
Cooling Efficiency of Two-Phase Closed Thermosyphon Installed in Cast-in-Place Pile Foundation for Overhead Transmission Lines in High-Latitude Permafrost Regions

Abstract
1. Introduction
2. Numerical Model
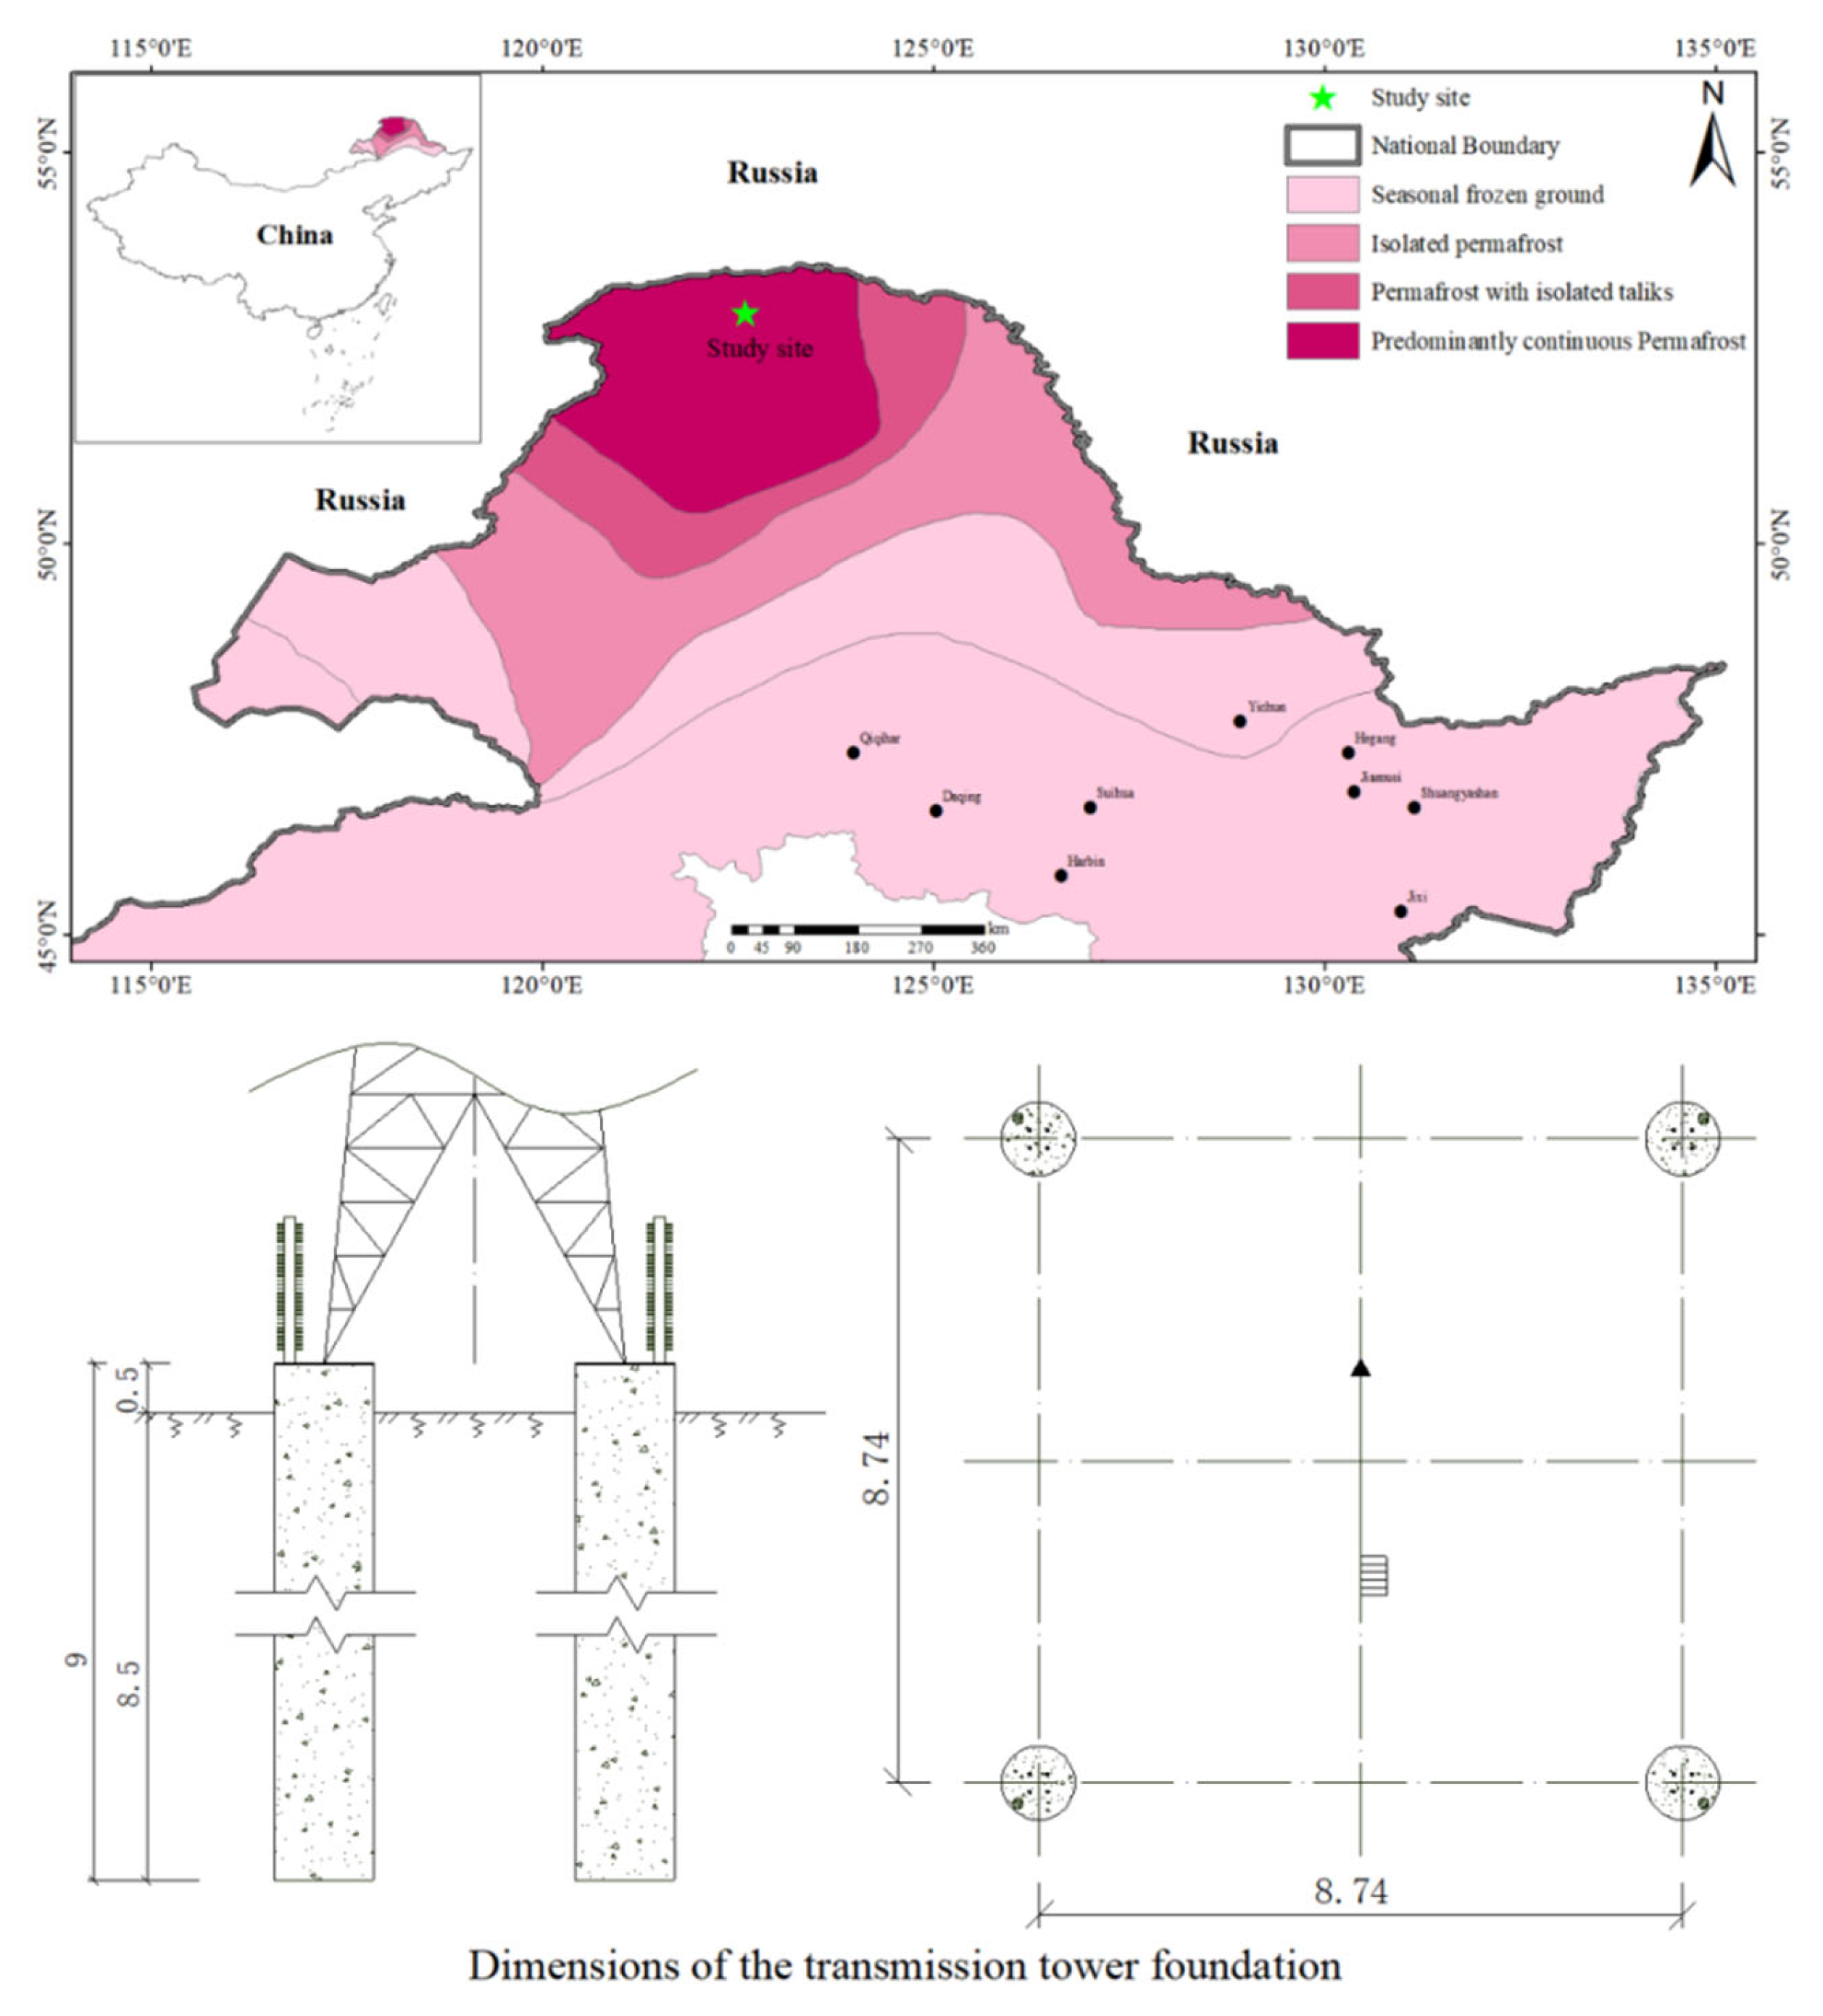
2.1. Research Area
2.2. Heat Transfer Theory
2.3. Major Parameters
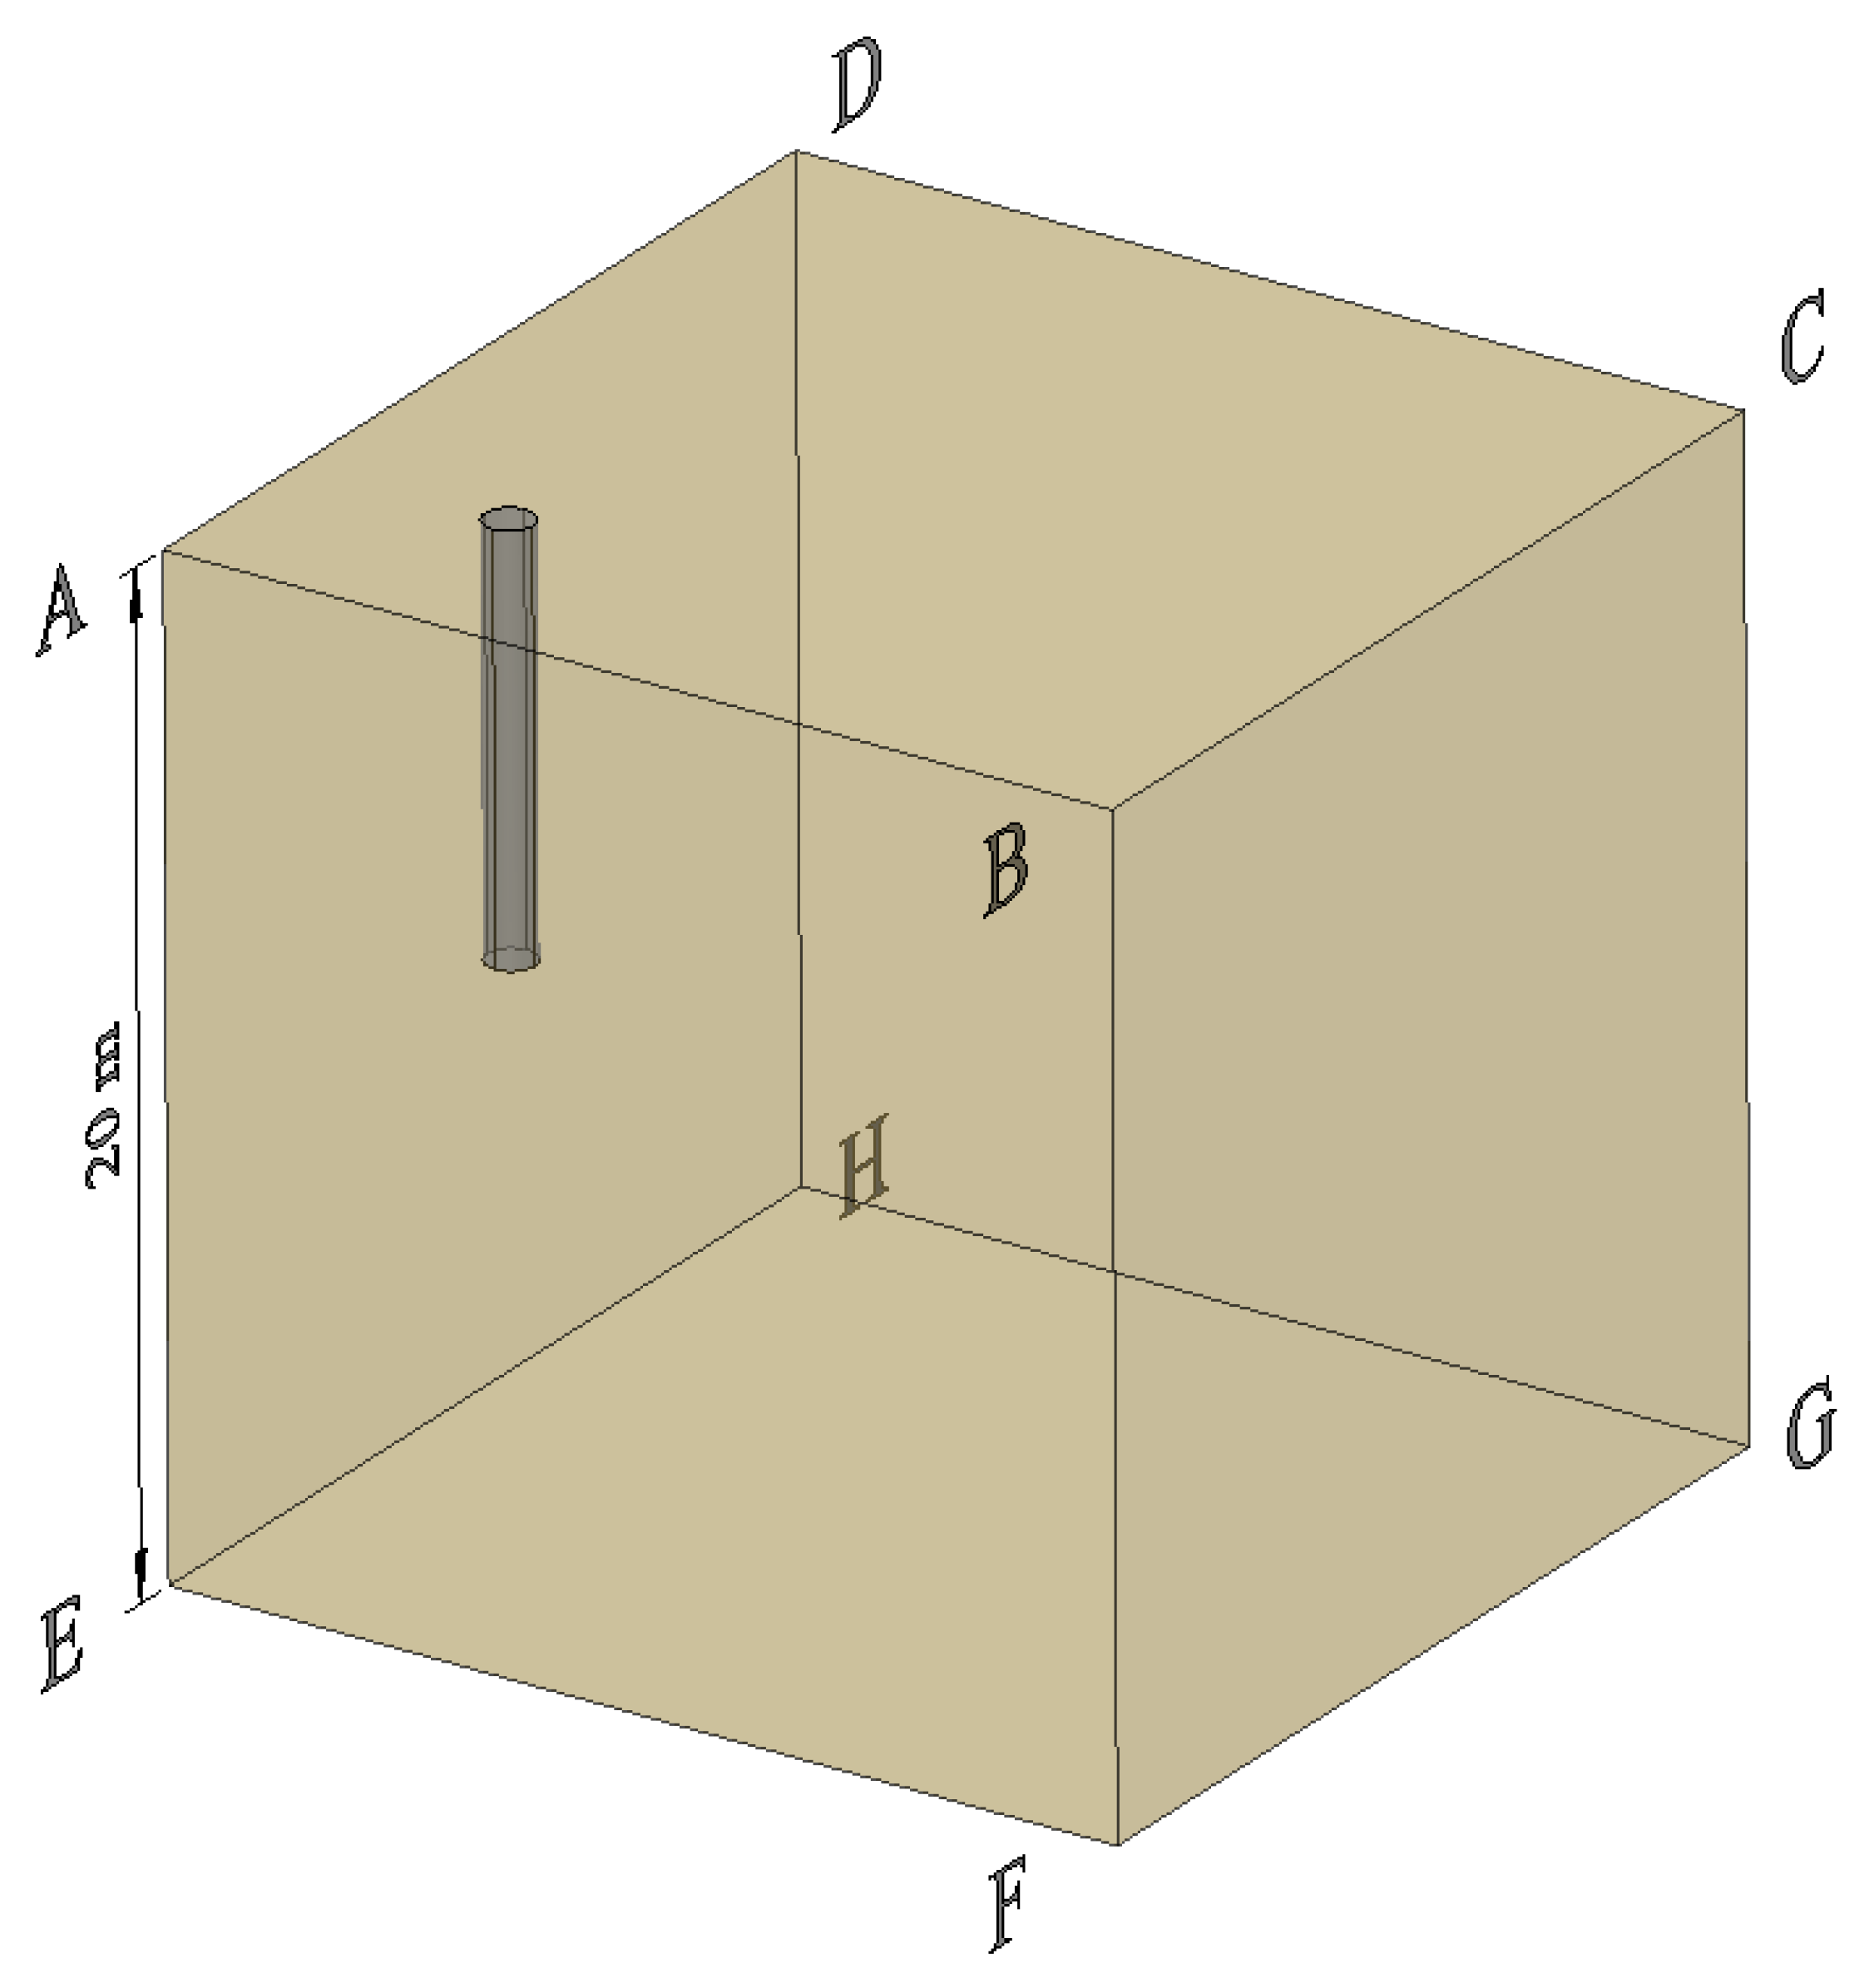
2.4. Computational Domain and Boundary Conditions
3. Results
3.1. Freeze-Thaw Characteristics
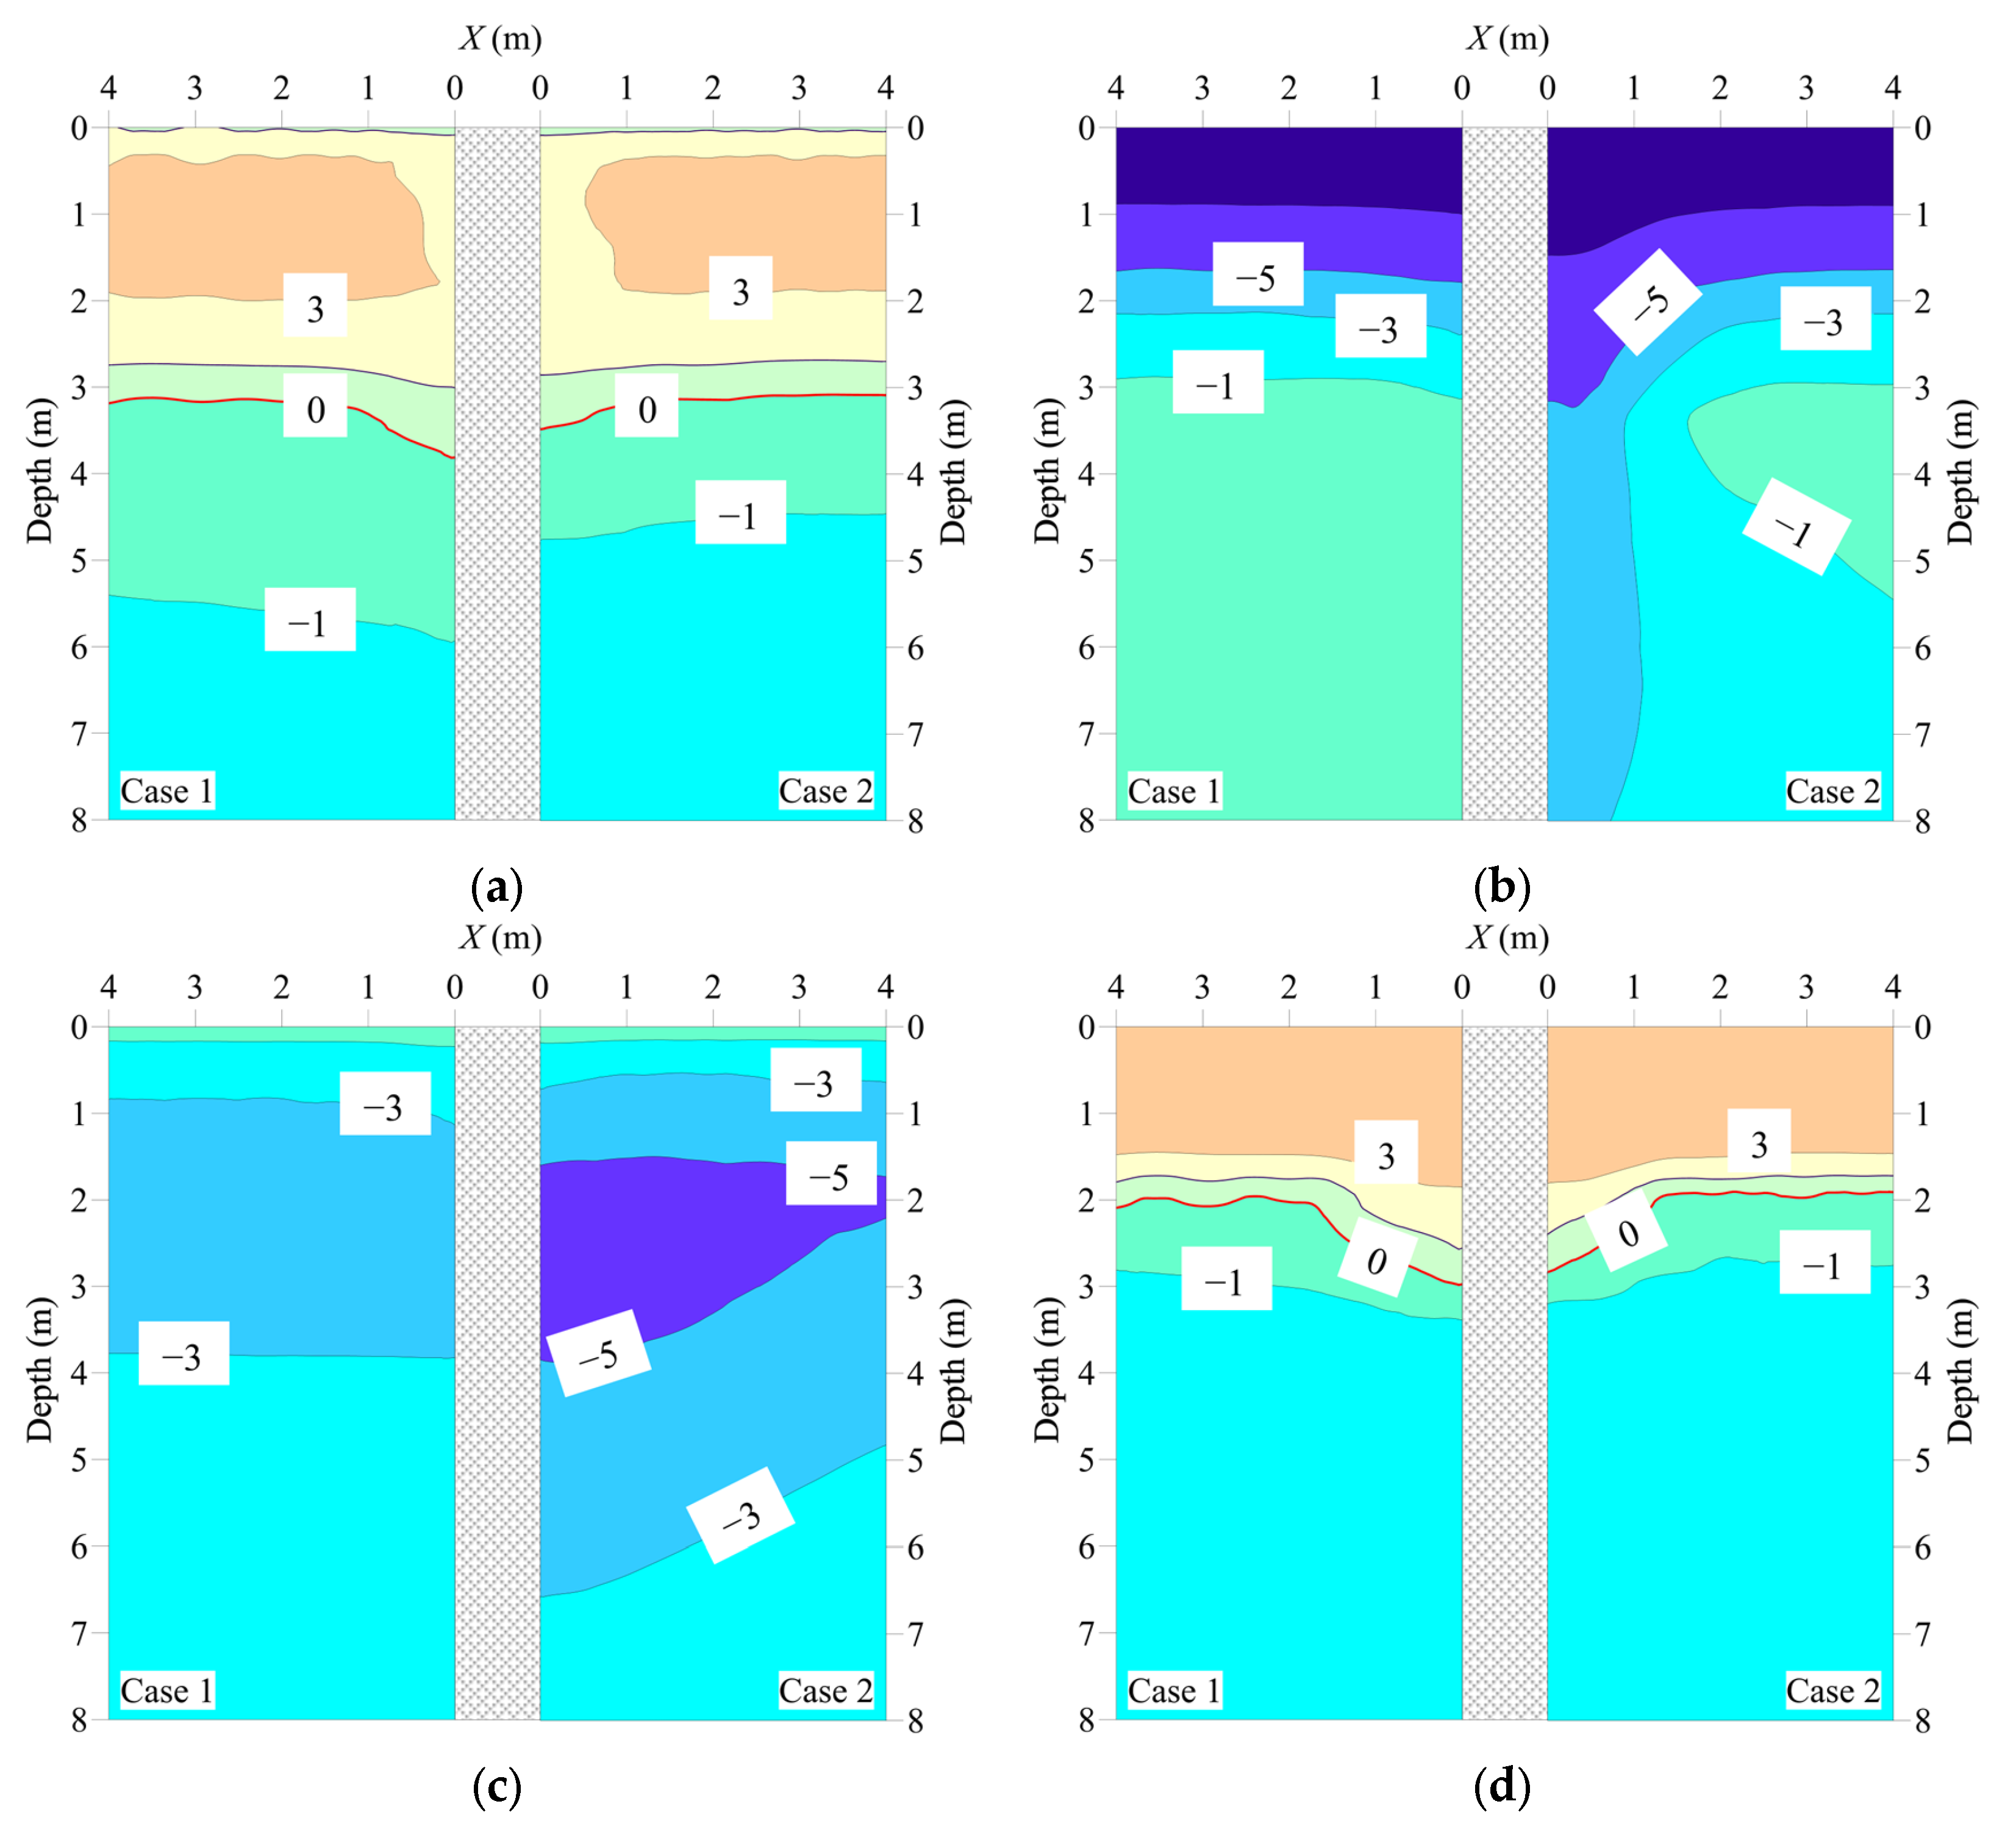
3.2. Ground Temperature Field Distribution
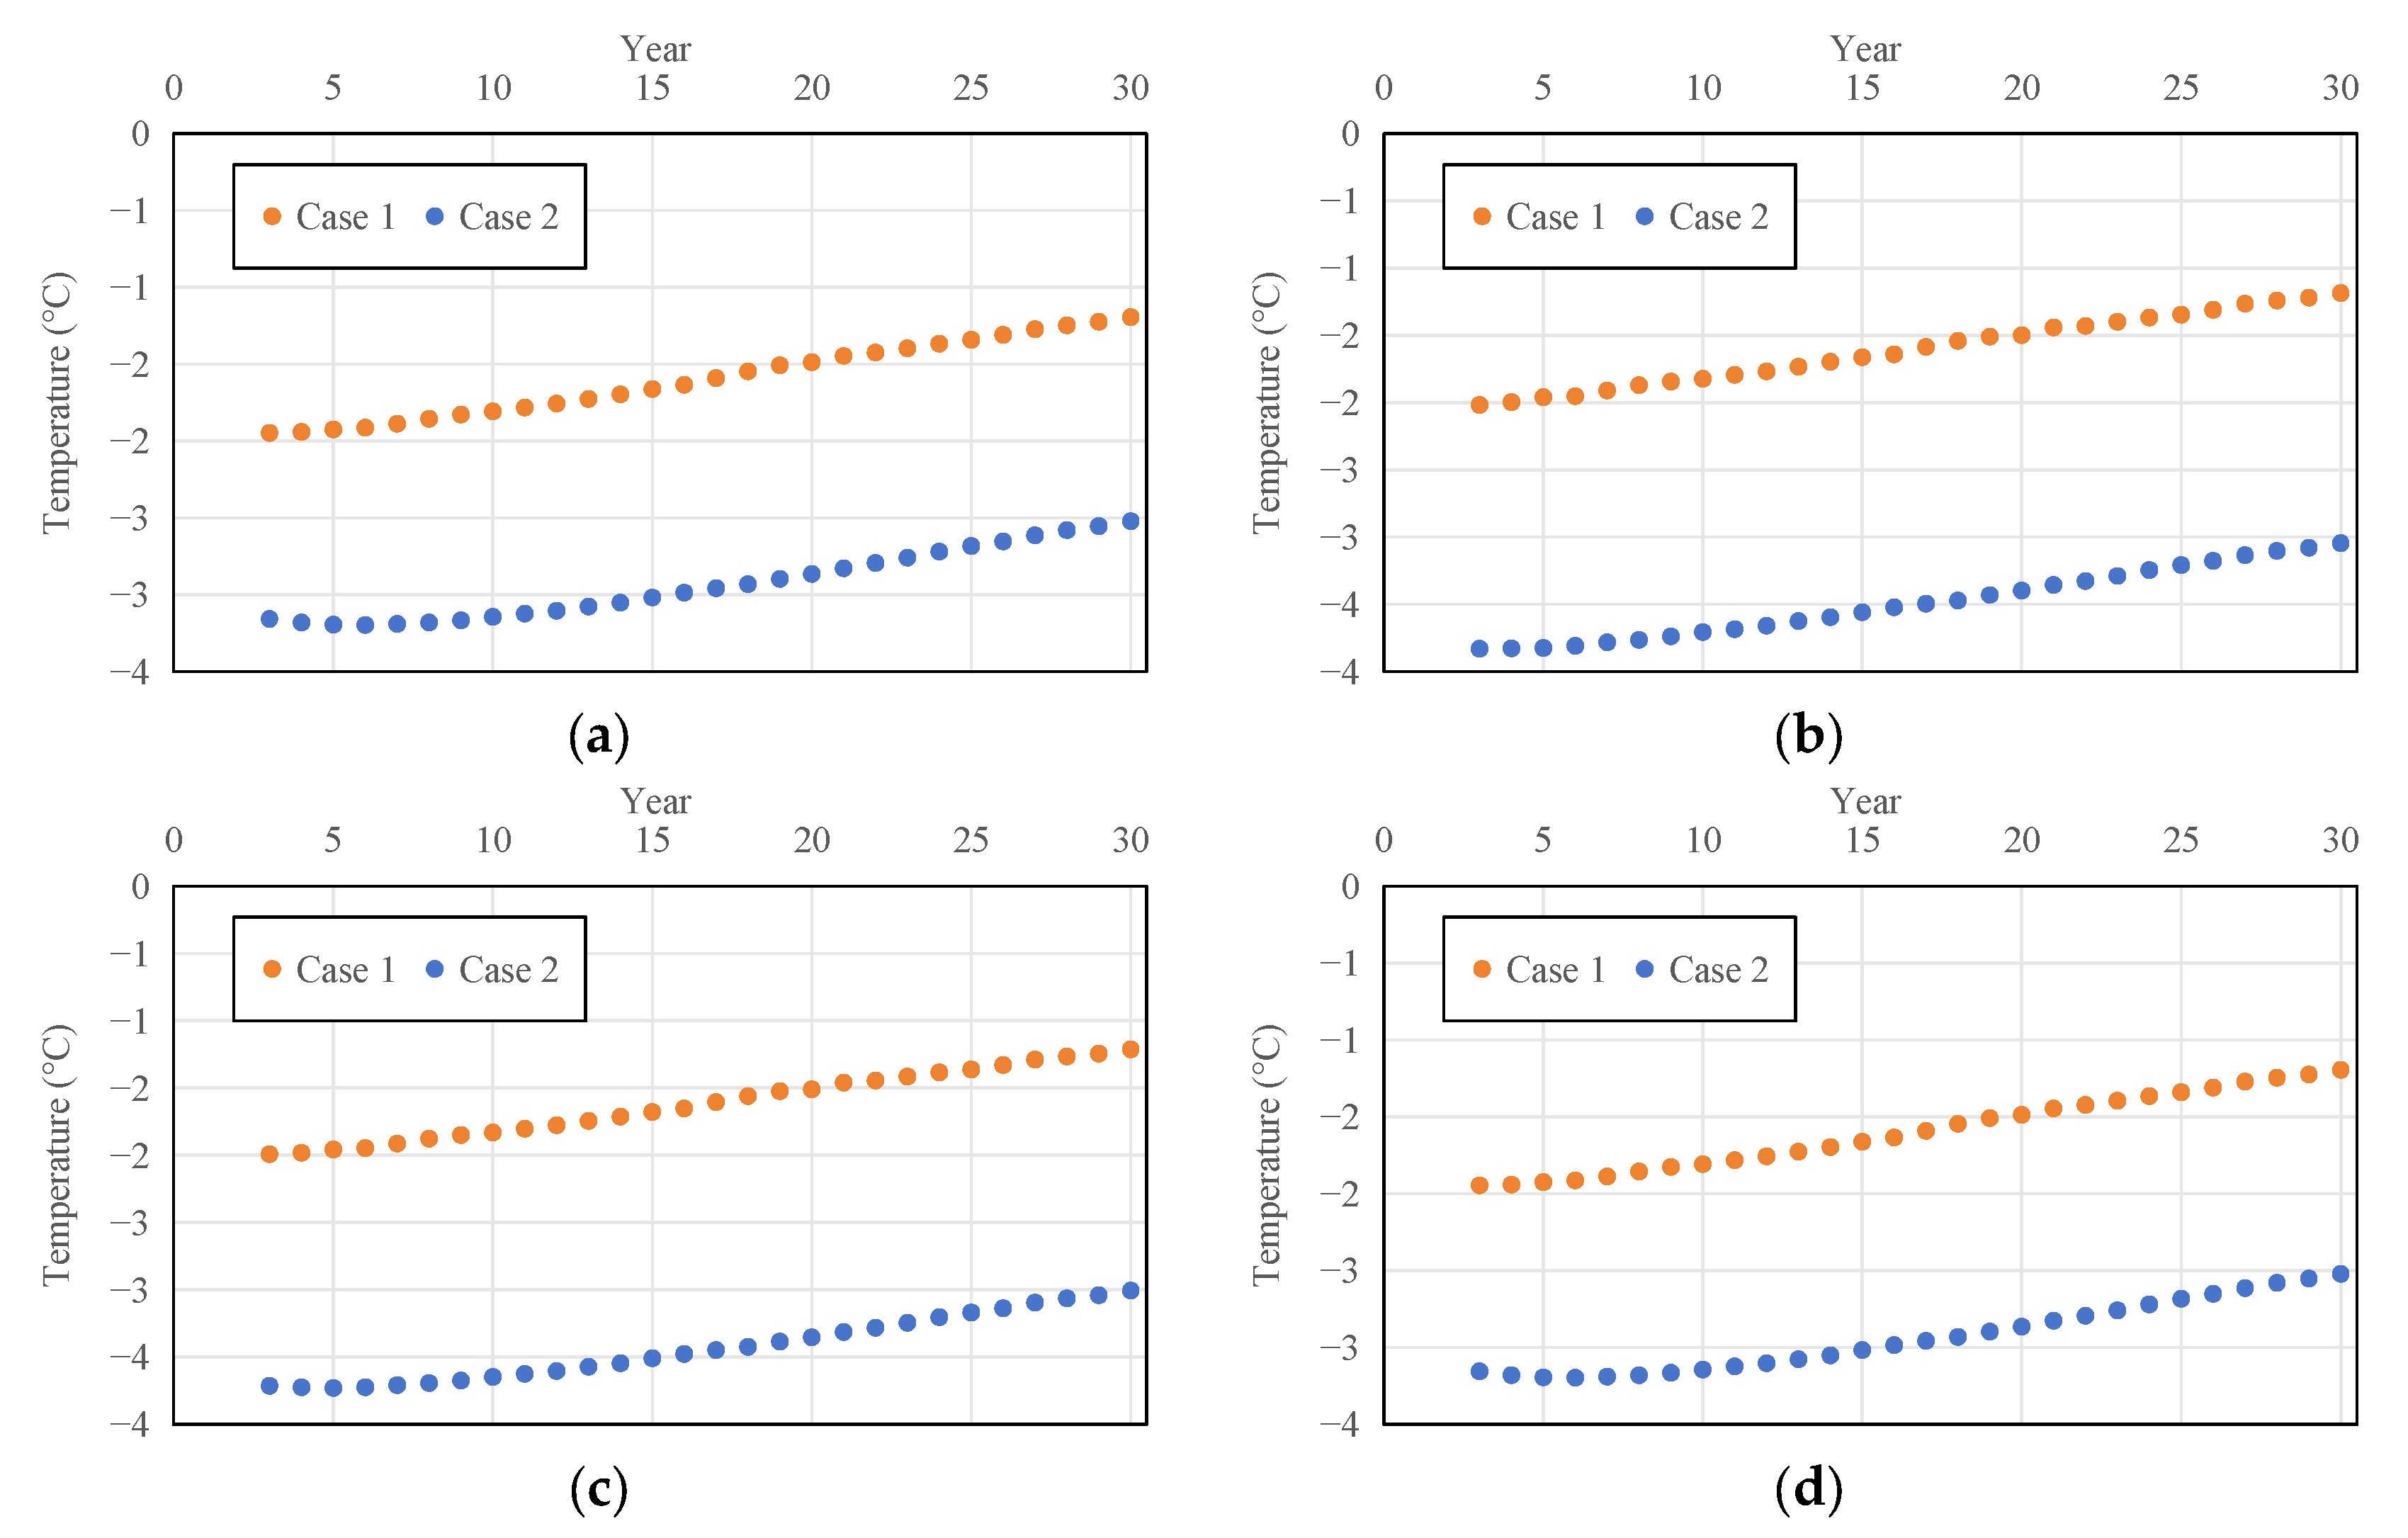
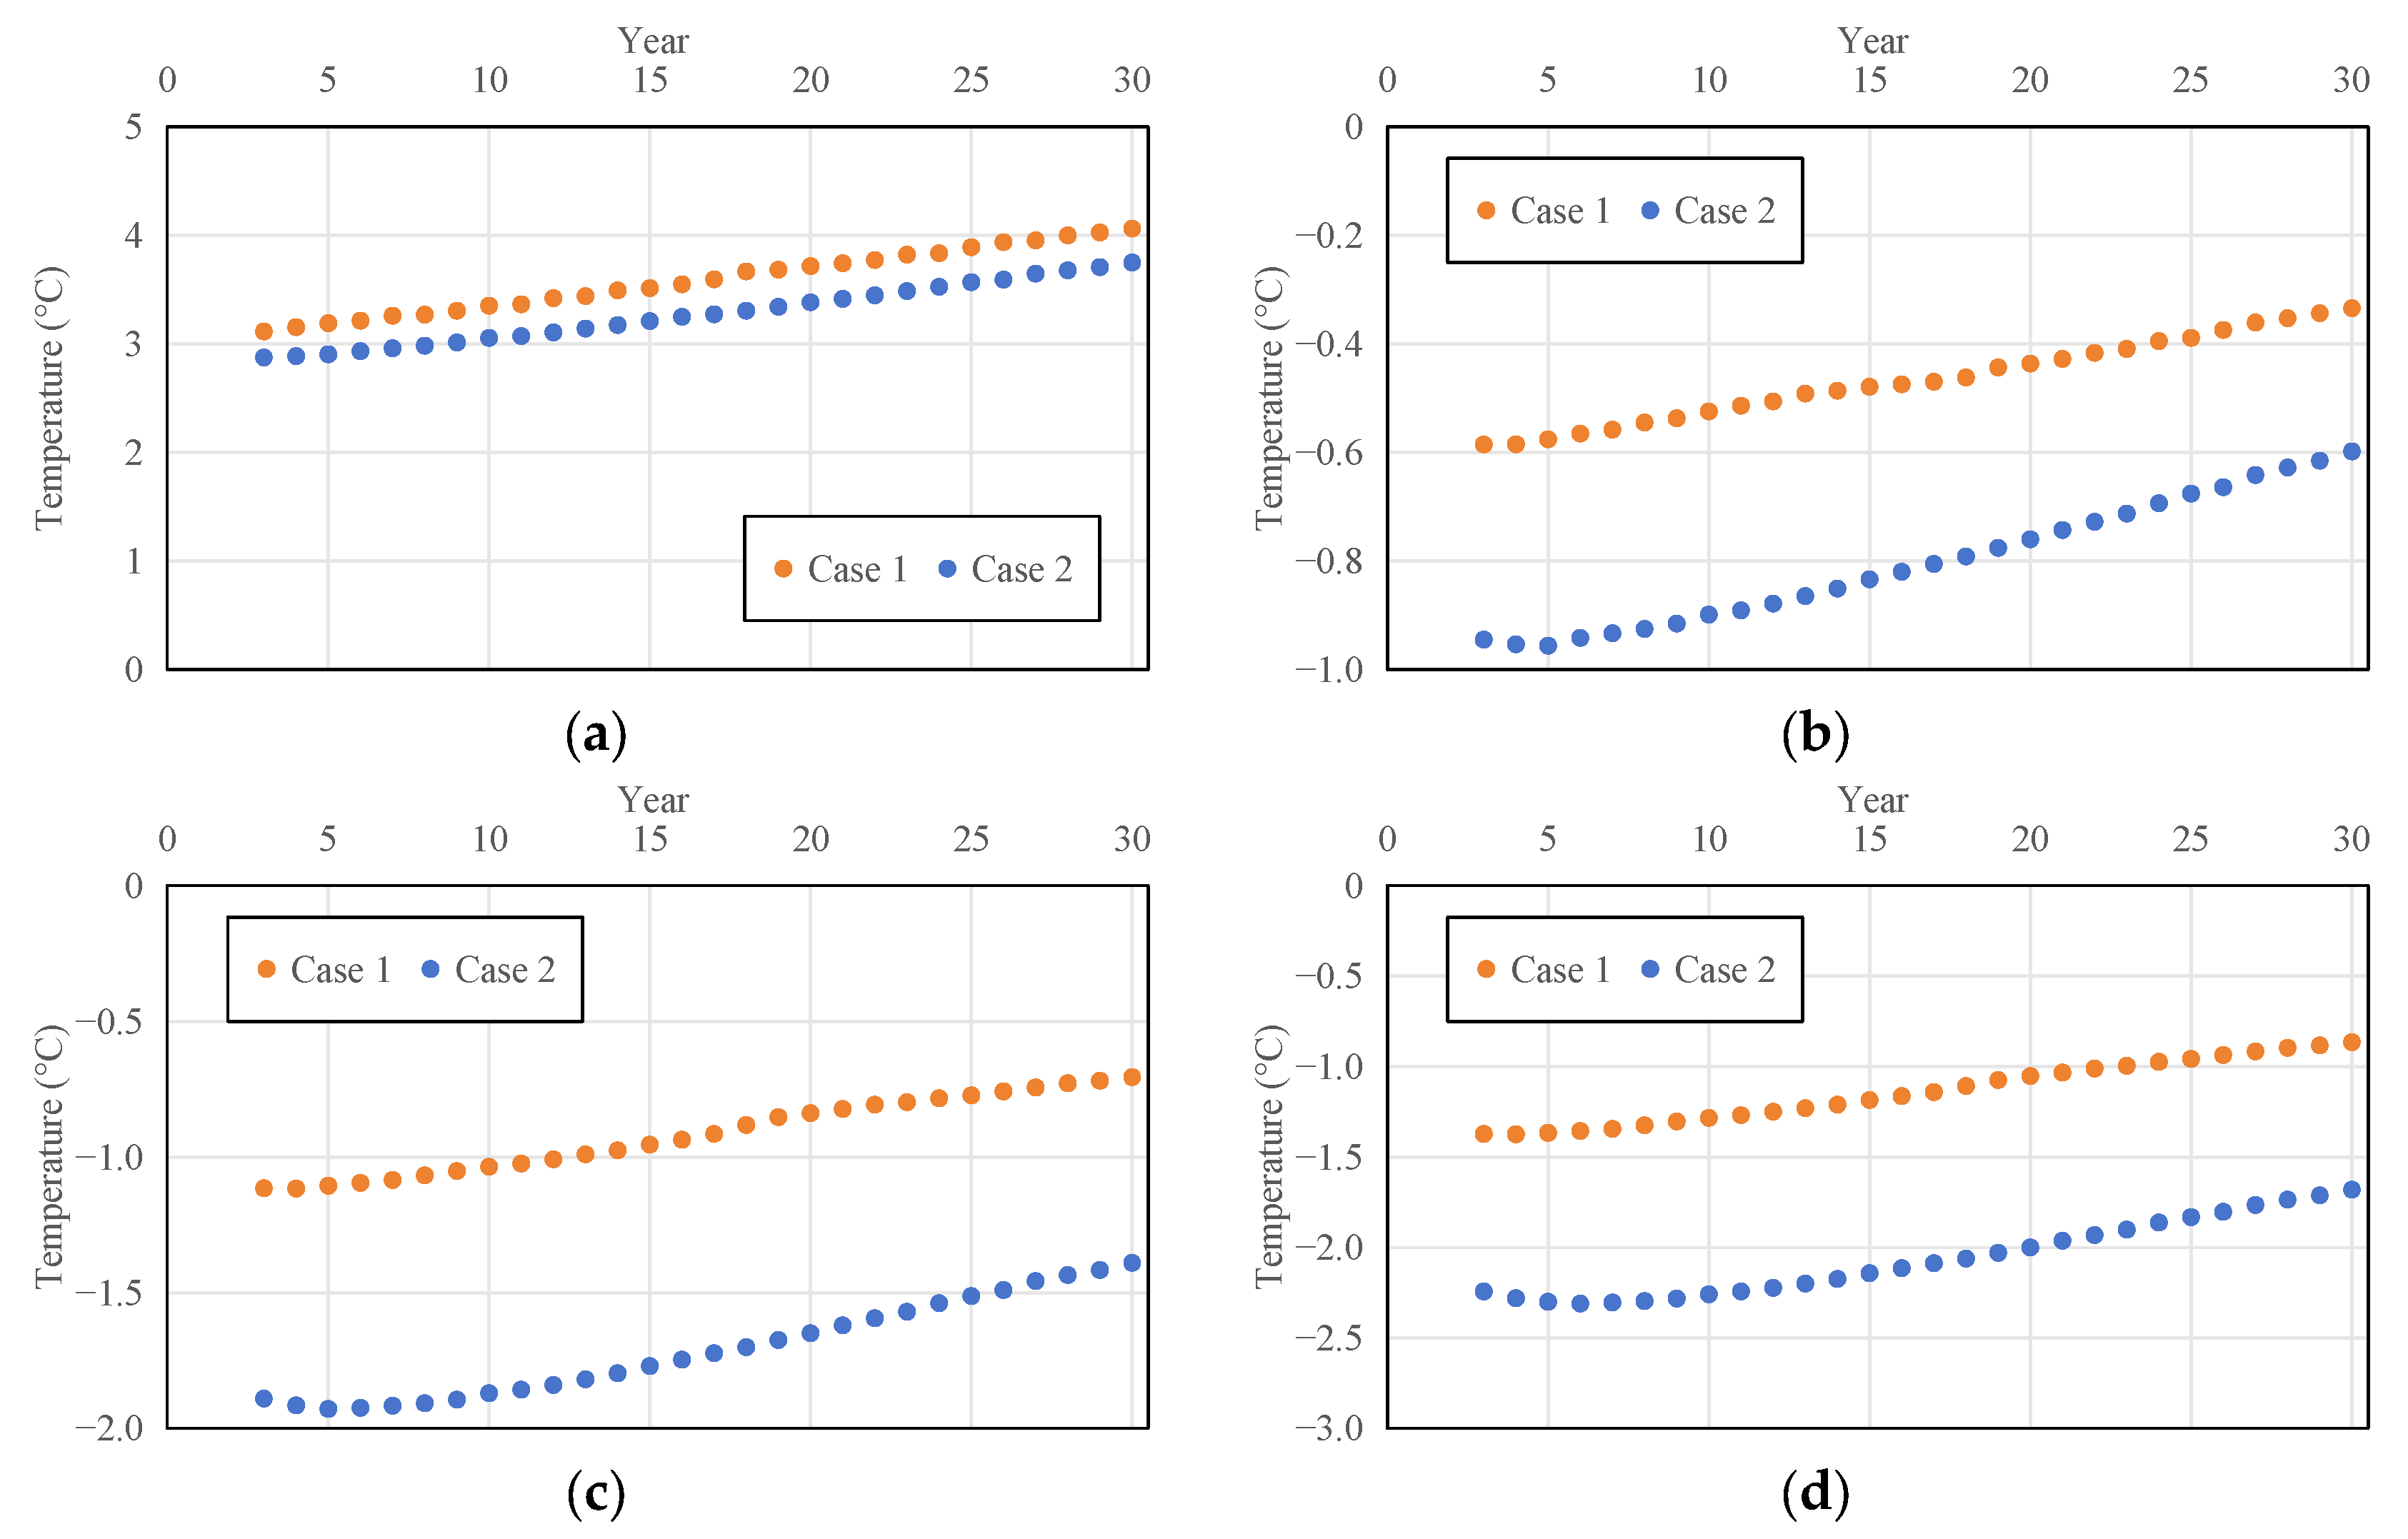
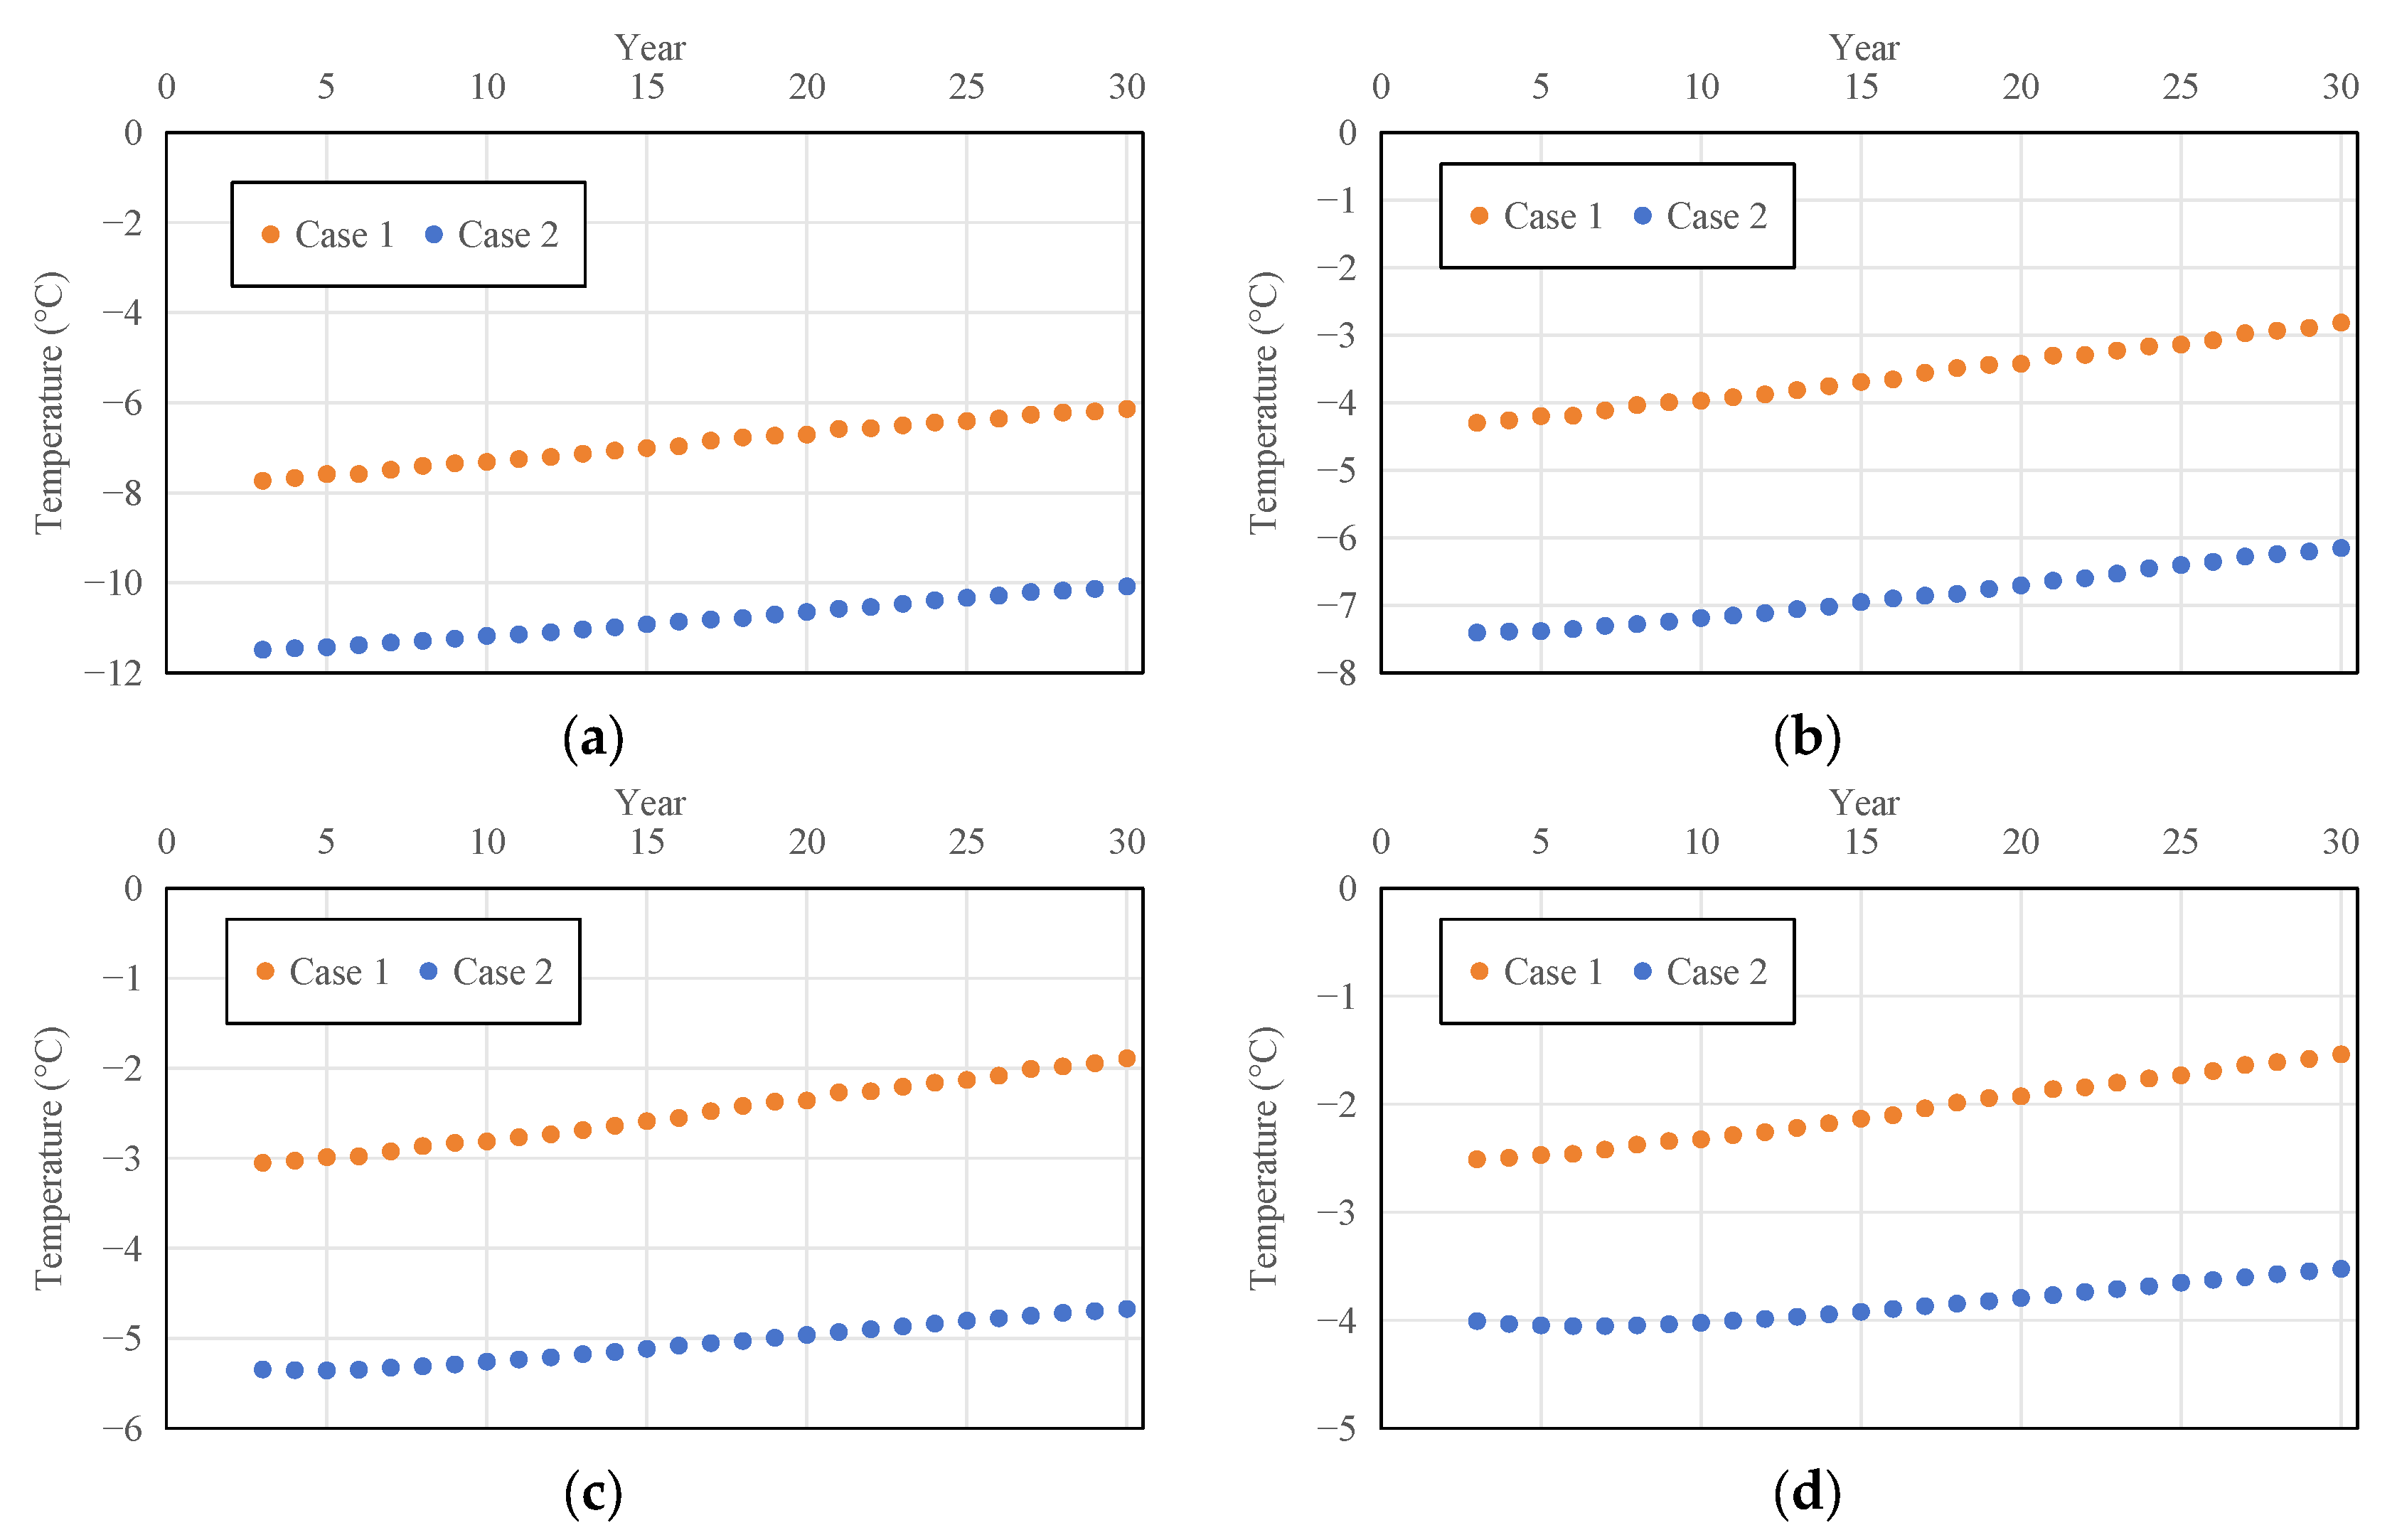
3.3. Temperature Profile of Pile Sides
3.4. Response of Cooling Performance to Climate Warming
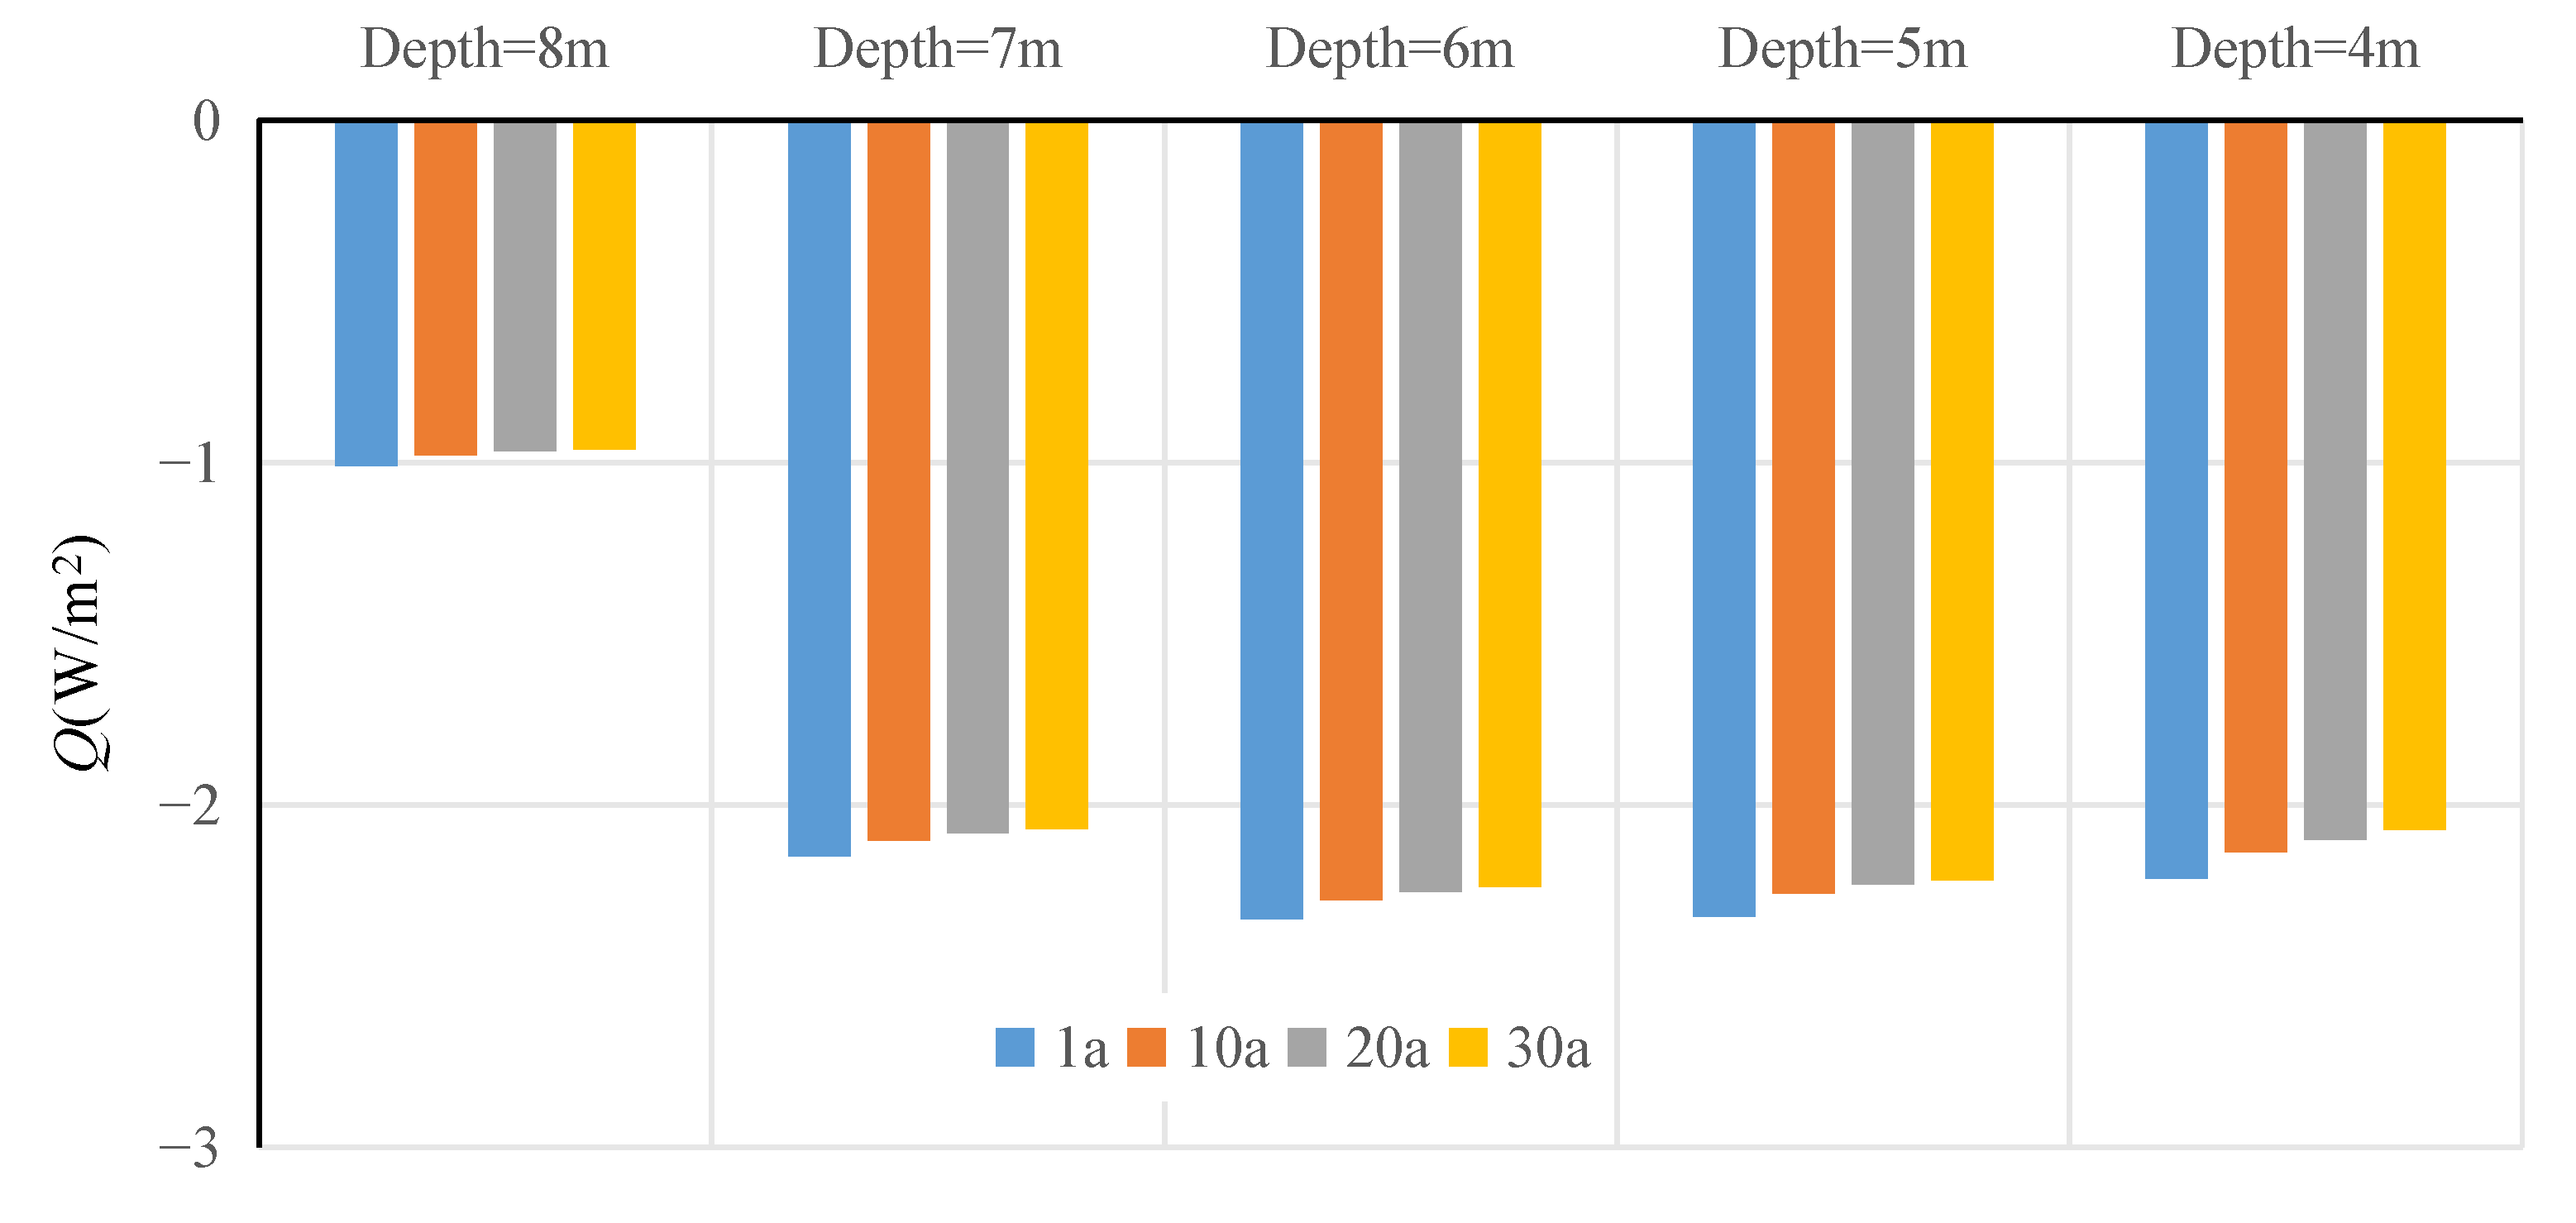
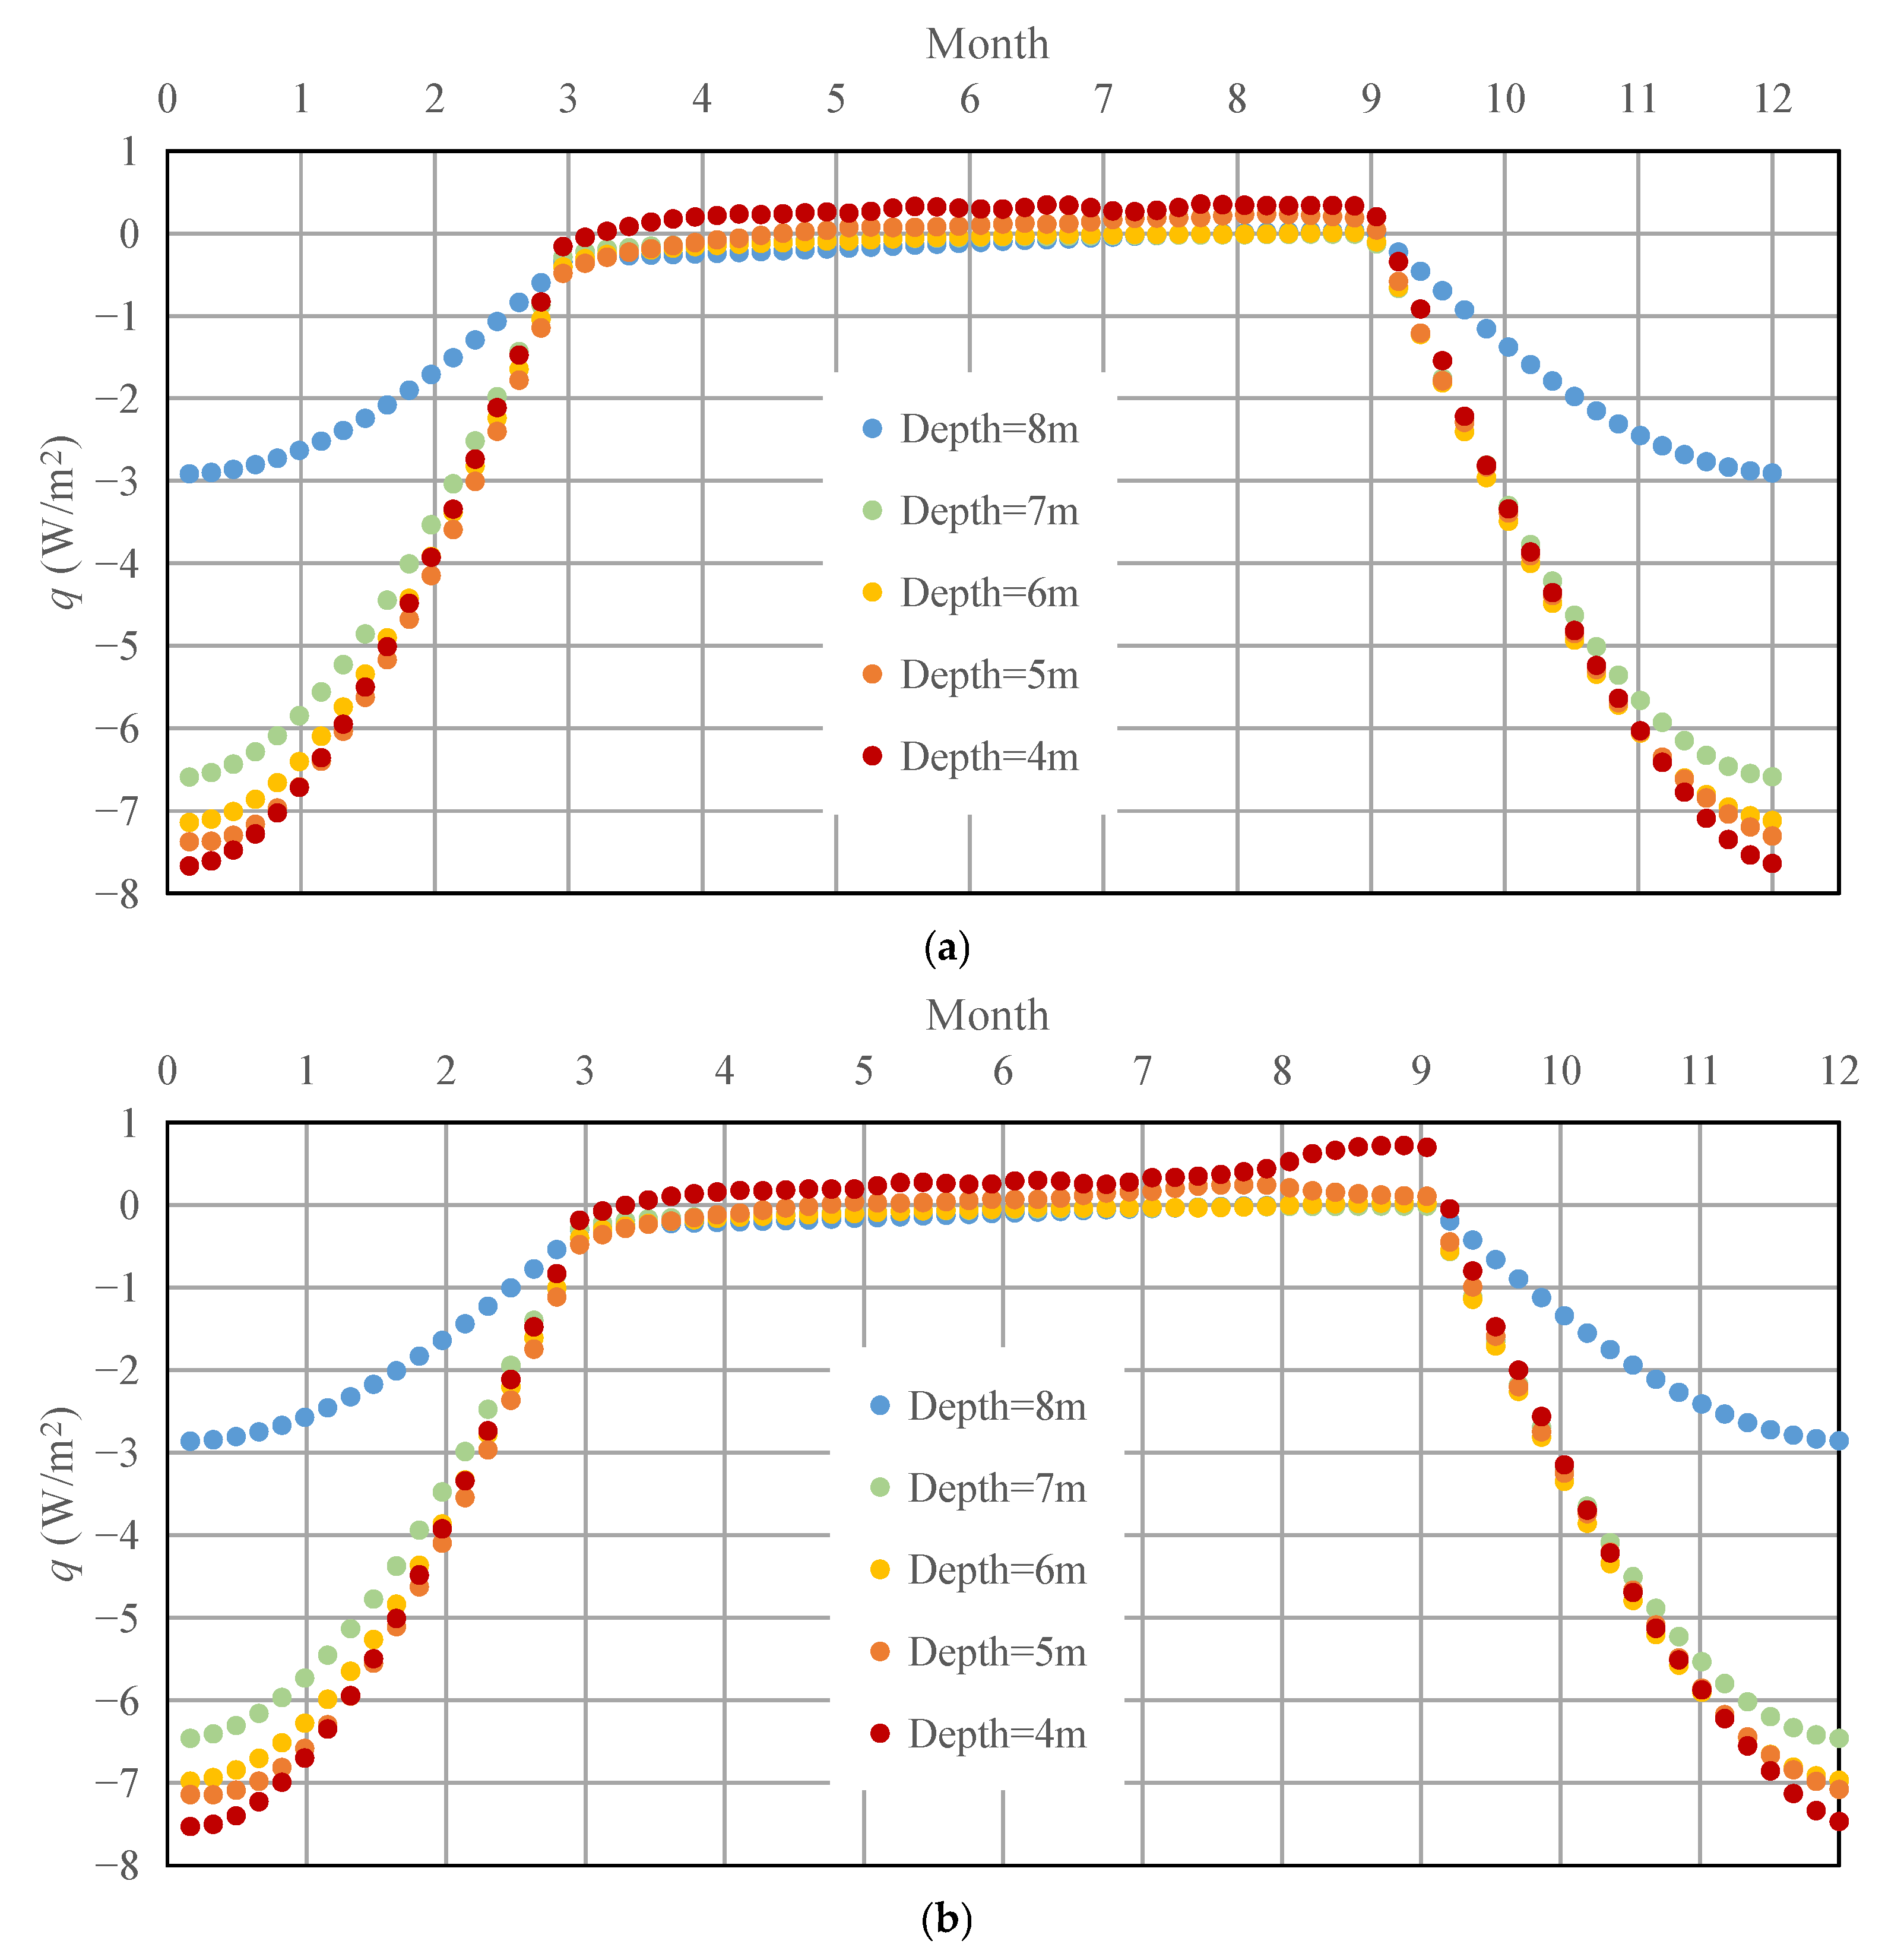
3.5. Energy Exchange Process
4. Conclusions
- The integration of TPCTs into cast-in-place pile foundations partially mitigates the downward migration of the permafrost table around transmission tower foundations induced by climate warming. While the cooling effect of TPCTs effectively slows the rate of permafrost thaw, their ability to fully stabilize the permafrost table remains limited.
- The operational efficiency of TPCT-enhanced cast-in-place pile foundations is highly temperature-dependent, with an effective cooling period spanning from early October to late March annually.
- TPCT-equipped cast-in-place pile foundations provide efficient ground temperature regulation, effectively counteracting permafrost degradation driven by climate change. This significantly reduces the risk of structural damage to transmission tower foundations in permafrost regions.
Author Contributions
Funding
Data Availability Statement
Conflicts of Interest
References
- Andersland, O.B.; Ladanyi, B. Frozen Ground Engineering; John Wiley & Sons: Hoboken, NJ, USA, 2004. [Google Scholar]
- Gao, Z.Y.; Zhang, C.M.; Liu, W.Y.; Niu, F.J.; Wang, Y.B.; Lin, Z.J.; Yin, G.A.; Ding, Z.K.; Shang, Y.H.; Luo, J. Extreme degradation of alpine wet meadow decelerates soil heat transfer by preserving soil organic matter on the Qinghai–Tibet Plateau. J. Hydrol. 2025, 653, 13278. [Google Scholar]
- Xu, X.Z.; Wang, J.C.; Zhang, L.X. Frozen Soil Physics; Science Press: Beijing, China, 2001. [Google Scholar]
- Ma, W.; Wang, D.Y. Frozen Soil Mechanics; Science Press: Beijing, China, 2014. [Google Scholar]
- Shang, Y.H.; Niu, F.J.; Li, G.Y.; Fang, J.H.; Gao, Z.Y. Application of a Concrete Thermal Pile in Cooling the Warming Permafrost Under Climate Change. Adv. Clim. Chang. Res. 2024, 15, 170–183. [Google Scholar]
- Aksenov, V.I.; Kistanov, O.G. Estimation of resistance components to an axial load on piles embedded in permafrost. Soil Mech. Found. Eng. 2008, 45, 71–75. [Google Scholar] [CrossRef]
- Shang, Y.H.; Niu, F.J.; Fang, J.H.; Wu, L.B. Experimental study on thermal regime and frost jacking of pile foundation during operation period in permafrost regions. Front. Earth Sci. 2022, 10, 821305. [Google Scholar]
- Harris, S.A.; Brouchkov, A.; Cheng, G.D. Geocryology: Characteristics and Use of Frozen Ground and Permafrost Landforms; CRC Press: Boca Raton, FL, USA, 2018. [Google Scholar]
- Hjort, J.; Streletskiy, D.; Doré, G.; Wu, Q.B.; Bjella, K.; Luoto, M. Impacts of permafrost degradation on infrastructure. Nat. Rev. Earth Environ. 2022, 3, 24–38. [Google Scholar] [CrossRef]
- Wu, J.J.; Ma, W.; Sun, Z.Z.; Wen, Z. In-situ study on cooling effect of the two-phase closed thermosyphon and insulation combinational embankment of the Qinghai–Tibet Railway. Cold Reg. Sci. Technol. 2010, 60, 234–244. [Google Scholar]
- Zhang, B.; Sheng, Y.; Chen, J.; Li, J. In-situ test study on the cooling effect of two-phase closed thermosyphon in marshy permafrost regions along the Chaidaer–Muli Railway, Qinghai Province, China. Cold Reg. Sci. Technol. 2011, 65, 456–464. [Google Scholar] [CrossRef]
- Zhang, M.Y.; Lai, Y.M.; Zhang, J.M.; Sun, Z.Z. Numerical study on cooling characteristics of two-phase closed thermosyphon embankment in permafrost regions. Cold Reg. Sci. Technol. 2011, 65, 203–210. [Google Scholar] [CrossRef]
- Yu, F.; Qi, J.L.; Zhang, M.Y.; Lai, Y.M.; Yao, X.L.; Liu, Y.Z.; Wu, G.L. Cooling performance of two-phase closed thermosyphons installed at a highway embankment in permafrost regions. Appl. Therm. Eng. 2016, 98, 220–227. [Google Scholar]
- Yu, F.; Zhang, M.Y.; Lai, Y.M.; Liu, Y.Z.; Qi, J.L.; Yao, X.L. Crack formation of a highway embankment installed with two-phase closed thermosyphons in permafrost regions: Field experiment and geothermal modeling. Appl. Therm. Eng. 2017, 115, 670–681. [Google Scholar] [CrossRef]
- Pei, W.S.; Zhang, M.Y.; Lai, Y.M.; Yan, Z.R.; Li, S.Y. Evaluation of the ground heat control capacity of a novel air-L-shaped TPCT-ground (ALTG) cooling system in cold regions. Energy 2019, 179, 655–668. [Google Scholar] [CrossRef]
- Zhang, M.Y.; Pei, W.S.; Lai, Y.M.; Niu, F.J.; Li, S.Y. Numerical study of the thermal characteristics of a shallow tunnel section with a two-phase closed thermosyphon group in a permafrost region under climate warming. Int. J. Heat Mass Transf. 2017, 104, 952–963. [Google Scholar]
- Fedorovich, D.I.; Targulyan, Y.O. Pile foundation construction characteristics in the alaska oil pipeline. Constr. Under Spec. Soil Cond. 1991, 5, 6–8. [Google Scholar]
- Guo, L.; Yu, Q.H.; You, Y.H.; Wang, X.B.; Li, X.N.; Chang, Y. Cooling effects of thermosyphons in tower foundation soils in permafrost regions along the Qinghai–Tibet Power Transmission Line from Golmud, Qinghai Province to Lhasa, Tibet Autonomous Region, China. Cold Reg. Sci. Technol. 2016, 121, 196–204. [Google Scholar]
- Guo, L.; Zhang, Z.Q.; Wang, X.B.; Yu, Q.H.; You, Y.H.; Chang, Y.; Xie, Y.L.; Gou, T.T. Stability analysis of transmission tower foundations in permafrost equipped with thermosiphons and vegetation cover on the Qinghai-Tibet Plateau. Int. J. Heat Mass Transf. 2018, 121, 367–376. [Google Scholar]
- You, Y.H.; Yu, Q.H.; Wang, X.B.; Guo, L.; Chen, K.; Wu, Q.B. Effects of thermosyphons on the thermal regime and stability of cast-in-place piles in permafrost regions on the Qinghai-Tibet Plateau. Permafr. Periglac Process. 2022, 33, 277–285. [Google Scholar] [CrossRef]
- Sun, T.; Guo, H.X.; Zhou, T.B.; Suo, H.N.; Dong, T.C.; Zhang, M.G. Study on active thermal protection for bridge pier in permafrost regions by using thermosyphon group. J. Glaciol. Geocryol. 2023, 45, 1555–1563. [Google Scholar]
- Jin, H.J.; Hao, J.Q.; Chang, X.L.; Zhang, J.M.; Yu, Q.H.; Qi, J.L.; Lü, L.Z.; Wang, S.L. Zonation and assessment of frozen-ground conditions for engineering geology along the China-Russia crude oil pipeline route from Mo’he to Daqing, Northeastern China. Cold Reg. Sci. Technol. 2010, 64, 213–225. [Google Scholar] [CrossRef]
- Lai, Y.M.; Zhang, M.Y.; Li, S.Y. Theory and Application of Cold Regions Engineering; Science Press: Beijing, China, 2009. [Google Scholar]
- Yu, W.B. Study on Special Embankment in Permafrost Regions of Qinghai-Tibet Railway. Ph.D. Thesis, University of Chinese Academy of Sciences, Beijing, China, 2003. [Google Scholar]
- Lai, Y.M.; Wang, Q.S.; Niu, F.J.; Zhang, K.H. Three-dimensional nonlinear analysis for temperature characteristic of ventilated embankment in permafrost regions. Cold Reg. Sci. Technol. 2004, 38, 165–184. [Google Scholar]
- Lu, Y. Study on the Change of Permafrost in urban Environment–A Case Study of Mohe County. Ph.D. Thesis, University of Chinese Academy of Sciences, Beijing, China, 2018. [Google Scholar]


| Physical Variable | ||||
|---|---|---|---|---|
| W·m−1·°C−1 | J·m−3·°C−1 | W·m−1·°C−1 | J·m−3·°C−1 | |
| Loam | 1.63 | 2.37 × 10⁶ | 0.95 | 4.29 × 10⁶ |
| Silty clay | 1.58 | 2.23 × 10⁶ | 1.13 | 2.82 × 10⁶ |
| Gravelly sand | 1.86 | 1.51 × 10⁶ | 1.48 | 1.94 × 10⁶ |
| Bedrock | 1.82 | 1.85 × 10⁶ | 1.47 | 2.1 × 10⁶ |
| Pile foundation | 2.94 | 2.075 × 10⁶ | 2.944 | 2.075 × 10⁶ |
| Parameter | Value |
|---|---|
| Length of evaporator section, Le (m) | 8 |
| Length of condenser section, Lc (m) | 1.5 |
| Inner diameter of pipe, di (m) | 0.053 |
| Outer diameter of pipe, do (m) | 0.063 |
| Number of fins, n | 75 |
| Fin thickness, δ (m) | 0.0015 |
| Fin height, bn (m) | 0.02 |
Disclaimer/Publisher’s Note: The statements, opinions and data contained in all publications are solely those of the individual author(s) and contributor(s) and not of MDPI and/or the editor(s). MDPI and/or the editor(s) disclaim responsibility for any injury to people or property resulting from any ideas, methods, instructions or products referred to in the content. |
© 2025 by the authors. Licensee MDPI, Basel, Switzerland. This article is an open access article distributed under the terms and conditions of the Creative Commons Attribution (CC BY) license (https://creativecommons.org/licenses/by/4.0/).
Share and Cite
Zhao, L.; Xiao, Y.; Shang, Y.; Lu, Y.; Wu, X. Cooling Efficiency of Two-Phase Closed Thermosyphon Installed in Cast-in-Place Pile Foundation for Overhead Transmission Lines in High-Latitude Permafrost Regions. Processes 2025, 13, 1080. https://doi.org/10.3390/pr13041080
Zhao L, Xiao Y, Shang Y, Lu Y, Wu X. Cooling Efficiency of Two-Phase Closed Thermosyphon Installed in Cast-in-Place Pile Foundation for Overhead Transmission Lines in High-Latitude Permafrost Regions. Processes. 2025; 13(4):1080. https://doi.org/10.3390/pr13041080
Chicago/Turabian StyleZhao, Lei, Yao Xiao, Yunhu Shang, Yan Lu, and Xuyang Wu. 2025. "Cooling Efficiency of Two-Phase Closed Thermosyphon Installed in Cast-in-Place Pile Foundation for Overhead Transmission Lines in High-Latitude Permafrost Regions" Processes 13, no. 4: 1080. https://doi.org/10.3390/pr13041080
APA StyleZhao, L., Xiao, Y., Shang, Y., Lu, Y., & Wu, X. (2025). Cooling Efficiency of Two-Phase Closed Thermosyphon Installed in Cast-in-Place Pile Foundation for Overhead Transmission Lines in High-Latitude Permafrost Regions. Processes, 13(4), 1080. https://doi.org/10.3390/pr13041080