1. Introduction
Currently, numerous studies [
1,
2,
3,
4,
5,
6,
7,
8,
9,
10,
11] worldwide are dedicated to searching for and selecting effective enhanced oil recovery (EOR) methods. Countries such as China, Canada, and India have extensive experience in applying chemical EOR techniques [
12,
13,
14,
15]. Thermal EOR methods have been widely employed in the United States, Oman, China, Canada, and Indonesia [
16,
17,
18,
19,
20,
21]. Additionally, Venezuela, Russia, Kazakhstan, Mexico, Colombia, and India have significant experience in thermal EOR applications [
22,
23,
24,
25]. Gas-based EOR is predominantly used in countries such as the United States, Brazil, and Canada [
26,
27,
28]. In the United States, CO
2 injection has become widespread due to the availability of natural CO
2 sources. This method has demonstrated high efficiency, particularly in carbonate formations with low permeability/injectivity [
26]. According to recent research, CO
2 injection contributed to an oil recovery increase of approximately 273,000 barrels per day in the U.S. in 2020 [
5].
Chemical EOR is based on two primary mechanisms: improved macroscopic and microscopic displacement efficiency. The macroscopic efficiency of EOR can be enhanced through polymer flooding, wherein the injection of a polymer solution increases the viscosity of the displacing fluid and reduces its effective permeability with respect to water [
25,
29,
30]. The microscopic displacement efficiency can be improved through the injection of alkalis and surfactants utilizing several mechanisms such as interfacial tension reduction, oil–water emulsification, the solubilization of interfacial films, wettability alteration, etc. The efficiency of the various methods of oil recovery varies greatly, as it depends on both the reservoir fluids and rock properties, including the reservoir pressure and temperature [
29]. The economic performance of EOR is influenced by oil prices, the cost per barrel of injected solution, and the duration of chemical reagent injection [
25].
Chemical EOR projects have been implemented across various oil fields worldwide. The largest application of chemical enhanced oil recovery is in China, where available data indicate that there has been an oil production increase of 300,000 barrels per day. Other countries that have adopted chemical EOR techniques to a significant extent include the United States and Canada. Polymer flooding and ASP flooding have been the most widely used chemical methods for clastic reservoirs [
12].
In India, chemical EOR was first applied in the Sanand field [
22]. Polymer flooding yielded promising results, achieving an incremental oil recovery of 23% of the initial oil in place (OOIP) [
24]. Another major polymer-flooding project, entailing the development of existing fields, is the one that was carried out in the Mangala field. Initially, a pilot polymer-flooding project was launched, leading to a reduction in the water cut, followed by the implementation of an ASP flooding project [
23].
To enhance oil recovery in Indonesia, several laboratory studies and field trials of chemical EOR methods have been conducted in fields such as the Minas, Tanjung, and Kaji Semoga fields, among others [
31]. It has been estimated that chemical EOR methods can potentially recover an additional 2.48–4.90 billion barrels of oil.
In Kazakhstan, pilot tests of chemical EOR have been carried out in the North Buzachi, Kalamkas, Uzen, Zaburunje, and East Moldabek fields. Laboratory studies using core samples from Kazakhstani fields have demonstrated the effectiveness of chemical EOR methods [
29,
32].
The primary objective of the thermal EOR methods is to introduce a heat carrier into the reservoir to reduce oil viscosity, thereby improving the phase mobility in porous media and enhancing the recovery of oil. The main thermal EOR techniques that are used worldwide include steam injection, cyclic steam stimulation, in situ combustion, and SAGD (steam-assisted gravity drainage), which are considered conventional thermal recovery methods [
17,
18,
19].
Thermal recovery techniques—particularly steam injection—continue to dominate as the most preferred enhanced oil recovery (EOR) method for heavy oil reservoirs [
33].
Gas-based EOR is one of the most effective methods for enhancing oil recovery, and is widely applied internationally. The process of gas vaporization is used to improve reservoir oil recovery. In this method, gas slugs are injected into the reservoir to increase pressure; then, the gas dissolves in the reservoir oil, reducing its viscosity and enhancing its mobility under reservoir conditions. Industrial trials have shown that, at high pressures, nearly all of the components of crude oil can dissolve in the gas, except for resins and other heavy fractions [
26,
27,
28]. When the pressure decreases at the surface, the gas, saturated with oil vapors, condenses into a liquid phase, forming a valuable condensate. Thus, the fundamental principle of this method is the artificial transformation of an oil reservoir into a gas-condensate reservoir.
Numerous efficient reservoir development technologies utilizing gas-based EOR methods are widely applied worldwide. These include high-pressure gas injection (using hydrocarbon gases, nitrogen, or flue gases), water alternating gas (WAG) injection, and carbon dioxide (CO
2) injection [
4,
5].
In gas-condensate reservoirs, offshore fields, and remote oil fields that lack access to gas markets, gas injection methods remain the preferred approach.
This study presents the results of a series of experiments conducted on core samples from the East Moldabek field to determine the greatest oil displacement efficiency that can be achieved with the tested EOR methods. Similar filtration experiments conducted on core samples using chemical agents have been reported in previous studies [
34,
35,
36].
The geological and physical structures of the East Moldabek field’s productive reservoirs are complex, featuring weakly cemented rock formations, gas–oil zones, a low initial reservoir pressure, and high-viscosity oil. Experimental studies were conducted on the Cretaceous horizons M-II and M-III as well as the Jurassic horizons J-IV, J-V, J-VI, and J-VII. Well performance data from the East Moldabek field indicate the low efficiency of conventional recovery methods in this field.
The East Moldabek field is located in the southeastern part of the Pre-Caspian Basin, in the interfluve of the Sagiz and Emba rivers.
In the Lower Cretaceous section of the productive formation, one gas–oil horizon (M-I) and two oil horizons (M-II and M-III) have been identified. The Middle Jurassic section contains seven productive horizons: J-I and J-II are gas–oil horizons, while J-IV, J-V, J-VI, and J-VII are oil-bearing horizons.
The depth of the horizons ranges from 190 to 810 m. The oil column in the Lower Cretaceous deposits varies between 35 and 57 m, while the gas column ranges from 1.4 to 16 m. Oil–water contact has been recorded at depths between 181 and 544 m. The reservoirs are stratified, anticlinal, and tectonically sealed. The productive horizons are composed of clastic rocks with porous-type reservoirs. The oil-saturated thickness ranges from 1.4 to 19.4 m, while the gas-saturated thickness varies between 1 and 14.6 m. The open porosity of the reservoirs is between 29% and 40%, with the permeability of the reservoirs ranging from 0.026 to 0.75 μm2. The degree of oil saturation ranges from 0.56 to 0.77, and the degree of gas saturation ranges from 0.48 to 0.64.
The reservoir pressure ranges from 2.4 to 4.5 MPa, with temperatures between 23 °C and 27 °C.
The oils from the Cretaceous horizons are heavier than those from the Jurassic horizons but exhibit similar physicochemical properties. The density of the Cretaceous oils ranges from 891 kg/m3 to 930 kg/m3. These oils have a low sulfur content (0.23–0.48%), are resinous (6.02–14.8%), and have a low paraffin content (0.12–1.09%). The oil saturation pressure at reservoir temperature varies from 1.44 to 1.8 MPa, while the dynamic viscosity of the reservoir oil ranges from 74.1 mPa·s to 242 mPa·s.
The density of the Jurassic oils ranges from 877 to 898 kg/m3. These oils have low sulfur (0.3–0.48%) and paraffin contents (0.13–2.36%). The resin content varies between 0.12% and 0.49%.
This study examines various reservoir stimulation methods, including the base method—oil displacement using formation water; thermal EOR—the injection of hot water; chemical EOR—polymer and ASP flooding; and gas EOR—nitrogen and CO2 injection.
2. Equipment and Preparation of the Core, Formation Water, and Oil Samples for Experiments
For this study, both packed and drilled core samples were used, obtained from wells in the Cretaceous and Jurassic horizons of the East Moldabek field. For the Cretaceous horizon M-I, packed core samples with a diameter of 38 mm (1.5 inches) and a length of approximately 5.8 cm were used. The sampling depth was 197 m. The core samples were manually collected and subsequently placed in special filtration containers, with the weight of each sample being no less than 100 g. For the Jurassic horizon J-IV, drilled core samples were used.
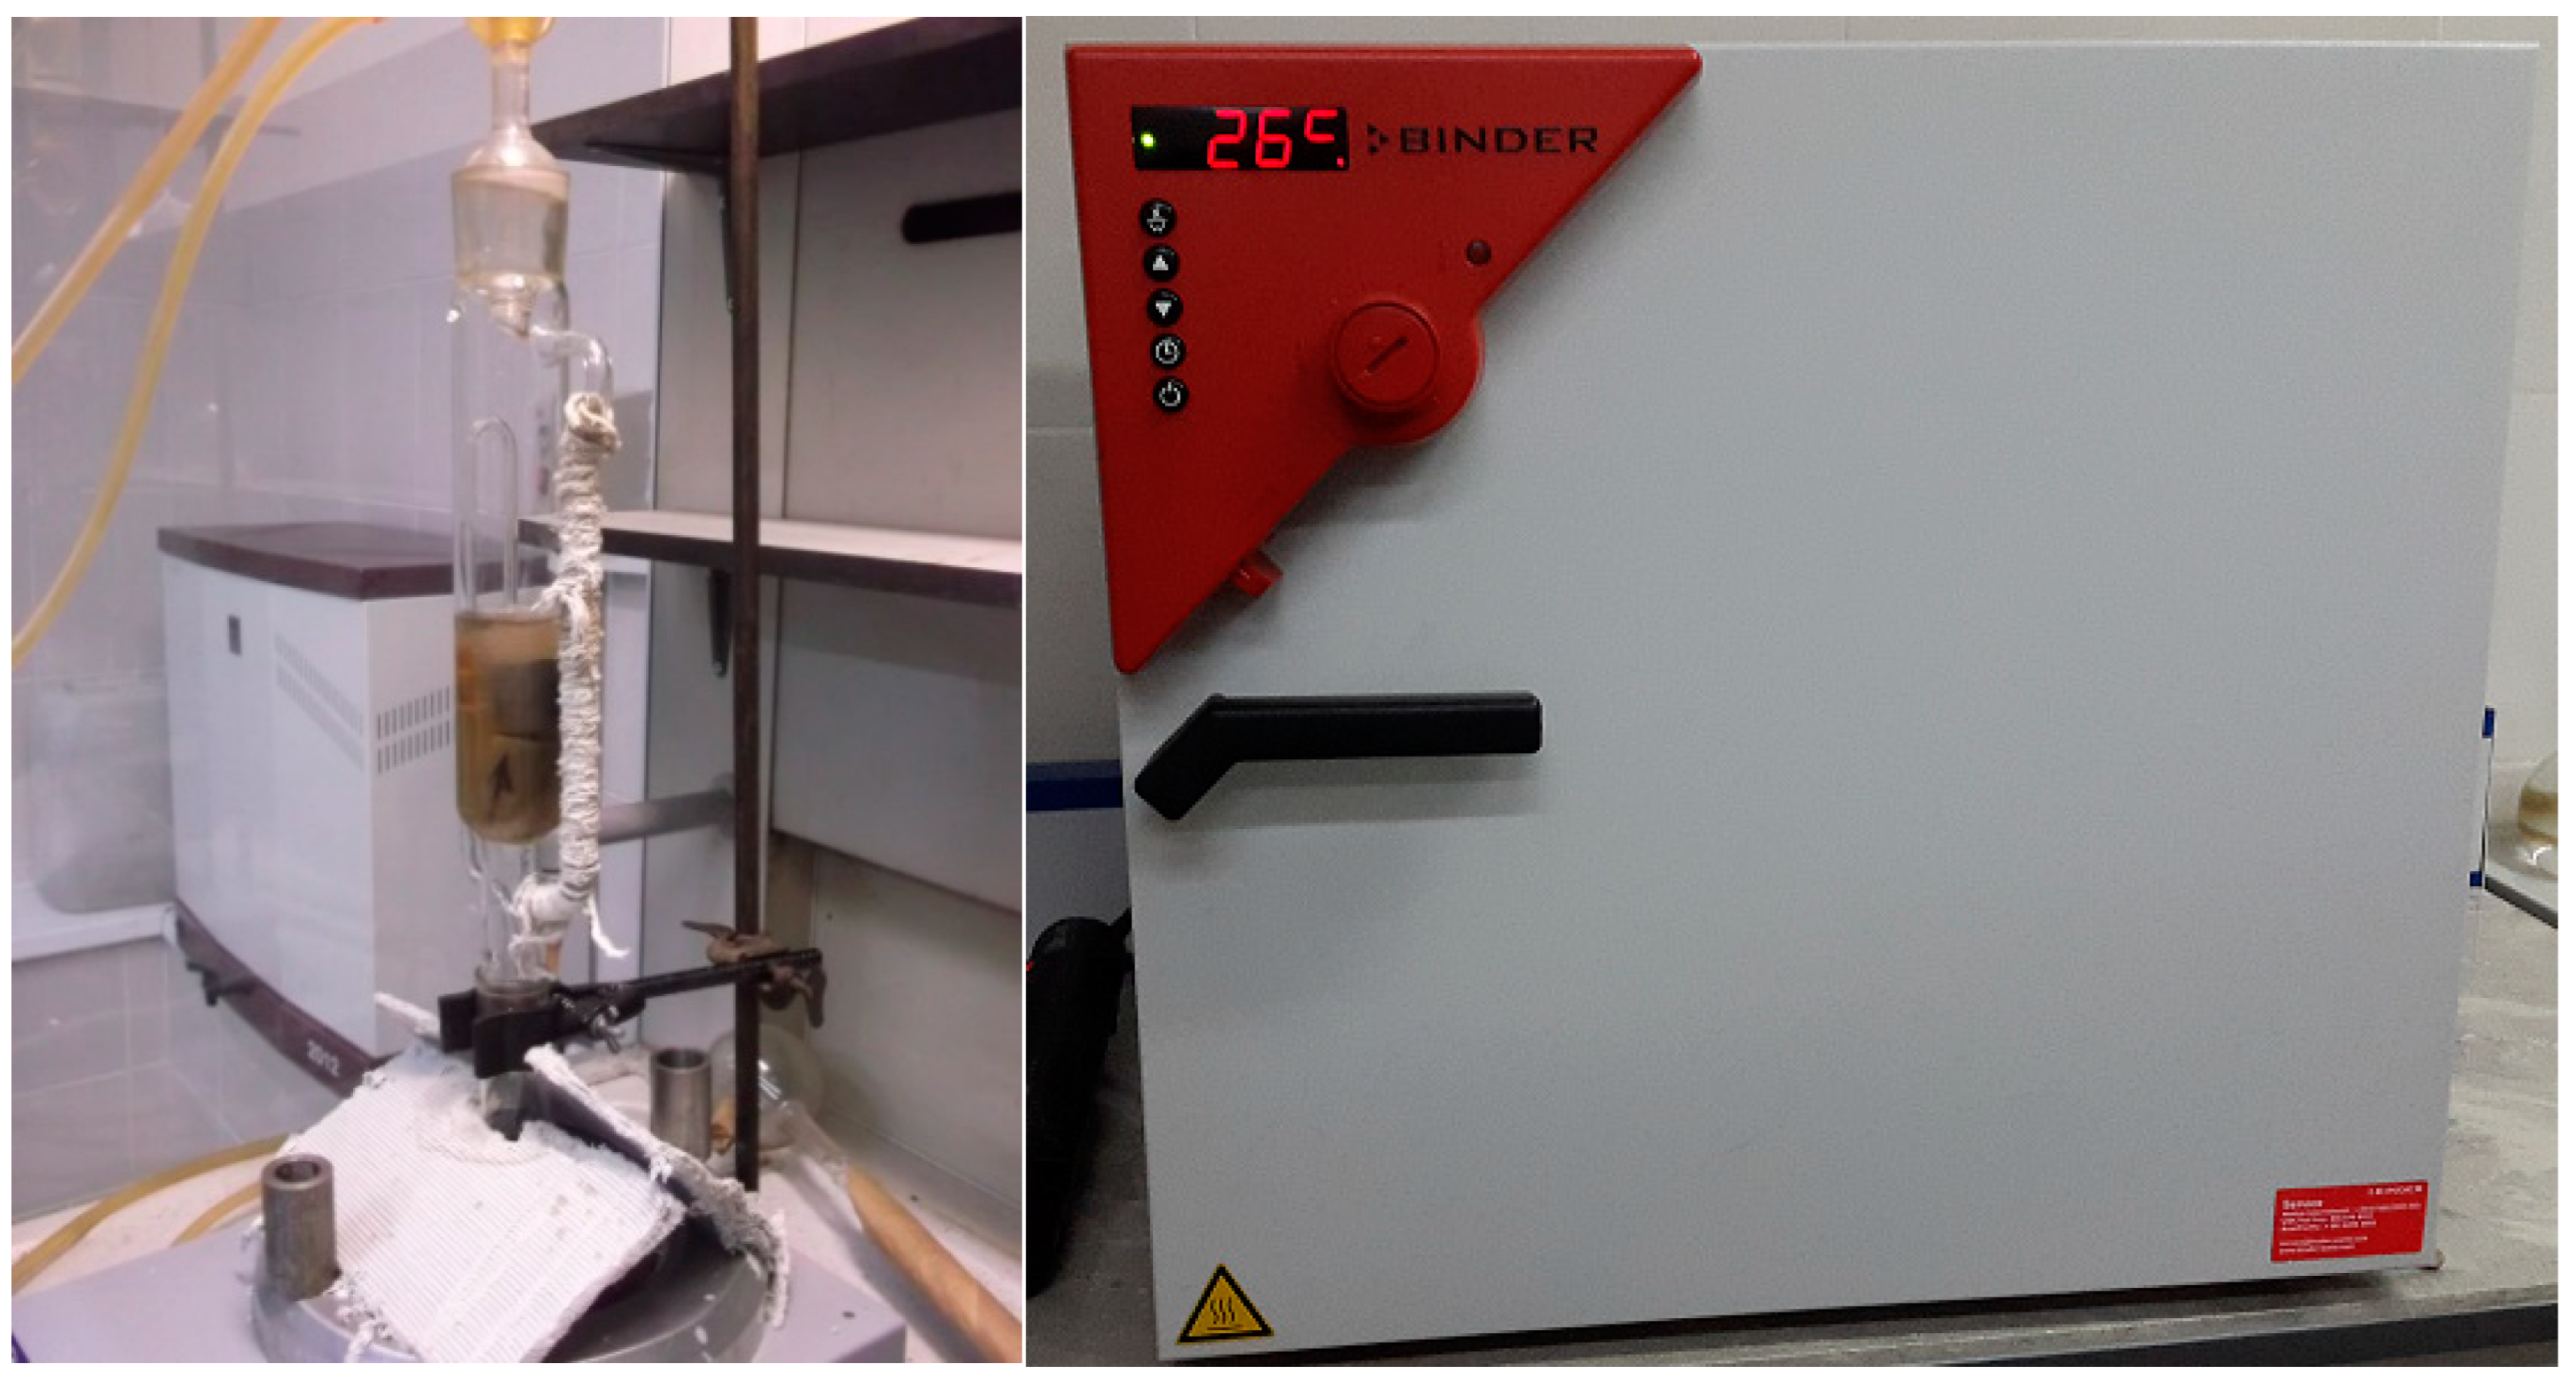
The core samples were cleaned using a Soxhlet apparatus along with organic solvent washing (
Figure 1). A benzene–alcohol mixture was used as the solvent. The operating principle of the Soxhlet apparatus is straightforward: solvent vapors pass through a side tube into the extractor and, subsequently, the condenser, where they condense into liquid form, filling the container that holds the samples inside the extractor.
During the cleaning process, the samples were checked for luminescence under ultraviolet light. Combined with the color of the solvent, this procedure was used to determine the degree of hydrocarbon removal.
After undergoing complete cleaning, all of the samples were dried in a drying oven (DKN 600) at 60 °C until they reached a constant weight.
After ascertaining the basic volume and weight parameters of the samples, they were placed in a glass desiccator to reduce their adsorption of atmospheric moisture and then transferred for further standard analysis (i.e., the determination of porosity and gas permeability).
To determine the filtration and reservoir properties of the samples, the “Abacus” computerized workstation was used to conduct automated data entry regarding thee weight and dimensions of the samples. The results of sample weighing, performed on analytical scales with an accuracy of 0.001 g, and the average sample dimensions, measured using a digital caliper, were automatically recorded in a specially created table.
To measure the grain volume of the samples, a calibrated helium porosimeter (ULTRA-PORE 300) operating based on Boyle’s law was used.
The absolute permeability of the samples was measured using gas (nitrogen) with calibrated ULTRA-PERM 600 equipment, which was equipped with the latest mass flow meters and pressure sensors. This software performs calculations using Darcy and Klinkenberg equations to determine the gas permeability of samples and the inverse of the mean pressure.
The fundamental Darcy equation for calculating gas permeability is as follows:
where
is the gas permeability, mD; μ is the gas viscosity, cP;
is the gas flow rate, cm
3/s;
is the inlet pressure, atm;
is the outlet pressure, atm;
A is the cross-sectional area of the sample, cm
2; and
is the sample’s length, cm.
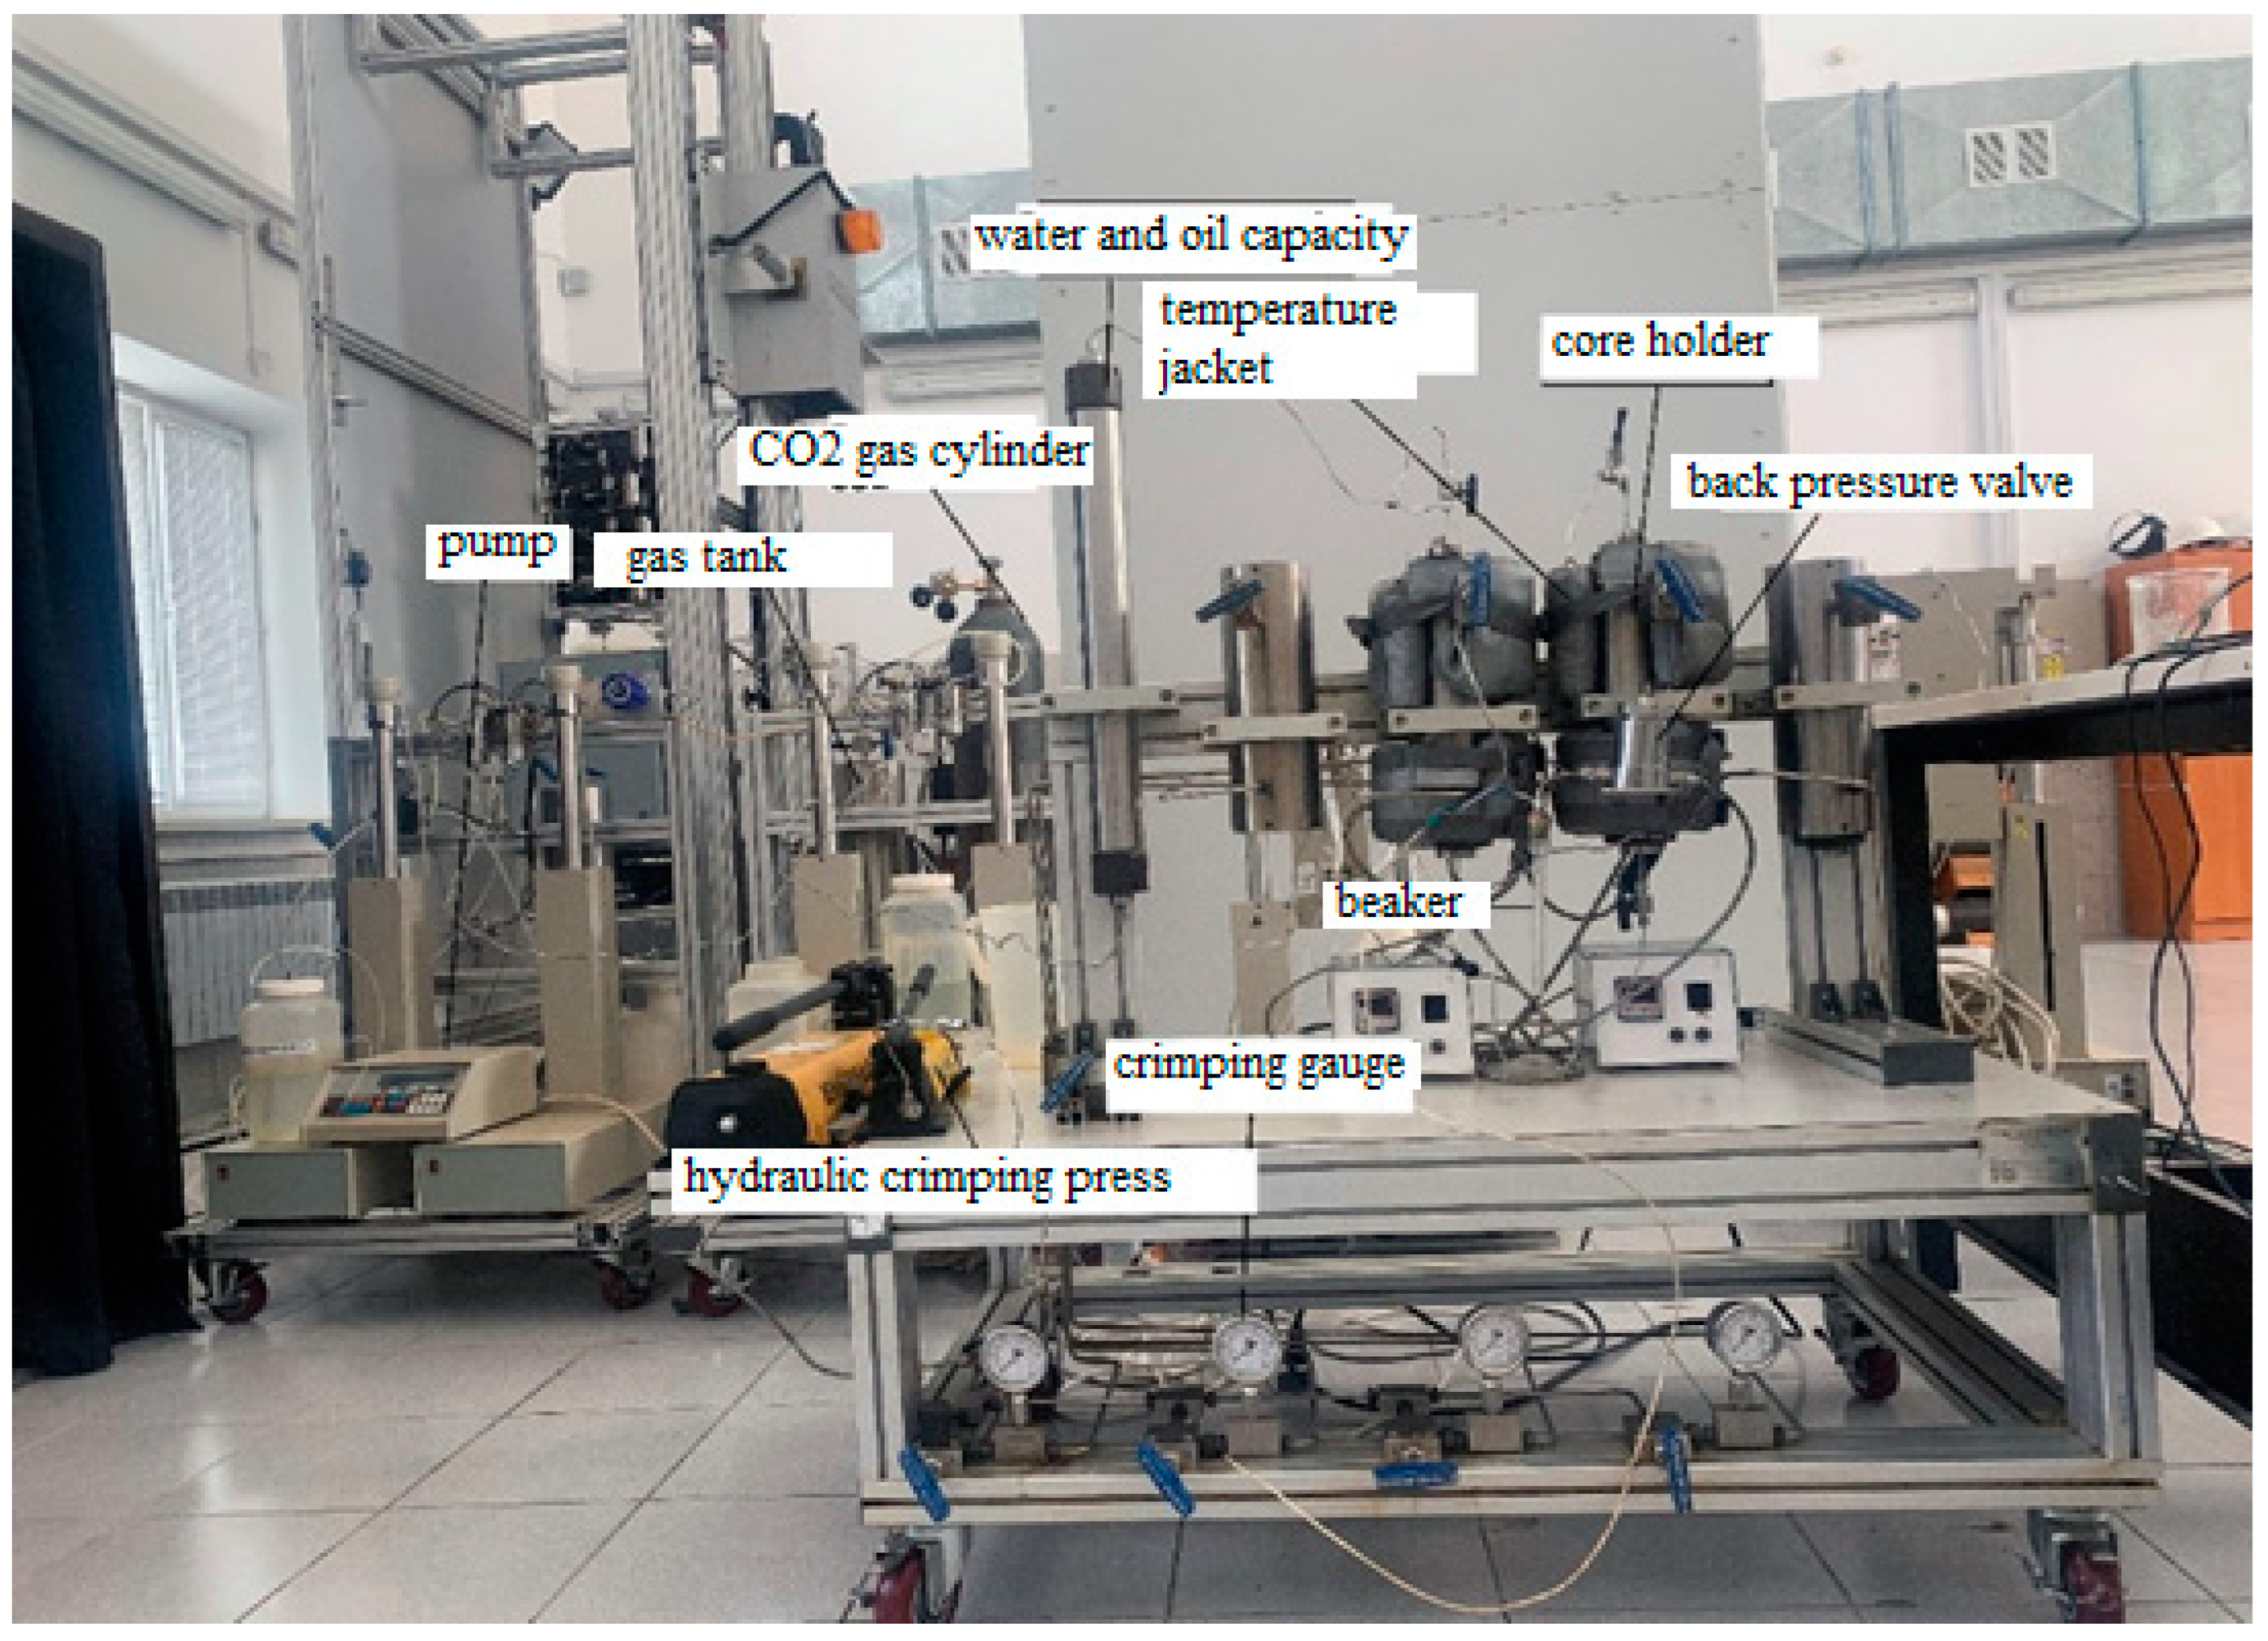
For conducting the special filtration studies, the PLS-200 system with four hydrostatic core holders was used (
Figure 2). The core holders were configured to operate under pressures of up to 10,000 psi and temperatures of up to 150 °C to closely simulate reservoir conditions.
The device is equipped with a pulse-free piston pump capable of injecting water, oil, and polymer at up to 3650 psi at flow rates ranging from 0.001 to 204 mL/hour. Additionally, it includes a DPS-100 differential pressure measurement system with two high-precision sensors (0.05%).
The core samples were initially saturated with formation water and then placed into the hydrostatic core holders of the system. An automatic saturator (AST-600) was used to saturate the model samples with water, allowing for the automated selection of the air evacuation time and saturation pressure, and thus ensuring fast and complete saturation of the core samples.
For the injection of water, oil, and polymer during the filtration studies, high-pressure dual-cylinder pulse-free syringe pumps and cylindrical piston displacement containers were used.
All filtration experiments were conducted without using back pressure, as the fluid output volumes were calculated using the material balance method. During each experiment, the core holders were wrapped with special heating jackets to maintain the reservoir temperature: 19.7 °C for the Cretaceous horizon and 29.3 °C for the Jurassic horizon.
2.1. Methodology for Filtration Studies on Core Samples
The samples were 100% saturated with formation water, and their water permeability (kw) was determined: the water permeability of the sample (k), before any interaction between the injected water, the formation water, and the rock in its pore channels, was calculated using Darcy’s formula in three different flow regimes.
where
is the water permeability of the core sample, μm
2;
is the volume of formation water passing through the core sample, cm
3;
is the water viscosity, mPa·s;
is the length of the core sample, cm;
is the water filtration time, s;
is the cross-sectional area of the core sample, cm
2; and
is the pressure drop at the end of the core sample, MPa;
The water in the samples was displaced by oil, and the residual water saturation (Swi) was determined in order to simulate reservoir conditions;
The samples were saturated with oil;
The oil in the samples was displaced with technical water: graduated cylinders were placed at the outlet tubes from the core holder to measure the amount of recovered oil, which was later used to determine the oil recovery factor. The efficiency with which the oil was displaced by the water was calculated as the ratio of the displaced oil volume
to the initial oil volume before the injection of the displacement agent
:
After injecting 7–8 pore volumes into the core and increasing the water cut in the produced fluid to 95–99%, the selected displacement agent (alkali/surfactant, polymer, hot water, nitrogen, or carbon dioxide) was injected until the pressure differential stabilized.
In some of the filtration studies, the pumped volume was used, instead of the Vinj water/Vpore ratio, to plot the graph of the displacement efficiency coefficient.
In all cases of polymer flooding, the FloPaam 5205 VHM polymer was used in concentrations of 2000, 2500, and 3000 ppm, along with the heat-resistant polymer TR-15-16.
2.2. Object of Study for Filtration Experiments
Core Material: Core material from the Cretaceous and Jurassic horizons was used for filtration studies. The baseline data for the filtration experiments conducted on the core samples are presented in
Table 1. For some samples, the exact core sampling depth was unknown. It is known that the reservoir’s filtration and storage properties are heterogeneous, as shown in
Figure 3. A significant variation in the absolute permeability values with depth and as a function of porosity can be observed (
Figure 3).
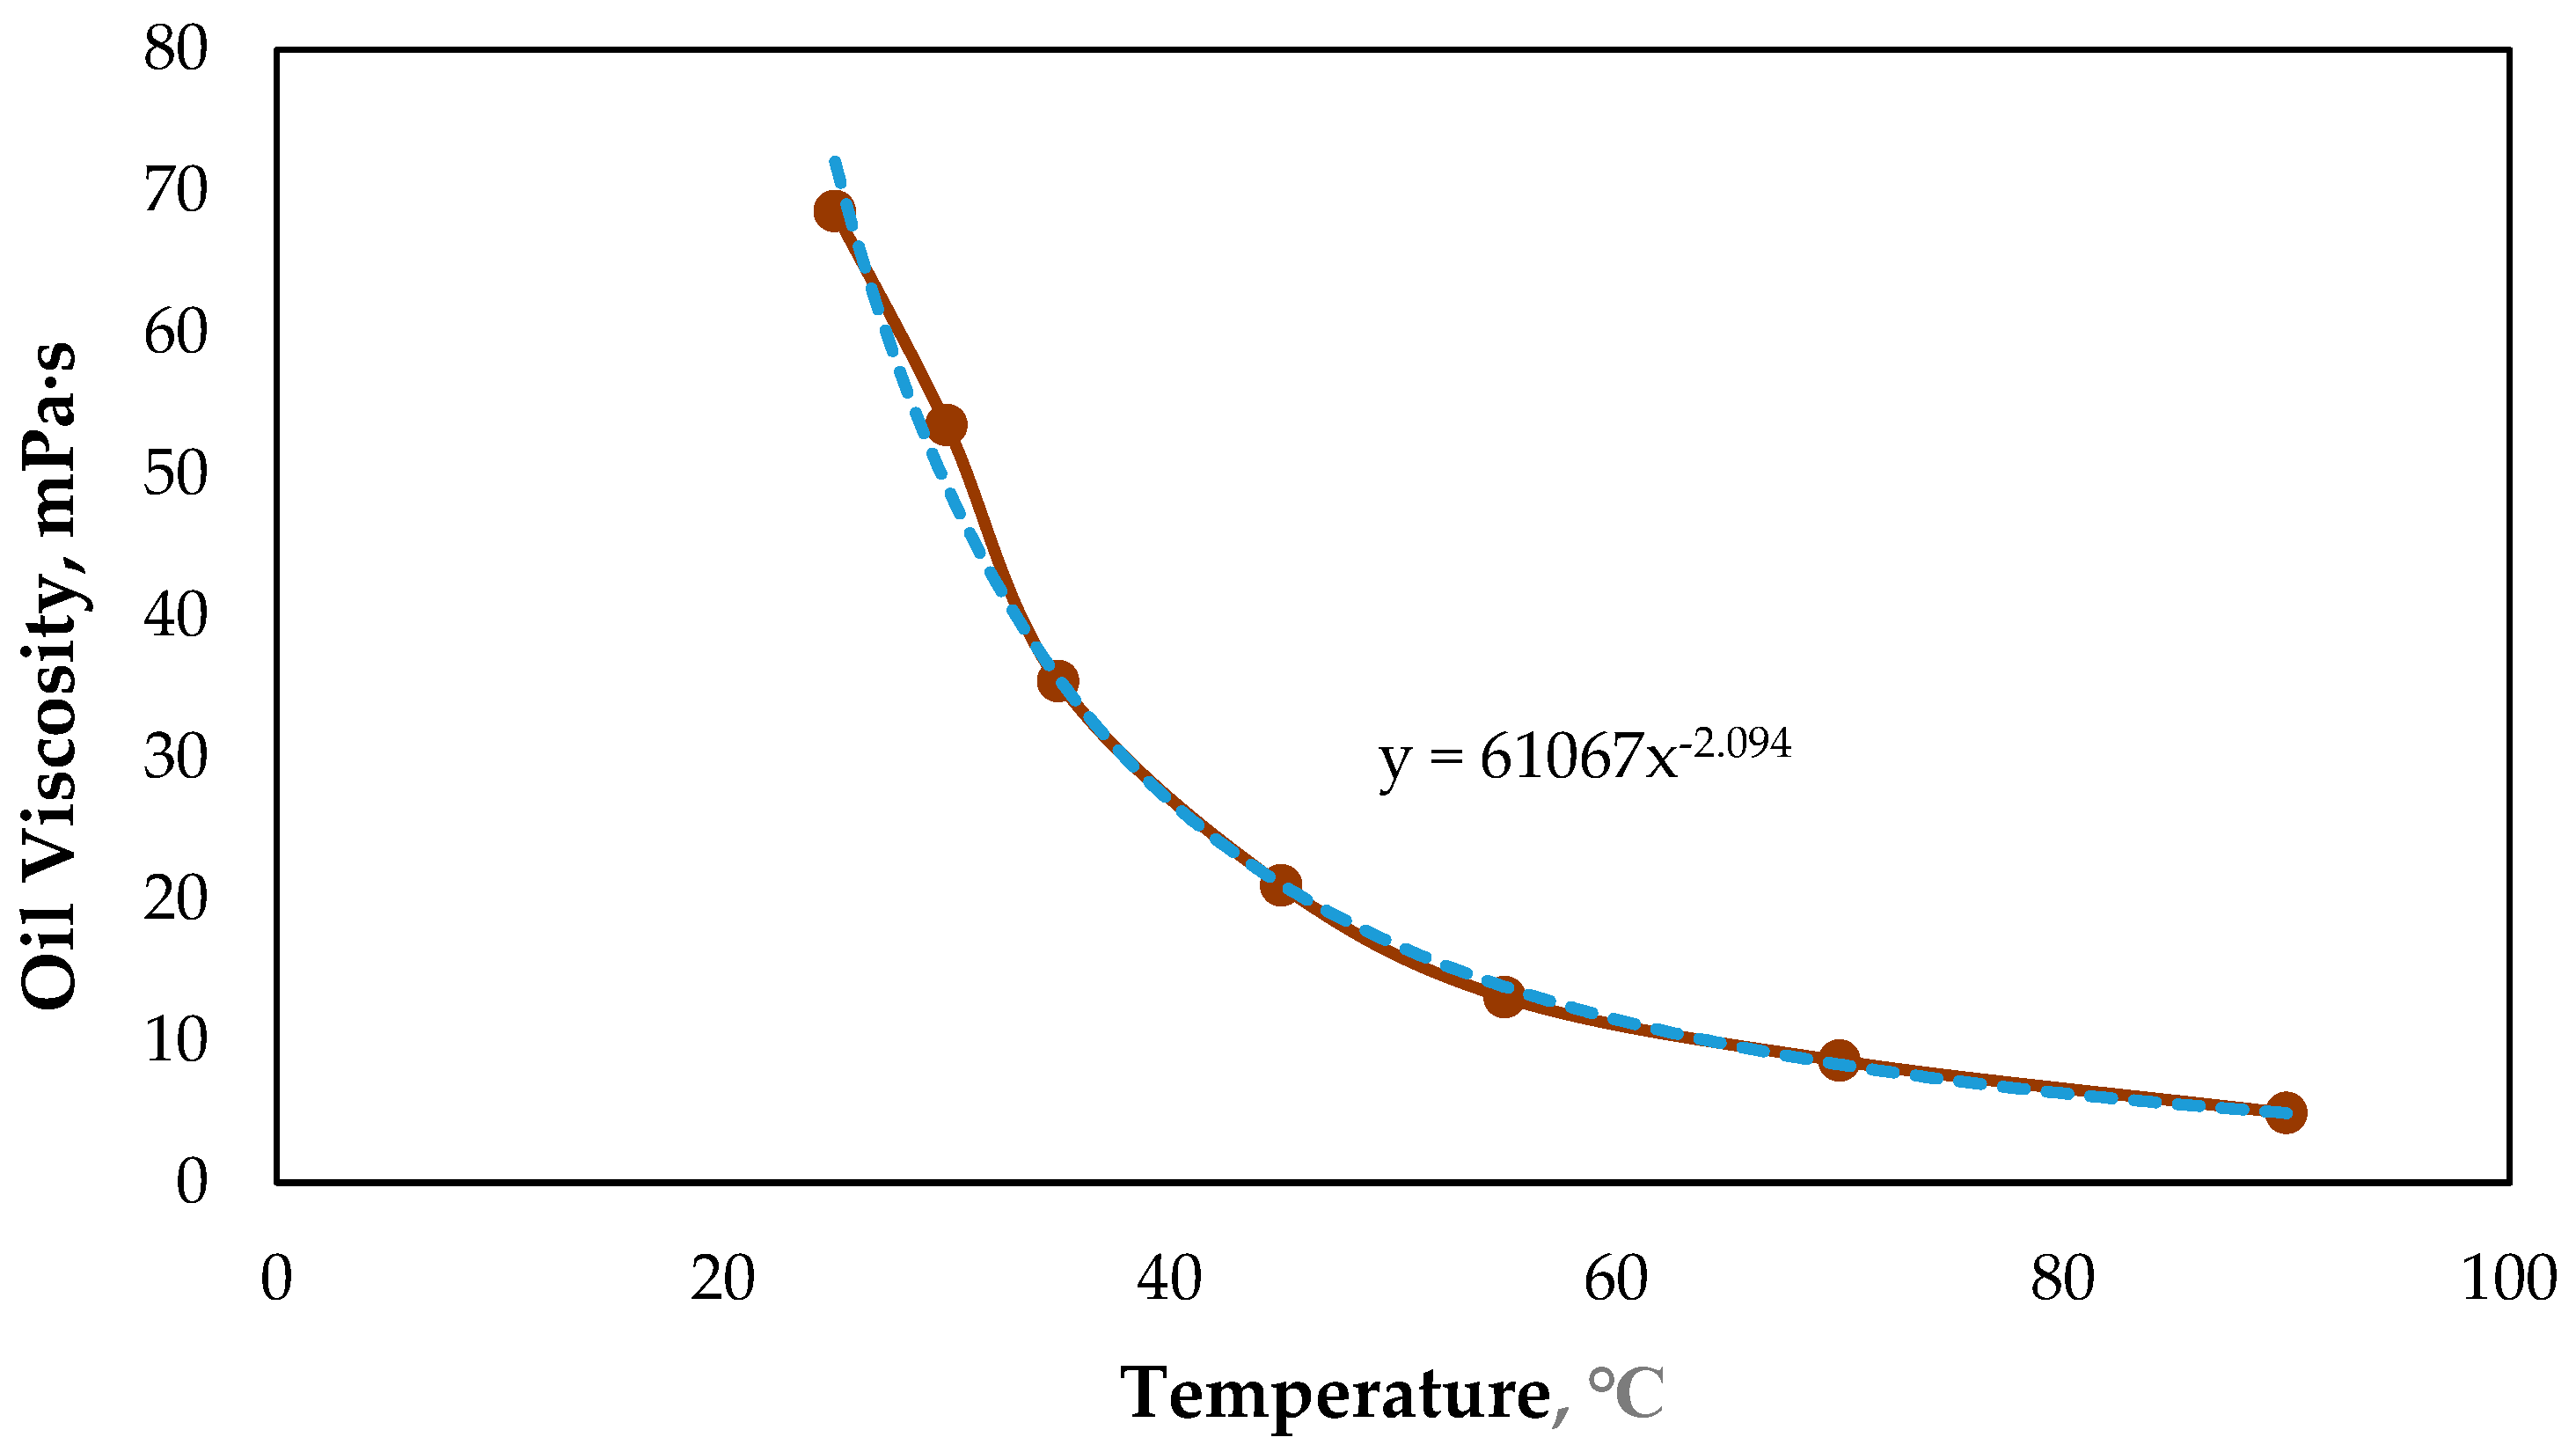
Oil: Crude oil samples from various wells and horizons were used for the filtration studies. At temperatures of 25–35 °C, the oil behaves as a pseudoplastic fluid, while, at higher temperatures, it exhibits Newtonian behavior.
Figure 4 illustrates the dependence of the viscosity of the Jurassic horizon (J-IV) oil on the temperature.
Formation Water: For the filtration experiments, the formation water of the Moldabek East field was simulated under laboratory conditions with a salinity of 173 g/L. One liter of synthetic water contains the following ions: HCO3—0.195 g; SO4—0.793 g; Cl—104.6 g; Ca—1.9 g; Mg—0.79 g; and Na + K—64.6 g.
The physical properties of the formation water are presented in
Table 2.
Polymer Flopaam 5205VHM (SNF Floerger, Andrézieux-Bouthéon, France)
: The concentration range for the industrial application of this polymer is 0.1–0.5% g/L of formation water.
Figure 5 presents the rheological curves of Flopaam 5205VHM at different temperatures.
At temperatures below 55 °C, Flopaam 5205VHM exhibits pseudoplastic behavior, whereas, at higher temperatures, it behaves as a Newtonian fluid. The upper temperature limit for the applicability of this polymer, as recommended by the manufacturer, is 50 °C. When overheated, the polymer undergoes degradation, which significantly reduces its pseudoplastic properties and decreases its viscosity.
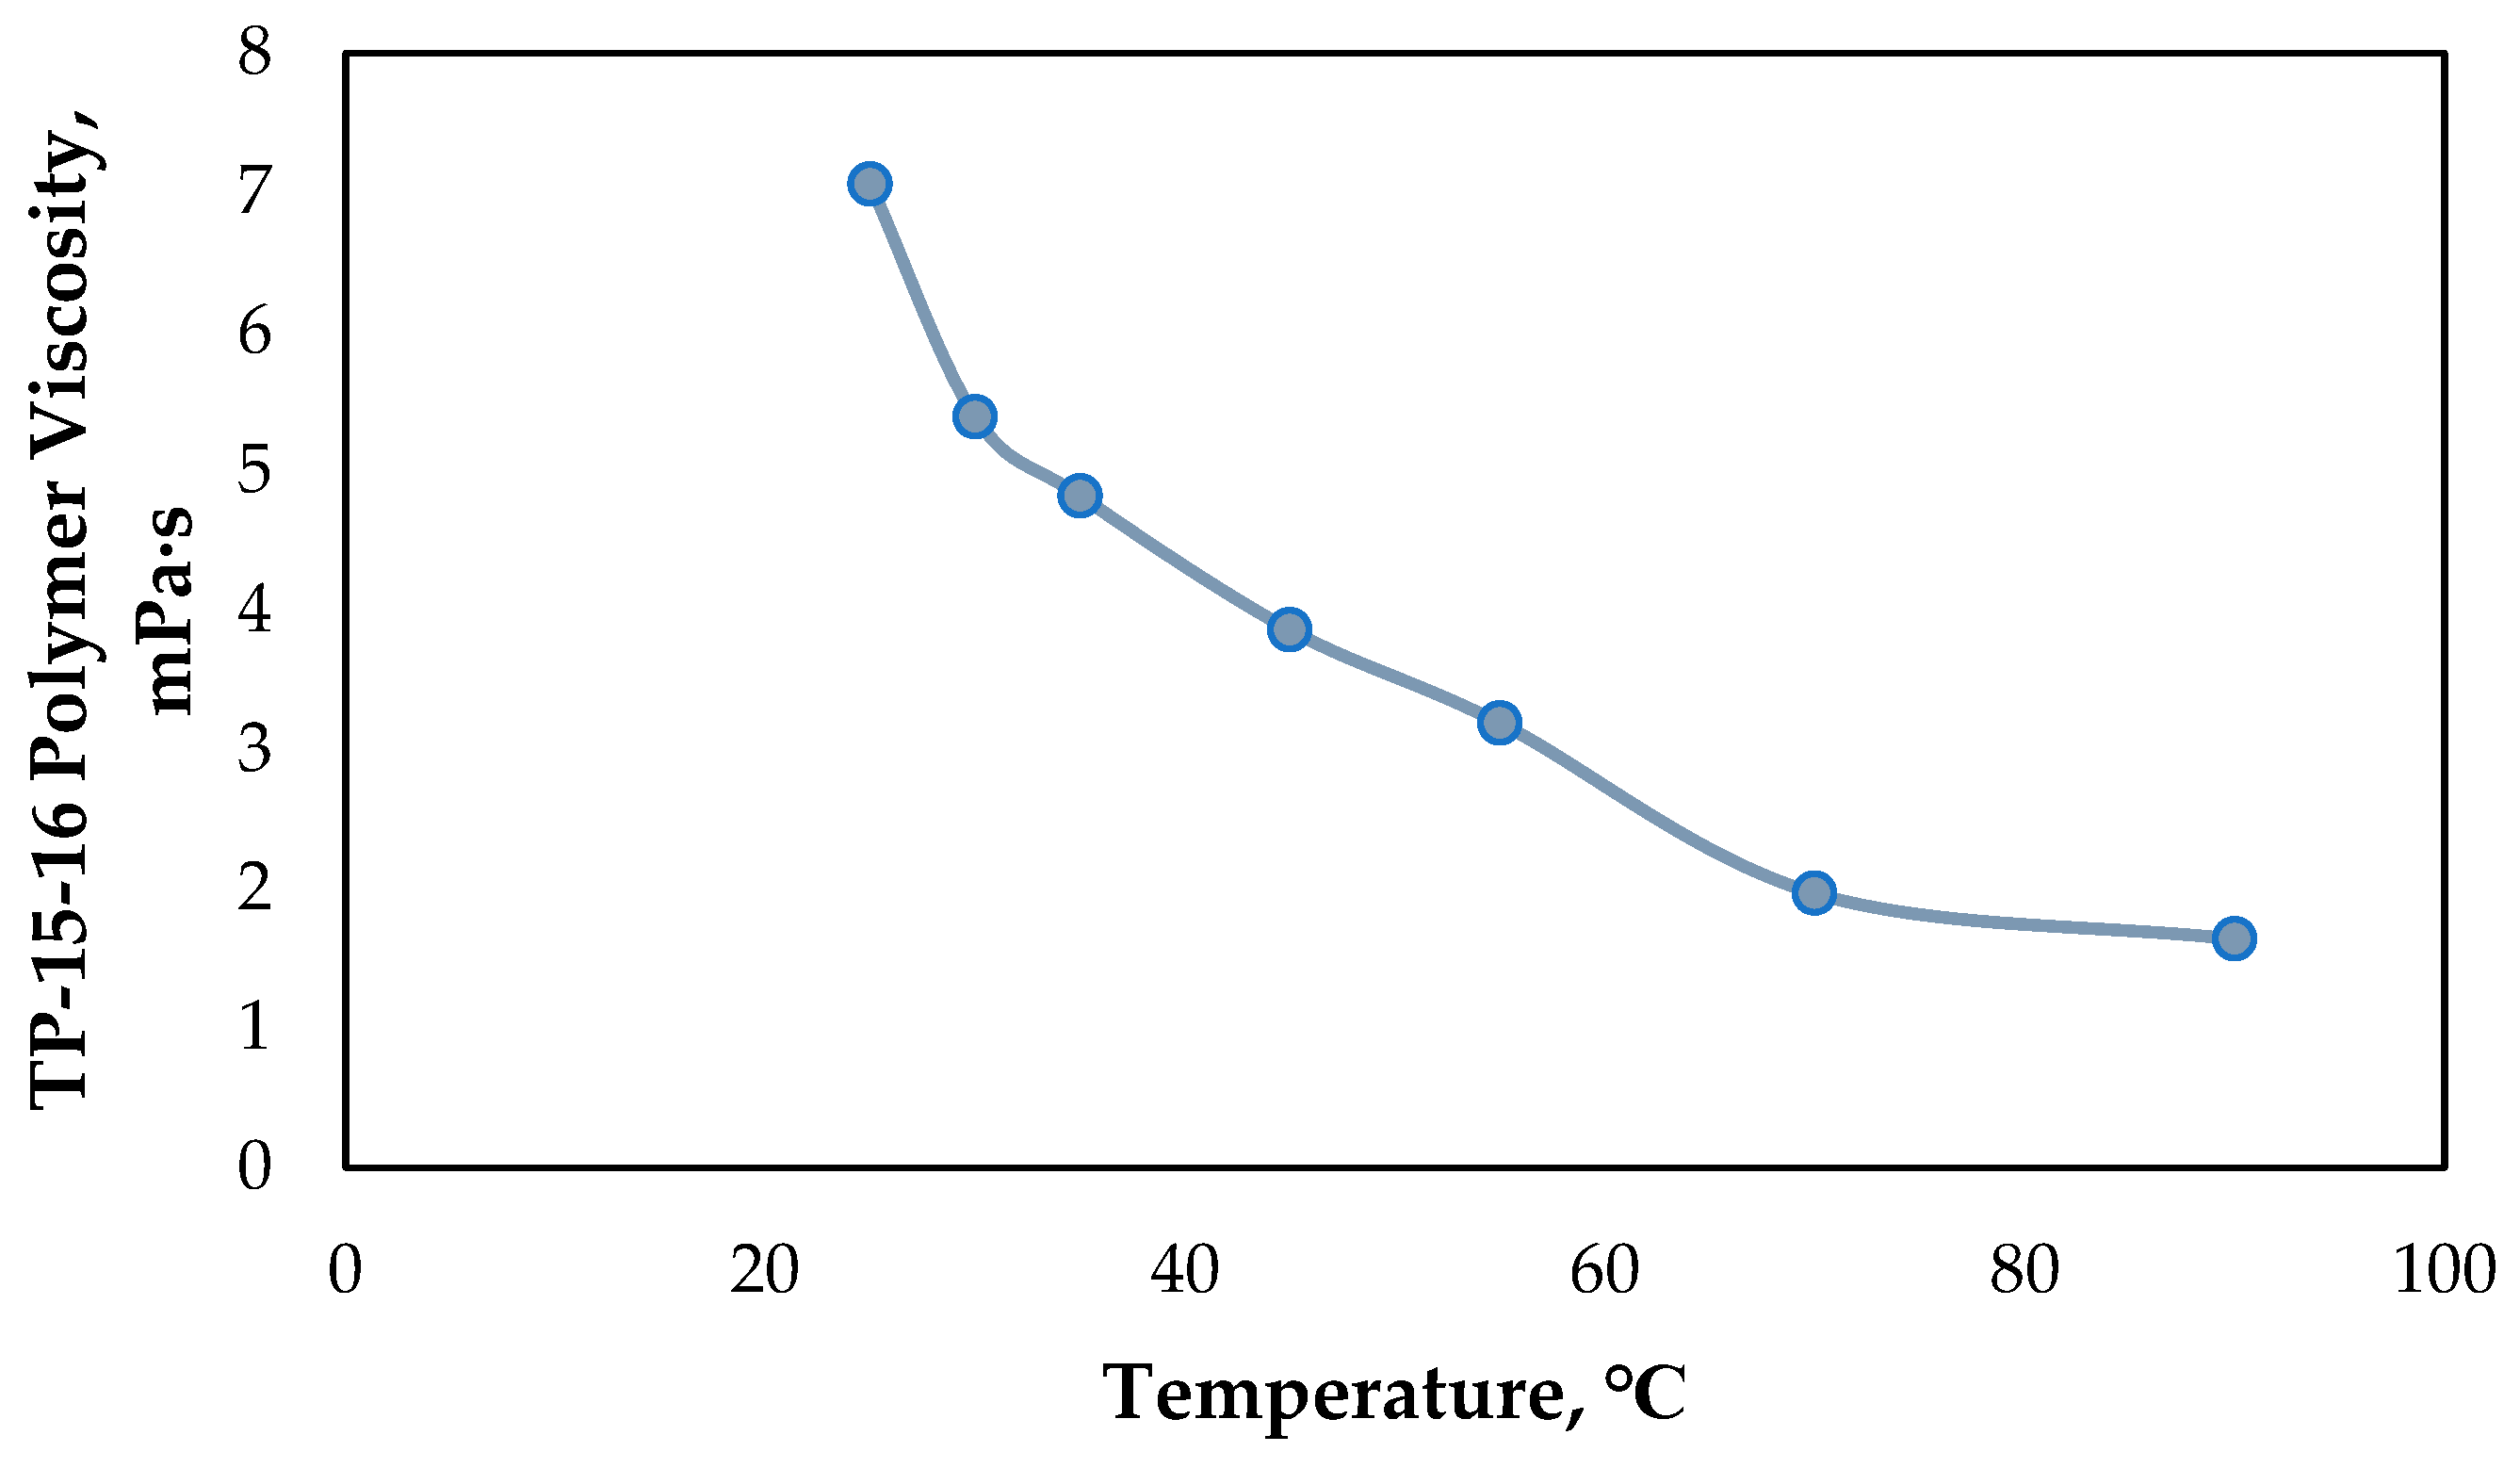
Polymer TR-15-16 (SNF Floerger, France): This polyacrylamide can be used in reservoirs with temperatures of up to 90 °C. The concentration range for its industrial application is 0.1–0.5% g/L of formation water.
Figure 6 illustrates the dependence of TR-15-16’s viscosity on the temperature. The polymer exhibits pseudoplastic behavior across the entire studied temperature range.
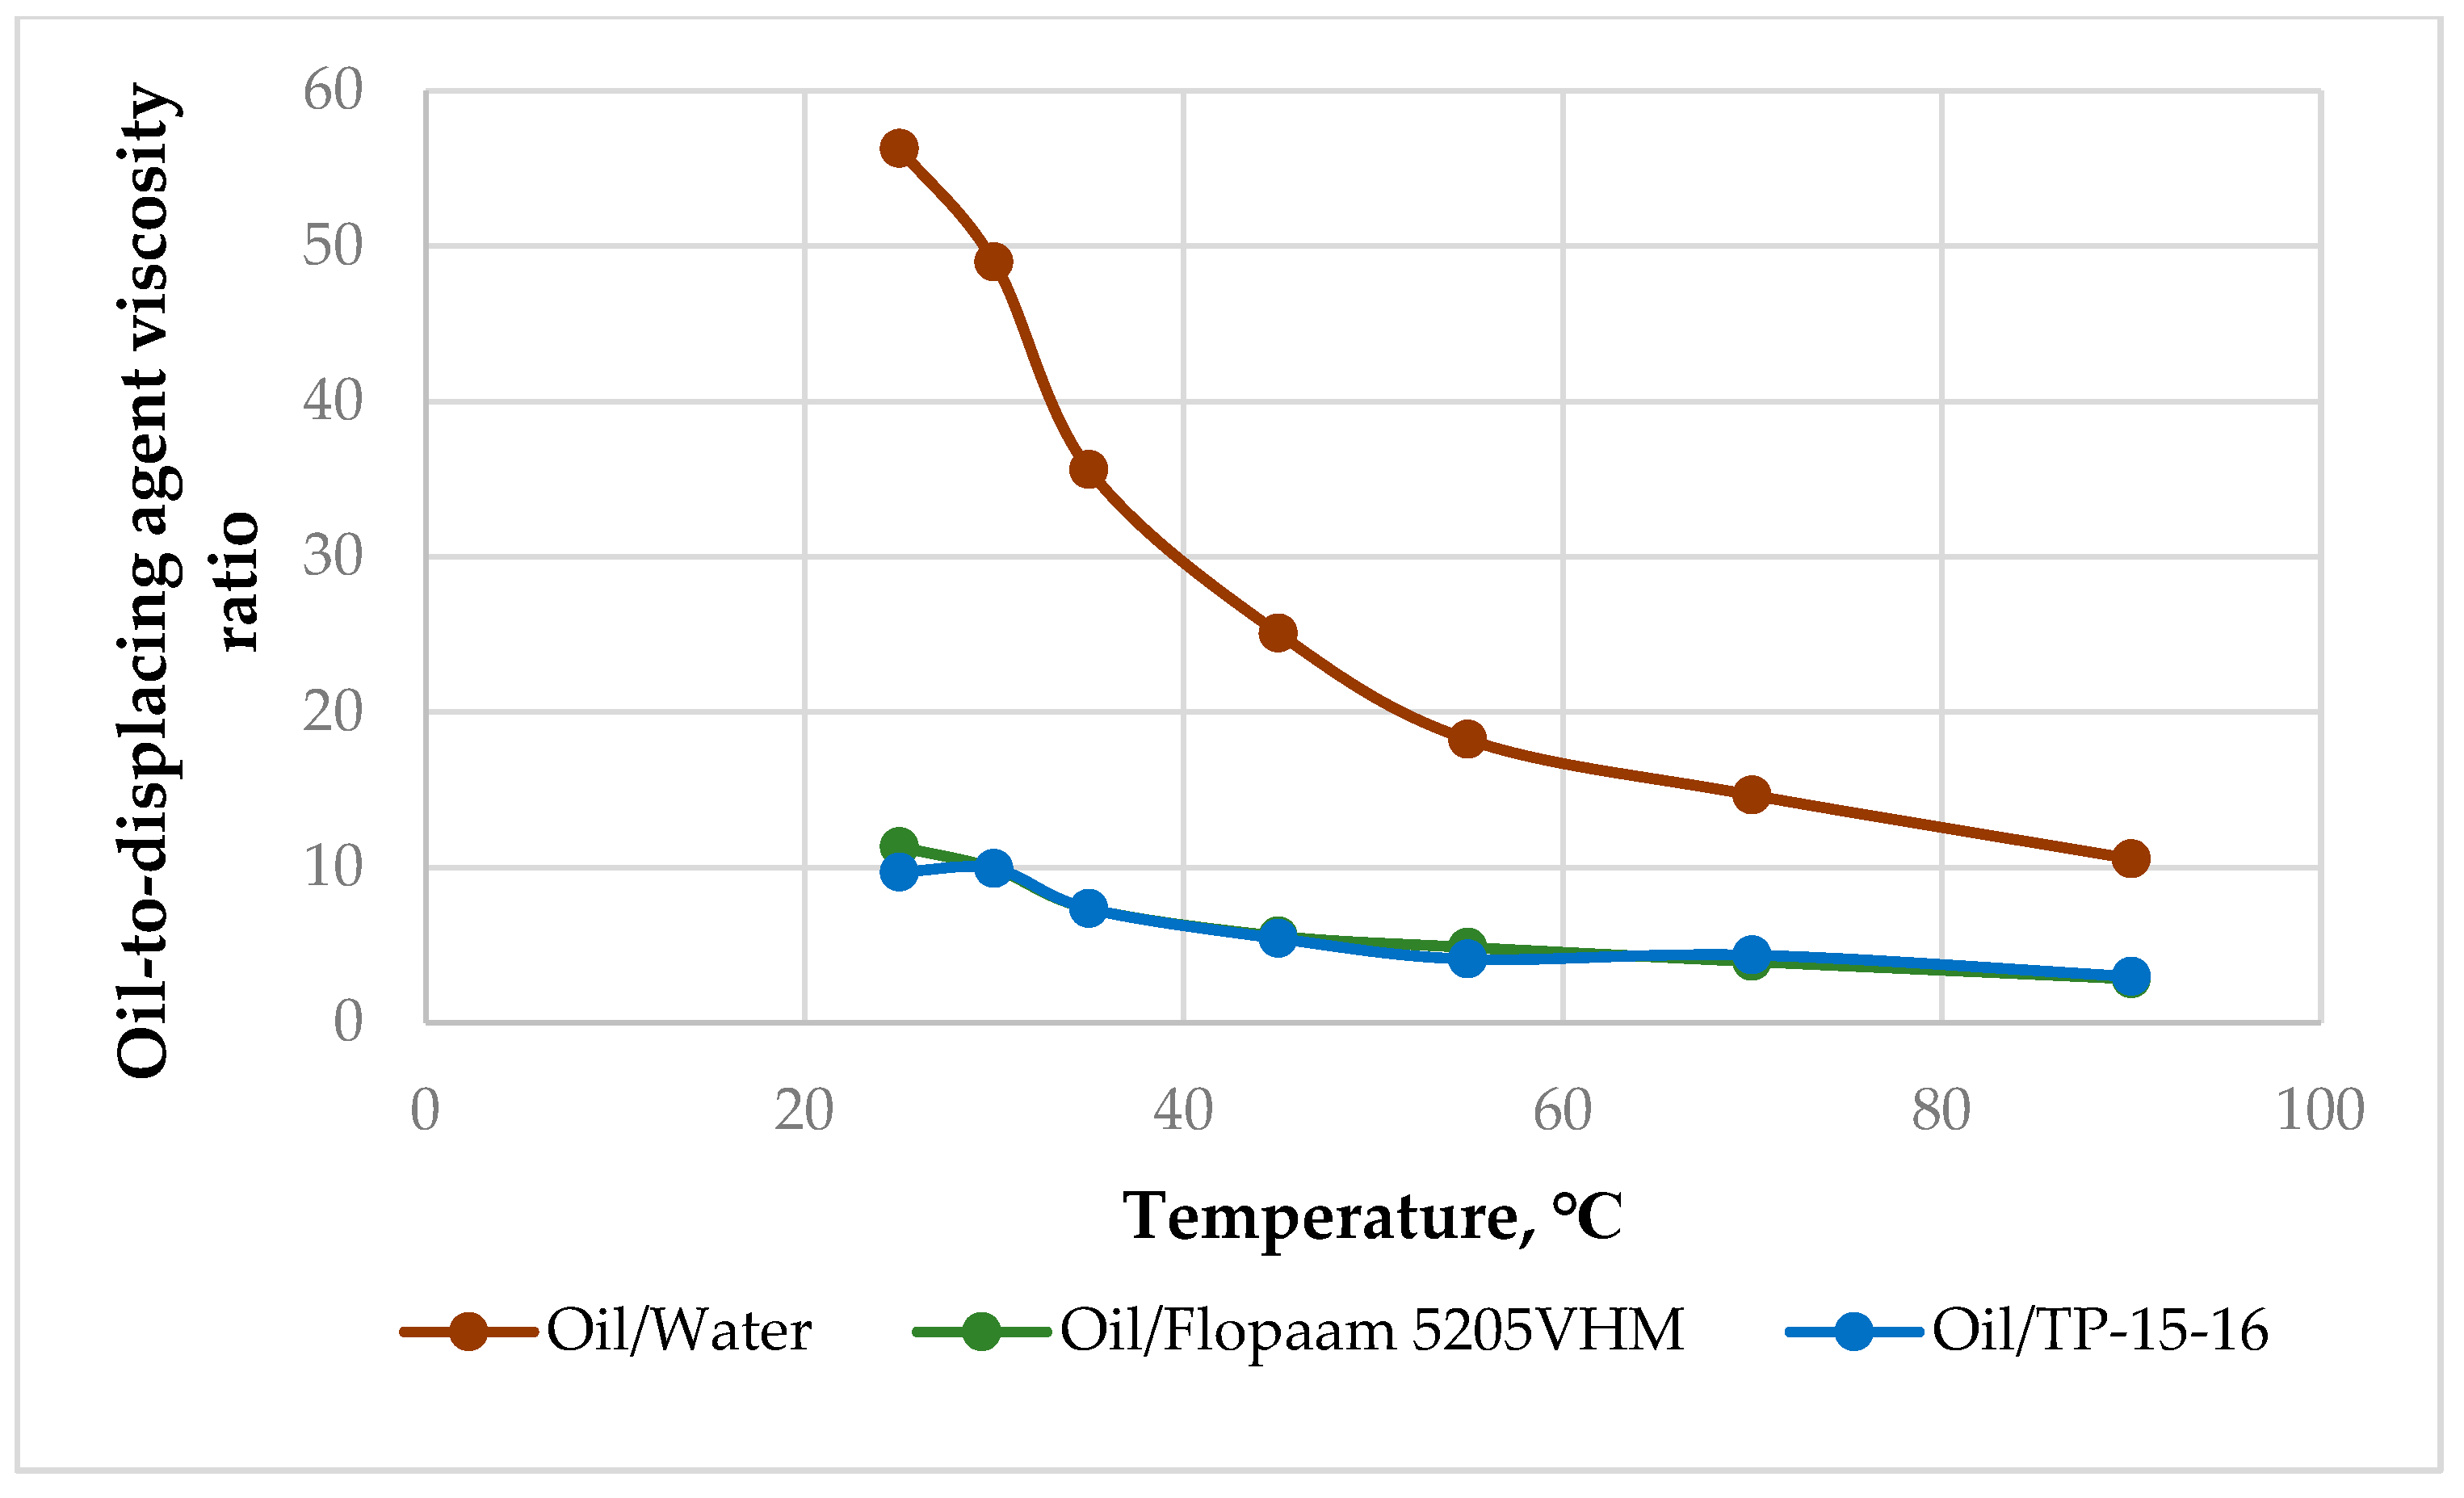
Figure 7 illustrates the viscosity ratio of oil to the different displacing agents used. Notably, both polymers exhibit highly similar viscosity characteristics across the entire temperature range.
The key differences between the two polymers are presented in
Table 3.
3. Results of Experimental Studies
3.1. Filtration Experiment Results for Chemical EOR
The results of the analysis of standard core samples from the East Moldabek field are summarized in
Table 4, demonstrating the effectiveness of the ASP flooding method (using alkali, surfactant, and polymer agents).
3.2. ASP Flooding
The ASP flooding filtration experiments were conducted as follows:
Phase behavior tests at the alkali/surfactant–oil interface.
Lauryl sulfate (hereinafter referred to as the surfactant) was used as a surfactant, while sodium hydroxide was used as the alkali agent. These reagents were prepared in the required concentrations using technical water and were mixed until fully dissolved.
Based on the results of the phase behavior tests conducted at different alkali and surfactant concentrations, the following concentrations were selected for the filtration studies.
The specific alkali/surfactant concentrations for each experiment are presented in
Table 5.
The experimental conditions and the results of the filtration experiments conducted to determine the oil displacement efficiency when using the ASP agent are presented in
Table 5 and
Figure 8.
As shown in
Table 5, which summarizes the filtration experiment results for the ASP flooding, the highest increase in the displacement efficiency coefficient was achieved using the higher-viscosity oil. Specifically, for the oil from the Cretaceous horizon with a viscosity of 407.4 mPa·s, the additional increase was 19.2%, which can be compared to that of 17.7% for the oil from the Jurassic horizon with a viscosity of 66.1 mPa·s. However, it should be noted that the gas permeability in the Cretaceous horizon is significantly higher than that in the Jurassic horizon (see
Table 4)—1460 mD versus 127.7 mD. Additionally, the core samples from the Cretaceous horizon were packed samples.
These filtration experiment results indicate that ASP flooding is an effective enhanced oil recovery (EOR) method for high-viscosity oil. Overall, as shown in the graph (
Figure 8), in most cases, the displacement efficiency reached 68%.
3.3. Injection of Surfactant and Polymer Solutions
The results of the filtration experiment conducted to determine the oil displacement efficiency during the injection of surfactant and polymer solutions are presented in
Table 6.
The core pore volume was 6.471 cm3 (porosity: 29.69%), and the absolute air permeability was 430 mD.
Throughout the entire experiment, core saturation and subsequent water flooding were achieved using formation water at a flow rate of 0.1 cm3/min.
A total of seven pore volumes of formation water and surfactant solution were injected into the core. The first two pore volumes of formation water were injected to simulate conventional waterflooding at a reservoir temperature of 30 °C. At the end of the waterflooding, the displacement efficiency reached 25.89%.
To simulate a chemical flooding method, two types of surfactants—Surfactant 1 (S1) and Surfactant 2 (S2)—were used in this experiment. To evaluate their oil displacement efficiencies, each surfactant solution was injected separately in a quantity of two pore volumes. After injecting a total of five pore volumes of S1 and S2, the additional increases in the displacement efficiency were 8.4% and 1%, respectively. The overall displacement efficiency for the core (
Figure 9, Model 5) reached 35.29% (
Figure 9).
For the polymer flooding, conventional waterflooding was first simulated by injecting three pore volumes of formation water into the core (
Figure 10, Model 6). The absolute permeability of core Model 6 was 271 mD. The core pore volume was 6.457 cm
3 (porosity: 30.48%). Throughout the experiment, core saturation and subsequent water flooding were achieved using formation water at a flow rate of 0.1 cm
3/min.
The oil displacement efficiency for the water injection was 27%, with flooding carried out at a temperature of 30 °C. Subsequently, a 0.1% solution of partially hydrolyzed polyacrylamide (HPAM) with a degree of hydrolysis of 30% and a molecular weight of 18 × 10
6 was injected. The first two pore volumes of HPAM solution were injected at 30 °C, and then the temperature was gradually increased to 95 °C (
Figure 10).
3.4. Results of Filtration Experiments Involving Polymer Flooding
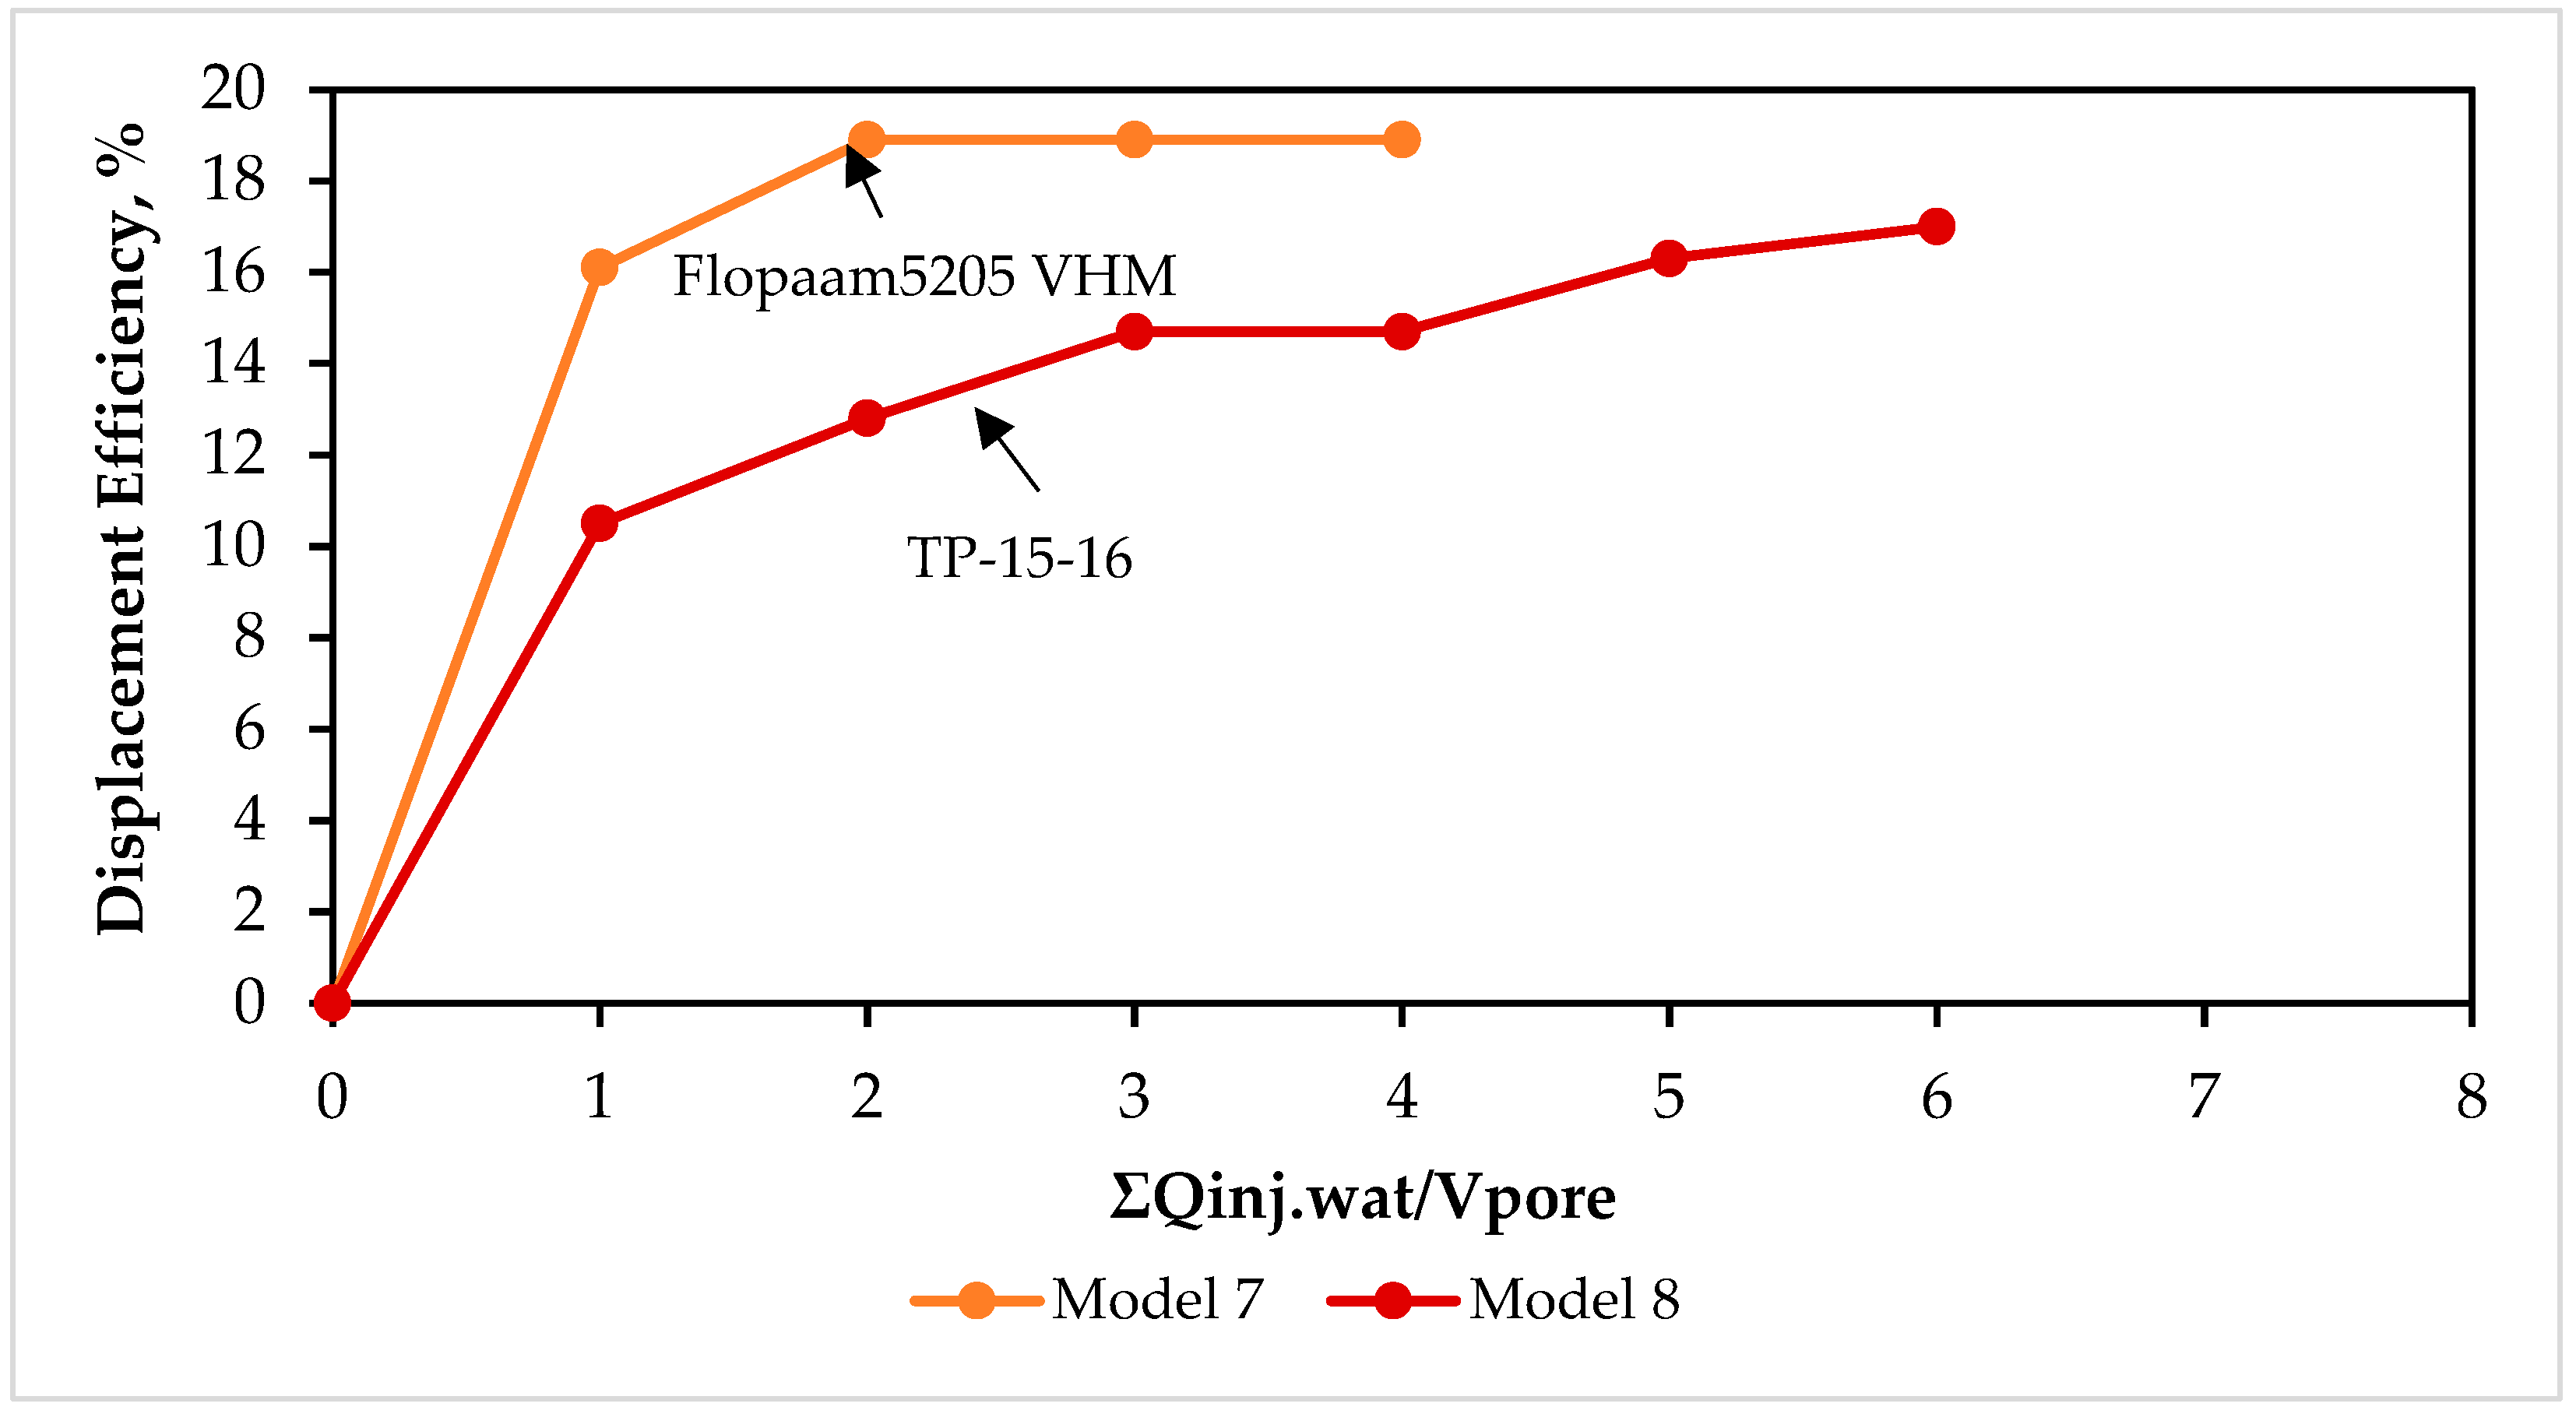
The results regarding the displacement of oil by an aqueous solution of Flopaam 5205 VHM and TP-15-16 polymers under constant pressure-drop conditions are shown in
Figure 11 (
Table 7). Under four-pore-volume injection, the permeability of the core for the polymer solution reached 1.36 mD.
A relatively rapid stabilization of the pore space saturation was observed. The aqueous solution of Flopaam 5205 VHM led to an increase in the displacement efficiency compared to the formation water at the same temperature (18.9% vs. 12.9%, respectively) (
Table 7).
The displacement of oil by water in a volume of two pore volumes (T = 30 °C) was followed by additional displacement using a heat-resistant polymer solution, TP-15-16, at temperatures of 30, 45, and 70 °C.
Figure 11 presents a graph of the displacement efficiency increase and permeability variation obtained with the displacing agent. The displacement efficiency during the water injection was 12.8%. During the additional oil displacement using the polymer solution, the displacement efficiencies achieved were 14.7%, 15.5%, and 17.0% at 30, 45, and 70 °C, respectively.
At equal concentrations, the polymer solution TP-15-16 was less effective than Flopaam 5205 VHM. The displacement efficiency for Flopaam 5205 VHM reached 18.9% (at reservoir temperature), whereas that for TP-15-16 was 17.0% (at 70 °C).
3.5. Results of Filtration Experiments on Thermal EOR Methods (Hot-Water Injection)
Two filtration experiments were conducted at different times to determine the displacement efficiency during thermal treatment using hot water.
The displacement of oil by water was studied at different temperatures: 25, 30, 35, 45, 55, 75, and 90 °C (
Table 8).
Figure 12 presents a graph of the increase in the displacement efficiency as a function of the water injection. The water injection rate remained constant at all temperatures. After 70 °C, the increase in the displacement efficiency declined, which may be attributed to the rheological properties of fluids: at temperatures above 70 °C, the viscosities of oil and water, as well as their viscosity ratios, change only slightly (
Figure 12).
A reduction in permeability (typically at 100% water saturation) during reservoir heating is usually associated with the thermal expansion of the rock matrix, the washing out of fine-grained fractions, and, consequently, the narrowing of pore channels. In our case, the saturation dynamically changed with heating; the water saturation increased, which should, theoretically, have a positive effect on the water permeability. However, it appears that, at high temperatures, the expansion of the rock matrix outweighed the effect of increased water saturation.
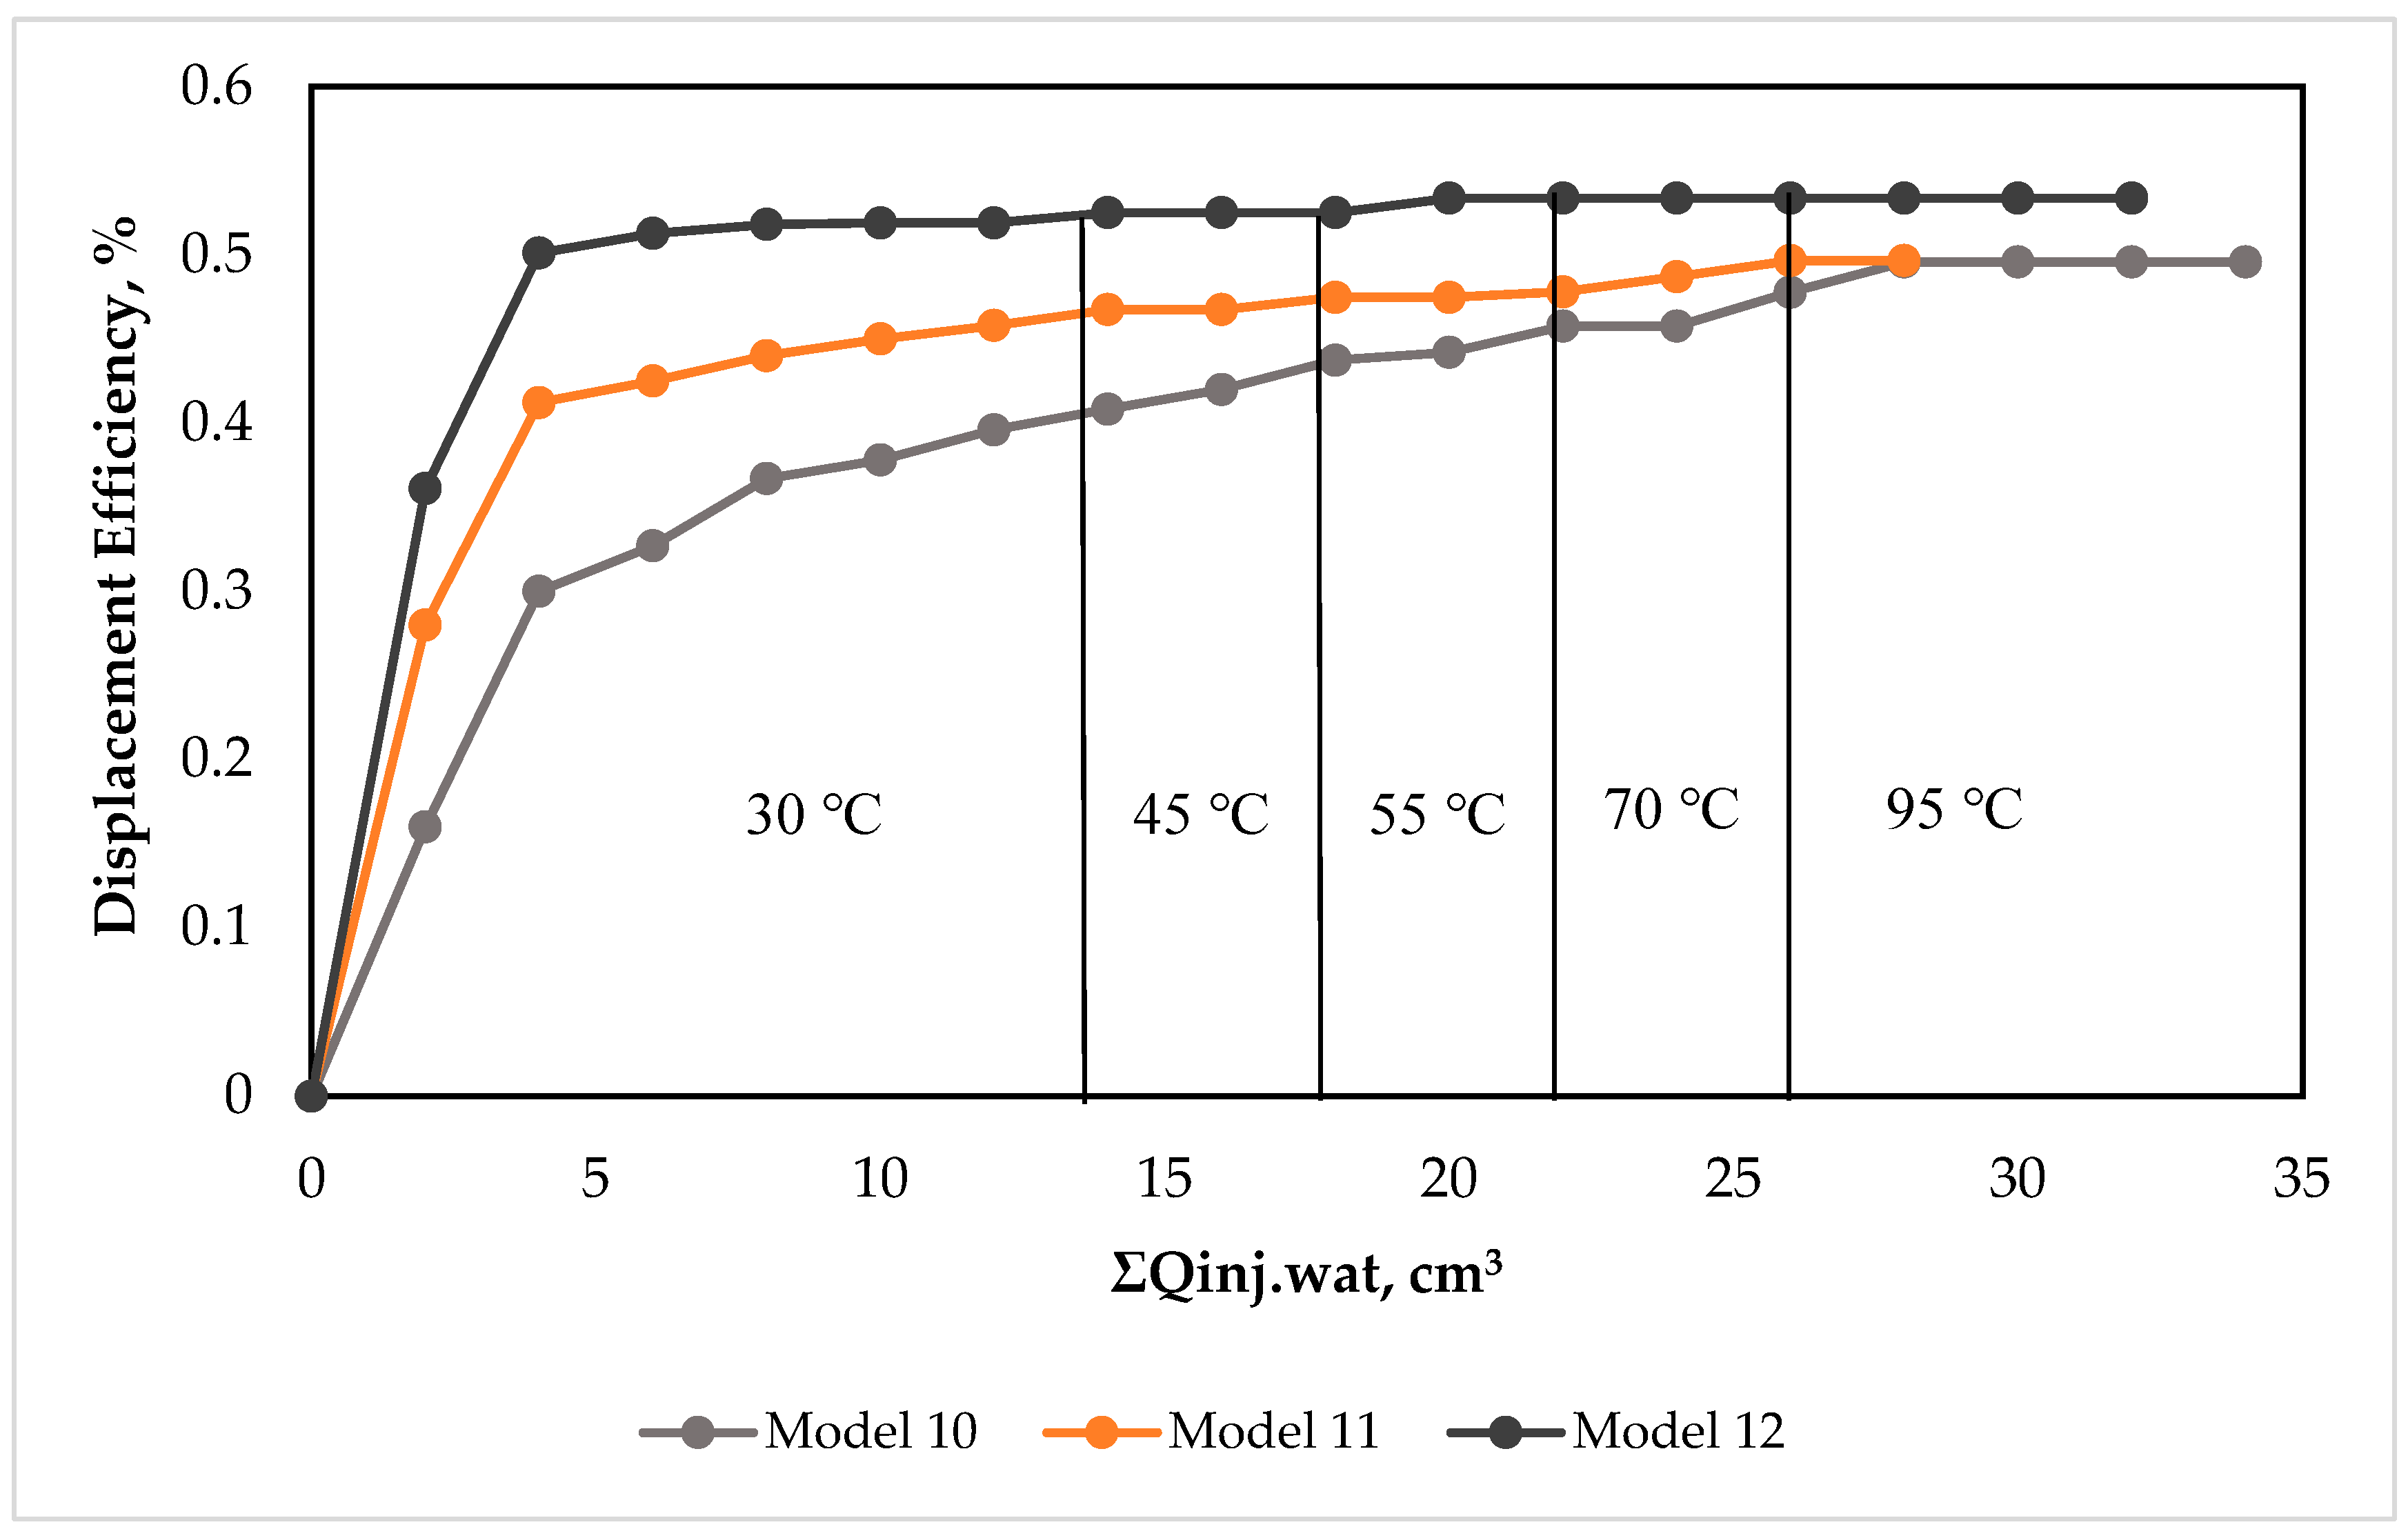
To simulate the thermal effects on the reservoir, water was injected into the core at elevated temperatures. The temperature in the core holder was gradually increased from 45 °C to 95 °C. A total of four pore volumes of formation water was injected into the core. The first two pore volumes were injected to simulate conventional waterflooding at a reservoir temperature of 30 °C.
Based on the results of the thermal flooding—i.e., hot-water injection—the highest increase in the displacement efficiency was 8.75% at 95 °C for Model 1 (
Figure 13, Model 10). The overall displacement efficiency in this case reached 49.58%. In the other two cases, the additional increase in displacement efficiency did not exceed 2.92% (
Table 8,
Figure 13), with the highest displacement efficiency being recorded at 53.36%. Compared to the other two experiments, Model 12 (
Figure 13) exhibited a higher displacement efficiency after conventional waterflooding (52.1%) but a low displacement efficiency after thermal flooding (1.26%).
3.6. Results of Filtration Experiments on Gas EOR Methods
Injection of Nitrogen and CO2
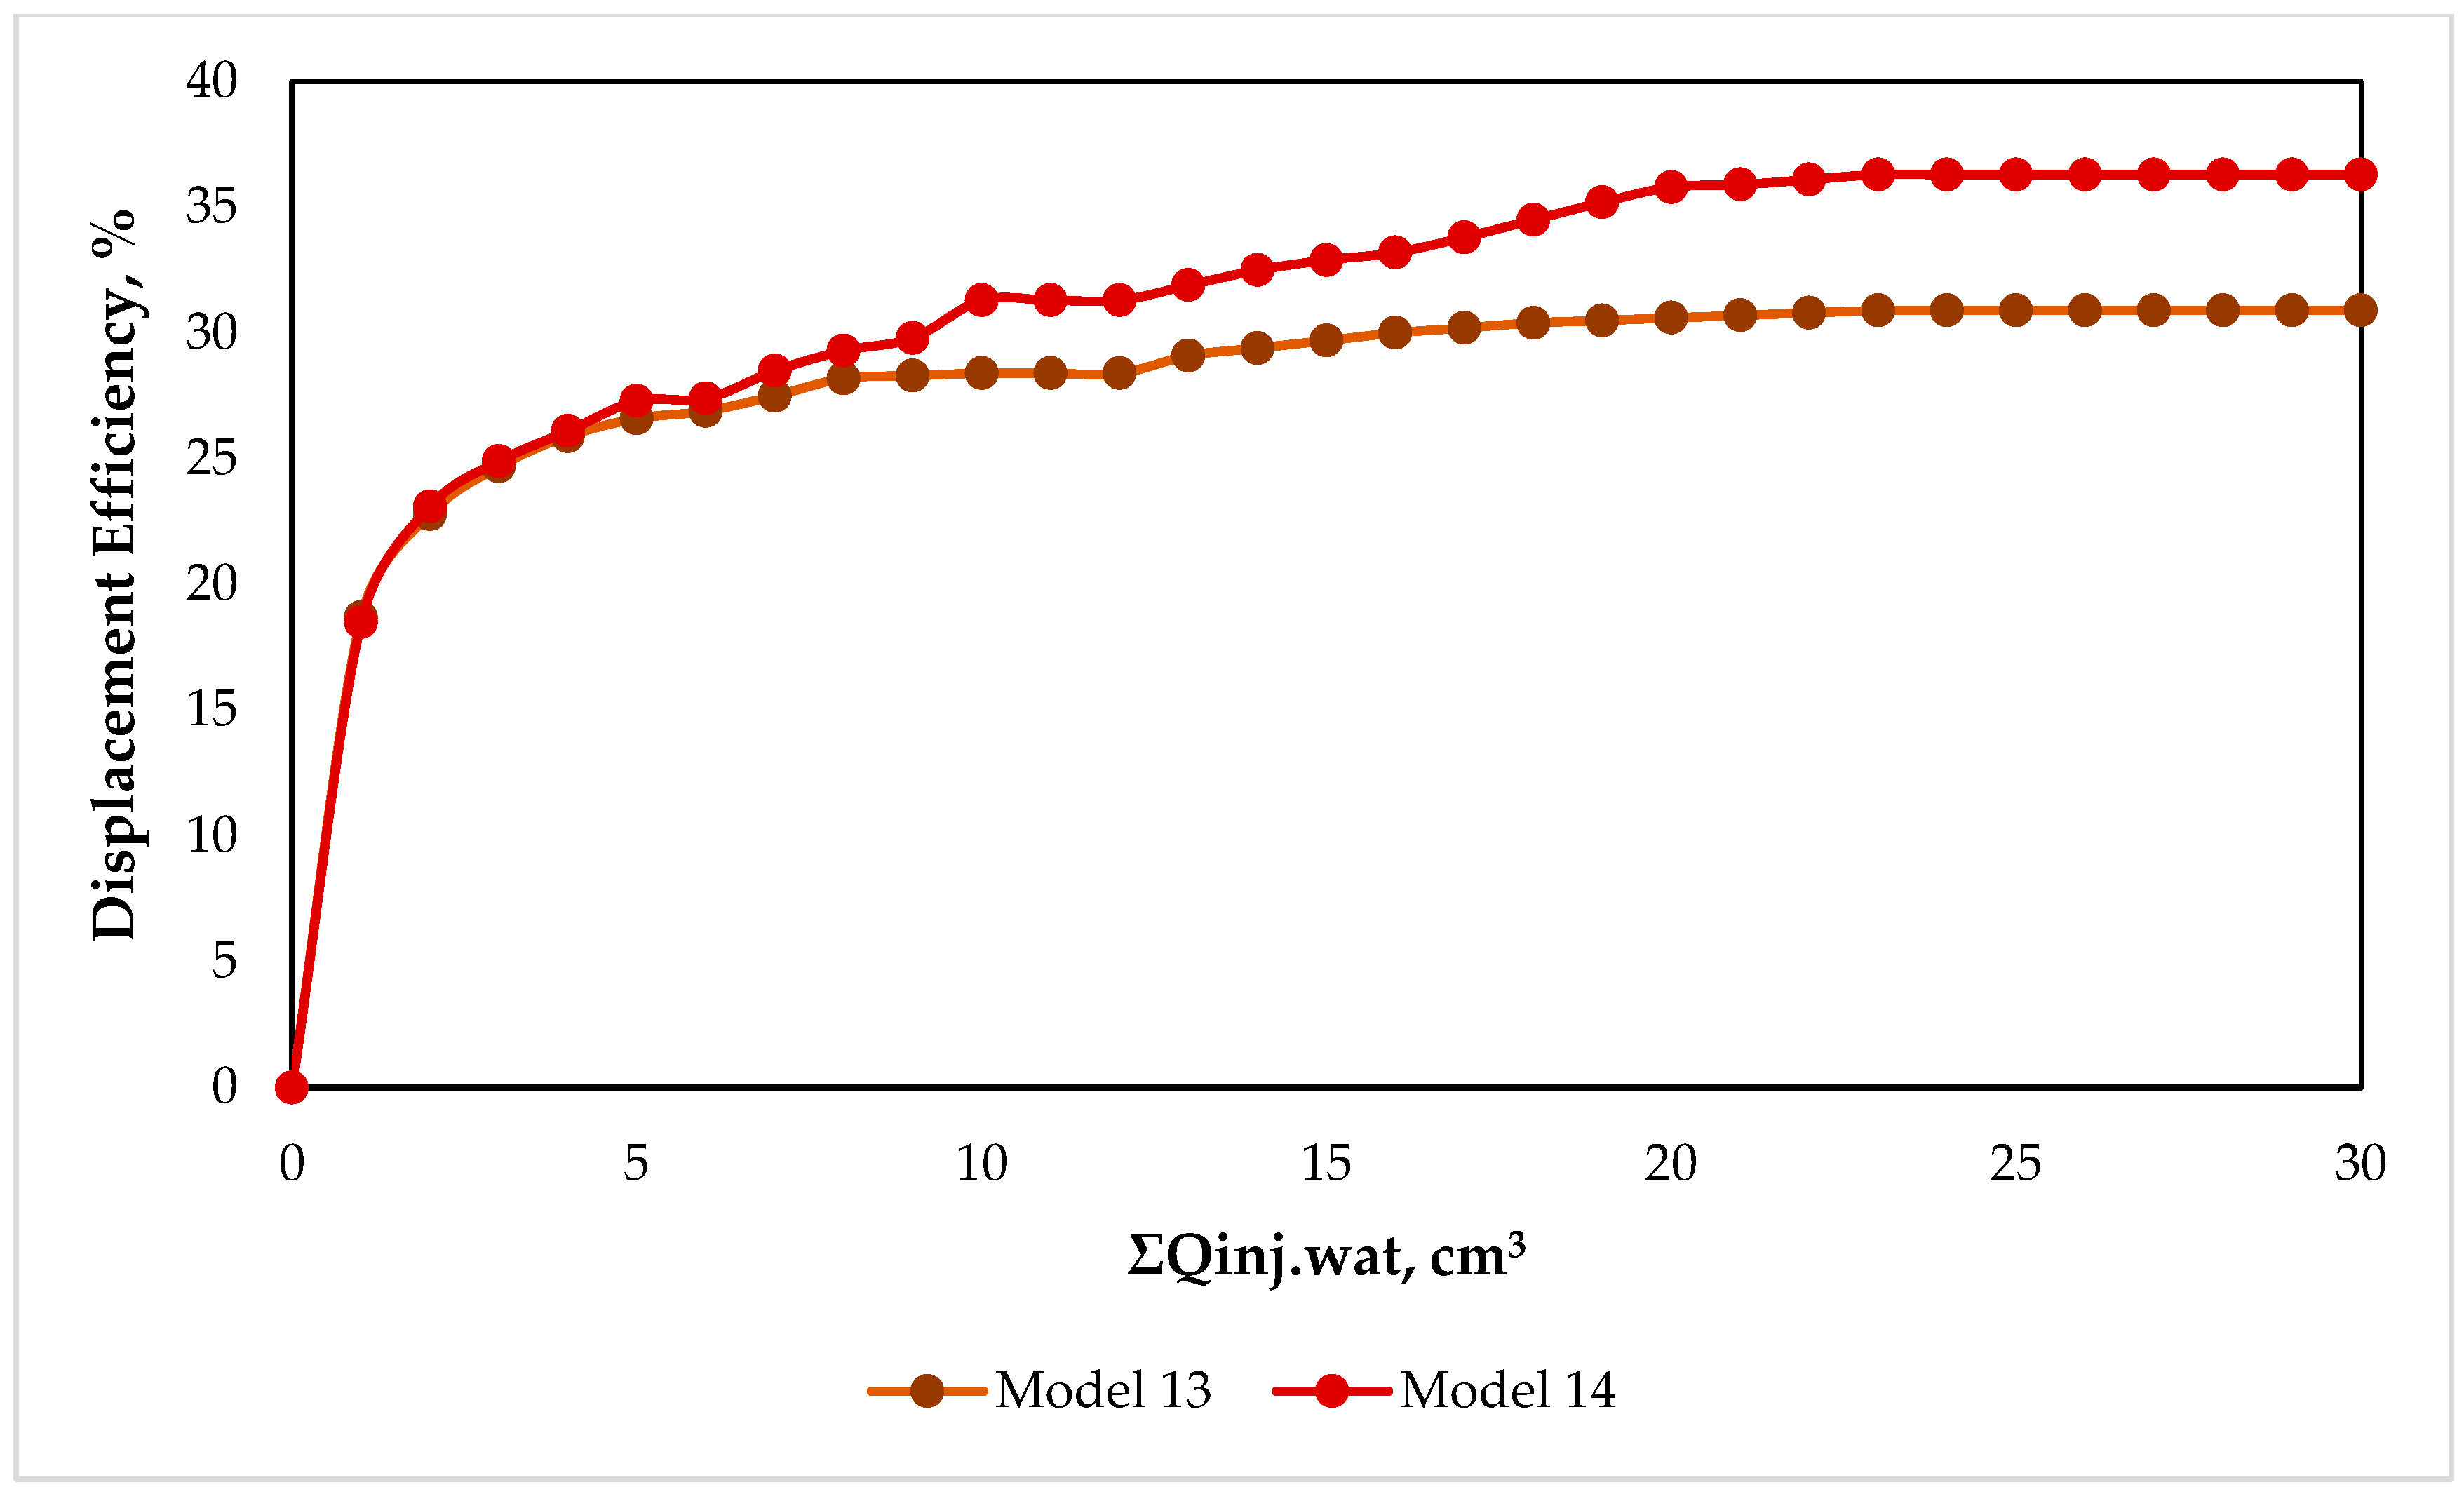
The filtration experiments demonstrated that using nitrogen and carbon dioxide (CO
2) as displacement agents can enhance the oil displacement efficiency by mobilizing residual oil. Nitrogen injection increased the displacement efficiency to 36.2%, with an incremental increase of 3.6%. CO
2 injection resulted in a displacement efficiency increase of 5.06% compared to conventional waterflooding (
Table 9,
Figure 14). This effect can be attributed to the dissolution of the CO
2 in the oil, a process that reduces oil’s viscosity and improves its flowability.
4. Conclusions
Our experimental studies included conducting filtration experiments on the displacement of highly viscous oil using core samples from the East Moldabek field to determine effective methods for enhancing oil recovery. The objective was to identify the most efficient enhanced oil recovery (EOR) method in terms of its displacement efficiency improvement. The tested methods included baseline displacement using formation water, thermal EOR through hot-water injection, chemical EOR via polymer flooding and ASP injection, and gas EOR using nitrogen and CO2 injection.
Table 10 provides a summary of the advantages and disadvantages of the enhanced oil recovery (EOR) methods analyzed in this study.
Filtration experiments were conducted at different times using various filtration systems. The results indicated that the most effective EOR methods for the highly viscous oil in the East Moldabek field were chemical and thermal EOR techniques. The chemical EOR methods included ASP flooding, polymer flooding, and surfactant solution injection. ASP flooding achieved the highest increase in displacement efficiency, reaching 19%, making it the most effective method among all of the others.
For thermal EOR, the stepwise heating of water up to 95 °C was applied. The highest obtained increase in displacement efficiency was 17%. However, after 70 °C, the displacement efficiency increase declined, which may be attributed to the rheological properties of fluids: at temperatures above 70 °C, the viscosities of oil and water, as well as their viscosity ratios, change insignificantly.
The gas EOR methods led to lower improvements in the displacement efficiency. Filtration experiments on unconsolidated Cretaceous core samples from the East Moldabek field demonstrated that nitrogen injection led to a slight increase in the displacement efficiency, amounting to approximately 3%. CO2 injection resulted in a displacement efficiency increase of 5.06% compared to conventional water flooding. This is due to the dissolution of the CO2 in the oil, a process that reduces the viscosity and improves the mobility of oil. Additional studies must be conducted to further evaluate the feasibility of this method. However, this experimental study highlights the effectiveness of nitrogen and CO2 injection in enhancing oil recovery in Cretaceous formations and demonstrates the value of integrating laboratory methods into EOR research. These results can serve as a foundation for future filtration experiments and further EOR investigations.
This study presents the results of core filtration experiments aimed at evaluating the displacement efficiency of and assessing methods for enhancing oil recovery. However, several limitations must be considered when interpreting the obtained data.
Firstly, the laboratory experiments were conducted on core samples, which do not fully replicate the complex in situ conditions of reservoirs, which include formation heterogeneity, thermo-baric effects, and chemical interactions with formation fluids. Secondly, this study was based on a limited number of core samples, potentially reducing the representativeness of the results for reservoirs with significant geological variability. Additionally, the duration of the experiments was constrained, preventing a comprehensive assessment of the long-term stability of the injected agents and their impacts on reservoir properties.
To improve the reliability and applicability of the findings, further research should focus on the following areas:
Conducting extended experiments that consider cyclic injection and the potential retention of injected agents within the reservoir matrix;
Scaling up this study through field pilot tests and numerical simulations;
Investigating the impact of reservoir heterogeneity on displacement efficiency;
Developing more precise mathematical models of filtration processes;
Evaluating the environmental and economic feasibility of employing the studied technologies.
Advancing research in these directions will enable a more accurate adaptation of enhanced oil recovery (EOR) technologies to field-specific conditions and improve their industrial applicability.


