
Influence of Different Substrate and Microorganism Concentrations on Butyric Acid-Derived Biohydrogen Production


Abstract
1. Introduction
2. Materials and Methods
2.1. CWP Characterization and Preparation for Fermentation
2.2. Culture
2.3. Batch Dark Fermentation Assay
2.4. Analytical Techniques
2.5. Statistical Analysis
3. Results and Discussion
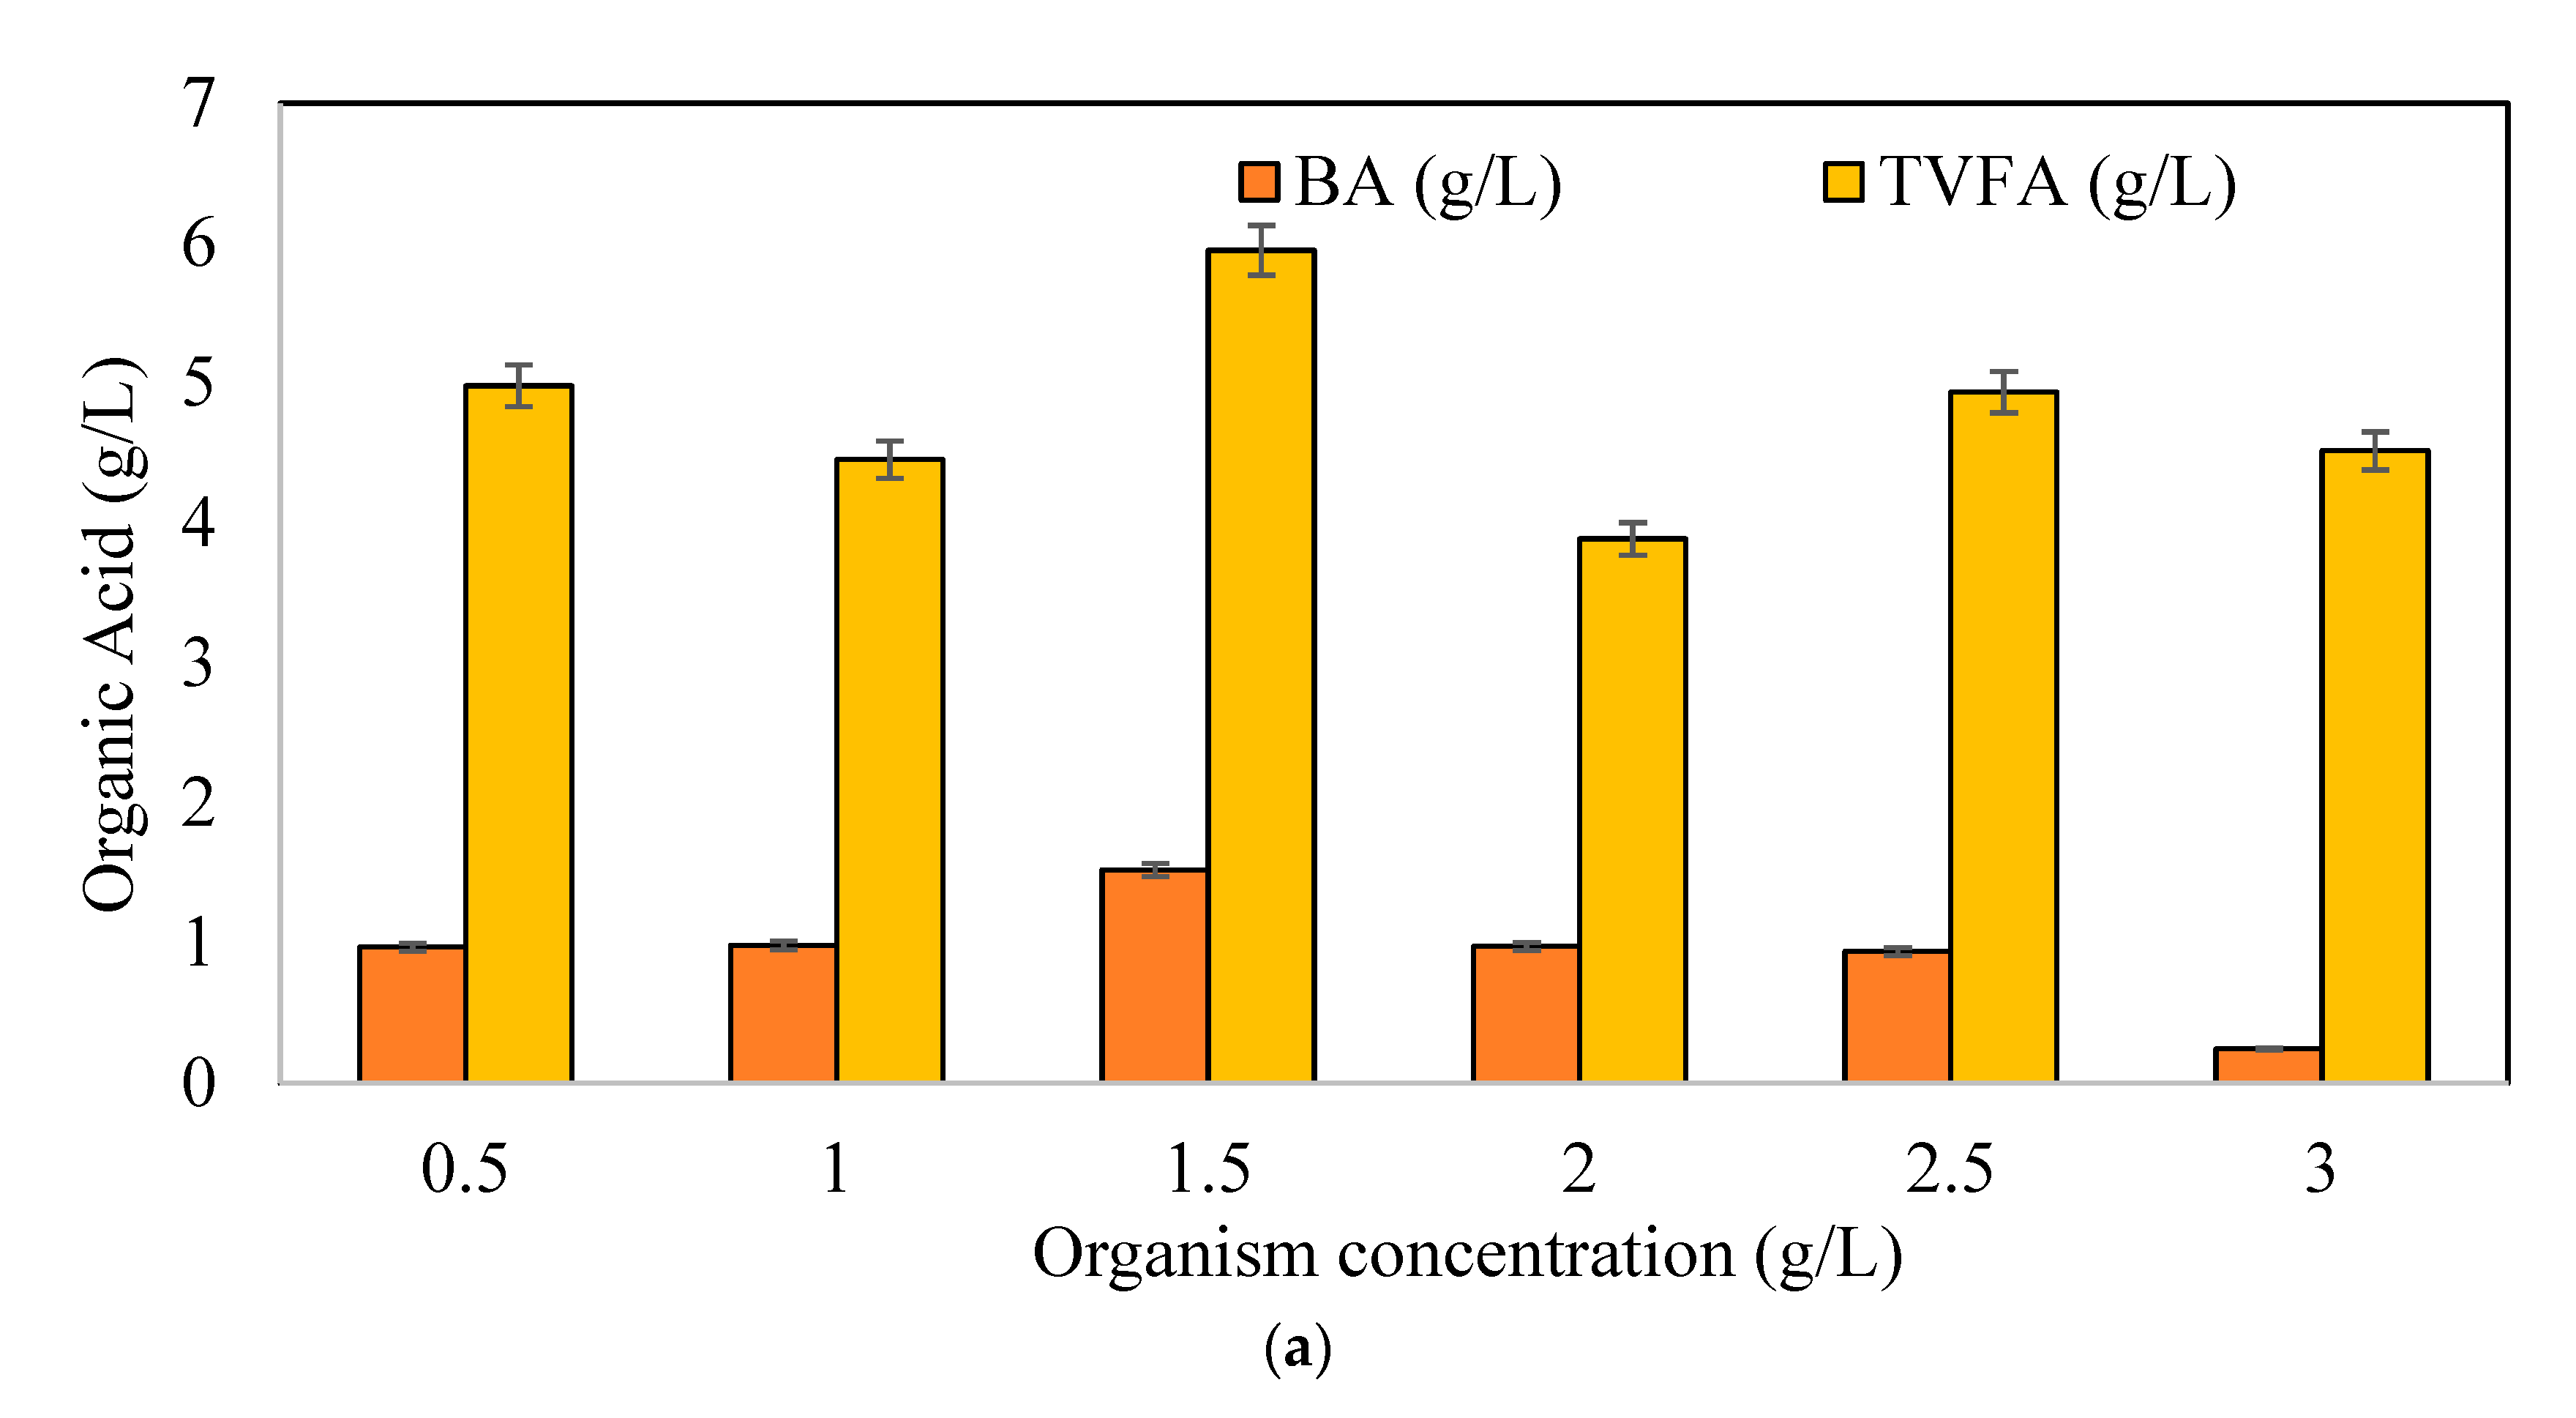
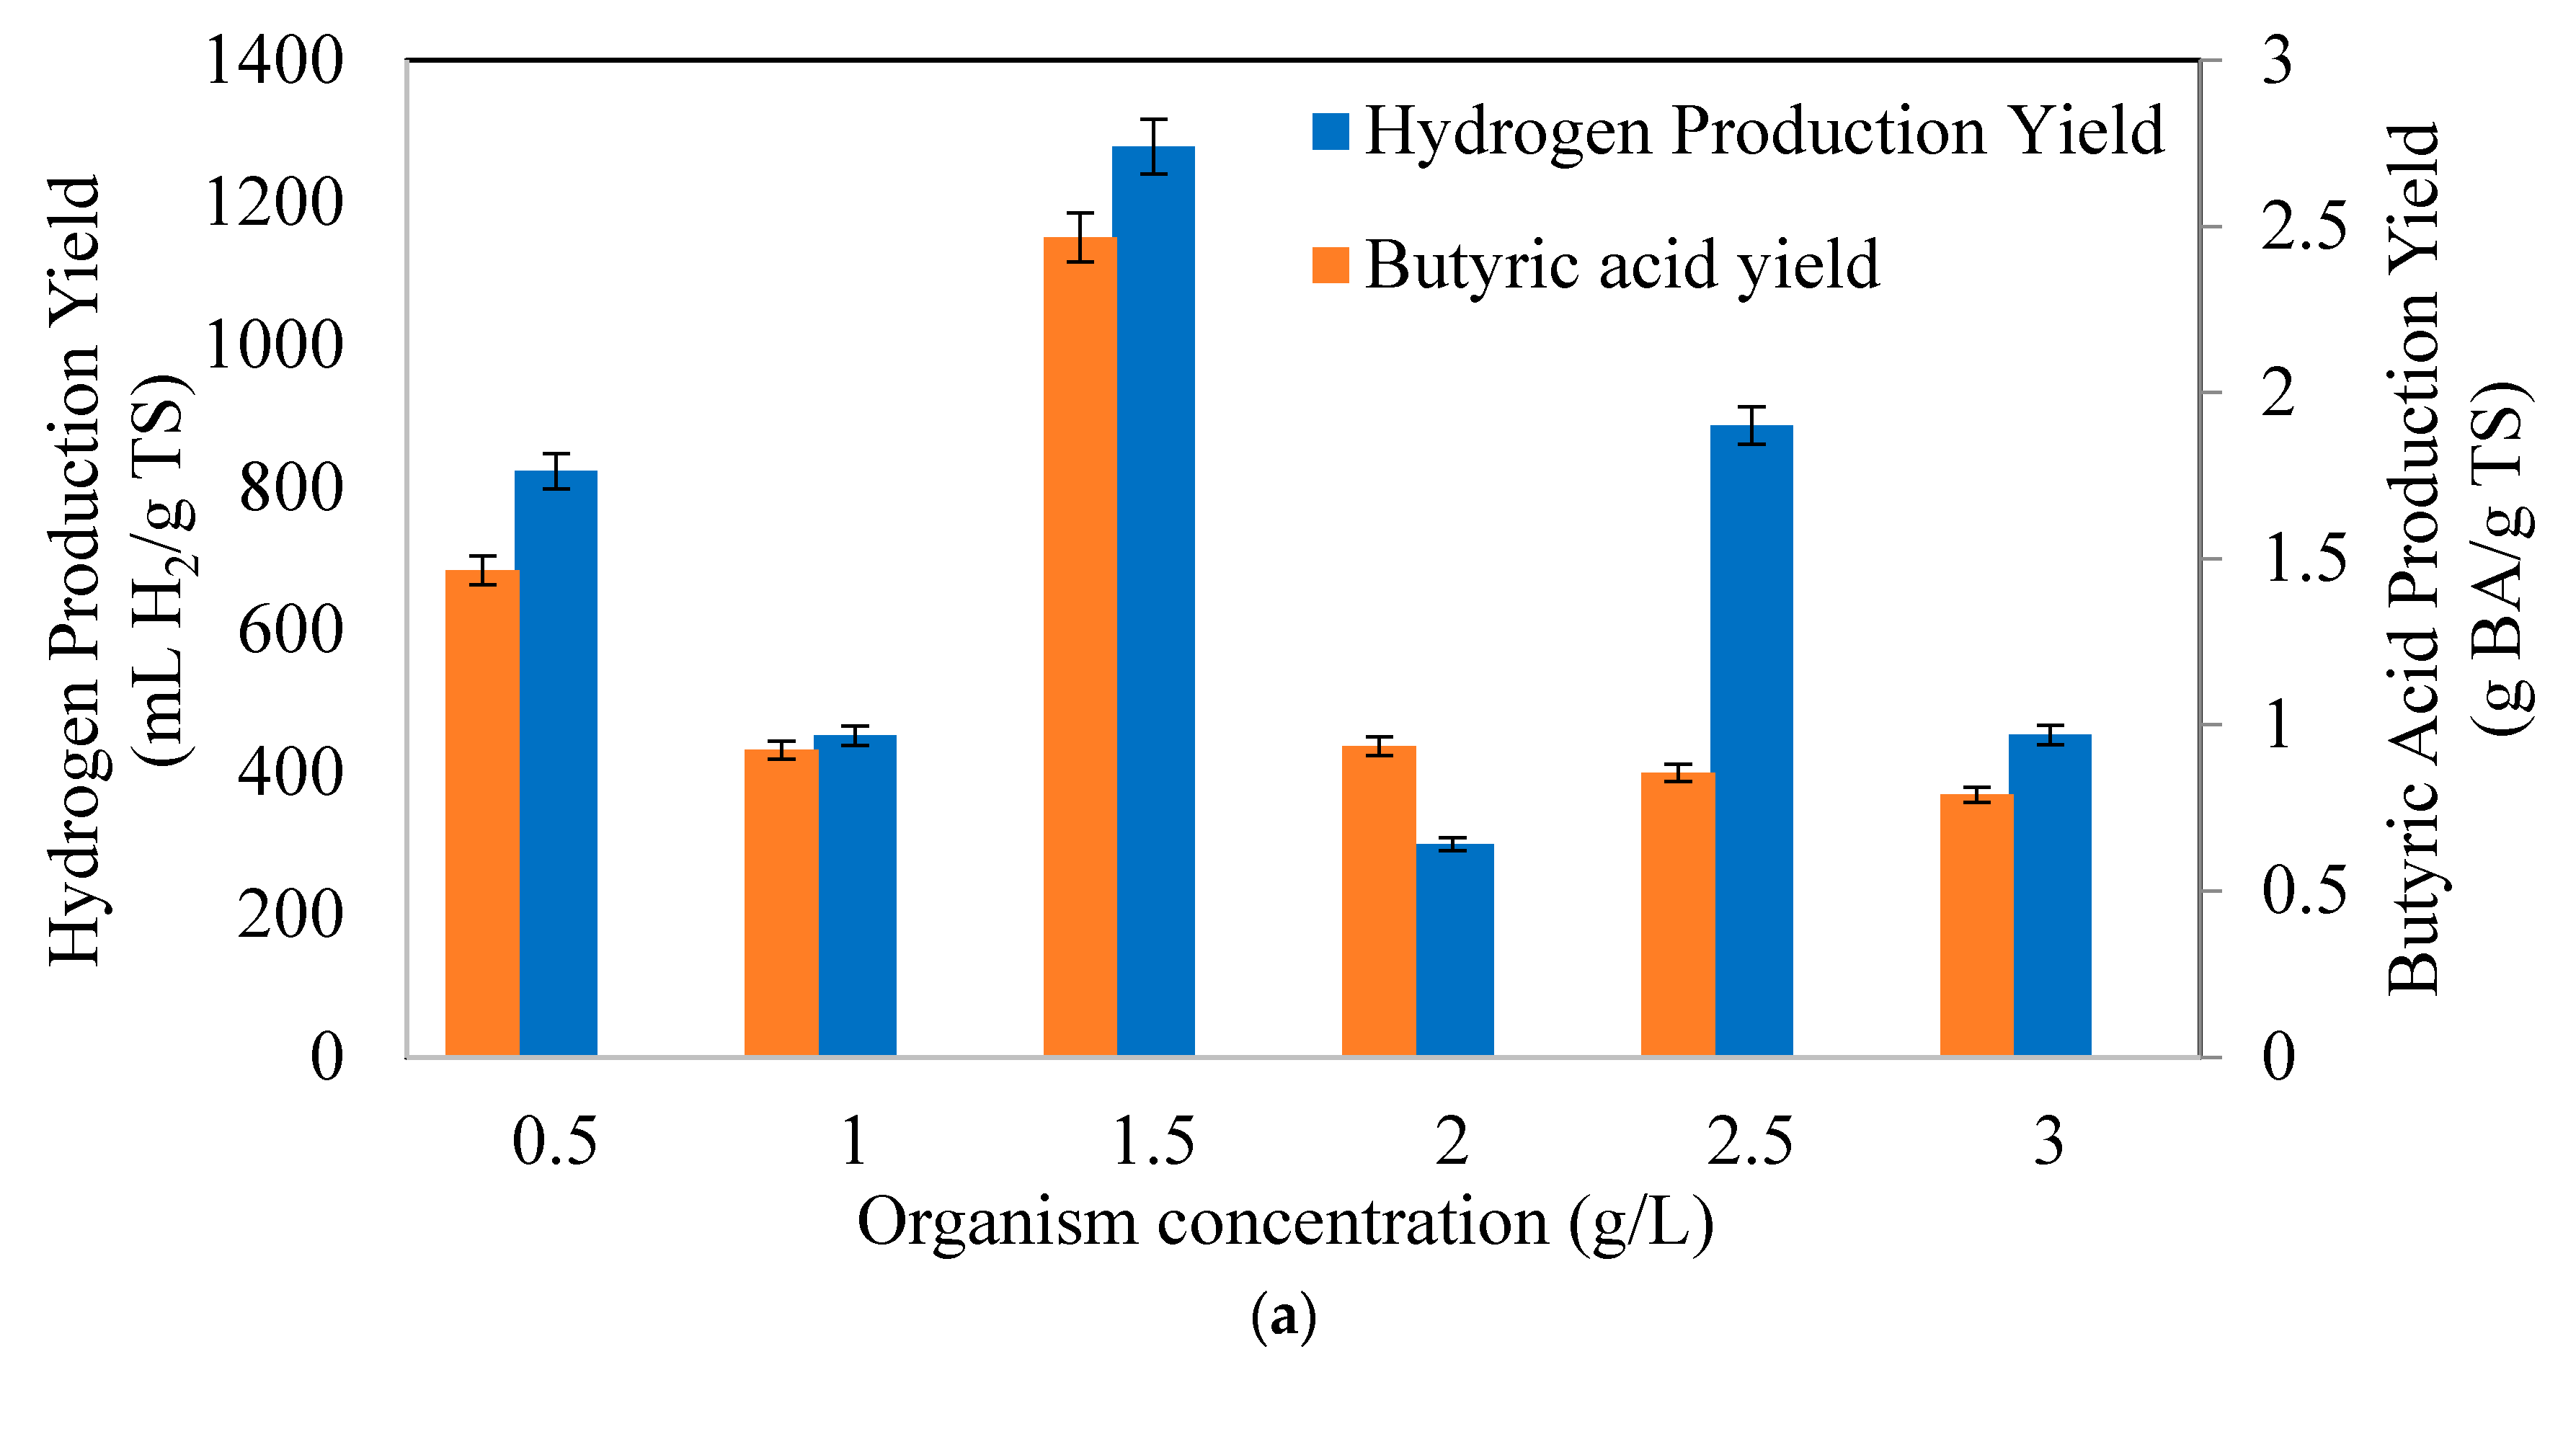
3.1. Effects of Initial Microorganism Concentrations on Butyric Acid and Hydrogen Production Potential
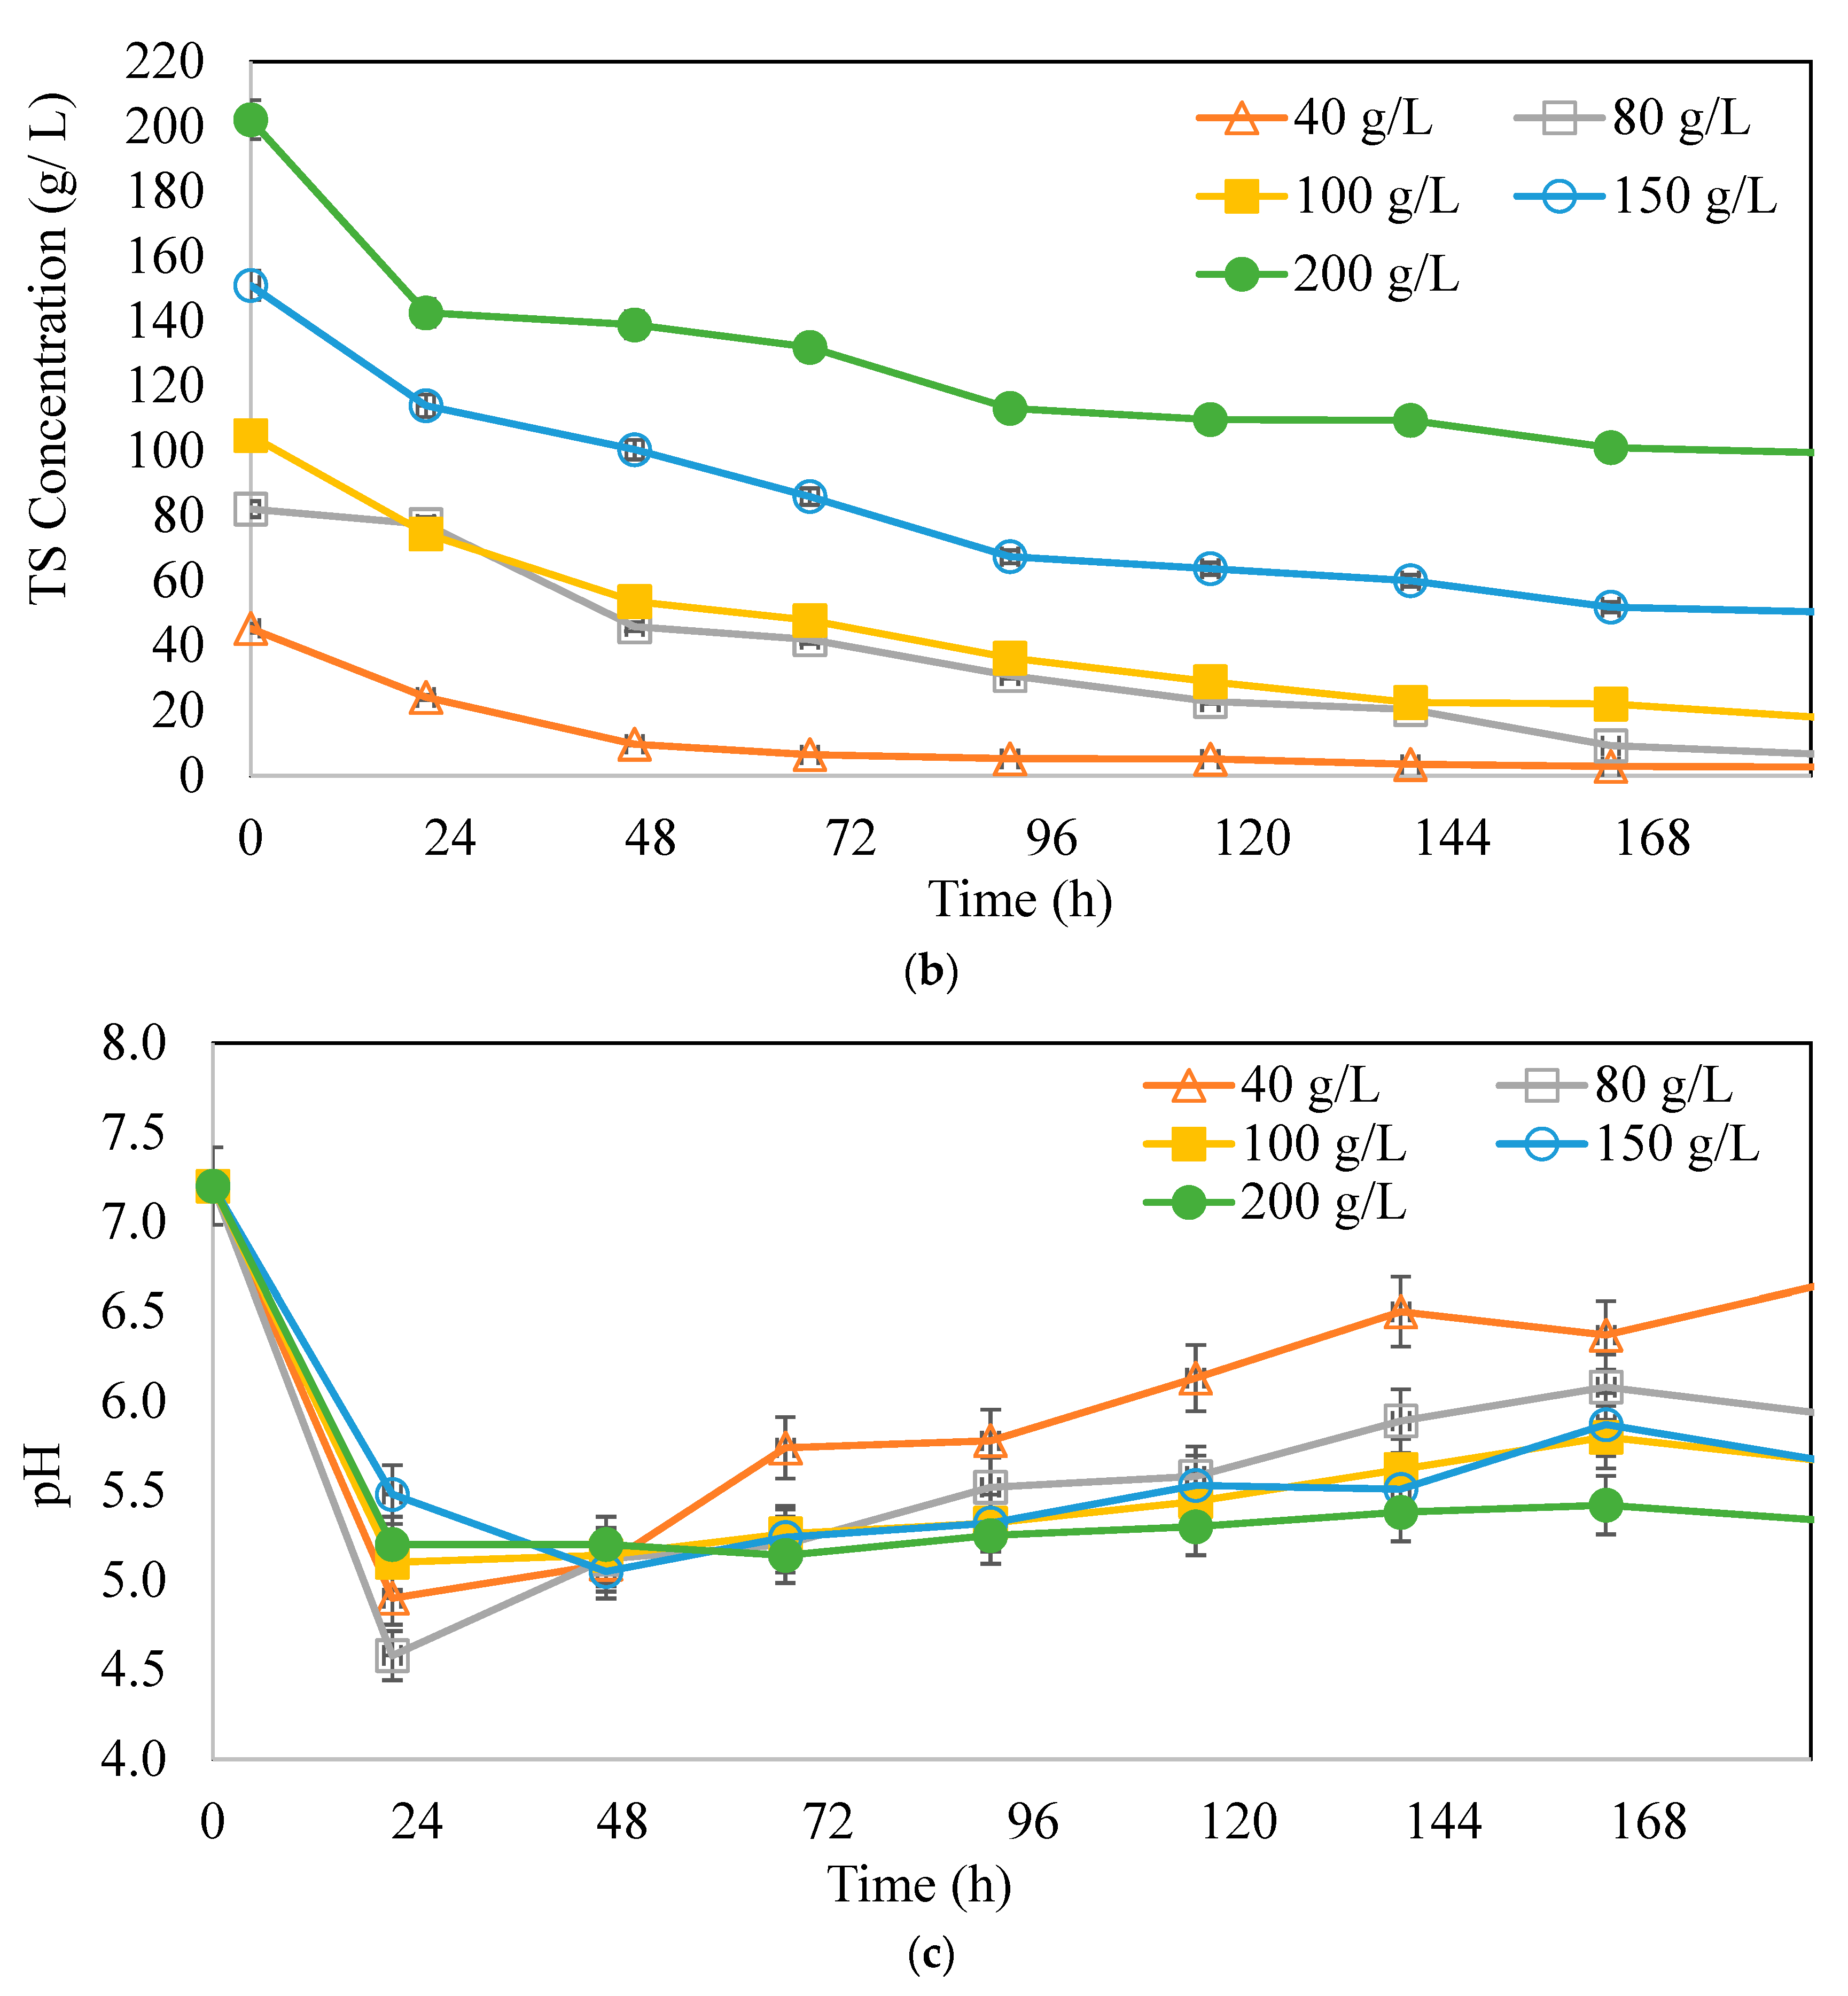
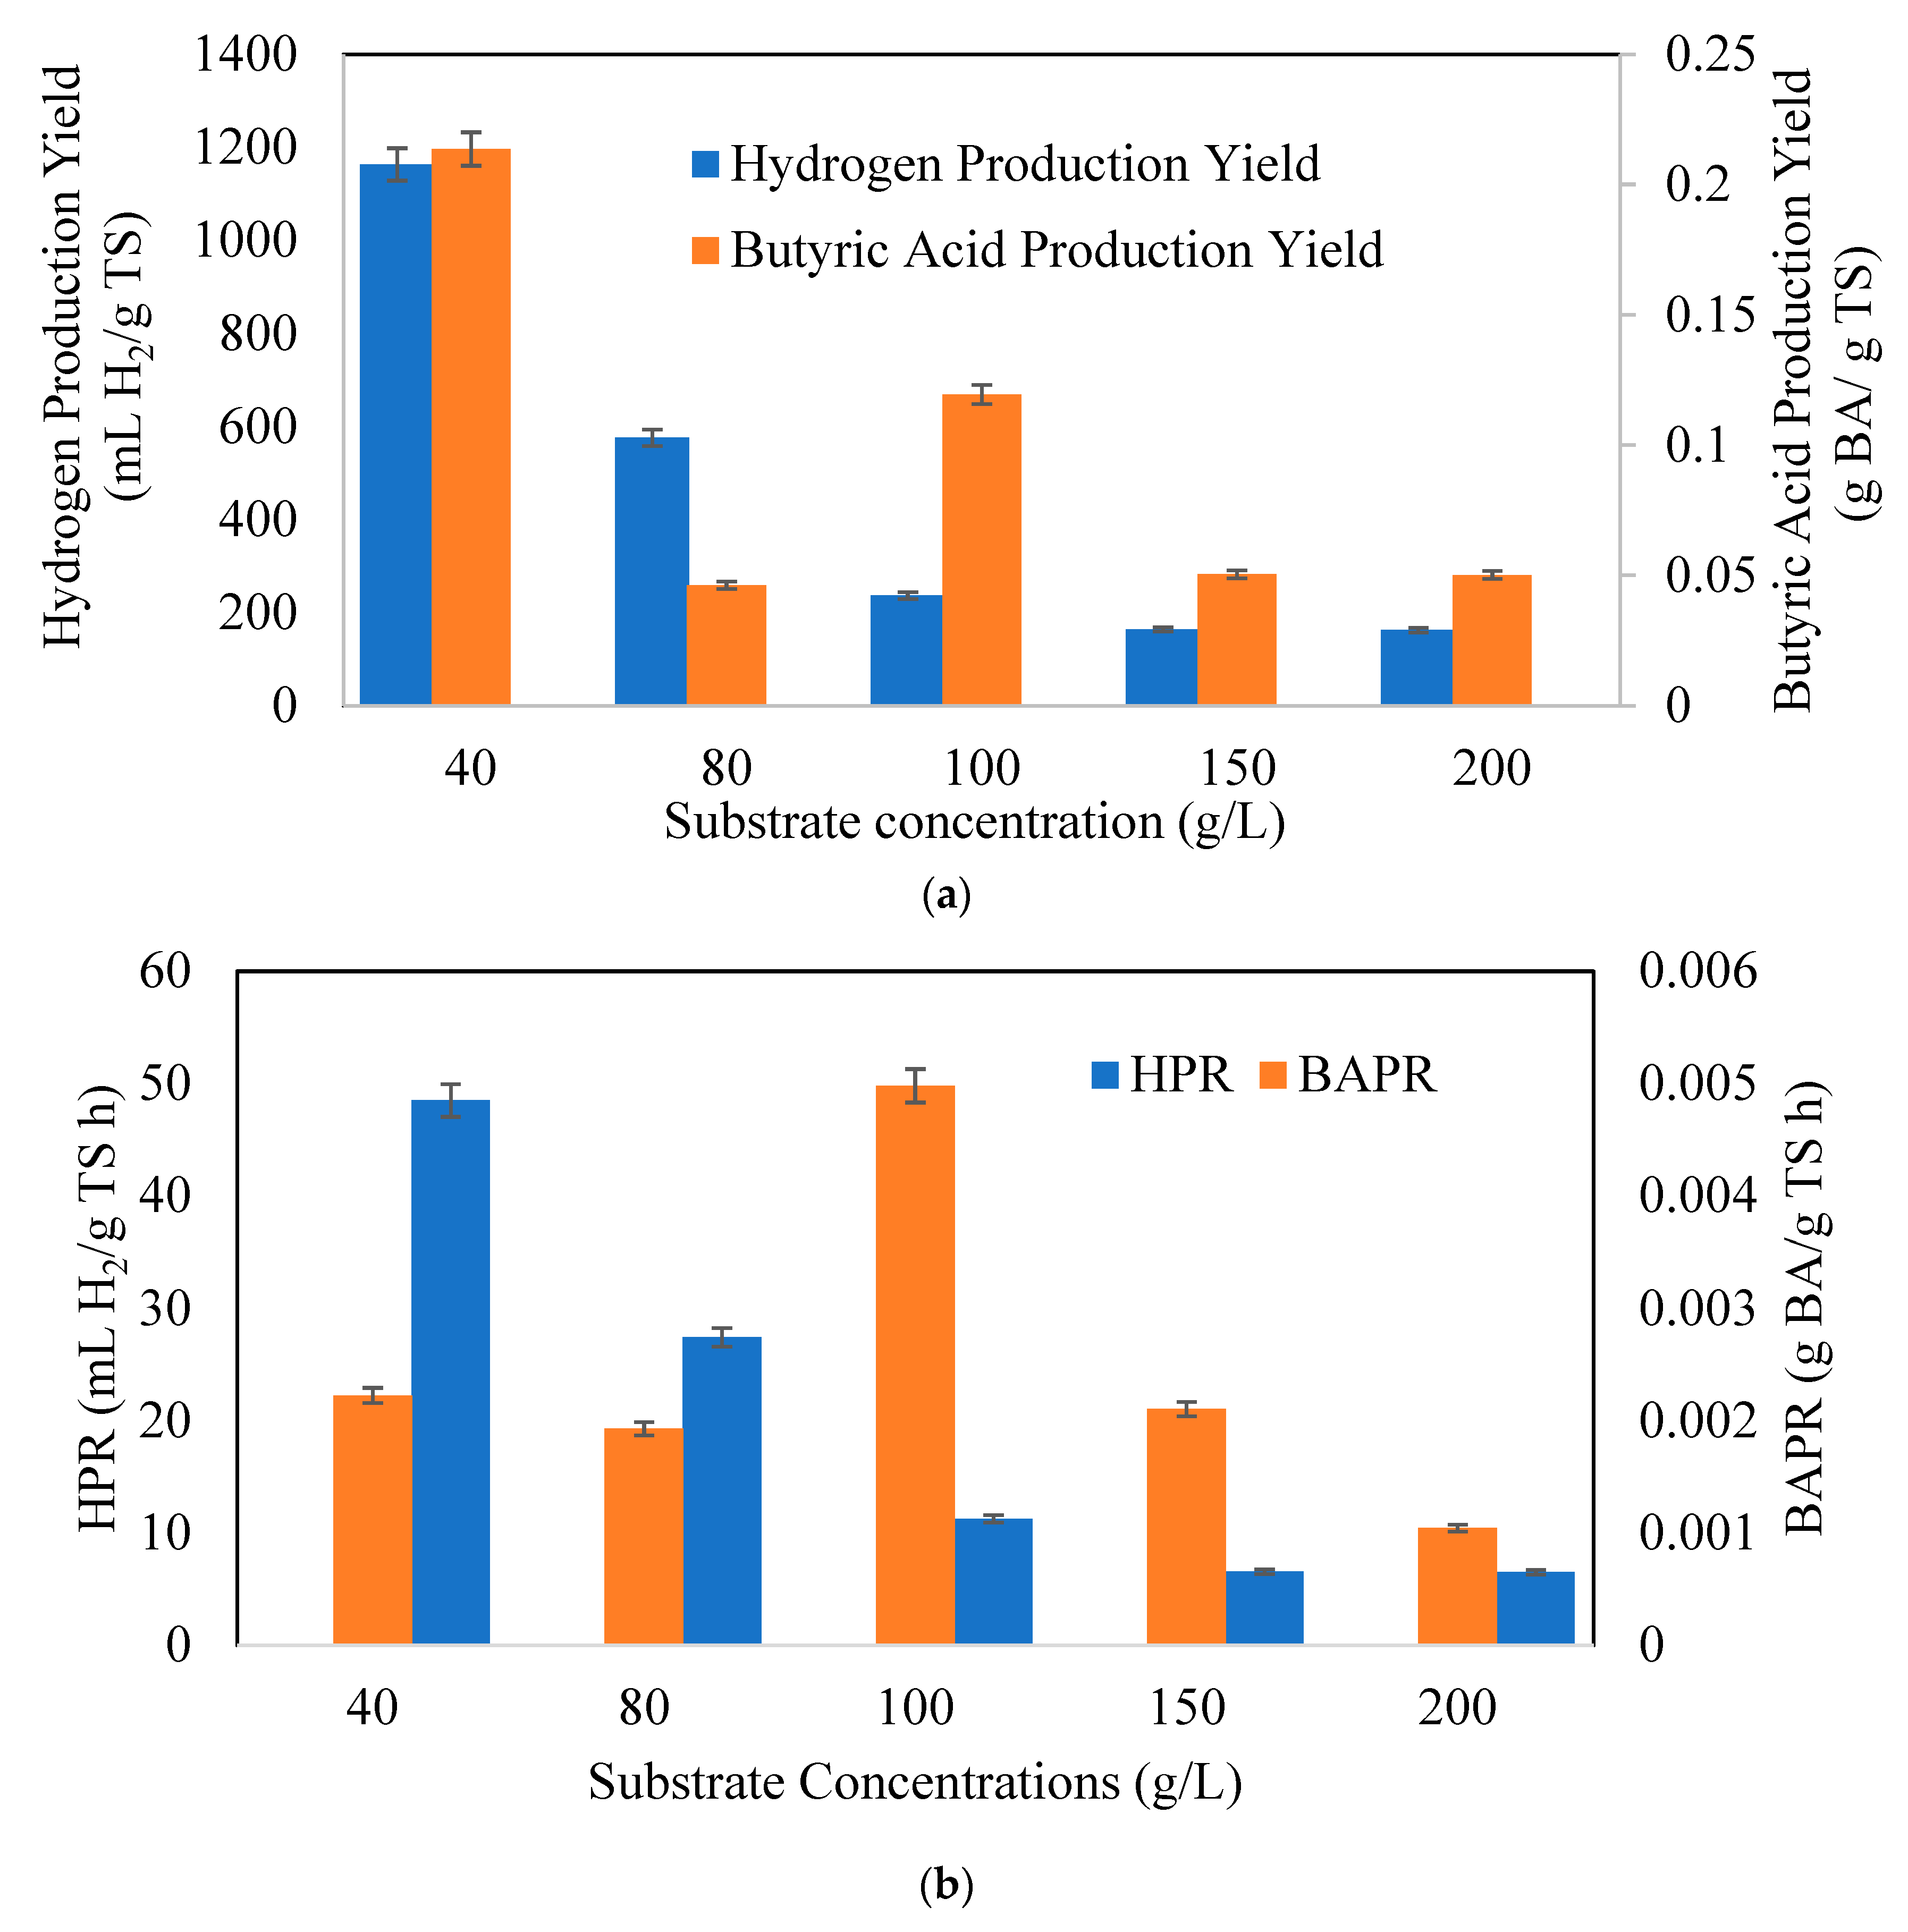
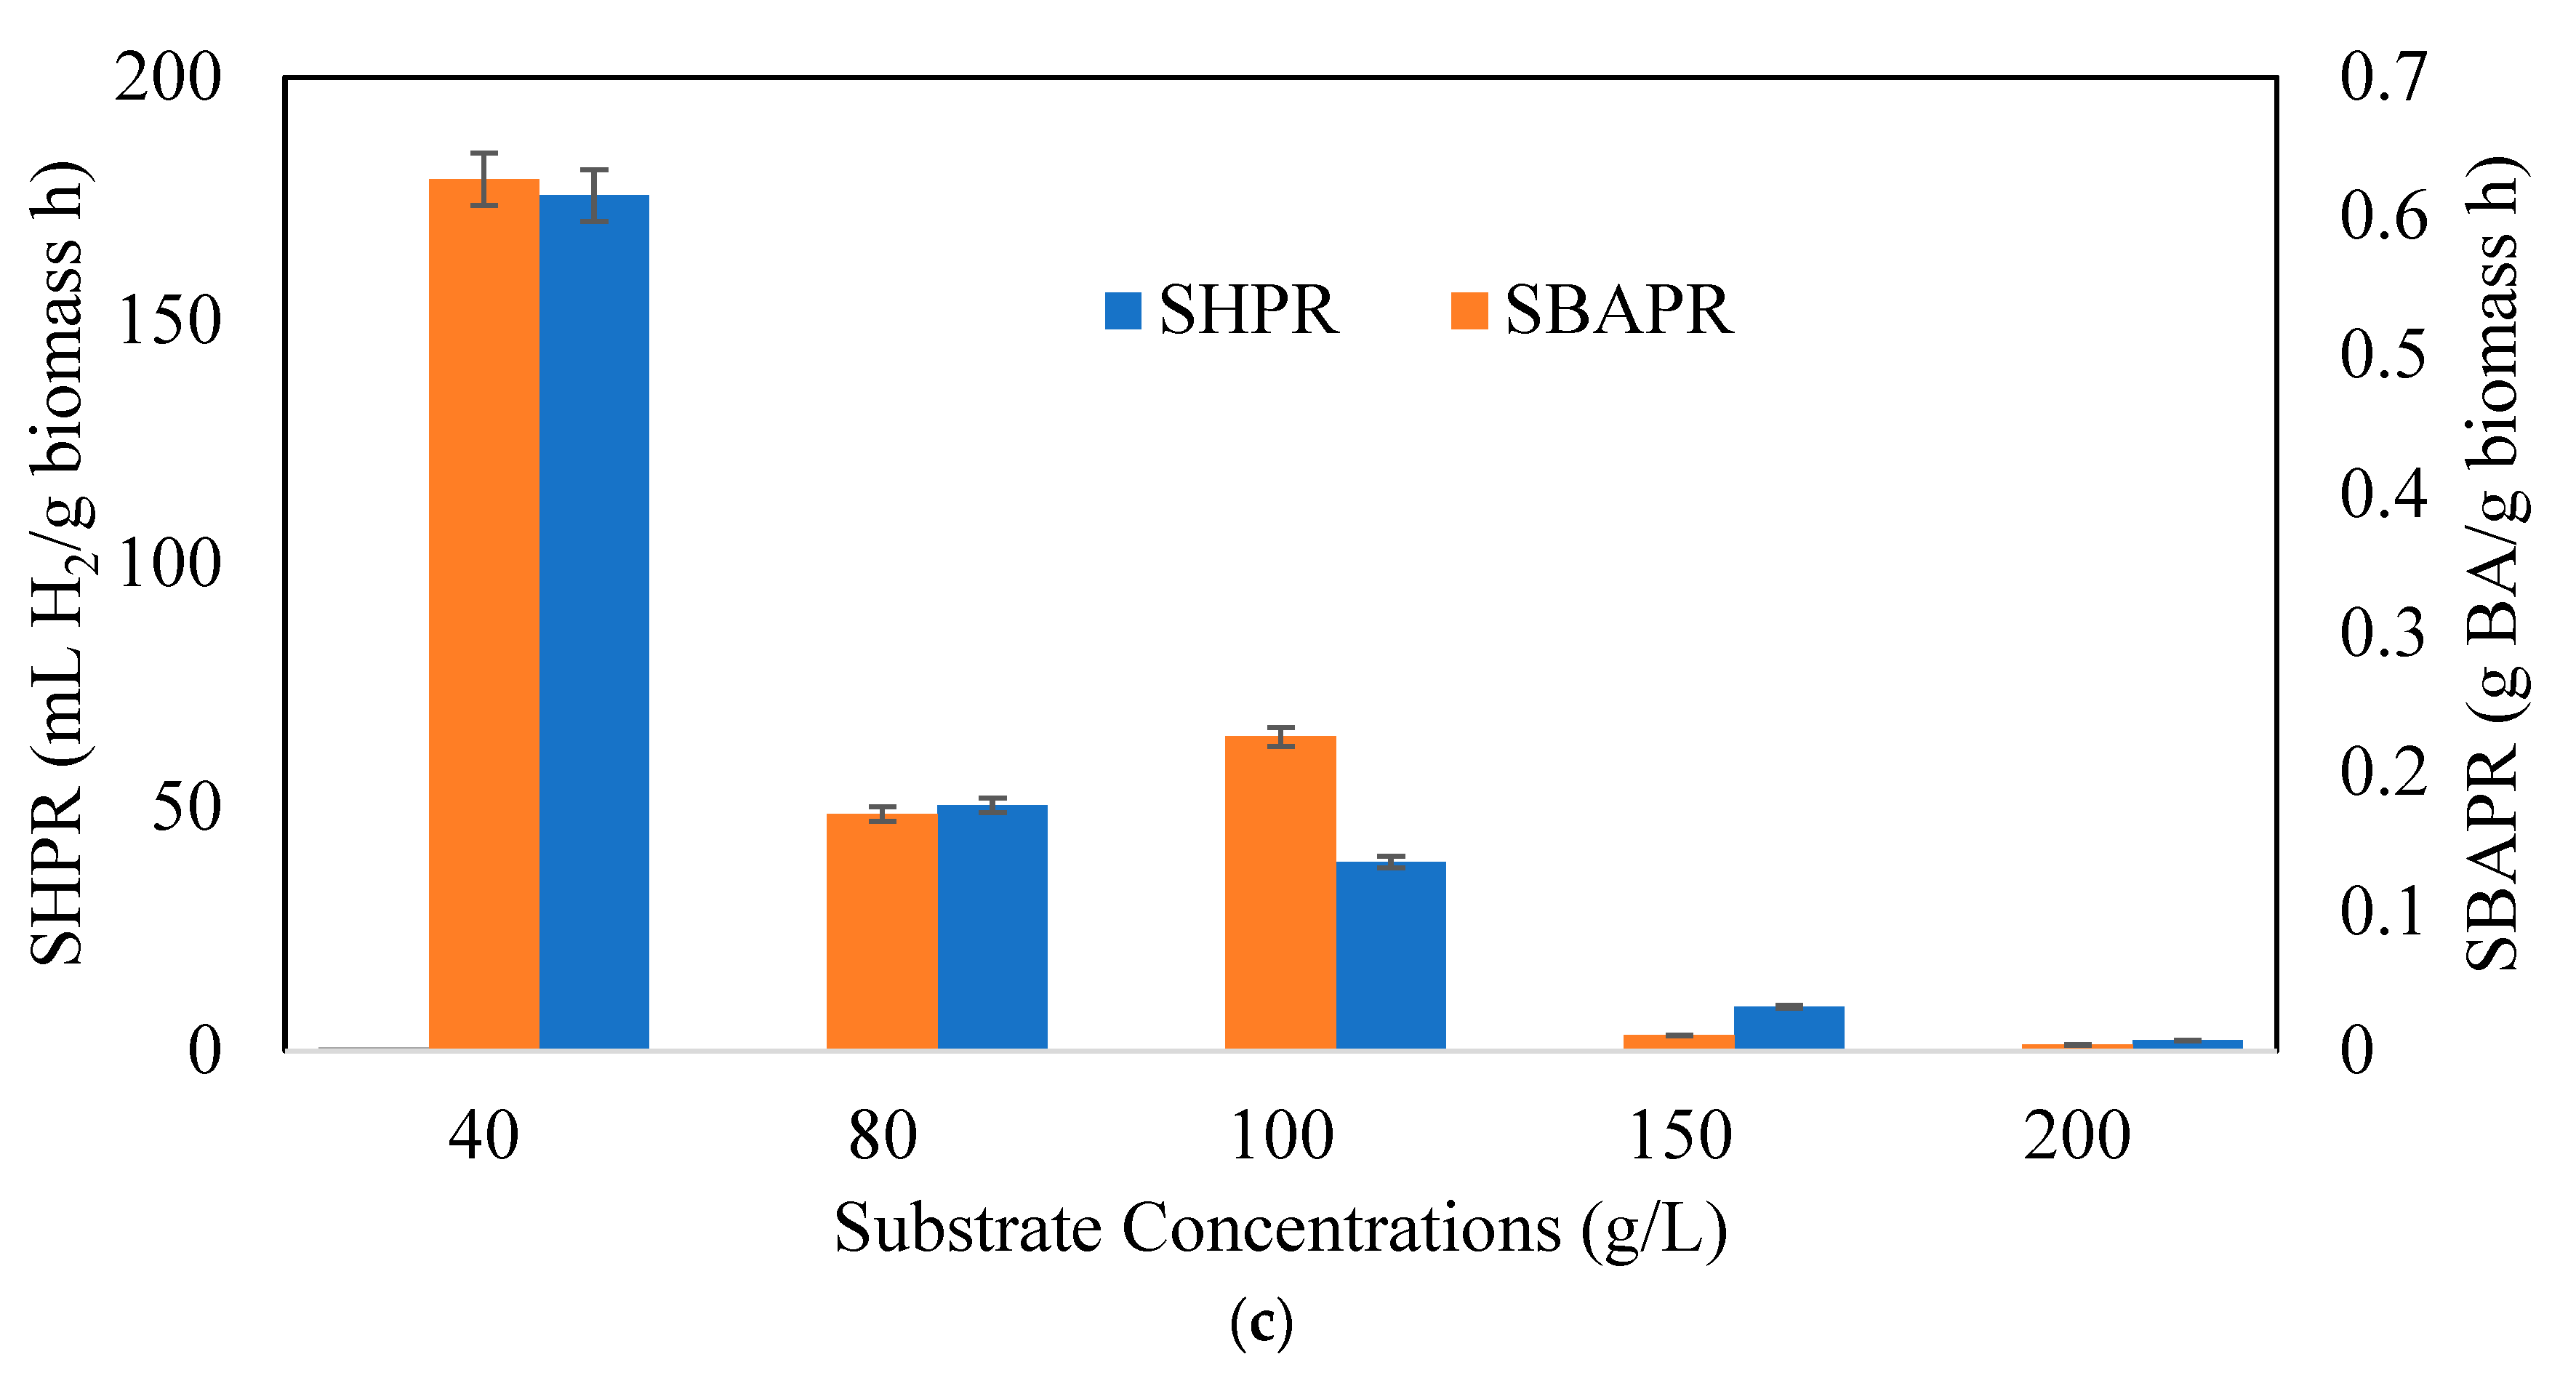
3.2. Effects of Substrate Concentrations on Butyric Acid and Hydrogen Production Potential
4. Conclusions
Author Contributions
Funding
Data Availability Statement
Acknowledgments
Conflicts of Interest
Abbreviations
| Ammonium | NH4+ | Biomass To Substrate Ratio | Xo/So |
| Butyric Acid To Acetic Acid Ratio | BA/AA | Butyric Acid Production Rate | BAPR |
| Cheese Whey | CW | Cheese Whey Powder | CWP |
| Cumulative Hydrogen Formation | CHF | Hydrogen Production Yield | YH2/TS |
| Hydrogen Production Rate | HPR | High-Purity Liquid Chromatography | HPLC |
| Inductively Coupled Plasma-Mass Spectrometry | ICP-MS | IBM SPSS Statistics Software V29 | SPSS |
| Initial Biomass Concentration | Xo | Initial Substrate Concentration | So |
| Gas Chromatography | GC | Nitrate | NO3− |
| Refractive Index Detection | RID | Suspended Solids | SS |
| Specific Hydrogen Rate | SHPR | Specific Butyric Acid Production Rate | SPBR |
| Total Nitrogen | TN | Total Sugar | TS |
| Total Phosphorus | TP | Total Volatile Fatty Acid | TVFA |
| Ultraviolet | UV | Volatile Fatty Acid | VFA |
References
- Özmıhçı, S.; Hacıoğlu, İ.; Altındağ, E.E. Impacts of mycotoxin on biohydrogen production from waste dry fruits. J. Mater. Cycles Waste Manag. 2022, 24, 1736–1746. [Google Scholar] [CrossRef]
- Câmara-Salim, I.; González-García, S.; Feijoo, G.; Moreira, M.T. Screening the environmental sustainability of microbial production of butyric acid produced from lignocellulosic waste streams. Ind. Crops Prod. 2021, 162, 113280. [Google Scholar] [CrossRef]
- Hussain, A.; Lee, J.; Xiong, Z.; Wang, Y.; Lee, H.S. Butyrate production and purification by combining dry fermentation of food waste with a microbial fuel cell. J. Environ. Manag. 2021, 300, 113827. [Google Scholar] [CrossRef]
- Sauer, M.; Marx, H. Co-cultures and synthetic microbial communities for green chemical production. Curr. Opin. Green Sustain. Chem. 2023, 42, 100842. [Google Scholar] [CrossRef]
- Liu, S.; Duncan, S.; Qureshi, N.; Rich, J. Fermentative production of butyric acid from paper mill sludge hydrolysates using Clostridium tyrobutyricum NRRL B-67062/RPT 4213. Biocatal. Agric. Biotechnol. 2018, 14, 48–51. [Google Scholar] [CrossRef]
- Atasoy, M.; Cetecioglu, Z. Butyric acid dominant volatile fatty acids production: Bio-Augmentation of mixed culture fermentation by Clostridium butyricum. J. Environ. Chem. Eng. 2020, 8, 104496. [Google Scholar] [CrossRef]
- Baeyens, J.; Zhang, H.; Nie, J.; Appels, L.; Dewil, R.; Ansart, R.; Deng, Y. Reviewing the potential of bio-hydrogen production by fermentation. Renew. Sustain. Energy Rev. 2020, 131, 110023. [Google Scholar] [CrossRef]
- Polettini, A.; Pomi, R.; Rossi, A.; Zonfa, T.; De Gioannis, G.; Muntoni, A. Continuous fermentative hydrogen production from cheese whey—New insights into process stability. Int. J. Hydrogen Energy 2022, 47, 21044–21059. [Google Scholar] [CrossRef]
- Bevilacqua, R.; Regueira, A.; Mauricio-Iglesias, M.; Lema, J.M.; Carballa, M. Understanding the effect of trace elements supplementation on volatile fatty acids production from proteins. J. Environ. Chem. Eng. 2021, 9, 105934. [Google Scholar] [CrossRef]
- Khanna, S.; Goyal, A.; Moholkar, V.S. Production of n-butanol from biodiesel derived crude glycerol using Clostridium pasteurianum immobilized on Amberlite. Fuel 2013, 112, 557–561. [Google Scholar] [CrossRef]
- Jang, Y.S.; Woo, H.M.; Im, J.A.; Kim, I.H.; Lee, S.Y. Metabolic engineering of Clostridium acetobutylicum for enhanced production of butyric acid. Appl. Microbiol. Biotechnol. 2013, 97, 9355–9363. [Google Scholar] [CrossRef]
- Kim, M.; Kim, K.Y.; Lee, K.M.; Youn, S.H.; Lee, S.M.; Woo, H.M.; Oh, M.K.; Um, Y. Butyric acid production from softwood hydrolysate by acetate-consuming Clostridium sp. S1 with high butyric acid yield and selectivity. Bioresour. Technol. 2016, 218, 1208–1214. [Google Scholar] [CrossRef] [PubMed]
- Liu, T.; Malkmes, M.J.; Zhu, L.; Huang, H.; Jiang, L. Metal-organic frameworks coupling simultaneous saccharication and fermentation for enhanced butyric acid production from rice straw under visible light by Clostridium tyrobutyricum CtΔack::cat1. Bioresour. Technol. 2021, 332, 125117. [Google Scholar] [CrossRef]
- Richmond, C.; Han, B.; Ezeji, T.C. Stimulatory Effects of Calcium Carbonate on Butanol Production by Solventogenic Clostridium Species. Cont. J. Microbiol. 2011, 5, 18–28. [Google Scholar]
- Wu, H.; Wang, C.; Chen, P.; He, A.Y.; Xing, F.X.; Kong, X.P.; Jiang, M. Effects of pH and ferrous iron on the coproduction of butanol and hydrogen by Clostridium beijerinckii IB4. Int. J. Hydrogen Energy 2017, 42, 6547–6555. [Google Scholar] [CrossRef]
- Zhang, Y.; Xiao, L.; Wang, S.; Liu, F. Stimulation of ferrihydrite nanorods on fermentative hydrogen production by Clostridium pasteurianum. Bioresour. Technol. 2019, 283, 308–315. [Google Scholar] [CrossRef]
- Moon, C.; Hwan Lee, C.; Sang, B.I.; Um, Y. Optimization of medium compositions favoring butanol and 1,3-propanediol production from glycerol by Clostridium pasteurianum. Bioresour. Technol. 2011, 102, 10561–10568. [Google Scholar] [CrossRef]
- Sarma, S.; Anand, A.; Dubey, V.K.; Moholkar, V.S. Metabolic flux network analysis of hydrogen production from crude glycerol by Clostridium pasteurianum. Bioresour. Technol. 2017, 242, 169–177. [Google Scholar] [CrossRef]
- Costa-Silva, T.A.; Carvalho, A.K.F.; Souza, C.R.F.; De Castro, H.F.; Bachmann, L.; Said, S.; Oliveira, W.P. Immobilized enzyme-driven value enhancement of lignocellulosic-based agricultural byproducts: Application in aroma synthesis. J. Clean. Prod. 2021, 284, 124728. [Google Scholar] [CrossRef]
- Ribeiro, J.C.; Mota, V.T.; de Oliveira, V.M.; Zaiat, M. Hydrogen and organic acid production from dark fermentation of cheese whey without buffers under mesophilic condition. J. Environ. Manag. 2022, 304, 114253. [Google Scholar] [CrossRef]
- Fu, H.; Yang, S.T.; Wang, M.; Wang, J.; Tang, I.C. Butyric acid production from lignocellulosic biomass hydrolysates by engineered Clostridium tyrobutyricum overexpressing xylose catabolism genes for glucose and xylose co-utilization. Bioresour. Technol. 2017, 234, 389–396. [Google Scholar] [CrossRef] [PubMed]
- Fuess, L.T.; dos Santos, G.M.; Delforno, T.P.; de Souza Moraes, B.; da Silva, A.J. Biochemical butyrate production via dark fermentation as an energetically efficient alternative management approach for vinasse in sugarcane biorefineries. Renew. Energy 2020, 158, 3–12. [Google Scholar] [CrossRef]
- Kao, W.C.; Lin, D.S.; Cheng, C.L.; Chen, B.Y.; Lin, C.Y.; Chang, J.S. Enhancing butanol production with Clostridium pasteurianum CH4 using sequential glucose-glycerol addition and simultaneous dual-substrate cultivation strategies. Bioresour. Technol. 2013, 135, 324–330. [Google Scholar] [CrossRef]
- Zhao, Z.-T.; Yang, S.-S.; Luo, G.; Sun, H.-J.; Liu, B.-F.; Cao, G.-L.; Bao, M.-Y.; Pang, J.-W.; Ren, N.-Q.; Ding, J. Biohydrogen fermentation from pretreated biomass in lignocellulose biorefinery: Effects of inhibitory byproducts and recent progress in mitigation strategies. Biotechnology Advances 2025, 79, 10850. [Google Scholar] [CrossRef]
- Perna, V.; Castelló, E.; Wenzel, J.; Zampol, C.; Fontes Lima, D.M.; Borzacconi, L.; Varesche, M.B.; Zaiat, M.; Etchebehere, C. Hydrogen production in an upflow anaerobic packed bed reactor used to treat cheese whey. Int. J. Hydrogen Energy 2013, 38, 54–62. [Google Scholar] [CrossRef]
- Srivastava, N.; Srivastava, M.; Kushwaha, D.; Gupta, V.K.; Manikanta, A.; Ramteke, P.W.; Mishra, P.K. Efficient dark fermentative hydrogen production from enzyme hydrolyzed rice straw by Clostridium pasteurianum (MTCC116). Bioresour. Technol. 2017, 238, 552–558. [Google Scholar] [CrossRef]
- Youcai, Z.; Tao, Z. Pretreatment and aged refuse dosage on biohydrogen production from food waste. In Biohydrogen Production and Hybrid Process Development: Energy and Resource Recovery from Food Waste; Elsiever: Amsterdam, The Netherlands, 2021; pp. 149–238. [Google Scholar] [CrossRef]
- Dahiya, S.; Mohan, S.V. Selective control of volatile fatty acids production from food waste by regulating biosystem buffering: A comprehensive study. Chem. Eng. J. 2019, 357, 787–801. [Google Scholar] [CrossRef]
- Lovato, G.; Albanez, R.; Stracieri, L.; Ruggero, L.S.; Ratusznei, S.M.; Rodrigues, J.A.D. Hydrogen production by co-digesting cheese whey and glycerin in an AnSBBR: Temperature effect. Biochem. Eng. J. 2018, 138, 81–90. [Google Scholar] [CrossRef]
- Barba, F.J. An integrated approach for the valorization of cheese whey. Foods 2021, 10, 564. [Google Scholar] [CrossRef]
- Alavi-Borazjani, S.A.; Tarelho, L.A.d.C.; Capela, M.I. Parametric optimization of the dark fermentation process for enhanced biohydrogen production from the organic fraction of municipal solid waste using Taguchi method. Int. J. Hydrogen Energy 2021, 46, 21372–21382. [Google Scholar] [CrossRef]
- Ghimire, A.; Sposito, F.; Frunzo, L.; Trably, E.; Escudié, R.; Pirozzi, F.; Lens, P.N.L.; Esposito, G. Effects of operational parameters on dark fermentative hydrogen production from biodegradable complex waste biomass. Waste Manag. 2016, 50, 55–64. [Google Scholar] [CrossRef]
- Moussa, R.N.; Moussa, N.; Dionisi, D. Hydrogen Production from Biomass and Organic Waste Using Dark Fermentation: An Analysis of Literature Data on the Effect of Operating Parameters on Process Performance. Processes 2022, 10, 156. [Google Scholar] [CrossRef]
- Argun, H.; Kargi, F.; Kapdan, I.K.; Oztekin, R. Batch dark fermentation of powdered wheat starch to hydrogen gas: Effects of the initial substrate and biomass concentrations. Int. J. Hydrogen Energy 2008, 33, 6109–6115. [Google Scholar] [CrossRef]
- Chen, Y.; Yin, Y.; Wang, J. Recent advance in inhibition of dark fermentative hydrogen production. Int. J. Hydrogen Energy 2021, 46, 5053–5073. [Google Scholar] [CrossRef]
- Mıynat, M.E.; Argun, H. Prevention of substrate and product inhibitions by using a dilution strategy during dark fermentative hydrogen production from molasses. Int. J. Hydrogen Energy 2020, 45, 34695–34706. [Google Scholar] [CrossRef]
- Kargi, F.; Ozmihci, S. Utilization of cheese whey powder (CWP) for ethanol fermentations: Effects of operating parameters. Enzym. Microb. Technol. 2006, 38, 711–718. [Google Scholar] [CrossRef]
- Karakaya, G.; Özmıhçı, S. Statistical optimization of biohydrogen fermentation from a perspective of butyrate production. Int. J. Hydrogen Energy 2024, 67, 807–817. [Google Scholar] [CrossRef]
- Casler, M.D.; Vermerris, W.; Dixon, R.A. Replication concepts for bioenergy research experiments. Bioenergy Res. 2015, 8, 1–16. [Google Scholar]
- Dubois, M.; Gilles, K.A.; Hamilton, J.K.; Rebers, P.A.; Smith, F. Colorimetric Method for Determination of Sugars and Related Substances. Anal. Chem. 1956, 28, 350–356. [Google Scholar]
- Kargi, F.; Eren, N.S.; Ozmihci, S. Effect of initial bacteria concentration on hydrogen gas production from cheese whey powder solution by thermophilic dark fermentation. Biotechnol. Prog. 2012, 28, 931–936. [Google Scholar] [CrossRef]
- Kara, M.; Odabsi, M.; Dumanoglu, Y.; Falay, E.O.; Tuygun, G.T.; Altiok, H.; Bayram, A.; Tolunay, D.; Elbir, T. Investigation of atmospheric pollution by biomonitoring of major and trace elements in an industrial region. J. Environ. Sci. Eng. Technol. 2019, 7, 16–25. [Google Scholar] [CrossRef]
- Kriswantoro, J.A.; Chu, C.Y. Biohydrogen production kinetics from cacao pod husk hydrolysate in dark fermentations: Effect of pretreatment, substrate concentration, and inoculum. J. Clean. Prod. 2024, 434, 140407. [Google Scholar] [CrossRef]
- Gallardo, R.; Alves, M.; Rodrigues, L.R. Modulation of crude glycerol fermentation by Clostridium pasteurianum DSM 525 towards the production of butanol. Biomass Bioenergy 2014, 71, 134–143. [Google Scholar] [CrossRef]
- Gallazzi, A.; Branska, B.; Marinelli, F.; Patakova, P. Continuous production of n-butanol by Clostridium pasteurianum DSM 525 using suspended and surface-immobilized cells. J. Biotechnol. 2015, 216, 29–35. [Google Scholar] [CrossRef]
- Sarchami, T.; Johnson, E.; Rehmann, L. Optimization of fermentation condition favoring butanol production from glycerol by Clostridium pasteurianum DSM 525. Bioresour. Technol. 2016, 208, 73–80. [Google Scholar] [CrossRef] [PubMed]
- Fonseca, B.C.; Bertolucci, J.; da Silva, T.M.; dos Passos, V.F.; de Gouvêa, P.F.; Dinamarco, T.M.; Reginatto, V. Butyric acid as a sole product from xylose fermentation by a non-solventogenic Clostridium beijerinckii strain under controlled pH and nutritional conditions. Bioresour. Technol. Rep. 2020, 10, 100426. [Google Scholar] [CrossRef]
- Kremling, A.; Bettenbrock, K.; Laube, B.; Jahreis, K.; Lengeler, J.W.; Gilles, E.D. The Organization of Metabolic Reaction Networks: III. Application for Diauxic Growth on Glucose and Lactose. Metab. Eng. 2001, 3, 362–379. [Google Scholar] [CrossRef]
- Yu, Y.; Tangney, M.; Aass, H.C.; Mitchell, W.J. Analysis of the Mechanism and Regulation of Lactose Transport and Metabolism in Clostridium acetobutylicum ATCC 824. Appl. Environ. Microbiol. 2007, 73, 1842–1850. [Google Scholar]
- Qureshi, N.; Liu, S.; Saha, B.C. Butyric Acid Production by Fermentation: Employing Potential of the Novel Clostridium tyrobutyricum Strain NRRL 67062. Fermentation 2022, 8, 491. [Google Scholar] [CrossRef]
- Dessì, P.; Asunis, F.; Ravishankar, H.; Cocco, F.G.; De Gioannis, G.; Muntoni, A.; Lens, P.N.L. Fermentative hydrogen production from cheese whey with in-line, concentration gradient-driven butyric acid extraction. Int. J. Hydrogen Energy 2020, 45, 24453–24466. [Google Scholar] [CrossRef]
- Kelbert, M.; Machado, T.O.; Araújo PH, H.; Sayer, C.; de Oliveira, D.; Maziero, P.; Simons, K.E.; Carciofi, B.A.M. Perspectives on biotechnological production of butyric acid from lignocellulosic biomass. Renew. Sustain. Energy Rev. 2024, 202, 114717. [Google Scholar] [CrossRef]
- Suazo, A.; Tapia, F.; Aroca, G.; Quintero, J. Techno-Economic and Life Cycle Assessment of a Small-Scale Integrated Biorefinery for Butyric-Acid Production in Chile. Fermentation 2024, 10, 1. [Google Scholar] [CrossRef]
 : 0.5 g/L,
  : 1 g/L,
  : 1.5 g/L,
  : 2 g/L,
  : 2.5 g/L,
  : 3 g/L.
: 0.5 g/L, : 1 g/L, : 1.5 g/L, : 2 g/L, : 2.5 g/L, : 3 g/L.
: 3 g/L.
: 0.5 g/L, : 1 g/L, : 1.5 g/L, : 2 g/L, : 2.5 g/L, : 3 g/L.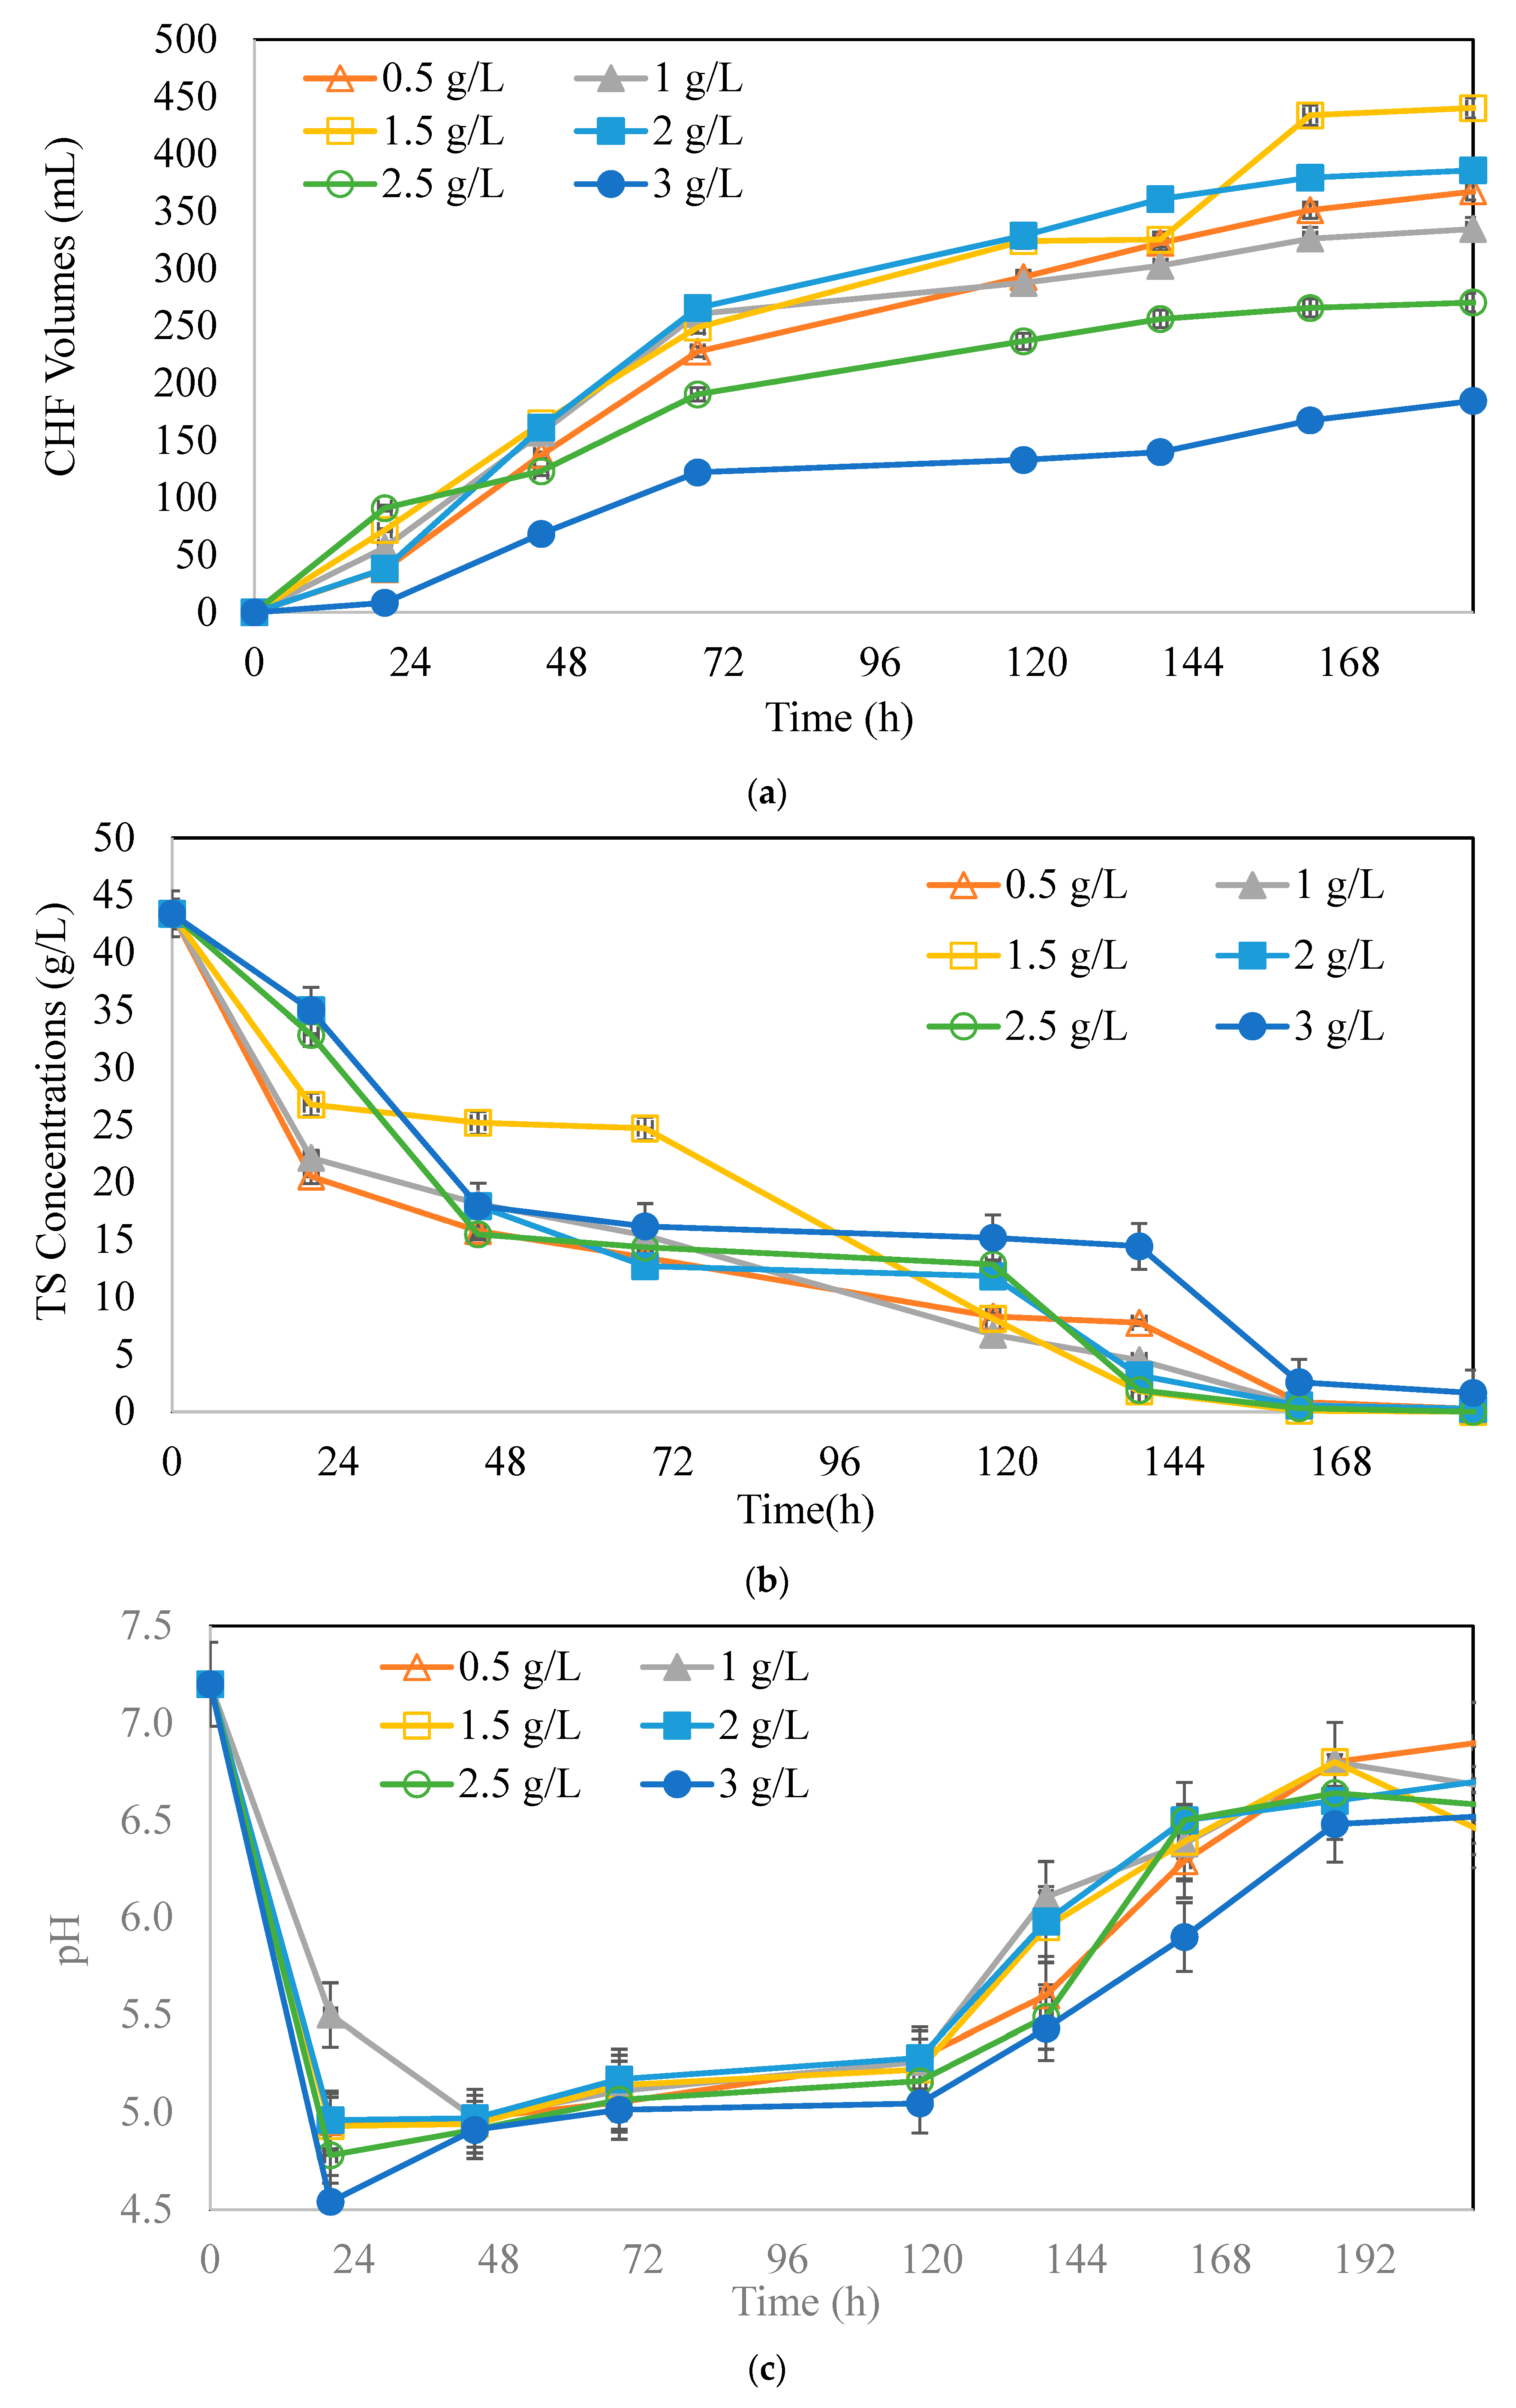

 : 40 g/L,
  : 80 g/L,
  : 100 g/L,
  : 150 g/L,
  : 200 g/L.
: 40 g/L, : 80 g/L, : 100 g/L, : 150 g/L, : 200 g/L.
: 200 g/L.
: 40 g/L, : 80 g/L, : 100 g/L, : 150 g/L, : 200 g/L.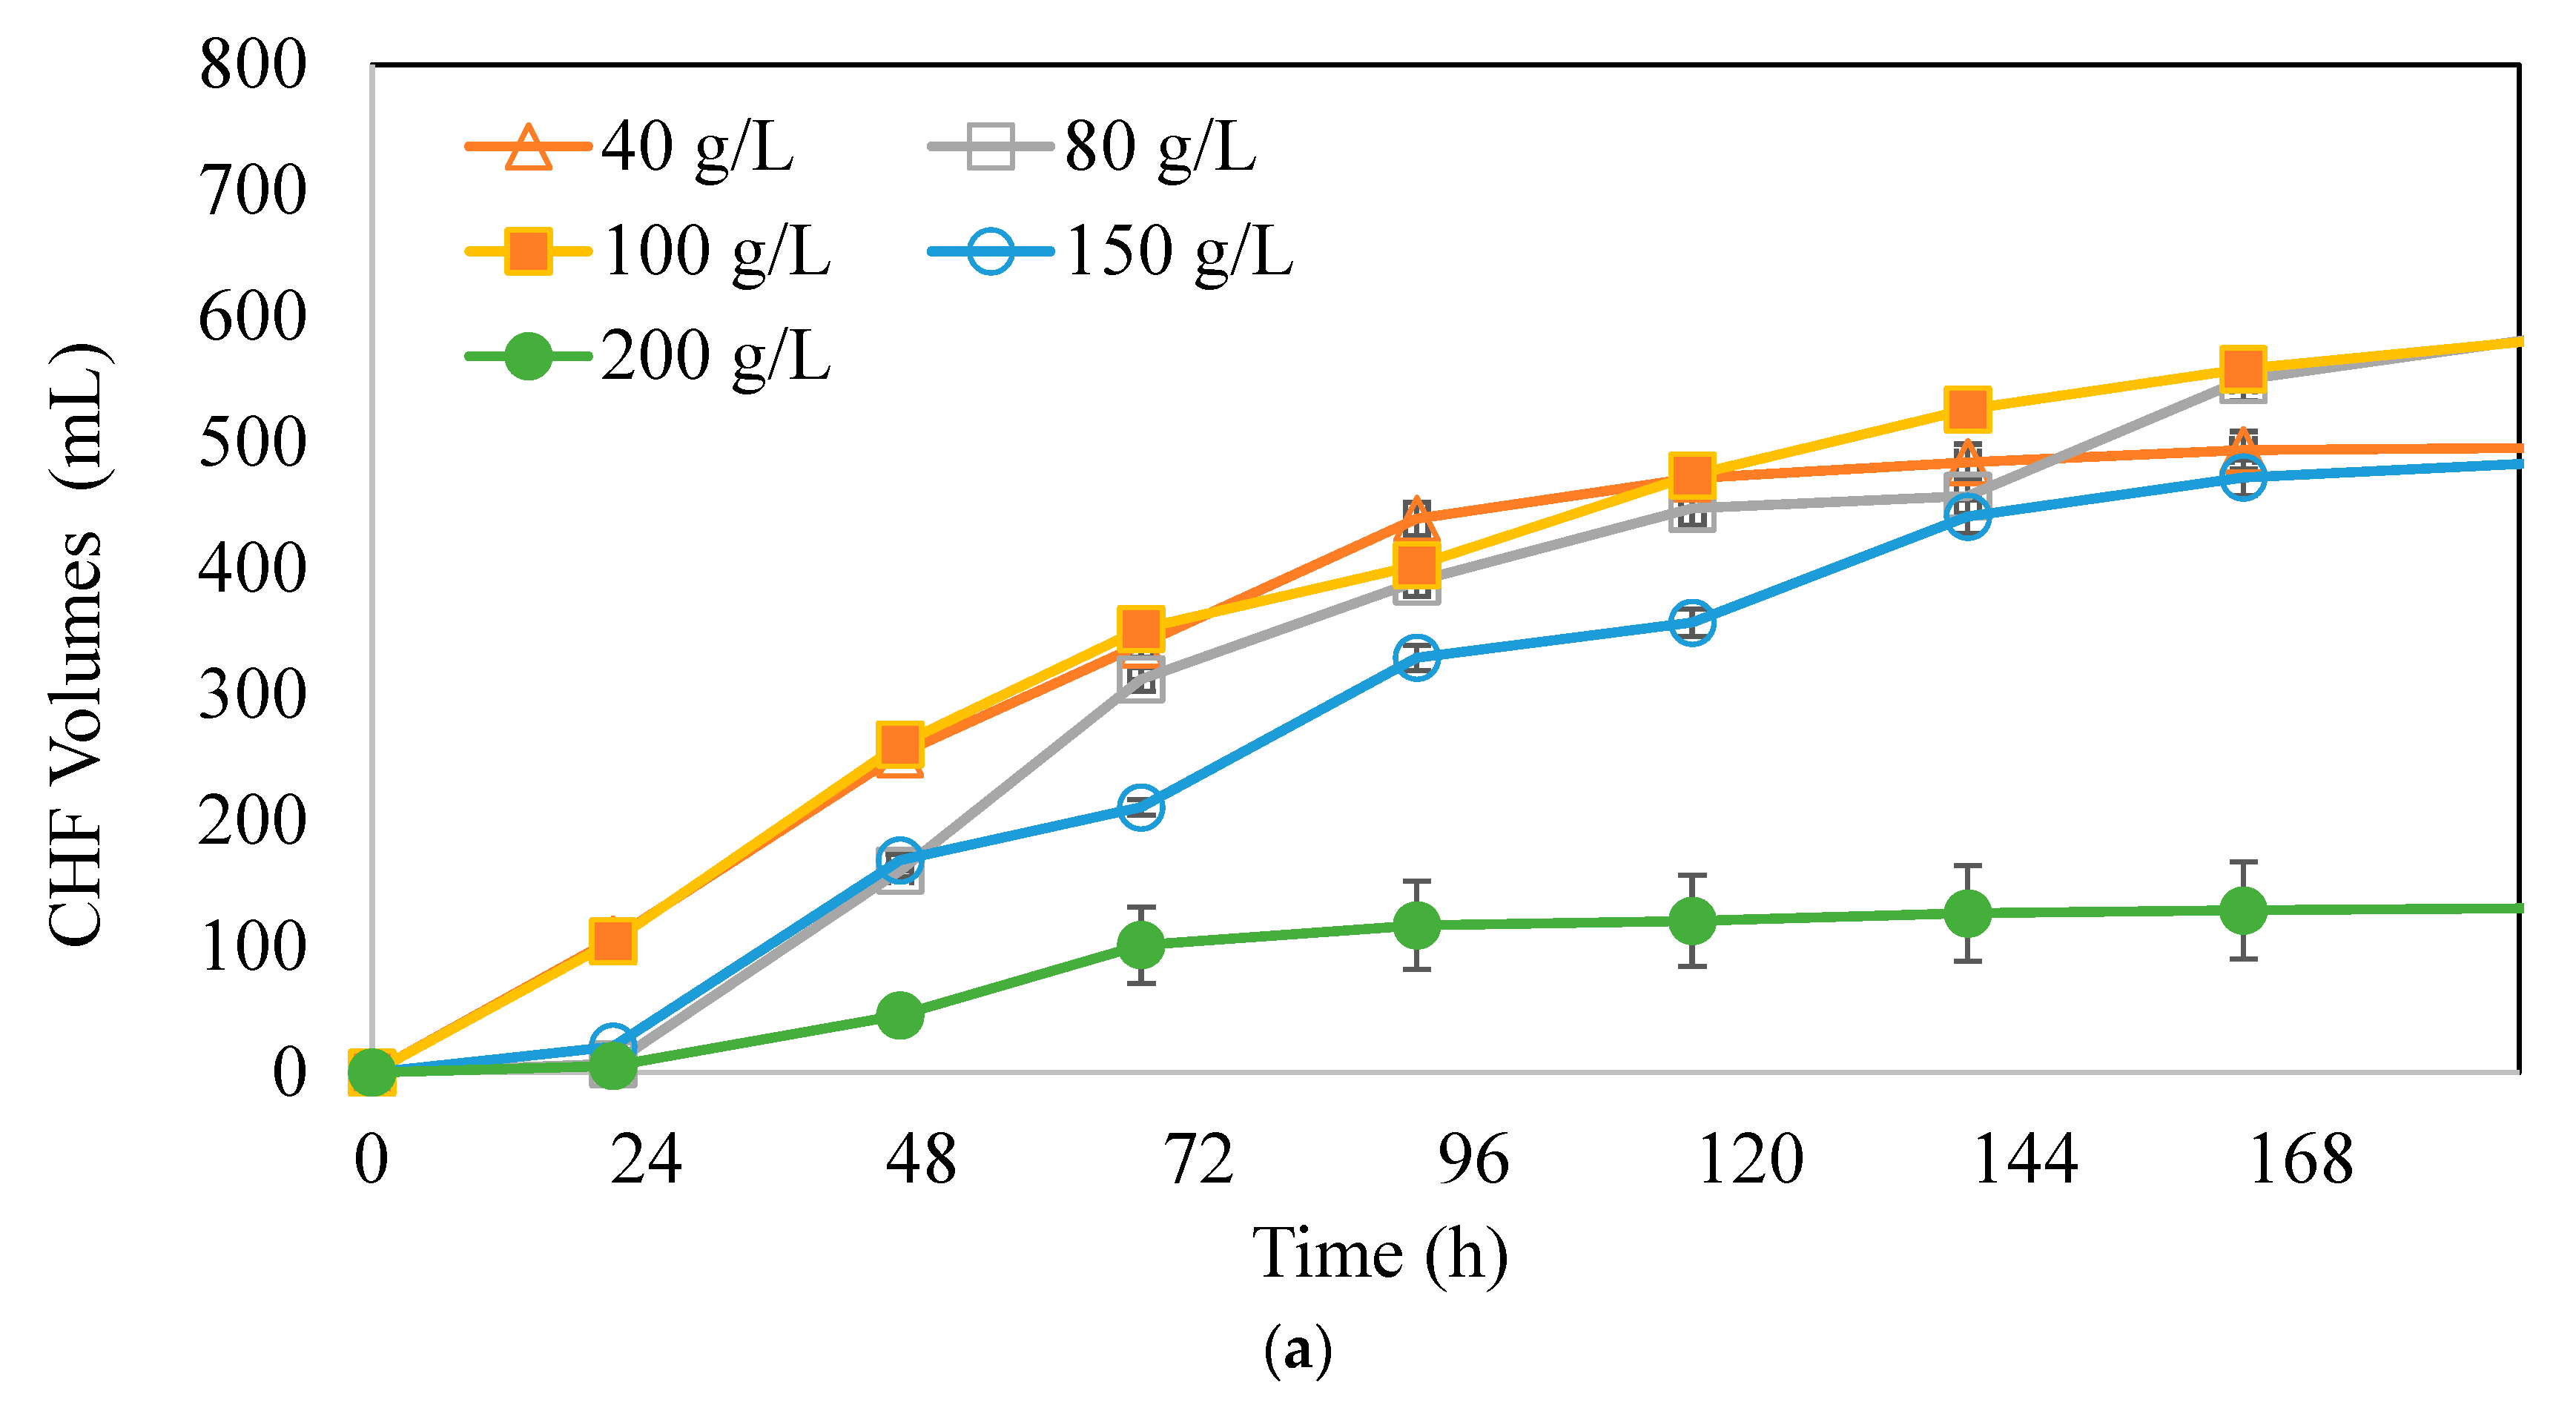


| Parameter | Value |
|---|---|
| pH | 6.8 ± 0.1 |
| TP | 260 ± 3 mg/L |
| TN | 280 ± 5 mg/L |
| NH4+ | 3.51 ± 0.1 mg/L |
| NO3− | 100 ± 8 mg/L |
| SS | 778 ± 4 mg/L |
| TSS | 9980 ± 10 mg/L |
| Parameter | Concentration (mg/L) | Parameter | Concentration (mg/L) |
|---|---|---|---|
| 7 Li | 1.95 ± 0.1 | 63 Cu [He] | 2.00 ± 0.1 |
| 9 Be | 0 | 66 Zn [He] | 3.97 ± 0.05 |
| 11 B [He] | 33.38 ± 0.5 | 75 As [He] | 0.87 ± 0.1 |
| 23 Na [He] | 132,342.94 ± 1000 | 78 Se [He] | 0.22 ± 0.01 |
| 24 Mg [He] | 17,940.54 ± 500 | 88 Sr [He] | 123.36 ± 1 |
| 27 Al [He] | <0.000 | 95 Mo | 9.48 ± 0.1 |
| 39 K [He] | 152,848.84 ± 1500 | 107 Ag | 0.03 ± 0.001 |
| 43 Ca [He] | 173,537.15 ± 1000 | 111 Cd | 0.10 ± 0.001 |
| 51 V [He] | 76.40 ± 5 | 118 Sn | 0.23 ± 0.005 |
| 52 Cr [He] | 1.78 ± 0.05 | 121 Sb | 0.13 ± 0.001 |
| 55 Mn [He] | 10.63 ± 0.1 | 137 Ba | 13.02 ± 0.5 |
| 56 Fe [He] | 41.46 ± 0.7 | 205 Tl | 0.08 ± 0.005 |
| 59 Co [He] | 0.24 ± 0.1 | 208 Pb | 2.15 ± 0.1 |
| 60 Ni [He] | 13.12 ± 0.5 |
Disclaimer/Publisher’s Note: The statements, opinions and data contained in all publications are solely those of the individual author(s) and contributor(s) and not of MDPI and/or the editor(s). MDPI and/or the editor(s) disclaim responsibility for any injury to people or property resulting from any ideas, methods, instructions or products referred to in the content. |
© 2025 by the authors. Licensee MDPI, Basel, Switzerland. This article is an open access article distributed under the terms and conditions of the Creative Commons Attribution (CC BY) license (https://creativecommons.org/licenses/by/4.0/).
Share and Cite
Karakaya, G.; Özmihçi, S. Influence of Different Substrate and Microorganism Concentrations on Butyric Acid-Derived Biohydrogen Production. Processes 2025, 13, 1068. https://doi.org/10.3390/pr13041068
Karakaya G, Özmihçi S. Influence of Different Substrate and Microorganism Concentrations on Butyric Acid-Derived Biohydrogen Production. Processes. 2025; 13(4):1068. https://doi.org/10.3390/pr13041068
Chicago/Turabian StyleKarakaya, Gizem, and Serpil Özmihçi. 2025. "Influence of Different Substrate and Microorganism Concentrations on Butyric Acid-Derived Biohydrogen Production" Processes 13, no. 4: 1068. https://doi.org/10.3390/pr13041068
APA StyleKarakaya, G., & Özmihçi, S. (2025). Influence of Different Substrate and Microorganism Concentrations on Butyric Acid-Derived Biohydrogen Production. Processes, 13(4), 1068. https://doi.org/10.3390/pr13041068