Article

A Similarity Theory-Based Study on Natural Convection Condensation Boundary Layer Characteristics of Vertical Walls

1
College of Nuclear Science and Technology, Naval University of Engineering, Wuhan 430033, China
2
College of Nuclear Science and Technology, Harbin Engineering University, Harbin 150001, China
*
Author to whom correspondence should be addressed.
Processes 2025, 13(4), 1050; https://doi.org/10.3390/pr13041050
Submission received: 27 February 2025 / Revised: 23 March 2025 / Accepted: 27 March 2025 / Published: 1 April 2025
(This article belongs to the Section Chemical Processes and Systems)

Abstract

:
To address the challenge of heat transfer enhancement in the condensation of steam with non-condensable gases on a vertical wall under natural convection conditions, an improved boundary layer model with coupled multi-physics field was proposed in this paper, and traditional theoretical limitations were broken through by innovations. The particle swarm optimization algorithm was first introduced into the solution of the condensation boundary layer, and the convergence difficulty in the laminar–turbulent transition region under infinite boundary conditions was overcome. A coupled momentum–energy–mass equation system that simultaneously considered temperature–concentration dual-driven gravity terms and liquid film drag–suction dual effects was established, and higher computational efficiency and accuracy were achieved. A new mechanism where the concentration boundary layer dominated heat transfer resistance under the coupled action of the Prandtl number (Pr) and Schmidt number (Sc) was revealed. Experimental validation demonstrated that a prediction error of less than 5% was exhibited by the model under typical operating conditions of passive containment cooling systems (pressures of 1.5–4.5 atm and subcooling temperatures of 14–36 °C), and a theoretical tool for high-precision condensation heat transfer design was provided.

1. Introduction

Steam condensation is widely observed in daily life and industrial production. In many cases, heat is removed through steam condensation. However, the presence of non-condensable gases significantly reduces the condensation heat transfer rate. As steam condenses on a cold wall, non-condensable gases accumulate near the wall, forming an isolation layer that the steam in the mainstream region must penetrate to reach the wall. The fluid flows under the influence of various forces, generating velocity, temperature, and concentration boundary layers, as shown in Figure 1. The characteristics of the boundary layer determine the concentration and temperature gradients at the wall, thereby affecting the heat and mass transfer rates. The morphology of the boundary layer is influenced by the flow regime, such as forced and natural convection. In forced convection, the heat transfer rate mainly depends on the velocity of the mainstream region, and this area has been extensively studied [1,2]. In natural convection, the driving force comes from the density difference caused by the temperature and concentration differences between the wall and the mainstream region. Under the influence of gravity, the fluid flows downward along the wall. The problem in natural convection is more complex, as the flow velocity is coupled with temperature and concentration and is jointly affected by factors such as the temperatures of the wall and the mainstream region, the steam concentration, the Prandtl number (Pr), and the Schmidt number (Sc) [3]. Factors affecting heat transfer also include the geometric characteristics of the wall, such as inside the tube [4], outside the tube [5], planar [6], and porous interfaces [7]. This paper focuses on vertical walls, which are relevant to the passive containment cooling systems in nuclear reactors.
Research methods can be divided into theoretical and experimental categories. Early experimental studies were conducted by Uchida [8] and Tagami [9], and their empirical relationships were widely used in containment analysis programs. Since then, many scholars have carried out condensation heat transfer experimental studies under different conditions [10,11,12,13,14,15], obtaining empirical relationships under corresponding conditions and providing data support for verifying theoretical studies. Currently, theoretical research primarily focuses on two main directions: one is to directly solve the boundary-layer conservation equations, and the other is to analyze problems based on the analogy of heat and mass transfer [16]. Given the partial–differential nature of the differential equations, obtaining a direct solution is difficult, and the heat-and-mass-transfer similarity theory has been more extensively explored and applied [17,18,19,20]. Lu [21] noted that previous studies rarely considered the suction effect, atomization effect, and interface friction effect, so the model was modified, and results closer to the experimental values were obtained. While the similarity theory can determine the heat transfer coefficient, it cannot describe the flow state of the fluid. Sparrow [22] obtained the velocity and concentration boundary layers by directly solving the conservation equations but only considered the component differences in the gravity term, ignored the influence of temperature on the momentum equation, and did not include the convective term in the heat transfer analysis, resulting in calculated results lower than the experimental values.
This study aimed to develop a theoretical model for wall condensation heat transfer, simultaneously considering the dual effects of wall suction and liquid film drag. After establishing the three conservation equations, appropriate methods were sought to obtain their numerical solutions under infinite boundary conditions, and the characteristics of the velocity, temperature, and non-condensable gas concentration boundary layers and their interactions under laminar flow conditions were investigated.
Compared with previous studies, this research aims to establish a universal predictive model applicable to wall condensation. The main innovations are reflected in two aspects. Firstly, it achieves multi-physical field coupling modeling. Breaking through the limitations of temperature’s influence on momentum equations, the buoyancy term simultaneously considers both temperature and concentration gradient effects. Through rigorous mathematical derivation, previously empirical treatments of suction effects and liquid film drag effects are incorporated into boundary conditions, establishing a more comprehensive physical coupling mechanism. Secondly, it implements innovative numerical solution methods. Addressing the infinite boundary conditions that traditional similarity solutions struggle to handle, this study pioneers the application of particle swarm optimization algorithms to solve ODE systems. This intelligent optimization strategy effectively resolves the mathematical singularity associated with three infinite boundary conditions, overcoming the convergence bottleneck of traditional shooting methods.
In this paper, a theoretical model was developed for the condensation heat transfer problem of vertical walls with non-condensable gases under stable natural convection conditions. The gravity term accounts for two factors: temperature and concentration. The boundary conditions incorporate the liquid–film drag and suction effects, and the calculated heat transfer coefficient was compared with the experimental results. Finally, the verified model was employed to analyze the characteristics of the flow velocity, temperature, and concentration boundary layers of the mixed gas.
The differences between this work and previous similar works are shown in Table 1.

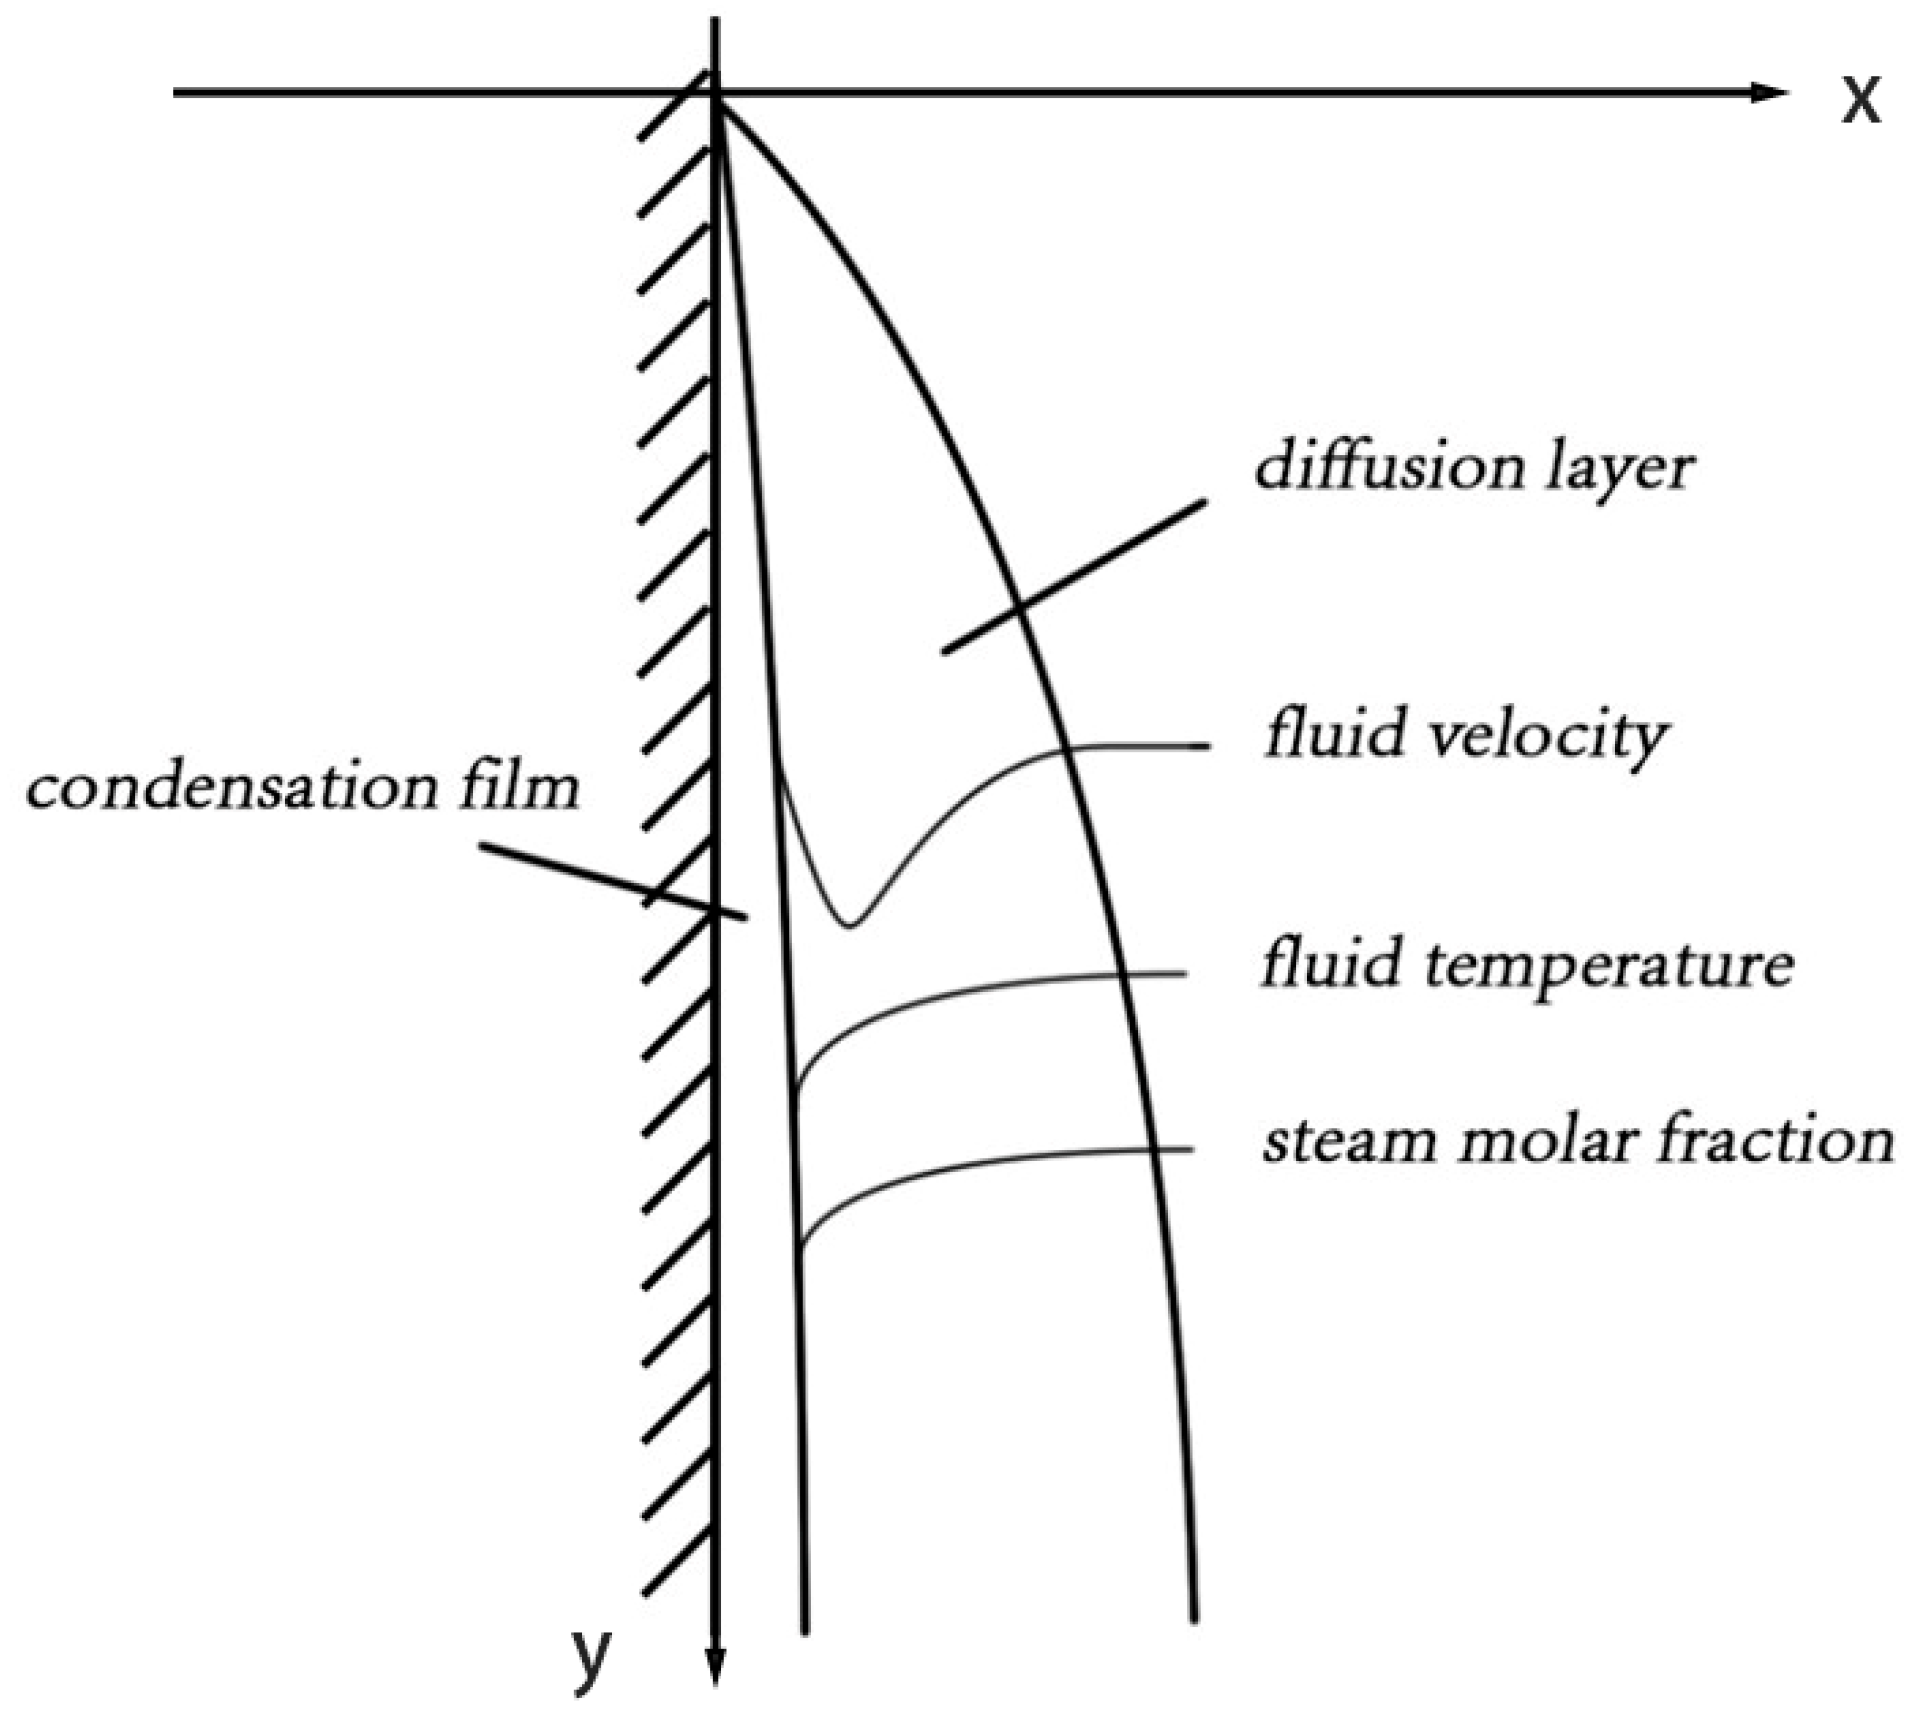
2. Model Establishment

2.1. Basic Assumptions

The boundary layer studied in this paper is for laminar flow. When Gr > 109, it gradually transitions to turbulent flow, making the fluid state more complex. When steam condenses, a liquid film forms on the wall, increasing the thermal resistance between the mixed gas and the wall. According to research by Oh [23], Zhang [24], and others, when the concentration of non-condensable gases is not too low, the primary thermal resistance in heat transfer remains on the gas side. Therefore, the effect of the liquid-film thermal resistance is neglected in this study, assuming that the temperature of the liquid-film surface is the same as the wall temperature. Condensation problems often involve large temperature differences, and the physical properties of the fluid change significantly from the wall to the mainstream region, especially parameters such as density, viscosity coefficient, diffusion coefficient, Prandtl number, and Schmidt number, which can significantly impact the calculation results. Considering the non-linear changes in temperature and gas concentration in the transverse direction, a unified logarithmic average value is used as the input condition. For example, T a v e = T b T w / ln T b / ln T w is used as the average value of the transverse temperature change, and the same approach applies to other parameters. The flow of the liquid film can drive the gas flow, while the gas exerts a reverse viscous drag force on the liquid film. Considering the large density difference between the liquid and the gas, the flow of the liquid film only considers gravity and its own viscous drag force, neglecting the flow resistance on the gas side. At low pressures, the ideal gas state equation c = P / R T is used for gas concentration calculation, and at high pressures, it needs to be corrected by the compression coefficient.

2.2. Differential Equations of Convective Heat Transfer

During the convective heat transfer process of the mixed gas, the stable momentum equation, energy equation, and concentration diffusion equation are as follows [25]:
u u x + v u y = 1 M v c v b + M g c g b M v c v + M g c g ) g + ν 2 u y 2
u t x + v t y = a 2 t y 2
u c v x + v c v y = D 2 c v y 2
where u and v are the flow velocities of the fluid in the x and y directions, respectively; Mg and Mv are the molar masses of the non-condensable gas and steam, respectively; cv and cg are the concentrations of steam and non-condensable gas at the calculation node, respectively; cvb and cgb are the concentrations of steam and non-condensable gas in the mainstream region, respectively; g is the gravitational acceleration; t is the fluid temperature; ν is the kinematic viscosity; a is the thermal diffusivity; and D is the gas mass-transfer diffusion coefficient. Because the flow velocity of the mixed gas varies in both the x and y directions, directly solving the partial–differential equations is challenging. Given the similarity of the boundary layer in the geometric section, after finding the similarity solution, it can be transformed into a system of ordinary differential equations, greatly simplifying the problem. The similarity variable η = y H x is introduced, and the stream function is expressed as follows:
ψ x , η = ν f η G x
where
G x = 4 1 4 G r x 1 4
H x = 1 x 1 4 G r x 1 4
G r x is the Grashof number and its expression is G r x = g Δ ρ x 3 / ρ ν 2 . According to the definition of the stream function, we can obtain the following expressions:
u = ψ y = ν H x G x f η
v = ψ x = ν G x 4 x 3 f η η f η
The dimensionless temperature and dimensionless concentration are defined as θ η and γ η , and their expressions are as follows:
θ ( η ) = t ( η ) t b t w t b
γ ( η ) = c v ( η ) c v b c v w c v b
η is a function of x and y. It is proportional to y and inversely proportional to x 1 / 4 . Substituting Equations (7) and (8) into the equation system, we can obtain the simplified differential equation system:
f + 3 f f 2 f 2 + ξ = 0
θ + 3 Pr   f θ = 0
γ + 3 S c f γ = 0
where
ξ = M v c v + M g c g M v c v b + M g c g b M v c v w + M g c g w M v c v b + M g c g b

2.3. Determination of Boundary Conditions

If there is no steam condensation on the vertical wall surface, and the fluid undergoes natural convection only due to the density difference caused by the temperature difference, its boundary conditions are as shown in Table 2.
When considering the condensation effect, two effects at the wall can influence the boundary-layer characteristics and the heat transfer rate. One is the suction effect caused by wall condensation. A large amount of steam condenses at the wall, which is equivalent to adding a negative mass-source term, drawing the mixed gas towards the wall. This causes the mass transfer of steam and air to superimpose a transverse migration on free diffusion, resulting in a thinner boundary layer, which actually enhances the heat transfer. The other is the viscous-drag effect of the liquid film on the gas boundary layer, which imparts an initial longitudinal velocity to the gas side at the gas–liquid interface, thereby affecting the boundary-layer characteristics and the heat transfer efficiency. Whether the theoretical model, considering these two effects, still satisfies the similarity theory depends on whether a similarity solution to the simplified differential equation system can be found. We can first assume that the similarity variable is still η, and if the boundary conditions of the simplified differential equation system obtained from this are independent of x, the assumption holds.
First, consider the wall-suction effect. The transverse migration velocity of the mixed gas at the interface is given by Peterson as shown below [26]:
v i = D 1 c g c g y i
Considering c g = c c v , here, c represents the molar concentration of the gas mixture. We can obtain the following expression:
v i = D 1 c g c v y i = D c v w c v b c g γ 0 H x
Since η = 0 at the interface, by substituting it into Equation (8), we can obtain v i = 3 f 0 ν H x , and then we can obtain the wall-boundary condition as follows:
f 0 = D c v w c v b 3 c g ν γ 0
It can be seen that the boundary condition is independent of x, and thus the equation system presents a similarity solution.
Next, we consider the liquid-film drag effect. According to Nusselt’s condensation theory, the flow velocity at the liquid-film surface primarily depends on the liquid-film thickness δ, and its expression is as follows:
u i = ρ f ρ g g 2 μ f δ 2
δ increases as x increases. The liquid-film thickness at a specific position can be determined from the corresponding mass flow rate per unit width of the liquid film, Γ, and the relationship between them is as follows:
Γ = ρ f ρ f - ρ g g 3 μ f δ 3 = m ˙ x
m ˙ x is the total condensation amount per unit width upstream of this position, and its expression is as follows:
m ˙ x = k c x c v b c v w = 4 3 S h D c v b c v w x 3 / 4
where kc is the mass-transfer coefficient, and the dimensionless mass-transfer number is defined using the average Sherwood number S h x = 4 3 S h , where S h = γ 0 G r x 4 1 / 4 . Correspondingly, u i x 1 / 2 . From Equation (7), we can obtain the following equation:
u i = ν 2 2 x G r 1 / 2 f 0 x 1 / 2
By combining Equations (18)–(21), we can obtain the expression of the boundary condition f’(0), which is independent of x. Therefore, the equation system also has a similarity solution. Based on the above analysis, the boundary conditions of the simplified differential equation system are shown in Table 3.

3. Model Solution and Verification
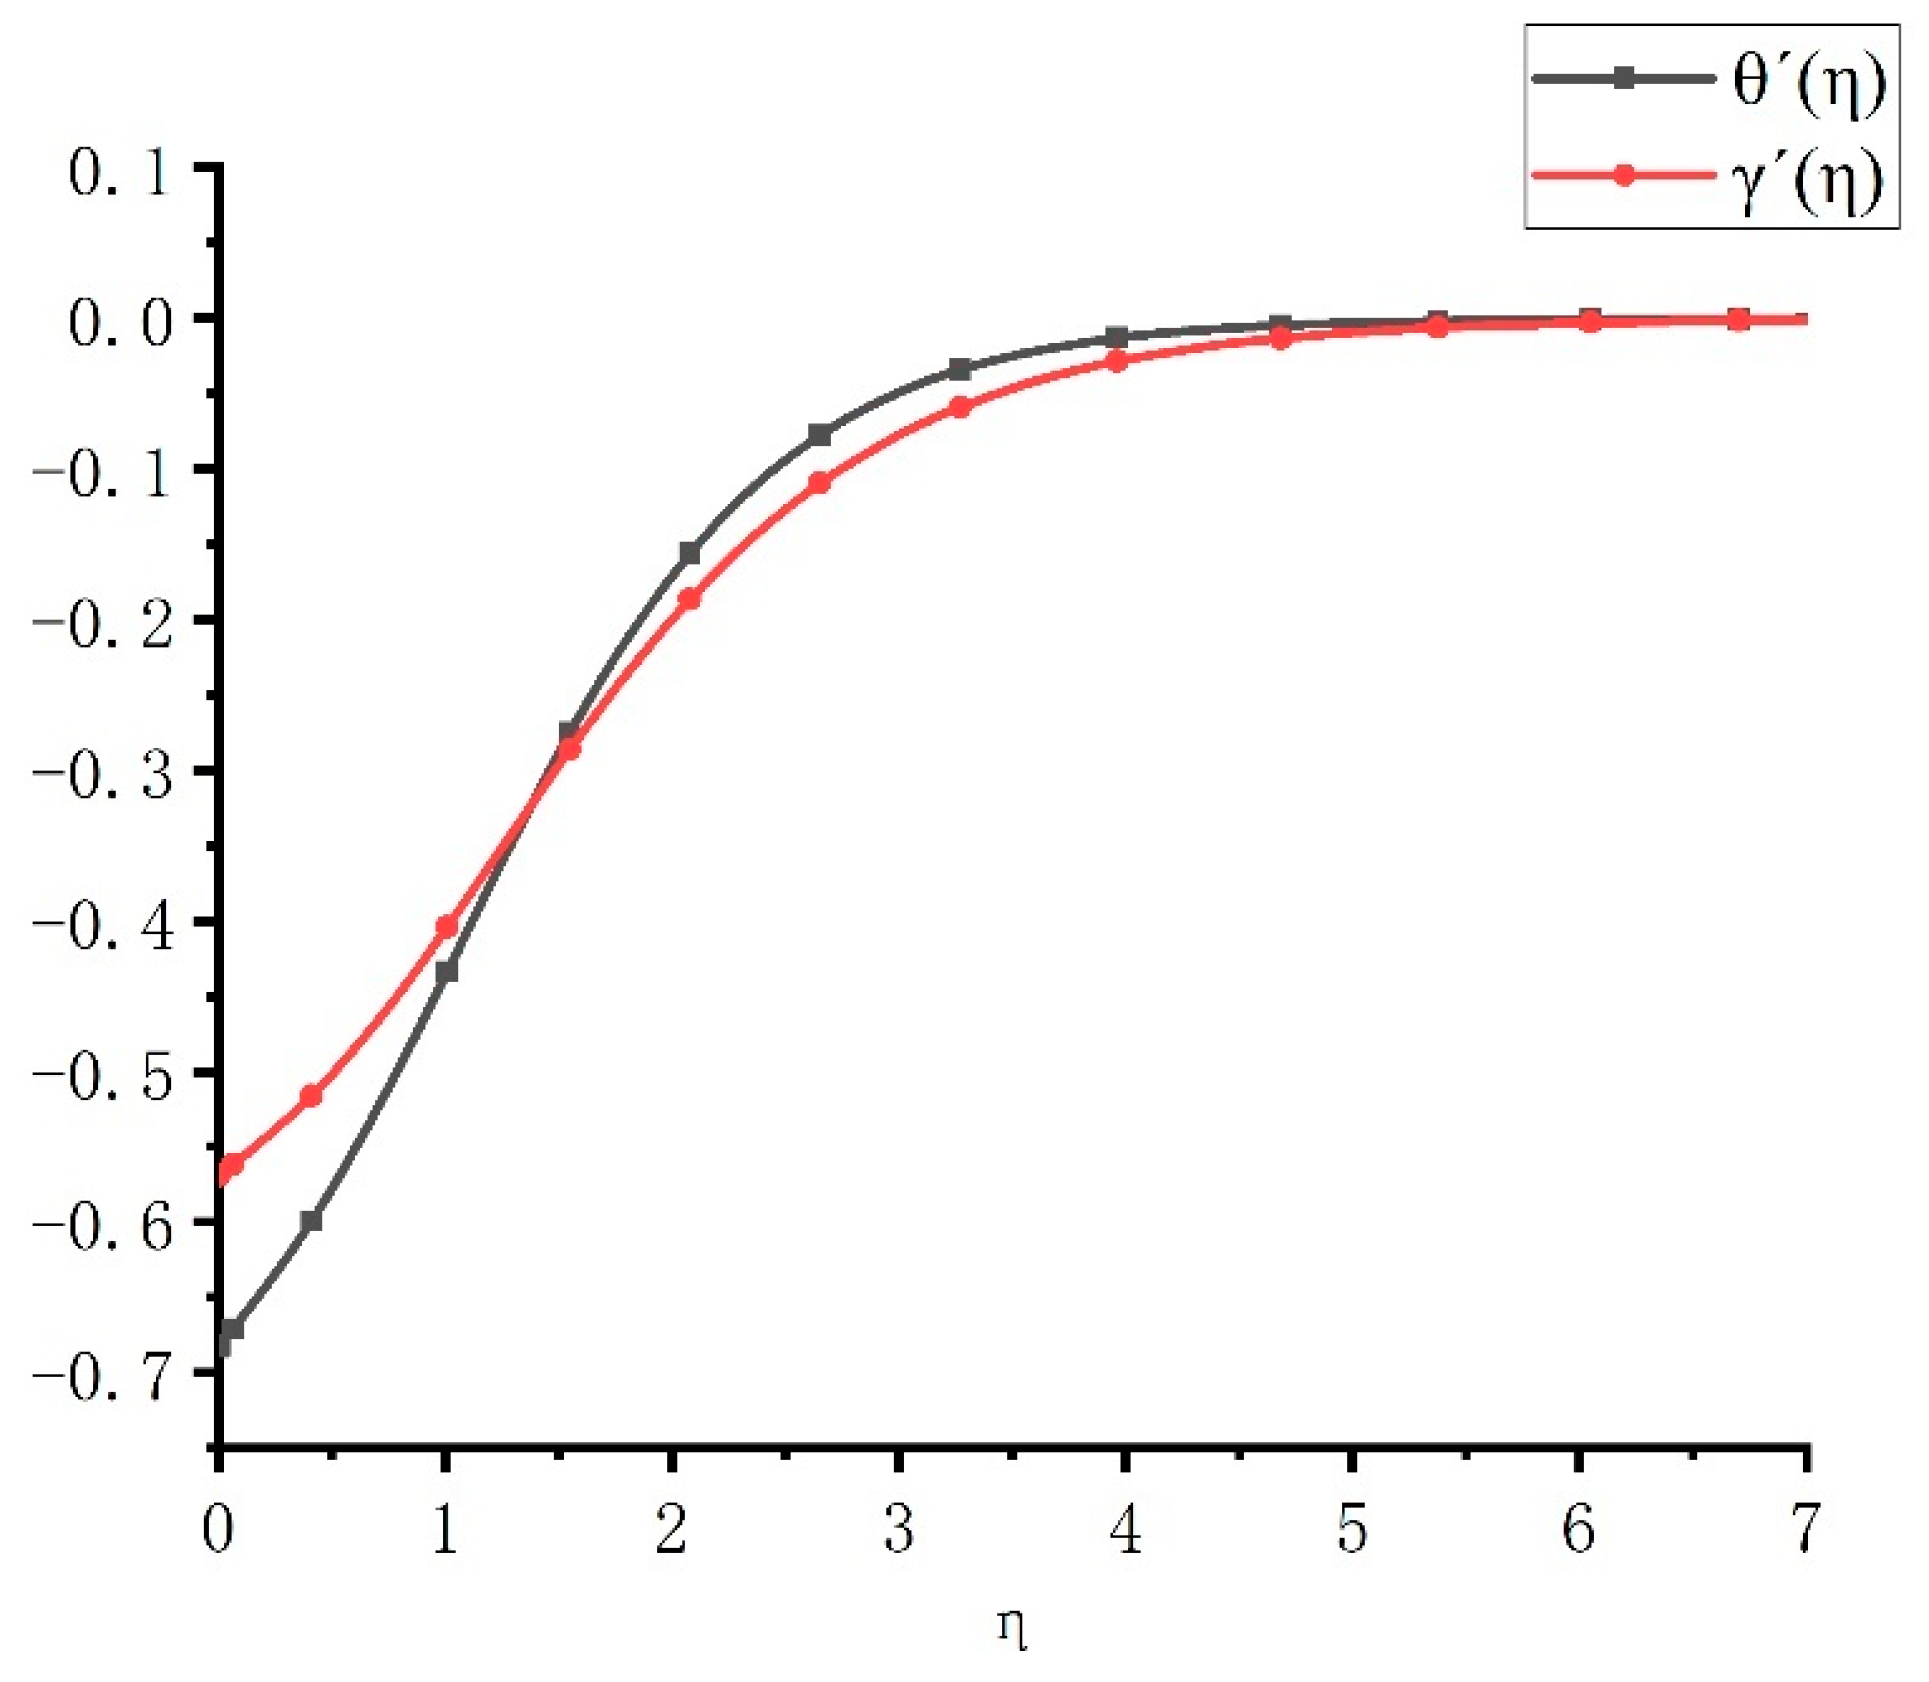
3.1. Model Solution

This problem has three infinite boundary conditions, which are difficult to solve using conventional methods. In this paper, the particle swarm optimization algorithm (PSO) is used. The particles automatically search for the values of the three undetermined zeros, and whether the function value approaches zero at infinity corresponding to these zeros is used as the convergence criterion to obtain the solution of the entire equation system. The particle swarm optimization algorithm allows particles to search with random initial positions and velocities, and to share their search results with other particles for correction. After multiple iterations, the optimal solution is obtained. During the search process, the particles continuously update their velocities and positions, and the formulas are as follows:
v i d = w l × v i d + c 1 r 1 ( p i d x i d ) + c 2 r 2 ( p g d x i d )
x i d = x i d + v i d
where xid is the particle position, vid is the particle velocity, wl is the weight, c1 and c2 are the learning factors, r1 and r2 are random numbers, and pid and pgd are the optimal positions found. In the calculation process, the dimension is set to 3. The Runge–Kutta method is used to solve the differential equation system, and the least-squares method is used to evaluate the calculation results.

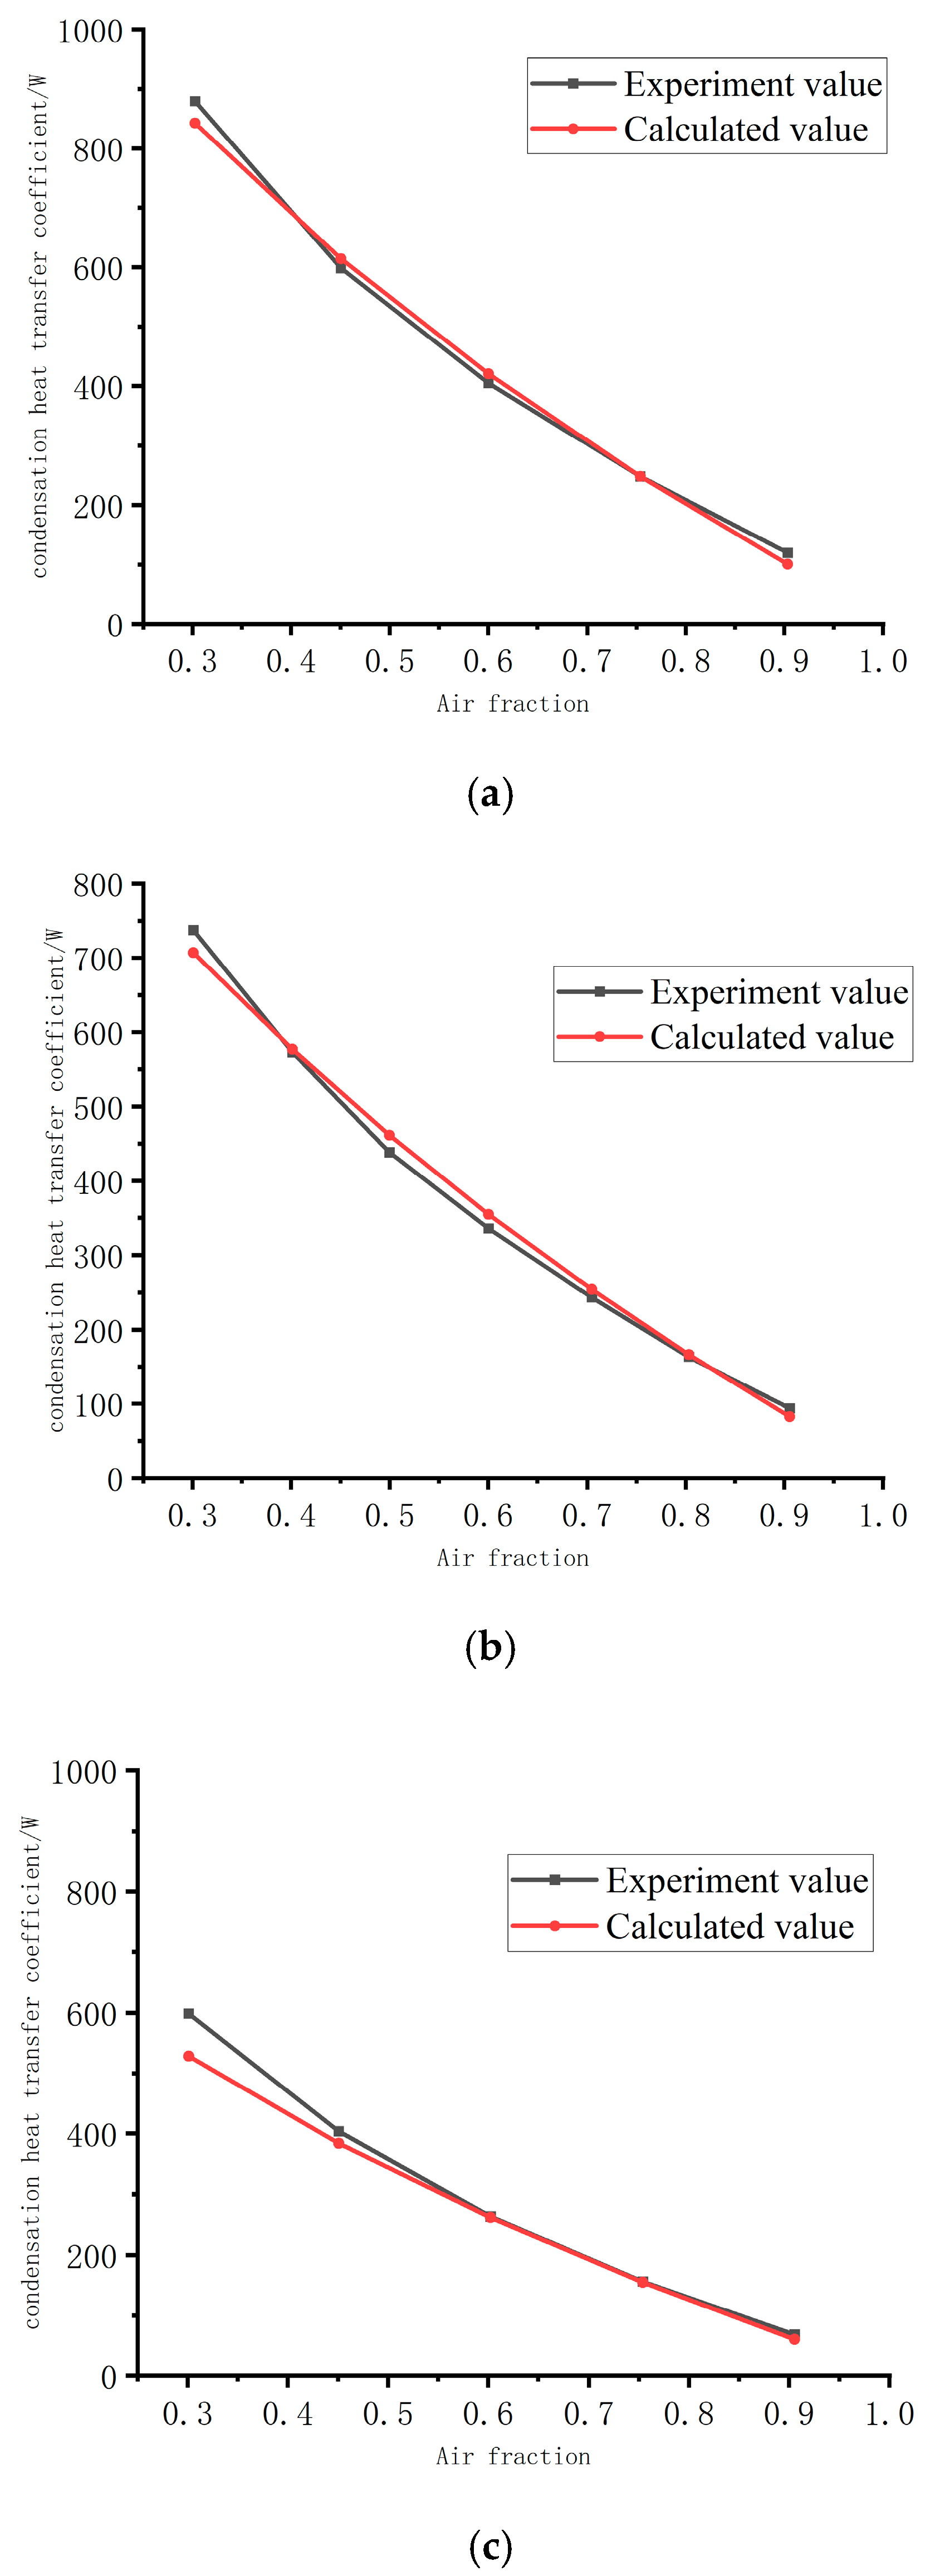
3.2. Experimental Verification

In the model validation section, the particle swarm optimization (PSO) algorithm was first employed to numerically solve the governing equations of momentum, energy and gas mass fraction conservation. This yielded the velocity, temperature, and non-condensable gas concentration profiles at the wall (i.e., η = 0), along with their corresponding gradients at the wall. By utilizing the concentration and temperature profiles, the diffusion-driven condensation rate at the wall was determined. Combining the temperature gradient with the velocity field further enabled the calculation of both the suction-induced condensation rate and the convective heat transfer rate. These components were integrated to derive the overall wall heat transfer coefficient.
The total heat transfer coefficient consists of three parts: the latent heat released by the condensation of diffused steam h1, the latent heat released by the condensation of sucked-in steam h2, and the convective heat transfer of the mixed gas h3. The expressions of these three components are as follows:
h 1 = k c c v b c v w h f g M v T b T w
h 2 = 2 2 ν G r 1 / 4 f 0 M v h f g c w x T b T w
h 3 = 4 N u x k 3 x
where k is the thermal conductivity, hfg is the latent heat of vaporization, N u x = θ 0 G r x 4 1 / 4 , and its average value in the x-direction is N u L = 4 3 N u x . The total heat transfer coefficient is as follows:
h t = h 1 + h 2 + h 3
There is relatively little publicly available experimental data on natural-convection laminar condensation heat transfer on vertical walls. In this paper, the MIT experimental data are used for comparison and verification.
The numerical model validation employs the benchmark experimental data published by Dehbi et al. at MIT in 1991, which systematically investigated steam condensation in the presence of non-condensable gases (air/helium mixtures) under natural convection. The experimental setup consists of a vertically oriented copper tube (length = 3.5 m, outer diameter = 60.3 mm, wall thickness = 3.2 mm) operating at pressures spanning 1.5–4.5 bar, with non-condensable gas mass fractions of 25–90% for air and 1.7–8.3% for helium. Wall subcooling temperatures were maintained between 15 and 50 °C. Raw data were processed using a second-order Butterworth low-pass filter to eliminate pump-induced mechanical noise, while wall heat losses were corrected via a pre-calibrated empirical correlation derived from isothermal reference tests. The expanded uncertainty (k = 2) in reported condensation heat transfer coefficients was quantified as ±6.5% through Monte Carlo propagation analysis, covering laminar (Gr = 5 × 10⁶) to turbulent (Gr = 3 × 10⁹) regimes. All the validation cases in this work fall within the 95% confidence intervals of the Dehbi dataset, thereby ensuring statistical robustness of the model-experiment agreement.
The selected experimental pressures are 1.5 atm, 3 atm, and 4.5 atm, and the wall sub-cooling is 50 °C. The average heat transfer coefficient is measured after changing the air mass fraction in the mixed gas. The comparison between the calculated values and the experimental values is shown in Figure 2.
Considering the influence of sub-cooling, using Dehbi’s experiment for comparison, five different working conditions are selected, and the sub-cooling range is from 14.4 °C to 36 °C. Because the experimental data do not have a fixed air-mass percentage, these five working conditions include two variables: sub-cooling and air-mass percentage. The heat transfer coefficient varies significantly, which allows for the verification of the influence of sub-cooling. The selected experimental data and their errors compared with the calculated values are shown in Table 4.
Although the predicted condensation rates in most cases show extremely high computational accuracy with errors within ±3% compared to experimental data, the local deviation of 15.5% still requires further investigation. Possible sources of error include (1) limitations of the conventional Fick’s diffusion model under high-concentration non-condensable gas conditions; (2) the experimental error itself reaching 15%.

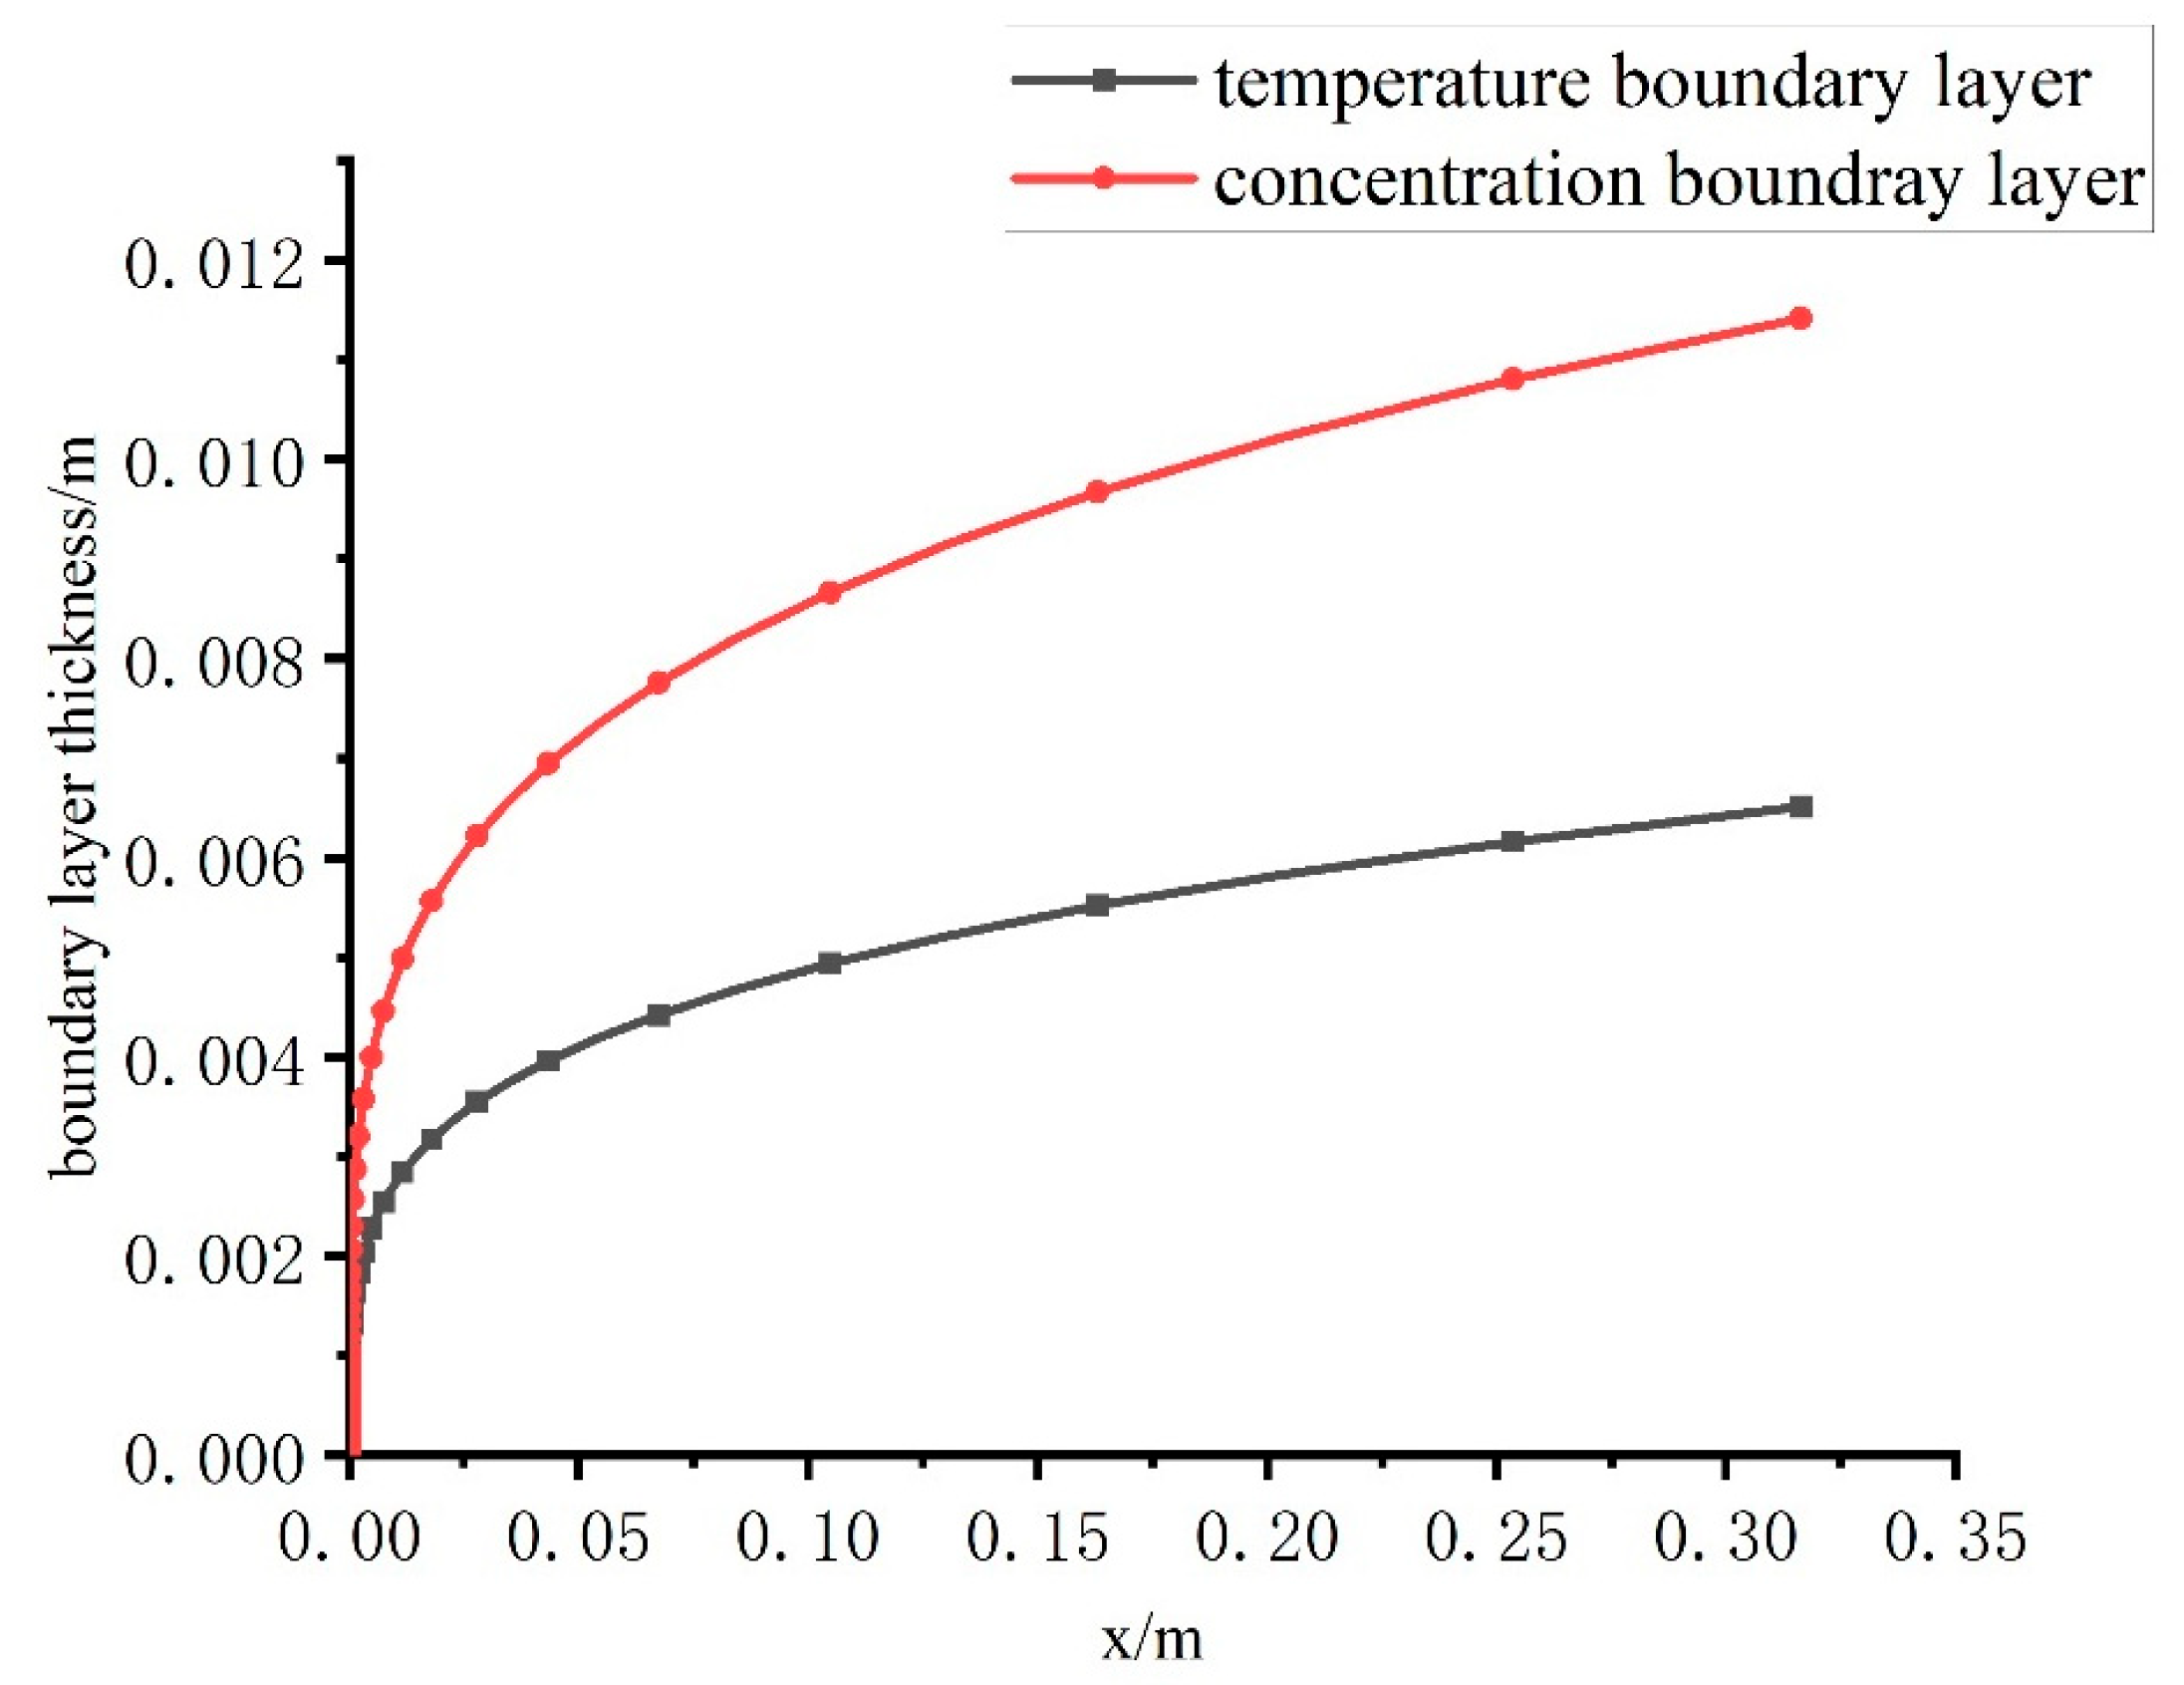
4. Analysis of Boundary-Layer Characteristics

Taking the wall temperature of 40 °C, pressure of 2 atm, and air-mass fraction of 0.62 as an example, the characteristics of the temperature, concentration, and velocity boundary layers are analyzed. The variation trends of f’(η), γ(η), and θ(η) with η are shown in Figure 3. When x is fixed, η y . From Equation (7), u f η , so f’(η) intuitively reflects the transverse velocity distribution of the mixed gas at the wall. At the wall, due to the dragging effect of the liquid film, f’(η) is not zero, and f 0 max f η . It can be seen that when the concentration of non-condensable gases is not too low, the liquid-film flow velocity is low, the thickness is small, and the influence on the gas-side flow and heat transfer is not significant. In the boundary layer, because the fluid temperature is lower, the air-mass fraction is higher, and the density is greater than that in the mainstream region, under the action of gravity, the fluid flows downward along the vertical direction. This process is similar to the natural-convection process without phase change, and the main difference lies in the change in the transverse velocity caused by the suction effect.
Figure 3 illustrates the variations in the dimensionless velocity profile f′(η), temperature boundary layer θ(η), and concentration boundary layer γ(η) with the similarity variable η. The velocity boundary layer exhibits significant non-linear characteristics: near the wall (η < 1.0), the velocity increases rapidly with η, reaches a peak at η ≈ 1.0, and then slowly decays to zero in the mainstream region. This phenomenon arises from the combined effects of dual driving forces: the initial velocity induced by the liquid film drag effect near the wall, and the natural convection acceleration caused by temperature-concentration gradient coupling. Notably, the peak velocity position is closer to the wall compared to classical natural convection boundary layers, indicating that the suction effect compresses the velocity boundary layer by approximately 15%.
Figure 4 demonstrates similar but asynchronous decay trends of the temperature and concentration boundary layers. At η = 0, the temperature gradient is significantly steeper than the concentration gradient, suggesting that heat conduction at the wall is stronger than mass diffusion. However, as η increases, the temperature boundary layer approaches the mainstream value faster than the concentration boundary layer. This discrepancy is primarily attributed to the difference in the Prandtl number (Pr ≈ 0.72) and Schmidt number (Sc ≈ 0.61): since Pr > Sc, heat transfer via molecular diffusion is less efficient than mass diffusion, resulting in a thinner but steeper temperature boundary layer.
Next, we analyze the variation law of the boundary layer along the x-direction. The characteristics of the boundary layer determine that the distribution of cross-section parameters along the flow direction is similar, leading to a similarity solution. Assuming that the fluid parameters reach 99% of the mainstream region as the boundary-layer interface, Figure 3 shows that a fixed value of η corresponds to the interface, from which the thickness of the gas boundary layer can be determined as follows:
δ g = x η 0.99 G r x / 4 1 / 4 x 1 / 4
At x = 0.3 m, the calculated local Gr is approximately 9.4 × 10⁸, which belongs to laminar flow, and the local Nu is approximately 87.6. Figure 5 shows the variation trend of the thickness of the mixed-gas boundary layer along the x-direction. Its thickness is in the order of millimeters to centimeters, much larger than the thickness of the condensate liquid film. The variation trends of the flow velocities of the mixed gas at positions of 0.1 m, 0.2 m, and 0.3 m are selected, respectively, as shown in Figure 6. The overall flow velocity gradually increases along the x-direction, and the position of the maximum velocity gradually shifts in the positive y-direction, which is a direct manifestation of the gradual increase in the boundary-layer thickness.

5. Conclusions

During the condensation process of steam containing non-condensable gases on a vertical wall, the temperature and steam mass fraction at the wall are lower than those in the mainstream region, and the density is higher. Under the action of gravity, the mixed-gas flow forms a natural-convection boundary layer. The characteristics of the boundary layer can be determined by solving a system of differential equations for momentum, energy, and component transfer. After considering the liquid-film drag and wall-suction effects, a similarity solution of the equation system can still be found, simplifying the equation form. The particle swarm optimization algorithm can handle the issue of infinite boundary conditions. The calculation results are in good agreement with the experimental values. When the concentration of non-condensable gases is not too low, the thin condensate liquid film and low surface flow velocity result in a weak dragging effect on the gas side. Generally, the temperature boundary layer and the concentration boundary layer do not overlap, and the difference in their thicknesses mainly depends on the relative magnitudes of Pr and Sc. Along the flow direction, the thicknesses of the temperature and concentration boundary layers are proportional to x1/4, much larger than the thickness of the condensate liquid film, in the order of millimeters or centimeters. The maximum flow velocity gradually increases, and the position of the maximum velocity gradually shifts in the positive y-direction.
The research results are directly applied to the optimal design of passive containment cooling systems for third-generation nuclear power plants. Traditional empirical correlations (such as the Uchida model) exhibit prediction deviations exceeding 30% under off-design conditions, whereas the proposed model, through analyzing the transport competition mechanism between steam and air within the boundary layer, enables precise prediction of condensation heat sink capacity under extreme accident scenarios (e.g., Loss of Coolant Accident, LOCA). At a typical containment pressure of 3 atm with 60% air content, the Nu number calculated by the model demonstrates a 95% agreement with MIT experimental data, showing a 20% improvement in accuracy compared to Herranz’s heat and mass transfer analogy method.

Author Contributions

Conceptualization, Y.C.; data curation, Y.Z.; formal analysis, J.L.; funding acquisition, H.X.; investigation, Y.C. and W.W.; methodology, H.G.; project administration, Y.C.; resources, H.G. and H.X.; software, J.L.; supervision, Y.Z.; validation, W.W.; visualization, H.G.; writing—original draft, J.L.; writing—review and editing, Y.Z. All authors have read and agreed to the published version of the manuscript.

Funding

This work is supported by the following sources the National Natural Science Foundation of China (No. 12102474) and an important research project (No. 2023-173ZD-135).

Data Availability Statement

The original contributions presented in this study are included in the article. Further inquiries can be directed to the corresponding author.

Conflicts of Interest

The authors declare that they have no known competing financial interests or personal relationships that could have appeared to influence the work reported in this paper.

Nomenclature

Main Terms
TermDefinition
Boundary LayerThin fluid region near walls with significant gradients in velocity, temperature, or concentration.
Suction EffectEnhanced mass transfer phenomenon where condensation-induced pressure drop drives gas–vapor mixtures toward walls.
Liquid Film Drag EffectViscous interaction between condensate film flow and gas boundary layer, altering gas-phase velocity distribution.
Similarity TheoryAnalytical method converting partial differential equations to ordinary differential equations via similarity variables for boundary layer problems.
Particle swarm optimization (PSO)Bio-inspired optimization algorithm mimicking bird flocking behavior, used to solve differential equations with infinite boundary conditions.
Mathematical Symbols
SymbolDefinition
ηSimilarity variable representing dimensionless normal coordinate in boundary layers.
θ(η)Dimensionless temperature profile: θ = t η t b t w t b .
γ(η)Dimensionless concentration profile: γ = c v η c v b c v w c v b .
f(η)Dimensionless stream function describing velocity boundary layer characteristics.
Abbreviations
PSOParticle swarm optimization
Dimensionless Numbers
SymbolNamePhysical Meaning
GrGrashof NumberBuoyancy-to-viscous force ratio, characterizing natural convection intensity: G r x = g Δ ρ x 3 ρ ν 2 .
PrPrandtl NumberMomentum-to-thermal diffusivity ratio: Pr = ν/α, reflecting fluid heat transfer properties.
ScSchmidt NumberMomentum-to-mass diffusivity ratio: Sc = ν/D, reflecting fluid mass transfer characteristics.
NuNusselt NumberConvective-to-conductive heat transfer ratio: N u x = h x k .
ShSherwood NumberConvective-to-diffusive mass transfer ratio: S h x = k c x D .

References

  1. Wang, L.; Sundén, B.; Manglik, R.M. Enhanced Heat Transfer in Forced Convection Laminar Flow through Microfin Tubes. J. Heat Transf. 2021, 143, 071801. [Google Scholar]
  2. Xu, H.; Gu, H.; Sun, Z. Forced convection condensation of steam in the presence of multicomponent noncondensable gases inside a horizontal tube. Int. J. Heat Mass Transf. 2017, 104, 1110–1119. [Google Scholar]
  3. Muñoz-Cobo, J.L.; Chiva, S.; Corberán, J.M.; Escriva, A. Interaction between natural convection and condensation heat transfer in the passive containment cooling condensers of the ESBWR reactor. Ann. Nucl. Energy 1999, 26, 277–300. [Google Scholar]
  4. Senjaya, R.; Inoue, T. Effects of non-condensable gas on the performance of oscillating heat pipe, part I: Theoretical study. Appl. Therm. Eng. 2014, 73, 1387–1392. [Google Scholar]
  5. Kang, J.; Kim, H.; Bak, J.; Lim, S.-G.; Yun, B. Condensation of steam mixed with non-condensable gas on vertical heat exchanger tubes in circumstances with free convection. Int. J. Heat Mass Transf. 2021, 169, 120925. [Google Scholar]
  6. Kim, S.; Mudawar, I.; Kizito, J.P. Condensation heat transfer on downward-facing flat surfaces subjected to natural convection-driven flow. Int. J. Heat Mass Transf. 2022, 183, 122163. [Google Scholar]
  7. Zhang, T.-Y.; Mou, L.-W.; Zhang, J.-Y.; Fan, L.-W.; Li, J.-Q. A visualized study of enhanced steam condensation heat transfer on a honeycomb-like microporous superhydrophobic surface in the presence of a non-condensable gas. Int. J. Heat Mass Transf. 2020, 150, 119352. [Google Scholar]
  8. Uchida, H.; Oyama, A.; Togo, Y. Evaluation of Post-incident Cooling Systems of Light-Water Power Reactors. In Proceedings of the Third International Conference on the Peaceful Uses of Atomic Energy, Geneva, Switzerland, 31 August–9 September 1964; Volume 13, pp. 93–104. [Google Scholar]
  9. Tagami, T. Interim Report on Safety Assessments and Facilities Establishment Project for June 1965; Japanese Atomic Energy Research Agency: Tōkai Mura, Japan, 1965.
  10. Dehbi, A.A. The Effects of Noncondensable Gases on Steam Condensation Under Turbulent Natural Convection Conditions; Massachusetts Institute of Technology: Cambridge, MA, USA, 1991. [Google Scholar]
  11. Seungmin, O.; Shripad, T. Revankar. Experimental and theoretical investigation of film condensation with noncondensable gas. Int. J. Heat Mass Transf. 2006, 49, 2523–2534. [Google Scholar]
  12. Lee, K.-Y.; Kim, M.H. Experimental and empirical study of steam condensation heat transfer with a noncondensable gas in a small-diameter vertical tube. Nucl. Eng. Des. 2008, 238, 207–216. [Google Scholar]
  13. Su, J.; Sun, Z.; Fan, G.; Ding, M. Experimental study of the effect of non-condensable gases on steam condensation over a vertical tube external surface. Nucl. Eng. Des. 2013, 262, 201–208. [Google Scholar] [CrossRef]
  14. Gu, H.F.; Chen, Q.; Wang, H.J.; Zhang, H.Q. Condensation of a hydrocarbon in the presence of a non-condensable gas: Heat and mass transfer. Appl. Therm. Eng. 2015, 91, 938–945. [Google Scholar]
  15. Chen, J.; Gao, P.; Gu, H.; Chen, Y.; Xinnuo, E.; Yu, J. Experimental study of the natural deposition of submicron aerosols on the surface of a vertical circular tube with non-condensable gases. Nucl. Eng. Des. 2024, 417, 112863. [Google Scholar] [CrossRef]
  16. Lee, J.; Park, H.; Kim, M.H. Modified heat and mass transfer analogy for turbulent condensation with non-condensable gases under high-pressure conditions. Int. J. Heat Mass Transf. 2021, 165, 120678. [Google Scholar]
  17. Kim, J.-W.; Lee, Y.-G.; Ahn, H.-K.; Park, G.-C. Condensation heat transfer characteristic in the presence of noncondensable gas on natural convection at high pressure. Nucl. Eng. Des. 2009, 239, 688–698. [Google Scholar]
  18. Peterson, P.F. Theoretical basis for the Uchida correlation for condensation in reactor containments. Nucl. Eng. Des. 1996, 162, 301–306. [Google Scholar]
  19. Liao, Y.; Vierow, K. A Generalized Diffusion Layer Model for Condensation of Vapor with Noncondensable Gases. J. Heat Transf. 2007, 129, 988–994. [Google Scholar]
  20. Hwang, J.-H.; Jerng, D.-W. A condensation heat transfer model with light gas effects in non-condensable gas mixtures. Int. Commun. Heat Mass Transf. 2022, 130, 105765. [Google Scholar]
  21. Lu, J.; Cao, H.; Li, J. Diffusion layer model for condensation of vapor with the presence of noncondensable gas under natural convective condensation. Prog. Nucl. Energy 2020, 118, 103078. [Google Scholar]
  22. Sparrow, E.M.; Lin, S.H. Condensation Heat Transfer in the Presence of a Noncondensable Gas. J. Heat Transf. 1964, 86, 430–436. [Google Scholar]
  23. Oh, S.; Revankar, S.T. Quantitative analysis of gas-side resistance dominance in steam condensation with air under natural convection. Appl. Therm. Eng. 2019, 157, 113696. [Google Scholar]
  24. Zhang, Y.; Liu, C.; Chen, Q. Dominance of gas-phase resistance in condensation with non-condensable gases: A CFD study based on species transport model. Int. J. Heat Mass Transf. 2020, 153, 119563. [Google Scholar]
  25. Welty, J.R.; Charles, E.W.; Robert, E.W.; Gregory, L.R. Fundamentals of Momentum, Heat, and Mass Transfer, 4th ed; John Wiley & Sons: Hoboken, NJ, USA, 2001. [Google Scholar]
  26. Peterson, P.F. Diffusion Layer Theory for Turbulent Vapor Condensation with Non-condensable Gases. J. Heat Transf. 1993, 115, 998–1003. [Google Scholar] [CrossRef]
Figure 1. The boundary layer of gas flow near the wall.
Processes 13 01050 g001
Figure 2. Comparison between calculated values and experimental values. (a) 1.5 atm; (b) 3 atm; (c) 4.5 atm.
Processes 13 01050 g002
Figure 3. Variation in f′(η), θ(η) and γ(η) with η.
Processes 13 01050 g003
Figure 4. Variation in θ’(η) and γ’(η) with η.
Processes 13 01050 g004
Figure 5. Variation in boundary-layer thickness along the x-direction.
Processes 13 01050 g005
Figure 6. Comparison of mixed-gas flow velocities at different positions.
Processes 13 01050 g006
Table 1. The comparison between this work and previous work.
Researcher
and Reference
Solution MethodConsidered FactorsBoundary Condition TreatmentSolution Technique
Sparrow & Lin (1964) [22]Similarity theoryTemperature gradient drivenNo suction effectAnalytical integration
Peterson (1996) [18]Heat-mass transfer analogyDominant concentration diffusionSimplified suction velocityFinite difference
Liao et al. (2007) [19]Integral approximationLiquid film drag effectFixed interface velocityIterative method
Lu (2020) [21]Modified similarity solutionSuction effect correctionEmpirical correlationsShooting method
This workSimilarity theory +
PSO algorithm
Dual driving forces (temperature and concentration), coupled suction–drag effectsAsymmetric boundary conditionsParticle swarm optimization
Table 2. Boundary conditions for natural-convection heat transfer without condensation.
ConditionBoundary Conditions
When η = 0f = f′ = 0, θ = 1, γ = 1
When η f = 0 , θ = 0 , γ = 0
Table 3. Boundary conditions for natural-convection heat transfer with condensation.
ConditionBoundary Conditions
When η = 0f = f (0), f′ = f ′(0), θ = 1, γ = 1
When η→∞f′ = 0, θ = 0, γ = 0
Table 4. Comparison between experimental and calculated values under various sub-cooling conditions.
Data PointSub-Cooling (°C)Air-Mass FractionHeat Transfer Coefficient
(Experimental Value) [W/(m2·K)]
Calculated Relative Error
114.40.30610411.1%
220.40.5215502.13%
326.50.3498011.6%
431.10.618323−2.2%
5360.862148−15.5%
Disclaimer/Publisher’s Note: The statements, opinions and data contained in all publications are solely those of the individual author(s) and contributor(s) and not of MDPI and/or the editor(s). MDPI and/or the editor(s) disclaim responsibility for any injury to people or property resulting from any ideas, methods, instructions or products referred to in the content.

