Abstract
Horizontal and multilateral well EGSs can potentially achieve the high-heat extraction of HDR. Herein, the performance of a multilateral horizontal well system in geothermal exploitation was investigated based on the geothermal and geological conditions of Qiabuqia geothermal field. The target reservoir is a granitic basement at 2650–3650 m depth, with initial temperatures of 151–190 °C. The simulation results indicate that the initial production temperature and electric power reached 178.4 °C and 2.90 MW and decreased by 8.3% and 17.9% over 20 years of production under the scheme of injecting 60 °C cold water at 50 kg/s, respectively. The reduction in total greenhouse gas (GHG) emissions amounts to 0.15–0.51 Mt relative to a fossil fuel plant. The multilateral horizontal well EGS outperforms conventional double vertical wells in terms of production temperature and electric power generation. The heat production efficiency of the multilateral horizontal well is significantly influenced by well depth and the arrangement of branch wells. Reservoir stimulation can effectively reduce flow impedance and improve the system economy. The multilateral horizontal well system is a promising development scheme for geothermal exploitation in Qiabuqia geothermal field.
1. Introduction
Geothermal energy serves as a low-carbon, renewable alternative to fossil fuels like coal, oil, and natural gas [1]. Unlike solar or wind energy, it harnesses the consistent heat from the Earth’s interior, making it a stable and weather-independent energy source. Geothermal resources can be categorized into hydrothermal and hot dry rock (HDR) types based on their origins and storage conditions. Among them, the reserves of HDR resources are of a great quantity, and their distribution is not limited by region. An evaluation [2] revealed that China’s HDR resources at a depth of 3–10 km amount to 2.09 × 10⁷ EJ. The recovered energy could amount to approximately 2503 times the annual energy consumption of China in 2022, even with a recovery ratio of 2% [2].
However, effectively exploiting heat from HDR is challenging due to its deep burial and typically low permeability, which restricts fluid circulation and heat transfer. The Enhanced Geothermal System (EGS) could enhance reservoir permeability and boost thermal energy extraction. The EGS creates an artificial fracture network using hydraulic fracturing techniques, and then an artificial thermal reservoir (also called the stimulated reservoir volume, SRV) with high permeable fractures for fluid and heat transport is formed. The first application of EGS technology was in the early 1970s in Fenton Hill, United States, where it was successfully implemented in HDR reservoirs. Over the last several decades, extensive field trials for EGS have been conducted in various locations, including Soultz in France, Hijiori in Japan, and the Cooper Basin in Australia [3]. In these traditional EGS projects, two wells—either vertical or directional—were drilled: one for fluid injection and the other for production. An artificial fractured reservoir was then established through hydraulic fracturing techniques to enhance heat extraction.
However, the high drilling cost and the technical difficulty of the hydraulic fracturing of the artificial thermal reservoir restrict the commercial mining of EGS. Drilling a single vertical wellbore to a depth of 4500–5000 m incurs costs of approximately USD 13–15 million, accounting for over 50% of the total project cost [4]. A large number of artificial thermal reservoir construction experiments have shown that the generation of artificial fracture networks depends on the original in situ stress and existing fracture system [3]. The geological characteristics and the physical properties of reservoir rock significantly impact the reservoir hydraulic fracturing results and thus the inter-well connectivity. Reservoir stimulation experiments in different geothermal fields take place under specific geological conditions [3,5]. Besides reservoir stimulation, the well layout plays a vital role in enhancing the exploitation efficiency of HDR geothermal resources.
Horizontal well and multilateral well HDR mining schemes have been proposed. For horizontal and multilateral wells, only one main vertical wellbore is drilled and branches out into injection and production wellbores at different depths, which could significantly reduce the drilling cost of vertical wellbores compared with the conventional doublet-well. Moreover, multilateral wells could increase the contact area of the wellbore and HDR and reduce the flow impedance and pump power consumption, thereby improving the injectivity and productivity. Unlike single horizontal wells, multilateral horizontal wells enable three-dimensional (3D) development and achieve higher production efficiency. These advantages have led to their extensive adoption in the petroleum sector [6,7,8,9] and unconventional energy extraction [10,11,12,13,14]. Currently, numerous field applications for multilateral wells have been reported in the petroleum industry [7,15], and their application in Klaipėda geothermal field greatly improved injectivity [16]. Meanwhile, many numerical simulation studies have been carried out in terms of geothermal development with horizontal and multilateral wells. Xie et al. [17] introduced a pinnate horizontal well system to investigate how operational well structure impacts heat extraction performance, taking into account the THM coupling process. The results indicated that the pinnate horizontal well system significantly outperforms the conventional doublet system in terms of heat extraction efficiency. Recently, a new type of EGS featuring multilateral wells has been proposed [18]. The findings suggest that compared to conventional double vertical wells, the multilateral well EGS achieves a higher output thermal power, production temperature, heat extraction ratio, and accumulative thermal energy. Zhang et al. [19] developed a comprehensive model for a multilateral well EGS to investigate complex fracture propagation and thermal energy production. The results indicated that the stimulated reservoir permeability and connectivity, as well as the extracted thermal power in multilateral well configurations, were significantly higher (approximately one order of magnitude) than those in conventional vertical well EGS. Utilizing the established THM-D coupling model, the study investigated the fracture propagation mechanisms in multi-branch radial wells under the combined effects of low-temperature-induced thermal stress and stress induced by radial wells [20]. The findings revealed that a smaller radial well angle in the multi-branch radial well system could create a more extensive fracture network, thereby expanding the scope of heat extraction during the heat mining phase. Hence, the horizontal and multilateral well EGS were considered promising for achieving high heat extraction efficiency in HDR development.
This paper proposes a novel multilateral horizontal well system for HDR reservoirs based on the geothermal and geological conditions of Qiabuqia geothermal field. The multilateral horizontal well system consists of two horizontal wells (with several branches), with one for injection and another for production. The production characteristics of the novel multilateral horizontal well system are examined. Following this, a comparison is made between the heat extraction performance of the multilateral horizontal well and that of several conventional double-well configurations. The sensitivity of the production criteria to the multilateral well designs (well depth, well angle, branch spacing, and branch setting) are analyzed. The impact of reservoir stimulation on production performance is discussed. The economic and environmental benefits of system development are analyzed and evaluated.
2. Characteristics of the Research Field
The Gonghe Basin is a rhombic intermountain basin extending roughly in the NWW direction, located between the Kunlun and Qinling Mountains. The Gonghe Basin comprises several key geological features, including the Tanggemu Depression, Guinan Depression, Guide Depression, Qijia Uplift, and Yellow River Uplift (Figure 1a) [21]. The Qiabuqia geothermal field is positioned in the transitional zone between the Yellow River Uplift and the Tanggemu Depression. The average geothermal gradient in the granitic formation exceeds 40 °C/km [22]. This high geothermal gradient is likely due to the combined influence of the high regional heat flow background of the northeastern Tibetan Plateau and the cooling effects of a shallow magma chamber [23].
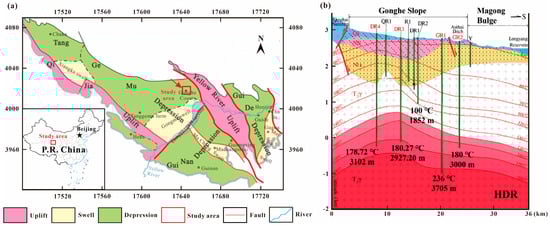
Figure 1.
(a) Geological structure map of the Gonghe Basin and surrounding areas; (b) stratigraphic profile in the Qiabuqia area derived from drilling data.
Since 2013, six deep geothermal boreholes (DR1-4 and GR1-2) have been drilled in the Qiabuqia geothermal field (Figure 1b). Among them, boreholes DR3, DR4, GR1, and GR2 serve as the main exploration wells for HDR geothermal resources (Figure 2). According to drilling records, DR3, DR4, and GR2 reach approximately 180 °C at around a 3000 m depth. Particularly, the GR1 well is the most successful for geothermal drilling and reaches a notable 236 °C at a 3705 m depth [24,25]. The average geothermal gradient of the granitic HDR reservoir is 41.2 ± 2.96 °C/km.
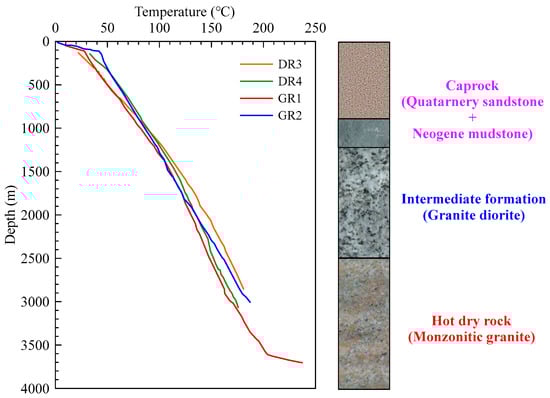
Figure 2.
Temperature profile of DR3, DR4, GR1, and GR2 geothermal wells, along with stratigraphic sections in the Qiabuqia geothermal field [24,25].
Driven by geothermal exploration data, assessments of geothermal exploitation potential in the Gonghe Basin have gained momentum recently. Focusing on the geological characteristics of Qiabuqia area within the Gonghe Basin, Xu et al. [26] proposed a design involving two horizontal wells. Utilizing the Local Thermal Non-Equilibrium (LTNE) theory, they evaluated key parameters such as the production temperature, energy efficiency, and economic and environmental benefits. The simulation results revealed that electric power generation largely hinged on fracture spacing and injection temperature. Additionally, they projected that greenhouse gas (GHG) emissions could be reduced by 0.27 to 0.92 Mt over a 30-year period. A subsequent investigation, incorporating local thermal non-equilibrium theory and the characteristics of natural faults, revealed that a fault–fracture-controlled doublet model is better suited to heat transfer in EGS compared to the conventional doublet model [27]. A performance evaluation for the Qiabuqia geothermal field through multilateral horizontal wells was also carried out, and a sensitivity analysis for parameters that affect heat production was implemented [28]. Zhong et al. [29] compared CO2 and water as a working fluid in long-term heat extraction performance based on the geological conditions of the Gonghe Basin. This study aimed to compare the heat extraction performance of multilateral horizontal wells against several continental doublet well systems, with a particular focus on evaluating the influence of multilateral well design on both heat production performance and economic viability.
3. Model Description
3.1. Model Geometry
A multilateral horizontal EGS was developed for the Qiabuqia geothermal reservoir based on the well log data from GR1. The model consists of a low-permeability HDR layer that encloses a high-permeability SRV (Figure 3a). The simulation domain comprises a cube measuring 1000 m × 1000 m × 1000 m (in the x, y, and z directions) spanning a 2650–3650 m depth, containing a centrally positioned a 500 m × 500 m × 500 m cubic SRV volume within the HDR formation. This configuration effectively minimizes boundary effects during thermal exploitation.
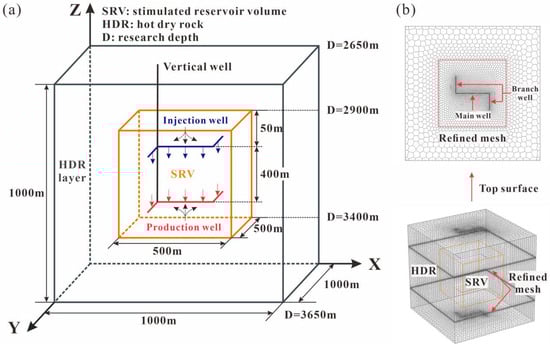
Figure 3.
(a) Schematic of the conceptual domain and (b) the discretization scheme of the base case.
3.2. Computational Model and Grid Discretization
As depicted in Figure 3a, the multilateral well configuration includes one horizontal injection well, one horizontal production well, and several branch wells. The angle between the main horizontal well and the branch well is 90°. The injection and production wells maintain a 400 m vertical spacing, positioned 50 m below the SRV’s upper boundary and 50 m above its lower boundary, respectively. The well radius is 0.1 m for both main and branch wellbores.
Given the significant scale differences among the rock matrix, SRV, and well system, discretizing the multilateral horizontal well system presents a notable challenge. To minimize the number of grid cells while maintaining simulation accuracy, the domain was discretized using an adaptive Voronoi grid system. Local grid refinement was specifically applied to critical regions, including the SRV zone, wellbore vicinities, and the SRV-HDR interfaces (Figure 3b). The system works as follows: The x-y plane is discretized using GMS 10.4 (Groundwater Modeling System) software [30], followed by discretization along the z-axis to form a three-dimensional grid. The grid along the wellbore axis is discretized with a grid size of 5 m. In the x-y plane, the grid size at the boundary of the SRV is 20 m, while the grid size at the boundary of the HDR layer is 50 m. Along the z-axis, the grid size at the interface between the SRV and the HDR layer is 1 m, with the grid size gradually increasing towards the top and bottom of the model, reaching a maximum size of 20 m. The total number of grids along the z-axis is 72. For the base case, each layer contains 3374 mesh elements, resulting in a total mesh count of 242,928. A grid independence test was conducted to ensure that the simulation results were not influenced by the grid resolution, and the selected grid configuration provides a balance between computational efficiency and accuracy.
The TOUGH2-EOS1 codes were adopted to develop mathematical models for geothermal heat flow and mass transfer [31]. TOUGH2-EOS1 is capable of simulating the non-isothermal transport of aqueous and gaseous water based on temperature and pressure conditions. Integral finite difference methods (IFDMs) with an implicit scheme were applied for the spatial–temporal discretion of the simulator. The accuracy of TOUGH2 has been verified through experimental results and analytical solutions, and it is extensively adopted as a computational tool in geothermal heat extraction simulations [5,26,29,32]. For detailed introductions and governing equations, readers should refer to the user manual [31].
3.3. System Properties
The essential geometric configurations and reservoir characteristics are systematically presented in Table 1. Both HDR and SRV reservoirs were assumed to be homogeneous isotropic porous media. Core samples of granitic rocks were obtained from exploratory wells within the Qiabuqia geothermal field for material characterization. The thermal conductivities, densities, and heat capacities of the granite samples from depths of 2900–3400 m were measured [33]. The measured thermal conductivities range from 2.07 to 2.81 W/(m·K), with an arithmetic mean of 2.43 ± 0.38 W/(m·K) [34]. In subsequent simulations, the arithmetical mean thermal conductivity of granite is applied to the HDR layer, while the highest measured value is assigned to the SRV. The porosity of reservoir rock was inferred from logging data [32], while the permeability of the granitic rock matrix was determined using the Three Axis MTS Rock Stiff Test Machine [35].

Table 1.
Geometric configurations and reservoir characteristics of the basic model.
3.4. Initial and Boundary Conditions
The initial temperature distribution in the model is established according to the steady-state temperature profile of well GR1 (Figure 2), as described by Equation (1).
T = 151 °C + 0.0391 °C/m × (−z − 2650) m
Here, 151 °C represents the temperature at the domain’s upper boundary, and the subsurface thermal structure follows a geothermal gradient of 39.1 °C/km; z denotes the depth (m). The temperature–depth relationship is derived using the linear least squares regression method based on measured temperatures from depths of 2650–3650 m.
The initial pressure is computed according to Equation (2).
P = −0.0089 MPa/m × z + 0.072 MPa
For the injection well, warm water at 60 °C was injected at 50 kg/s [36,37]. Meanwhile, the production pressure was maintained at 15 MPa. The lateral, top, and bottom boundaries were positioned sufficiently far from the injection and production wells to minimize boundary effects.
3.5. Simulation Cases
To enhance heat extraction in the Qiabuqia geothermal field, 12 simulation cases were designed and are detailed in Table 2. These scenarios encompass a base case of a 2-branch horizontal well system, 3 classic double-well systems (Cases 1–3), and 11 other deployments of multi-lateral well systems (Cases 4–12). The scenarios of classic double-well systems are designed to verify the reliability and superiority of the 2-branch horizontal well system. Cases 1 and 2 are horizontal double-well EGSs with a well length of 250 m and 500 m, with this length being equal to the length of the horizontal main wellbore and the total length of the multilateral horizontal well of the base case, respectively. Case 3 is a vertical double-well EGS with a well spacing of 400 m and a well length of 500 m, matching the total length of the multilateral wells in the base case. Case 4 reverses the locations of the injection and production wells to examine the impact of well depth on heat extraction performance. The scenarios with the multilateral well system (Cases 5 and 6) were designed to explore the influence of the angle of the main horizontal well on heat extraction. Cases 7 and 8 investigate the effects of branch spacing on heat extraction performance. Cases 9 and 10 focus on the impact of the branch well setting. Similarly, Cases 11 and 12 assess the influence of the SRV volume on heat extraction performance.
Table 2.
Simulation cases.
4. Results and Discussion
4.1. The Base Case
4.1.1. Production Temperature
Figure 4 illustrates the production temperature (Tpro) over a 20-year period, which shows a gradual decline over time. The high-temperature water is initially produced due to the high temperature of rock near the lower production well. As fluid flows from the upper injection well to the lower production well, it is heated by the surrounding rock during the displacement of the hot water. Therefore, the downward fluid cannot attain the initial high temperature of the rock near the production well (Figure 5). As heat extraction progresses, the cold front propagates downward and eventually reaches the production well, causing the production temperature to continue decreasing. According to Garnish et al. [38], for an economically viable EGS, the production temperature (Tpro) should maintain >90% of its initial value over 15–20 years. The simulation result demonstrates an 8.3% Tpro decline over 20 years, indicating that the multilateral well configuration satisfies the thermal sustainability requirements.
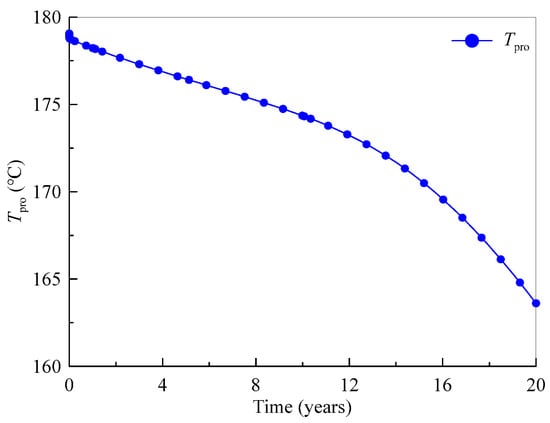
Figure 4.
Production temperature (Tpro) of base case.
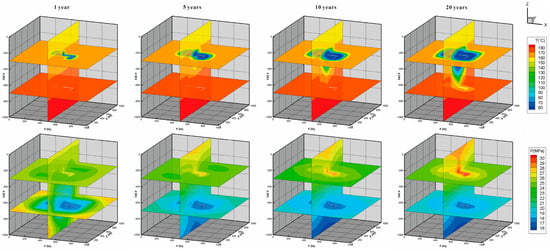
Figure 5.
Contours of reservoir temperature and pressure for the base multilateral horizontal well system.
The pattern of Tpro directly reflects the thermal dynamics within the reservoir. As depicted in Figure 5, the cold plume originates from the injection well and progressively expands over time. Prior to the thermal breakthrough, the temperature near the production wellbore experiences a slight decrease, attributable to the displacement of native geothermal fluids by injected cooler water. The initial water temperature in the inter-well region is lower than that adjacent to the production well. The cold front advances slowly toward the production well, eventually reaching it after approximately 13 years, which triggers a more rapid decline in production temperature (Figure 4). Pressure disturbances propagate faster than thermal fronts, creating a pressure-affected zone that surpasses the temperature-influenced area in spatial extent.
4.1.2. Thermal Production and Electricity Generation
The output thermal power (Wh) of a geothermal extraction system can be quantified through the following thermodynamic relationship:
Here, Tinj represents the injection water temperature (60 °C), and cp,f denotes the specific heat capacity of water. The variation in cp,f is neglected, and an average value of 4200 J/(kg·K) is used.
With an injection temperature of 60 °C, the electric power (We) is calculated as follows:
In this equation, Trej is the heat rejection temperature of the water, and the ratio (Trej/Tpro) is computed using absolute temperature. Given that the mean annual temperature in the Gonghe Basin is 4.1 °C [39], the heat rejection temperature is set at 277.25 K. With the coefficient of 0.3, the calculated conversion rate is 11–12%. This ensures that the influence of We on all sensitivity and economic analyses is controlled within a reasonable range.
The output thermal power (Wh) and electric power (We) are depicted in Figure 6. The trends in Wh and We mirror the changes in production temperature (Tpro). Wh drops from 25.00 MW to 21.76 MW (a reduction of 13.0%), and We declines from 2.90 MW to 2.38 MW (a decrease of 17.9%) within 20 years.
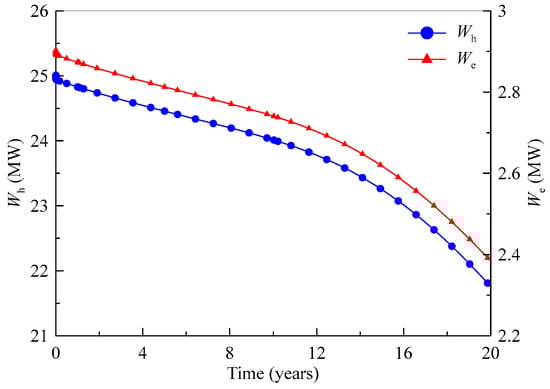
Figure 6.
Trends in output thermal power (Wh) and electric power (We).
4.1.3. Injection Pressure and Flow Impedance
The flow impedance IR, a crucial operational parameter for EGS, indicates the power consumption required per unit production rate to penetrate the reservoir, as defined by [40,41].
Here, the production pressure is maintained at 15 MPa. The pressure near the injection well fluctuates due to the continuous injection of cold water at a rate of 50 kg/s, which in turn increases the flow impedance (IR).
Figure 7 shows the injection pressure (Pinj) and flow impedance (IR) over a 20-year period. The Pinj rises significantly from 25.4 to 30.7 MPa. Correspondingly, IR increases from 0.207 to 0.313 MPa/(kg/s). The gradual increase in IR is primarily driven by the growing pressure differential and the rising fluid viscosity resulting from reservoir cooling (Figure 5). These findings align with previous studies [26,41,42]. For an economically viable EGS project, IR is typically expected to remain within the range of 0.1–0.2 MPa/(kg/s) throughout the operation lifespan [26,40]. The simulated IR here is out of the range of the economic IR. However, since water loss and fracturing effects are not accounted for in this analysis, the calculated IR may be somewhat higher than the reality.
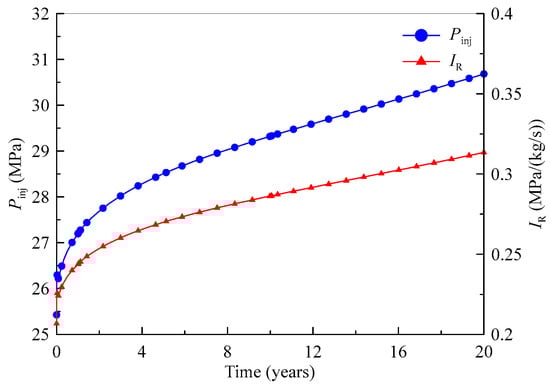
Figure 7.
Trends in injection pressure (Pinj) and flow impedance (IR).
4.1.4. Energy Efficiency
The system’s energy efficiency (η) is characterized as the ratio of total thermal energy produced to the internal energy consumed. The internal energy consumption Wp = Wp,inj + Wp,pro primarily consists of the energy used by the injection pump (Wp,inj) and the production pump (Wp,pro):
Here, hinj = 2950 m and hpro = 3350 m, with a pump efficiency (ηp) of 80%. For simplicity, the variation in fluid density (ρ) is neglected, with an average value of 914 kg/m3 used throughout the calculations. The heat energy efficiency (ηh) is determined using Equation (8), while the electric energy efficiency (ηe) is determined through Equation (9):
The energy efficiency (ηh) and electric energy efficiency (ηe) are depicted in Figure 8. In the first year, both ηh and ηe experience a sharp decline due to the substantial increase in injection pressure (Figure 7). Over the entire production period, ηh decreases from 26.1 to 16.5, and ηe decreases from 2.9 to 1.8. The continuous reduction in ηh indicates that the cost associated with internal energy consumption increases throughout the operational period. This decline is primarily driven by the reduction in Tpro (Figure 4) and the increase in Pinj (Figure 7). For a typical two-horizontal-well system, the ideal energy efficiency is 17.2–50.0 [43]. However, the base multilateral horizontal well achieves an ηe of only 1.8–2.9, indicating that the designed system cannot meet the industry standards from the point of view of energy efficiency.
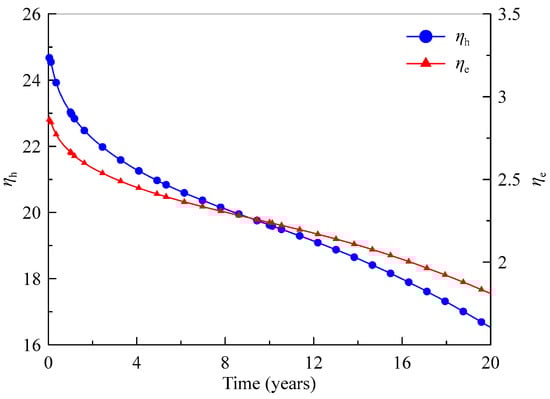
Figure 8.
Trends in heat energy efficiency (ηh) and electric energy efficiency (ηe).
4.1.5. Economic Assessment and Environmental Benefits
The expenses associated with a geothermal project typically include drilling, surface installation, operation, and maintenance. Specifically, the drilling costs (Cd) for implementing a multilateral horizontal well system can be estimated using the following equation [44].
Here, Hv represents the depth of the vertical wellbore, Hh is the length of the horizontal wellbore, and Pv and Ph are the drilling costs per meter for vertical and horizontal wellbores, respectively [45]. For the base case of a multilateral horizontal well, Hv = 3650 m, Hh = 1000 m, Pv = USD 1100/m, and Ph = USD 3300/m. Based on these values, the total drilling costs amount to approximately USD 7.315 million.
The costs of surface installation (Cs) are directly proportional to the size of the power plant. It is anticipated that the unit capital cost will decrease at an exponential rate as the plant’s capacity increases [26,46]. Given that the simulated We decreases from 2.90 MW to 2.38 MW over 20 years, a designing capacity (We,d) of 2.7 MW is deemed appropriate for the proposed EGS project. Based on this capacity, the unit capital cost is assumed to be 2000 USD/kW [45,46], resulting in a total surface installation cost of approximately USD 5.4 million.
The costs for operation and maintenance include internal energy consumption (Wp) and additional expenses such as personnel wages and insurance. The accumulative energy consumption of pumps (γp) is expressed as
Figure 9 illustrates the evolution of Wp and γp for the two pumps. The pumps consume a total energy (γp) of approximately 212.84 GWh. Other operational costs (Co) are estimated to be around USD 2.0 million [26].
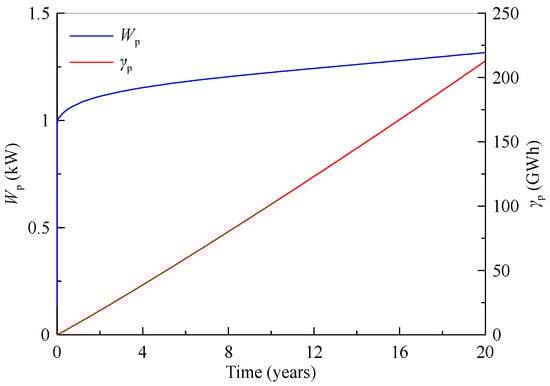
Figure 9.
Trends in internal energy consumption (Wp) and the accumulated energy consumption of pumps (γp).
Based on the calculations above, the total costs associated with the multilateral horizontal well system amount to approximately USD 14.715 million. According to a We,d of 2.7 MW, the base case generates around 432.48 GWh of electricity over a 20-year period. In addition, the levelized cost of energy (LCOE), which is calculated by dividing the total costs by the total power generation, is approximately 0.062 USD/kWh.
The average GHG emissions from the geothermal power plant amount to roughly 122 g/kWh [47], marking a substantial reduction compared to fossil fuels [47,48] (ranging from 460 to 1290 g/kWh [26]). Consequently, the GHG emissions reduction for geothermal power plants is 338–1168 g/kWh. Over 20 years, the proposed EGS power plant is projected to curtail 0.15–0.51 Mt of GHG emissions. Considering the 2018 carbon emission trading prices of 8.46–9.23 USD/t in a Beijing pilot [49], the estimated revenue from these emissions savings is approximately USD 1.27–4.71 million.
4.2. Comparisons of Base Case and Cases of Classic Double-Well EGS
Figure 10 depicts the Tpro, We, IR, and ηe of the base case and the cases of classic double-well EGS. As depicted in Figure 10a, the production temperature (Tpro) of the double horizontal well (Cases 1 and 2) exhibits a gradual decline over time. In contrast, for the double vertical well (Case 3), Tpro initially rises slightly in the first 10 years before decreasing over time. Meanwhile, the Tpro of the base case is higher than Case 3. The temperature drop in Case 1 occurs earlier than that in the base case, primarily due to the reduced heat transfer area resulting from the short wellbore length. The temperature profile of the base case aligns with that of Case 2 owing to the identical total well length. The temporal variation in electric power mirrors the trend observed in production temperature (Figure 10b). Figure 10c illustrates that the IR of the vertical well case is significantly lower than that of the horizontal well cases. This occurs because the production and injection wells are situated at the same formation depth; thus, the pump work required to overcome the formation pressure is saved, resulting in a smaller injection–production pressure difference and lower flow impedance (Figure 11). The IR of Case 1 is the highest due to having the shortest total well length. Shorter wellbores reduce the cross-section area for water flow, necessitating a larger injection–production pressure difference to maintain the same flow rate, resulting in a higher IR (Figure 11). The ηe shows the opposite situation compared to IR (Figure 10d), indicating that energy efficiency is primarily determined by internal energy consumption.
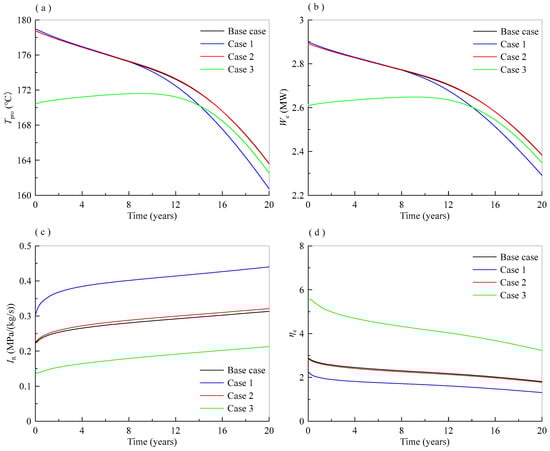
Figure 10.
Comparison of base case and classic double-wells for various performance parameters: (a) production temperature (Tpro), (b) electric power (We), (c) flow impedance (IR) and (d) electric energy efficiency (ηe).
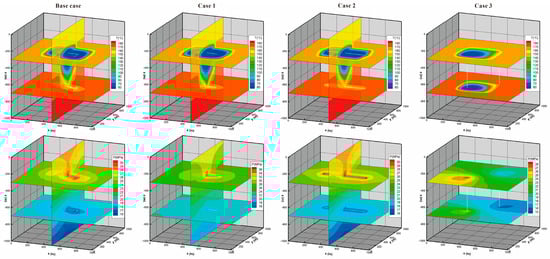
Figure 11.
Temperature and pressure distribution after 20 years for different well arrangements.
Figure 11 shows the spatial distribution of the reservoir temperature and pressure for the base case and classic double-well cases after 20 years. The low-temperature zone spreads outward from the injection well towards the production well. Heat extraction in the SRV along the y-axis is more complete in the base case compared to Cases 1 and 2. Case 2 obtains more heat compensation from the surrounding rock due to its proximity to the HDR area. A preferential low-temperature channel forms along the diagonal plane in Case 3. The injection–production pressure difference is larger in horizontal well cases than in the vertical well case, increasing as the wellbore length decreases. Therefore, the largest difference is observed in Case 1. In contrast, Case 3 exhibits the smallest pressure difference because the production and injection wells are at the same formation depth, reducing the need for pump work to overcome formation pressure.
The multilateral horizontal well EGS achieves heat extraction that is equal to, or even surpasses, that of conventional horizontal and vertical double-well EGSs, despite receiving less thermal compensation from the surrounding rock. Meanwhile, the cost of drilling for the multilateral horizontal well EGS is significantly reduced, as it necessitates only a single vertical wellbore. Additionally, the layout and geometrical parameters of multilateral wells, such as the number of wells, well length, and well diameter, can be optimized to further enhance heat extraction performance. Therefore, future studies should compare the heat extraction performances of optimal multilateral well and double-well EGS configurations in heterogeneous reservoirs.
4.3. Sensitivity Analysis
4.3.1. Influence of Well Depth
Figure 12 shows the sensitivity of Tpro, We, IR, and ηe to the depth of injection and production wells. Reversing the positions of the injection and production wells significantly impacts Tpro and We (Figure 12a,b). The Tpro of LIUP increases gradually over the first 12 years before declining. This trend is attributed to the high temperature of the lower reservoir heating the upward working fluid. As the working fluid migrates towards the upper production well, heat exchange occurs between the fluid and the upper reservoir, effectively reheating the upper reservoir. With continuous heat extraction, the heat within the deep, high-temperature reservoir gradually recovers, causing the low-temperature zone to gradually expand towards the upper production well. Similarly to the Tpro, the We initially increases before declining. Reversing the depths of the injection and production wells leads to a drastic reduction in IR. For the LIUP case, the pump work required to overcome the formation pressure is effectively halved, resulting in a smaller injection–production pressure difference and lower flow impedance. However, switching the well horizon results in increases in ηe from 1.8 to 2.9 to 5.1–19.1 (Figure 12d). This is mainly due to the obvious drop in Wp caused by the drop in IR.
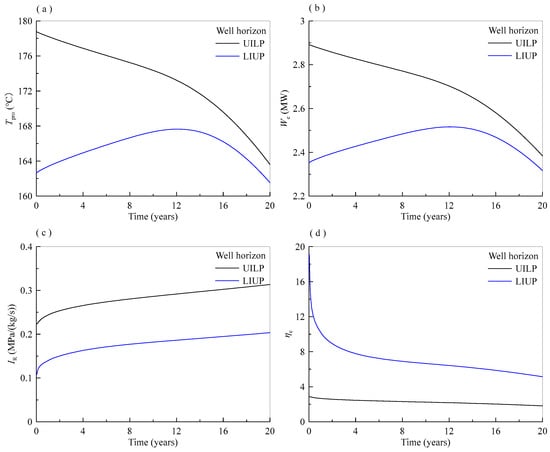
Figure 12.
Sensitivity of various performance parameters to well horizon: (a) production temperature (Tpro), (b) electric power (We), (c) flow impedance (IR) and (d) electric energy efficiency (ηe).
Figure 13 illustrates the pressure and temperature distribution after a 20-year period, comparing the base case with Case 4. The injection–production pressure difference in the base case reaches approximately 14 MPa, significantly higher than the 8 MPa observed in Case 4. Regarding the production well depth, the low-temperature zone in the LIUP case after 20 years is smaller due to the production well lying in the upper layer with lower temperature.
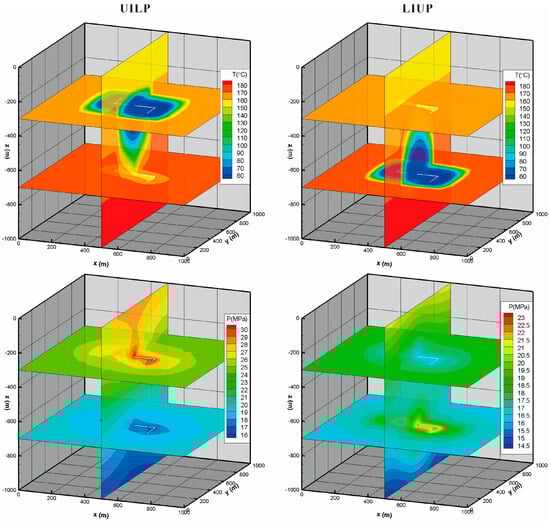
Figure 13.
Temperature and pressure distribution after 20 years for varying injection–production well depths.
4.3.2. Influence of Angle of Main Wellbore
Figure 14 illustrates the sensitivity of Tpro, We, IR, and ηe to the angle of the main horizontal production and injection wellbore. Rotating the main horizontal well can slow down the declining rate of Tpro and We, and after 20 years of production, the production temperature drops to 116 °C. This is due to the rotation of the main horizontal well leading to a longer distance between the production and injection wells (Figure 15). As a result, the fluid travels a longer path, allowing for more thorough heating and a slower decline in production temperature. In addition, the rotation of the main horizontal well leads to a significant increase in IR, primarily due to the extended distance between the wells and the associated rise in injection pressure. According to Equations (5)–(7), the increase in IR and Wp results in a decrease in ηe. In summary, the angle of the main wellbore significantly influences system productivity.
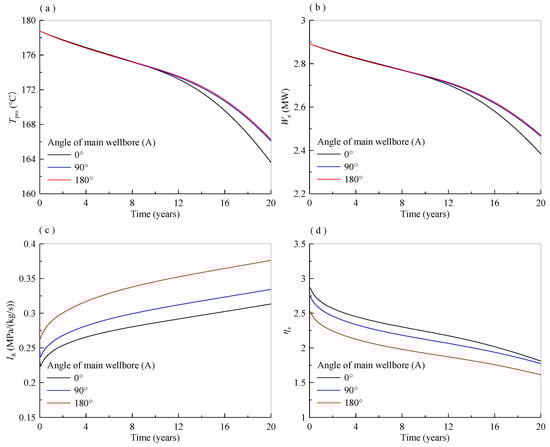
Figure 14.
Sensitivity of various performance parameters to angle of the main wellbore: (a) production temperature (Tpro), (b) electric power (We), (c) flow impedance (IR) and (d) electric energy efficiency (ηe).
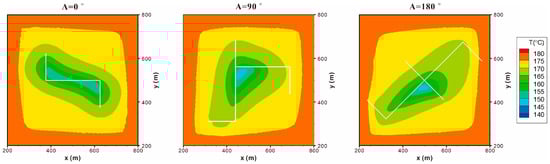
Figure 15.
Reservoir temperature distribution in the 20th year for various angles of the main wellbore.
4.3.3. Influence of Branch Spacing
Figure 16 shows the sensitivity of Tpro, We, IR, and ηe to branch spacing (db), by changing the spacing of the junction of the branch and main wells based on the base case. The two branches are arranged in the direction of the cross side of the main wellbore. The well interference is mainly between the branch well and the main well. Figure 16a,b show that the decrease in branch spacing results in a decline in Tpro and We. The Tpro and We of the cases of db = 83.3 m and 0 m are reduced and roughly coincide due to well interference (Figure 17). The Tpro decreases from 163.6 °C for the base case to 160.5 °C for the case of db = 0 m. Figure 16c shows that the decrease in db increases IR because of the increased well interference. Furthermore, decreasing db from 250 m to 0 m results in a drop in We from 2.90–2.38 MW to 2.90–2.28 MW (Figure 16b), and it also has a negative influence on ηe (Figure 16d). Overall, the branch spacing has little effect on EGS performance.
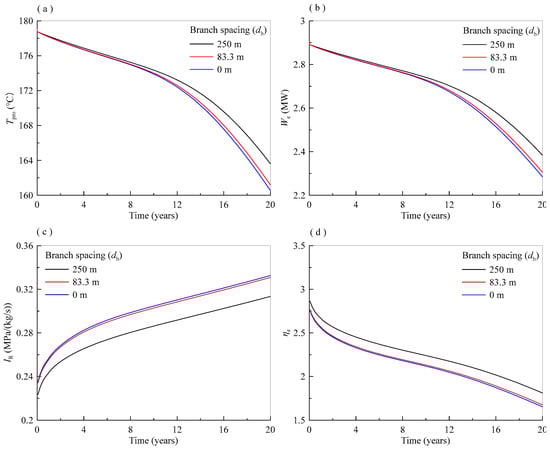
Figure 16.
Sensitivity of various performance parameters to branch spacing: (a) production temperature (Tpro), (b) electric power (We), (c) flow impedance (IR) and (d) electric energy efficiency (ηe).
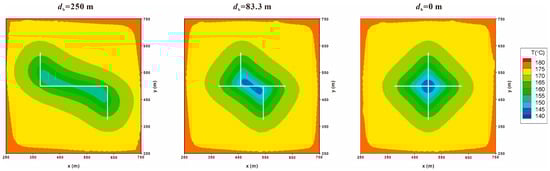
Figure 17.
Temperature distribution of SRV at the depth of the production well after 20 years for various branch spacing.
4.3.4. Influence of Branch Well Setting
In this section, the heat extraction performances of 2-branch cases under different branch well setting are evaluated. Figure 18 illustrates the dependence of Tpro, We, IR, and ηe on the branch well setting. Figure 18a,b show that non-branching in both the injection well and production well will result in a slight decrease in Tpro and We. This is because the total well length is reduced in non-branched configurations, diminishing the heat exchange area. Additionally, the cross-sectional area is smaller, which raises the flow rate per unit area and enhances convective heat transfer. The superposition of the two influences causes a slight decrease in the Tpro and We. Figure 18c shows that the non-branch well system results in an increase in IR. This is attributed to the shorter total well length leading to lower water temperatures, which in turn increases the water viscosity and subsequently raises IR. In contrast, ηe exhibits an opposing trend to IR, as the non-branch configuration has a minimal impact on We, while IR is significantly reduced.
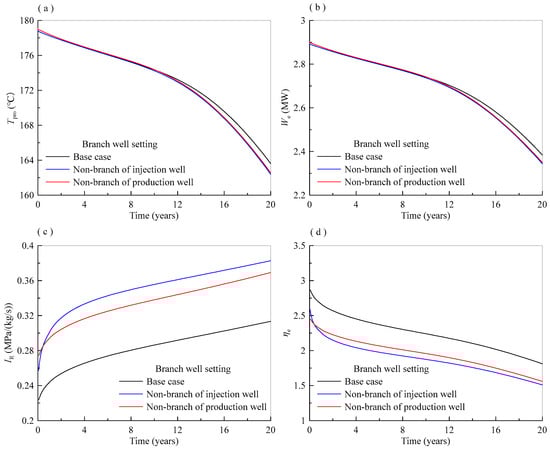
Figure 18.
Sensitivity of various performance parameters to the branch well setting: (a) production temperature (Tpro), (b) electric power (We), (c) flow impedance (IR) and (d) electric energy efficiency (ηe).
Non-branching in the injection well results in higher flow impedance and lower power generation efficiency. This is because the injection well is located in the shallow low-temperature zone, while the production well is in the deeper high-temperature zone. At the same flow rate, the flow impedance in the low-temperature zone is higher, leading to a reduced power generation efficiency when there is not a significant change in the production temperature.
4.3.5. Influence of SRV Volume
Figure 19 illustrates the dependence of Tpro, We, IR, and ηe on the volume of SRV (VSRV). The Tpro and We increase with the increase in VSRV. This trend is due to the larger high-permeability region created by an increased VSRV, which facilitates the easier extraction of stored energy (Figure 20). Compared with the base case of 500 m × 500 m × 500 m, the Tpro increases from 163.6 °C to 175.5 °C for 800 m × 800 m × 800 m. Figure 19c shows that increasing VSRV leads to a significant reduction in IR. This is because the larger high-permeability region allows for the quicker circulation of hot water, increased flow volume, and partially reduced water viscosity. Figure 19b shows increasing VSRV from 500 m × 500 m × 500 m to 800 m × 800 m × 800 m, resulting in an increase in We from 2.90–2.38 MW to 2.90–2.78 MW. Similarly, SRV volume has a positive impact on ηe (Figure 19d). Overall, an expanding SRV volume essentially increases the permeability of the surrounding rock. A larger SRV volume effectively reduces flow impedance, making heat extraction easier and improving the production temperature and energy efficiency.
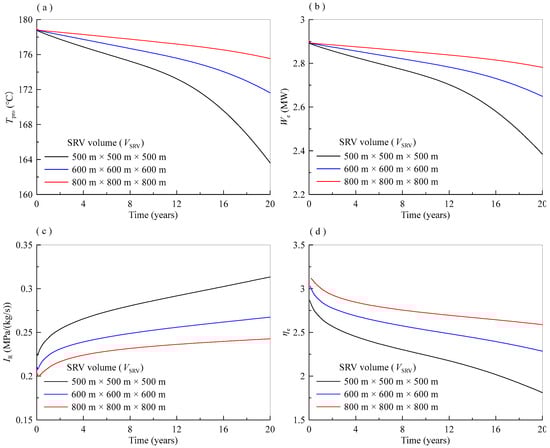
Figure 19.
Sensitivity of various performance parameters to the volume of SRV (VSRV): (a) production temperature (Tpro), (b) electric power (We), (c) flow impedance (IR) and (d) electric energy efficiency (ηe).
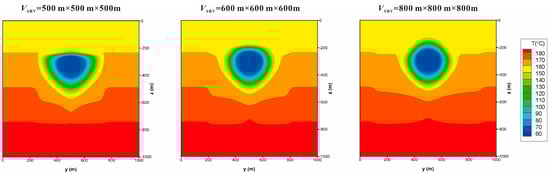
Figure 20.
Temperature distribution after 10 years for varying SRV volumes (at x = 500 m plane).
4.4. Economic Analysis
To compare the economic aspects, an economic analysis is carried out for all designed cases (Table 2). The total cost, LCOE, and profit are compared, respectively (Figure 21). The methodology for calculating these parameters is detailed in Section 4.1.5.
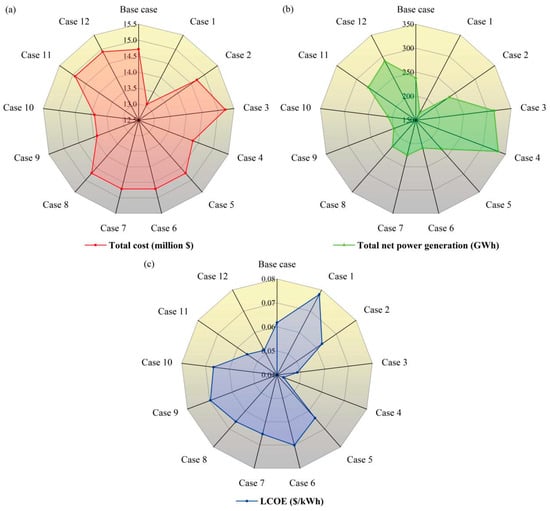
Figure 21.
Economic analysis for all cases: (a) total cost, (b) total net power generation, and (c) LCOE.
Case 4 of the LIUP well layout is the most economical, with an LCOE of 0.043 USD/kWh. The accumulative energy consumption of pumps (γp) is significantly reduced with the LIUP well layout, which in turn increases the system’s total net power generation and decreases the LCOE. Thus, well layout has a substantial impact on the economic performance of the system. Case 1 exhibits the least favorable economic situation, with an LCOE of 0.078 USD/kWh. This is mainly due to the significant decreases in total net power generation resulting from higher internal energy consumption due to the short total well length, thereby diminishing the economic viability.
The economic aspects in Case 11 and Case 12 have also improved. This is due to the fact that an increase in the volume of SRV indicates that a large volume is afforded for quick flow circulation and heat exchange. Therefore, the electric power increase and the internal energy consumption decrease lead to a large increase in extracted heat. Although there is simultaneously a slight increase in the cost of surface installation, the overall economic situation has improved.
The economic situation for Case 3 of the double vertical well is better than the base case but worse than Case 4. Although the average drilling cost for vertical wells is lower than that for horizontal wells, the total length of double vertical wells is longer and the drilling cost increases slightly. However, the internal energy consumption is significantly reduced. Overall, the total net power generation of the system is enhanced, leading to improved economic performance.
Based on the same cost for drilling and surface installation, the estimated costs of internal energy consumption play a leading role in the economic situation. Taking the LIUP well layout or increasing the reservoir volume through stimulation measures can significantly reduce the estimated costs of internal energy consumption, thereby enhancing the economic viability of the system.
5. Conclusions
A multilateral horizontal well reservoir model was established for the Qiabuqia geothermal field in the Gonghe Basin, targeting the granitic HDR reservoir between 2650 and 3650 m. This study aimed to explore the extraction potential of the HDR reservoir through the proposed well system. The production performance of the multilateral horizontal well system was evaluated and compared with several classic double-well systems. The sensitivity of key production parameters to factors such as well depth, well angle, branch spacing, branch setting, and SRV volume was systematically and quantitatively analyzed. Additionally, the economic and environmental benefits of the proposed system were discussed. Based on the simulation results, the following conclusions can be drawn:
- (1)
- For the basic multilateral horizontal well system, the initial production temperature and electric power reach 178.4 °C and 2.90 MW and decrease by 8.3% and 17.9% over 20 years of production, respectively, satisfying the thermal sustainability requirements for EGS development. Throughout the 20-year period, the system achieves an electric power of 2.38–2.90 MW, a flow impedance of 0.207–0.313 MPa/(kg/s), and an electric energy efficiency of 1.8–2.9.
- (2)
- Based on the simulation outcomes, the proposed configuration has an installed power capacity of 2.7 MW. The designed power plant is projected to produce around 432.48 GWh of electricity, with total costs estimated at USD 14.715 million. The LCOE is calculated as 0.062 USD/kWh. Additionally, the GHG emissions reduction is expected to range from 0.15 to 0.51 Mt over 20 years.
- (3)
- The multilateral horizontal well EGS achieves higher production temperature and electric power than the configurations of non-branch horizontal well and conventional vertical double-well EGS. The multilateral horizontal well EGS only required one vertical wellbore, significantly reducing drilling costs.
- (4)
- The heat production of geothermal reservoirs highly depends on the well depth and branch well arrangement. The layout of upper injection and lower production wells could result in a high production temperature but low energy efficiency. Meanwhile, the layout of lower injection and upper production wells leads to low production temperature but high energy efficiency. The layout featuring a lower injection and an upper production well is more favorable.
- (5)
- Increasing the angle of the main wellbore results in higher electric power, but the pump power consumption also increases. Reducing the branch spacing leads to a decrease in electric power and an increase in pump power consumption. Non-branching in the injection well and production well has little effect on electric power, but the pump power consumption increases significantly.
- (6)
- A large volume of stimulating reservoir can significantly reduce flow impedance, lower internal energy consumption, and enhance economic performance.
The proposed EGS utilizing multilateral horizontal wells has been shown to represent an effective approach to exploiting the HDR reservoir in the Qiabuqia geothermal field. The numerical model presented here also serves as a valuable tool for optimizing and designing EGSs with multilateral horizontal wells. Furthermore, for heterogeneous reservoirs, the multilateral well system can improve connectivity and prevent fluid short-circuiting by leveraging the permeability distribution characteristics of the reservoir, thereby facilitating more economic and efficient geothermal development. Therefore, further investigations into the impact of reservoir heterogeneity and the existence of natural faults and artificial fractures could provide additional insights for optimizing the heat extraction performance of multilateral horizontal wells.
Author Contributions
Conceptualization, H.Z., G.J. and N.W.; Methodology, H.Z., G.J. and Y.Z.; Software, G.J. and Y.Z.; Validation, J.L.; Formal analysis, J.L.; Investigation, Z.S.; Resources, L.L., Z.S. and J.Z.; Data curation, C.F.; Writing—original draft, H.Z.; Writing—review & editing, G.J., L.L. and N.W.; Visualization, C.F.; Funding acquisition, H.Z., G.J., J.L. and J.Z. All authors have read and agreed to the published version of the manuscript.
Funding
This research was jointly supported by the Open Fund of Key Laboratory of Oil & Gas Equipment, Ministry of Education (Southwest Petroleum University) (Grant Number: OGE202302-12), Carbon Peak and Carbon Neutralization Science and Technology Innovation Special Fund of Jiangsu Province, China (Grant Number: BE2022859), Guangdong Basic and Applied Basic Research Foundation (Grant Number: 2023A1515010926), Guangzhou Science and Technology Plan Project (Grant Numbers: 2024A04J9876, 202201010562), the National Natural Science Foundation of China (Grant Number: 52004261), and Scientific Research Program for Young Talents of Guangzhou Education Bureau (Grant Number: 202234798).
Data Availability Statement
The original contributions presented in this study are included in the article. Further inquiries can be directed to the corresponding author.
Acknowledgments
We are grateful to the editors for their meticulous handling and constructive guidance. Special thanks go to the anonymous reviewers for their insightful comments and valuable suggestions, which significantly improved our manuscript.
Conflicts of Interest
The authors declare no conflict of interest.
References
- Zheng, B.; Xu, J.; Ni, T.; Li, M. Geothermal energy utilization trends from a technological paradigm perspective. Renew. Energy 2015, 77, 430–441. [Google Scholar]
- International Energy Agency (nd) China Energy Data, IEA. Available online: https://www.iea.org/countries/china (accessed on 25 July 2024).
- Breede, K.; Dzebisashvili, K.; Liu, X.; Falcone, G. A systematic review of enhanced (or engineered) geothermal systems: Past, present and future. Geotherm. Energy 2013, 1, 4. [Google Scholar]
- Lukawski, M.Z.; Silverman, R.L.; Tester, J.W. Uncertainty analysis of geothermal well drilling and completion costs. Geothermics 2016, 64, 382–391. [Google Scholar] [CrossRef]
- Zeng, Y.; Zhan, J.; Wu, N.; Luo, Y.; Cai, W. Numerical investigation of electricity generation potential from fractured granite reservoir by water circulating through three horizontal wells at Yangbajing geothermal field. Appl. Therm. Eng. 2016, 104, 1–15. [Google Scholar] [CrossRef]
- Wang, H.; Guo, J.; Zhang, L. A semi-analytical model for multilateral horizontal wells in low-permeability naturally fractured reservoirs. J. Pet. Sci. Eng. 2017, 149, 564–578. [Google Scholar] [CrossRef]
- Cinelli, S.D.; Kamel, A.H. Novel Technique to Drill Horizontal Laterals Revitalizes Aging Field. Conference Novel Technique to Drill Horizontal Laterals Revitalizes Aging Field. In Proceedings of the SPE/IADC Drilling Conference, Amsterdam, The Netherlands, 5–7 March 2013. [Google Scholar]
- Zander, D.; Czehura, M.; Snyder, D.J.; Seale, R. Horizontal Drilling and Well Completion Optimization in a North Dakota Bakken Oilfield. In Proceedings of the SPE Annual Technical Conference and Exhibition, Florence, Italy, 19–22 September 2010. [Google Scholar]
- Rankin, R.; Thibodeau, M.; Vincent, M.C.; Palisch, T.T. Improved Production and Profitability Achieved with Superior Completions in Horizontal Wells: A Bakken/Three Forks Case History. In Proceedings of the SPE Annual Technical Conference and Exhibition, Florence, Italy, 19–22 September 2010. [Google Scholar]
- Mao, P.; Wan, Y.; Sun, J.; Li, Y.; Hu, G.; Ning, F.; Wu, N. Numerical study of gas production from fine-grained hydrate reservoirs using a multilateral horizontal well system. Appl. Energy 2021, 301, 117450. [Google Scholar]
- Zhang, B.; Li, X.; Zhao, Y.; Chang, C.; Zheng, J. A Review of Gas Flow and Its Mathematical Models in Shale Gas Reservoirs. Geofluids 2020, 2020, 8877777. [Google Scholar] [CrossRef]
- Ye, J.; Qin, X.; Xie, W.; Lu, H.; Ma, B.; Qiu, H.; Jinqiang, L.; Jing’an, L.; Zenggui, K.; Cheng, L.; et al. Main progress of the second gas hydrate trial production in the South China Sea. Geol. China 2020, 47, 557–568. (In Chinese) [Google Scholar]
- Ren, X.; Zhou, L.; Zhou, J.; Lu, Z.; Su, X. Numerical analysis of heat extraction efficiency in a multilateral-well enhanced geothermal system considering hydraulic fracture propagation and configuration. Geothermics 2020, 87, 101834. [Google Scholar] [CrossRef]
- Daryasafar, A.; Shahbazi, K.; Ghadiri, M.; Marjani, A. Simultaneous geological CO2 sequestration and gas production from shale gas reservoirs: Brief review on technology, feasibility, and numerical modeling. Energy Sources Part A Recovery Util. Environ. Eff. 2020, 47, 1472–1489. [Google Scholar]
- Ragab, A.M.; Kamel, A.M. Radial Drilling Technique for Improving Well Productivity in Petrobel-Egypt. In Proceedings of the SPE North Africa Technical Conference and Exhibition, Cairo, Egypt, 15–17 April 2013. [Google Scholar]
- Nair, R.; Peters, E.; Sliaupa, S.; Valickas, R.; Petrauskas, S. A case study of radial jetting technology for enhancing geothermal energy systems at Klaipeda geothermal demonstration plant. In Proceedings of the 42nd Workshop on Geothermal Reservoir Engineering Stanford University, Stanford, CA, USA, 13–15 February 2017; pp. 1–11. [Google Scholar]
- Xie, J.; Wang, J.; Liu, X. Performance analysis of pinnate horizontal well in enhanced geothermal system. Appl. Therm. Eng. 2022, 201, 117799. [Google Scholar]
- Song, X.; Shi, Y.; Li, G.; Yang, R.; Wang, G.; Zheng, R.; Li, J.; Lyu, Z. Numerical simulation of heat extraction performance in enhanced geothermal system with multilateral wells. Appl. Energy 2018, 218, 325–337. [Google Scholar]
- Zhang, X.; Huang, Z.; Li, G.; Wu, X.; Wang, T.; Zhou, X. Enhancing reservoir stimulation and heat extraction performance for fractured geothermal reservoirs: Utilization of novel multilateral wells. Energy 2024, 291, 130410. [Google Scholar]
- Zhang, W.; Wang, M.; Wei, Z.; Yu, H.; Wang, C.; Wang, D.; Guo, T. Study of the fracture propagation and the corresponding heat mining performance of multi-branch radial wells geothermal system based on the THM-D coupling model. Geoenergy Sci. Eng. 2024, 243, 213302. [Google Scholar]
- Wang, C.; Lv, Y. Gonghe Basin: A new and worth-researching basin. Xinjiang Pet. Geol. 2004, 25, 471–473. (In Chinese) [Google Scholar]
- Zhang, C.; Zhang, S.; Li, S.; Jia, X.; Jiang, G.; Gao, P.; Wang, Y.; Hu, S. The characteristics of geothermal field of the Qiabuqia geothermal area in the Gonghe basin, northeastern Tibetan Plateau. Chin. J. Geophys. 2018, 61, 4545–4557. (In Chinese) [Google Scholar]
- Zhang, C.; Jiang, G.; Shi, Y.; Wang, Z.; Wang, Y.; Li, S.; Jia, X.; Hu, S. Terrestrial heat flow and crustal thermal structure of the Gonghe-Guide area, northeastern Qinghai-Tibetan plateau. Geothermics 2018, 72, 182–192. [Google Scholar]
- Lei, Z.; Zhang, Y.; Zhang, S.; Fu, L.; Hu, Z.; Yu, Z.; Li, L.; Zhou, J. Electricity generation from a three-horizontal-well enhanced geothermal system in the Qiabuqia geothermal field, China: Slickwater fracturing treatments for different reservoir scenarios. Renew. Energy 2020, 145, 65–83. [Google Scholar] [CrossRef]
- Lei, Z.; Zhang, Y.; Yu, Z.; Hu, Z.; Li, L.; Zhang, S.; Fu, L.; Zhou, L.; Xie, Y. Exploratory research into the enhanced geothermal system power generation project: The Qiabuqia geothermal field, Northwest China. Renew. Energy 2019, 139, 52–70. [Google Scholar]
- Xu, T.; Yuan, Y.; Jia, X.; Lei, Y.; Li, S.; Feng, B.; Hou, Z.; Jiang, Z. Prospects of power generation from an enhanced geothermal system by water circulation through two horizontal wells: A case study in the Gonghe Basin, Qinghai Province, China. Energy 2018, 148, 196–207. [Google Scholar]
- Zhang, J.; Xie, J.; Zhang, H. Production capacity and mining plan optimization of fault/fracture-controlled EGS model in Gonghe Basin. Energy Sci. Eng. 2019, 7, 2966–2983. [Google Scholar] [CrossRef]
- Zhai, H.; Jin, G.; Liu, L.; Su, Z.; Zeng, Y.; Liu, J.; Li, G.; Feng, C.; Wu, N. Parametric study of the geothermal exploitation performance from a HDR reservoir through multilateral horizontal wells: The Qiabuqia geothermal area, Gonghe Basin. Energy 2023, 275, 127370. [Google Scholar] [CrossRef]
- Zhong, C.; Xu, T.; Gherardi, F.; Yuan, Y. Comparison of CO2 and water as working fluids for an enhanced geothermal system in the Gonghe Basin, northwest China. Gondwana Res. 2023, 122, 199–214. [Google Scholar] [CrossRef]
- Borgia, A.; Cattaneo, L.; Marconi, D.; Delcroix, C.; Rossi, E.L.; Clemente, G.; Amoroso, C.; Re, F.L.; Tozzato, E. Using a MODFLOW grid, generated with GMS, to solve a transport problem with TOUGH2 in complex geological environments: The intertidal deposits of the Venetian Lagoon. Comput. Geosci. 2011, 37, 783–790. [Google Scholar] [CrossRef]
- Pruess, K.; Oldenburg, C.M.; Moridis, G.J. TOUGH2 User’s Guide Version 2; Lawrence Berkeley National Lab. (LBNL): Berkeley, CA, USA, 1999; 204p. [Google Scholar]
- Yue, G.; Deng, X.; Xing, L.; Lin, W.; Liu, F.; Liu, Y.; Wang, G. Numerical simulation of hot dry rock exploitation using enhanced geothermal systems in Gonghe Basin. Sci. Technol. Rev. 2015, 33, 62–67. (In Chinese) [Google Scholar]
- Zhang, C.; Jiang, G.; Jia, X.; Li, S.; Zhang, S.; Hu, D.; Hu, S.; Wang, Y. Parametric study of the production performance of an enhanced geothermal system: A case study at the Qiabuqia geothermal area, northeast Tibetan plateau. Renew. Energy 2019, 132, 959–978. [Google Scholar] [CrossRef]
- Popov, Y.A.; Pribnow, D.F.C.; Sass, J.H.; Williams, C.F.; Burkhardt, H. Characterization of rock thermal conductivity by high-resolution optical scanning. Geothermics 1999, 28, 253–276. [Google Scholar] [CrossRef]
- Zhuang, Y.; Zhang, C.; Zhu, M.; Zhu, Y.; Luo, J.; Guo, Q. Laboratory study of improving granite permeability by using mud acid as the chemical stimulus. Saf. Environ. Eng. 2017, 24, 16–21+45. (In Chinese) [Google Scholar]
- Evans, K. Enhanced/engineered geothermal system: An introduction with overviews of deep systems built and circulated to date. In Proceedings of the China Geothermal Development Forum Beijing, Beijing, China, 6–7 November 2010; pp. 410–433. [Google Scholar]
- Sanyal, S.; Butler, S. An Analysis of Power Generation Prospects from Enhanced Geothermal Systems. Geotherm. Resour. Counc. Trans. 2005, 29, 131–138. [Google Scholar]
- Garnish, J.D. Hot Dry Rock—A European Perspective. Geotherm. Resour. Counc. Trans. 1985, 9, 329–337. [Google Scholar]
- Liu, B.; Jin, H.; Sun, L.; Sun, Z.; Su, Z.; Zhang, C. Holocene climatic change revealed by aeolian deposits from the Gonghe Basin, northeastern Qinghai–Tibetan Plateau. Quat. Int. 2013, 296, 231–240. [Google Scholar] [CrossRef]
- Zeng, Y.; Zhan, J.; Wu, N.; Luo, Y.; Cai, W. Numerical simulation of electricity generation potential from fractured granite reservoir through vertical wells at Yangbajing geothermal field. Energy 2016, 103, 290–304. [Google Scholar]
- Tester, J.W.; Anderson, B.J.; Batchelor, A.S.; Blackwell, D.D.; DiPippo, R. The Future of Geothermal Energy. Mass. Inst. Technol. 2006, 358, 1–3. [Google Scholar]
- Murphy, H.; Brown, D.; Jung, R.; Matsunaga, I.; Parker, R. Hydraulics and well testing of engineered geothermal reservoirs. Geothermics 1999, 28, 491–506. [Google Scholar]
- Zeng, Y.; Su, Z.; Wu, N. Numerical simulation of heat production potential from hot dry rock by water circulating through two horizontal wells at Desert Peak geothermal field. Energy 2013, 56, 92–107. [Google Scholar]
- Feng, Z.; Zhao, Y.; Zhou, A.; Zhang, N. Development program of hot dry rock geothermal resource in the Yangbajing Basin of China. Renew. Energy 2012, 39, 490–495. [Google Scholar]
- Zhang, Y.; Li, Z.; Guo, L.; Gao, P.; Jin, X.; Xu, T. Electricity generation from enhanced geothermal systems by oilfield produced water circulating through reservoir stimulated by staged fracturing technology for horizontal wells: A case study in Xujiaweizi area in Daqing Oilfield, China. Energy 2014, 78, 788–805. [Google Scholar] [CrossRef]
- Chamorro, C.R.; Mondéjar, M.E.; Ramos, R.; Segovia, J.J.; Martín, M.C.; Villamañán, M.A. World geothermal power production status: Energy, environmental and economic study of high enthalpy technologies. Energy 2012, 42, 10–18. [Google Scholar] [CrossRef]
- Bertani, R.; Thain, I. Geothermal power generating plant CO2 emission survey. IGA News 2002, 49, 1–3. [Google Scholar]
- Kristmannsdóttir, H.; Ármannsson, H. Environmental aspects of geothermal energy utilization. Geothermics 2003, 32, 451–461. [Google Scholar]
- Yin, Y.; Jiang, Z.; Liu, Y.; Yu, Z. Factors Affecting Carbon Emission Trading Price: Evidence from China. Emerg. Mark. Financ. Trade 2019, 55, 3433–3451. [Google Scholar] [CrossRef]
Disclaimer/Publisher’s Note: The statements, opinions and data contained in all publications are solely those of the individual author(s) and contributor(s) and not of MDPI and/or the editor(s). MDPI and/or the editor(s) disclaim responsibility for any injury to people or property resulting from any ideas, methods, instructions or products referred to in the content. |
© 2025 by the authors. Licensee MDPI, Basel, Switzerland. This article is an open access article distributed under the terms and conditions of the Creative Commons Attribution (CC BY) license (https://creativecommons.org/licenses/by/4.0/).