Abstract
Although heavy oil remains a crucial energy source, its high viscosity makes its utilization challenging. We have performed an interpretable analysis of the relationship between the molecular structure of digital oil and its viscosity using molecular dynamics simulations combined with machine learning. In this study, we developed three “digital oils” to represent light, medium, and heavy oils in consideration of their composition and molecular structure. Using molecular dynamics (MD) simulations, we calculated the density, self-diffusion coefficient, and viscosity of these digital oils at various temperatures (323–453 K). The accuracy of the simulation results was demonstrated by their good fit to the experimental data. We further explored the correlation between interaction energy and viscosity. As interaction energy increased, molecular attraction strengthened, resulting in greater friction between molecules and a higher viscosity of the digital oil. Cluster analysis revealed that, compared with the other two oils, the heavy oil contained rod-shaped molecular aggregates in greater quantity and larger clusters. Additionally, we computed the radial distribution functions of the SARA (saturates, aromatics, resins, and asphaltenes) components; among molecular pairs, aromatics and resins showed the largest interaction energy and were the most tightly bound, contributing to increased viscosity. To more effectively predict the viscosity of digital oils, we integrated four machine learning (ML) techniques: linear regression, random forest, extra trees, and gradient boosting. Post-hoc analysis coupled with SHapley Additive exPlanations (SHAP) was applied to interpret how macroscopic and microscopic features influence the viscosity and to identify the contributions of individual molecules. This work presents a novel and efficient method for estimating the viscosity of digital oils by combining MD simulations with ML approaches, offering a valuable tool for quick and cost-effective analysis.
1. Introduction
Global demand for petroleum resources continues to grow, driven by technological advances and sustained economic growth. However, the over-exploitation of conventional oil fields has resulted in a marked decline in the reserves and recoverable quantities of light oil. Consequently, conventional light oil is increasingly unable to meet current energy demands [1], making the development and utilization of heavy crude oil an urgent priority. Heavy crude oil, however, presents significant challenges due to its high viscosity, low fluidity, and the high costs of extraction and transportation [2]. The viscosity of crude oil is mainly determined by its molecular structure, especially the presence of macromolecules, and these components tend to make crude oil much less fluid at low temperatures. Therefore, the study of the relationship between the viscosity of crude oil and its molecular structure not only aids in understanding the influence of different components on fluidity but also provides a theoretical foundation for the development of new types of fluidity improvers. Accurate analysis of the molecular structure characteristics can provide important data support for reservoir extraction, pipeline design, and enhancement of oil recovery efficiency. Therefore, a thorough understanding of the relationship between viscosity and molecular structure is crucial for the effective development of heavy oil resources.
The focus of oil-related research has shifted from extensive empirical studies to mechanistic analyses grounded in molecular structures. Traditional experimental methods, though valuable, are time-consuming and incapable of capturing the detailed molecular movements at the microscopic level. With the rapid advancement of computational resources and techniques, molecular dynamics (MD) simulations have emerged as a valuable tool for studying atomic and molecular behaviors across various disciplines, including biology, medicine, and chemistry. Naturally, MD simulations have found extensive applications in petroleum engineering as well, with numerous studies applying MD simulations in oil extraction [3,4,5], oil transportation [6,7,8], and petrochemical engineering [9,10,11,12].
In theory, more detailed knowledge of the molecular structure of an oil system will lead to a more accurate mechanistic analysis. However, in practice, attaining a comprehensive molecular understanding of an oil system is all but impossible. Petroleum consists of thousands of complex molecular structures, and accurately representing this complexity poses a significant challenge. Petroleum molecules, which consist of carbon, hydrogen, oxygen, nitrogen, sulfur, and various trace metals, are exceedingly intricate and difficult to model with precision. Experimentally, mass spectrometry can provide valuable structural information, facilitating a more comprehensive understanding of the molecular petroleum composition. Nevertheless, due to the complexity of petroleum, this approach requires considerable effort. To streamline this process, the concept of “digital oils” has emerged to facilitate the modeling of crude oil [13,14].
MD simulations have been employed to investigate the relationships between molecular interactions and the physical properties of various systems [6,7,15,16,17,18,19,20,21,22]. For example, Yang et al. [15] studied the kinematic viscosity and density of blends of n-decane with ethyl decanoate or ethyl dodecanoate biofuels. They found that increasing temperature led to decreased molecular chain length and increased intermolecular distances, resulting in reduced kinematic viscosity. Cao et al. [7] investigated the behavior of wax molecules during aggregation and crystallization in crude oil systems, revealing that the wax molecules formed ordered structures in disordered liquid-phase crude oil at relatively low temperatures. Similarly, Zhang et al. [23] used MD simulations to examine the effects of cross-linking degree and tensile stretching on the thermal conductivity of polydimethylsiloxane. Through MD simulations of kratom heavy oil, Zhu et al. [16] discovered that metal ions acted as connectors to facilitate interactions with molecules containing heteroatoms, resulting in the formation of larger molecular clusters and increased oil viscosity. Zhang et al. [24] conducted MD simulations to explore the effects of ultrasound and viscosity-reducing agents on the rate of viscosity reduction, hydrogen bond quantity, and bond types in heavy oil. Su et al. [25] employed MD simulations to calculate the radial distribution functions (RDFs), spatial distribution functions, self-diffusion coefficients, and interaction energies of esters with the goal of elucidating the deep eutectic solvent extraction mechanism. Collectively, these studies highlight the efficacy of MD simulations for analyzing the relationships between the physical properties and molecular structures of digital oils, particularly in situations where experimental approaches are not feasible. Given these advantages, MD simulations are widely used to compute the physical properties of organic systems and to analyze molecular behavior. MD simulation shows significant promise for applications in viscosity reduction and oil extraction. Nevertheless, research on the relationships between energy, molecular structure, and physical properties remains limited. Additionally, most MD studies of oil systems have focused on specific systems; relatively few qualitative analyses of oil molecules and their physical properties have been reported.
Numerous studies have demonstrated the potential of combining MD simulations with machine learning (ML) techniques [26,27,28,29,30,31]. Bhimineni et al. [27] integrated ML models with an MD database to predict the diffusion coefficient of hydrogen in brine. Freitas and colleagues [30] developed an ML model that combines MD simulations with experimental data to predict fuel characteristics across a wide range of pressures and temperatures. Similarly, Omrani et al. [31] used MD simulations to create a dataset of interfacial tension values for the H2-brine system while accounting for various thermodynamic conditions and NaCl concentrations. Wang et al. [32] combined MD simulations with ML to predict the thermal conductivity of the ternary CaO-SiO2-Al2O3 system. Although the integration potential of MD and ML has been demonstrated, they have not been widely applied in petrochemistry, where the molecular structure is complex.
In this study, MD simulations were employed to qualitatively analyze and generate a dataset of the viscosities of digital oils. First, three digital oils were constructed by adjusting the molecular ratios of four components. Using MD simulations, the key physical properties of digital oils, including the density, self-diffusion coefficient, viscosity, and interaction energy, were calculated. The direct relationship between viscosity and interaction energy was also examined. Next, the correlation between viscosity and molecular aggregation was investigated through cluster analysis and RDF calculations. The effect of nickel ions on system viscosity was also analyzed. Subsequently, various ML models based on the MD-generated dataset were utilized to explore the complex influences of temperature, component ratios, and elemental mass distribution on viscosity. Finally, a gradient boosting model was employed to further assess how these factors affect the viscosity of digital oils.
2. Methods
2.1. Molecular Models
To address the limitations imposed by computational power and the complexity of the oil components, a reasonable simplification of the complex oil model was implemented [33]. This simplification facilitated the analysis of viscosity and molecular structure.
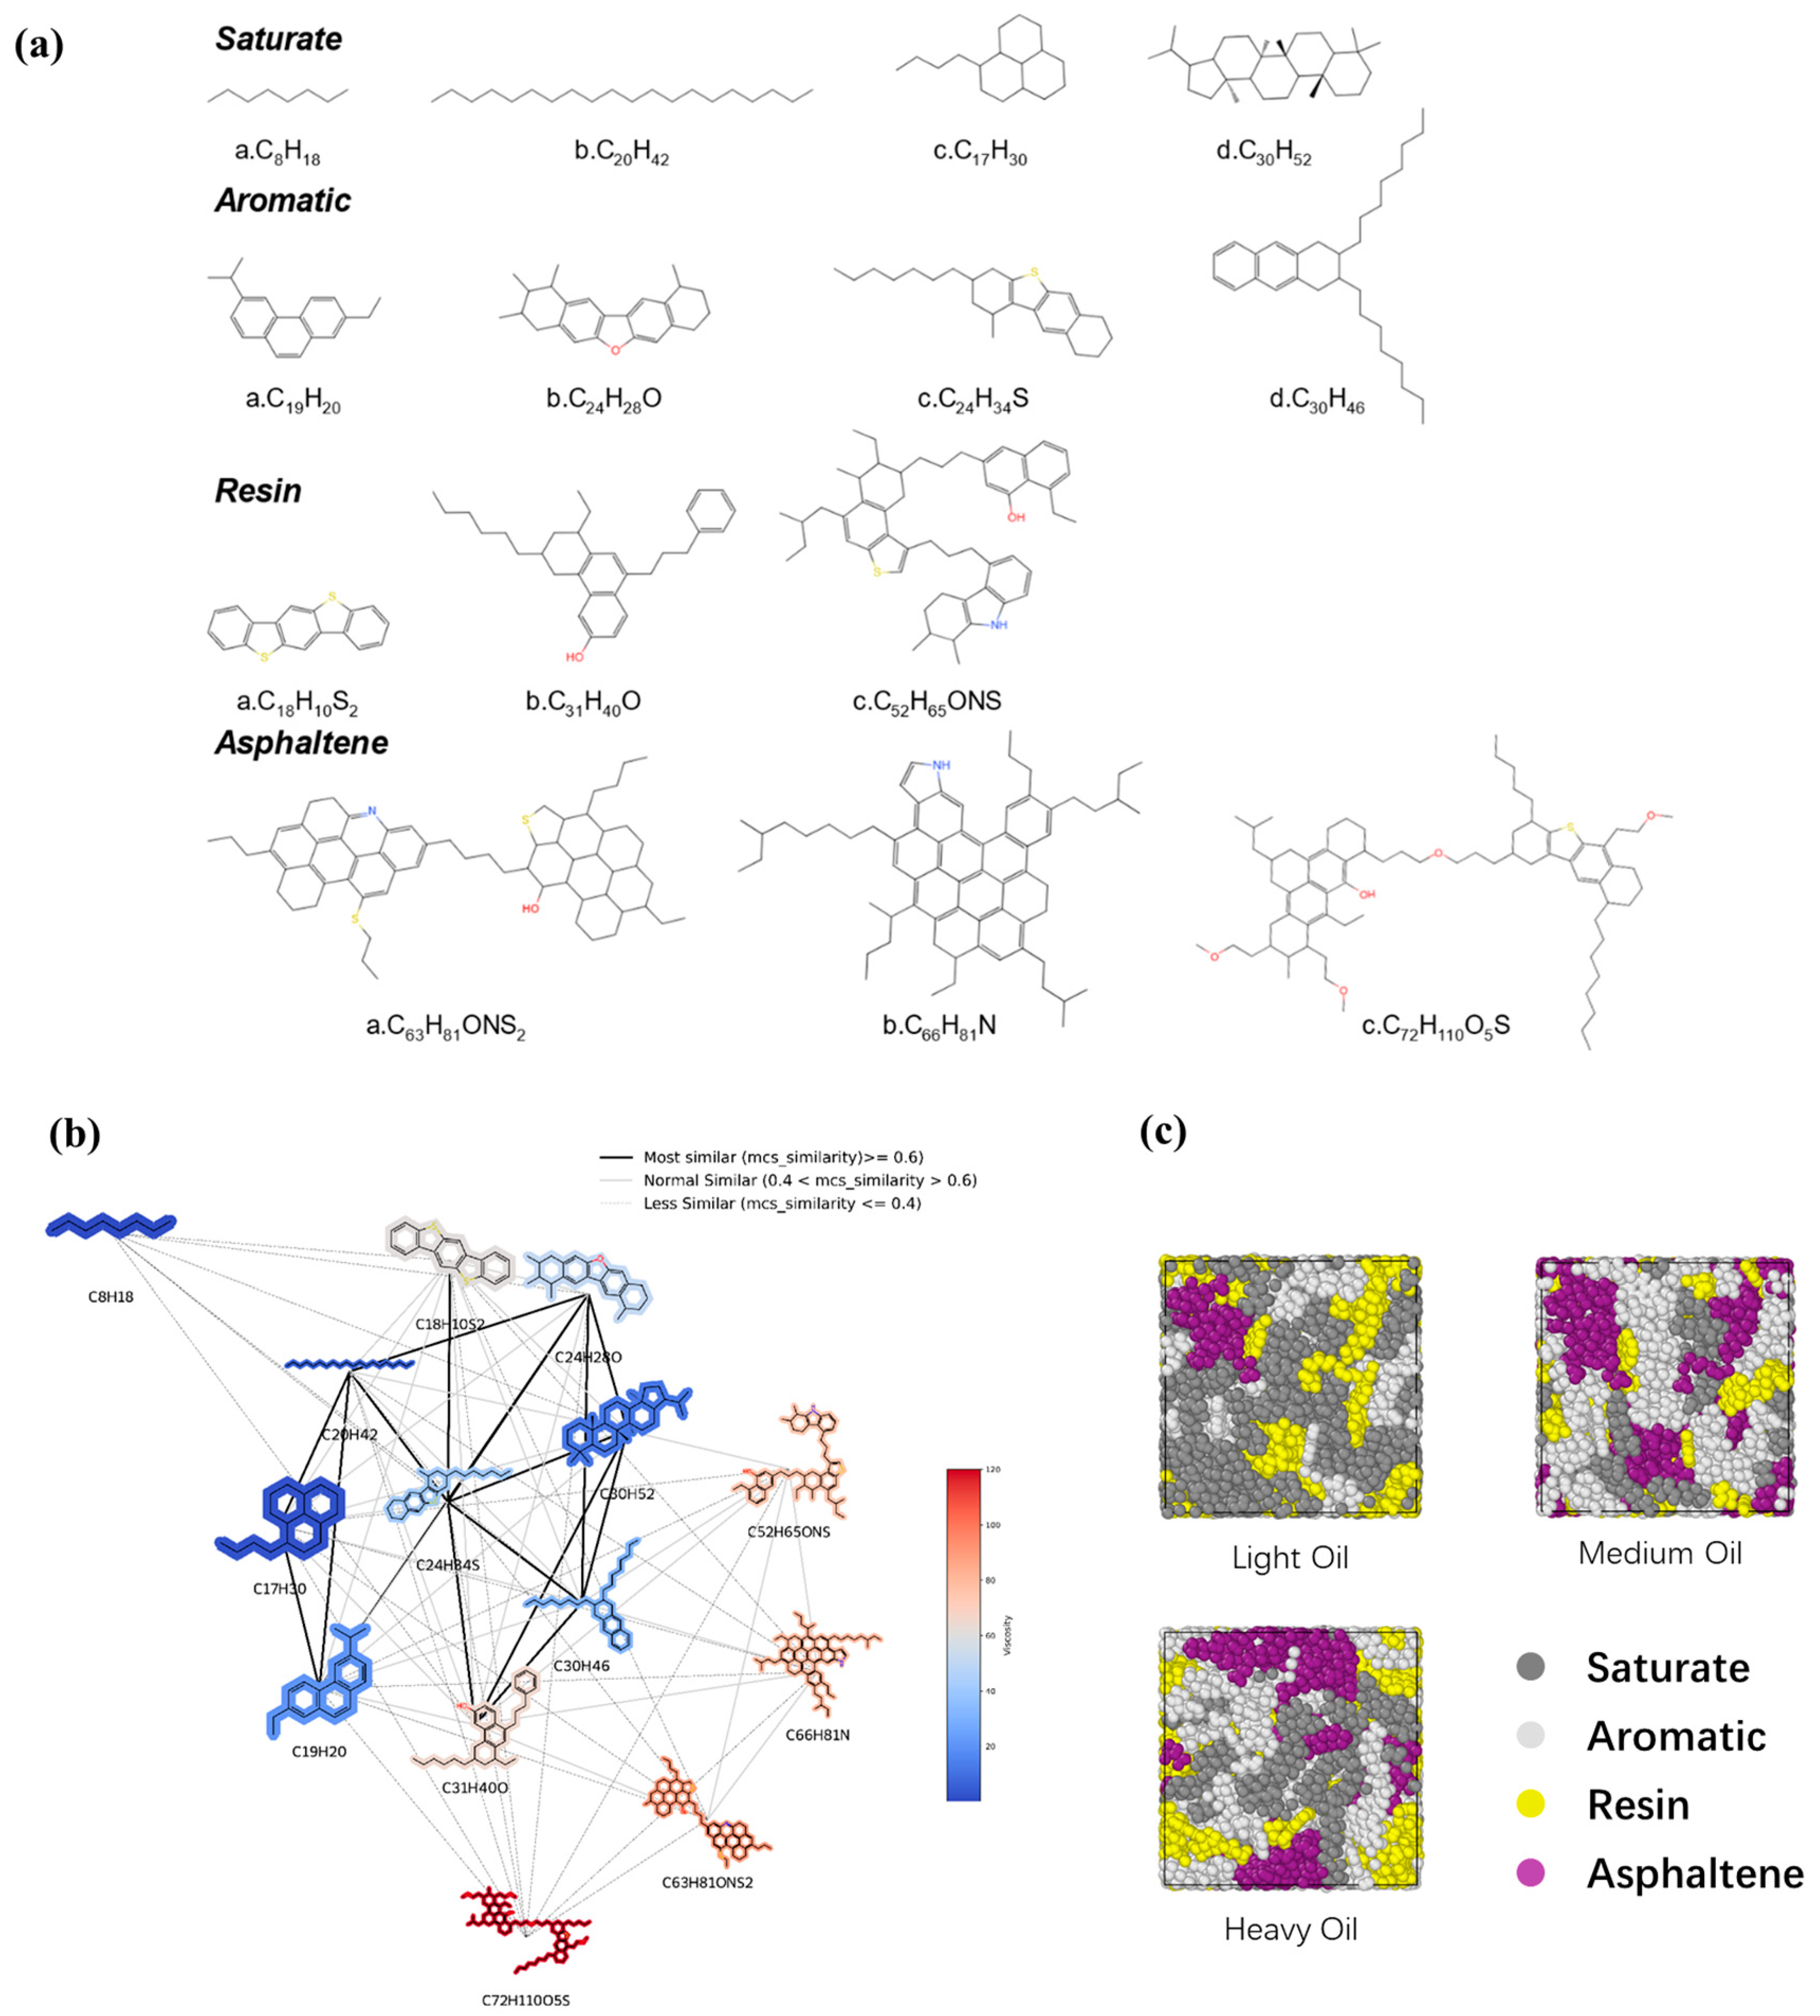
Three digital oil models consisting of 14 distinct molecular structures based on the SARA (saturate, aromatic, resin, and asphaltene) classification [34] were constructed. The molecular structures were selected with reference to the literature and mixed in different ratios to form digital oils [9,35,36]. The specific molecular structures are shown in Figure 1a. In the selected molecular structures, various types of molecules were considered. For the saturated fraction, short and long straight-chain molecules as well as some alicyclic molecules were chosen. In the aromatic fraction, we selected molecules containing aromatic rings with a few heteroatoms. The resin fraction contained molecules with relatively high proportions of heteroatoms and aromatic rings, whereas the asphaltene fraction included large planar molecules featuring numerous aromatic and alicyclic rings. Three digital oils (light, medium, and heavy) were constructed with increasing hydrocarbon ratios to represent different crude oil densities. It should be noted that definitions of light, medium, and heavy oils are specifically for the purposes of this study. The number of molecules in each digital oil model is presented in Table S1, and the C/H ratios of the light, medium, and heavy oils were 7.1, 7.6, and 8.1, respectively. Based on the maximum common substructure similarity, we constructed the chemical space of each molecule [37]; this visualization method replaces the nodes with 2D molecular structures to provide an intuitive view of the relationship between the molecular structure and viscosity (Figure 1b). The schematic representations of the three digital oils (light, medium, and heavy) are provided in Figure 1c.
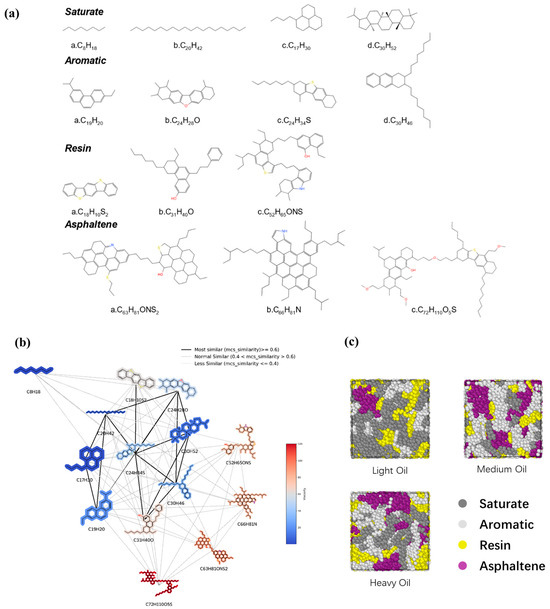
Figure 1.
(a) Selected molecular structures of digital oils. The blue atoms represent nitrogen atoms and hydrogen atoms attached to them; The red atoms represent oxygen atoms and hydrogen atoms attached to them; The yellow atoms represent the sulfur atoms and the hydrogen atoms attached to them. (b) Network representation of the chemical spaces constituted by each molecular structure. The color represents the magnitude of the component’s viscosity, with viscosity gradually increasing from blue to red. (c) Schematic representation of the three digital oils. Dark gray represents saturate, light gray represents aromatic, yellow represents resin, and purple represents asphaltene.
2.2. Simulation Parameters
The viscosity–temperature properties and aggregation behaviors of the three digital oils were calculated using the Large Scale Atomic/Molecular Massively Parallel Simulator (LAMMPS) [18,38]. The initial configuration and model construction were performed using PACKMOL (v20.010) [39] and Moltemplate (v2.20.20) [40] software. PACKMOL is a packing algorithm that creates initial points for molecular dynamics simulations by stacking molecules in defined regions of space. The simulation box constructed by this stacking ensures the stabilization of short-range repulsive interactions. Moltemplate is a general-purpose cross-platform molecular generator for LAMMPS that assigns appropriate parameters to atoms and molecules based on the desired force fields. Periodic boundary conditions were applied in the x, y, and z directions. Well-defined classical intramolecular and intermolecular potentials were combined with the OPLS-AA force field, which has been successfully applied in previous studies to analyze the density and aggregation behavior of oil systems [9,22,41].
Non-bonding interactions between atoms were characterized using the Lennard–Jones potential with a cutoff distance of 10 Å. To capture the temperature dependences of the oils, simulations were conducted under atmospheric pressure at temperatures ranging from 323 to 453 K. These temperatures were chosen to adequately represent oil behavior under various conditions. The oil molecules were initially uniformly and randomly dispersed throughout the simulation box, which has dimensions of 200 × 200 × 200 Å3. The simulations began with systematic runs under isothermal and isobaric (NPT) conditions for 1.2 ns, allowing the system to reach equilibrium at the specified temperature. We define the equilibrium convergence coefficient , whose relevant description is presented in the Supporting Information. The equilibrated configurations thus obtained were then utilized as the initial states for cluster analysis and for the calculation of density, self-diffusion coefficients, and viscosity.
The mean square displacement (MSD) is an essential metric in the study of fluid micro-dynamics. MSD represents the average distance traveled by atoms and provides insights into the flow characteristics of the fluid. The self-diffusion coefficient can be derived from the Einstein equation relating MSD to the diffusion time:
where ri(t) is the position vector of the atoms in the system at time t, and ⟨⟩ denotes the average of all oil molecules and the time starting point.
Viscosity is a fundamental physical parameter with critical importance when considering the characteristics of fluid flow. The Green–Kubo formula [18,42,43] is widely used to determine viscosity in MD simulations. Using this method, the velocity of a given system (η) can be calculated as
where kB denotes the Boltzmann constant, V represents the volume of the simulation box, and Pαβ is the non-diagonal element of the stress tensor.
3. Results and Discussion
3.1. Density
Density is one of the most fundamental properties of a liquid. Accurately simulating the density is essential for subsequent calculations. The densities of the three digital oils at different temperatures (323–453 K) were calculated (Table S2), and the fitted curve is shown in Figure S1. The density of digital oils clearly decreased as the temperature increased. As the temperature increased, atomic motion intensified, leading to the expansion of the simulation box, which in turn reduced the density. This observation is in accordance with well-established physical principles.
3.2. Self-Diffusion Coefficient
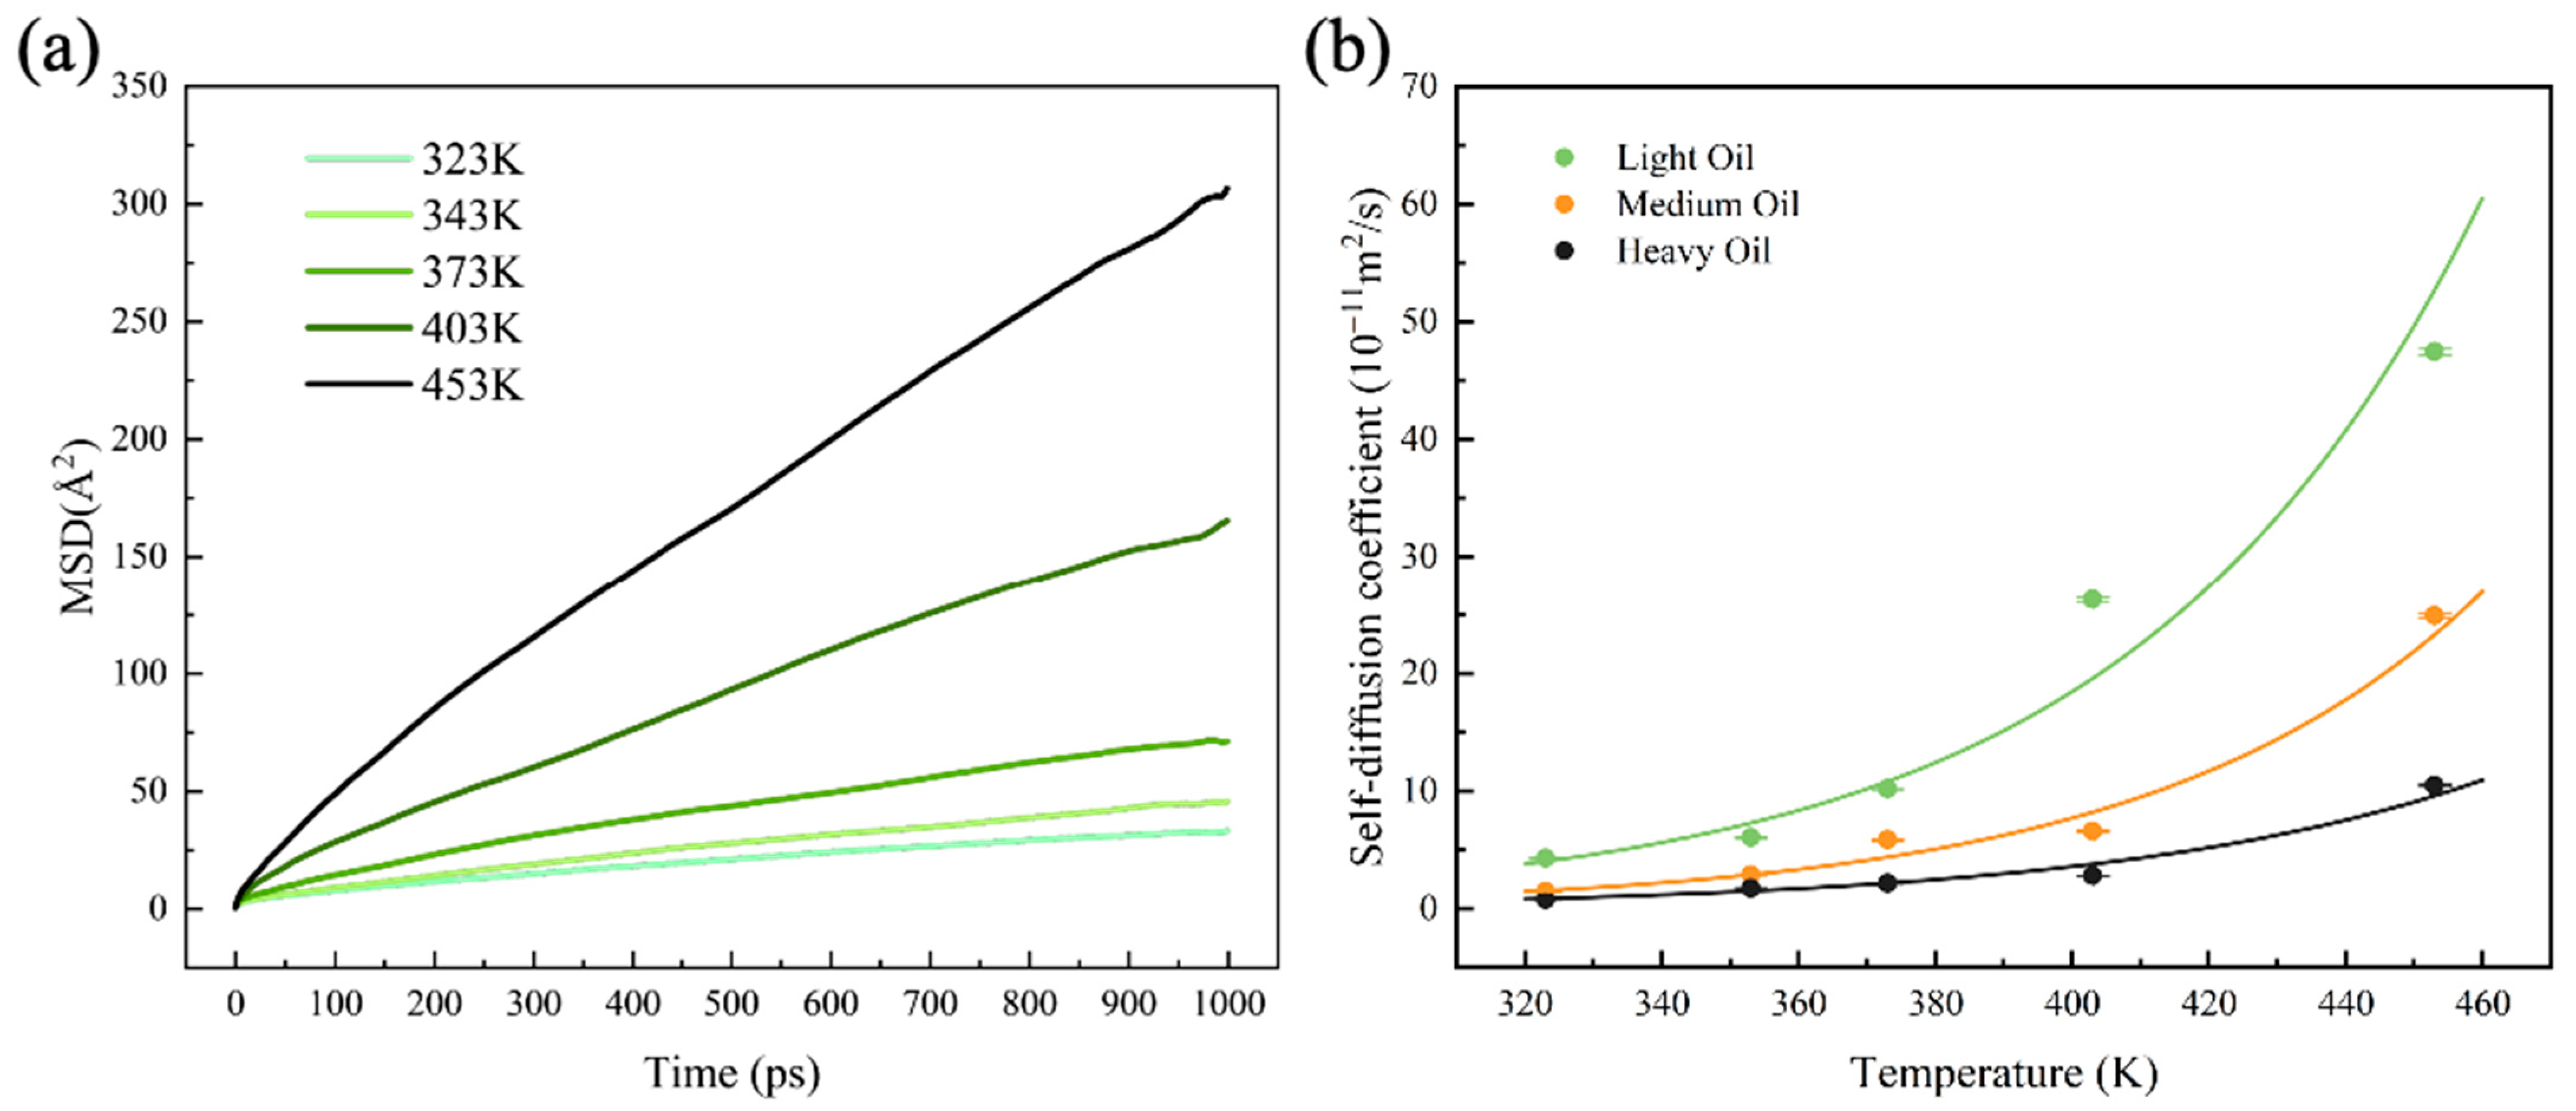
The self-diffusion coefficient is a crucial property that reflects the viscosity–temperature relationship of fluids and indicates the molecular mass transfer capacity in oil systems. In this study, the MSD values of the three digital oils were calculated over a temperature range of 323–453 K based on 1-ns NPT simulations conducted after the system reached equilibrium. The MSD of light oil is shown in Figure 2a, while the MSD values of the medium and heavy oils are shown in Figure S2. The self-diffusion coefficients were determined by calculating the slope of the MSD curve within 400–900 ps, as illustrated in Figure 2b. The specific values of the self-diffusion coefficients are listed in Table S3. The results demonstrate a clear exponential dependence of the self-diffusion coefficient on temperature, with the coefficient increasing exponentially as the temperature increases for all three digital oils.
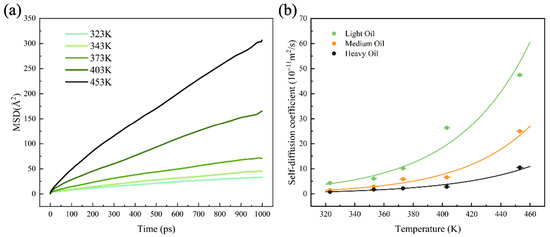
Figure 2.
(a) MSDs of light oil at different temperatures. (b) Self-diffusion coefficients of the three digital oils at different temperatures.
3.3. Viscosity
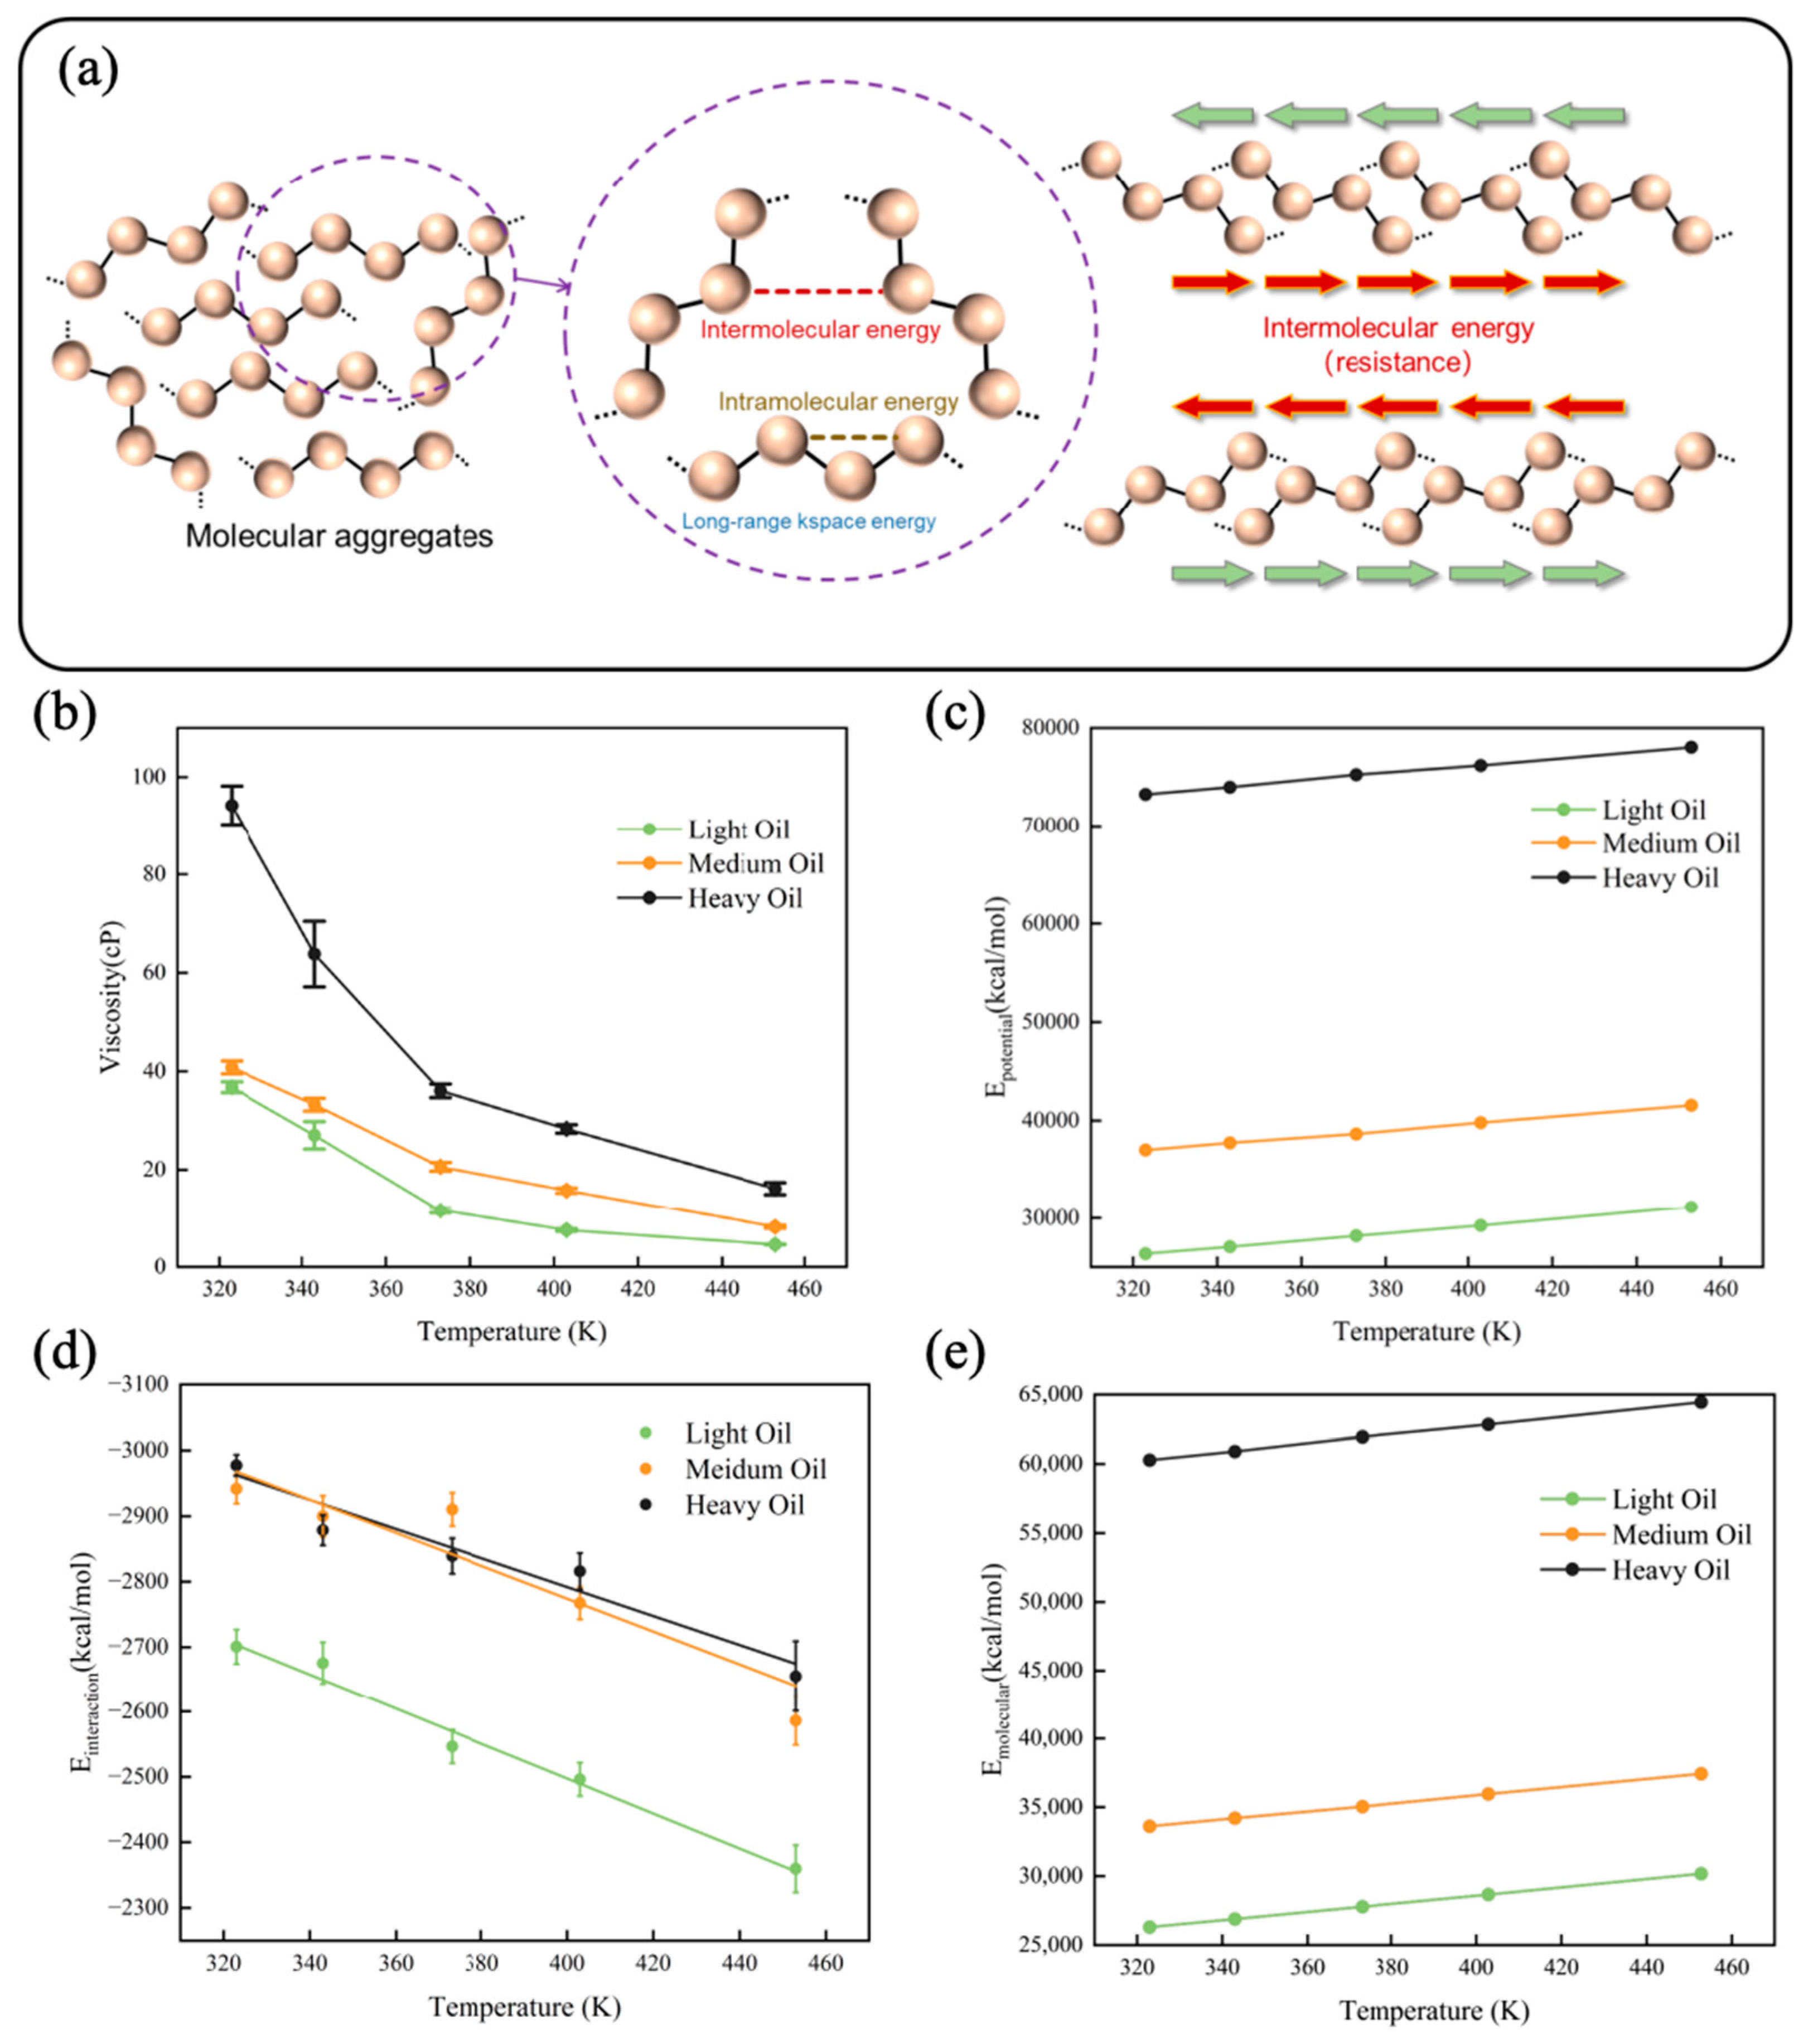
To demonstrate the accuracy of the viscosity derived from the OPLS-AA force field, we first compared the calculated viscosity with the viscosity of the same system reported in the literature [13], showing good agreement. We then calculated the viscosities of the three digital oils over the same temperature range as before, as illustrated in Figure 3b. The specific viscosity values are provided in Table S4. The viscosity decreased sharply with increasing temperature within the range of 323–373 K; at temperatures exceeding 373 K, the viscosity decreased more gradually with increasing temperature. Yao et al. [44] discovered an exponential relationship between solvent viscosity and the binding energy among solvent molecules in pure solvents and binary solvent mixtures. We quantified the different energy components within the system and selected interaction energy as a parameter to fit the viscosity using the Arrhenius equation. Figure 3d shows the interaction energies of digital oils at various temperatures. Heavy oil exhibited the highest interaction energy followed by the medium and light oils. The interaction energy of the system decreased with increasing temperature. Figure 3a schematically shows the molecular forces involved. The primary forces affecting viscosity are intermolecular forces, particularly the interaction energy. As interaction energy increases, molecular attraction strengthens, resulting in greater friction between molecules and a higher oil viscosity. The trends in energy observed within the system are both significant and accurate. A pre-factor coefficient, independent of interaction energy, was defined; the equations presented in Table 1 illustrate the numerical correlation between viscosity and interaction energy. To better understand the constitutive relationship between digital oil viscosity and composition, the aggregation degree of the system must be further analyzed from the perspective of molecular structure.

Figure 3.
(a) Schematic diagram of molecular forces. The arrow shows the direction of the molecules. Properties of digital oils at different temperatures: (b) viscosity, (c) potential energy, (d) interaction energy, and (e) molecular energy (the sum of the bond, angle, dihedral, and improper energies).

Table 1.
Fitted equations for the relationship between viscosity, interaction energy and temperature.
In addition to the interaction energy, we calculated the potential energy (Figure 3c) and molecular energy (the sum of bond, angle, dihedral, and improper energy) (Figure 3e) of each digital oil at different temperatures. The diagrams of potential and molecular energy with error bars are shown in the Supporting Information. Potential energy refers to the energy associated with the entire atomic system, while molecular energy encompasses the sum of the bond energy, angle energy, dihedral angle energy, and improper energy. Plots of the data, accompanied by error bars, are presented in the Supplementary Information, because the errors for both potential energy and molecular energy were minimal. Notably, the energy curves were approximately straight lines, indicating that the time period selected for averaging was appropriate.
3.4. Cluster Analysis
To gain a better understanding of atomic mobility, we conducted cluster analysis using OVITO (Open Visualization Tool) [45] to examine the movements of atoms within the system. Clusters formed by atoms directly contribute to the reduction of molecular movement. A cluster is defined as a group of interconnected particles, in which each particle is within the influence of the other particles in the same cluster. Every potential cluster was analyzed, and key parameters such as cluster count, radius of gyration, and relative shape anisotropy were determined. As shown in Figure 4, the number of clusters increased with increasing temperature. This is because increasing temperature caused the kinetic energy of atoms to increase, leading to more vigorous atomic motion and the formation of small clusters. However, owing to the distinct molecular compositions of the three digital oils, the cluster numbers could not be directly contrasted among these different oils. Consequently, to examine atomic aggregation across the various digital oils, we conducted an analysis of the radius of gyration of the clusters.
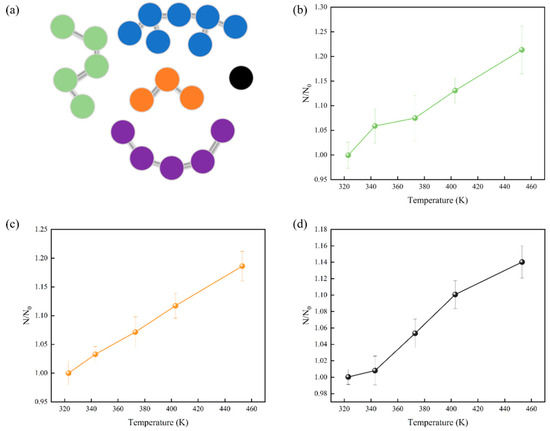
Figure 4.
(a) Schematic representation of a cluster. Connected particles of the same color are considered to be the same cluster. Number of clusters of digital oils at different temperatures: (b) light oil in green, (c) medium oil in orange, and (d) heavy oil in gray. N0 is the number of clusters of the digital oil at 323 K, and N is the number of clusters of the digital oil at the temperature of the corresponding horizontal coordinate.
The radius of gyration directly reflects the size of the cluster. The probability distribution of the radius of gyration at 373 K was calculated, as depicted in Figure 5. The probability distribution can be broken down into four distinct regions corresponding to radius of gyration values of 0–1.5 Å, 1.5–4 Å, 4–5.5 Å, and >5.5 Å. For all three digital oils, the strongest peaks in the distribution functions were located in the first region, indicating that clusters with sizes of 0–1.5 Å were the most abundant in all oils. In the second region, the peaks were all weaker than those in the first region, and the distribution peaks of light and medium oils were slightly stronger than that of heavy oil. In the third region, the second peak appeared in all three curves. However, the curves of the heavy and medium oils had two peaks in this region, unlike the curve of light oil. Moreover, the peaks of heavy oil corresponded to a slightly larger horizontal coordinate than that of medium oil in this region. Thus, among the three digital oils, heavy oil had the largest clusters, with medium oil coming second. Considering the similar contents of small clusters in all oils, the large clusters are an obvious obstacle to atomic motion, which explains why the heavy oil showed the largest viscosity.
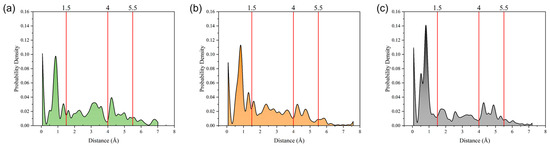
Figure 5.
Probability distributions of the radius of gyration of different oils at 373 K: (a) light oil, (b) medium oil, and (c) heavy oil.
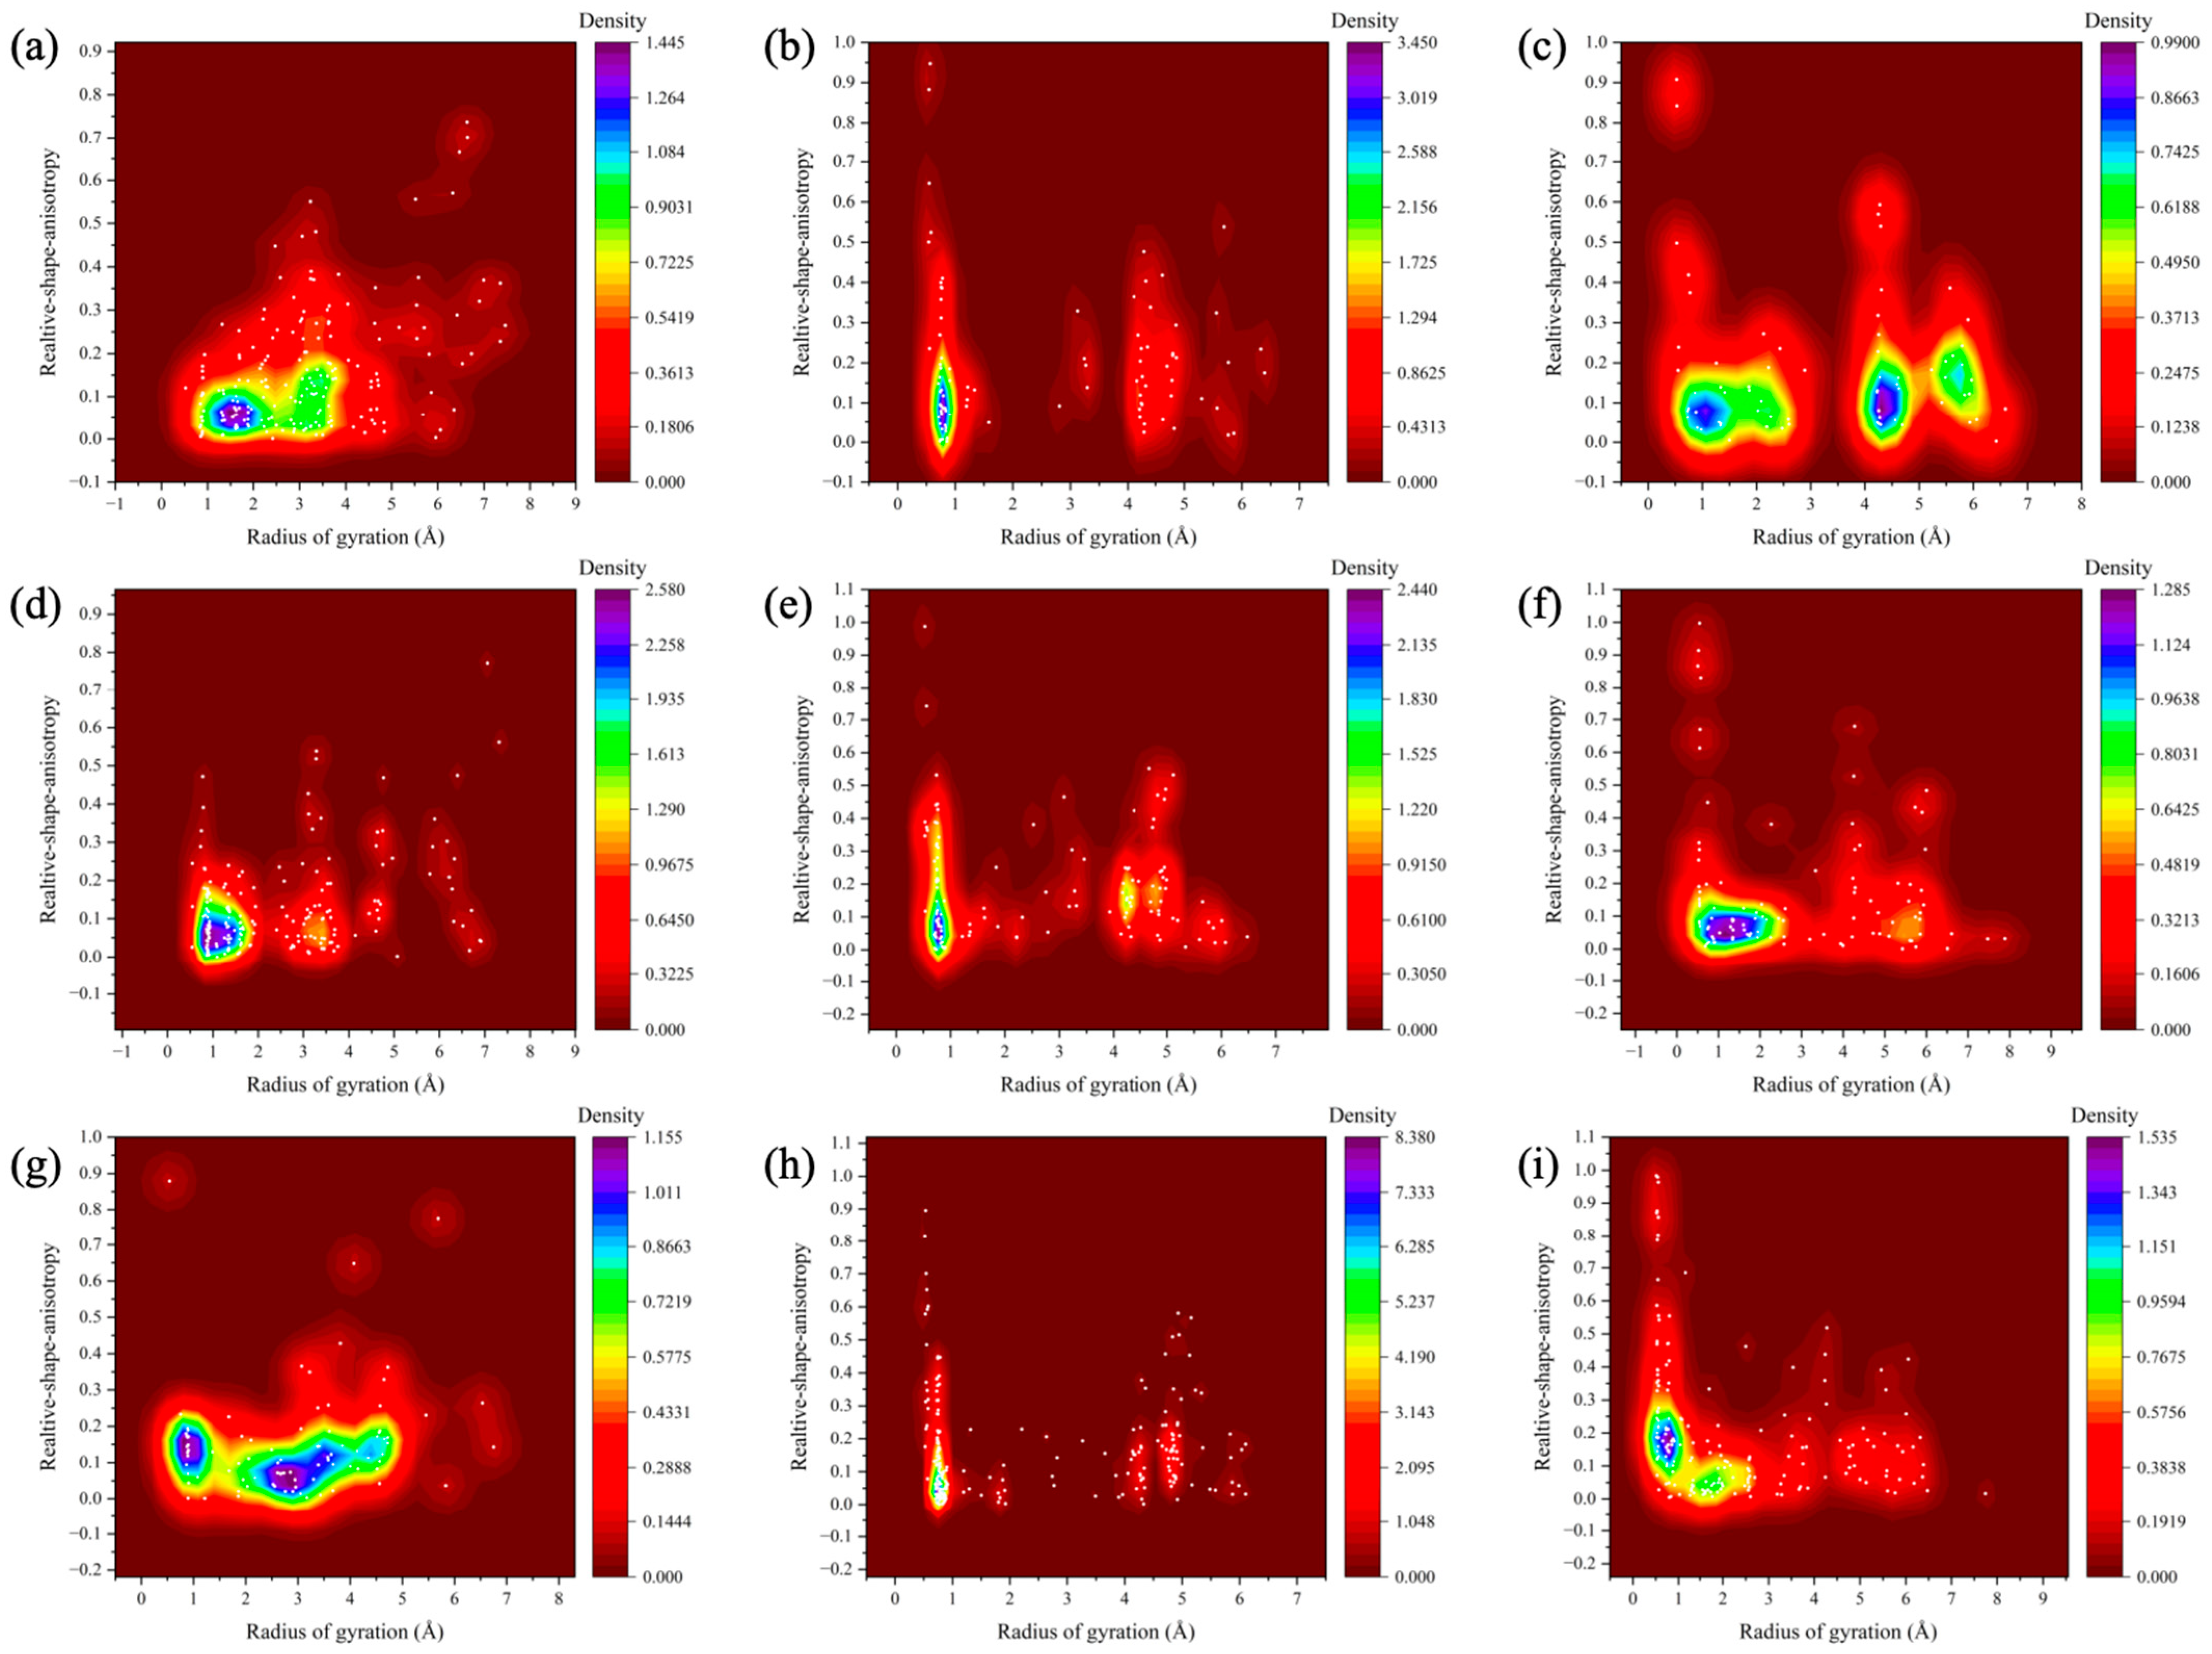
We plotted the relationship between the radius of gyration and the relative shape anisotropy (κ2) for digital oils in their SARA fractions, as illustrated in Figure 6. To simplify the visual analysis, resin and asphaltene were considered a single class. The value of κ2 ranges from 0 to 1, with 0 corresponding to a perfectly spherical structure and 1 indicating a linear, rod-like morphology.
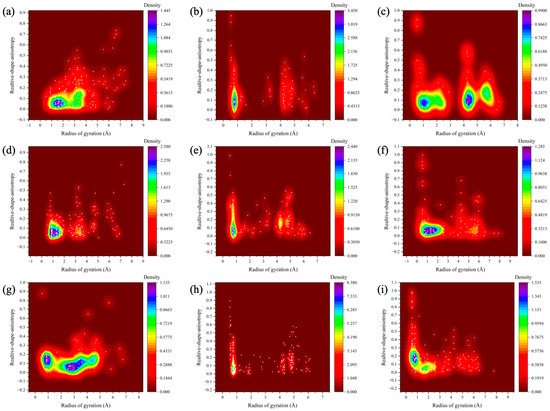
Figure 6.
Relative shape anisotropy of digital oils. (a) Relative shape anisotropy of saturates in light oil. (b) Relative shape anisotropy of aromatics in light oil. (c) Relative shape anisotropy of resin-asphaltenes in light oil. (d) Relative shape anisotropy of saturates in medium oil. (e) Relative shape anisotropy of aromatics in medium oil. (f) Relative shape anisotropy of resin-asphaltenes in medium oil. (g) Relative shape anisotropy of saturates in heavy oil. (h) Relative shape anisotropy of aromatics in heavy oil. (i) Relative shape anisotropy of resin-asphaltenes in heavy oil.
In Figure 6, the κ2 density distributions of the saturated, aromatic, and resin-asphaltene fractions are displayed from left to right, while the distributions of the light, medium, and heavy oils are shown from top to bottom. Horizontal comparison reveals that the clusters formed by resin-asphaltene were larger than those formed by the saturated and aromatic fractions. Additionally, the resin-asphaltene clusters exhibited a wider κ2 distribution, indicating a greater proportion of rod-like structures. Due to their elongated shapes, these rod-like clusters exhibit lower mobility compared to spherical clusters. The aromatic clusters were smaller than the saturated clusters, likely due to the presence of more n-C20 molecules in the saturated fraction; these long straight-chain molecules increased the radius of gyration. In contrast, a lateral comparison reveals that the saturated clusters in heavy oils are significantly larger than those in light and medium oils, with little variation between the latter two. For aromatic fractions, the differences in cluster size among the three oils were minimal. However, the resin-asphaltene clusters in heavy oil were the most rod-like, followed by the medium and light oils.
3.5. Radial Distribution Function (RDF) Analysis
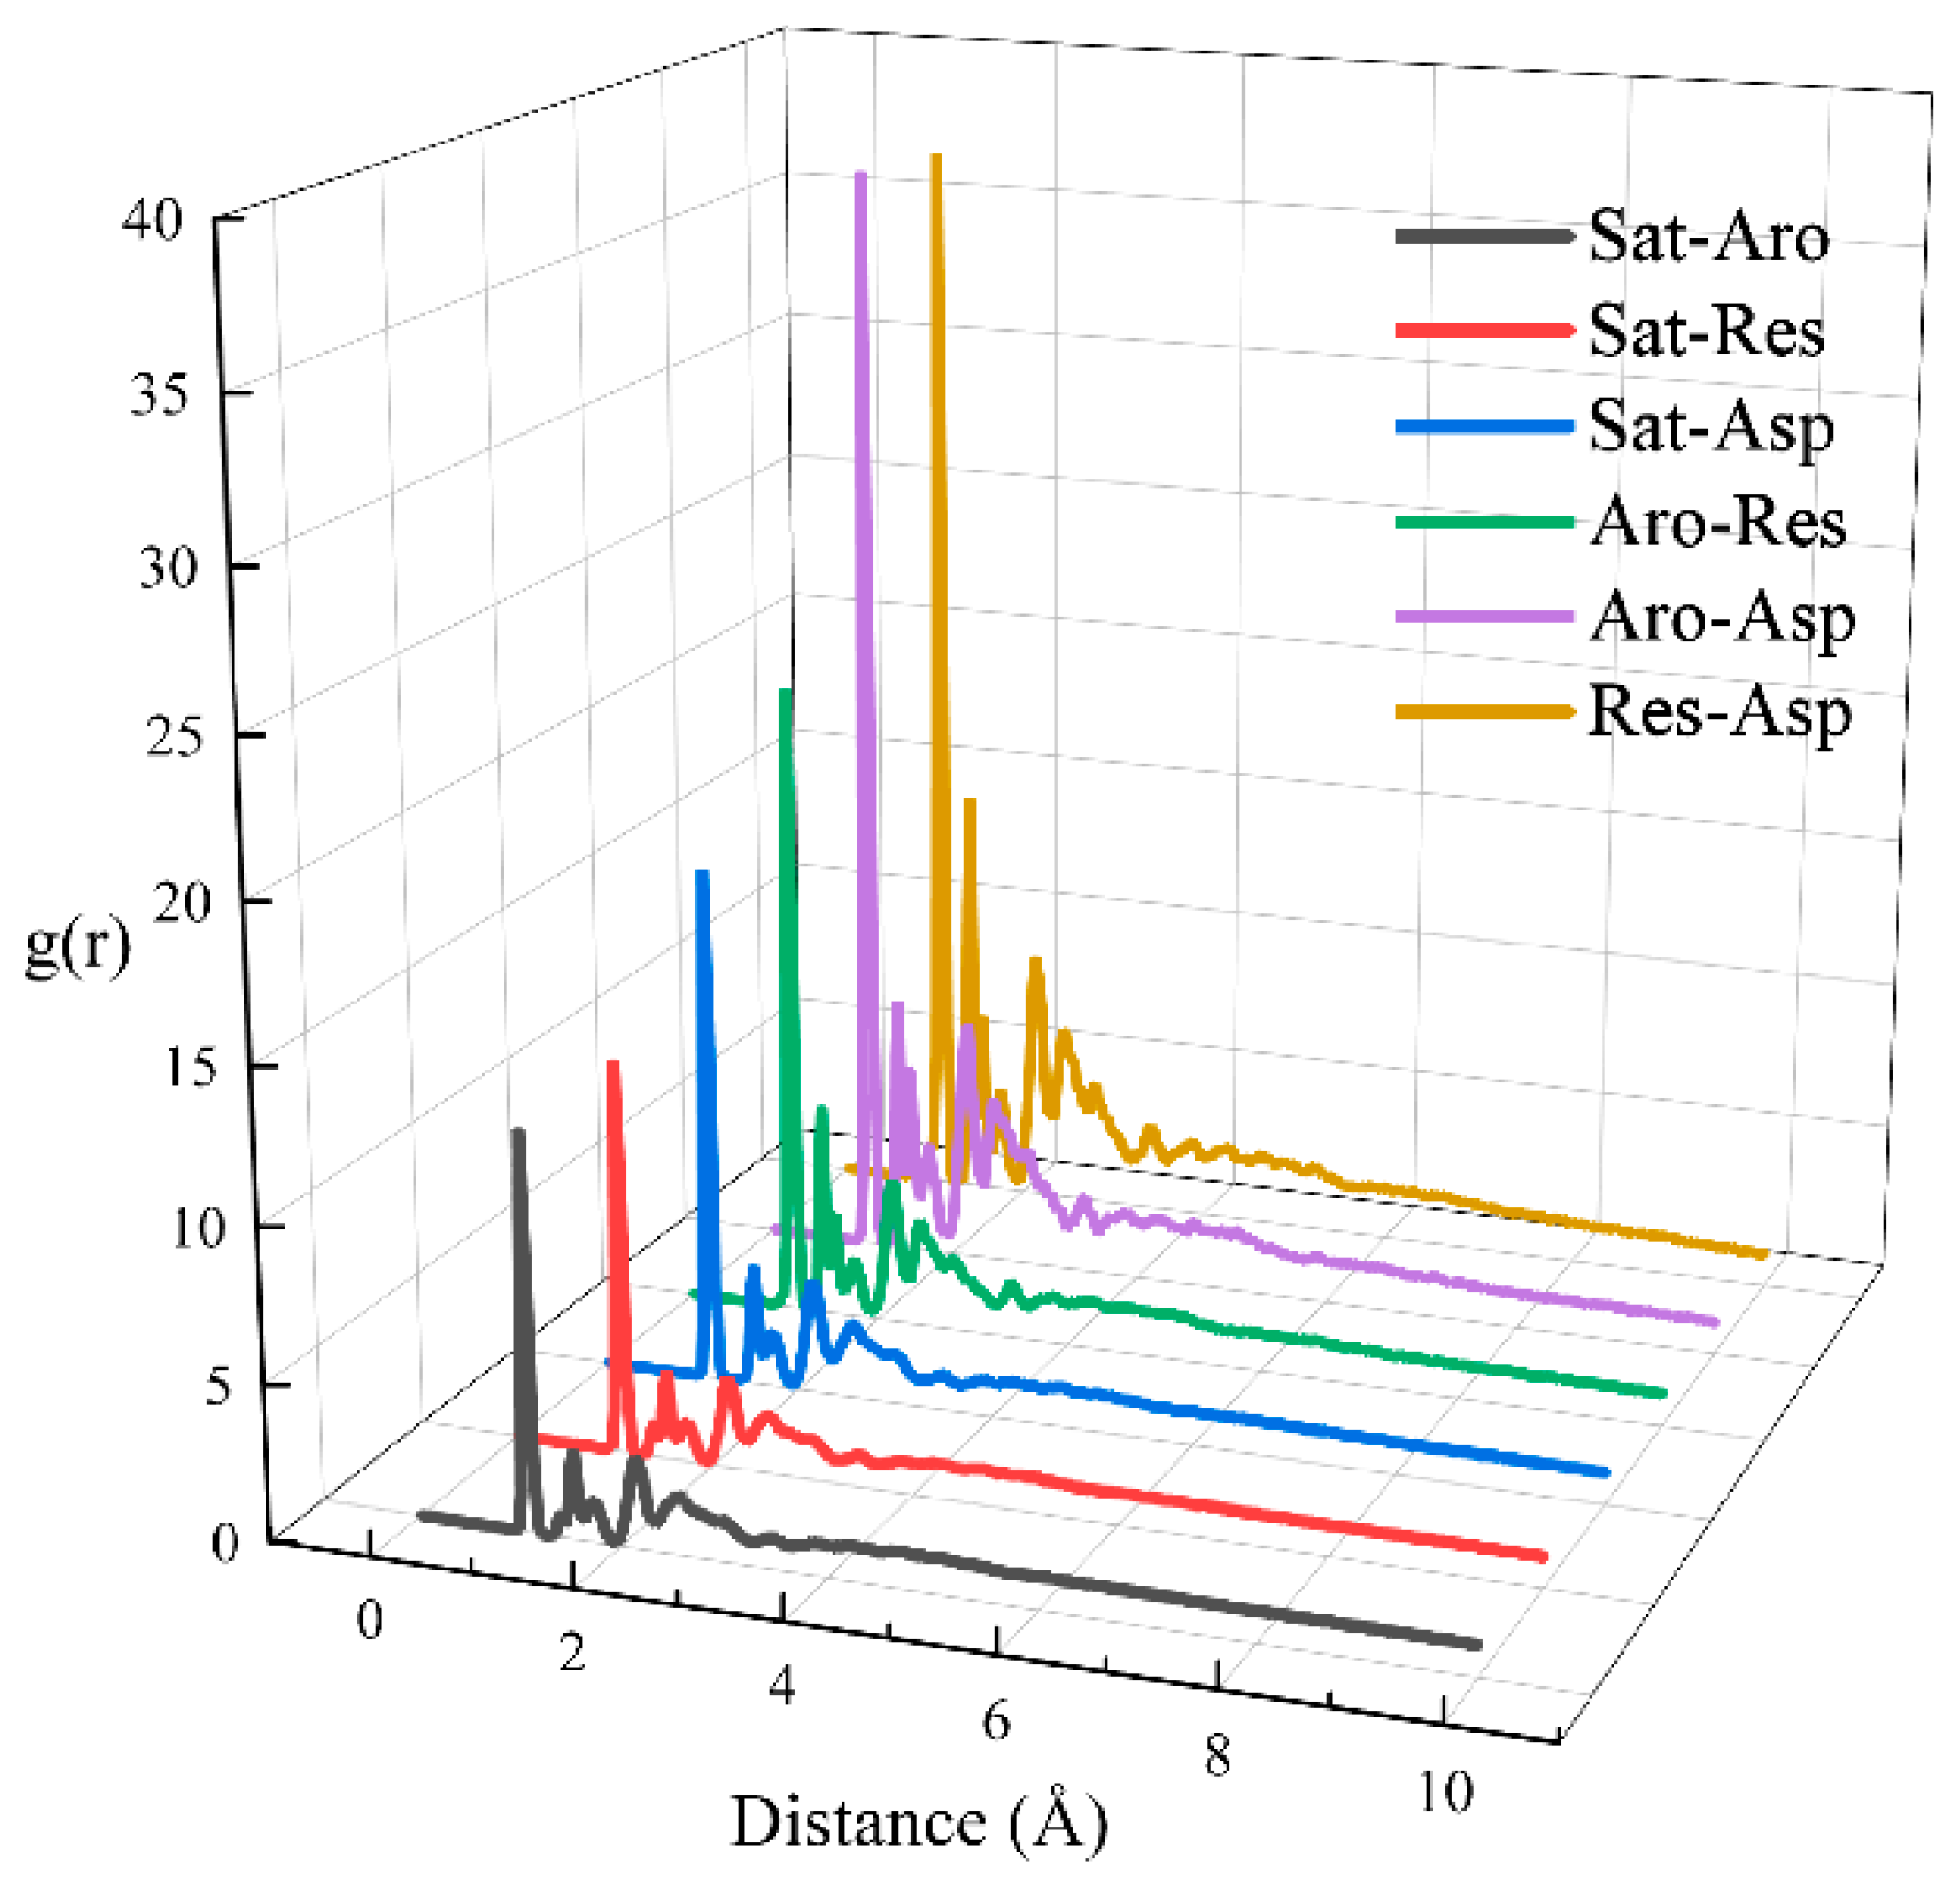
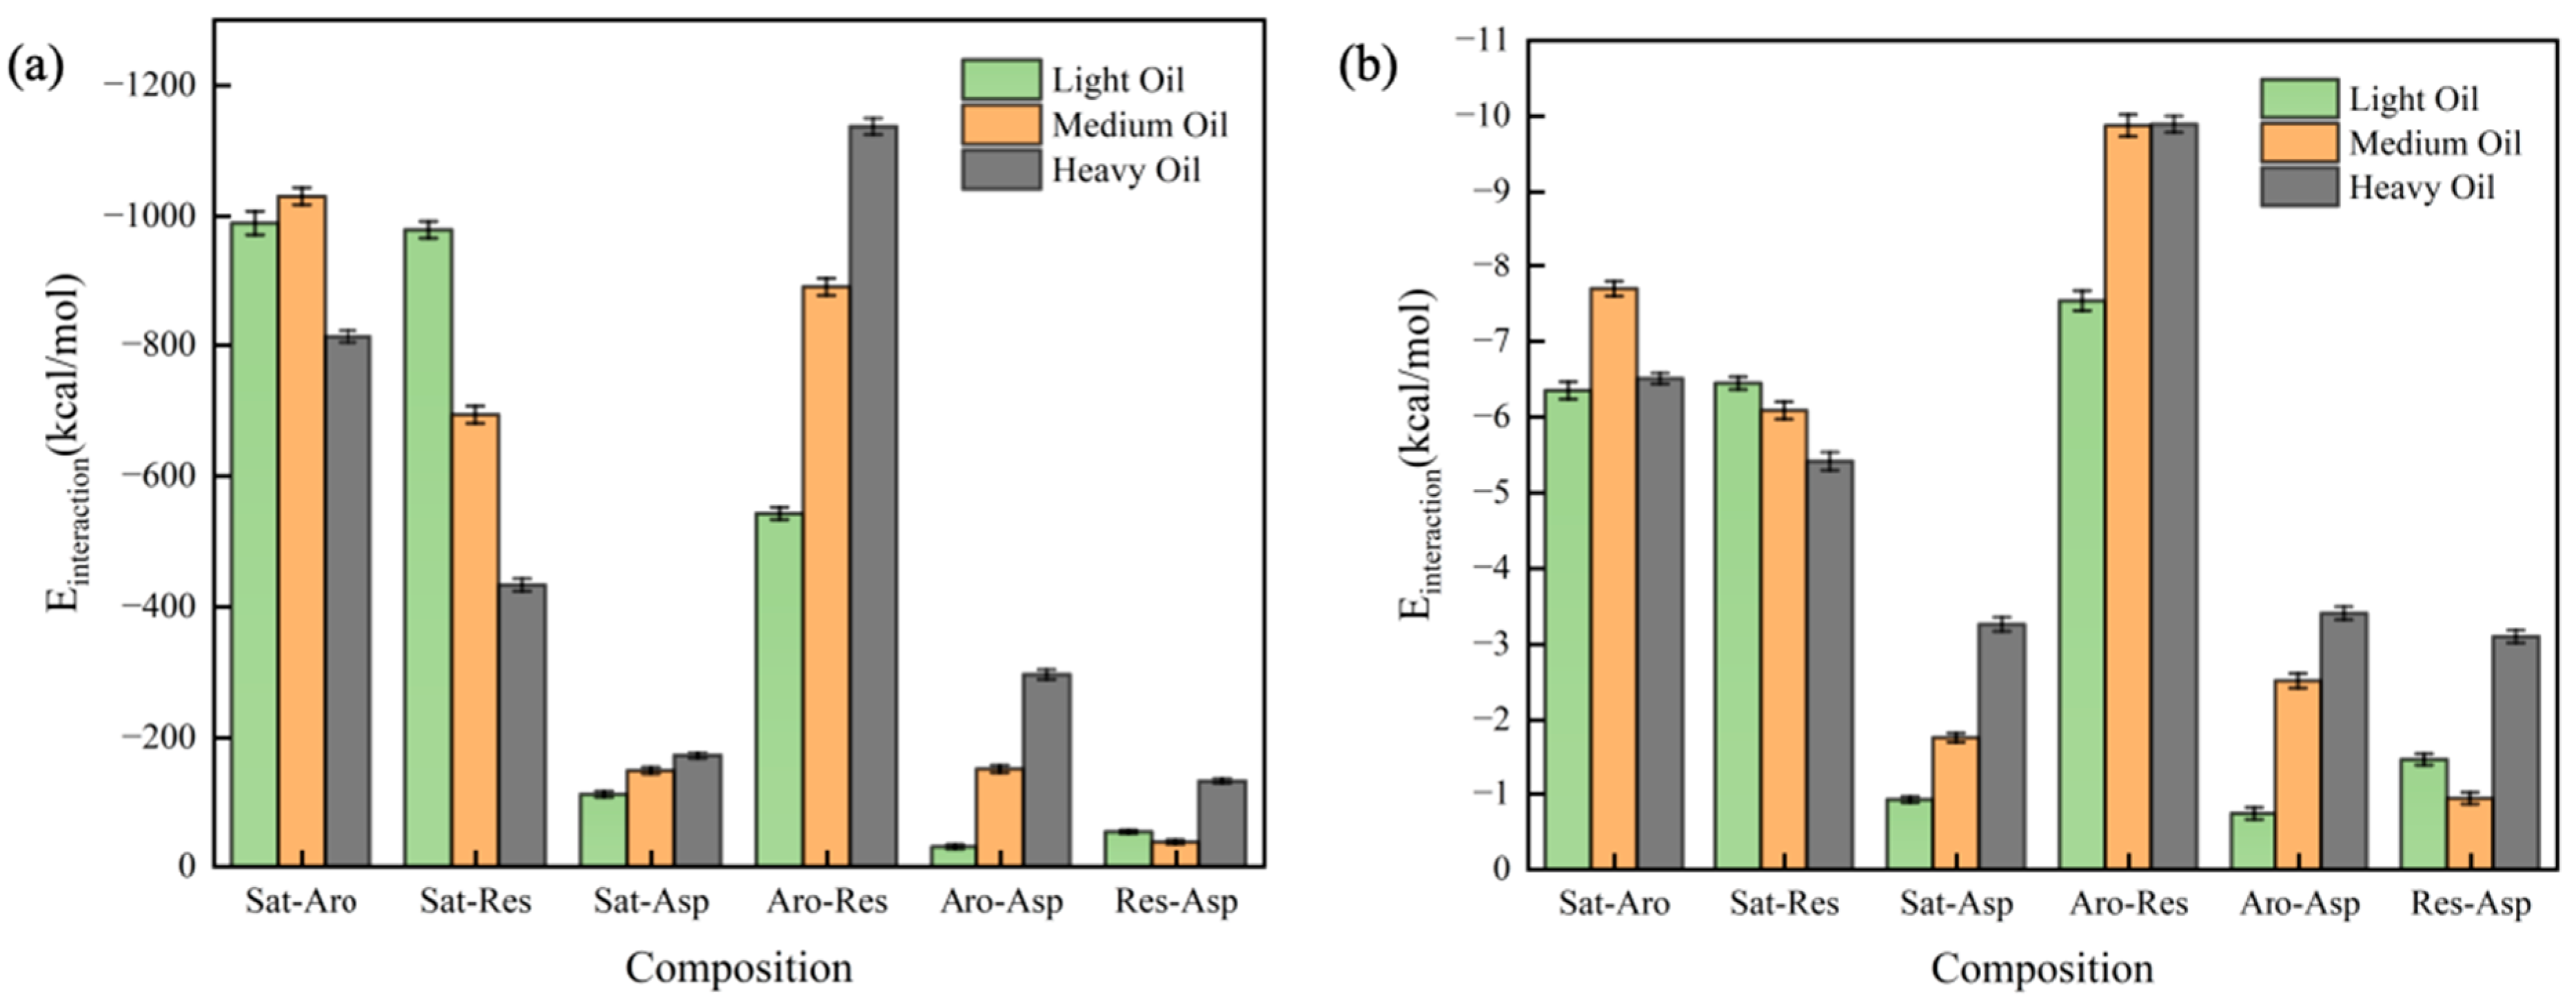
In this section, we calculated the RDFs of two-component systems at 323 K, as depicted in Figure 7. The individual RDFs are plotted in Figure S5. A stronger peak in the RDF indicates a greater degree of aggregation at the corresponding horizontal coordinate. All six RDFs show peaks at approximately x ≈ 1 Å, with the peak height decreasing in the following order: Res-Asp > Aro-Asp > Aro-Res > Sat-Asp > Sat-Res > Sat-Aro. Additionally, we calculated the interaction energies between the two components at 323 K, as shown in Figure 8. Figure 8a illustrates the total interaction energy between the two components, while Figure 8b presents the average interaction energy for each pair. The interaction energy between saturates and aromatics showed no clear relationship with the hydrocarbon ratio. However, the interaction energy of the Sat-Res combination decreased with an increase in the hydrocarbon ratio, indicating that this interaction contributed to the increasing viscosity of the system. In contrast, the interaction energies of the remaining four combinations increased with increasing hydrocarbon ratio, implying that these interactions also contributed to the change in viscosity. Among the combinations, Aro-Res had the most significant effect.
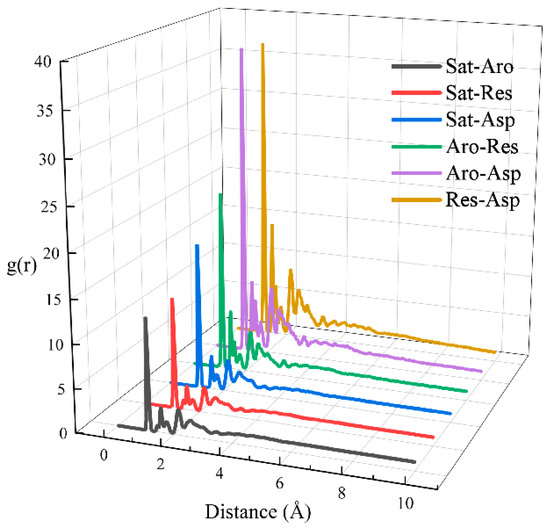
Figure 7.
RDFs for pairs of the different components of digital oils.

Figure 8.
Interaction energy of the two-component system: (a) total interaction energy and (b) average interaction energy.
3.6. Effects of Heteroatoms
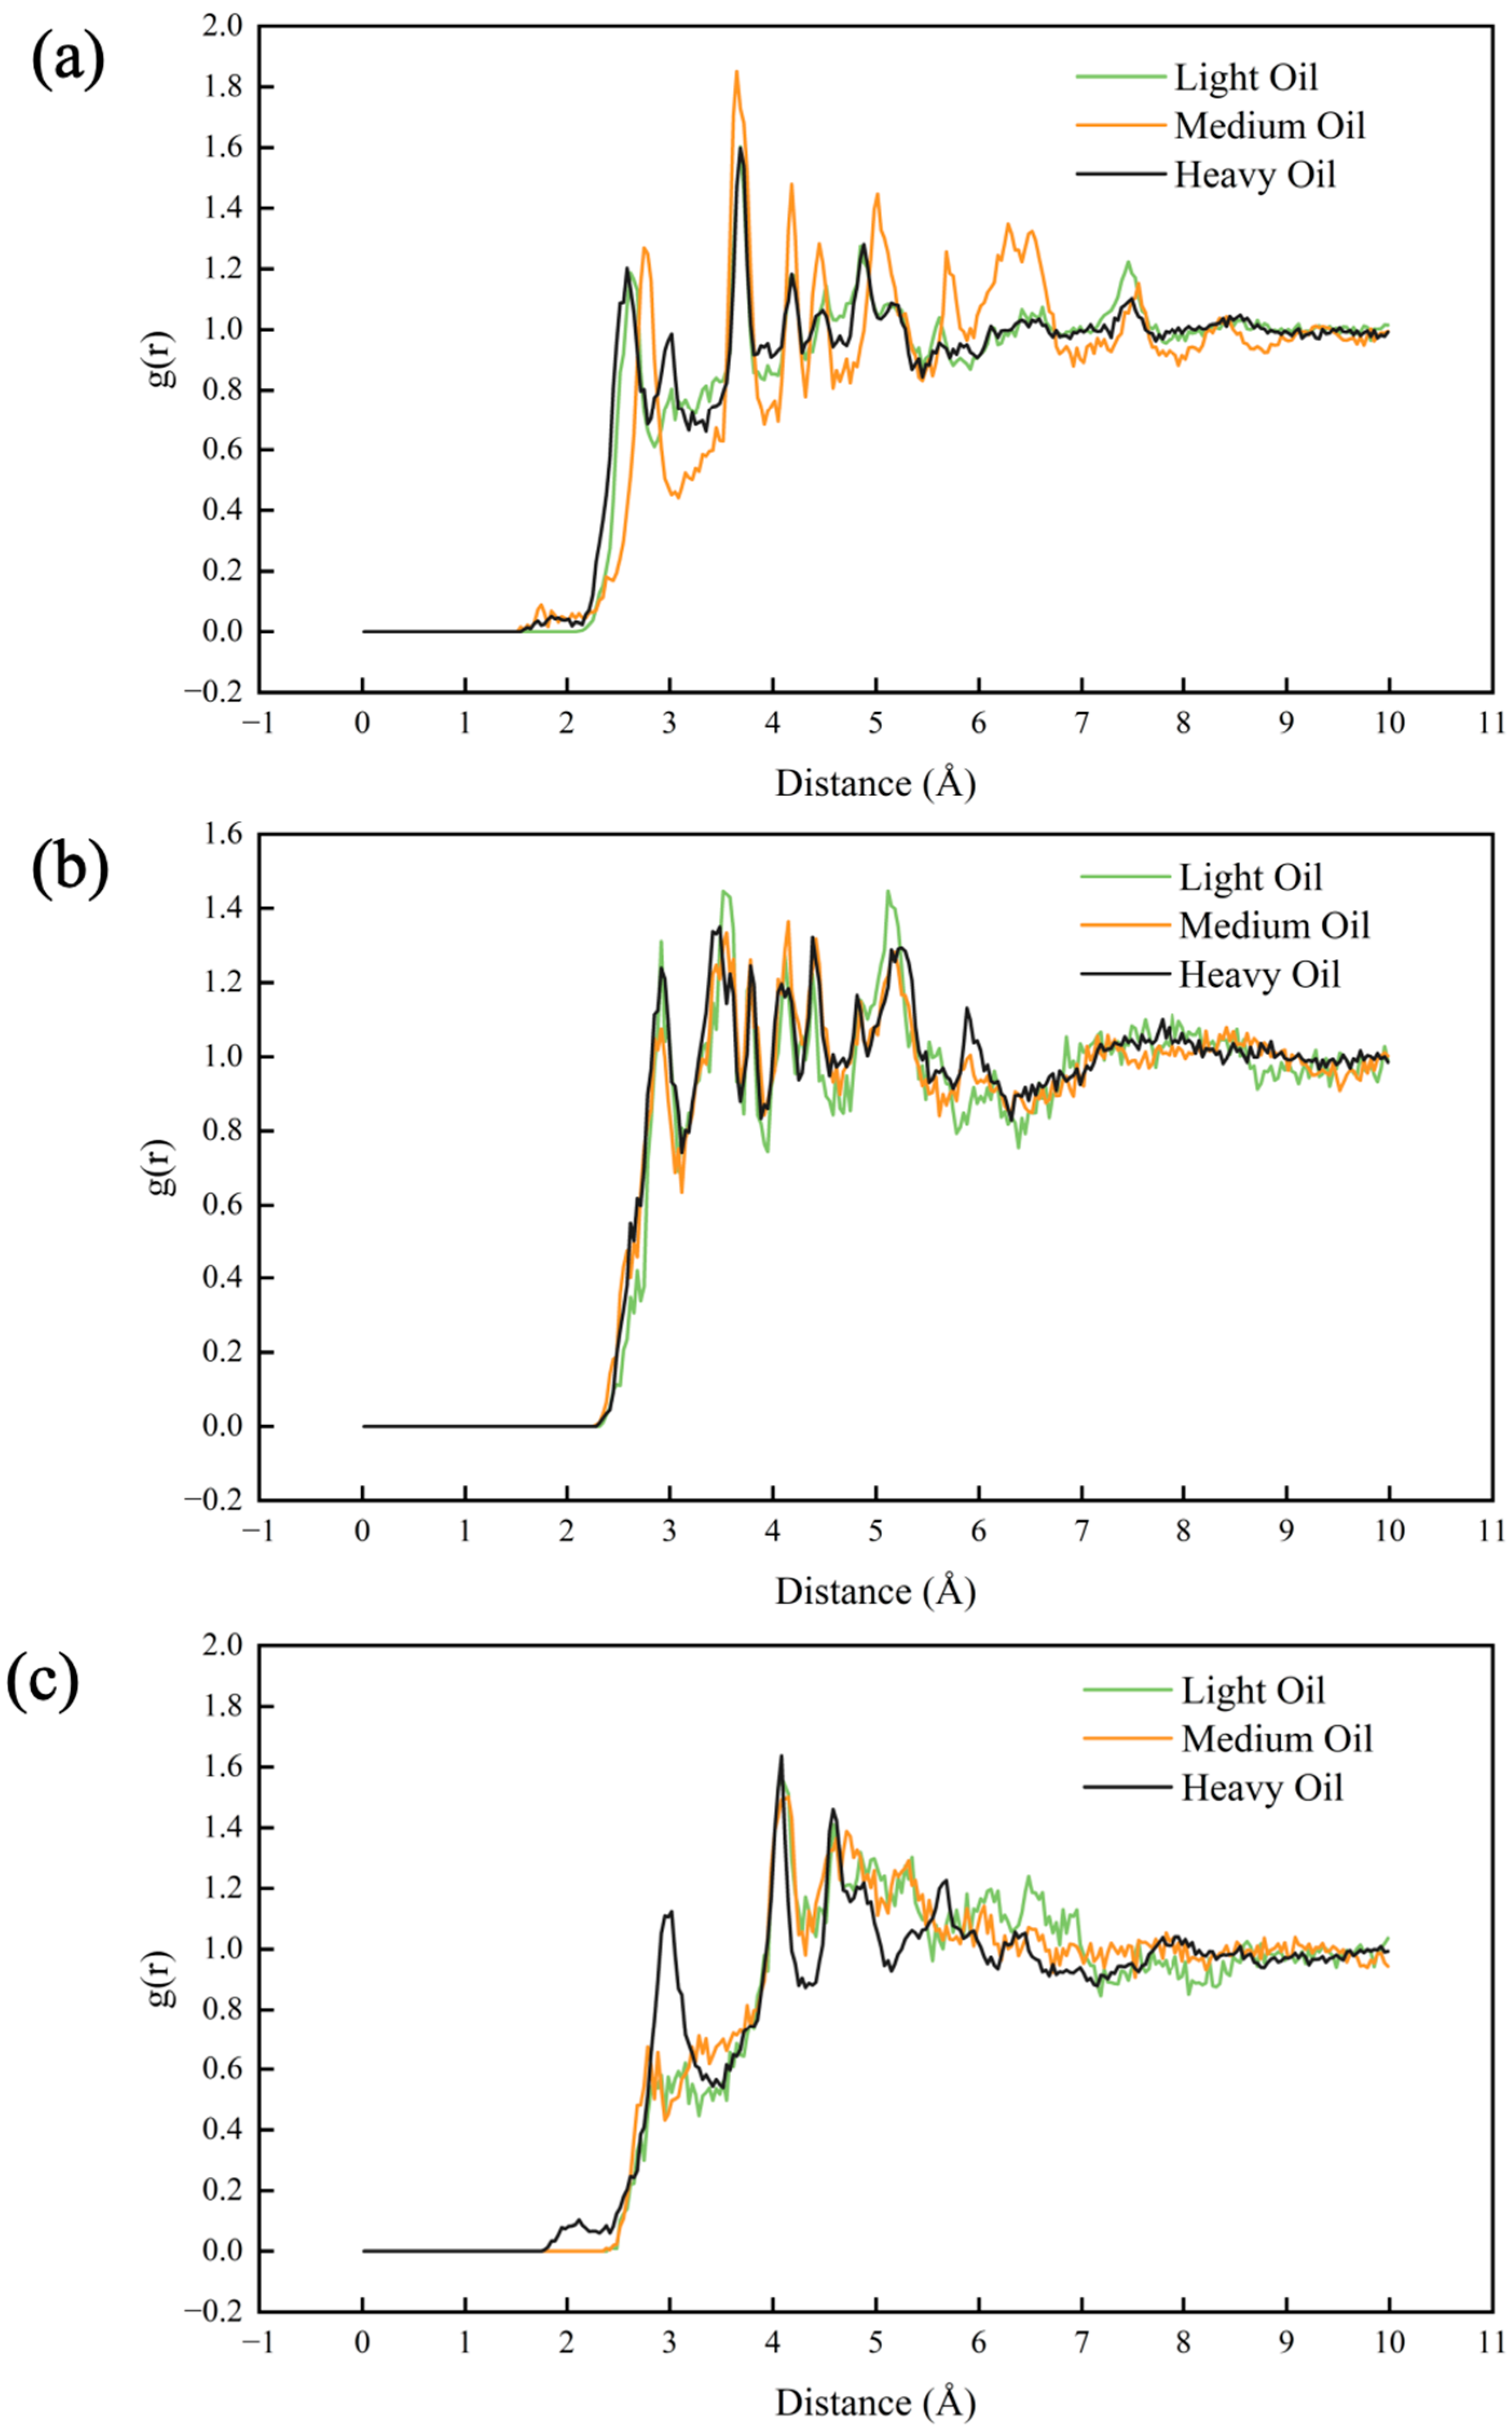
To analyze the contributions of heteroatoms to system aggregation within the molecular structure, we calculated the RDFs between the heteroatoms and the other atoms, which gives a good indication of the presence or absence of an enhanced distribution density in the vicinity of the heteroatoms in the molecular structure, as shown in Figure 9. Heteroatoms here are oxygen, nitrogen, and sulfur atoms in the selected oil molecular structure. The RDFs for nitrogen and oxygen atoms showed minimal differences across the light, medium, and heavy oil systems. However, for sulfur atoms, a more pronounced RDF peak was observed in the heavy oil system than in the light and medium oil systems, indicating that sulfur contributed more significantly to aggregation in heavy oil compared to light and medium oils. The lack of notable differences in the RDFs of nitrogen and oxygen between the oils may be due to their relatively uniform distributions within the molecular structure, making it challenging to observe their effect on aggregation solely through the RDFs. Mathematically, during the calculation of the RDF, the relatively uniform distribution of nitrogen and oxygen indicates that the probability of encountering other atoms at a given distance from them is relatively constant across various oil systems. The RDF is a measure of the average density of atoms around a reference atom. For nitrogen and oxygen, since their distribution is uniform, there are no significant local variations in the density of surrounding atoms that would cause distinct peaks or differences in the RDFs between different oil types. This makes it challenging to observe their effect on aggregation solely through the RDFs.

Figure 9.
RDFs of different elements in the three digital oils: (a) O, (b) N, and (c) S.
3.7. Effects of Metal Ions
Our previous analyses focused on digital oils without any metallic elements. To investigate the effects of metallic elements on the viscosity of digital oil, we added two OEP–Ni molecules in the forms of Ni2+ and OEP2− [46] to the heavy oil system and calculated the viscosity of this nickel-containing system at 323 K. This system is distinguished from the three previous digital oils by the inclusion of an additional element (Ni). Compared to the initial heavy oil system, the viscosity of the metal-containing system was 38.9% higher (91.88 vs. 127.6 cP). The RDF of nickel ions is presented in Figure S6. These findings indicate that the incorporation of Ni2+ led to a significant increase in viscosity because the nickel ions formed aggregates with neighboring atoms, thereby increasing resistance to atomic movement. To understand the mechanism behind the significant increase in viscosity due to the incorporation of Ni2+, we carried out detailed molecular dynamics simulations. We tracked the movement trajectories of nickel ions and neighboring atoms over a long simulation time scale. We observed that Ni2+ ions have a strong tendency to interact with specific neighboring atoms in the heavy oil system. By calculating the coordination numbers, it was found that, on average, each Ni2+ ion ormed stable aggregates with approximately 16 neighboring atoms within a specific distance range (10 Å).These aggregates constituted relatively stable structures within the system.
3.8. Prediction and Interpretable Analysis of Digital Oil Viscosity
We applied four ML techniques [random forest (RF), extra trees (ET), gradient boosting (GB)] along with a basic linear regression (LR) method to predict the viscosities of digital oils based on the temperature, SARA ratio, and elemental composition. To provide a more comprehensive understanding, we conducted an in-depth comparison among these techniques. Random Forest (RF) is an ensemble learning method that builds multiple decision trees during training and aggregates their predictions. It is relatively robust to overfitting due to its bagging strategy. Extra Trees (ET), similar to RF, is also an ensemble of decision trees. However, ET constructs trees in a more random way, which can sometimes lead to better generalization, especially when dealing with complex data distributions. Gradient Boosting (GB) is a sequential ensemble method that constructs decision trees in an iterative fashion with the aim of minimizing the gradient of the loss function. It usually attains high accuracy, yet is more likely to suffer from overfitting if not appropriately adjusted. Basic Linear Regression (LR) is a simple and interpretable model, assuming a linear relationship between the independent variables (temperature, SARA ratio, elemental composition) and the dependent variable (viscosity). Ten-fold cross-validated mean cross-validated R2 score (MCRS) computations were conducted to fine-tune the hyperparameters of the RF, ET, and GB models. The hyperparameters adjusted included the number of estimators (nest), maximum depth (maxdep), and number of features (maxfeat). Information and obtained hyperparameters are listed in Table 2 [27]. The root mean-square-error (RMSE), mean absolute error (MAE), and R2 scores of the ML models were calculated to evaluate their accuracy, as shown in Figure 10a–c. We further compared the simulated viscosity with the predicted viscosity by means of the ET model, as depicted in Figure 10d. Virtually all the points corresponding to the ET model in Figure 10d are in close alignment with the line having a slope of 1. This indicates that the ET model can effectively capture the variations in viscosity, taking into account the known characteristics of digital oils applicable to practical scenarios. In terms of performance, as can be seen from the RMSE and MAE values, RF generally provides a good balance between accuracy and simplicity. ET shows excellent performance in this case, with its points in the comparison plot closely following the ideal line, suggesting high prediction accuracy. GB, although powerful, may require more careful tuning to avoid overfitting. LR, due to its linear assumption, may not capture complex non-linear relationships as effectively as the other three non-linear ML techniques, resulting in relatively higher errors in some cases.
Table 2.
Hyperparameters of the machine learning methods in this work.
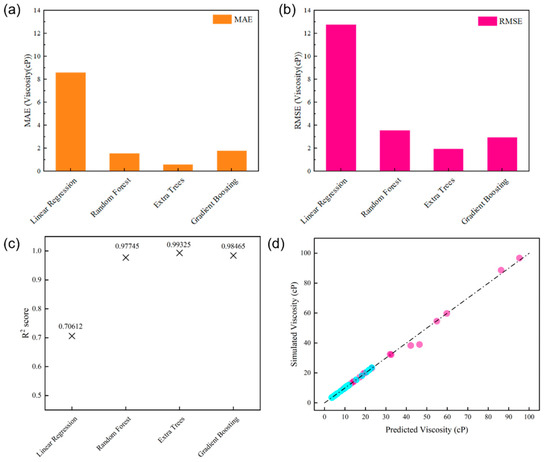
Figure 10.
Comparison of the accuracy of GB, ET, RF, and LR for predicting oil viscosity: (a) MAE, (b) RMSE, and (c) R2. (d) Plot of the simulated viscosity vs. the values predicted using the ET model. The blue dots represent the modeled and predicted viscosity values at high temperature, while the pink dots are those at low temperature.
Additionally, as shown in Table 3, the GB model was employed to generate the feature importance rating (FIR), providing further insights into feature significance. We computed the FIR across the entire temperature range as a baseline. In all three temperature ranges, temperature showed the strongest correlation with digital oil viscosity among all features. The FIR for temperature was lower in the high-temperature range than in the low-temperature range; thus, although temperature was still the most influential factor, its relative importance decreased with increasing temperature. Conversely, the FIR for each element was larger in the high-temperature range than in the low-temperature range, implying that elemental influence on viscosity increased with increasing temperature.
Table 3.
FIR values of various parameters.
The aforementioned results imply that ML models are capable of accurately predicting the viscosities of novel systems. As a result, ML offers a cost-effective and efficient approach for predicting the viscosity of oil systems, circumventing the labor-intensive and computationally demanding process of performing new MD simulations.
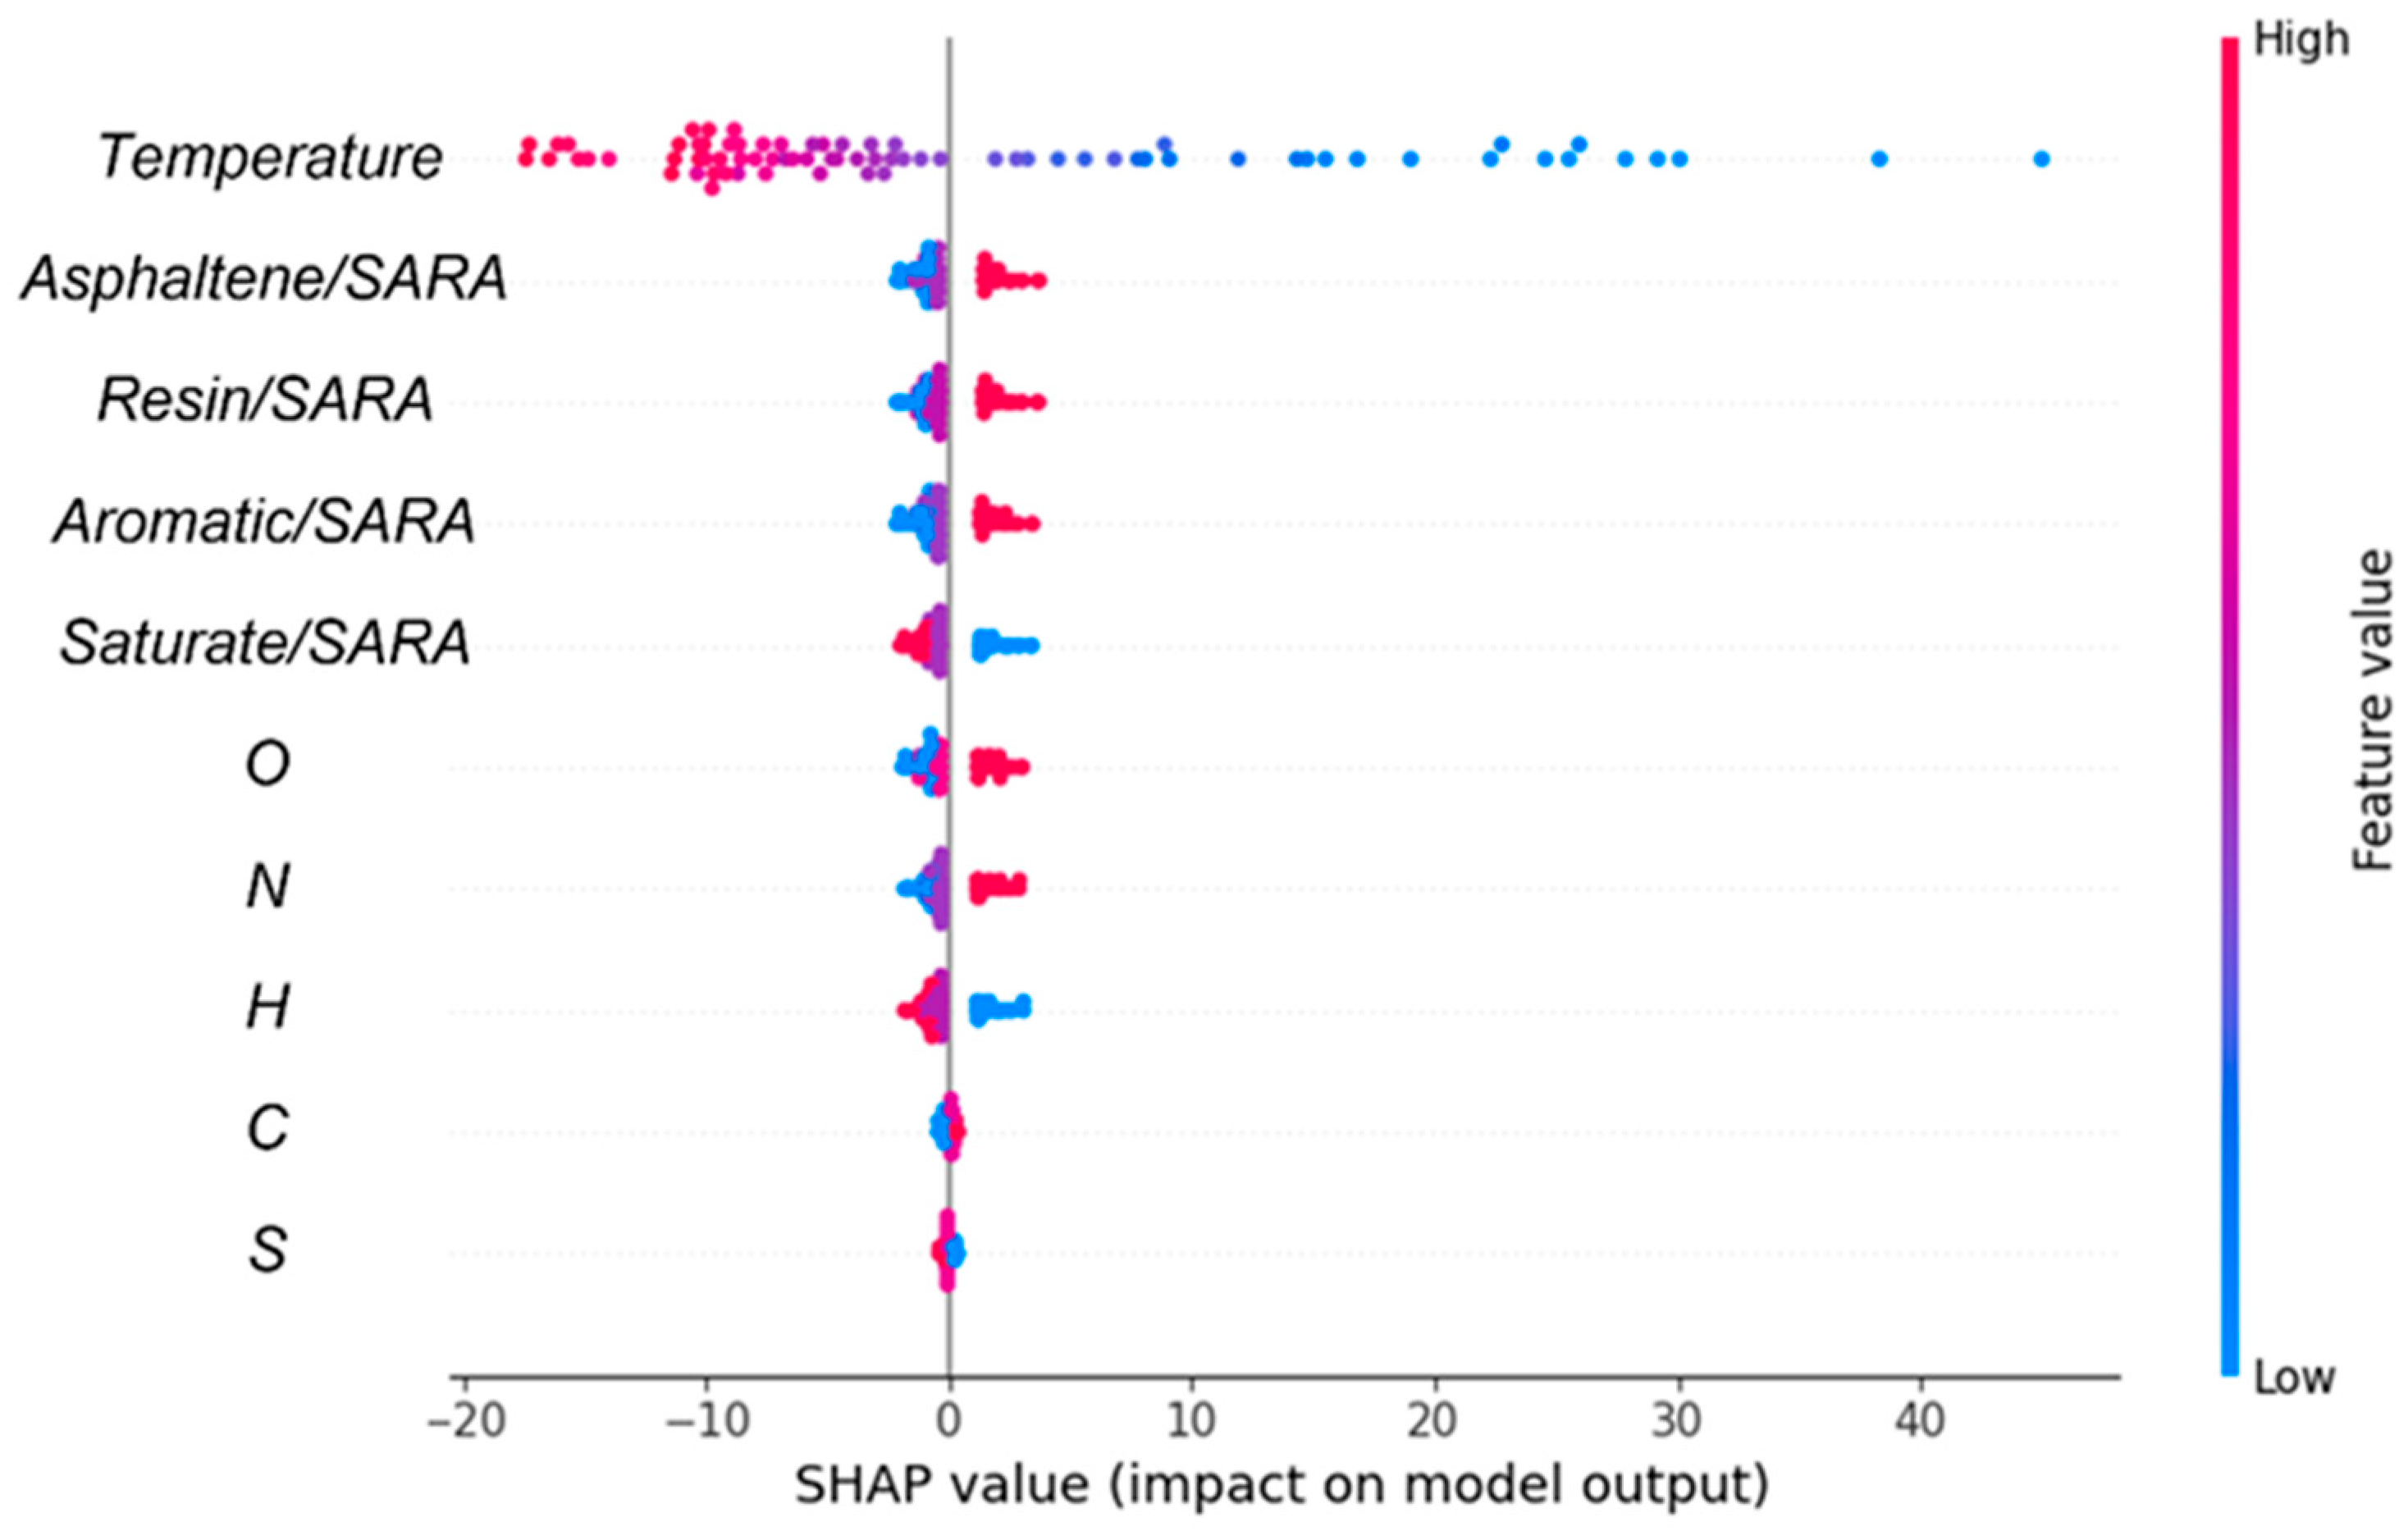
Subsequently, SHAP analysis was employed to investigate the influence of various features (temperature, SARA ratios, and elemental contents) on viscosity. A positive correlation between a feature and the SHAP value implies that the feature exerts a positive influence on viscosity, and conversely. The SHAP visualizations provide more information about the predictions of the ML model, emphasizing the relative importance of each feature in determining viscosity. Thus, the results enabled us to quantify the effect of each feature on viscosity. As illustrated in Figure 11, temperature was the most significant factor affecting viscosity. Interestingly, the impact of carbon on viscosity was weak due to the excessively high carbon content within the molecules. Thus, analyzing the effect of carbon as a whole did not provide sufficient detail; the effects of different carbon–carbon bonds on viscosity should be analyzed in the context of the specific molecular structure.
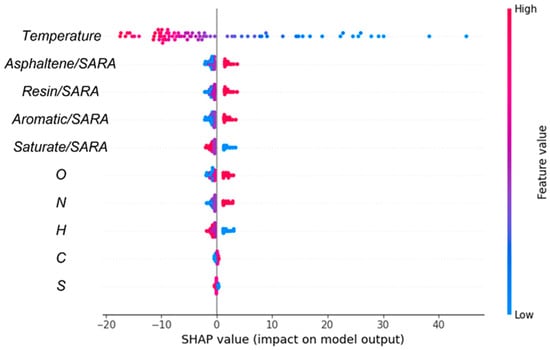
Figure 11.
Importance analysis of input features on output properties. The left axis shows elements that adversely affect the prediction, while the right axis depicts elements that positively influence the prediction.
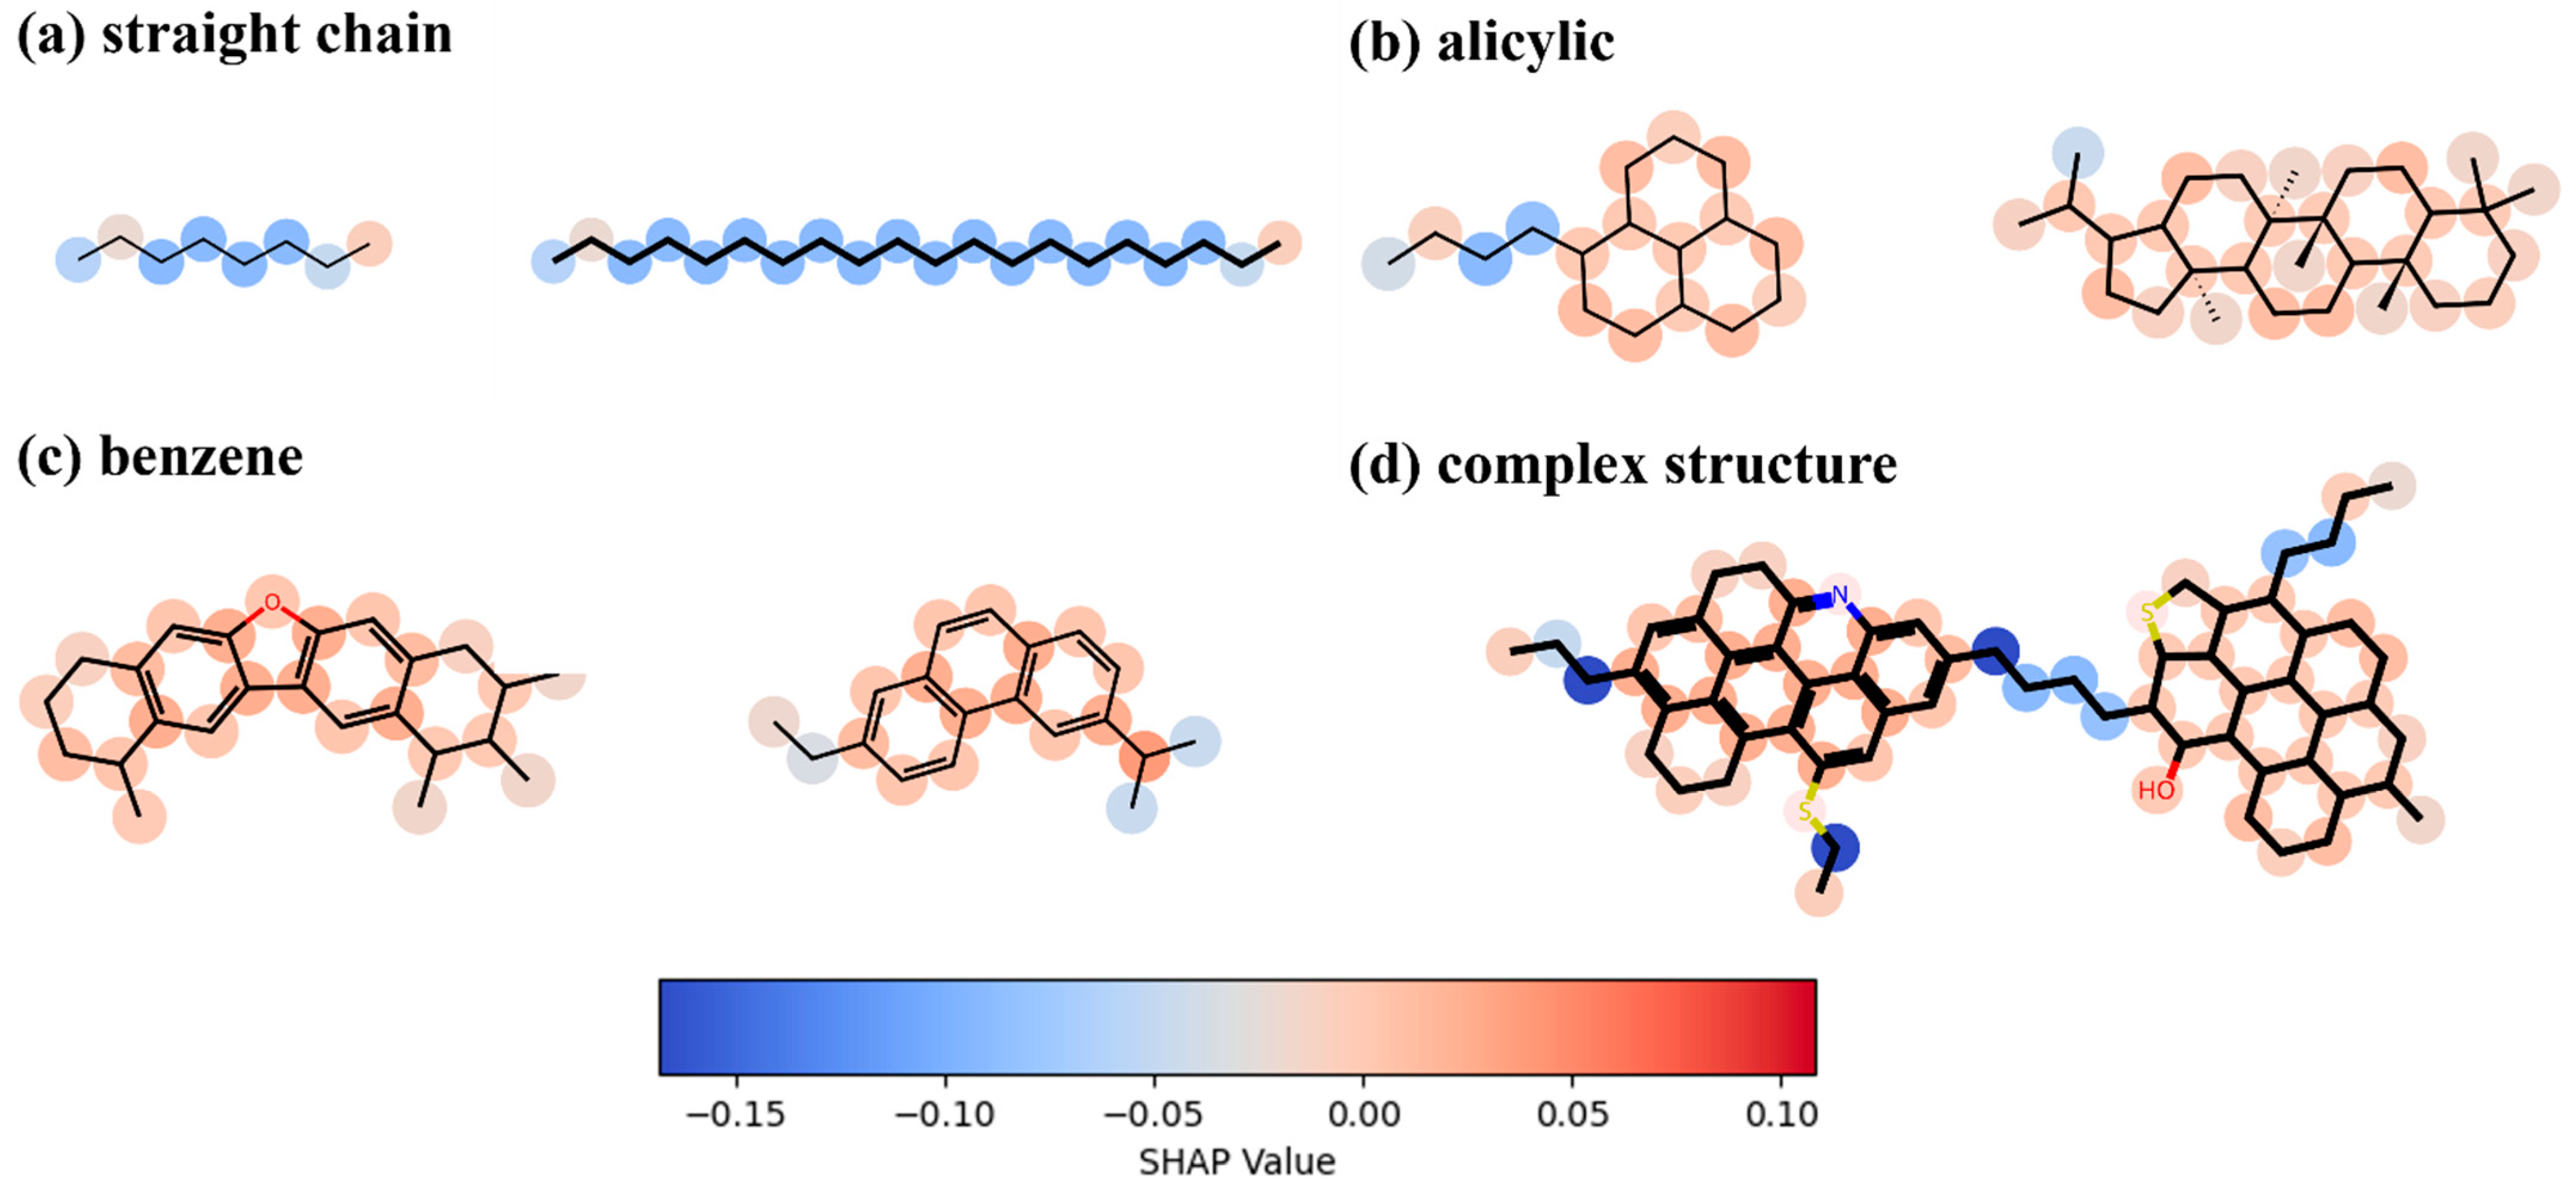
Figure 12 illustrates the importance of each molecule in determining the viscosity of the digital oil. As shown in Figure 12a, in the long straight-chain structure, the carbon atoms at the ends contribute more to the viscosity than the carbon atoms in the middle. This is because the carbon atoms at the ends are freer and have more space to interact with other atoms or molecules. Figure 12b illustrates the contribution of carbon atoms to viscosity in an alicyclic structure; in a structure where multiple alicyclic rings are connected, the carbon atoms connecting more alicyclic rings have a slightly greater effect on viscosity than the other carbon atoms in the alicyclic ring. Figure 12c shows the contribution of carbon atoms in the benzene ring structure to viscosity. The contributions are similar to those for the alicyclic structure; however, the carbon atoms on the benzene ring contribute more to viscosity than those on the alicyclic ring. Figure 12d shows that the same pattern applies to complex molecular structures, and that large lamellae formed by multiple benzene rings strongly affect viscosity.

Figure 12.
Analysis of the importance of each atom in determining the viscosity of digital oil.
4. Conclusions
In this study, three digital oil models were developed, and their physical properties were calculated using MD simulations. The relationships between molecular structure and physical properties, including energy, were also elucidated. Furthermore, ML techniques were applied to predict the viscosity of digital oils. The key findings of this study are summarized as follows.
First, the simulation system and methodology adopted in this work successfully replicated the physical properties of digital oils, such as the density, self-diffusion coefficient, and viscosity. MD simulations facilitated the effective qualitative analysis of the physical characteristics inherent in petroleum systems. Additionally, equations linking viscosity, interaction energy, and temperature were established, confirming their interdependence. The interaction energy, which reflects the molecular forces, decreased as the temperature increased, implying that reduced intermolecular friction leads to reduced oil viscosity. Cluster analysis revealed that, in comparison to light and medium oils, heavy oil contained more clusters, larger clusters, and more variable cluster shapes, with a tendency towards rod-like formations. This observation is in line with the physical behavior anticipated for heavy oils in simulations. RDFs were calculated for four molecular pairs and compared with the measured interaction energies. Among the molecular pairs, aromatic-resin pairs exhibited the highest interaction energy, indicating their most significant contribution to viscosity. The RDFs for heteroatoms such as nitrogen and oxygen were consistent throughout the light, medium, and heavy oils. In contrast, a significant peak emerged in the sulfur RDF for the heavy-oil system, indicating the prominent role of sulfur in aggregation within this system. Introducing Ni2+ ions into the heavy oil system caused an increase in viscosity, which could be attributed to the ability of Ni2+ ions to form larger molecular clusters, thereby enhancing aggregation. In the ML analysis, four models were evaluated based on the RMSE, MAE, and R2 scores to determine their predictive accuracy. The viscosities predicted by the ET model showed a strong correlation with the actual viscosity values, demonstrating its effectiveness in modeling the viscosity of digital oils with known properties. Both FIR and SHAP analyses revealed that temperature was the most influential factor regarding oil viscosity. However, its relative influence decreased as the temperature increased, while the influence of elemental composition became more significant. At the molecular-structure level, straight chains contributed the least to viscosity, followed by alicycles. Benzene rings, especially lamellar structures formed by multiple benzene rings, made the largest contribution to viscosity.
Overall, this study presents a comprehensive approach to analyze the macroscopic properties and microstructures of digital oils by integrating MD simulations with ML models. This combined methodology provides a cost-effective and efficient alternative to labor-intensive MD simulations, offering valuable insights for future research on the relationship between physical properties and microstructures.
Supplementary Materials
The following supporting information can be downloaded at: https://www.mdpi.com/article/10.3390/pr13030881/s1, Figure S1: Densities of the digital oils at different temperatures; Figure S2: Mean square displacement values of (a) medium oil and (b) heavy oil at different temperatures; Figure S3: Viscosity data for numerical oils in reference [13]; Figure S4: Potential energy as a function of temperature for the (a) light, (b) medium, and (c) heavy oils; Figure S5: Molecular energy as a function of temperature for the (a) light, (b) medium, and (c) heavy oils; Figure S6: RDFs between different components of the digital light oil: (a) saturated and aromatic fractions; (b) saturated and resin fractions; (c) saturated and asphaltene fractions; (d) aromatic and resin fractions; (e) aromatic and asphaltene fractions; and (f) resin and asphaltene fractions; Figure S7: RDF of Ni2+ in heavy oil; Table S1: Number of molecules in the digital oils; Table S2: Densities of the digital oils at different temperatures; Table S3: Self-diffusion coefficients of the digital oils at different temperatures; Table S4: Viscosities of the digital oils at different temperatures.
Author Contributions
Conceptualization, T.Z.; Methodology, Z.Z.; Software, Z.W.; Formal analysis, H.L.; Investigation, Y.M. and Z.Z.; Resources, Y.Z., X.L. and C.X.; Data curation, Y.M. and Z.W.; Writing—original draft, Y.Z. and H.L.; Writing—review & editing, T.Z.; Visualization, W.G.; Supervision, X.L. and C.X.; Project administration, W.G. All authors have read and agreed to the published version of the manuscript.
Funding
This research was funded by [Petrochina Science and Technology Special Project] grant number [2021DJ1405].
Data Availability Statement
The data file for the LAMMPS software(23Jun2022) for light oil in the article is available at https://github.com/Parsifal-55/DataForDigitalOil (accessed on 12 December 2024).
Conflicts of Interest
The authors declare no conflict of interest.
Nomenclature
| MSD | Mean square displacement |
| DS | Self-diffusion coefficient |
| ri(t) | Position vector of the atoms at time t |
| η | Viscosity |
| kB | Boltzmann constant |
| Pαβ | Non-diagonal element of the stress tensor |
| Rg | Radius of gyration |
| κ2 | Relative shape anisotropy |
| RDF | Radial distribution function |
References
- Wang, Z. Global Oil and Gas Development in 2022: Situation, Trends and Enlightenment. Pet. Explor. Dev. 2023, 50, 1167–1186. [Google Scholar] [CrossRef]
- Hasan, S.W.; Ghannam, M.T.; Esmail, N. Heavy Crude Oil Viscosity Reduction and Rheology for Pipeline Transportation. Fuel 2010, 89, 1095–1100. [Google Scholar] [CrossRef]
- Wang, L.; Zhang, Y.; Zou, R.; Zou, R.; Huang, L.; Liu, Y.; Lei, H. Molecular Dynamics Investigation of DME Assisted CO2 Injection to Enhance Shale Oil Recovery in Inorganic Nanopores. J. Mol. Liq. 2023, 385, 122389. [Google Scholar] [CrossRef]
- Huang, T.; Cheng, L.; Cao, R.; Wang, X.; Jia, P.; Cao, C. Molecular Simulation of the Dynamic Distribution of Complex Oil Components in Shale Nanopores during CO2-EOR. Chem. Eng. J. 2024, 479, 147743. [Google Scholar] [CrossRef]
- Fang, T.; Li, S.; Zhang, Y.; Su, Y.; Yan, Y.; Zhang, J. How the Oil Recovery in Deep Oil Reservoirs Is Affected by Injected Gas Types: A Molecular Dynamics Simulation Study. Chem. Eng. Sci. 2021, 231, 116286. [Google Scholar] [CrossRef]
- Zhu, B.; Yang, M.; Yan, Y.; Zhong, J.; Li, J.; Li, Z.; Zhang, J. Insights into the Effect of Water Content on Asphaltene Aggregation Behavior and Crude Oil Rheology: A Molecular Dynamics Simulation Study. J. Mol. Liq. 2024, 396, 124042. [Google Scholar] [CrossRef]
- Cao, H.; Cao, X.; Zhao, X.; Guo, D.; Liu, Y.; Bian, J. Molecular Dynamics Simulation of Wax Molecules Aggregational Crystallization Behavior during Cooling of Crude Oil Mixture. Case Stud. Therm. Eng. 2022, 37, 102298. [Google Scholar] [CrossRef]
- Su, G.; Zhang, H.; Geng, T.; Yuan, S. Effect of SDS on Reducing the Viscosity of Heavy Oil: A Molecular Dynamics Study. Energy Fuels 2019, 33, 4921–4930. [Google Scholar] [CrossRef]
- Park, J.W.; Lee, K.B. Molecular Dynamics Simulations of Asphaltene Aggregation in Heavy Oil System for the Application to Solvent Deasphalting. Fuel 2022, 323, 124171. [Google Scholar] [CrossRef]
- Xu, J.; Li, X.; Hou, C.; Wang, L.; Zhou, G.; Ge, W.; Li, J. Engineering Molecular Dynamics Simulation in Chemical Engineering. Chem. Eng. Sci. 2015, 121, 200–216. [Google Scholar] [CrossRef]
- Xiong, H.; Devegowda, D.; Huang, L. EOR Solvent-Oil Interaction in Clay-Hosted Pores: Insights from Molecular Dynamics Simulations. Fuel 2019, 249, 233–251. [Google Scholar] [CrossRef]
- Zhang, W.; Yi, X.; Yi, Q.; Sun, L. Performance Evaluation and Molecular Dynamics Simulation in the Liquid–Liquid Extraction Process of Low Transition Temperature Mixture + n-Hexane + 1,2-Dichloroethane. J. Mol. Liq. 2022, 364, 119913. [Google Scholar] [CrossRef]
- Iwase, M.; Sugiyama, S.; Liang, Y.; Masuda, Y.; Morimoto, M.; Matsuoka, T.; Boek, E.S.; Ueda, R.; Nakagawa, K. Development of Digital Oil for Heavy Crude Oil: Molecular Model and Molecular Dynamics Simulations. Energy Fuels 2018, 32, 2781–2792. [Google Scholar] [CrossRef]
- Cui, W.; Huo, K.; Sugiyama, S.; Liang, Y.; Masuda, Y.; Morimoto, M.; Matsuoka, T.; Boek, E.S.; Kaito, Y.; Nakagawa, K.; et al. Microstructural Evolution of Bitumen during the Glass Transition: An Application of Digital Oil. Fuel 2023, 335, 127048. [Google Scholar] [CrossRef]
- Yang, X.; Liu, Q.; Ma, Y.; Xie, J.; Cao, B. Molecular Dynamics Study on the Kinematic Viscosity, Density and Structure of Fuel Blends Containing n-Decane and Biofuel Compound of Ethyl Decanoate or Ethyl Dodecanoate. J. Mol. Liq. 2023, 379, 121680. [Google Scholar] [CrossRef]
- Zhu, H.; Zhang, S.; Li, X.; Ma, D.; Sun, X.; Wang, H.-Z.; Yan, Y.; Xu, J.; Yang, C. Molecular Dynamics Simulation Reveals Unique Rheological and Viscosity–Temperature Properties of Karamay Heavy Crude Oil. Energy Fuels 2021, 35, 7956–7966. [Google Scholar] [CrossRef]
- Li, J.; Chen, D.; Sun, K.; Pan, R.; Tang, Y. Molecular Dynamics Simulation and Experimental Study of the Rheological Performance of Graphene Lubricant Oil. Diam. Relat. Mater. 2024, 141, 110721. [Google Scholar] [CrossRef]
- Guo, J.; Xiao, H.; Wu, F. Prediction of Viscosity of Kerosene-Based Nanographene Fluids by Molecular Dynamics Simulation Analysis. J. Mol. Liq. 2023, 391, 123417. [Google Scholar] [CrossRef]
- Li, G.; Tan, Y.; Fu, Y.; Liu, P.; Fu, C.; Oeser, M. Density, Zero Shear Viscosity and Microstructure Analysis of Asphalt Binder Using Molecular Dynamics Simulation. Constr. Build. Mater. 2022, 345, 128332. [Google Scholar] [CrossRef]
- Yang, X.; Liu, Q.; Zhang, X.; Ji, C.; Cao, B. A Molecular Dynamics Simulation Study of the Densities and Viscosities of 1,2,4-Trimethylbenzene and Its Binary Mixture with n-Decane. Fluid Phase Equilibria 2022, 562, 113566. [Google Scholar] [CrossRef]
- Cartes, M.; Chaparro, G.; Alonso, G.; Mejía, A. Density and Viscosity of Liquid Mixtures Formed by N-Hexane, Ethanol, and Cyclopentyl Methyl Ether. J. Mol. Liq. 2022, 359, 119353. [Google Scholar] [CrossRef]
- Wang, Y.; Gong, S.; Li, L.; Liu, G. Sub-to-Supercritical Properties and Inhomogeneity of JP-10 Using Molecular Dynamics Simulation. Fuel 2021, 288, 119696. [Google Scholar] [CrossRef]
- Zhang, W.; Hu, Z.; Lu, Y.; Zhou, T.; Zhang, H.; Zhao, X.; Liu, L.; Zhang, L.; Gao, Y. Molecular Dynamics Simulation on the Heat Transfer in the Cross-Linked Poly(Dimethylsiloxane). J. Phys. Chem. B 2023, 127, 10243–10251. [Google Scholar] [CrossRef]
- Zhang, S.; Li, Q.; Xie, Q.; Zhu, H.; Xu, W.; Liu, Z. Mechanism Analysis of Heavy Oil Viscosity Reduction by Ultrasound and Viscosity Reducers Based on Molecular Dynamics Simulation. ACS Omega 2022, 7, 36137–36149. [Google Scholar] [CrossRef]
- Su, Z.; Liu, X.; Xing, J.; Jiao, Y.; Zhu, Z.; Qi, J.; Wang, Y. Separation of Butyl Acetate and Propyl Acetate from Wastewater by Liquid-Liquid Extraction and Molecular Dynamics Simulation. J. Mol. Liq. 2023, 379, 121699. [Google Scholar] [CrossRef]
- Wu, Z.; Zhou, T.; Lan, X.; Xu, C. The Practice and Prospect of Artificial Intelligence Driving Chemical Innovation Design. Chem. Prog. 2023, 42, 3910–3916. [Google Scholar] [CrossRef]
- Bhimineni, S.H.; Zhou, T.; Mahmoodpour, S.; Singh, M.; Li, W.; Bag, S.; Sass, I.; Müller-Plathe, F. Machine-Learning-Assisted Investigation of the Diffusion of Hydrogen in Brine by Performing Molecular Dynamics Simulation. Ind. Eng. Chem. Res. 2023, 62, 21385–21396. [Google Scholar] [CrossRef]
- Wang, H.; Zhang, C.; Chen, H.; Yu, X.; Li, Y.; Yang, K. Influence of Ether Group on Viscosity and Film Lubrication of Diester Lubricants: Integrated Quantitative Structure–Property Relationship and Molecular Dynamics Simulation Methods. J. Mol. Liq. 2024, 398, 124254. [Google Scholar] [CrossRef]
- Kirch, A.; Celaschi, Y.M.; de Almeida, J.M.; Miranda, C.R. Brine–Oil Interfacial Tension Modeling: Assessment of Machine Learning Techniques Combined with Molecular Dynamics. ACS Appl. Mater. Interfaces 2020, 12, 15837–15843. [Google Scholar] [CrossRef] [PubMed]
- Freitas, R.S.M.; Lima, Á.P.F.; Chen, C.; Rochinha, F.A.; Mira, D.; Jiang, X. Towards Predicting Liquid Fuel Physicochemical Properties Using Molecular Dynamics Guided Machine Learning Models. Fuel 2022, 329, 125415. [Google Scholar] [CrossRef]
- Omrani, S.; Ghasemi, M.; Singh, M.; Mahmoodpour, S.; Zhou, T.; Babaei, M.; Niasar, V. Interfacial Tension–Temperature–Pressure–Salinity Relationship for the Hydrogen–Brine System under Reservoir Conditions: Integration of Molecular Dynamics and Machine Learning. Langmuir 2023, 39, 12680–12691. [Google Scholar] [CrossRef]
- Wang, Z.; Huang, S.; Wen, G.; Liu, Q.; Tang, P. Thermal Conductivity Prediction and Structure-Property Relationship of CaO-SiO2-Al2O3 Ternary System: A Combination of Molecular Dynamics Simulations and Machine Learning. J. Mol. Liq. 2021, 324, 114697. [Google Scholar] [CrossRef]
- Li, X.; Cao, X.; Yuan, Y.; Deng, M.; Yang, X. Construction and Validation of the Average Molecular Structure Model of the Bio-Oil from Solvent-Thermal Liquefaction of Sawdust Using Molecular Characterization and Molecular Simulation. J. Mol. Liq. 2023, 379, 121689. [Google Scholar] [CrossRef]
- Xiong, Q.-A.; Zhang, Y.-M.; Qiao, P.; Li, G.-T.; Li, J.-Z.; Zhang, W. Comparative Pyrolysis Kinetics of Heavy Oil and Its SARA Fractions Using Distributed Activation Energy Model. Pet. Sci. 2023, 20, 3231–3239. [Google Scholar] [CrossRef]
- Zhang, Y.; Yuan, L.; Liu, S.; Zhang, J.; Yang, M.; Song, Y. Molecular Dynamics Simulation of Bubble Nucleation and Growth during CO2 Huff-n-Puff Process in a CO2-Heavy Oil System. Geoenergy Sci. Eng. 2023, 227, 211852. [Google Scholar] [CrossRef]
- Li, B.; Guo, Z.; Li, N.; Wang, D.; Li, G.; Zheng, L.; Qi, B.; Jiao, T. Molecular Dynamics Simulation of Wax Deposition in Crude Oil Systems. Colloids Surf. A Physicochem. Eng. Asp. 2023, 674, 131965. [Google Scholar] [CrossRef]
- Scalfani, V.F.; Patel, V.D.; Fernandez, A.M. Visualizing Chemical Space Networks with RDKit and NetworkX. J. Cheminform. 2022, 14, 87. [Google Scholar] [CrossRef] [PubMed]
- Thompson, A.P.; Aktulga, H.M.; Berger, R.; Bolintineanu, D.S.; Brown, W.M.; Crozier, P.S.; In’t Veld, P.J.; Kohlmeyer, A.; Moore, S.G.; Nguyen, T.D.; et al. LAMMPS—A Flexible Simulation Tool for Particle-Based Materials Modeling at the Atomic, Meso, and Continuum Scales. Comput. Phys. Commun. 2022, 271, 108171. [Google Scholar] [CrossRef]
- Martínez, L.; Andrade, R.; Birgin, E.G.; Martínez, J.M. P ACKMOL: A Package for Building Initial Configurations for Molecular Dynamics Simulations. J. Comput. Chem. 2009, 30, 2157–2164. [Google Scholar] [CrossRef] [PubMed]
- Jewett, A.I.; Stelter, D.; Lambert, J.; Saladi, S.M.; Roscioni, O.M.; Ricci, M.; Autin, L.; Maritan, M.; Bashusqeh, S.M.; Keyes, T.; et al. Moltemplate: A Tool for Coarse-Grained Modeling of Complex Biological Matter and Soft Condensed Matter Physics. J. Mol. Biol. 2021, 433, 166841. [Google Scholar] [CrossRef] [PubMed]
- Maskey, S.; Morrow, B.H.; Gustafson, M.Z.; Luning Prak, D.J.; Mikulski, P.T.; Harrison, J.A. Systematic Examination of the Links between Composition and Physical Properties in Surrogate Fuel Mixtures Using Molecular Dynamics. Fuel 2020, 261, 116247. [Google Scholar] [CrossRef]
- Yamaguchi, T.; Yamada, H.; Fujiwara, T.; Hori, K. Simulations of Dielectric Constants and Viscosities of Organic Electrolytes by Quantum Mechanics and Molecular Dynamics. J. Mol. Liq. 2020, 312, 113288. [Google Scholar] [CrossRef]
- Bashiri, M.; Shojaeefard, M.H.; Qasemian, A. Molecular Dynamics Simulations and Experimental Investigation of Viscosity of CuO-Oil Nanolubricant at Different Temperatures and Volume Fractions of Nanoparticles. J. Mol. Graph. Model. 2024, 129, 108750. [Google Scholar] [CrossRef]
- Yao, N.; Yu, L.; Fu, Z.-H.; Shen, X.; Hou, T.-Z.; Liu, X.; Gao, Y.-C.; Zhang, R.; Zhao, C.-Z.; Chen, X.; et al. Probing the Origin of Viscosity of Liquid Electrolytes for Lithium Batteries. Angew. Chem. 2023, 135, e202305331. [Google Scholar] [CrossRef]
- Stukowski, A. Visualization and Analysis of Atomistic Simulation Data with OVITO–the Open Visualization Tool. Model. Simul. Mater. Sci. Eng. 2010, 18, 015012. [Google Scholar] [CrossRef]
- Shen, K.; Cui, L.; Yang, L.; Wei, X.; Liu, X.; Ren, M.; Cao, F.; Xu, J. Molecular Dynamics Simulations of the Nickel Removal from Crude Oil by Neutral and Charged Spherical Polymer Brushes. Fuel 2023, 345, 128179. [Google Scholar] [CrossRef]


Disclaimer/Publisher’s Note: The statements, opinions and data contained in all publications are solely those of the individual author(s) and contributor(s) and not of MDPI and/or the editor(s). MDPI and/or the editor(s) disclaim responsibility for any injury to people or property resulting from any ideas, methods, instructions or products referred to in the content. |
© 2025 by the authors. Licensee MDPI, Basel, Switzerland. This article is an open access article distributed under the terms and conditions of the Creative Commons Attribution (CC BY) license (https://creativecommons.org/licenses/by/4.0/).