Article

Statistical Damage Constitutive Model for Mudstone Based on Triaxial Compression Tests

1
Chongqing Institute of Geology and Mineral Resources, Chongqing 401120, China
2
Chongqing Municipal Transportation Commission, Chongqing 401147, China
3
State Key Laboratory of Mountain Bridge and Tunnel Engineering, Chongqing Jiaotong University, Chongqing 400074, China
4
State Grid Xuzhou Power Supply Company, Xuzhou 221000, China
5
State Key Laboratory of Coal Mine Disaster Dynamics and Control, Chongqing University, Chongqing 400044, China
*
Authors to whom correspondence should be addressed.
Processes 2025, 13(3), 864; https://doi.org/10.3390/pr13030864
Submission received: 24 January 2025 / Revised: 27 February 2025 / Accepted: 5 March 2025 / Published: 14 March 2025
(This article belongs to the Special Issue Model of Unconventional Oil and Gas Exploration)

Abstract

:
For the purpose of precisely depicting the failure and deformation of mudstone at varying burial depths under engineering activities, a statistical meso-damage constitutive model of mudstone was established on the basis of continuum damage mechanics, with the adoption of the compound power function and the Mohr–Coulomb yield criterion. Through triaxial compression tests under diverse confining pressures, the validity of this constitutive model was verified, and the macroscopic effects of mudstone damage evolution induced by internal defects and alterations in meso-structures were analyzed. The results reveal that an increase in confining pressure can remarkably enhance both the peak strength and the residual strength of mudstone. The constitutive model demonstrates relatively high accuracy in predicting the stress–strain responses, as well as the residual strength of mudstone. Moreover, parameter ε0 is capable of reflecting the macroscopic deformation strength of mudstone. Specifically, the larger the value of parameter ε0 is, the greater the peak deviatoric stress of mudstone will be, accompanied by a stronger bearing capacity. Parameter m, on the other hand, governs the brittle-to-ductile transition characteristics under failure. It also demonstrates that the macroscopic brittle failure characteristics of mudstone will become more noticeable as the value of parameter m increases.

1. Introduction

As a typical soft rock with unique engineering properties, mudstone has attracted significant attention in engineering fields including coal mining, tunnel excavation, dam construction, and slope engineering [1,2,3,4]. However, as a natural rock material, mudstone inherently contains pre-existing defects such as cracks and joints [5,6]. These initial damages may induce the initiation, propagation, and interconnection of microcracks under complex stress conditions [7], leading to considerable challenges in the accurate characterization and prediction of mudstone damage. Furthermore, the irreversible nature of performance degradation and damage evolution under external loads renders classical elastoplastic theories inadequate for precisely describing its deformation characteristics and failure mechanisms, thereby compromising the safety and stability of engineering activities involving mudstone structures [8,9]. This underscores the critical importance of introducing damage mechanics to investigate the evolutionary patterns of deformation and damage in mudstone, which holds substantial scientific and practical value for engineering applications.
Current research on statistical damage models for mudstone primarily focuses on two categories: The first involves macroscopic phenomenological statistical damage models [10,11]. These models adopt a holistic perspective, treating rock as a continuum without delving into its internal microstructure or specific damage mechanisms. Instead, they establish damage models based on macroscopic experimental observations and mechanical behaviors [12]. The statistical variation in rock unit failure is typically described using probability density functions such as normal distribution, log-normal distribution, and Weibull distribution [13,14,15]. Although effective in characterizing rock damage, these models require further refinement in capturing the complete damage evolution process. The second category comprises micromechanics-based statistical damage models [16], which aim to describe damage accumulation caused by microdefects and cracks at different structural scales [17]. Nevertheless, the stochastic nature of microstructures poses significant challenges in measuring damage variables and correlating microstructural changes with macroscopic mechanical parameter variations.
Despite the widespread application of statistical damage models in brittle rock characterization, their direct implementation for mudstone faces multiple challenges. Considering complex mechanical factors and geological conditions, researchers have developed various damage constitutive models [18,19]. Extensive studies have been conducted on factors influencing rock deformation and failure, including water-weakening effects, varied loading paths, plastic deformation, and freeze–thaw cycles [20,21,22]. Energy-based methods have also been employed to derive damage constitutive models, incorporating parameters such as crack volumetric strain, moment tensor damage indices, and acoustic emission (AE) energy to quantify damage evolution [23,24]. Although numerous damage constitutive models have been proposed for specific engineering scenarios, critical gaps remain in understanding stress evolution and damage characteristics of mudstone under triaxial compression [25,26,27,28]. Particularly, the nonlinear relationships between environmental conditions at different burial depths and damage parameters have not been adequately characterized. Moreover, poor convergence between existing constitutive models and experimental data significantly compromises the reliability of mechanical behavior prediction and damage assessment in underground engineering applications, posing potential risks to engineering safety.
To address these limitations, this study proposes a novel damage constitutive equation for analyzing mudstone failure under triaxial compression. Based on continuum damage mechanics, a statistical damage constitutive model was established by integrating composite power functions with the Mohr–Coulomb yield criterion. The model’s validity was verified through triaxial compression tests, revealing the evolution of internal defects and microstructural changes in rock masses. Damage variables were introduced to quantify the macroscopic effects induced by microstructural alterations, thereby elucidating the damage evolution process of mudstone under variable confining pressures. This approach provides enhanced predictive capability for mudstone mechanical behavior in complex underground engineering environments.

2. Tests and Methods

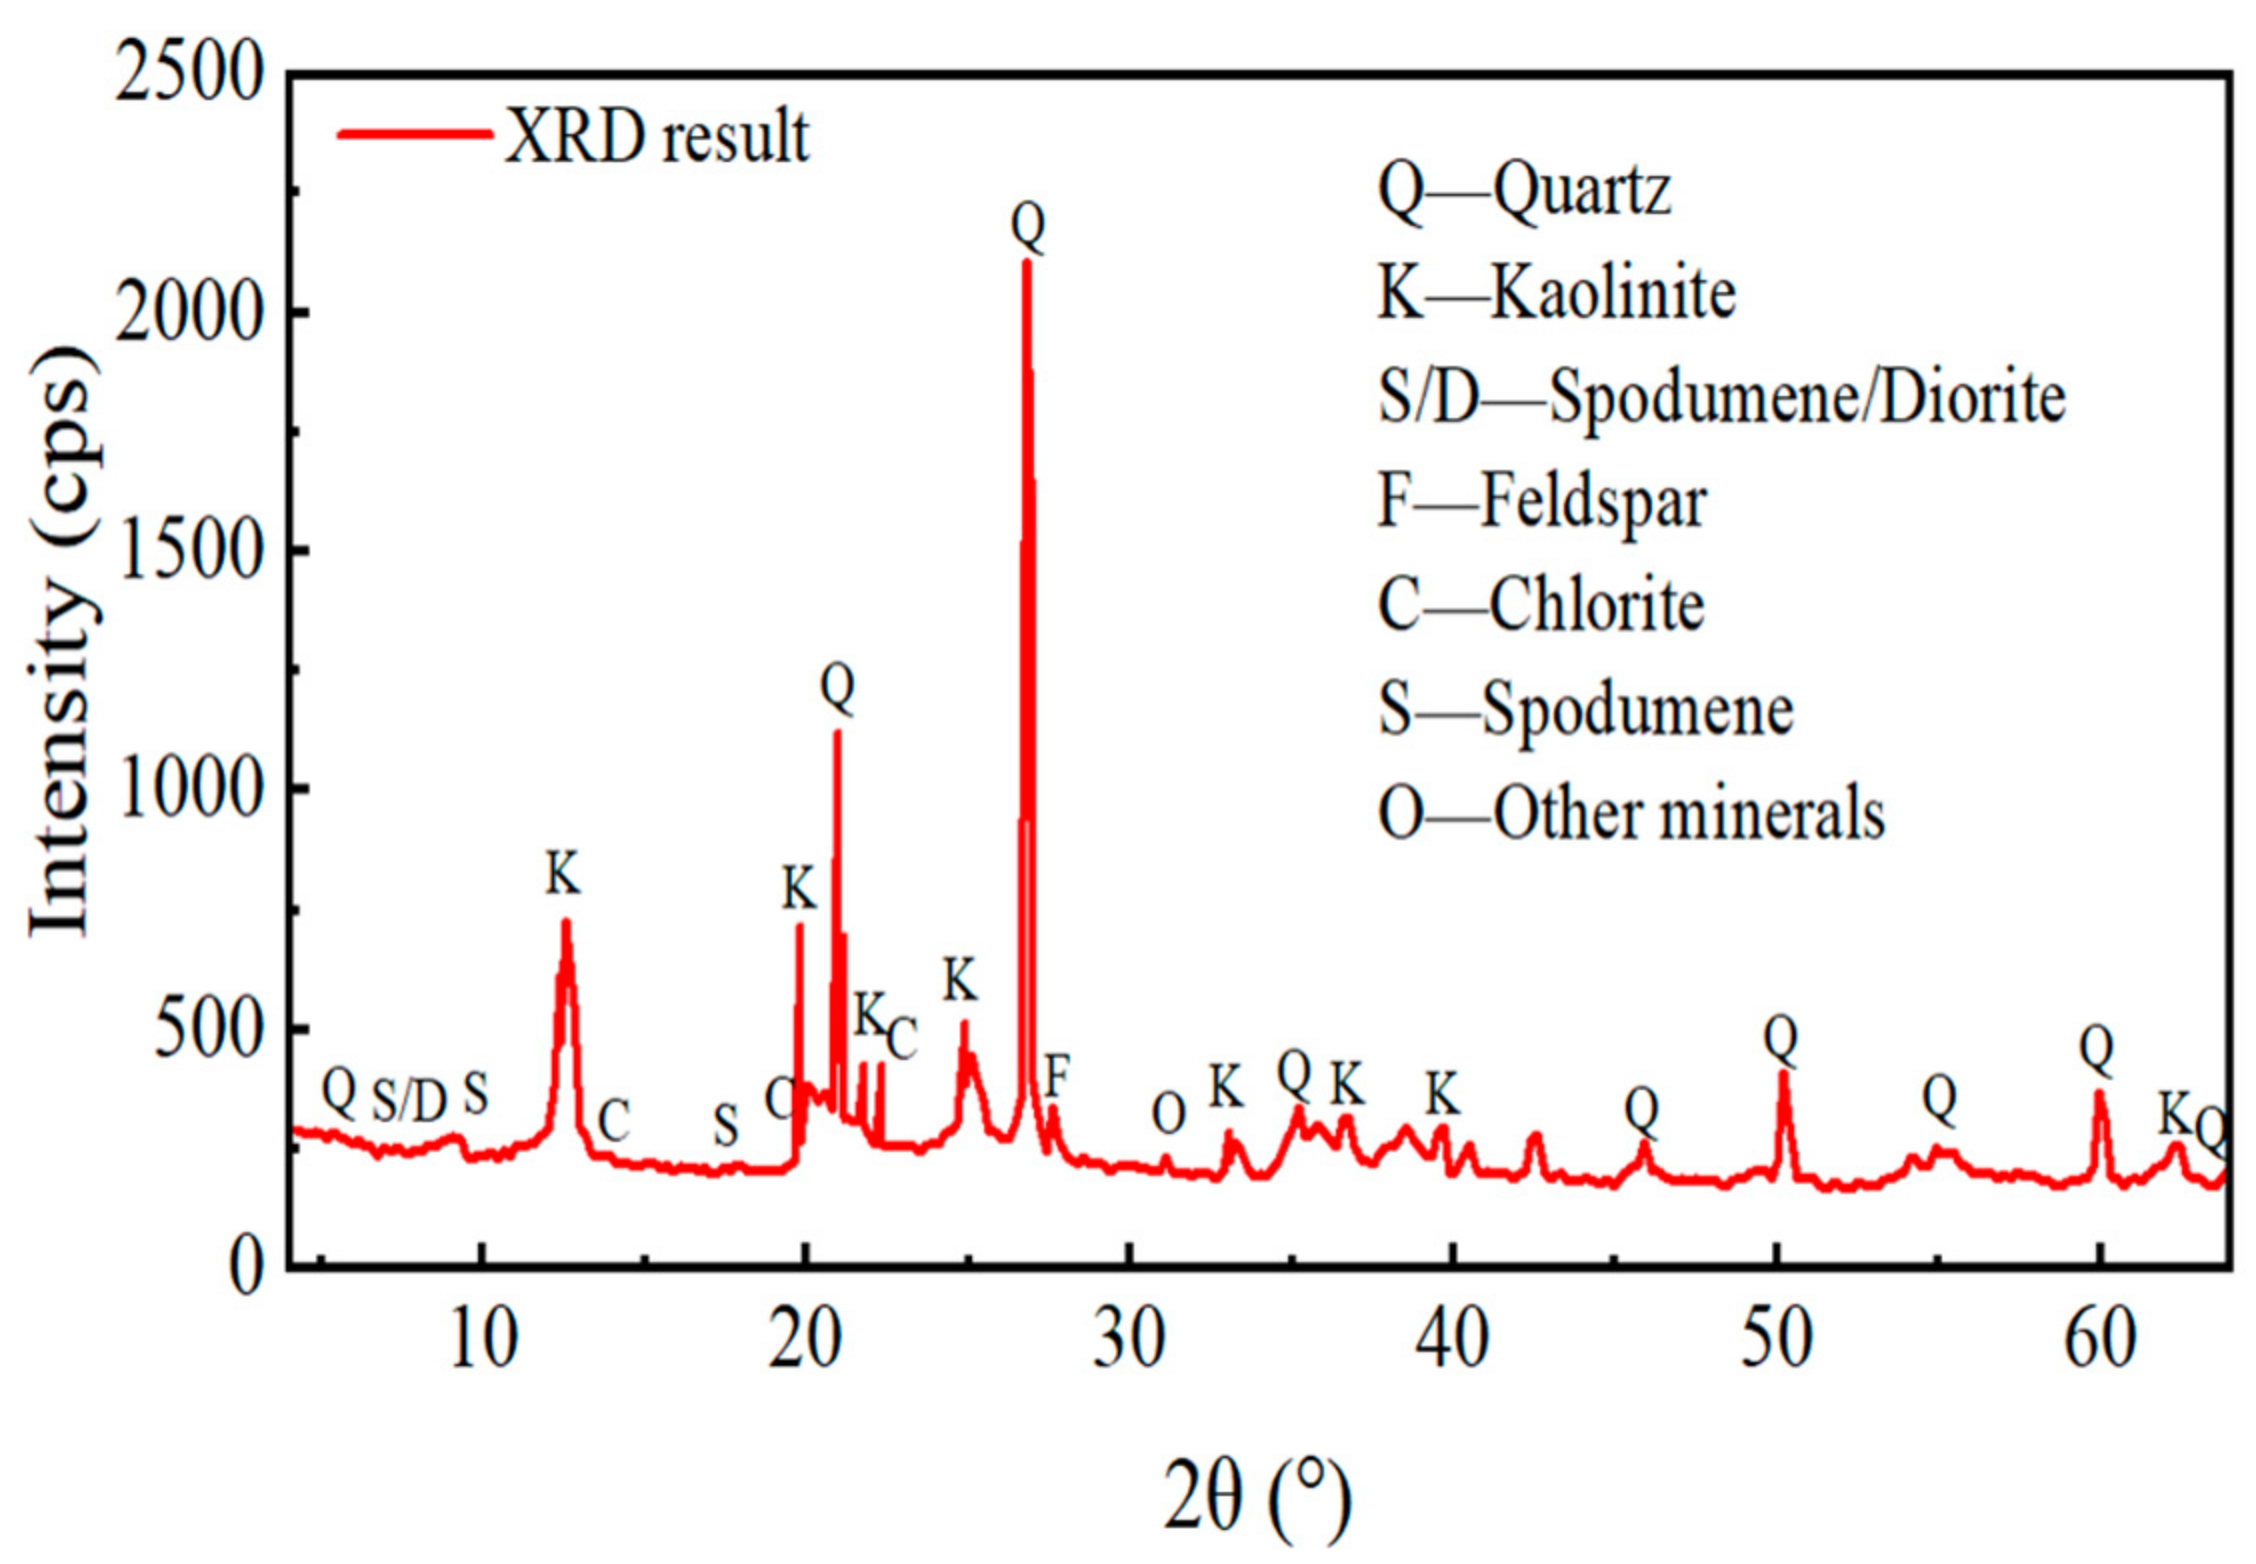
2.1. Material and Mineral Analysis

The mudstone specimens drilled in the field were wrapped and sealed with cling film to avoid oxidization due to prolonged contact with the air, and then quickly transferred to the laboratory for processing (Z1Z-200T engineering coring machine, Jincheng Jingsheng Micro-Tech Mechanical & Electrical Co., Ltd., Tongling, China), and processed into cylindrical standard specimens in accordance with the requirements of the International Standard for Rock Mechanics (ISRM), which stipulates that the height-to-diameter ratio should be 2:1 (GEOCUT Geological Cutting Machine, Kemitech technology (Shenzhen) CO., LTD., Shenzhen, China). In addition, the ends of the specimens were ground to a flatness of ±50 µm using a grinder (Kemete Precision Grinding Machine, Kemitech technology (Shenzhen) CO., LTD., Shenzhen, China), and the detailed process of specimen processing is shown in Figure 1. Table 1 is the statistical information about the mudstone specimens, where ρ is the dry density, φ is the porosity, w is the water content, d is the diameter of the mudstone specimens, and h is the height of the mudstone specimens. In addition, in order to detect the specific minerals contained in the mudstone used, the mineral content was measured using X-ray diffraction (XRD).
The mudstone specimens’ XRD test results are displayed in Figure 2. Kaolinite, quartz, illite/rectangular amphibole interlayer minerals, illite, feldspar, and chlorite are the primary minerals found in the mudstone specimen utilized for the investigation, as shown in the figure. The precise compositions of this test sample were quantitatively examined as follows: 7% illite/rectangular amphibole interlayer minerals, 5% illite, 2% feldspar, 3% chlorite, 64% kaolinite, 16% quartz, and 3% other minerals, in that order.

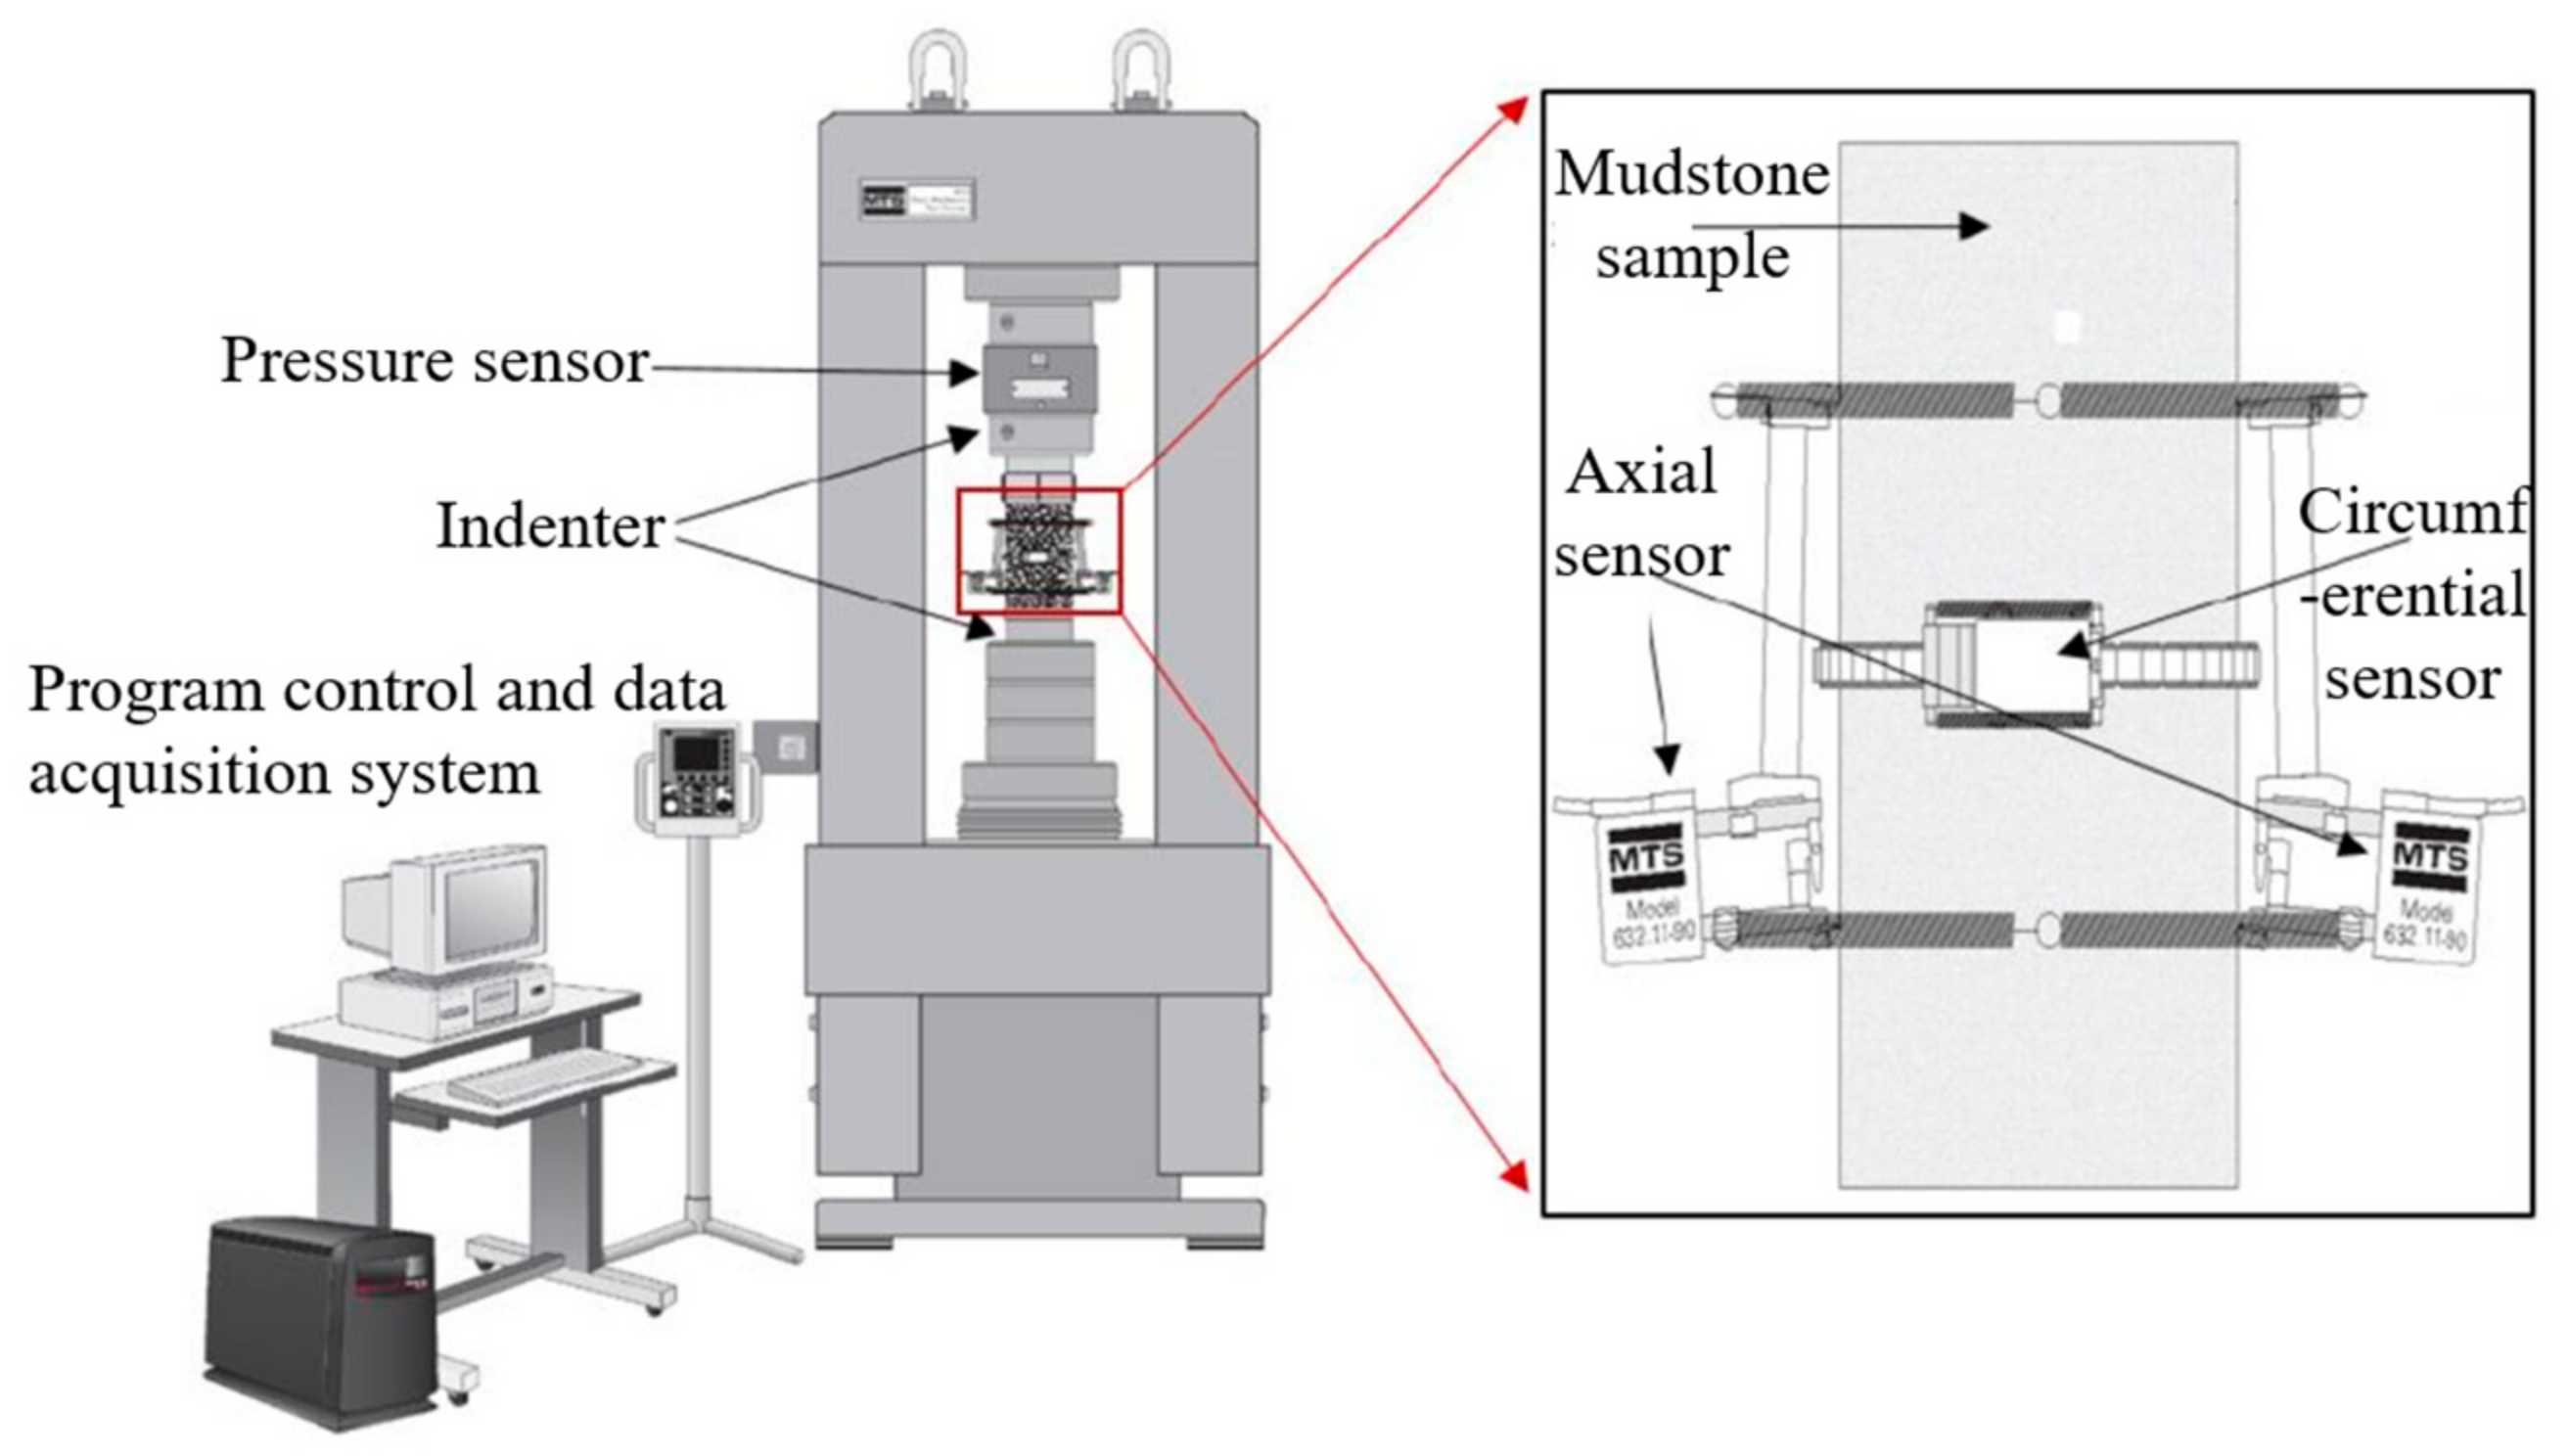
2.2. Test Setup and Test Program

The triaxial compression test of mudstone was performed using the MTS 815 servo-hydraulic rock test system; Figure 3 displays the schematic diagram of the test apparatus. The maximum axial pressure that can be applied by the system is 4600 kN, and the peripheral pressure is 140 MPa. In order to avoid inaccurate test results caused by the end effect, it is necessary to uniformly rub petroleum jelly on the contact section between the mudstone specimen and the testing machine during the installation process, so as to minimize the friction during the loading process. The triaxial compression test of mudstone was conducted in the following manner: a 5 mm thick heat-shrinkable film was first wrapped around the mudstone specimen, and the film was subsequently applied to the mudstone specimen using a heat gun. The aforementioned procedure was then repeated. Electrical insulating tape (non-oil soluble type) of 3 mm thickness was tightly wrapped around the columnar mudstone specimen and the gasket side. Following this, an axial prestress of 1 kN was applied to hold the mudstone specimen in place while it was placed on the loading platform. After that, the strain gauge was attached to the test apparatus, and the annular strain collector was positioned in the middle of the mudstone specimen. The perimeter pressure was applied to the target value at a steady rate of 0.1 MPa/s at the start of the test, and the tests were set to a perimeter pressure of 0, 5, 15, and 25 MPa. Then, deviatoric stress was applied to the specimen end face at a constant axial displacement rate of 0.002 mm/s (axial strain rate of about 2.0 × 10⁻⁵/s) until the specimen was damaged. In this study, ε1 represents the axial strain. Loads and displacements during the test were measured by a programmed control system with sensors from a computer. The stress–strain curves of mudstone during loading was recorded until the mudstone specimens reached the residual strength. Finally, other physical parameters such as peak bias stress, modulus of elasticity, Poisson’s ratio, and residual bias stress of the mudstone specimens were calculated separately. If the data vary significantly between the same batch of mudstone, the study should be repeated.

3. Mathematical Modeling and Validation of Stress–Strain in Mudstone Damage

3.1. Mudstone Damage Mechanism Analysis

Figure 4 shows a schematic diagram of the damage of mudstone specimens under different influencing factors under laboratory conditions and the damage distribution of the mudstone equivalent model. A little increase in rock damage will arise from the progressive growth of microfractures that join microcracks or micropores as the axial load (σ1) increases, as seen in Figure 4a. Eventually, the microfractures will combine to generate macrofractures when the mudstone is no longer heavy. The specimen has now suffered significant damage. Figure 4a shows that the mudstone specimen’s damage is mostly divided into the following three sections: (1) The variable Dnd of natural damage. The original state of the mudstone’s randomly dispersed microcracks, micropores, and microdefects is what causes this damage. (2) Environmental degradation and its fluctuating Ded. This damage is brought on by the diversification of environmental elements as a result of the environment where the specimen is located experiencing stress perturbation. (3) Stress damage and its variable Dsd. The mechanical failure of the rock mass in underground engineering is what caused this damage. These damage factors have the following relationship:
D = D n d + D e d + D s d
According to previous scholars, at the microscopic scale, a rock can be considered to be composed of many rock units, which, in turn, can be analyzed by the statistics of the strength of the rock units. From Figure 4b, the damage of the mudstone equivalent model can be represented by the damaged units, and thus the volume of the damaged part of the rock is the volume of all damaged rock units Vd, while the volume of the undamaged rock units can be expressed as Vud. Then, the damage variable D of the mudstone equivalent model is as follows:
D = V d V u d

3.2. Statistical Microscopic Damage Mechanics Modeling

It is widely acknowledged that when rock is injured, it can be broken down into two pieces: the damaged part and the elastic component (Figure 4). In general, the injured portion is thought to have no bearing capacity. It is established by the idea of continuous damage mechanics [18,19] that
σ i = σ i e ( 1 D )
where D is the damage variable, typically 0 < D < 1, and σi and σie are the apparent and effective stresses, respectively, in MPa. D = 0 indicates that there is no damage to the rock material, but D = 1 indicates that there is extensive damage.
It is assumed that the rock is materially isotropic and that the damage is isotropic. The following can be produced using Equation (3):
( σ 1 σ 3 ) = ( σ 1 e σ 3 e ) · ( 1 D )
where (σ1σ3) is expressed as the apparent bias stress, MPa, and (σ1e − σ3e) is the effective bias stress, MPa, that the elastic part of the rock material is subjected to.
The relationship between axial bias stress and strain in the rock can be roughly described as linear until yielding if the initial closure phase of the rock during loading is disregarded. Consequently, it can be presumed that Hooke’s law governs the connection between bias stress and strain in the elastic portion of the rock material:
( σ 1 e σ 3 e ) = E ε 1 e
where E is the modulus of elasticity, MPa, and ε1e is the axial strain in the rock’s elastic component.
The comparable strain theory states that the effective strain resulting from the effective stress on the undamaged rock is identical to the apparent strain resulting from the apparent stress on the damaged rock [20]:
ε 1 = ε 1 e
where ε1 is the axial strain.
Substituting Equation (6) into Equation (5) yields
( σ 1 e σ 3 e ) = E ε 1
Substituting Equation (7) into Equation (4) yields
( σ 1 σ 3 ) = E ε 1 · ( 1 D )
After total damage, the rock cannot withstand external loads, as shown by Equation (8), where (σ1σ3) = 0 when D = 1. As a result, the residual bias stress cannot be reflected in Equation (8). The remaining ability of the rock to withstand external loading is the residual bias stress produced by friction on the shear fracture surface following damage. Equation (8) needs to be adjusted in order to more effectively depict the damage process of mudstone under triaxial compression.
Since the damaged component still has some bearing capability, it is thought that the rock material is made up of simply an elastic part and a damaged part (Figure 4). These two components will then share the total axial bias stress that the rock sample is exposed to. Consequently, this results in the following:
( σ 1 σ 3 ) = ( σ 1 σ 3 ) N + ( σ 1 σ 3 ) D
where the axial deviatoric stresses applied to the damaged and elastic parts of the rock material are denoted by (σ1σ3)N and (σ1σ3)D, respectively, in MPa. It is assumed that the connection between axial deviatoric stresses and strains for the elastic part still adheres to Equation (8):
( σ 1 σ 3 ) N = E ε 1 · ( 1 D )
The residual bias stress (σ1σ3)r is the final expression for the damaged part’s axial bias stress, which has a positive correlation with the damage variable D [21]. In other words, when D = 0, (σ1 − σ3)D = 0 and when D = 1, (σ1 − σ3)D = (σ1 − σ3)r. As a result, the damaged part’s axial bias stress can be written as follows:
( σ 1 σ 3 ) D = ( σ 1 σ 3 ) r D
According to Equations (10)–(12), it can be concluded that
( σ 1 σ 3 ) = E ε 1 · ( 1 D ) + ( σ 1 σ 3 ) r · D
Equation (12) states that when D = 1, (σ1σ3) = (σ1σ3)r, indicating that the rock might still supply residual bias stress following total damage. Consequently, Equation (12) makes more sense than Equation (8). In the meantime, it is evident from Equation (12) that identifying the damage variable D is a crucial step in creating this constitutive model.
The impact of internal defects on the mechanical characteristics of mudstone is mostly represented in the microelement strength, assuming that the mudstone specimen is made up of innumerable microelements (i.e., the fundamental components of rock damage) (Figure 4). The distribution of microelement strength is likewise random because of the intrinsic flaws in the rock material. Consequently, the damage evolution equation can be inferred using statistical techniques as long as the distribution form of the microelement strength can be identified. The Weibull distribution, normal distribution, log-normal distribution, maximum entropy distribution, and others are examples of distribution forms of microelement strength [22,23,24]. The probability density distribution function f(p) of the rock microelement strength, which is assumed to follow a complex power function in this study, is
f ( p ) = 5 m ε 0 ( p ε 0 ) m 1 1 + ( p ε 0 ) m 6
where p is a randomly distributed variable for the strength of the microelement, and m and ε0 are parameters related to the mechanical properties of the mudstone.
Axial strain [24] or the strength criteria [25] can be used to characterize the random distribution variable of mudstone microelement strength. In this investigation, the axial strain ε1 is used to describe the random distribution variable of mudstone microelement strength p, taking into account the benefits of straightforward form and ease of use. Consequently, Equation (13) can be reformulated as follows:
f ( ε 1 ) = 5 m ε 0 ( ε 1 ε 0 ) m 1 1 + ( ε 1 ε 0 ) m 6
Suppose ND is the number of damaged microelements and N denotes the total number of microelements. Then, the rock statistical damage variable D is [24,25] as follows:
D = N D N
According to Equation (14), the number of damaged microelements can be determined as
N D = 0 ε 1 N f ( ε 1 ) d ε 1 = N C 1 1 + ε 1 ε 0 m 5
where C is a constant of integration.
Substituting Equation (16) into Equation (15) gives
D = C 1 1 + ε 1 ε 0 m 5
Assuming that there is no initial damage to the mudstone specimen, D = 0 when ε1 = 0. Then, Equation (17) can be written as follows:
D = 1 1 1 + ε 1 ε 0 m 5
The mudstone damage evolution equation, which is based on the composite power function distribution, is Equation (18). It is evident from Equation (18) that 0 ≤ D ≤ 1. One can obtain the following by substituting Equation (18) into Equation (12):
σ 1 σ 3 = E ε 1 1 + ε 1 ε 0 m 5 + σ 1 σ 3 r × 1 1 1 + ε 1 ε 0 m 5
The mathematical formula for the statistical damage of mudstone developed in this study is Equation (19), in which the bias stress borne by the damaged area of the mudstone is represented by the second term, and the bias stress borne by the elastic component inside the mudstone is represented by the first term.

3.3. Model Parameter Determination

Four parameters must be found in the statistical damage principle model based on Equation (19): the parameters m and ε0, the residual bias stress (σ1σ3)r, and the elastic modulus E. E and (σ1σ3)c are two of them that may be identified immediately from the findings of mudstone triaxial compression testing. Thus, the only thing that has to be explained is how parameters m and ε0 are calculated. The peak deviatoric stress (σ1σ3)c and the peak point strain ε1c have the following relationship, assuming that the mudstone’s deviatoric stress–strain curve fulfills Equation (19):
σ 1 σ 3 c = E ε 1 c 1 + ε 1 c ε 0 m 5 + σ 1 σ 3 r × 1 1 1 + ε 1 c ε 0 m 5
Equation (20) states that the slope of the deviatoric stress–strain curve should equal zero at its peak:
σ 1 σ 3 c ε 1 c = E 1 + ε 1 c ε 0 m + 5 m σ 1 σ 3 r ε 0 ε 1 c ε 0 m 1 5 m E ε 1 c ε 0 ε 1 c ε 0 m 1 1 + ε 1 c ε 0 m 6 = 0
According to Equation (21), it can be derived as follows:
E 1 + ε 1 c ε 0 m + 5 m σ 1 σ 3 r ε 0 ε 1 c ε 0 m 1 5 m E ε 1 c ε 0 ε 1 c ε 0 m 1 = 0
According to Equation (22), the parameter ε0 is as follows:
ε 0 = E ( 5 m 1 ) ε 1 c m 5 m ( σ 1 σ 3 ) r ε 1 c m 1 E 1 m
Equation (20) can be rewritten as follows:
ε 1 c ε 0 m = E ε 1 c σ 1 σ 3 r σ 1 σ 3 c σ 1 σ 3 r 1 5 1
Substituting Equation (23) into Equation (24) yields the following:
m = E ε 1 c + E ε 1 c E ε 1 c σ 1 σ 3 r σ 1 σ 3 c σ 1 σ 3 r 1 5 1 5 E ε 1 c σ 1 σ 3 r
Substituting E, (σ1σ3)r,(σ1σ3)c, and ε1c into Equation (25), the parameter m can be determined, and substituting E, (σ1σ3)r, and ε1c, and m into Equation (23), the parameter ε0 can be determined.

3.4. Model Validation

The predicted and experimental data were compared to confirm that the statistical damage model based on the composite power function distribution was appropriate. The model characteristics of mudstone under various circumferential pressure conditions are displayed in Table 2. The table indicates that the parameter m exhibits a steady decreasing pattern as the perimeter pressure gradually increases, whilst the parameter ε0 rises from 0.0077 to 0.0137. The model prediction of the mudstone stress–strain curves at various perimeter pressure conditions are compared with the experimental results in Figure 5. The bias stress of mudstone under various displacement conditions may be computed using Equation (19), and the resulting model can then be used to forecast how the stress of the mudstone will evolve throughout the course of the displacement process. From Figure 5, it can be found that the results obtained from the theoretical model calculation can match the test data better. This also shows that the damage model constructed in this study can better predict the stress–strain curve of mudstone and its damage law under different peripheral pressures. In addition, it can be noted that the model also has a more accurate prediction for the calculation of the residual strength of mudstone.

4. Results and Discussion

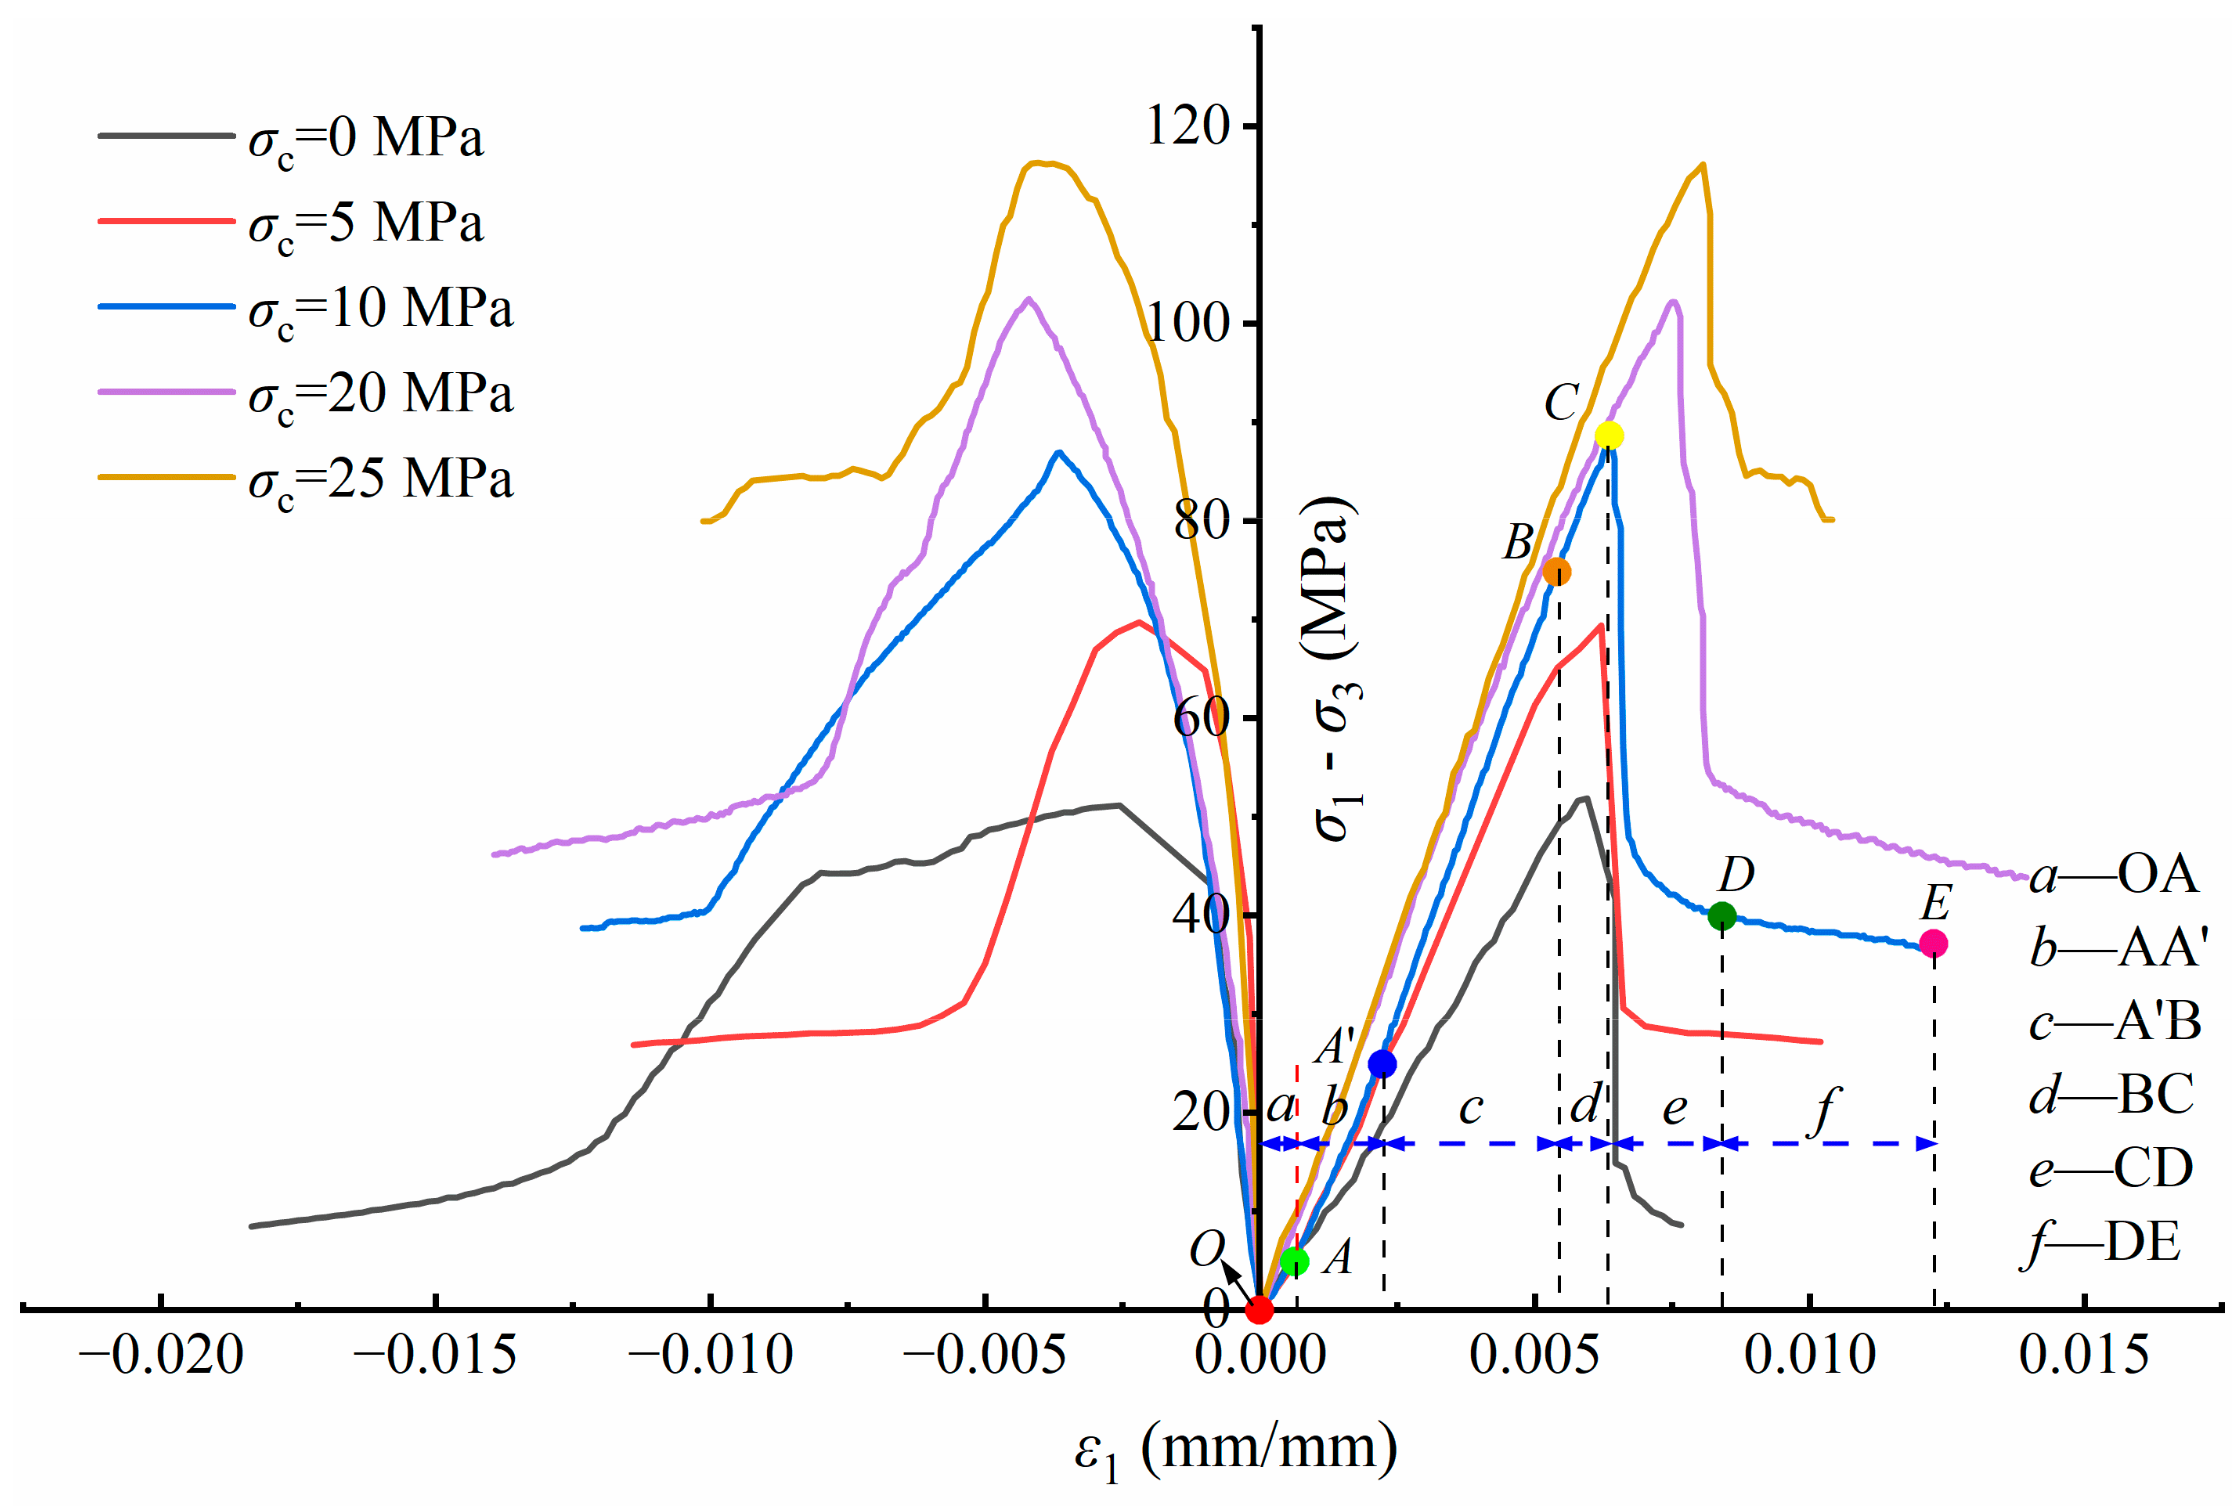
4.1. Results of Mechanical Characterization of Mudstone

Figure 6 shows the stress–strain curves of the mudstone subjected to different confining pressures. In this study, the mechanical properties of mudstone under five working conditions of 0 MPa, 5 MPa, 10 MPa, 20 MPa, and 25 MPa were investigated, respectively. As can be seen from the figures, the stress–strain curves of mudstone can be divided into six typical deformation stages: (1) initial nonlinear deformation stage (OA); (2) microcrack and pore closure stage (AA’); (3) linear elasticity stage (A’B); (4) microcrack extension stage (BC); (5) plastic damage stage (CD); and (6) residual strength stage (DE). It can be found that the mudstone enters the residual strength stage (DE), which exhibits some residual strength despite the fact that the mudstone has been damaged, mainly due to the frictional effect of the sliding presence of the damaged cleavage surfaces, as well as the external action provided by the surrounding pressure. The stress stays constant, the damage keeps building up and spreading, and the strain increases consistently as the axial displacement increases. But once the deformation reaches a certain point, the oil sealing mechanism is broken by the disturbed mudstone, and the oil seeps into the mudstone’s interior and fracture surfaces, causing the mudstone to slide and split quickly.
When comparing the outcomes of various confining pressures, it is discovered that the mudstone’s stress–strain curves fluctuate significantly depending on the confining pressure and that the mudstone’s strength progressively increases as the confining pressure rises. The mudstone’s peak strength is 51.91 MPa and its residual strength is 12.25 MPa under a confining pressure of 0 MPa. The mudstone’s maximum strength is 69.47 MPa under a confining pressure of 5 MPa, and its residual strength following damage is 27.65 MPa. It is discovered that the mudstone’s peak strength reaches 88.67 MPa and exhibits a considerable degree of strength when the confining pressure is increased to 10 MPa. At 20 MPa, the peak strength and residual strength of the mudstone are 103.28 MPa and 46.55 MPa, respectively, and the peak strength of the mudstone is 116.19 MPa and the residual strength of the mudstone is 51.63 MPa at 25 MPa, which is the highest peak strength and the highest residual strength of the mudstone in the world, compared to the mudstone with no pressure applied. Compared with the mudstone sample without the application of perimeter pressure, the peak strength and residual strength of the mudstone increased by 64.28 MPa and 39.38 MPa, respectively, which shows that the application of the perimeter pressure can effectively increase the strength of the mudstone and make the mudstone have a higher residual strength. This also shows that the mudstone has a higher bearing capacity under high perimeter pressure.
The mudstone’s modulus of elasticity and fitted curves under various confining pressures are displayed in Figure 7. The figure indicates that the elastic modulus E of mudstone progressively increases as the peripheral pressure rises and that the elastic modulus E growth rate tends to gradually decrease. In previous studies, scholars found that if the discrete nature of the rock specimens is eliminated, the modulus of elasticity of the rock can be considered independent of the peripheral pressure. This reaffirms that rock anisotropy and inhomogeneity due to the internal void structure of natural rocks are the main factors affecting the mechanical properties of rocks. The increase in the peripheral pressure can promote the closure of the cracks and void structures existing inside the mudstone, which, in turn, increases the friction of the crack surface and leads to the reduction in the shear slip occurring in the crack surface or void structure, which is also conducive to the improvement of the elastic modulus of mudstone. In addition, the elastic simulation is also fitted and analyzed in Figure 7. From the figure, it can be seen that the evolution pattern of the elastic modulus with respect to the circumferential pressure is in accordance with the power function distribution and the R2 is 0.95.

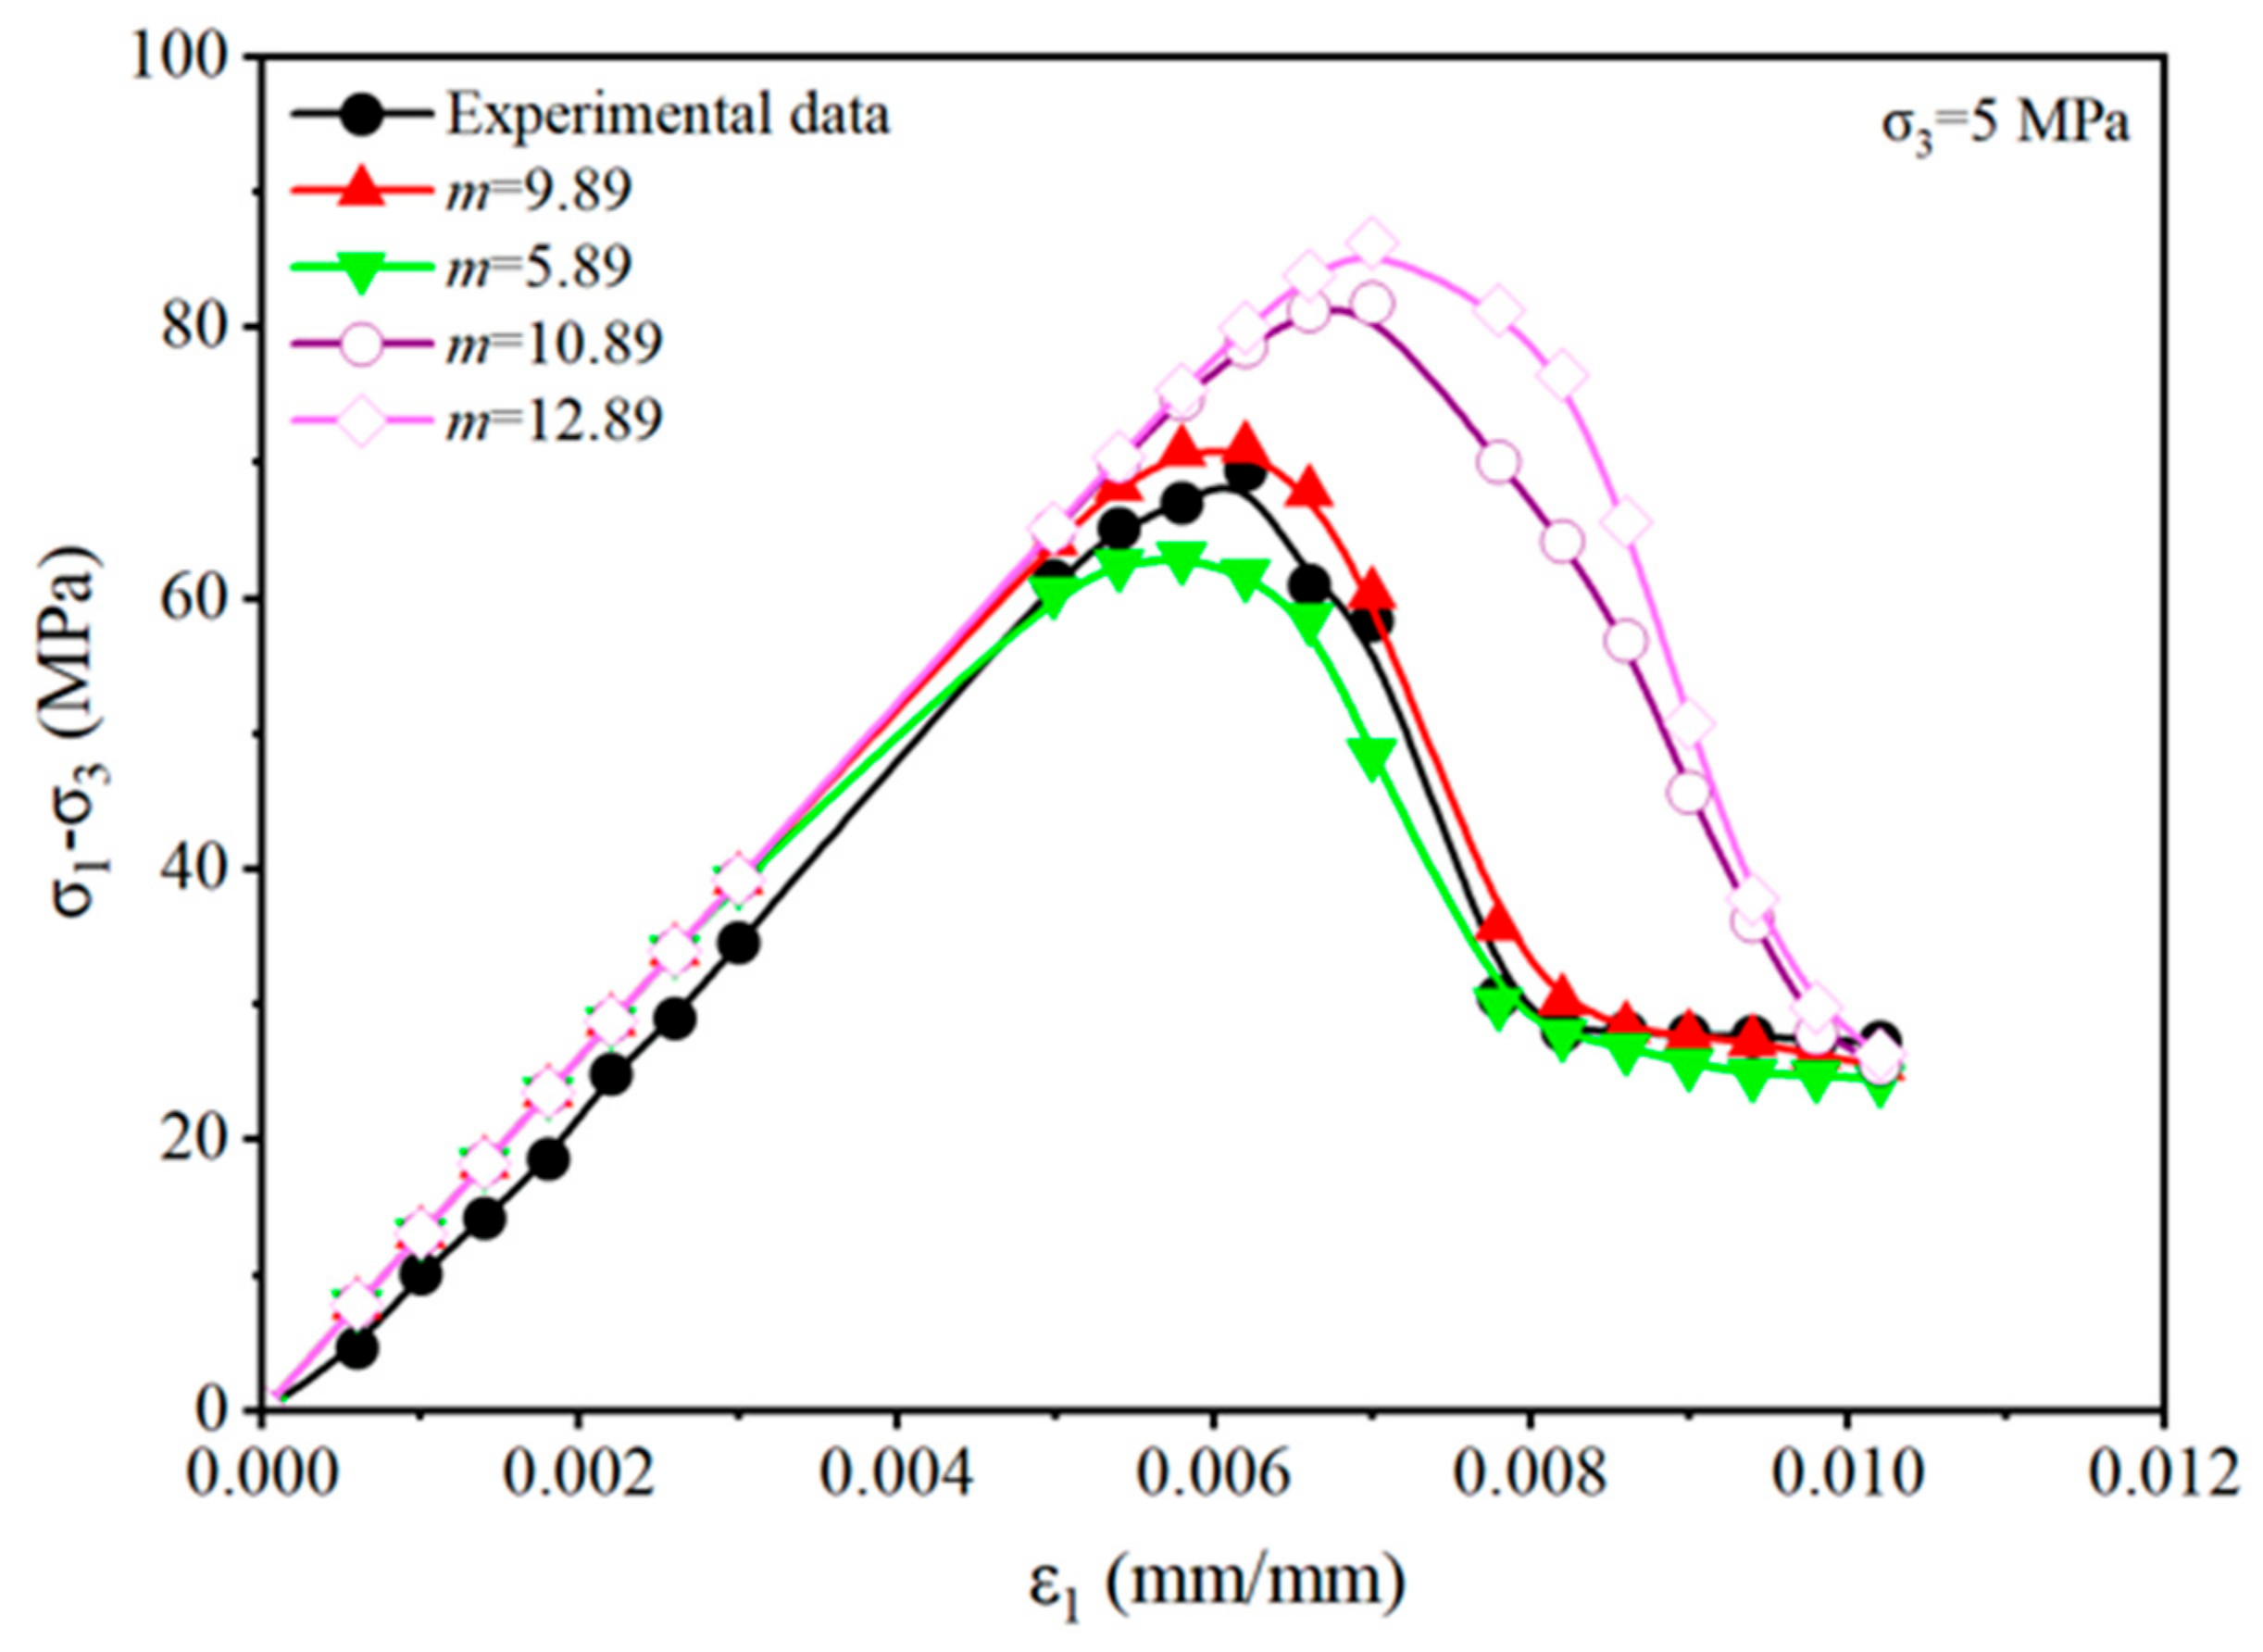
4.2. Parameter Sensitivity Analysis

In order to verify the effect of parameters m and ε0 on mudstone damage, mudstone damage with different parameters is analyzed separately. The stress–strain evolution of mudstone at an enclosing pressure of 5 MPa is selected for analysis. From the above analysis, the elastic modulus E of the mudstone is 13,067.58 MPa, the parameter m is 9.89, and the initial parameter ε0 is 0.0088 at a peripheral pressure of 5 MPa. Figure 8 shows the stress–strain curves calculated based on the intrinsic model of the mudstone damage under the condition of different parameters ε0. From the figure, it can be seen that the parameter ε0 has no obvious influence on the evolution law of the mudstone stress–strain curve. However, when parameter ε0 = 0.0088, the axial strain ε1 of the mudstone is 0.0062, and the large peak deviatoric stress (σ1σ3) it is subjected to is 69.47 MPa; with the increase in parameter ε0 to 0.0093, the axial strain ε1 of the mudstone does not change significantly, but the peak deviatoric stress it is subjected to is increased to 75.008. In addition, with the further increase in parameter ε0, the axial strain of the mudstone increases, but the peak bias stress also increases significantly. Although the effect of parameter ε0 on the residual bias stress of the mudstone is insignificant, the axial strain of the mudstone shows a significant increase with the increase in parameter ε0, which indicates that the parameter ε0 can reflect the macro-deformation strength of the mudstone. The increase in parameter ε0 correlates with elevated peak deviatoric stress, indicating that ε0 governs the critical threshold for damage accumulation in mudstone. Specifically, ε0 serves as a proxy for the minimum energy input required for microcrack propagation, where higher values necessitate greater stress levels to trigger significant damage. Furthermore, the enhanced bearing capacity associated with elevated ε0 values inversely reflects a lower degree of crack development within the mudstone matrix. Furthermore, the estimation methodology for parameter ε0 can be established based on the empirical relationship between ε0 and confining pressure derived from Table 2. Specifically, Equation (23) provides a predictive empirical correlation for ε0, enabling robust pre-experimental determination of this parameter with enhanced accuracy:
ε 0 = 0.0000041 σ 3 2 + 0.00013 σ 3 + 0.00776
Figure 9 shows the stress–strain curves calculated based on the damage ontology model of mudstone under different parameter m conditions. Under the calculation of different parameter m, the working condition is selected to be consistent with that in Figure 8, and the initial parameter m is 9.89. According to the evolution law of the curve in the figure, it can be seen that the value of the parameter m has a greater influence on the shape of the bias stress–strain curve. With the increase in the value of parameter m, the slope of the partial stress–strain curve in the mudstone damage stage gradually increases after the peak value. This indicates that the parameter m mainly reflects the degree of macroscopic brittleness of mudstone damage, and the larger the value of parameter m, the more obvious the macroscopic brittleness damage characteristic of mudstone. This further demonstrates that parameter m governs the damage localization process in mudstone. An increase in parameter m facilitates the transition of the internal microcrack network from stable propagation to unstable coalescence. From an engineering perspective, parameter m provides critical guidance for early-warning strategies: higher parameter m values intensify brittle failure characteristics, necessitating prioritized monitoring of the strain acceleration phase to prevent sudden instability. Conversely, lower parameter m values permit the implementation of progressive deformation monitoring protocols for mudstone.

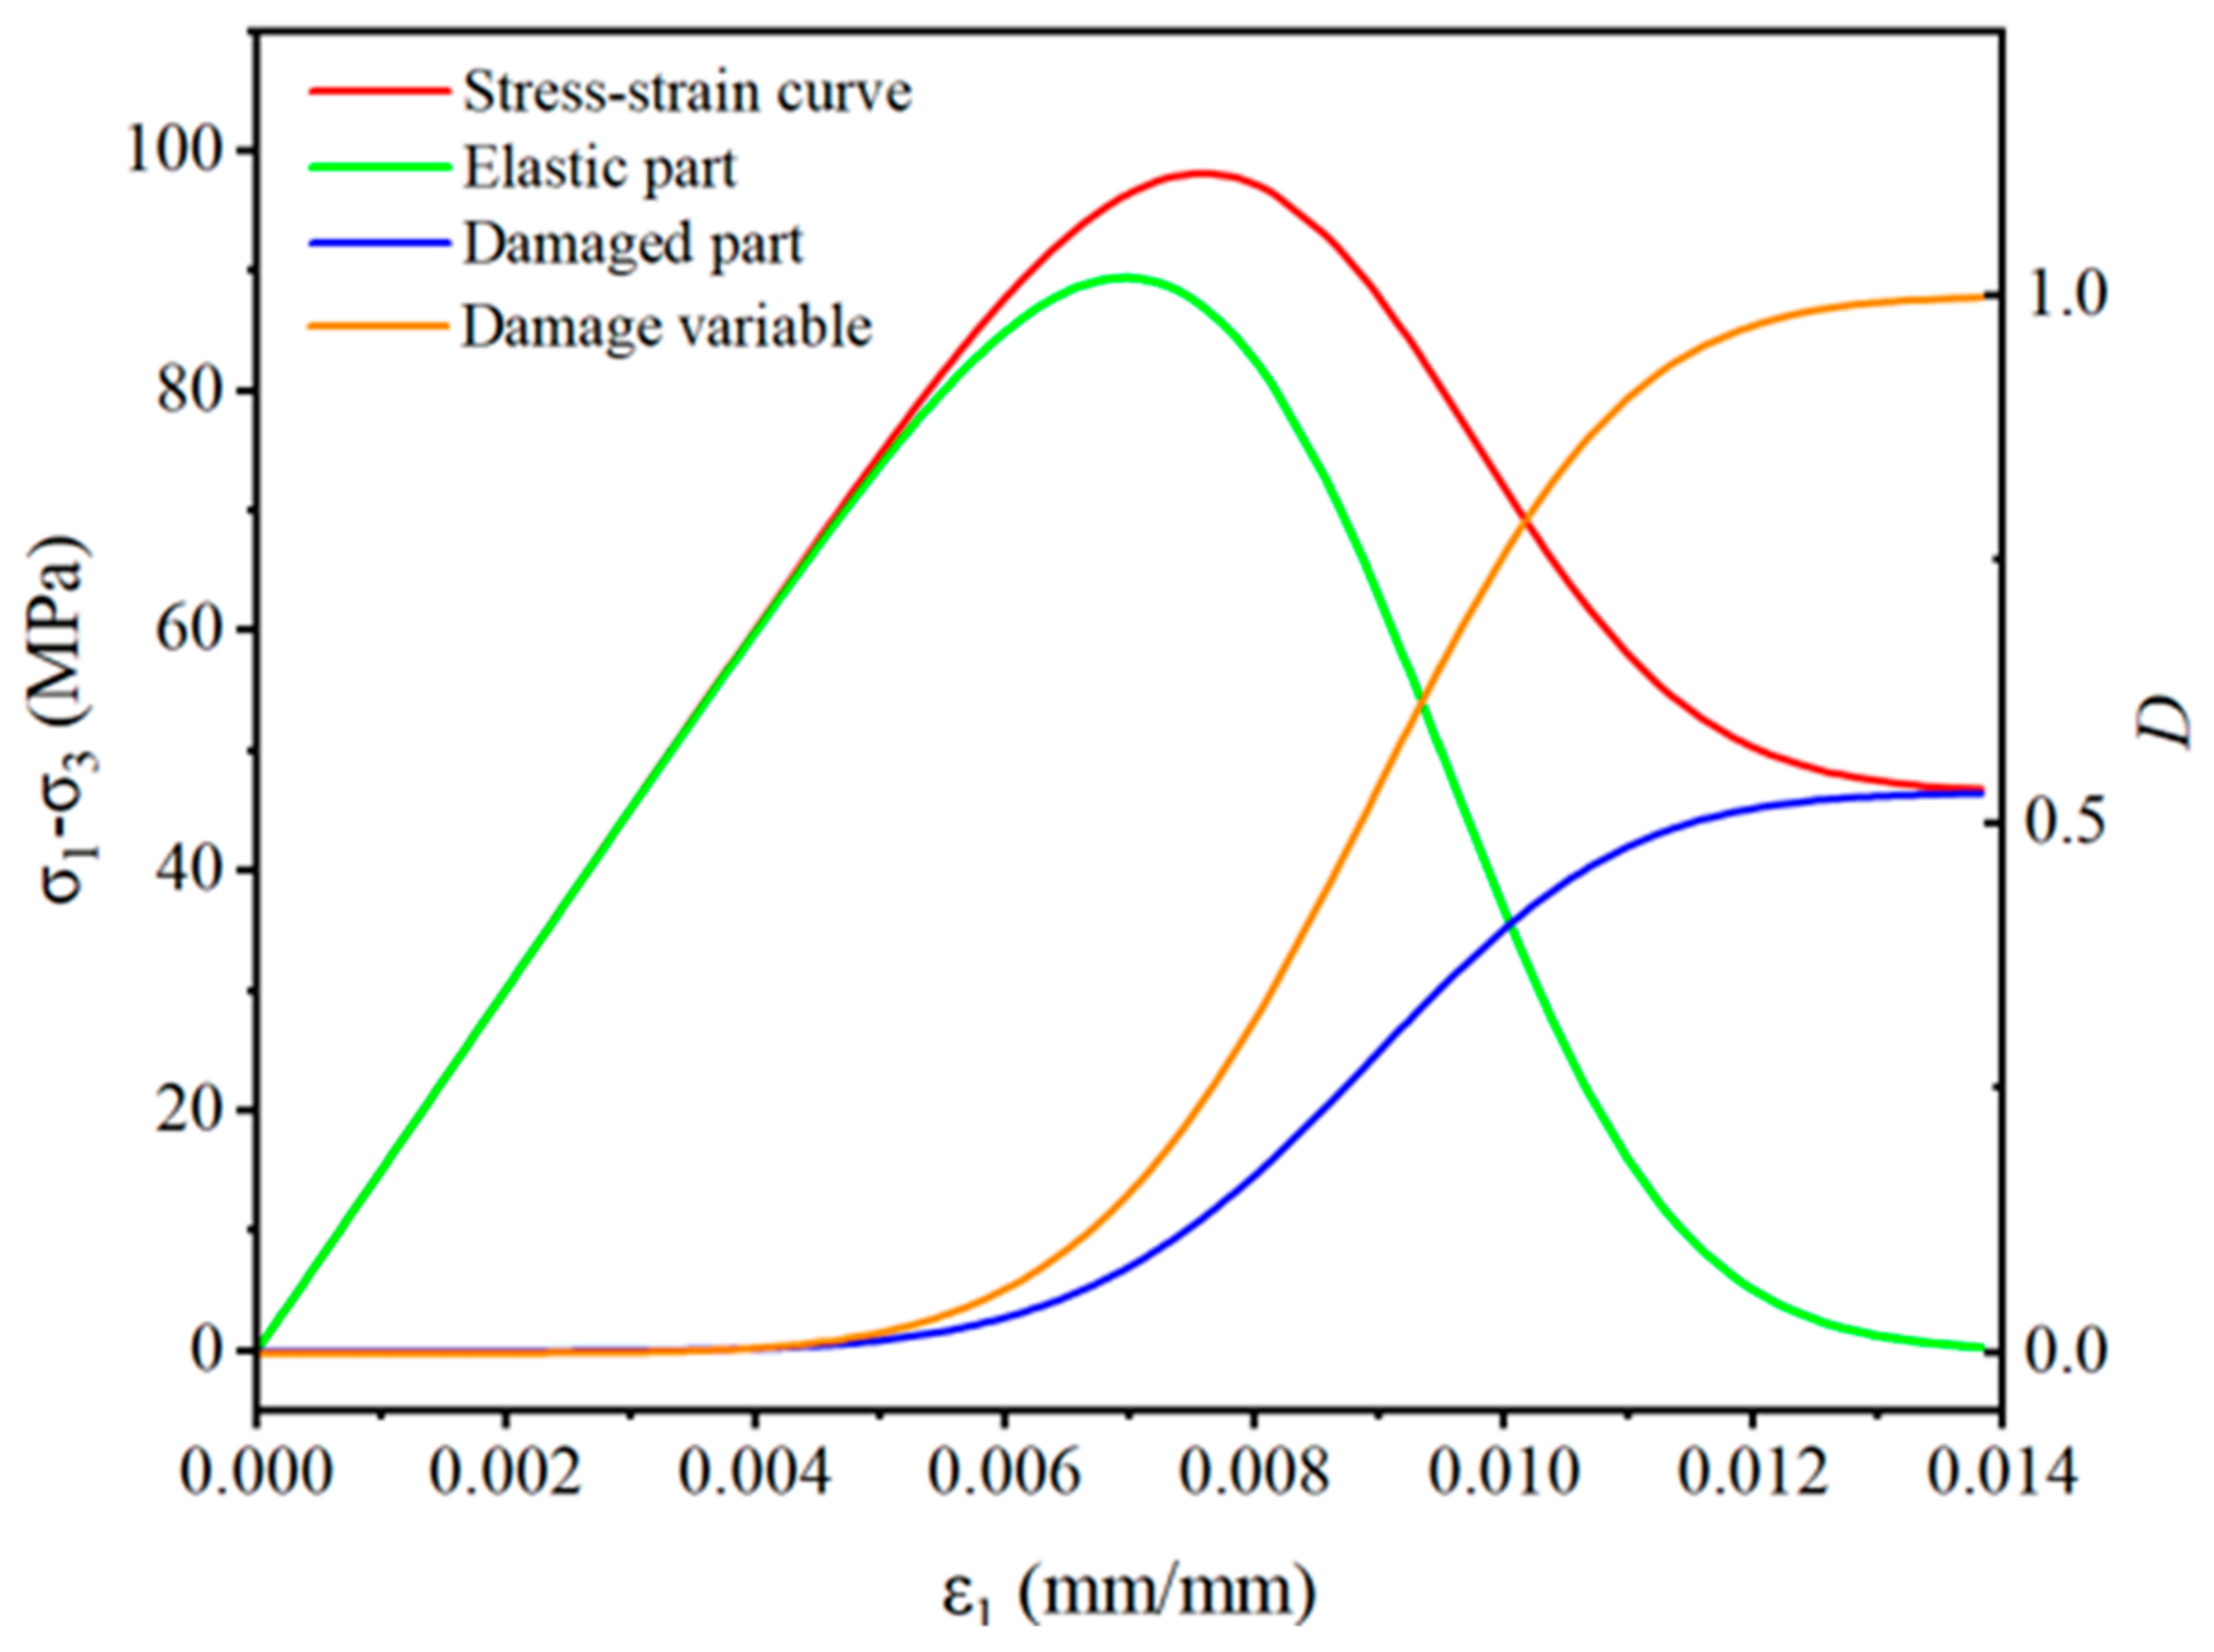
4.3. Damage Evolution Analysis

From Figure 6 and Equation (19), it can be seen that the total bias stress sustained by the mudstone under external loading is shared by the elastic part and the damaged part of the mudstone. Equation (19) suggests that the bias stress borne by the mudstone’s elastic component is determined by the first term of the equation, whereas the bias stress borne by the mudstone’s dammed portion is determined by the second term of the equation. This led to the independent calculation of the stress–strain curves for the various mudstone sections under triaxial compression. The stress–strain curves of mudstone predicted by theoretical modeling at a perimeter pressure of 20 MPa are displayed in Figure 10. The red curve in the figure represents the model’s predicted total bias stress–strain curve for the mudstone; the green curve represents the mudstone’s elastic portion’s calculated stress–strain curve; the blue curve represents the mudstone’s damaged portion’s calculated stress–strain curve; and the orange curve represents the damage variable D’s evolution curve. From the figure, it can be seen that the damage variable shows an S shape with increasing strain. A similar trend is the partial stress–strain curve of the damaged part of mudstone in the ring-breaking process. As can be seen from the figure, when the strain is less than 0.004, the deformation inside the mudstone is basically caused by the elastic part of the mudstone, and it can be considered that the mudstone enters into the elastic stage at this stage, and the damage variable D is about equal to 0. When the strain is greater than 0.004 and less than 0.0125, the damaged part of the mudstone starts to deform and destroy, and the bias stress carried by the elastic part decreases with the increase in the strain, and the bias stress carried by the damaged part increases gradually. At this stage, the damage variable of the mudstone also gradually approaches 1 from 0. When the strain is greater than 0.0125, the damage variable is equal to 1, which indicates that all the internal microscopic units of the mudstone are damaged. At the same time, this also reflects that the bias stress that the mudstone is subjected to in this stage is the residual bias stress, and this part of the stress-carrying unit is also provided by all the damaged parts of the mudstone.

5. Conclusions

The reliability of the constructed statistical damage constitutive model of mudstone is confirmed with respect to the mechanical behavior of mudstone and its damage characteristics under various peripheral pressure conditions. The parameter sensitivity of the constructed constitutive model as well as the damage evolution mechanism of mudstone are thoroughly examined. This study establishes a statistical damage constitutive model of mudstone based on continuous damage mechanics through systematic laboratory damage mechanism research and theoretical analysis. The following is discovered:
(1)
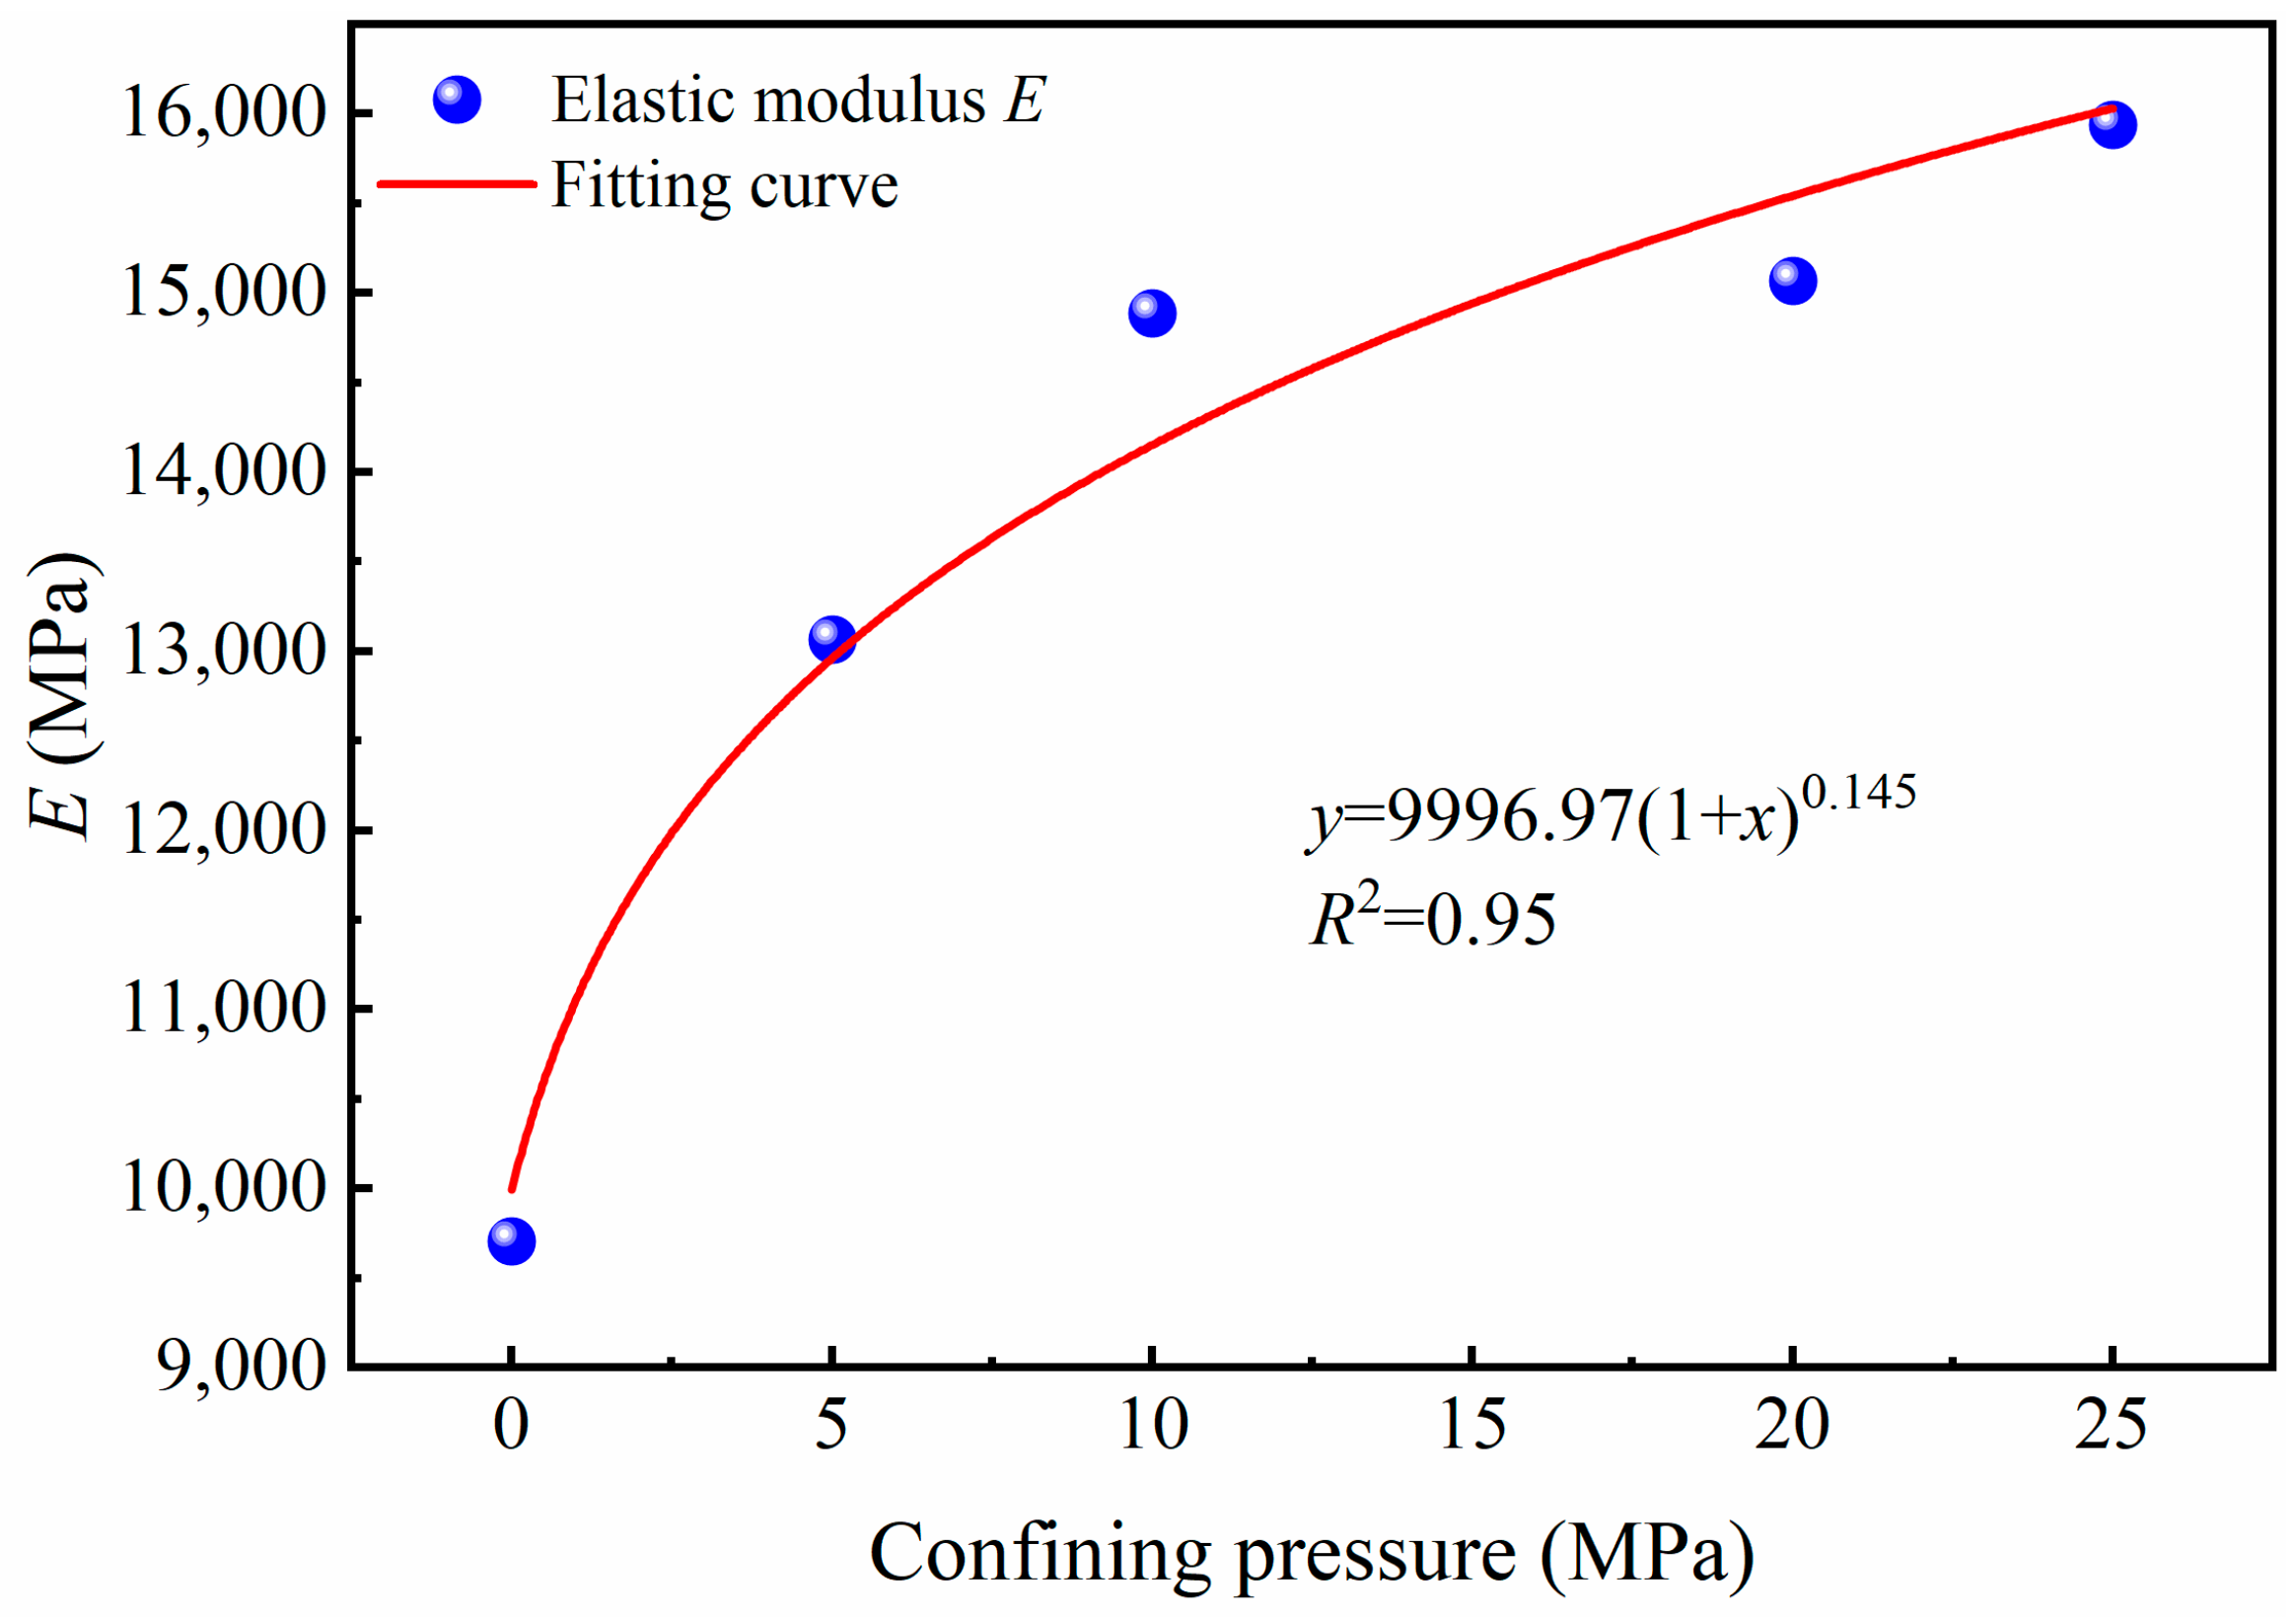
Mudstone’s stress–strain curve has clear stage features; as peripheral pressure rises, the material’s peak and residual strengths considerably increase, and its elastic modulus also rises.
(2)
The validity of the developed model is confirmed by comparing and analyzing the constructed mudstone statistical damage model with the test findings. It is also possible to anticipate the stress–strain response under various peripheral pressures using the constructed mudstone damage constitutive model. This is crucial for comprehending and forecasting mudstone behavior in real-world engineering applications.
(3)
The sensitivity analysis validates the impact of the model parameters on the mudstone damage characteristics. The microstructural characteristics of mudstone are closely related to the parameter ε0, whereas the macroscopic deformation strength of mudstone is primarily reflected by the parameter m.
(4)
A new tool for comprehending and forecasting the mechanical behavior of mudstone under intricate stress situations is provided by the statistical damage ontology model of mudstone that was suggested in this study. To confirm and broaden the model’s applicability, future research can investigate its application to different kinds of rocks.

Author Contributions

Y.L., conceptualization, software, data curation, methodology, and writing—original draft preparation; L.C., investigation, formal analysis, writing—original draft preparation, and supervision; S.R., data curation, software, and validation; X.L., conceptualization, methodology, data curation, and supervision; M.L., conceptualization, methodology, and data curation; K.L., methodology and data curation. All authors have read and agreed to the published version of the manuscript.

Funding

This study was financially supported by the Open Project of Chongqing Institute of Geology and Mineral Resources (Grant No. TICG-K2024006), the Natural Science Foundation Project of Chongqing (Grant No. CSTB2022NSCQ-MSX0427), and the Science and Technology Research Program of Chongqing Municipal Education Commission (Grant No. KJZD-M202400702).

Data Availability Statement

The data that support the findings of this study are available from the corresponding author upon request.

Conflicts of Interest

Author Mengjiao Liu was employed by State Grid Xuzhou Power Supply Company. The remaining authors declare that the research was conducted in the absence of any commercial or financial relationships that could be construed as a potential conflict of interest.

Nomenclature

CA constant of integrationf(p)Probability density distribution function
DThe damage variablemMechanical properties of mudstone
DedEnvironmental damage and its variablepRandomly distributed variable
DndNatural damage and its variableGreek letter
DsdStress damage and its variableε1The axial strain
EThe modulus of elasticityε0Mechanical properties of mudstone
NThe sum of all the microelementsε1The peak point strain
NDThe number of damaged microelementsσ1The axial load
VdThe total amount of damaged rock unitsσiThe apparent stress
VudThe volume of undamaged rock unitsσieThe effective stress

References

  1. Guan, Q.S. Casing milling and fishing technology of directional borehole in mudstone formation in underground coal mine. Saf. Coal Mines 2021, 52, 152–155. [Google Scholar] [CrossRef]
  2. Xiao, D.; Fu, W.; Wu, Q.; Sun, R.; Huang, F.; Tan, S.; Zhang, Y.; Fang, X. Drilling fluid for mudstone in wulonggou mine of qinghai province. Explor. Eng. (Rock Soil Drill. Tunneling) 2019, 46, 45–50. [Google Scholar]
  3. Guo, Z.; Wang, Q.; Yin, S.; Kuai, X.; Yan, D.; Li, M.; Qu, Y. The creep compaction behavior of crushed mudstones under the step loading in underground mining. Int. J. Coal Sci. Technol. 2019, 6, 408–418. [Google Scholar] [CrossRef]
  4. Huang, Z.; Liu, K.; Cui, S.; Yao, J.; Wu, Y.; Sepehrnoori, K.; Jia, C. Numerical Simulation of Reactive Flow in Fractured Vuggy Carbonate Reservoirs Considering Hydro-Mechanical-Chemical Coupling Effects. SPE J. 2025, 30, 853–874. [Google Scholar] [CrossRef]
  5. Zhang, X.; Liu, X.; Chen, C.; Kong, L.; Wang, G. Engineering geology of residual soil derived from mudstone in zimbabwe. Eng. Geol. 2020, 277, 105785. [Google Scholar] [CrossRef]
  6. Wu, L.Z.; Li, S.H.; Sun, P.; Huang, R.Q.; Li, B. Shear creep tests on fissured mudstone and an improved time-dependent model. Pure Appl. Geophys. 2019, 176, 4797–4808. [Google Scholar] [CrossRef]
  7. Douma, L.A.N.R.; Dautriat, J.; Sarout, J.; Dewhurst, D.N.; Barnhoorn, A. Impact of water saturation on the elastic anisotropy of the whitby mudstone, united kingdom. Geophysics 2020, 85, MR57–MR72. [Google Scholar] [CrossRef]
  8. Li, S.N.; Liu, X.X.; Li, Y.; Wang, W.W.; Zhou, Y.M. Study on the deformation characteristics and damage evolution law of the progressive failure process of carbonaceous mudstone. China J. Highw. Transp. 2022, 35, 99–107. [Google Scholar] [CrossRef]
  9. Jing, H.; Yin, Q.; Yang, S.; Chen, W. Micro-mesoscopic creep damage evolution and failure mechanism of sandy mudstone. Int. J. Geomech. 2021, 21, 04021010. [Google Scholar] [CrossRef]
  10. Bai, W.; Lu, X.; Guan, J.; Huang, S.; Yuan, C.; Xu, C. Stress–strain behavior of FRC in uniaxial tension based on mesoscopic damage model. Crystals 2021, 11, 689. [Google Scholar] [CrossRef]
  11. Kang, G.; Yang, Z.; Chen, P.; Liu, R.; Ning, Y.; Pang, S. Mechanical behavior simulation of particulate-filled composite at meso-scale by numerical manifold method. Int. J. Mech. Sci. 2021, 213, 106846. [Google Scholar] [CrossRef]
  12. Rinker-Schaeffer, C.W.; O’Keefe, J.P.; Welch, D.R.; Theodorescu, D. Metastasis suppressor proteins: Discovery, molecular mechanisms, and clinical application. Clin. Cancer Res. 2006, 12, 3882–3889. [Google Scholar] [CrossRef] [PubMed]
  13. Pan, X.; Guo, W.; Wu, S.; Chu, J. An experimental approach for determination of the weibull homogeneity index of rock or rock-like materials. Acta Geotech. 2019, 15, 375–391. [Google Scholar] [CrossRef]
  14. Jiang, H.P.; Jiang, A.N.; Yang, X.R. Statistical damage constitutive model of high temperature rock based on weibull distribution and its verification. DOAJ (DOAJ Dir. Open Access J.) 2021, 42, 1894–1902. [Google Scholar] [CrossRef]
  15. Yang, B.; Qin, S.; Xue, L.; Chen, H. The reasonable range limit of the shape parameter in the weibull distribution for describing the brittle failure behavior of rocks. Rock Mech. Rock Eng. 2021, 54, 3359–3367. [Google Scholar] [CrossRef]
  16. Lisjak, A.; Liu, Q.; Zhao, Q.; Mahabadi, O.K.; Grasselli, G. Numerical simulation of acoustic emission in brittle rocks by two-dimensional finite-discrete element analysis. Geophys. J. Int. 2014, 196, 1263. [Google Scholar] [CrossRef]
  17. Ren, C.; Yu, J.; Liu, S.; Yao, W.; Zhu, Y.; Liu, X. A plastic strain-induced damage model of porous rock suitable for different stress paths. Rock Mech. Rock Eng. 2022, 55, 1887–1906. [Google Scholar] [CrossRef]
  18. Ma, Q.; Tan, Y.; Liu, X.; Gu, Q.; Li, X. Effect of coal thicknesses on energy evolution characteristics of roof rock-coal-floor rock sandwich composite structure and its damage constitutive model. Compos. Part B Eng. 2020, 198, 108086. [Google Scholar] [CrossRef]
  19. Lyu, C.; Liu, J.; Ren, Y.; Liang, C.; Liao, Y. Study on very long-term creep tests and nonlinear creep-damage constitutive model of salt rock. Int. J. Rock Mech. Min. Sci. (1997) 2021, 146, 104873. [Google Scholar] [CrossRef]
  20. Yang, C.; Zhou, K.; Xiong, X.; Deng, H.; Pan, Z. Experimental investigation on rock mechanical properties and infrared radiation characteristics with freeze-thaw cycle treatment. Cold Reg. Sci. Technol. 2021, 183, 103232. [Google Scholar] [CrossRef]
  21. Zhang, H.; Meng, X.; Yang, G. A study on mechanical properties and damage model of rock subjected to freeze-thaw cycles and confining pressure. Cold Reg. Sci. Technol. 2020, 174, 103056. [Google Scholar] [CrossRef]
  22. Zhu, T.; Chen, J.; Huang, D.; Luo, Y.; Li, Y.; Xu, L. A DEM-based approach for modeling the damage of rock under freeze–thaw cycles. Rock Mech. Rock Eng. 2021, 54, 2843–2858. [Google Scholar] [CrossRef]
  23. Tang, Y.; Okubo, S.; Xu, J.; Peng, S. Progressive failure behaviors and crack evolution of rocks under triaxial compression by 3d digital image correlation. Eng. Geol. 2019, 249, 172–185. [Google Scholar] [CrossRef]
  24. Sun, X.; Li, X.; Zheng, B.; He, J.; Mao, T. Study on the progressive fracturing in soil and rock mixture under uniaxial compression conditions by CT scanning. Eng. Geol. 2020, 279, 105884. [Google Scholar] [CrossRef]
  25. Meng, X.; Zhang, H.; Liu, X. Rock damage constitutive model based on the modified logistic equation under freeze–thaw and load conditions. J. Cold Reg. Eng. 2021, 35, 04021016. [Google Scholar] [CrossRef]
  26. Li, Y.; Jia, D.; Rui, Z.; Peng, J.; Fu, C.; Zhang, J. Evaluation method of rock brittleness based on statistical constitutive relations for rock damage. J. Pet. Sci. Eng. 2017, 153, 123–132. [Google Scholar] [CrossRef]
  27. Liu, Y.; Dai, F. A review of experimental and theoretical research on the deformation and failure behavior of rocks subjected to cyclic loading. J. Rock Mech. Geotech. Eng. 2021, 13, 1203–1230. [Google Scholar] [CrossRef]
  28. Wang, C.; He, B.; Hou, X.; Li, J.; Liu, L. Stress–energy mechanism for rock failure evolution based on damage mechanics in hard rock. Rock Mech. Rock Eng. 2019, 53, 1021–1037. [Google Scholar] [CrossRef]
Figure 1. Processing flow and physical diagram of mudstone specimen.
Processes 13 00864 g001
Figure 2. XRD results of mudstone specimens.
Processes 13 00864 g002
Figure 3. Mudstone mechanics experiment system and specimen installation.
Processes 13 00864 g003
Figure 4. (a) Damage of rock specimens under the action of different factors. (b) Microcracks and macrocracks in the mudstone equivalent model.
Processes 13 00864 g004
Figure 5. Comparison between experimental data and model prediction of mudstone stress–strain curve: (a) σ3 = 0 MPa; (b) σ3 = 5 MPa; (c) σ3 = 10 MPa; (d) σ3 = 20 MPa; (e) σ3 = 25 MPa.
Processes 13 00864 g005
Figure 6. Stress–strain curve of mudstone.
Processes 13 00864 g006
Figure 7. The connection between confining pressure and modulus of elasticity.
Processes 13 00864 g007
Figure 8. Stress–strain curves based on damage constitutive model with different parameter ε0 condition.
Processes 13 00864 g008
Figure 9. Stress–strain curves based on damage constitutive model with different parameter m condition.
Processes 13 00864 g009
Figure 10. Stresses on elastic and damaged parts of mudstone (σ3 = 20 MPa).
Processes 13 00864 g010
Table 1. The statistical information about the mudstone specimens.
Mudstoneρ (g/cm3)φ (%)w (%)d (mm)h (mm)
Average value2.1310.231.3550.02100.01
Table 2. Parameters of mudstone modeling with different circumferential pressure.
σ3 (MPa)Parameter
E (MPa)(σ1σ3)r (MPa)mε0
09709.3412.2513.720.0077
513,067.5827.659.890.0088
1014,888.2637.388.680.0092
2015,068.6546.556.380.0119
2515,939.6281.634.890.0137
Disclaimer/Publisher’s Note: The statements, opinions and data contained in all publications are solely those of the individual author(s) and contributor(s) and not of MDPI and/or the editor(s). MDPI and/or the editor(s) disclaim responsibility for any injury to people or property resulting from any ideas, methods, instructions or products referred to in the content.

