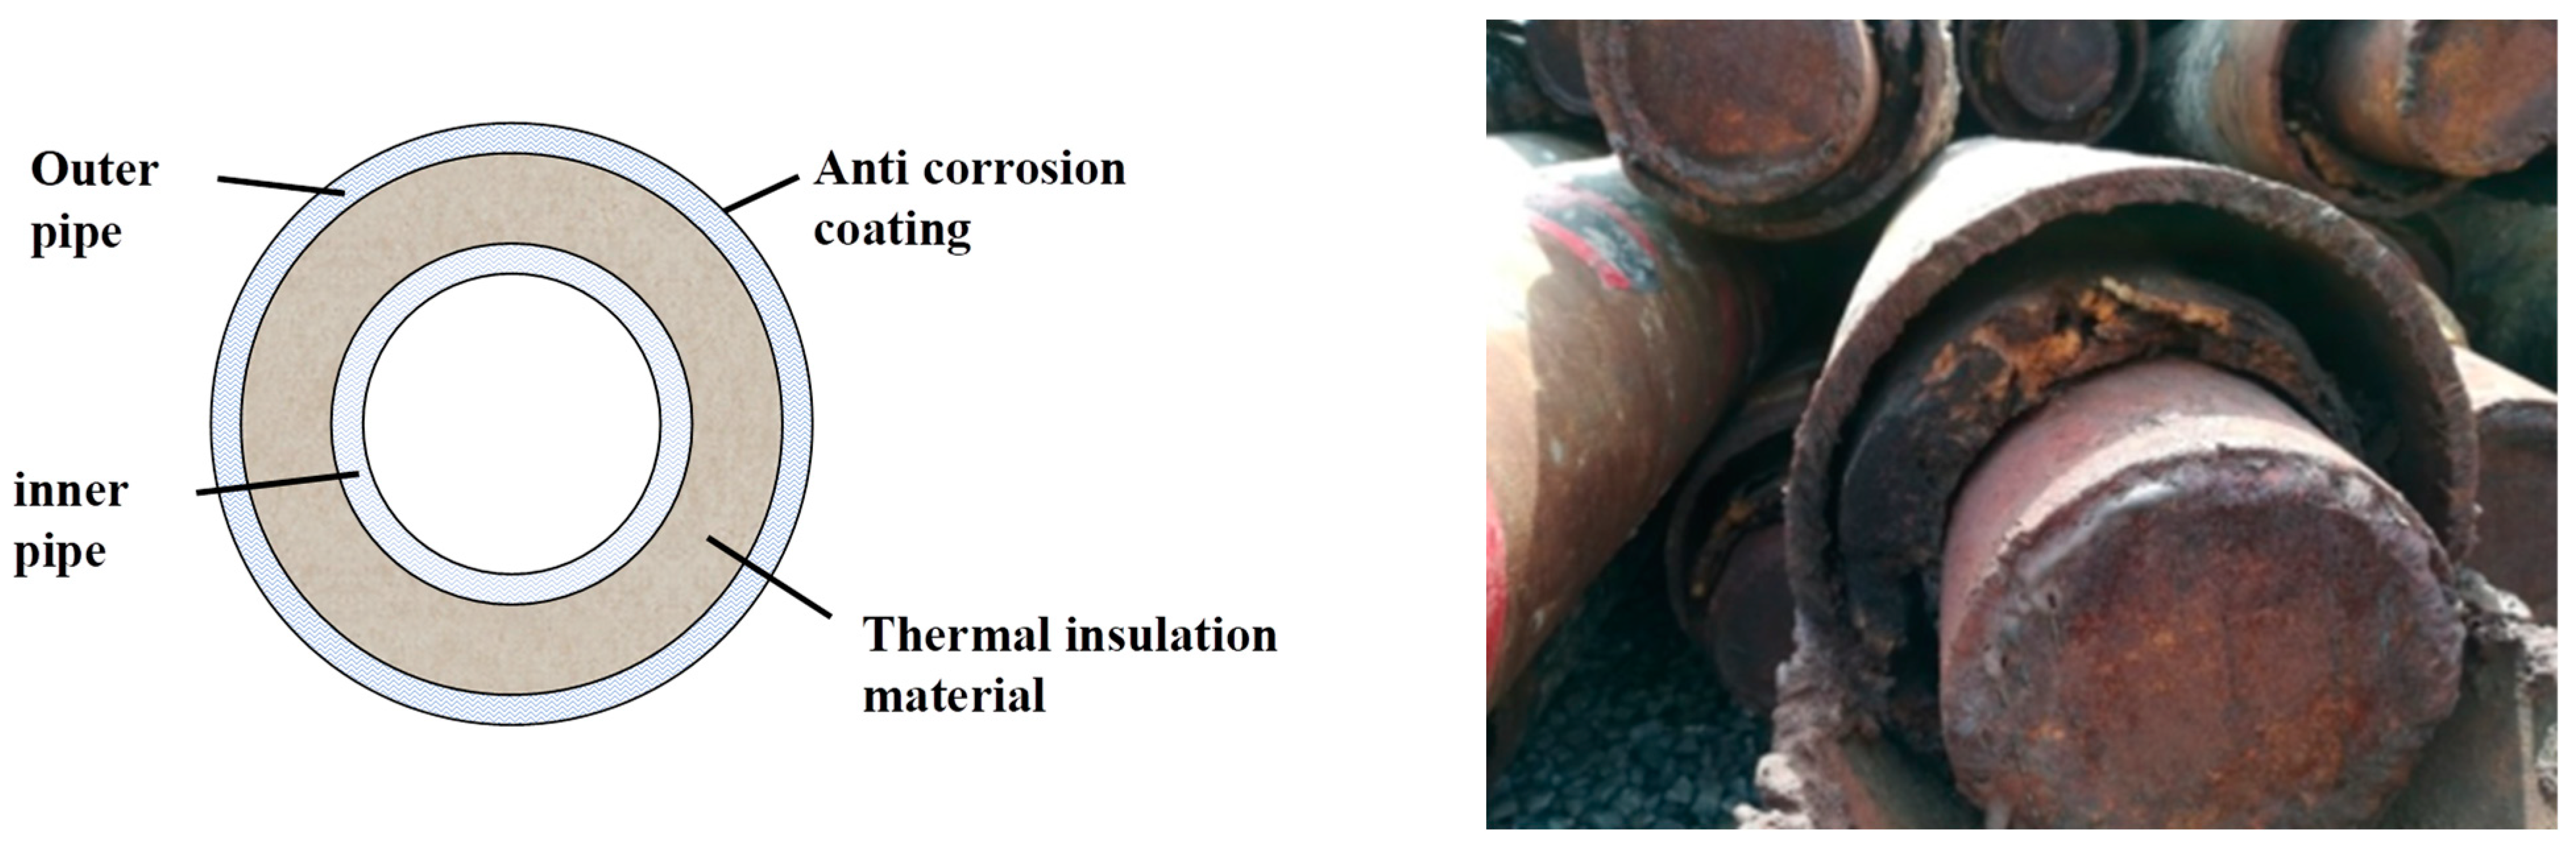
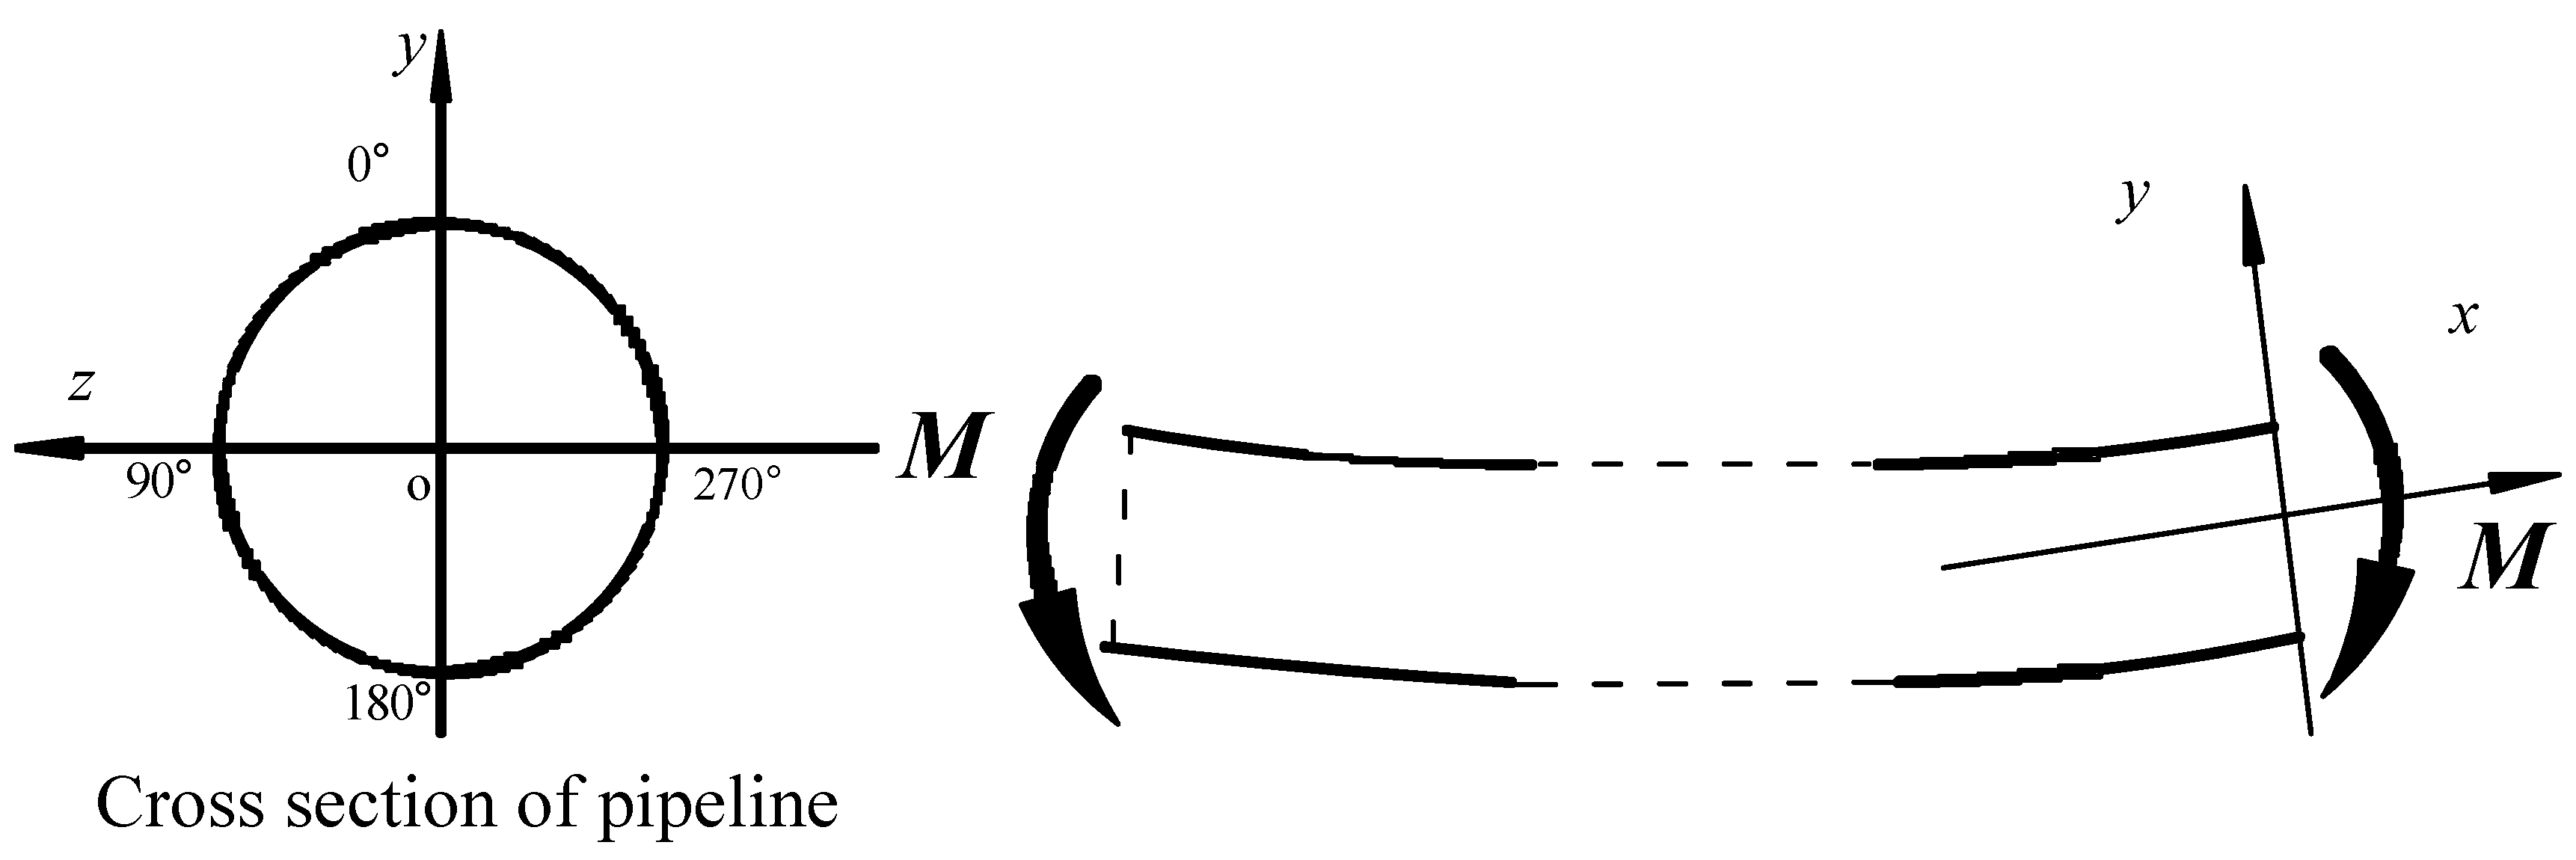
Figure 1.
Cross-sectional view of the double-layer pipeline (PIP).
Figure 1.
Cross-sectional view of the double-layer pipeline (PIP).
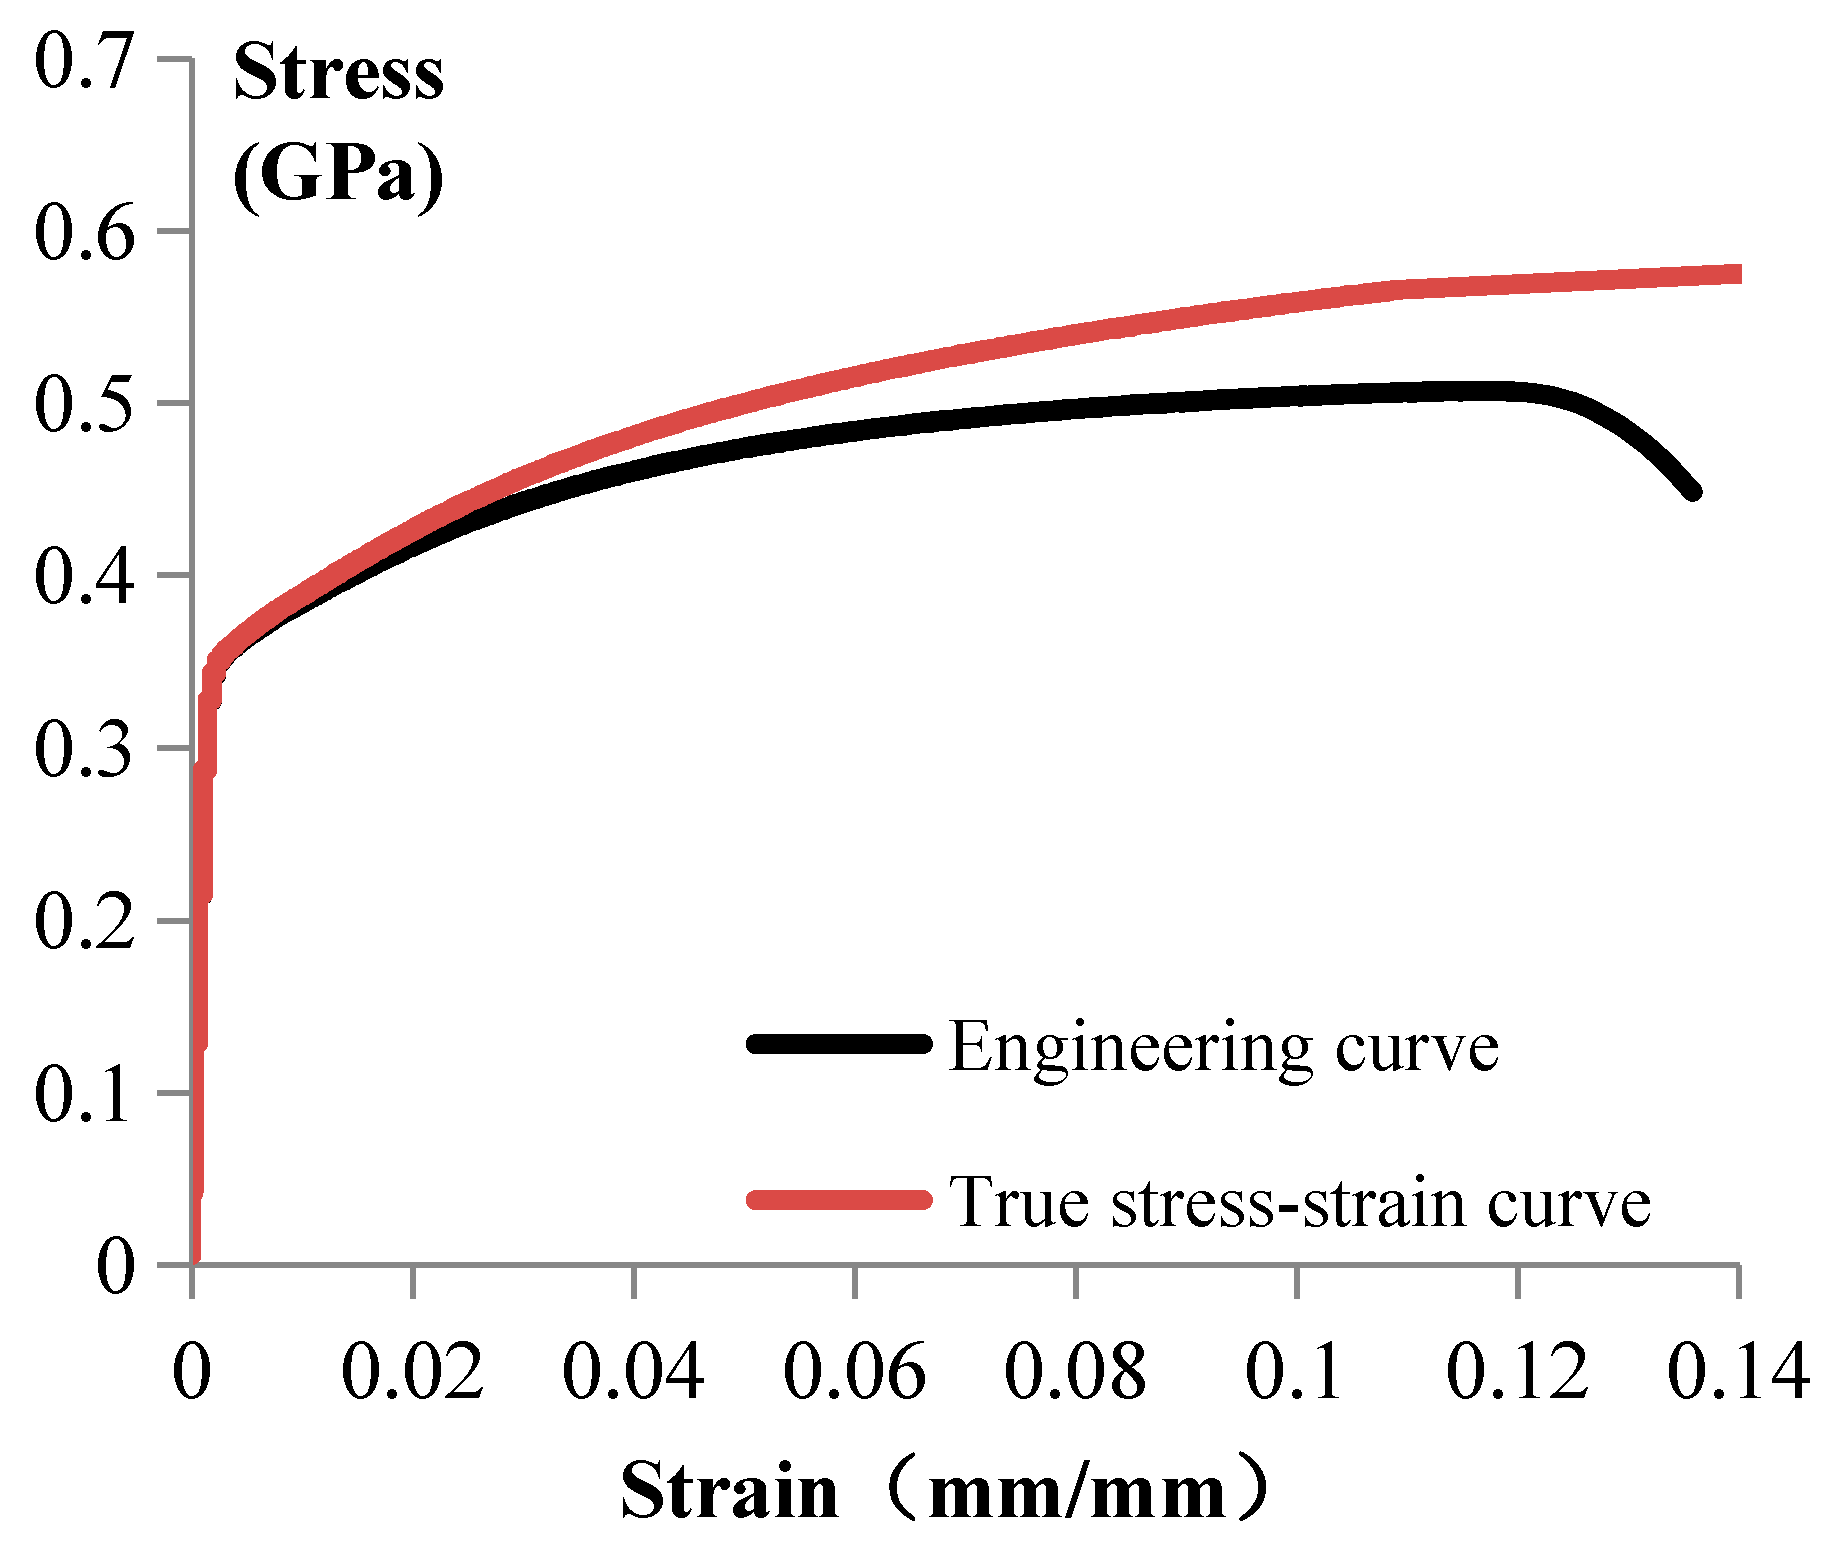
Figure 2.
Stress–strain curve of 16Mn steel.
Figure 2.
Stress–strain curve of 16Mn steel.
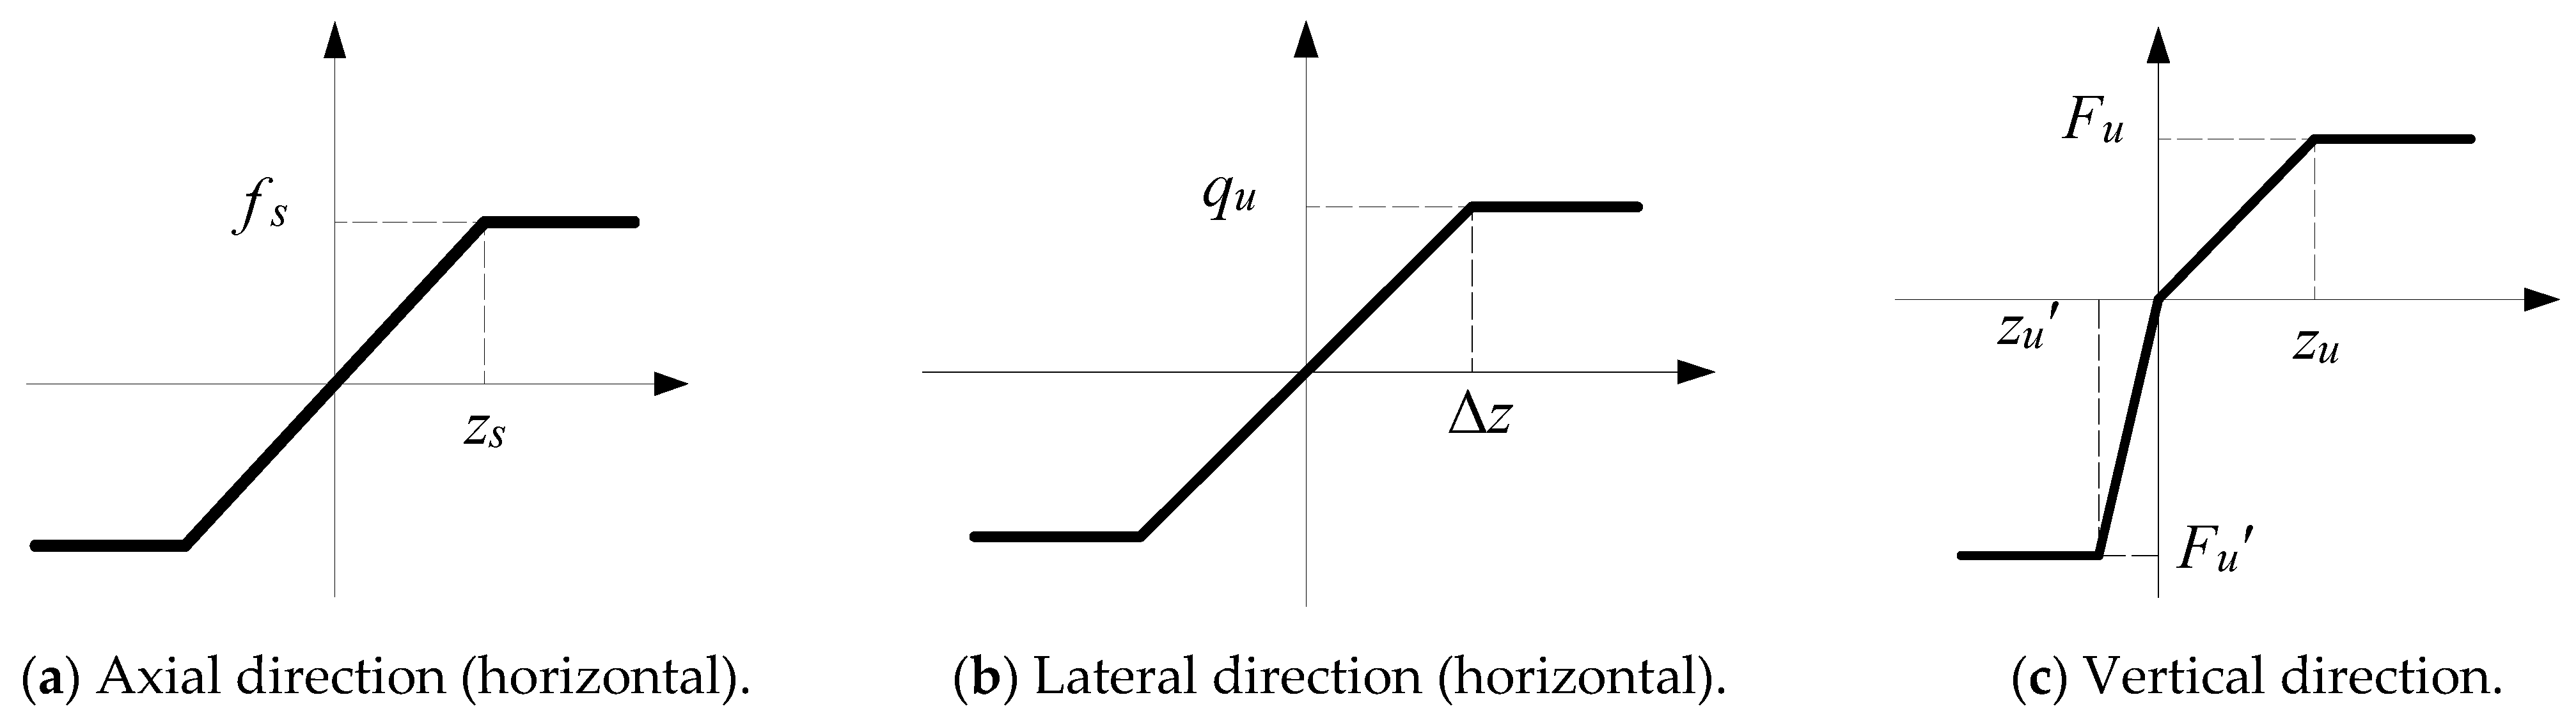
Figure 3.
Constitutive model of soil springs.
Figure 3.
Constitutive model of soil springs.
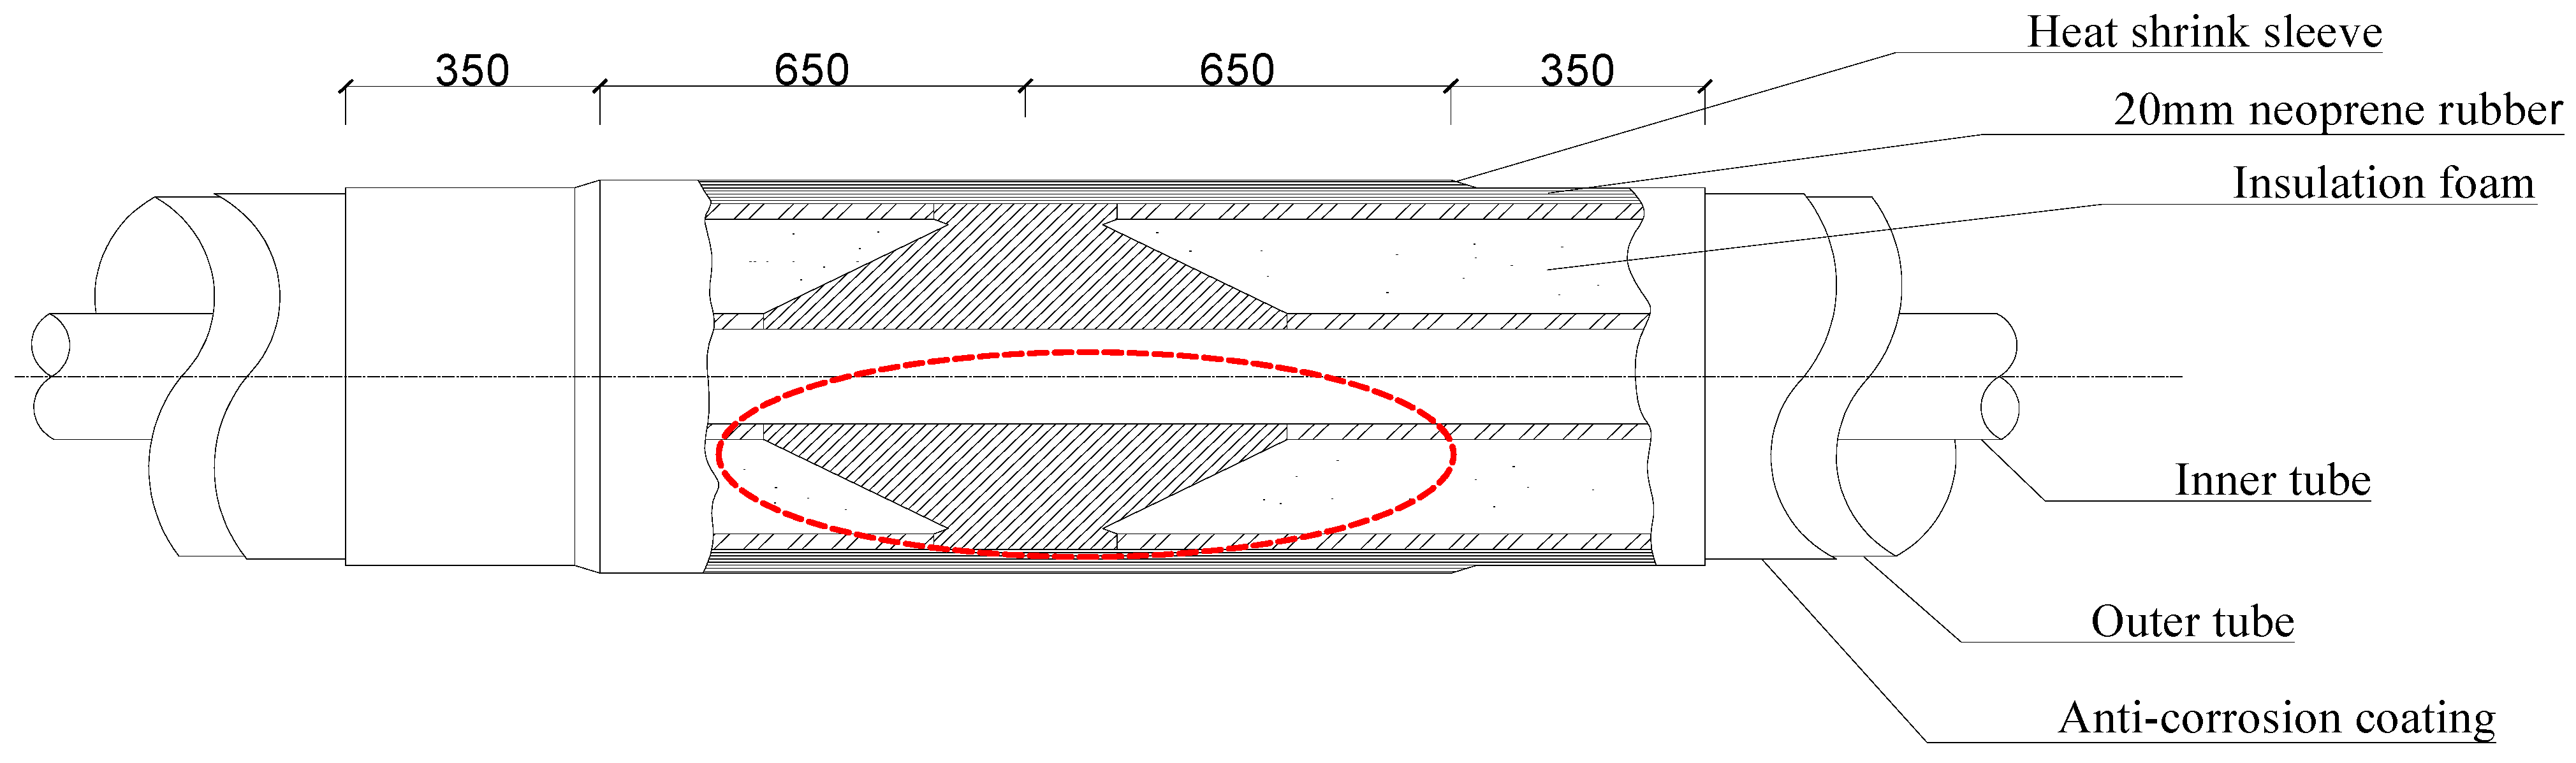
Figure 4.
Spring element model of inner and outer tubes.
Figure 4.
Spring element model of inner and outer tubes.
Figure 5.
Connection method of spring elements between inter-pipes.
Figure 5.
Connection method of spring elements between inter-pipes.
Figure 6.
Typical rigid joint connection diagram.
Figure 6.
Typical rigid joint connection diagram.
Figure 7.
Rigid joint connection.
Figure 7.
Rigid joint connection.
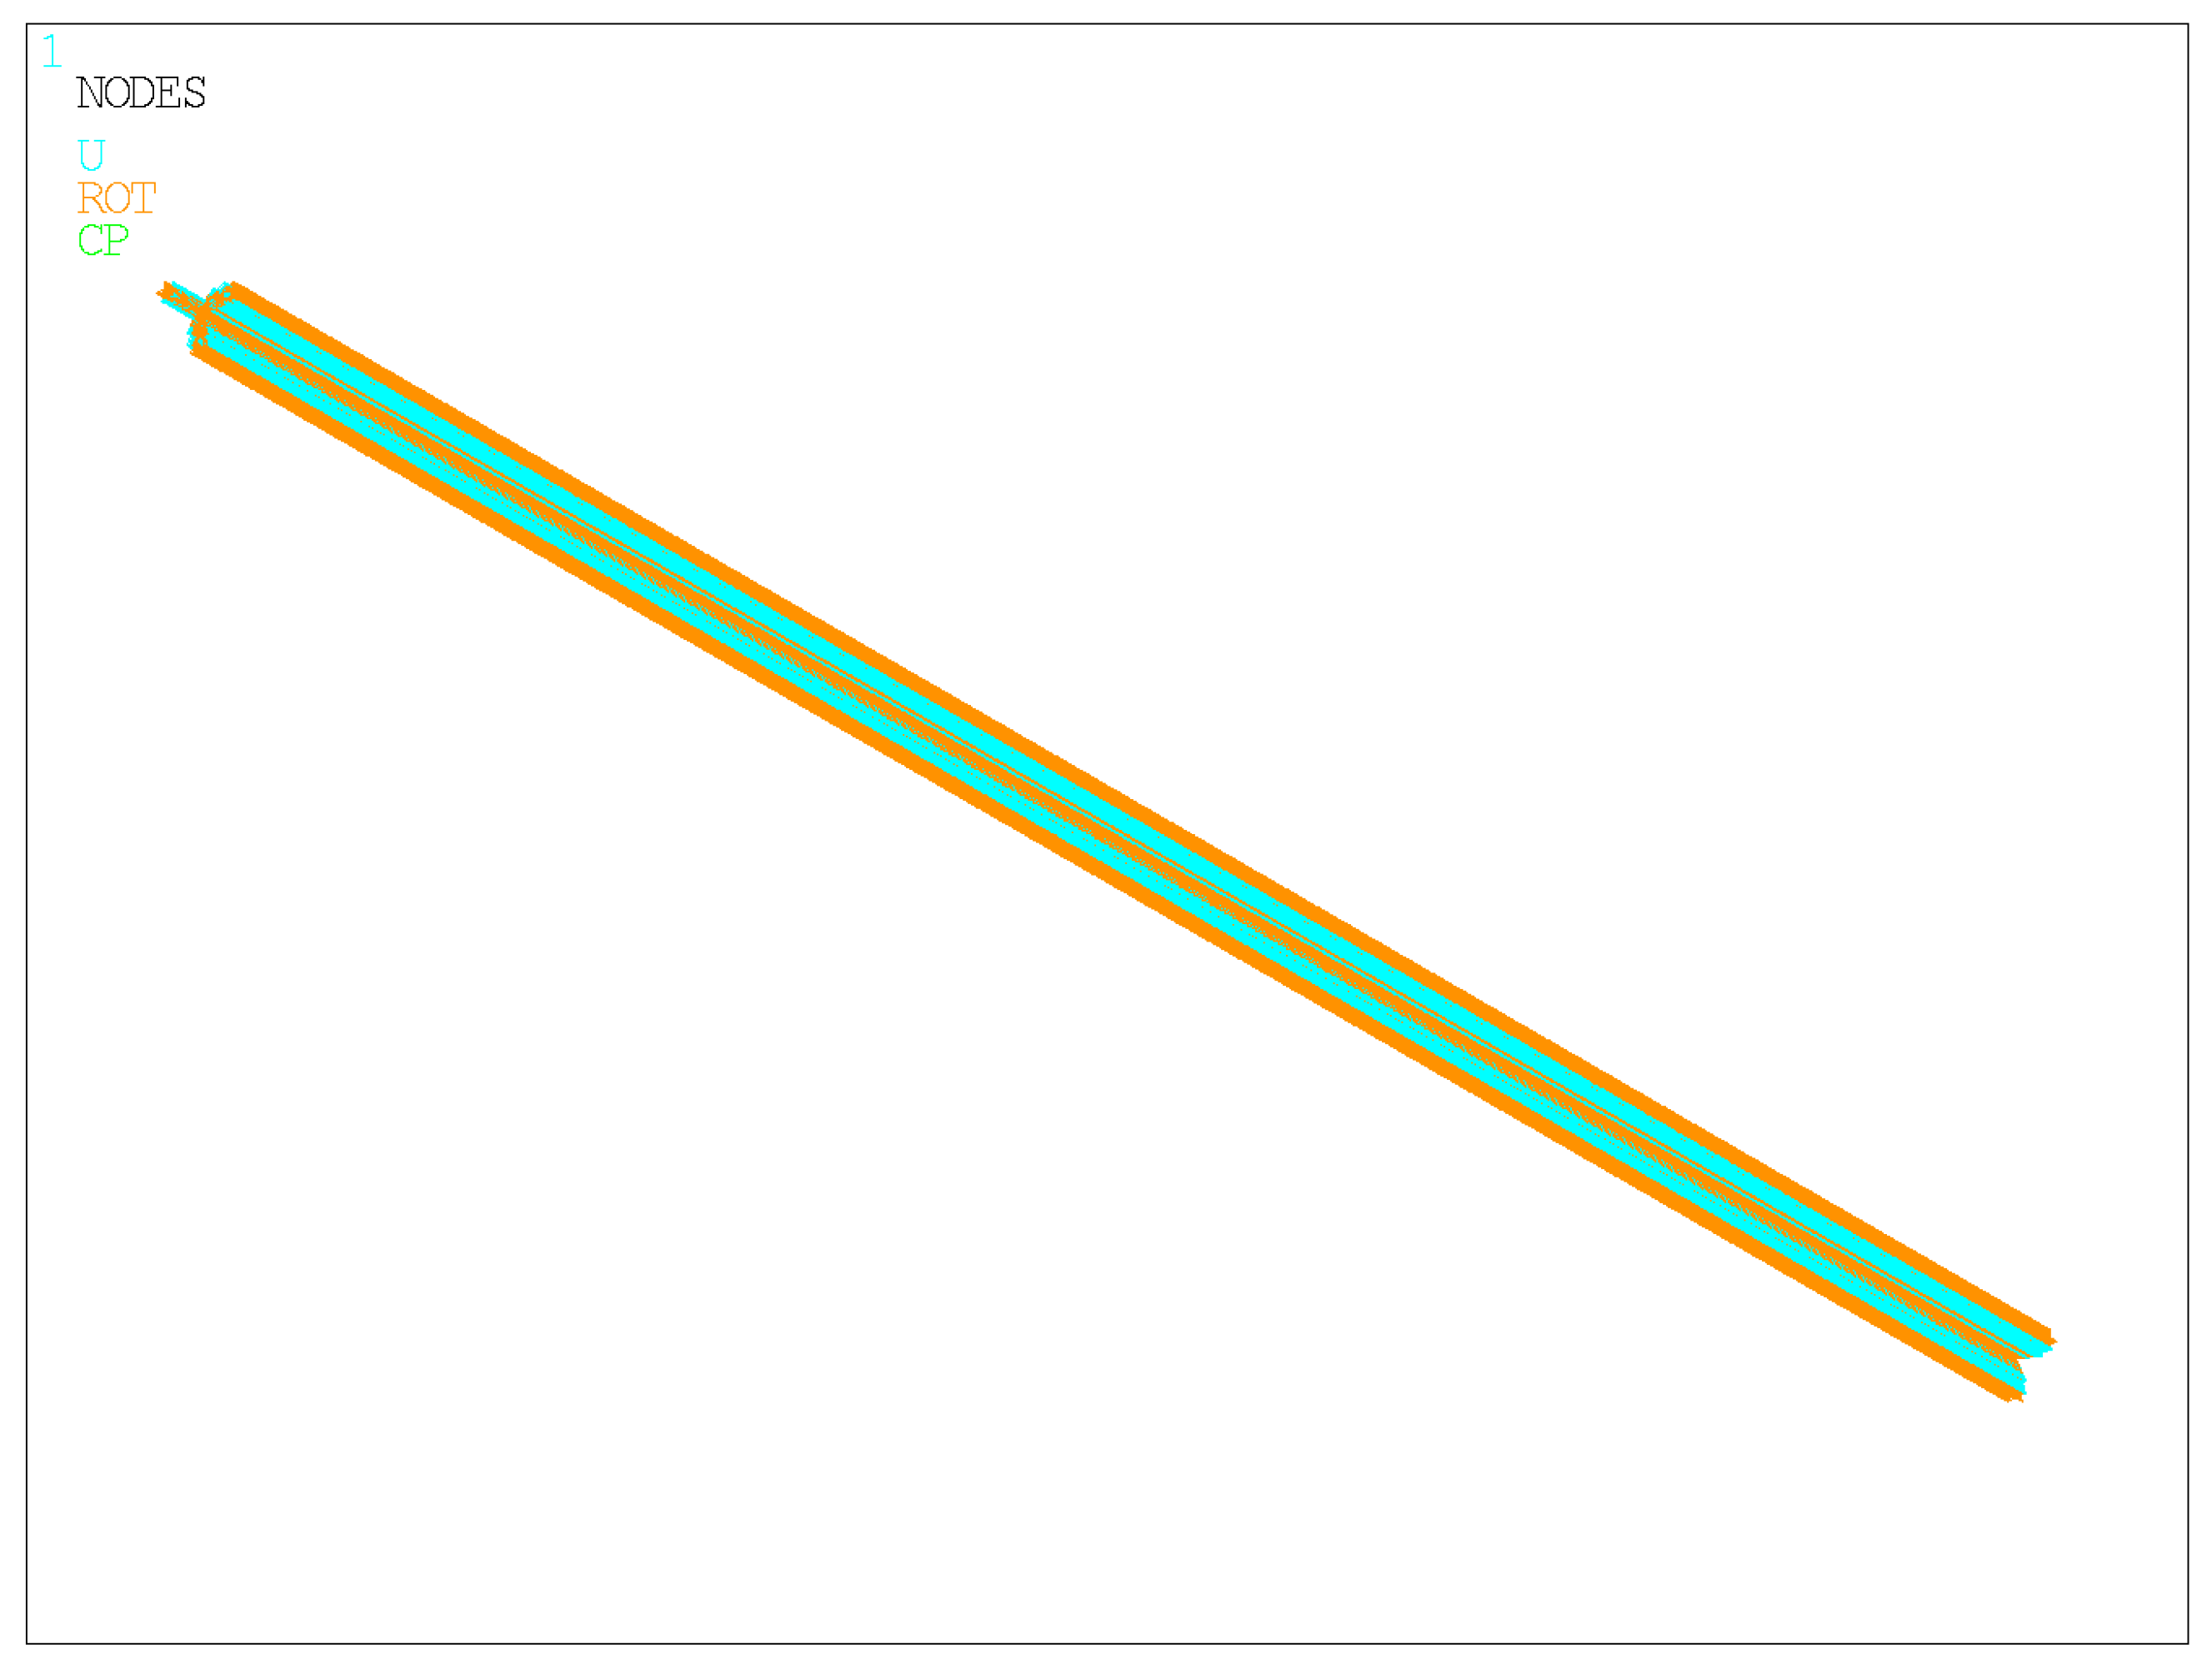
Figure 8.
Constraints and coupling model of PIP.
Figure 8.
Constraints and coupling model of PIP.
Figure 9.
Comparison of experimental and numerical results.
Figure 9.
Comparison of experimental and numerical results.
Figure 10.
Equivalent stress of outer pipe with Extreme Condition 1. (Note: “DMX=.04408” means “Displacement Max = 0.04408 mm”; “SMN=.769E+07”means “Stress Min = 0.769 × 10⁷ Pa”; ”SMX=.366E+08”means “Stress Max = 0.366 × 10⁸ Pa and the same notation applies throughout.)
Figure 10.
Equivalent stress of outer pipe with Extreme Condition 1. (Note: “DMX=.04408” means “Displacement Max = 0.04408 mm”; “SMN=.769E+07”means “Stress Min = 0.769 × 10⁷ Pa”; ”SMX=.366E+08”means “Stress Max = 0.366 × 10⁸ Pa and the same notation applies throughout.)
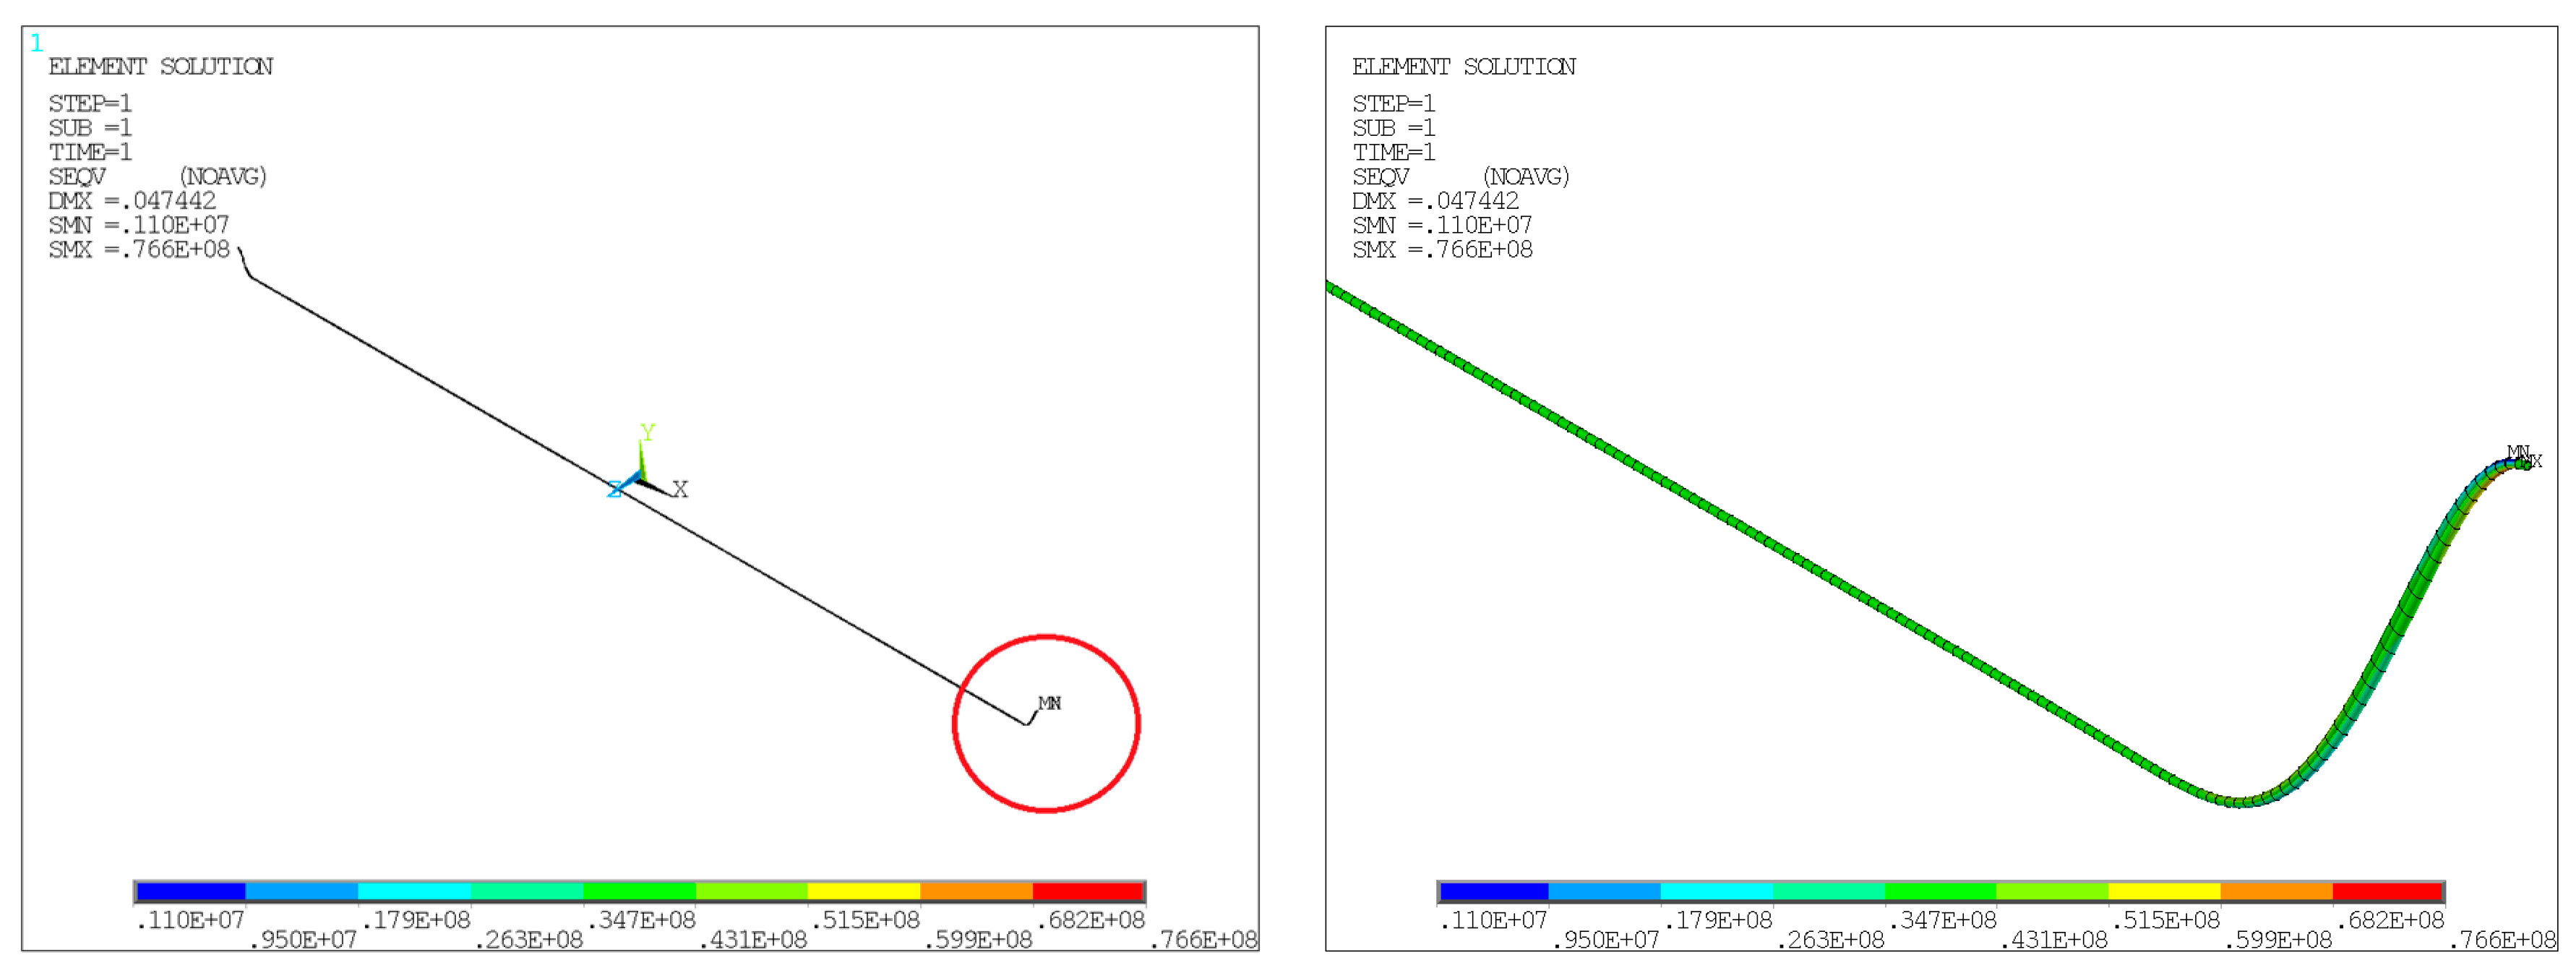
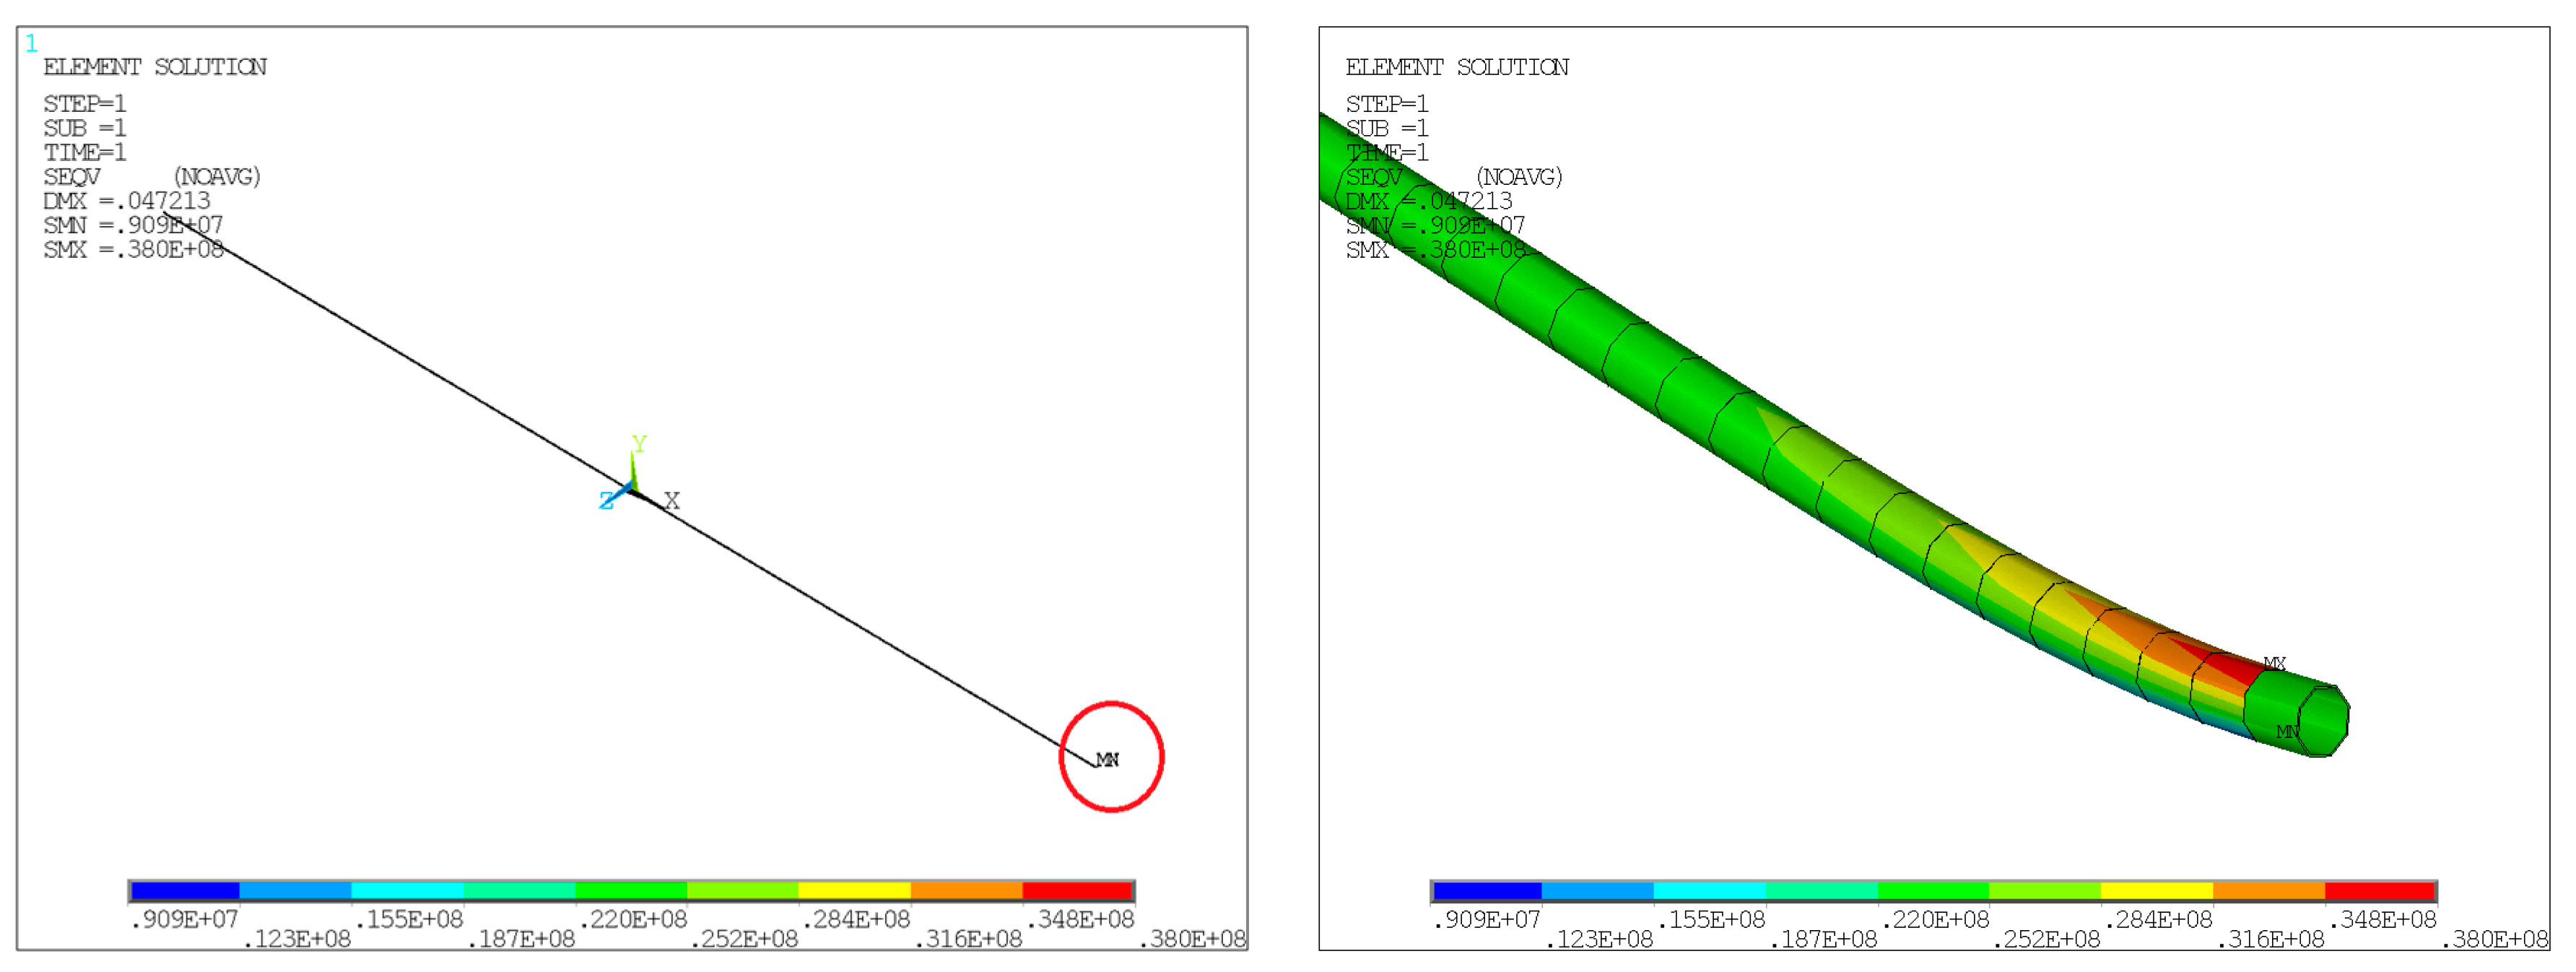
Figure 11.
Equivalent stress of inner pipe with Extreme Condition 1.
Figure 11.
Equivalent stress of inner pipe with Extreme Condition 1.
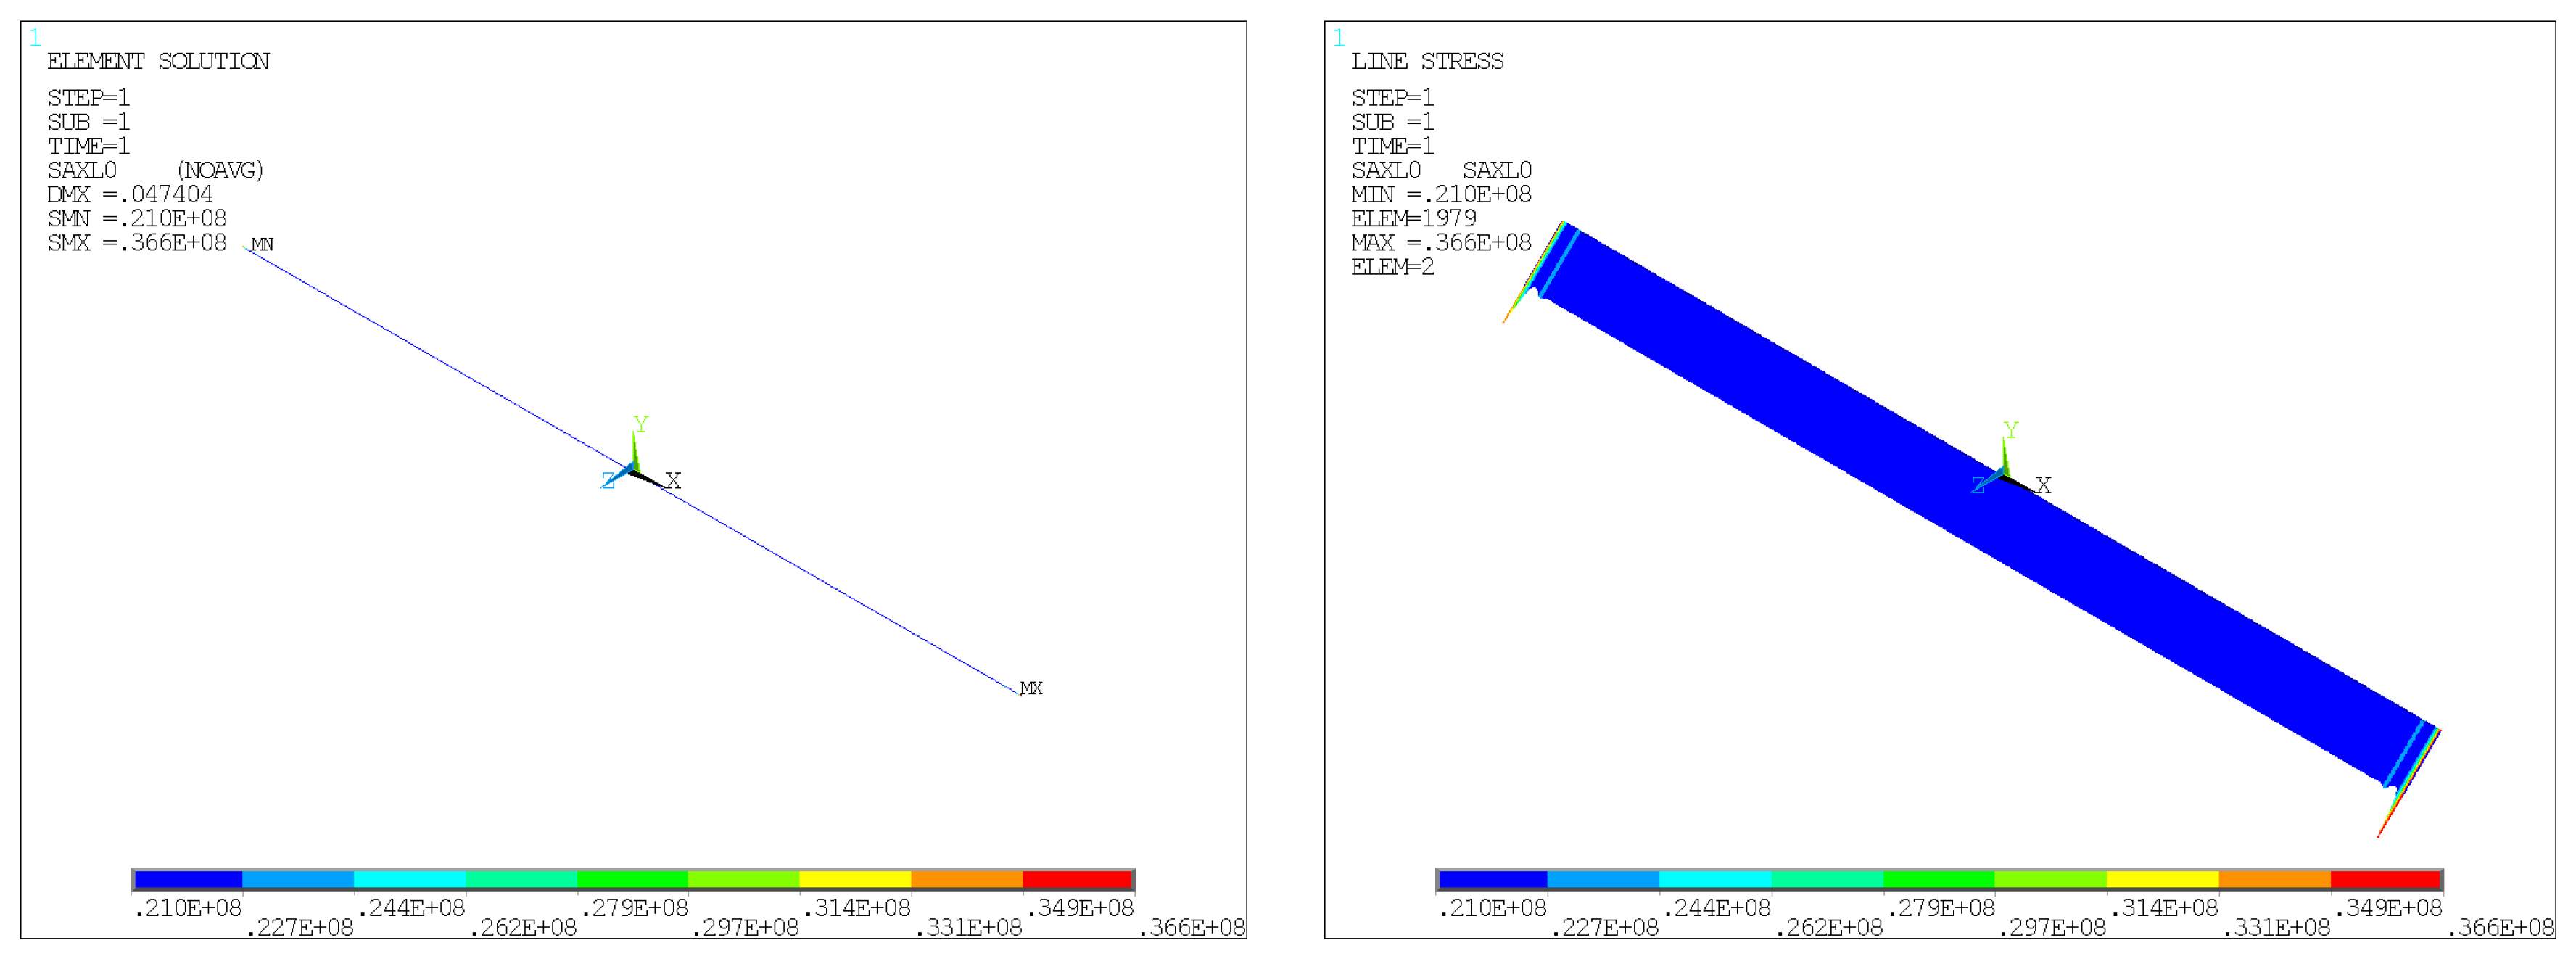
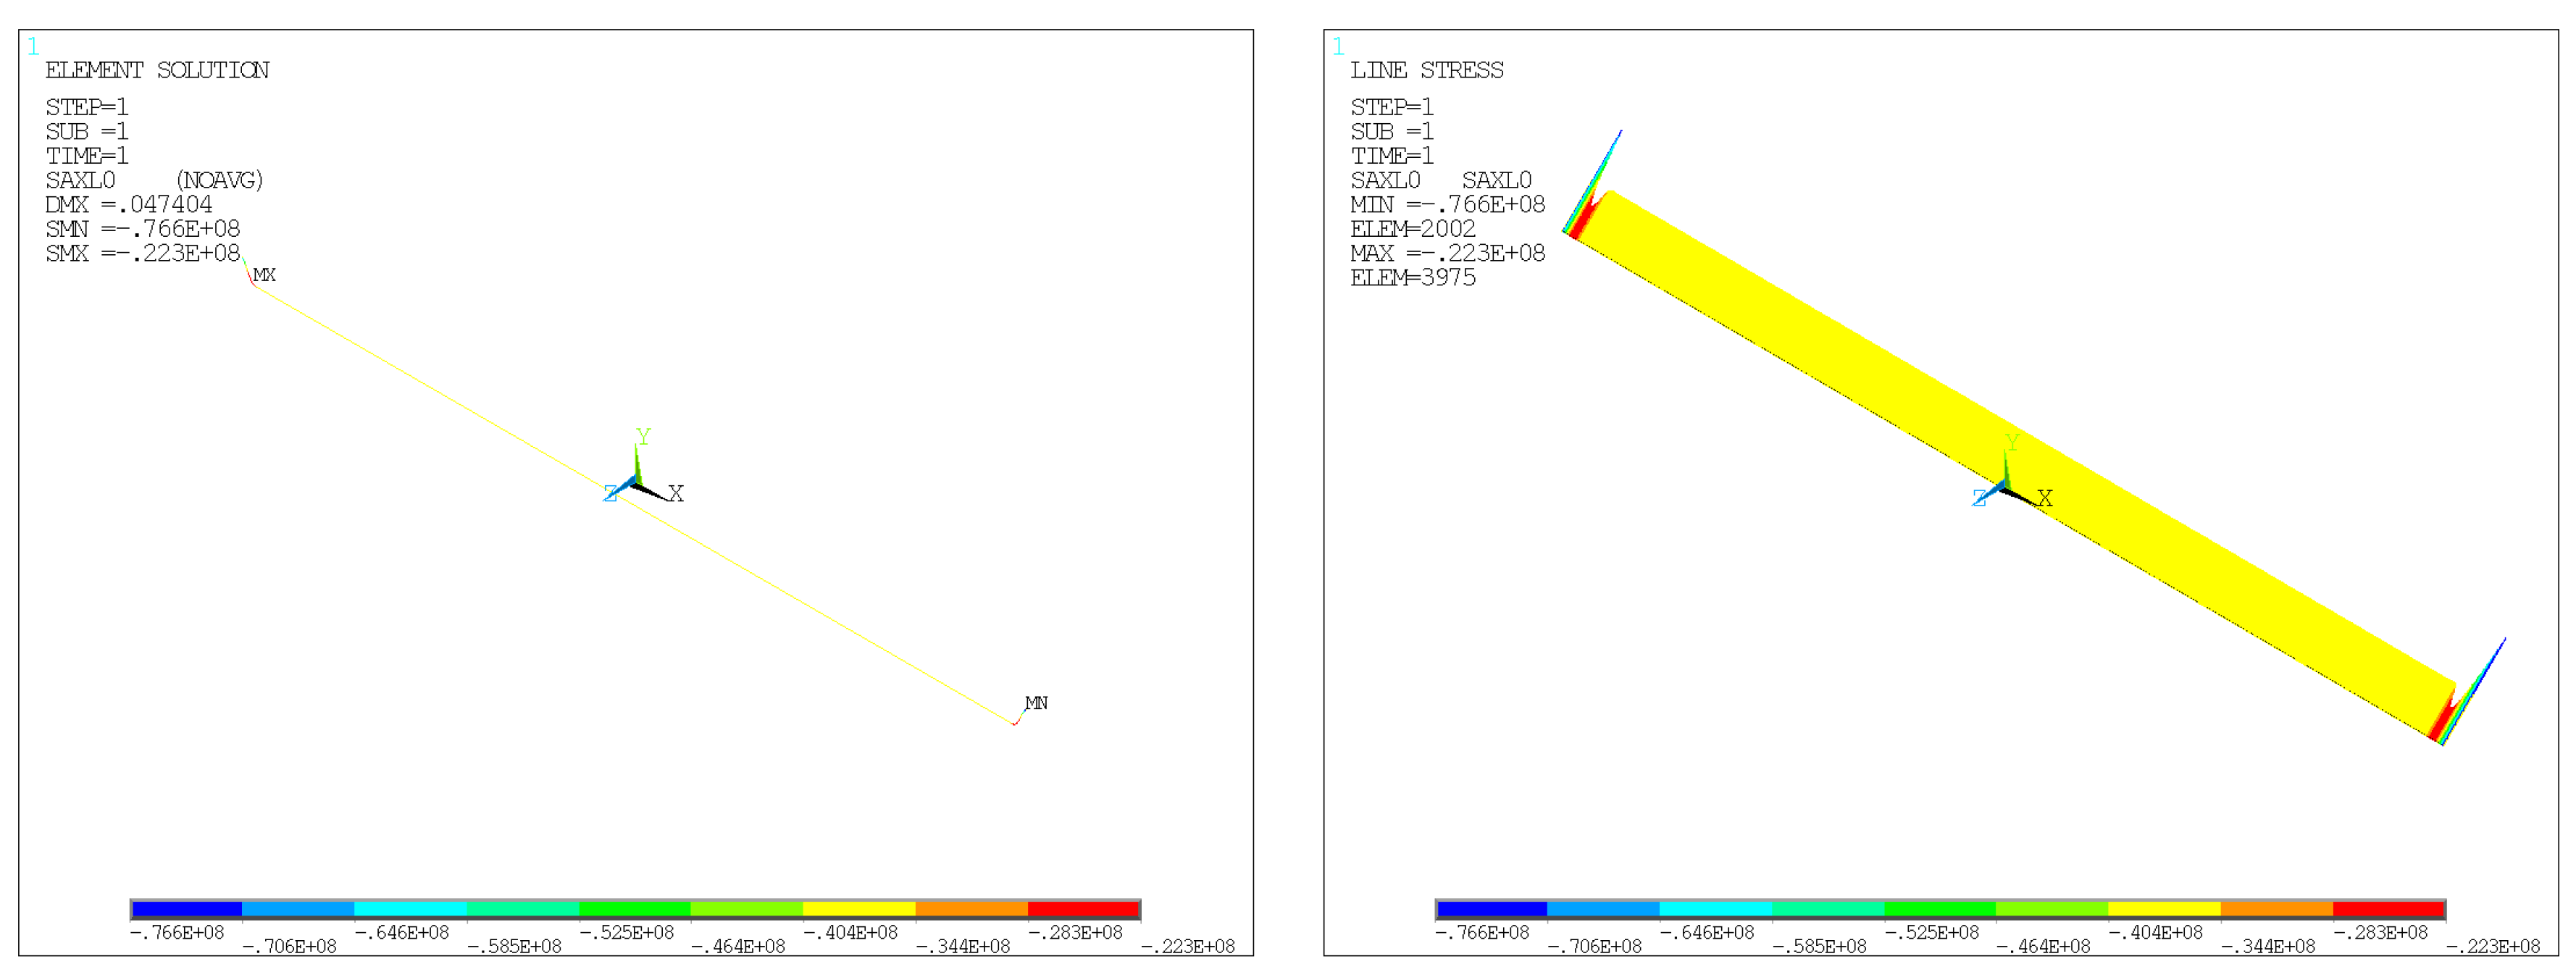
Figure 12.
Axial stress at 0° orientation with Extreme Condition 1.
Figure 12.
Axial stress at 0° orientation with Extreme Condition 1.
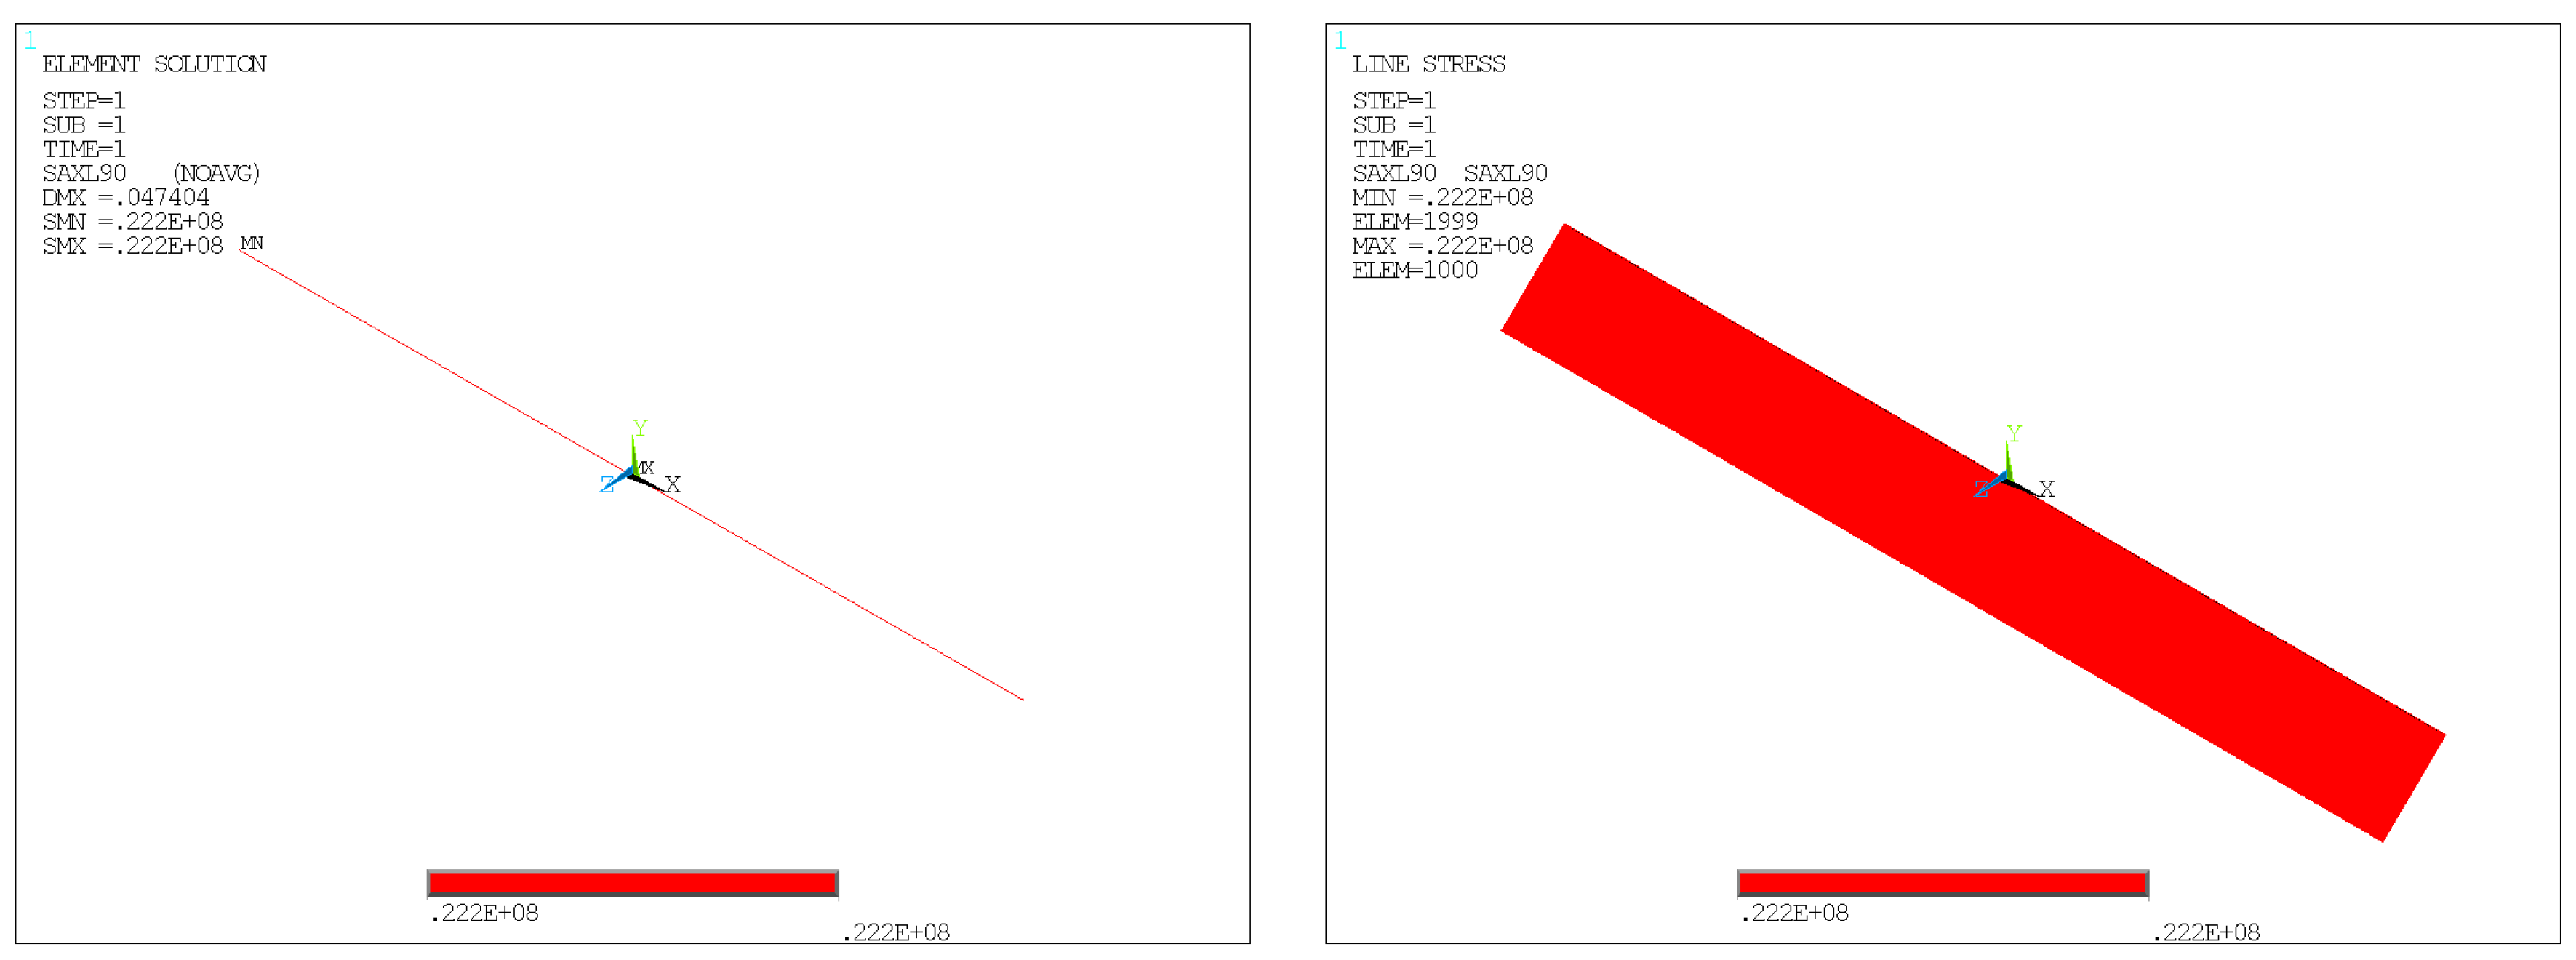
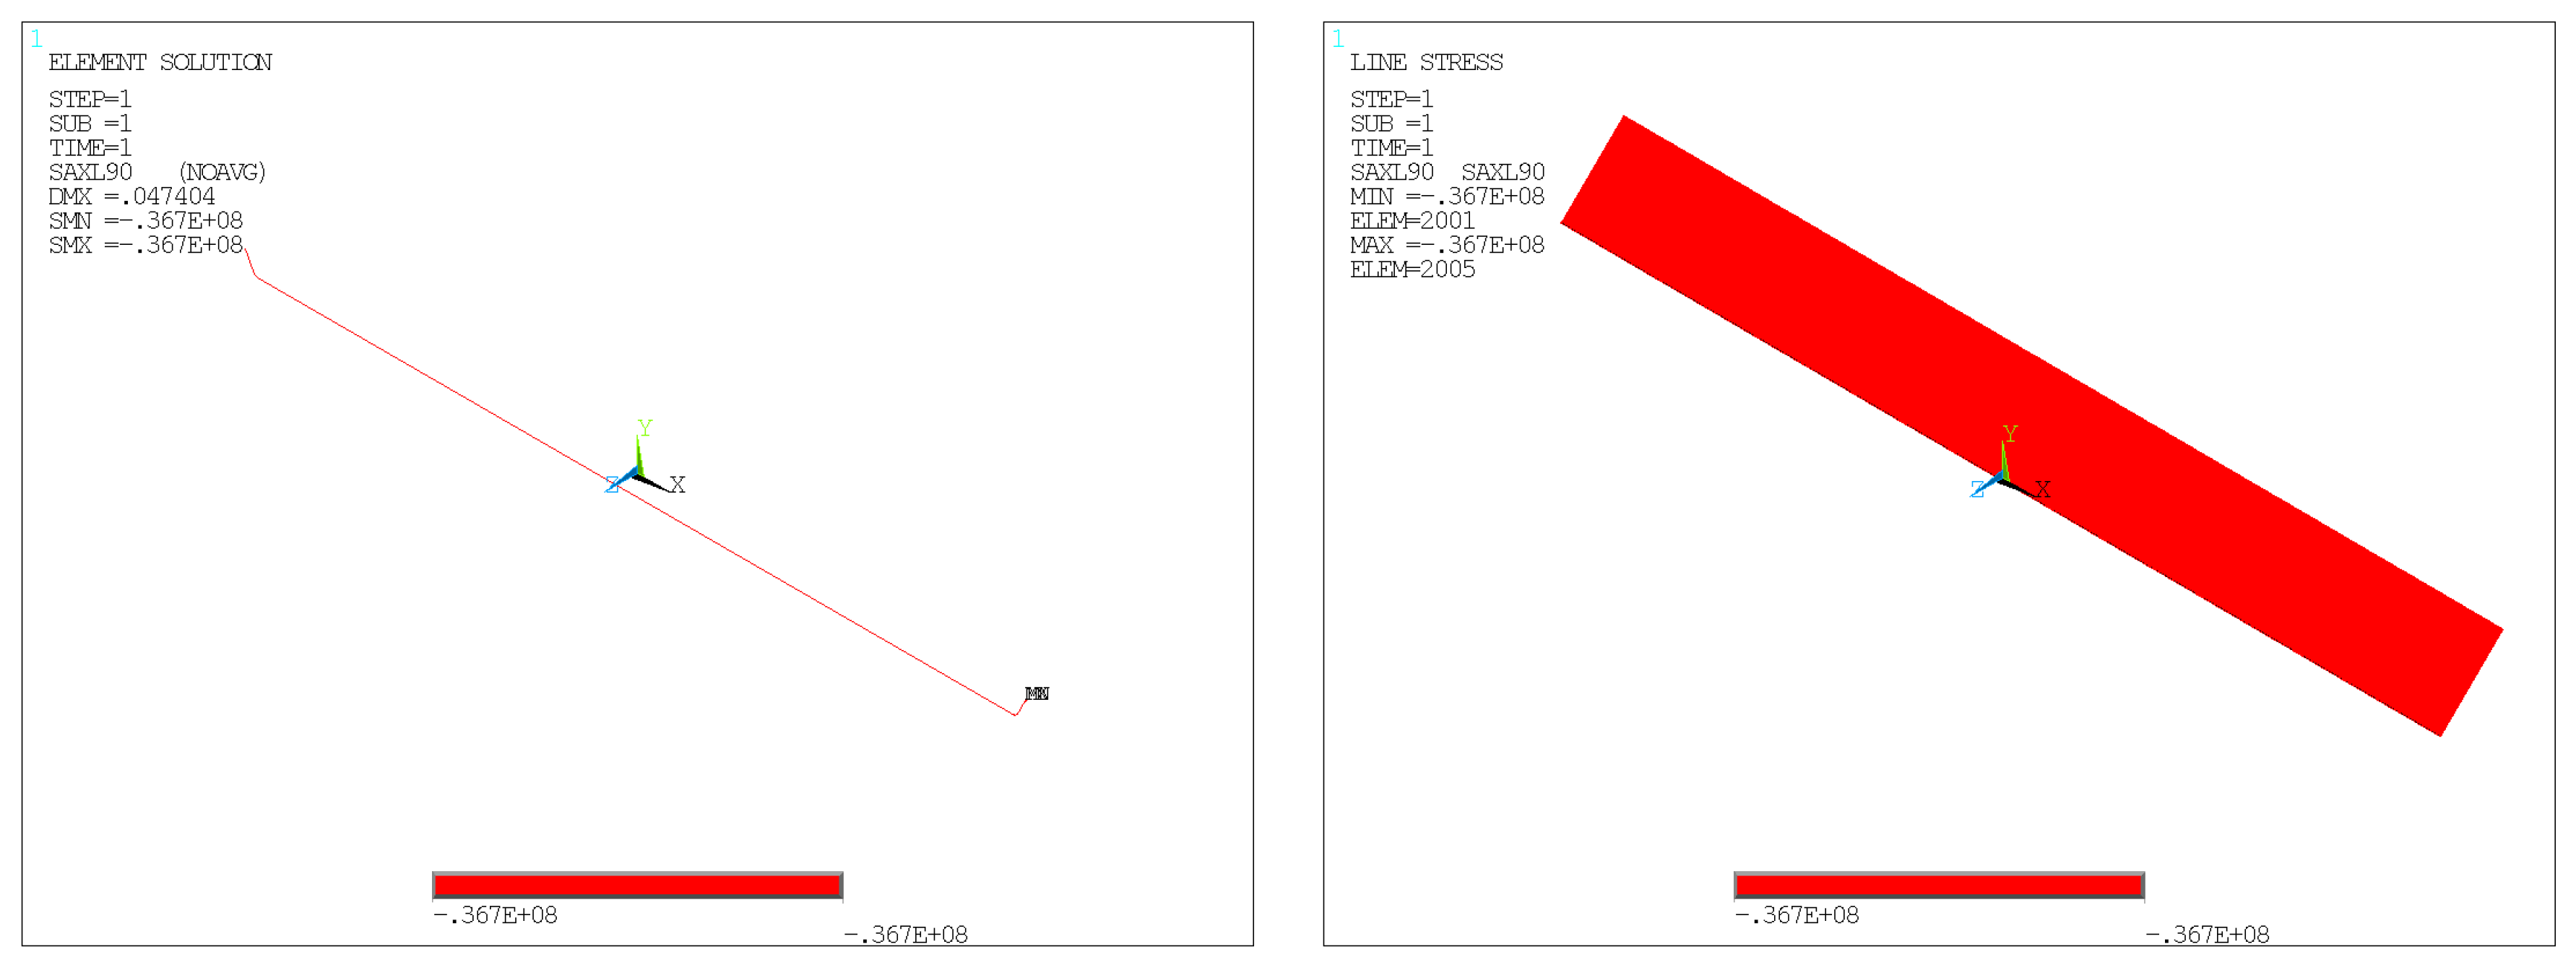
Figure 13.
Axial stress at 90° orientation with Extreme Condition 1.
Figure 13.
Axial stress at 90° orientation with Extreme Condition 1.
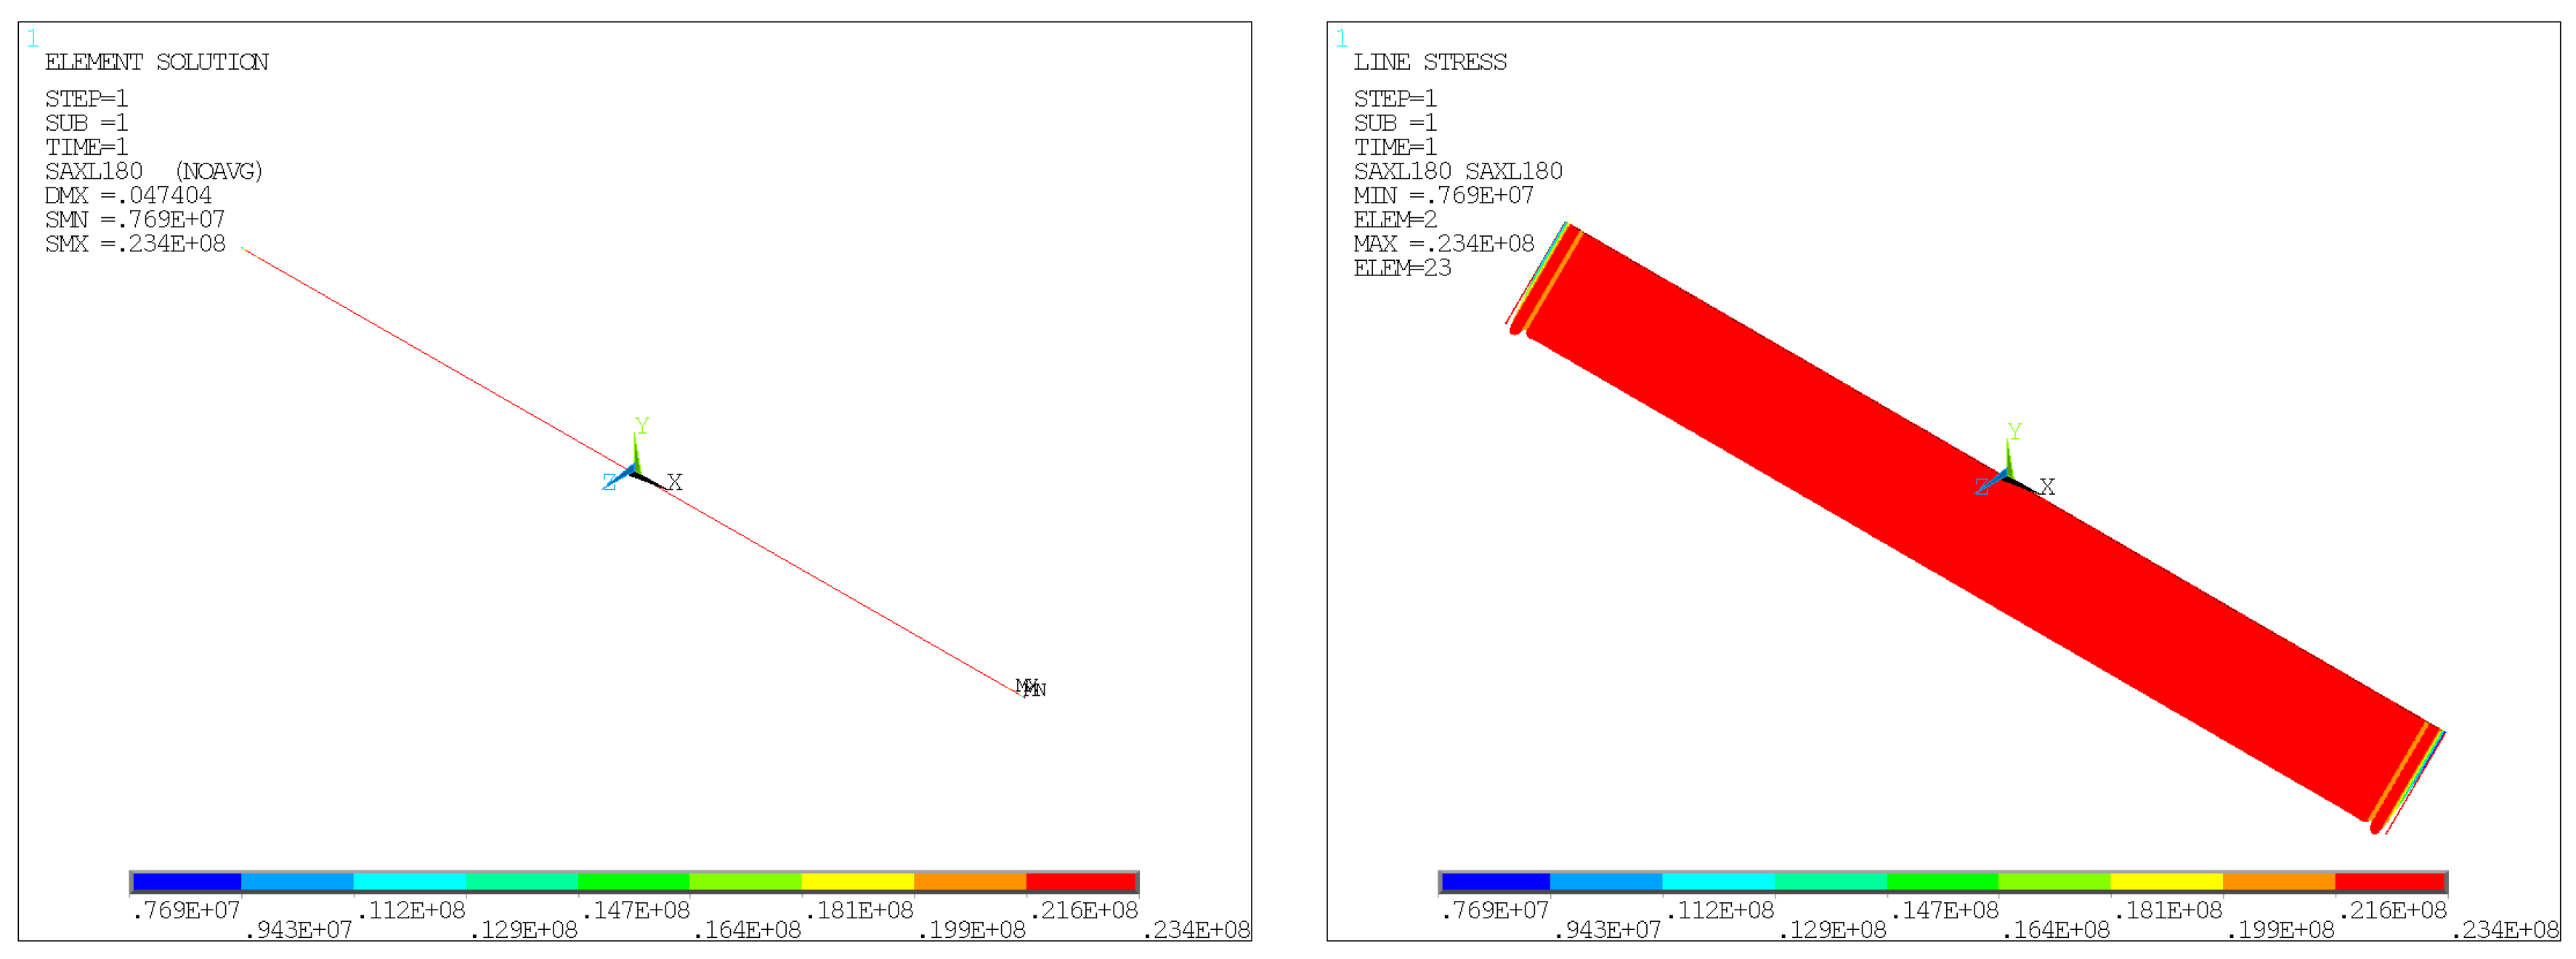
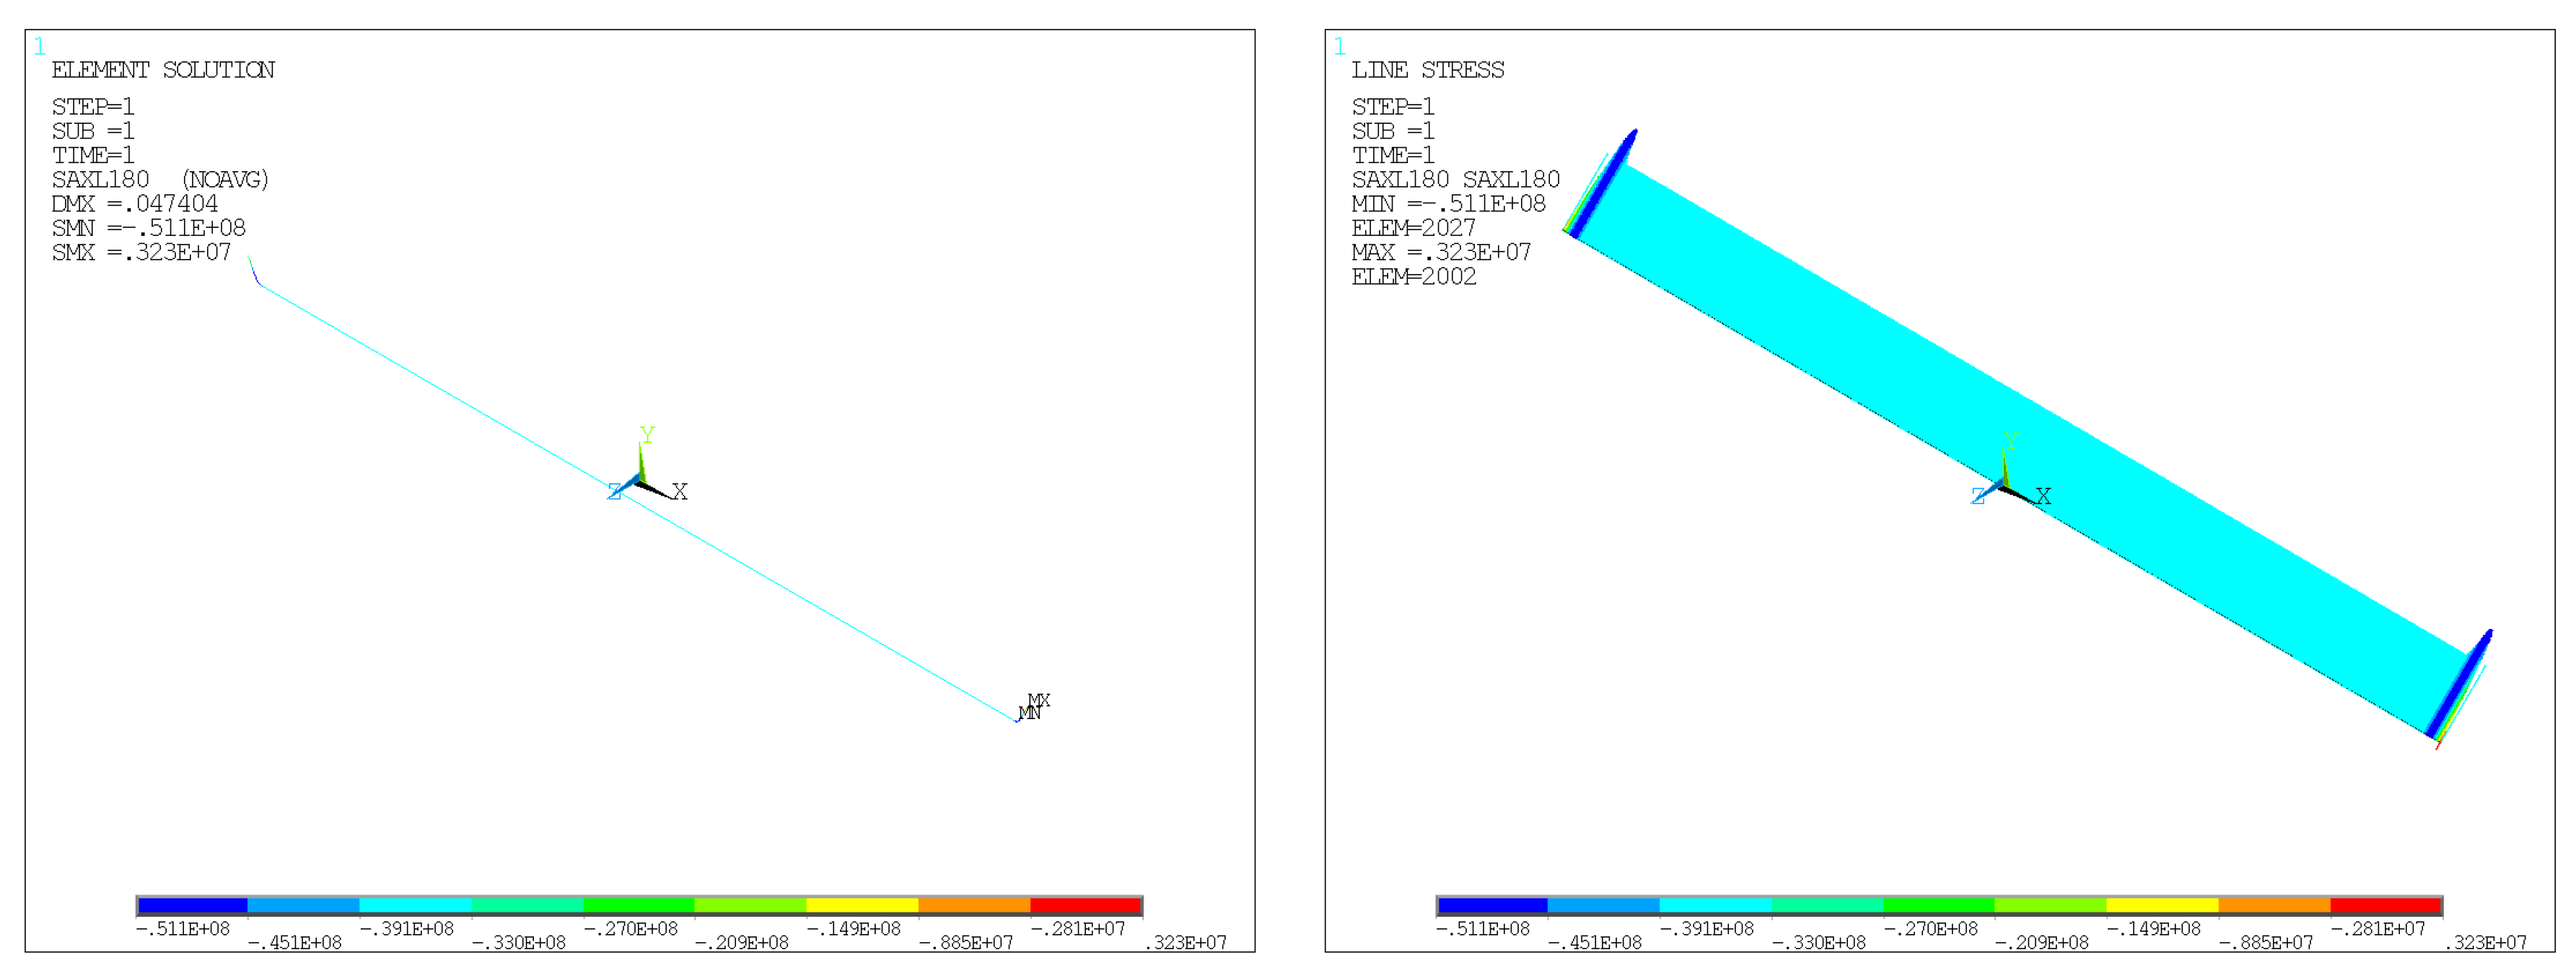
Figure 14.
Axial stress at 180° orientation with Extreme Condition 1.
Figure 14.
Axial stress at 180° orientation with Extreme Condition 1.
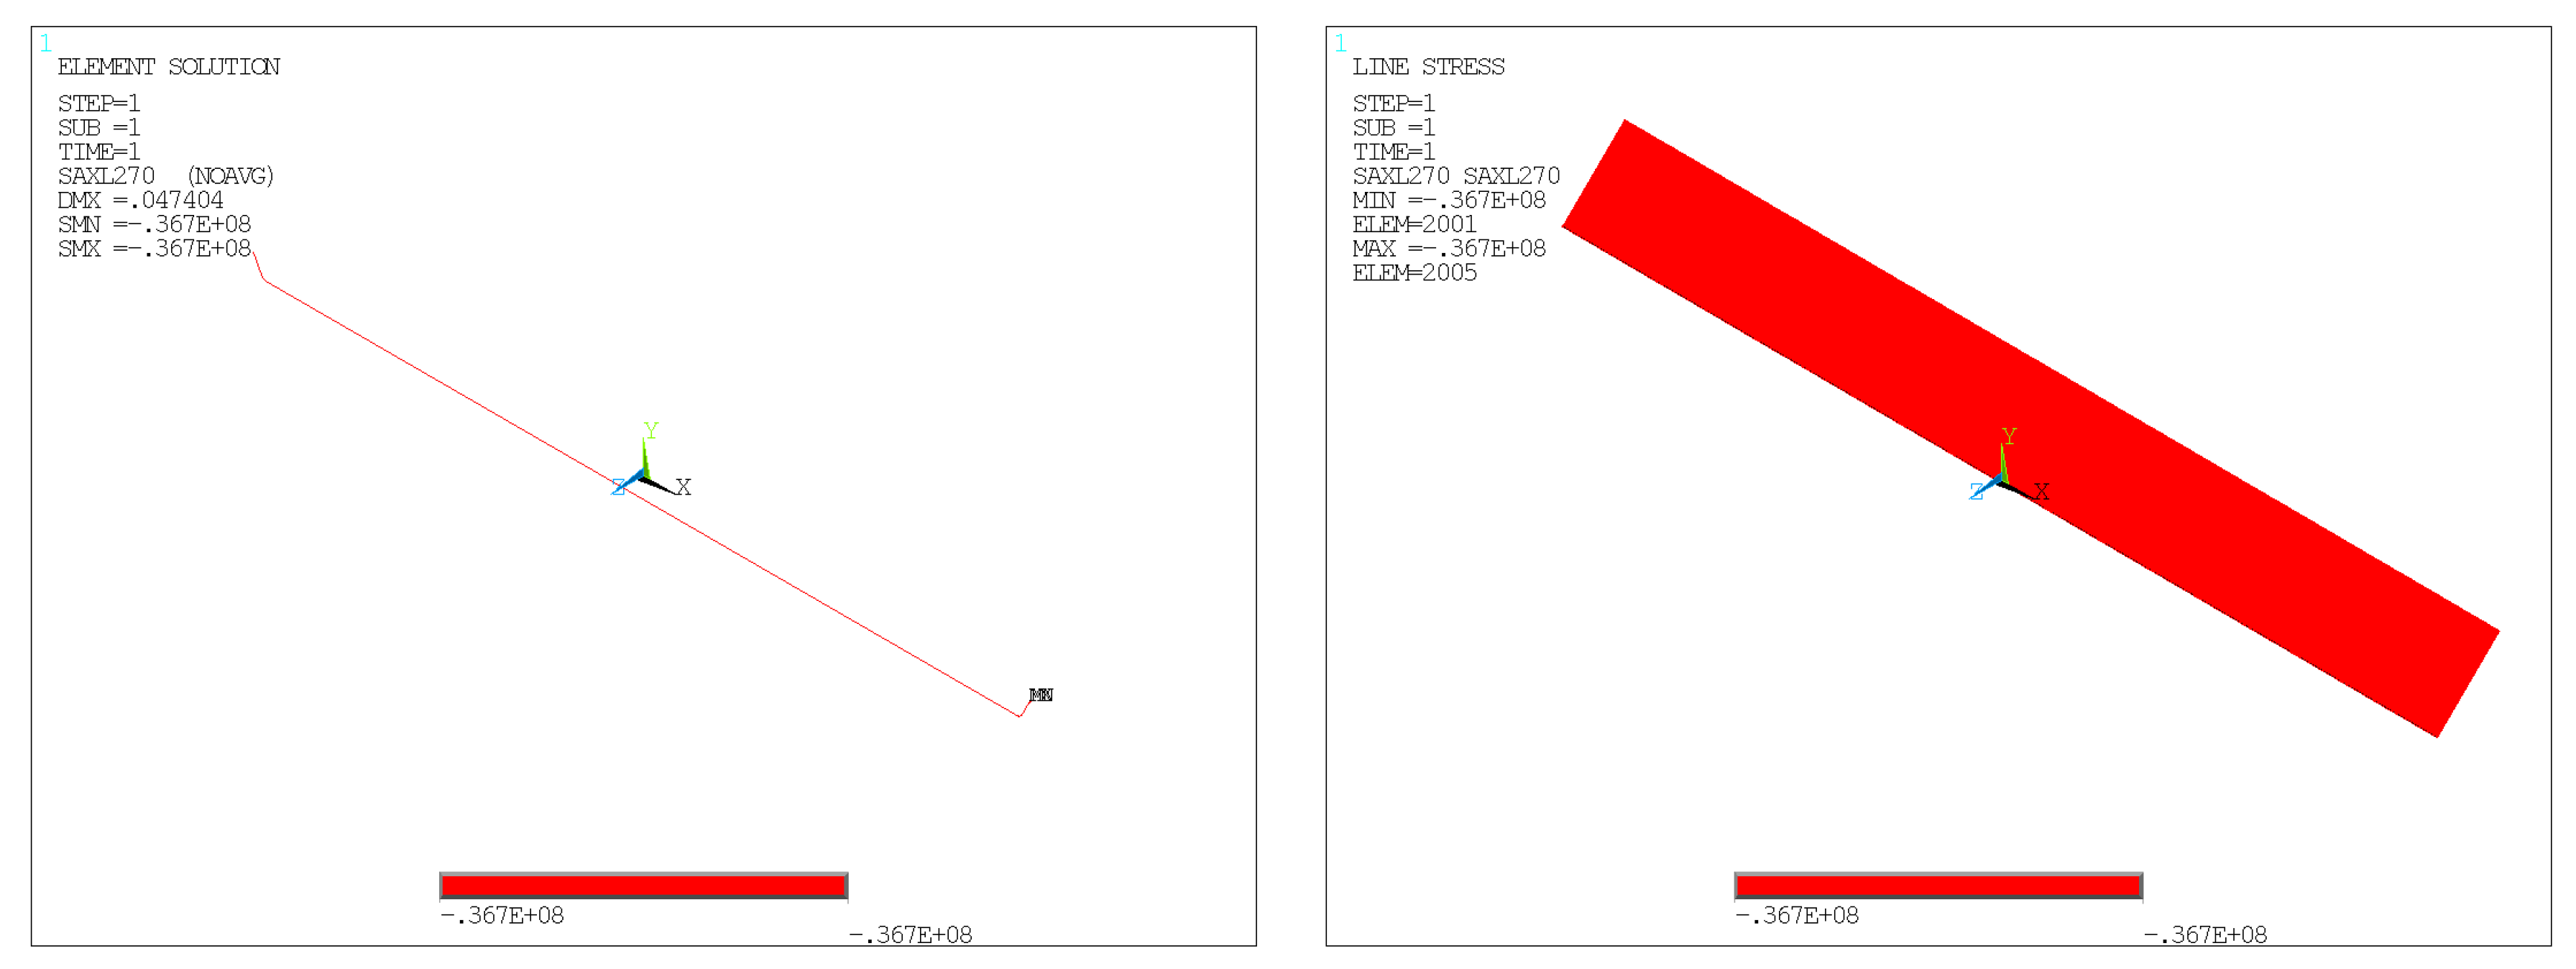
Figure 15.
Axial stress at 270° orientation with Extreme Condition 1.
Figure 15.
Axial stress at 270° orientation with Extreme Condition 1.
Figure 16.
Bending moment of Extreme Condition 1.
Figure 16.
Bending moment of Extreme Condition 1.
Figure 17.
Axial stress at 0° for Extreme Condition 1.
Figure 17.
Axial stress at 0° for Extreme Condition 1.
Figure 18.
Axial stress at 90° for Extreme Condition 1.
Figure 18.
Axial stress at 90° for Extreme Condition 1.
Figure 19.
Axial stress at 180° for Extreme Condition 1.
Figure 19.
Axial stress at 180° for Extreme Condition 1.
Figure 20.
Axial stress at 270° for Extreme Condition 1.
Figure 20.
Axial stress at 270° for Extreme Condition 1.
Figure 21.
Bending moment distribution at the ends of the inner pipe with Extreme Condition 1.
Figure 21.
Bending moment distribution at the ends of the inner pipe with Extreme Condition 1.
Figure 22.
Equivalent stress in the outer pipe with Extreme Condition 2.
Figure 22.
Equivalent stress in the outer pipe with Extreme Condition 2.
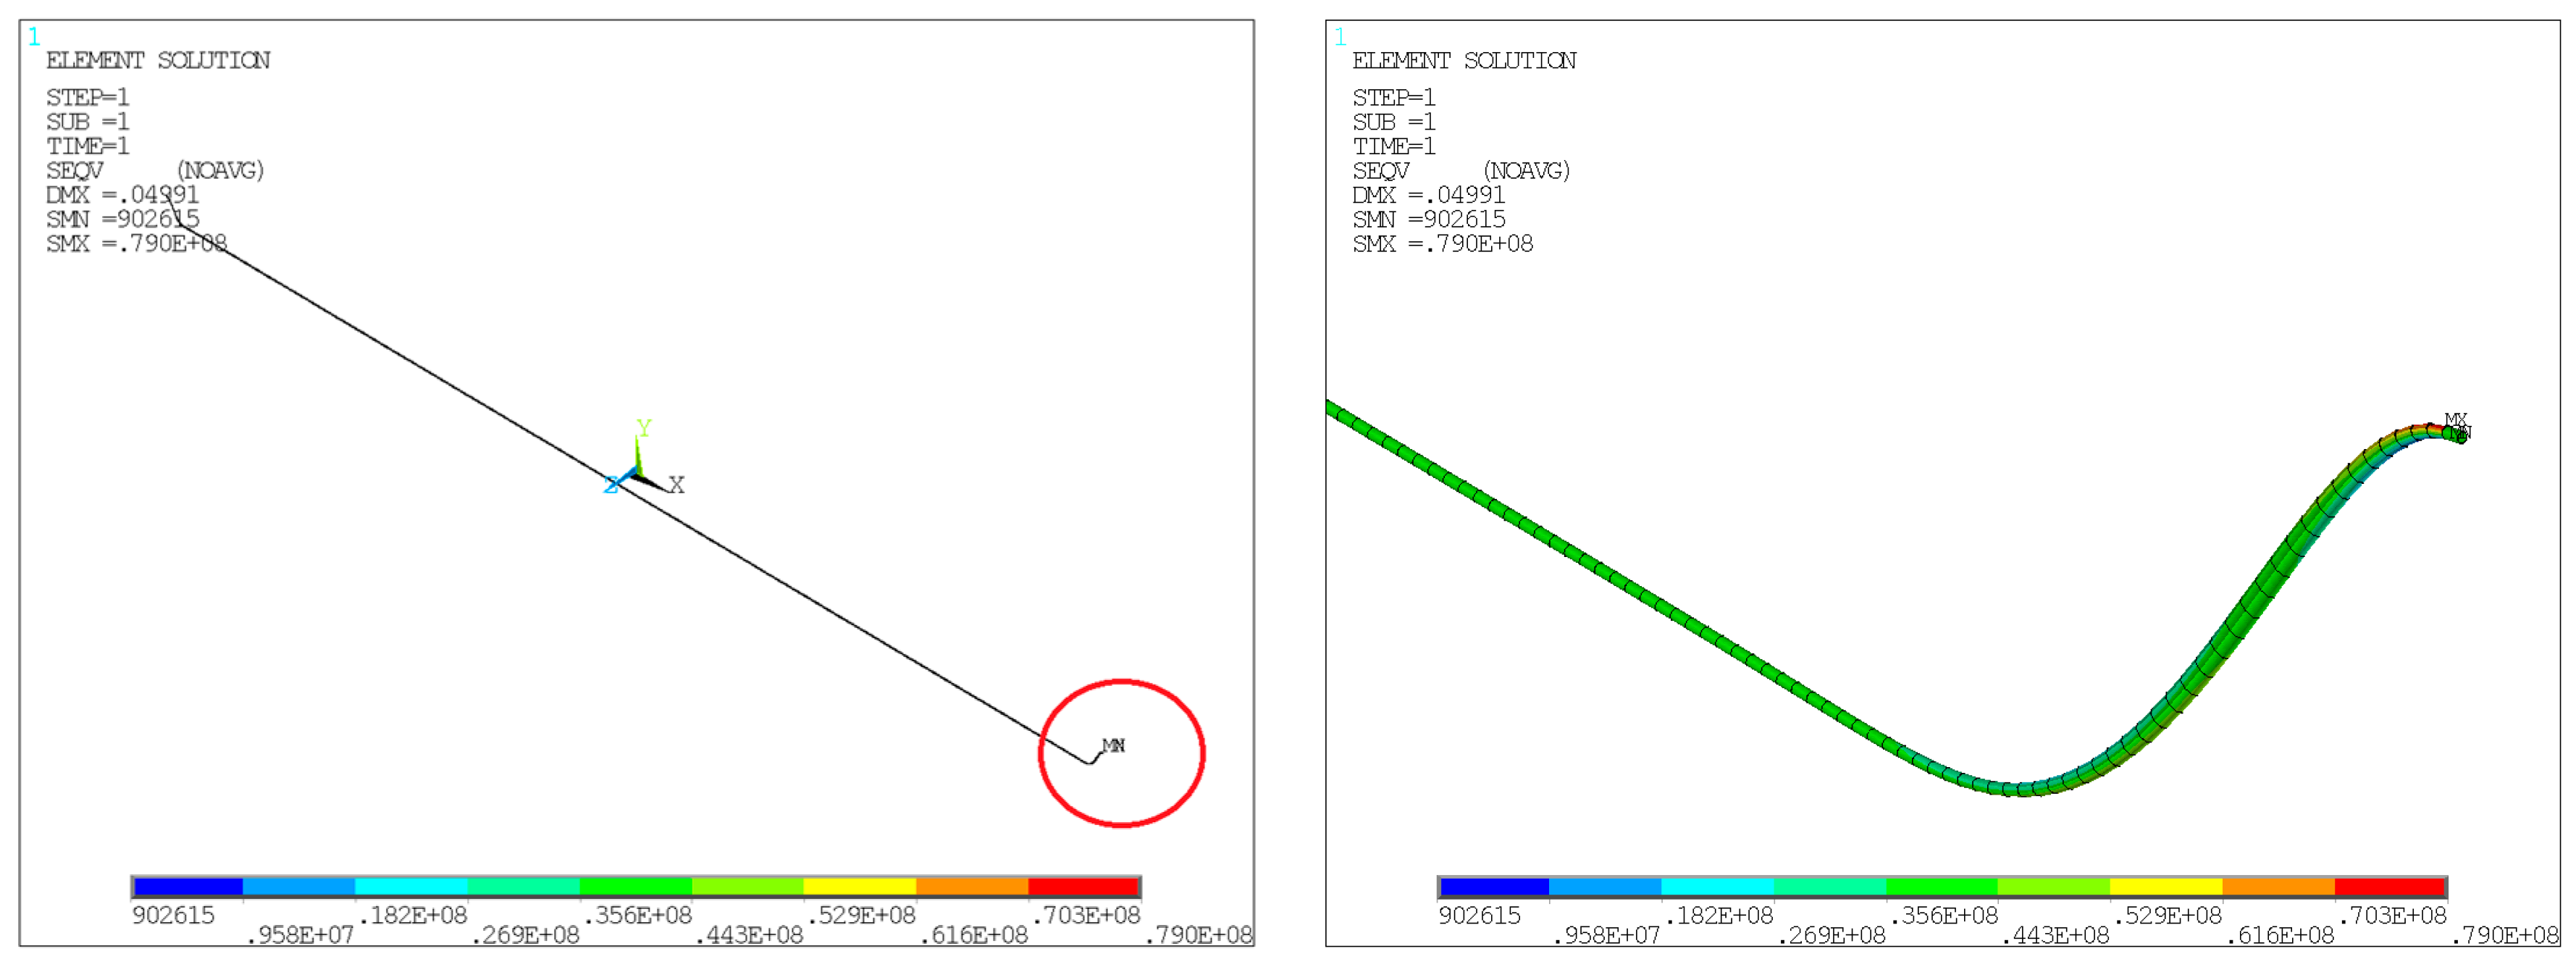
Figure 23.
Equivalent stress distribution in the inner pipe with Extreme Condition 2.
Figure 23.
Equivalent stress distribution in the inner pipe with Extreme Condition 2.
Figure 24.
Axial stress at 0° in the outer pipe with Extreme Condition 2.
Figure 24.
Axial stress at 0° in the outer pipe with Extreme Condition 2.
Figure 25.
Axial stress at 90° in the outer pipe with Extreme Condition 2.
Figure 25.
Axial stress at 90° in the outer pipe with Extreme Condition 2.
Figure 26.
Axial stress at 180° in the outer pipe with Extreme Condition 2.
Figure 26.
Axial stress at 180° in the outer pipe with Extreme Condition 2.
Figure 27.
Axial stress at 270° in the outer pipe with Extreme Condition 2.
Figure 27.
Axial stress at 270° in the outer pipe with Extreme Condition 2.
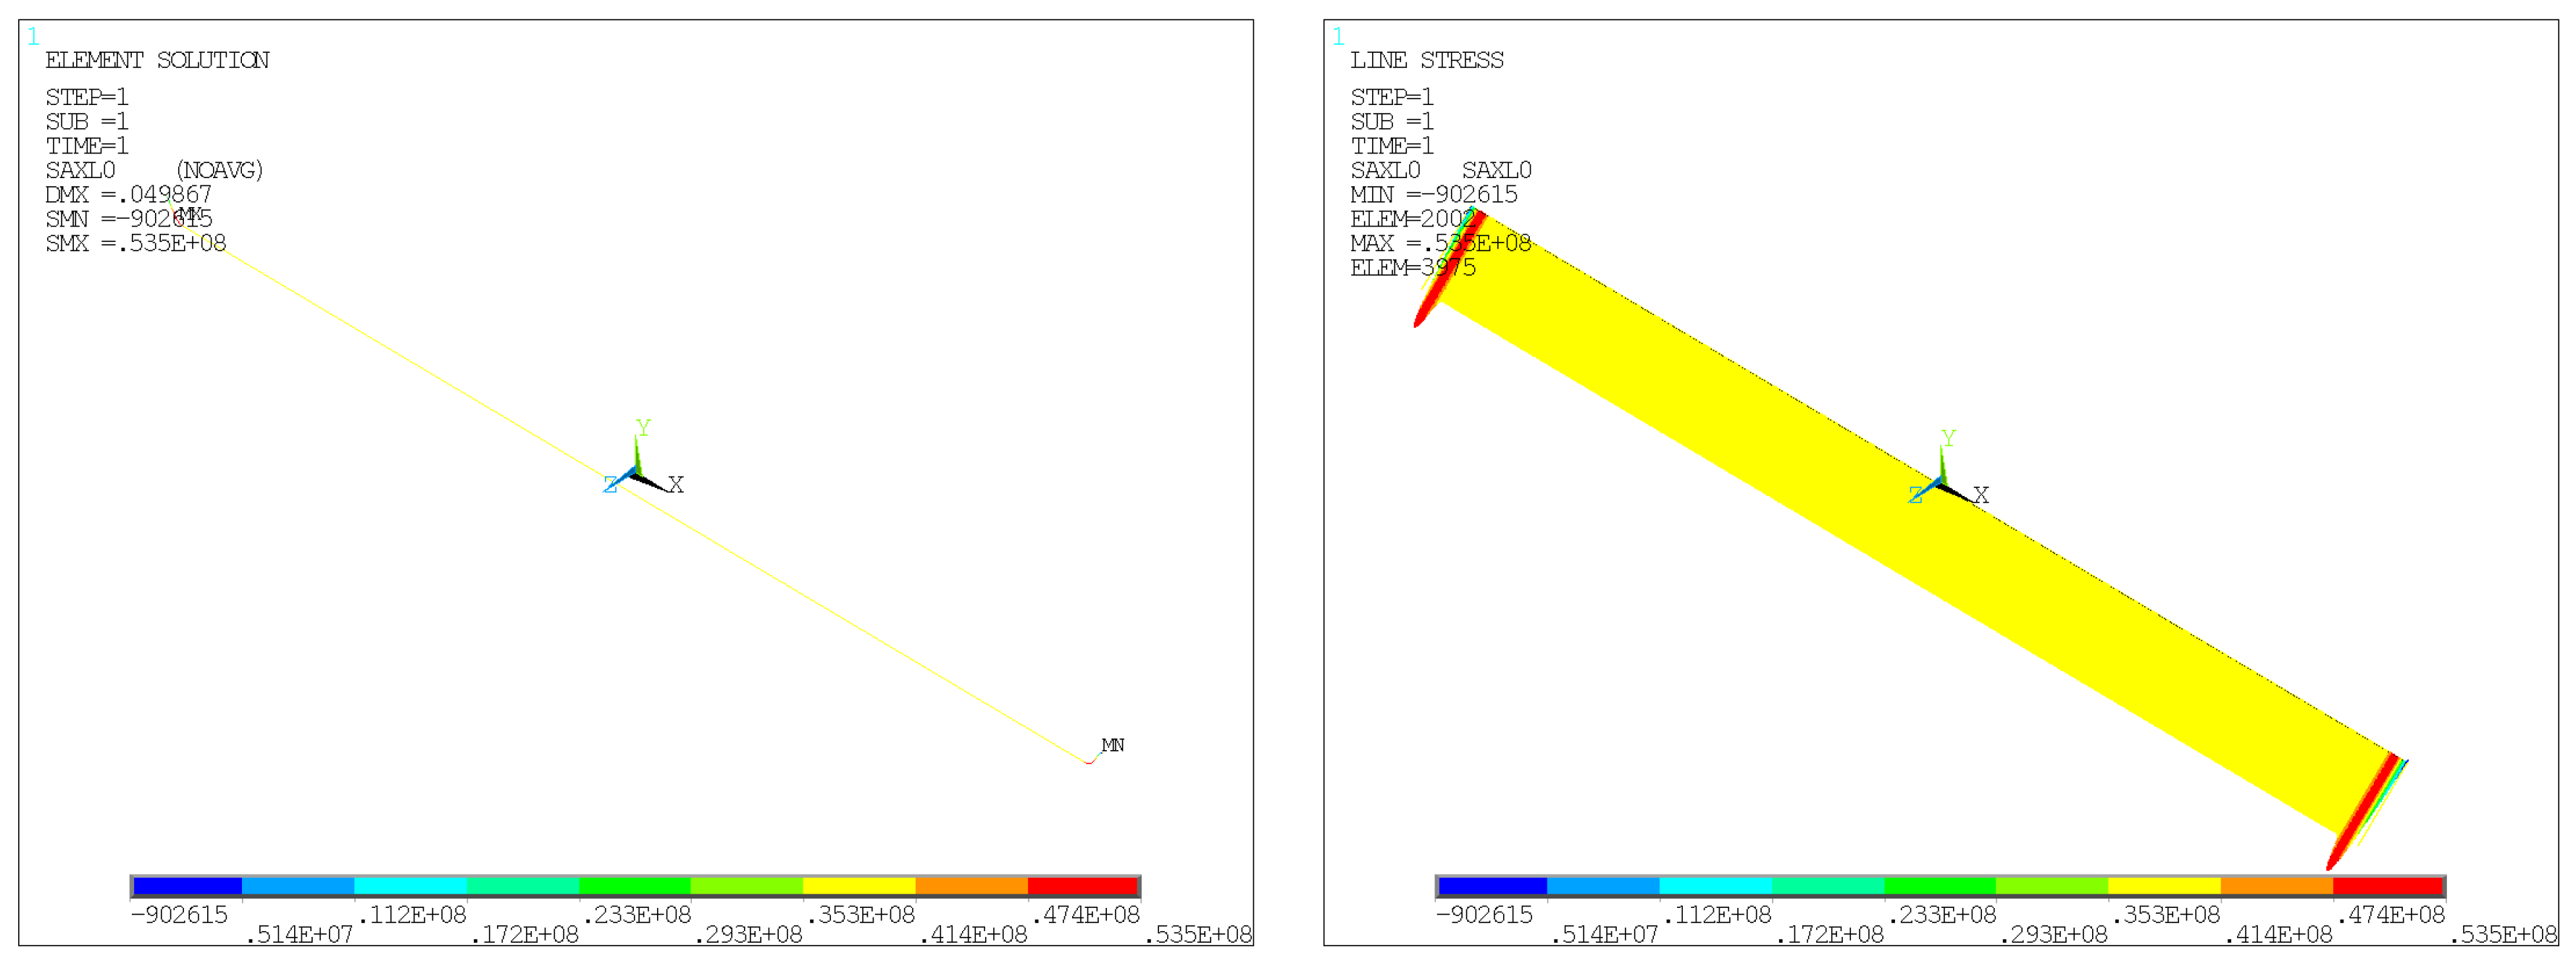
Figure 28.
Axial stress at 0° with Extreme Condition 2.
Figure 28.
Axial stress at 0° with Extreme Condition 2.
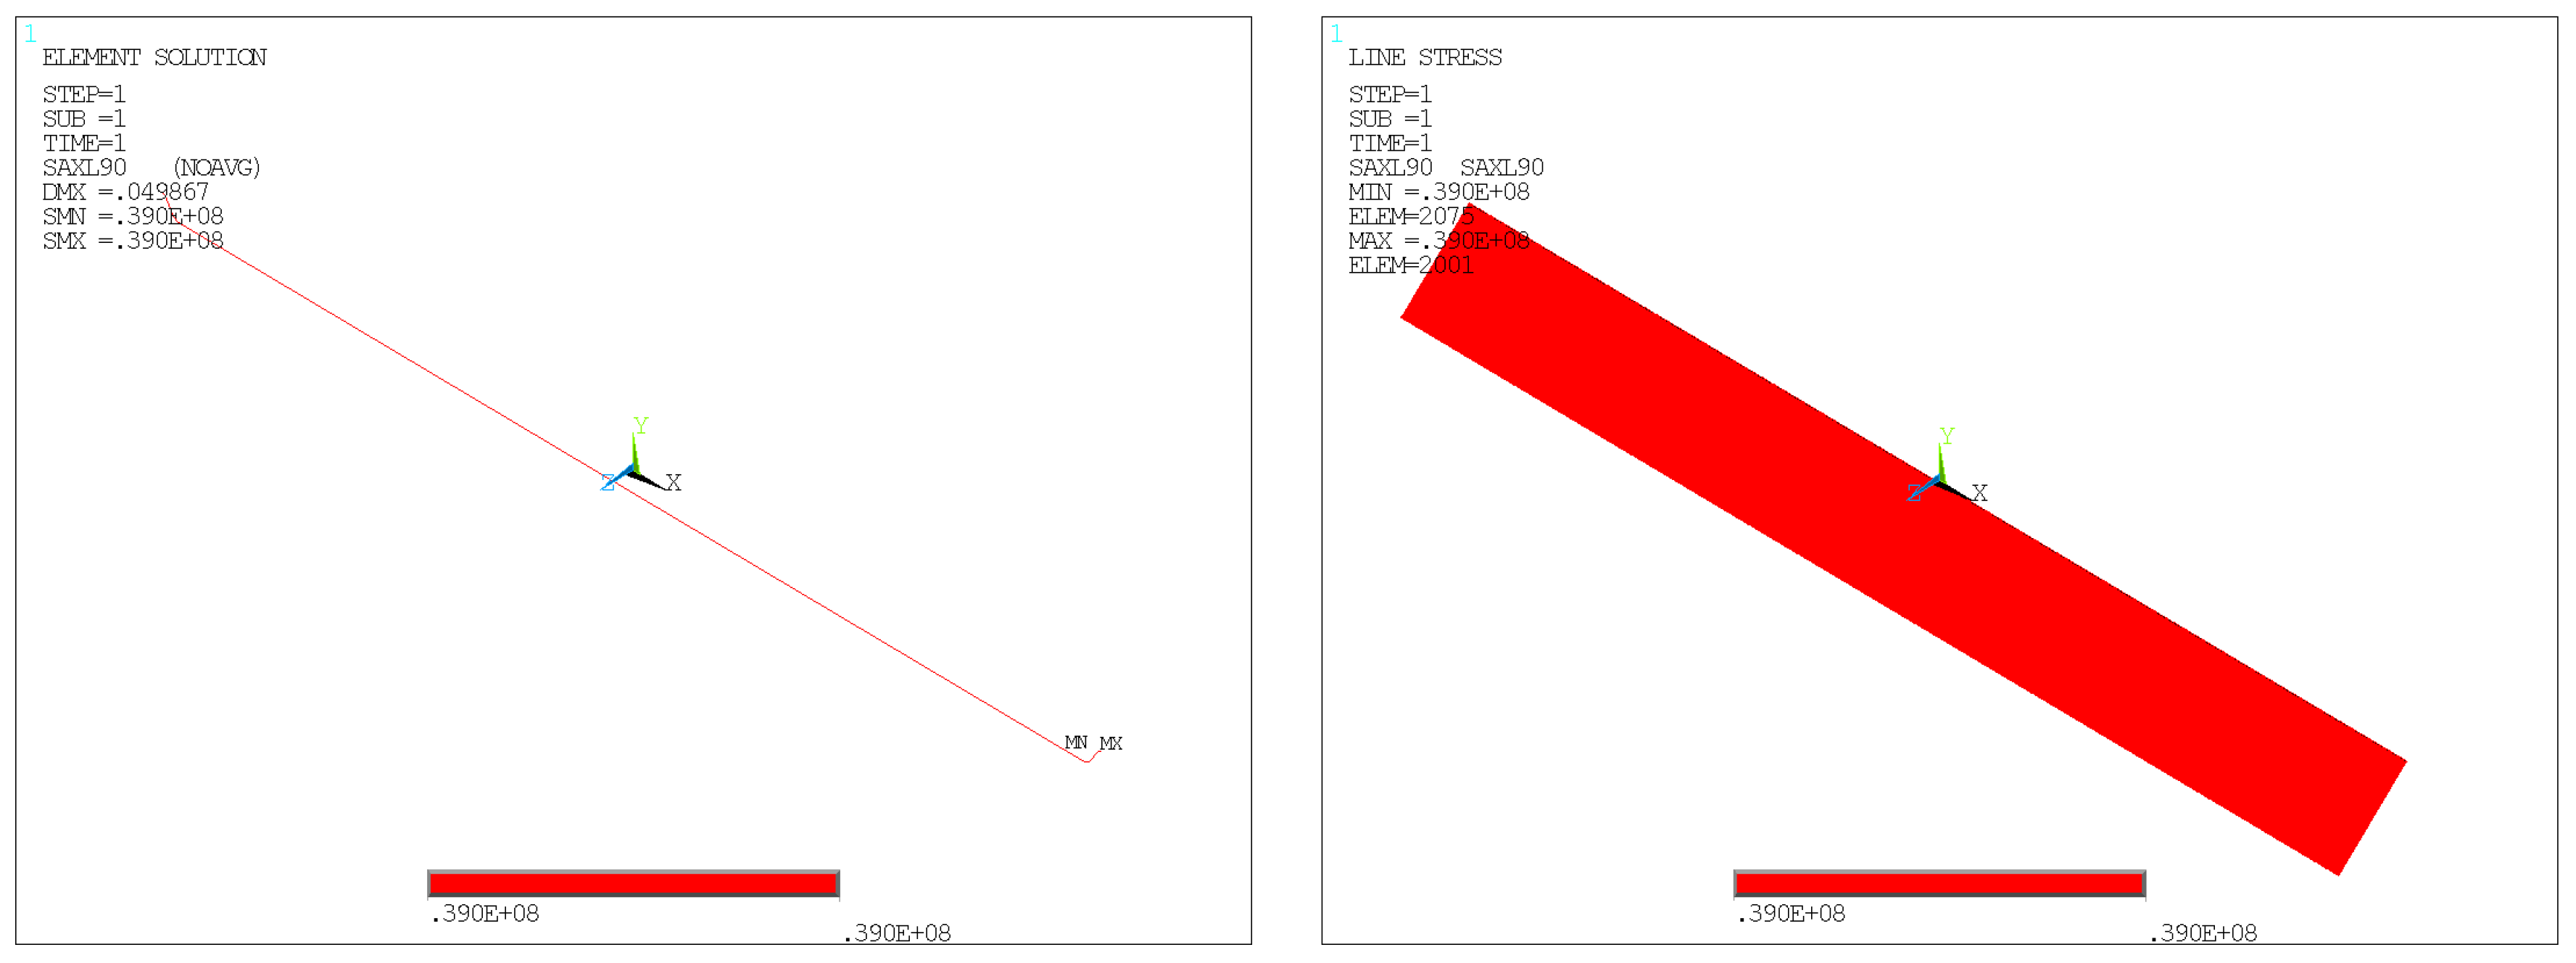
Figure 29.
Axial stress at 90° with Extreme Condition 2.
Figure 29.
Axial stress at 90° with Extreme Condition 2.
Figure 30.
Axial stress at 180° with Extreme Condition 2.
Figure 30.
Axial stress at 180° with Extreme Condition 2.
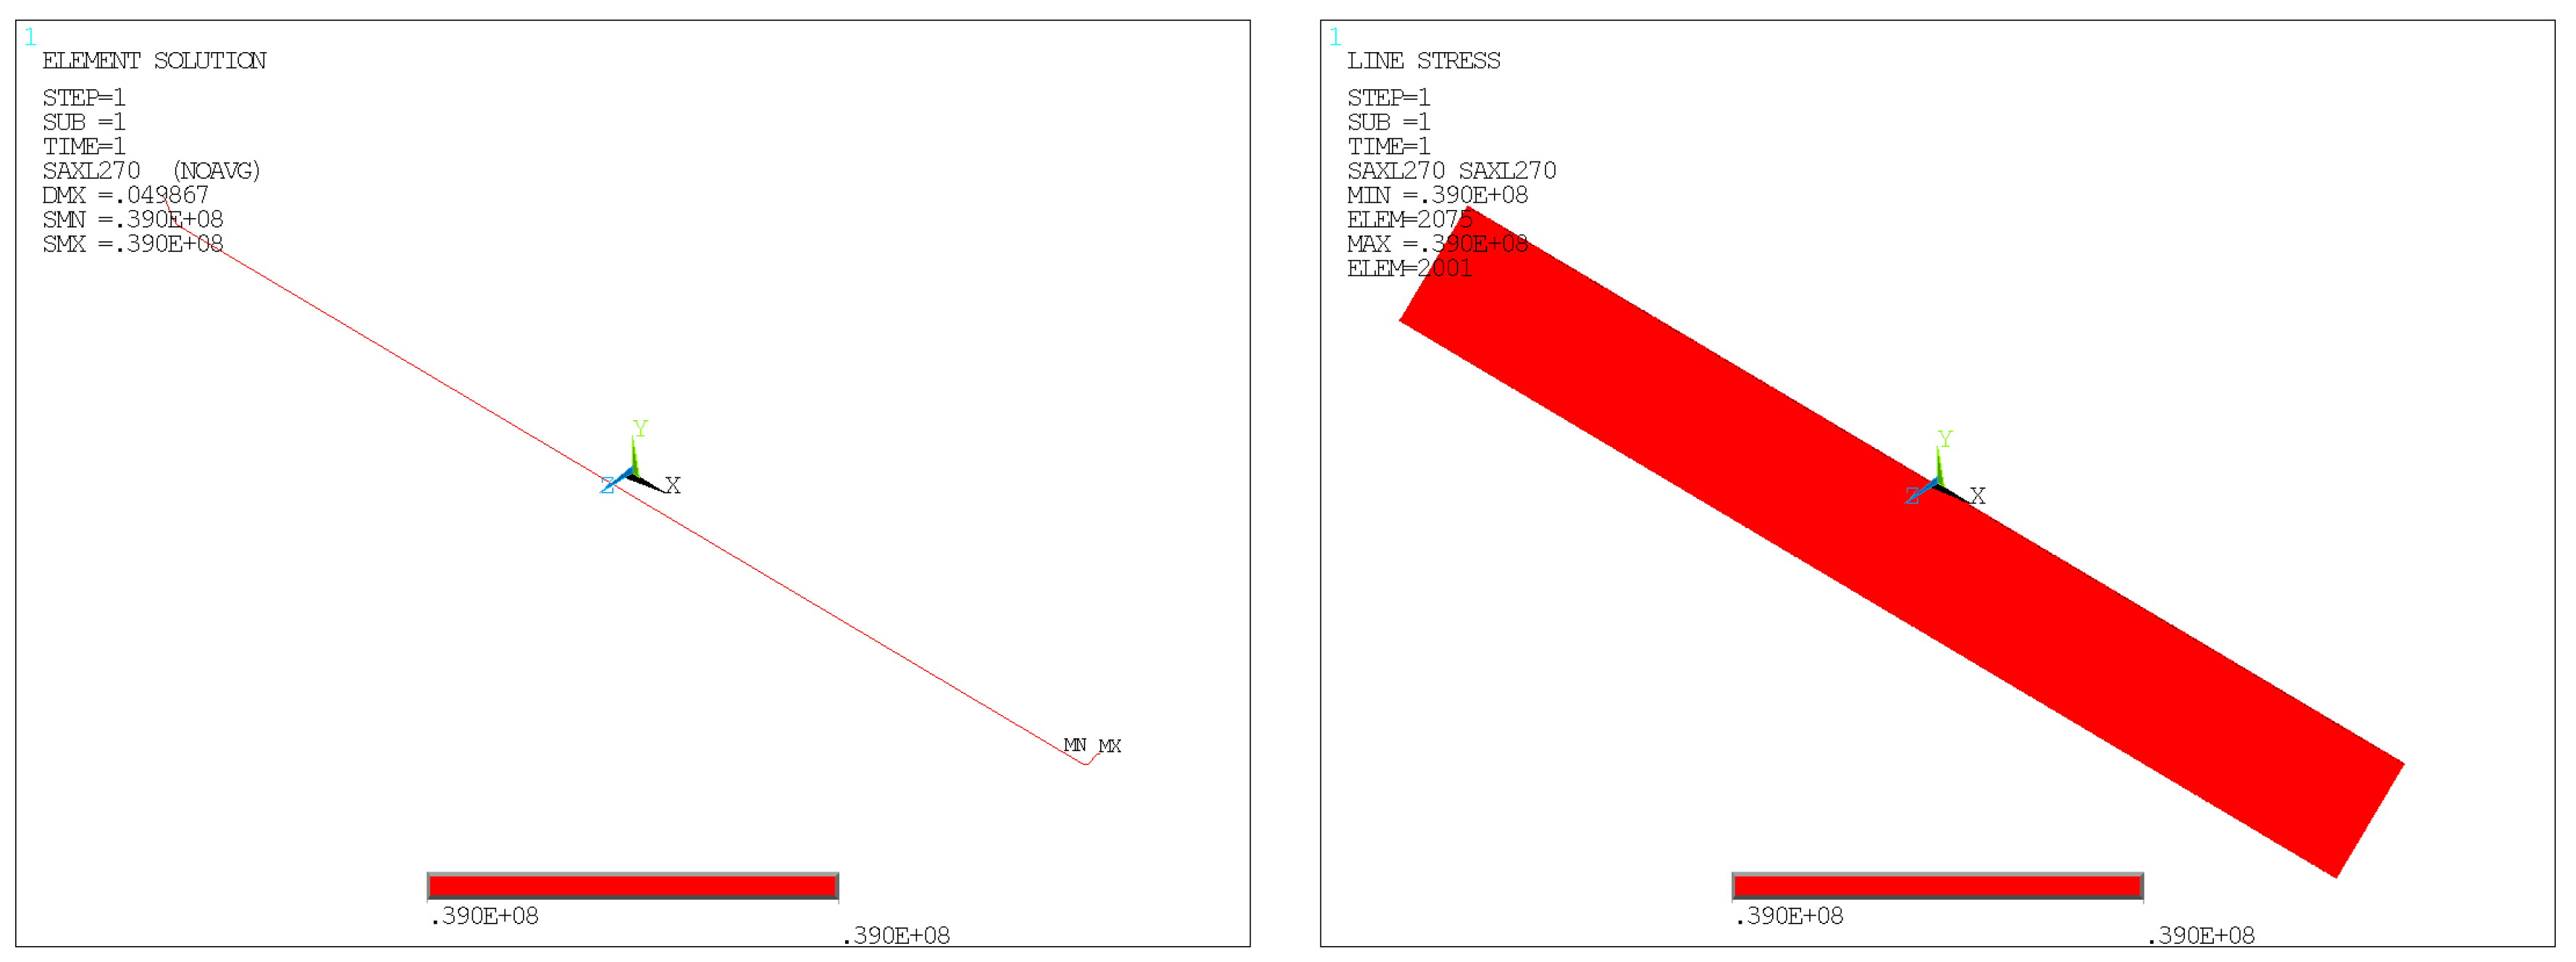
Figure 31.
Axial stress at 270° with Extreme Condition 2.
Figure 31.
Axial stress at 270° with Extreme Condition 2.
Figure 32.
Load distribution of double pipes with the temperature difference of the outer pipe.
Figure 32.
Load distribution of double pipes with the temperature difference of the outer pipe.
Figure 33.
Mechanical model at the ends of the dual-pipe system.
Figure 33.
Mechanical model at the ends of the dual-pipe system.
Figure 34.
Axial stress distribution in the outer pipe at 0° direction (without gravity).
Figure 34.
Axial stress distribution in the outer pipe at 0° direction (without gravity).
Figure 35.
Axial stress distribution in the outer pipe at 180° direction (without gravity).
Figure 35.
Axial stress distribution in the outer pipe at 180° direction (without gravity).
Figure 36.
Axial Stress Distribution in the inner pipe at 0° direction (without gravity).
Figure 36.
Axial Stress Distribution in the inner pipe at 0° direction (without gravity).
Figure 37.
Axial stress distribution in the inner pipe at 180° direction (without gravity).
Figure 37.
Axial stress distribution in the inner pipe at 180° direction (without gravity).
Table 1.
Engineering applications of double-layer pipelines.
Table 1.
Engineering applications of double-layer pipelines.
| Length/km | Location | Water Depth/m | Dimension/mm | Insulation Material | Completion Year |
|---|
| 25 | Congo | 200 | 254/304.8 | IZOFLEX(granules) | 2000 |
| 16.1 | Gulf of Mexico | 1341 | 304.8/203.2 | - | 2001 |
| 13.2 | Gulf of Mexico | 1036 | 254/152.4 | - | 2001 |
| 35.4 | Gulf of Mexico | 882 | 254/152.4 | - | 2003 |
| 16.8 | Gulf of Mexico | 882 | 304.8/203.2 | - | 2004 |
| 25 | France | 15 | 609/863.6 | IZOFLEX | 2004 |
| 8 | Peru | 1100 | 406.4/609 | IZOFLEX | 2004 |
| 37 | Nigeria | 140 | 254/304.8 | IZOFLEX | 2005 |
| 33 | UK North Sea | 1470 | 381/431.1 | IZOFLEX | 2005 |
| 66 | West Africa | 170 | 228.6/304.8 | IZOFLEX | 2007 |
| 22 | UK North Sea | 3050 | 406.4/472.4 | IZOFLEX | 2007 |
| 64.4 | Gulf of Mexico | 100 | - | - | 2008 |
| 20 | South China Sea | 2714 | 304.8/508 | PUF (foam) | 2009 |
| 20 | Gulf of Mexico | 2714 | 355.6/228.6 | Aerogel | 2010 |
| 60 | Gulf of Mexico | 200 | 304.8/203.2 | Aerogel | 2010 |
Table 2.
Structural parameters of the subsea pipeline.
Table 2.
Structural parameters of the subsea pipeline.
| Outer Pipe Diameter (Φ) × Wall Thickness (t)/mm | Inner Pipe Diameter (Φ) × Wall Thickness (t)/mm | Elastic Modulus/GPa | Poisson’s Ratio | Material |
|---|
| 273 × 9 | 168 × 9 | 207 | 0.27 | 16 Mn |
Table 3.
Yield displacement of axial soil springs.
Table 3.
Yield displacement of axial soil springs.
| Soil Type | zs (mm) | Soil Type | zs (mm) |
|---|
| Dense sand | 3 | Stiff clay | 8 |
| Loose sand | 5 | Soft clay | 10 |
Table 4.
Yield displacement of the downward vertical soil spring.
Table 4.
Yield displacement of the downward vertical soil spring.
| Soil Type | zu |
|---|
| Granular soils | 0.1 D |
| Cohesive soils | 0.2 D |
Table 5.
Yield displacement of the upward vertical soil spring.
Table 5.
Yield displacement of the upward vertical soil spring.
| Soil Type | zu′ |
|---|
| Sandy soils | 0.01 H~0.02 H (<0.1 D) |
| Cohesive soils | 0.1 H~0.2 H (<0.2 D) |
Table 6.
Soil parameters.
Table 6.
Soil parameters.
| Cohesion (kPa) | Effective Unit Weight (N/m) | Internal Friction Angle (°) | Total Unit Weight (N/m) | Friction Coefficient |
|---|
| 30 | 16,700 | 20 | 19,700 | 0.7 |
Table 7.
Environmental parameters.
Table 7.
Environmental parameters.
| Crude Oil Density (kg/m3) | Steel Density (kg/m3) | Burial Depth (m) | Water Depth (m) | Pipeline Length (m) |
|---|
| 860 | 7850 | 1.5 | 2.3 | 500 |
Table 8.
Material parameters of the crushable foam model of polyurethane foam.
Table 8.
Material parameters of the crushable foam model of polyurethane foam.
| Density ρ (kg·m−3) | Yield Stress (MPa) | Elastic Modulus (MPa) | Elastic Poisson’s Ratio | Yield Stress Ratio | Plastic Poisson’s Ratio |
|---|
| 100 | 0.7 | 16 | 0.3 | 1 | 0 |
Table 9.
Comparative analysis of key parameters.
Table 9.
Comparative analysis of key parameters.
| Test Condition | PFG | PHA |
|---|
| Numerical Result | Error | Numerical Result | Error |
|---|
| Maximum load | 1380 kN | 2% | 1331 kN | 1.5% |
| Lateral deformation | 45 mm | 5.2% | 30.2 mm | 4.6% |
| Maximum diameter of outer tube | 296.7 mm | 2.1% | 349.8 mm | 0.98% |
Table 10.
Monthly air temperature variations (February 1985–December 1989, °C).
Table 10.
Monthly air temperature variations (February 1985–December 1989, °C).
| Month | 1.0 | 2.0 | 3.0 | 4.0 | 5.0 | 6.0 | 7.0 | 8.0 | 9.0 | 10.0 | 11.0 | 12.0 | Year |
|---|
| Maximum | 9.5 | 14.1 | 19.6 | 31.2 | 36.3 | 39.6 | 36.6 | 35.3 | 34.5 | 30.3 | 21.8 | 18.6 | 39.6 |
| Average | −3.5 | −2.2 | 3.2 | 11.8 | 18.9 | 22.1 | 24.9 | 25.9 | 20.8 | 14.3 | 5.3 | −1.7 | 11.7 |
| Minimum | −16.6 | −12.7 | −8.0 | −2.0 | 5.0 | 11.5 | 17.3 | 16.4 | 10.1 | −2.6 | −8.2 | −18.0 | −18.0 |
Table 11.
Monthly seawater temperature variations (January 2008–December 2008, °C).
Table 11.
Monthly seawater temperature variations (January 2008–December 2008, °C).
| Month | 1 | 2 | 3 | 4 | 5 | 6 | 7 | 8 | 9 | 10 | 11 | 12 | Year |
|---|
| Maximum | 0.6 | 5.9 | 11.1 | 17.2 | 22.4 | 24.8 | 28.1 | 29.6 | 26.6 | 21.0 | 13.9 | 7.2 | 29.6 |
| Average | −0.6 | −0.2 | 6.4 | 12.1 | 17.8 | 21.5 | 25.0 | 26.9 | 24.0 | 17.3 | 10.2 | 1.5 | 13.6 |
| Minimum | −3.5 | −5.2 | 2.1 | 9.1 | 14.8 | 18.3 | 22.0 | 24.7 | 16.0 | 10.8 | 2.2 | −5.0 | −5.2 |
Table 12.
Verification of inner pipe displacement.
Table 12.
Verification of inner pipe displacement.
| Direction | Horizontal (m) | Vertical (m) |
|---|
Extreme
Condition 1 | Maximum absolute displacement | 0 | Maximum absolute displacement | 0.00003597 |
| Minimum absolute displacement | 0 | Minimum absolute displacement | −0.0205 |
| Maximum relative displacement | 0 | Maximum relative displacement | 0.020536 |
Extreme
Condition 2 | Maximum absolute displacement | 0 | Maximum absolute displacement | 0.000036 |
| Minimum absolute displacement | 0 | Minimum absolute displacement | −0.0205 |
| Maximum relative displacement | 0 | Maximum relative displacement | 0.020536 |
Table 13.
Stress of the outer pipe for Extreme Condition 1.
Table 13.
Stress of the outer pipe for Extreme Condition 1.
| Stress Type | Axial Stress | Hoop Stress |
|---|
| Direction | 0° | 90° | 180° | 270° | 0° | 90° | 180° | 270° |
| Maximum (MPa) | 36.6 | 22.2 | 23.4 | 22.2 | 0 | 0 | 0 | 0 |
| Minimum (MPa) | 21 | 22.2 | 7.69 | 22.2 | 0 | 0 | 0 | 0 |
| Average (MPa) | 22.2 | 22.2 | 22.1 | 22.2 | 0 | 0 | 0 | 0 |
Table 14.
Stress values in the inner pipe with Extreme Condition 1.
Table 14.
Stress values in the inner pipe with Extreme Condition 1.
| Stress Type | Axial Stress | Hoop Stress |
|---|
| Direction | 0° | 90° | 180° | 270° | 0° | 90° | 180° | 270° |
| Maximum (MPa) | −76.6 | −36.7 | −51.1 | −36.7 | 0 | 0 | 0 | 0 |
| Minimum (MPa) | −22.3 | −36.7 | 3.23 | −36.7 | 0 | 0 | 0 | 0 |
| Average (MPa) | −36.7 | −36.7 | −36.7 | −36.7 | 0 | 0 | 0 | 0 |
Table 15.
Stress for the outer pipe for Extreme Condition 2.
Table 15.
Stress for the outer pipe for Extreme Condition 2.
| Stress Type | Axial Stress (MPa) | Hoop Stress (MPa) |
|---|
| Direction | 0° | 90° | 180° | 270° | 0° | 90° | 180° | 270° |
| Maximum | −24.8 | −23.6 | −38 | −23.6 | 0 | 0 | 0 | 0 |
| Minimum | −9.09 | −23.6 | −22.4 | −23.6 | 0 | 0 | 0 | 0 |
| Average | −23.5 | −23.6 | −23.6 | −23.6 | 0 | 0 | 0 | 0 |
Table 16.
Stress values in the inner pipe with Extreme Condition 2.
Table 16.
Stress values in the inner pipe with Extreme Condition 2.
| Stress Type | Axial Stress | Hoop Stress |
|---|
| Direction | 0° | 90° | 180° | 270° | 0° | 90° | 180° | 270° |
| Maximum (MPa) | 53.5 | 39.0 | 79.0 | 39.0 | 0 | 0 | 0 | 0 |
| Minimum (MPa) | −0.9 | 39.0 | 24.6 | 39.0 | 0 | 0 | 0 | 0 |
| Average (MPa) | 39.1 | 39.0 | 39.0 | 39.0 | 0 | 0 | 0 | 0 |
Table 17.
Comparison of pipeline displacements and stresses with different insulation material densities.
Table 17.
Comparison of pipeline displacements and stresses with different insulation material densities.
| Case ID | Extreme Case 1 | Extreme Case 2 |
|---|
| Extreme Stress (MPa) | Extreme Displacement (mm) | Extreme Stress (MPa) | Extreme Displacement (mm) |
|---|
| Outer Pipe | Inner Pipe | Outer Pipe | Inner Pipe | Outer Pipe | Inner Pipe | Outer Pipe | Inner Pipe |
|---|
| PU density (kg/m3) | 40 | 38.7 | 74.1 | 0.0888 | 25.2 | 99.2 | −146.3 | 0.0888 | 25.4 |
| 65 | 37.9 | 75.1 | 0.0888 | 23.1 | 98.2 | −147.4 | 0.0888 | 23.2 |
| 90 | 36.9 | −76.2 | 0.0888 | 20.9 | 97.2 | −148.7 | 0.0888 | 21.1 |
| 100 | 36.6 | −76.6 | 0.0888 | 20.5 | 96.8 | −149 | 0.0888 | 20.5 |
| 110 | 36.4 | −76.8 | 0.0888 | 20.3 | 96.6 | −149.3 | 0.0888 | 20.4 |
Table 18.
Sensitivity indices of key parameters for inner pipe stress extremes.
Table 18.
Sensitivity indices of key parameters for inner pipe stress extremes.
| Parameter | Sensitivity Index | Parameter | Sensitivity Index |
|---|
| PU foam | Density | 0.65 | Pipeline | Young’s modulus | 0.02 |
| Compressive modulus | 0.01 | Poisson’s ratio | 0.01 |
| Yield stress | 0.58 | Thermal expansion coefficient | 0.53 |
| Environmental parameter | Temperature differential | 1.12 | Interface | Friction coefficient | 0.23 |
Table 19.
Parameters for Extreme Condition 1.
Table 19.
Parameters for Extreme Condition 1.
| Expansion Coefficient (α) | Temperature Difference (δt) | Outer Pipe Area (ao) | Inner Pipe Area (ai) | Pipe Length (l) | Elastic Modulus (e) |
|---|
| 1.2 × 10⁻⁵ | −23.6 °C | 0.006657m2 | 0.004019 m2 | 500m | 2.07 × 10¹¹ Pa |
Table 20.
Finite element results for Extreme Condition 1.
Table 20.
Finite element results for Extreme Condition 1.
| Outer Pipe Displacement | Outer Pipe Axial Stress σo (Average) | Inner Pipe Axial Stress σi
(Average) |
|---|
| 0.0888 m | 22.163 MPa | 36.708 MPa |
Table 21.
Finite element results for Extreme Condition 2.
Table 21.
Finite element results for Extreme Condition 2.
| Outer Pipe Displacement | Outer Pipe Axial Stress σo (Average) | Inner Pipe Axial Stress σi (Average) | Temperature Difference |
|---|
| 0.0949 m | 23.566 MPa | 39.031 MPa | 25.2 |
Table 22.
Stress types in dual-pipe models for different loading conditions.
Table 22.
Stress types in dual-pipe models for different loading conditions.
| Loading Condition | Load Type | Stress Model Classification | Inner Pipe Stress | Outer Pipe Stress |
|---|
| Extreme Condition 1 | Temperature deformation of outer pipe with shrinkage | Category 1 | Compressive stress | Tensile stress |
| Extreme Condition 2 | Temperature deformation of outer pipe with expansion | Category 2 | Tensile stress | Compressive stress |
Table 23.
Influence range of the pipe segment with Extreme Condition 1.
Table 23.
Influence range of the pipe segment with Extreme Condition 1.
| Segment | 0° Direction of External Pipe (m) | 180° Direction of External Pipe (m) | 0° Direction of External Pipe (m) | 180° Direction of External Pipe (m) |
|---|
| Endpoint a (m) | 24.5 | 24.25 | 25 | 23.5 |
| Endpoint b (m) | 24.25 | 24 | 24.75 | 23.25 |
| Average (m) | 24.375 | 24.125 | 24.875 | 23.375 |
Table 24.
Influence ranges of axial stress with Extreme Condition 2.
Table 24.
Influence ranges of axial stress with Extreme Condition 2.
| Section | 0° Direction of Outer Pipe (m) | 180° Direction of Outer Pipe (m) | 0° Direction of Outer Pipe (m) | 180° Direction of Outer Pipe (m) |
|---|
| Endpoint a (m) | 16 | 18 | 14.75 | 18.25 |
| Endpoint b (m) | 15.75 | 17.75 | 14.5 | 18 |
| Average (m) | 15.825 | 17.825 | 14.625 | 18.125 |


