1. Introduction
In recent years, as shallow coal resources have gradually depleted, mining activities have increasingly shifted to deep coal reserves, which are both extensive and significant. However, with increasing mining depth, the deformation and fragmentation of roadway surrounding rock under high-stress conditions have become more severe [
1,
2]. For instance, in a mine in China, the average mining depth of the working face exceeds 750 m. The complex mechanical and geological conditions of deep roadways often lead to roadway deformation, rock bursts, and coal and gas outbursts, posing significant challenges to the normal operation of the working face. This highlights the urgent need for further research into the mechanisms of bedrock failure and stress evolution beneath thick loose layers.
To clarify the mechanisms of roof disasters in working faces, recent years have seen extensive research on the movement and failure mechanisms of overlying strata during coal mining beneath thick loose layers. Cheng et al. [
3] investigated the deformation and evolution processes of overlying strata during coal mining. They analyzed the controlling role of the key layer in this deformation and identified three primary failure modes. Additionally, Chang et al. [
4] examined the movement patterns of overlying strata during backfilling mining under thick loose layers. Their analysis focused on the relationship between the filling ratio, the movement of the overlying strata, and the stress of the roof strata. Gao et al. [
5,
6] employed the Trigon command in UDEC to model the roof failure behavior and investigated the failure mechanism of the roof over the goaf by examining the displacement field, stress distribution, and crack propagation features. Xu et al. [
7] investigated the movement and failure characteristics of overlying strata after the mining of shallow-buried coal seams beneath thick loose layers. Their study identified an interface in the overlying strata, revealing distinct movement characteristics in the strata above and below this interface. Chen et al. [
8] studied the influence of different positions and thicknesses of key strata on the subsidence of overlying strata by using three-dimensional digital speckle technology and GDEM simulation software and concluded that the caving distance of overlying strata is proportional to the thickness of key strata. Wang et al. [
9] used PFC3D simulation software (version 5.0) to establish a multi-level coal seam excavation model, analyzed the collapse and crack characteristics of overburden rock during mining, and proposed a method to predict the failure height of overburden rock. Xiong et al. [
10] studied the influence of working face layout length on the overlying strata movement characteristics of steep inclined working faces by using similar simulation experiments and digital speckle technology and obtained the optimal working face layout length. Liu et al. [
11] established an analogous hyperbola model of overburden movement and studied the asymmetric fracture mechanism induced by coal seam mining beneath thick loose layers. Zhang et al. [
12] analyzed the failure characteristics of overburden under thin bedrock and thick loose layers and proposed a layered mining technique. Wang et al. [
13] investigated the movement characteristics of overlying strata under conditions of thin loose layers and thick bedrock and proposed a quantitative filling mining method. Wen et al. [
14] investigated the structure and movement behavior of the overlying strata and proposed a method for supporting the working load and addressing support failure. Li et al. [
15] studied the caving mechanism of roof overburden under repeated mining conditions, analyzed the caving characteristics of these two forms, and proposed corresponding control measures. Wu et al. [
16] revealed the impact of reduced bedrock thickness on the failure height of overlying strata through similar simulation experiments. Yang et al. [
17] studied the characteristics of subsidence and deformation caused by mining under thin bedrock and thick loose layers. The results indicate that surface subsidence is more pronounced under thin bedrock conditions. Ju et al. [
18] studied the fracture characteristics of the key layer in the overlying strata and obtained the influence of the fracture morphology of the key layer on the movement of the overlying strata. Kong et al. [
19] studied the stress evolution law of overburdened roofs, analyzed the factors affecting the stability of roofs, and proposed a control strategy to maintain the stability of the surrounding rock in roadways. Meng et al. [
20] investigated the fracture behavior of weak overburden under conditions of thin bedrock, developed a predictive calculation method for overburden failure height, and confirmed the accuracy of this predictive method through field experiments.
Anchorage technology has gained popularity for its simple operation, low cost, and remarkable deformation control effect [
21,
22,
23]. In addressing the issue of roadway surrounding rock deformation, researchers have extensively investigated anchoring support technology. Cao et al. [
24] proposed a combined control technology system known as “cutting roof to relieve pressure—multilevel continuous anchor—grouting”, which enhanced the strength and integrity of the surrounding rock. Additionally, Yang et al. [
25] examined the deformation characteristics, stress evolution, and crack development patterns of surrounding rock, introducing a novel combined support system termed “bolt + cable + mesh + shotcrete + shell”. Wang et al. [
26] carried out a numerical simulation of the deep roadway by coupling MIDAS and FLAC3D, analyzed the failure mechanism of the deep roadway and proposed a collaborative control method of “grouting-anchorage-pouring” for super-large section soft rock roadway. Meng et al. [
27] used UDEC simulation software (version 6.0) to study the deformation control of surrounding rock in the deep roadway and proposed a combined support method of “anchor bolt + anchor cable + bolting + deep and shallow borehole grouting + inverted arch”, and carried out experiments in the field to effectively control the bottom heave of the roadway. Zhang et al. [
28] proposed a support method consisting of a “steel shed + spray arch support + monomer + π steel beam” to address the severe fragmentation of the surrounding rock in roadways. Meanwhile, Xu et al. [
29] examined the deformation and failure behavior of deep gob-side entries and developed a control approach using asymmetric high-prestressed truss anchor cables, tailored to the roadway’s deformation patterns.
According to the relevant research and experience, it is known that the optimal stability control of roadway surrounding rock is frequently unattainable solely through the use of anchoring structures, and in certain cases, the roadway deformation can be effectively managed by combining reasonable pressure relief method [
30,
31]. Consequently, extensive research has been conducted by scholars on pressure relief techniques for surrounding rock in roadways. By pre-cutting the roof of the roadway, Xu et al. [
32] transformed the peak stress of the roof from a single peak to a double peak state, significantly reducing the roof stress. Combined with field investigation and FLAC3D numerical simulation, Xie et al. [
33] proposed a coal wall pressure relief technology with different apertures, which effectively reduced the displacement of two sides of the deep roadway. Yao et al. [
34] developed segmented large-diameter borehole pressure relief technology and proposed a rock burst decompression-support collaborative control system. Furthermore, Xie et al. [
35] introduced the “anchorage + pressure relief” collaborative control technology to address support structure failures resulting from stress transfer during the pressure relief process.
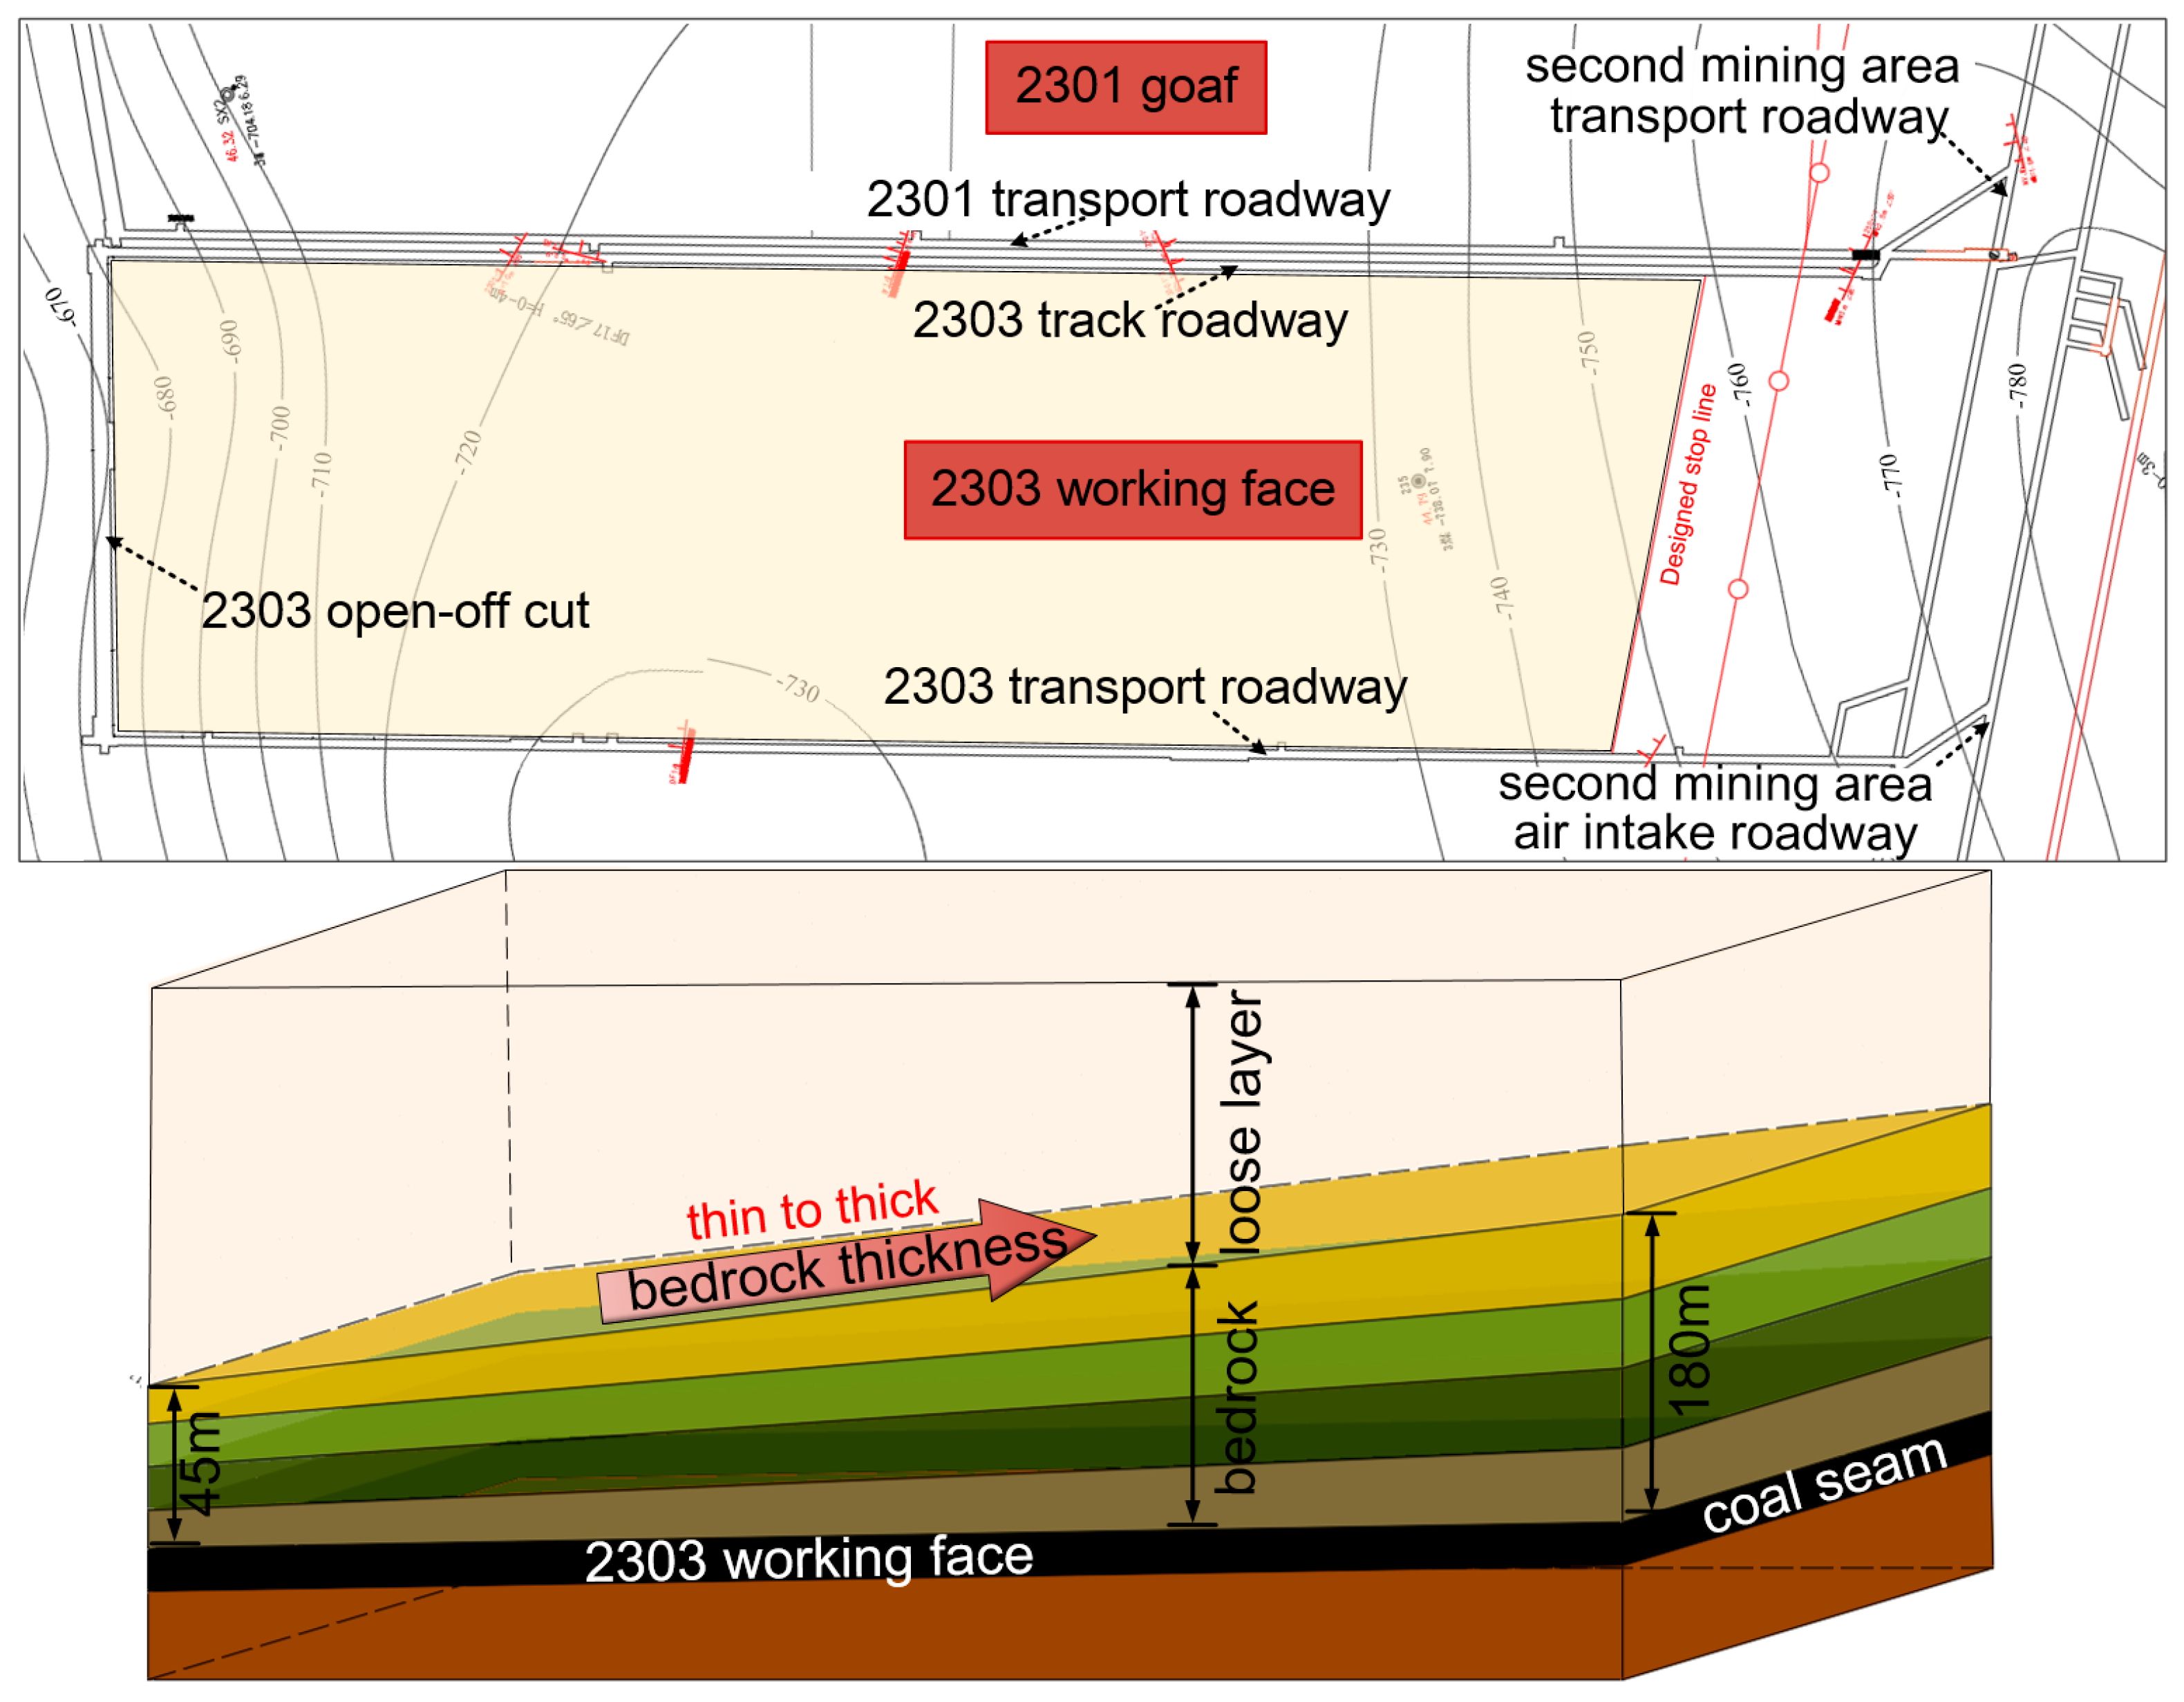
The previous research has predominantly concentrated on the stability analysis of loose layers and overlying strata structures under conditions of constant bedrock thickness. In contrast, studies examining the movement patterns and stress evolution laws of overlying strata induced by variations in bedrock thickness remain limited. Unlike traditional working face conditions, roadway surrounding rock exhibits distinct failure and deformation behaviors in the presence of thick loose layers and unequal bedrock thickness. For instance, in the early mining phase of a Chinese mine, the roadway surrounding rock underwent significant fracturing. Substantial deformation occurred in the mining roadway, resulting in the failure of certain support structures. As the working face advances, the stability of the surrounding rock gradually increases and the deformation decreases. To investigate the underlying mechanisms, this study focuses on the 2303 working faces in a Chinese mine in the engineering context. Field investigations were conducted to collect data, including roof strata composition and in-situ ground pressure measurements. These data were integrated with UDEC numerical simulations and theoretical analysis for a comprehensive study. The movement patterns and stress evolution of overlying strata were analyzed, and a calculation method for the fracture distance of the key layer was derived. Based on these findings, a surrounding rock control scheme for working faces with varying bedrock thickness was proposed. The results indicate that as bedrock thickness increases, the failure mode of the immediate roof strata transitions from plastic failure and collapse in thin bedrock sections to blocky fracturing in thick bedrock sections. Additionally, this study highlights the dynamic process of the stress peak at the working face shifting inward toward the coal wall as bedrock thickness increases, which represents the most distinctive feature differentiating this research from previous studies. Building on the findings regarding overlying rock stress under varying bedrock thickness conditions, and incorporating insights from prior studies, a “hole sealing—hole expansion—roof breaking—support” combined support method was proposed and successfully implemented in the field. This method effectively controlled and mitigated roadway surrounding rock deformation under these conditions, providing practical guidance for engineering applications in similar geological settings.
3. Establishment of Discrete Element Model
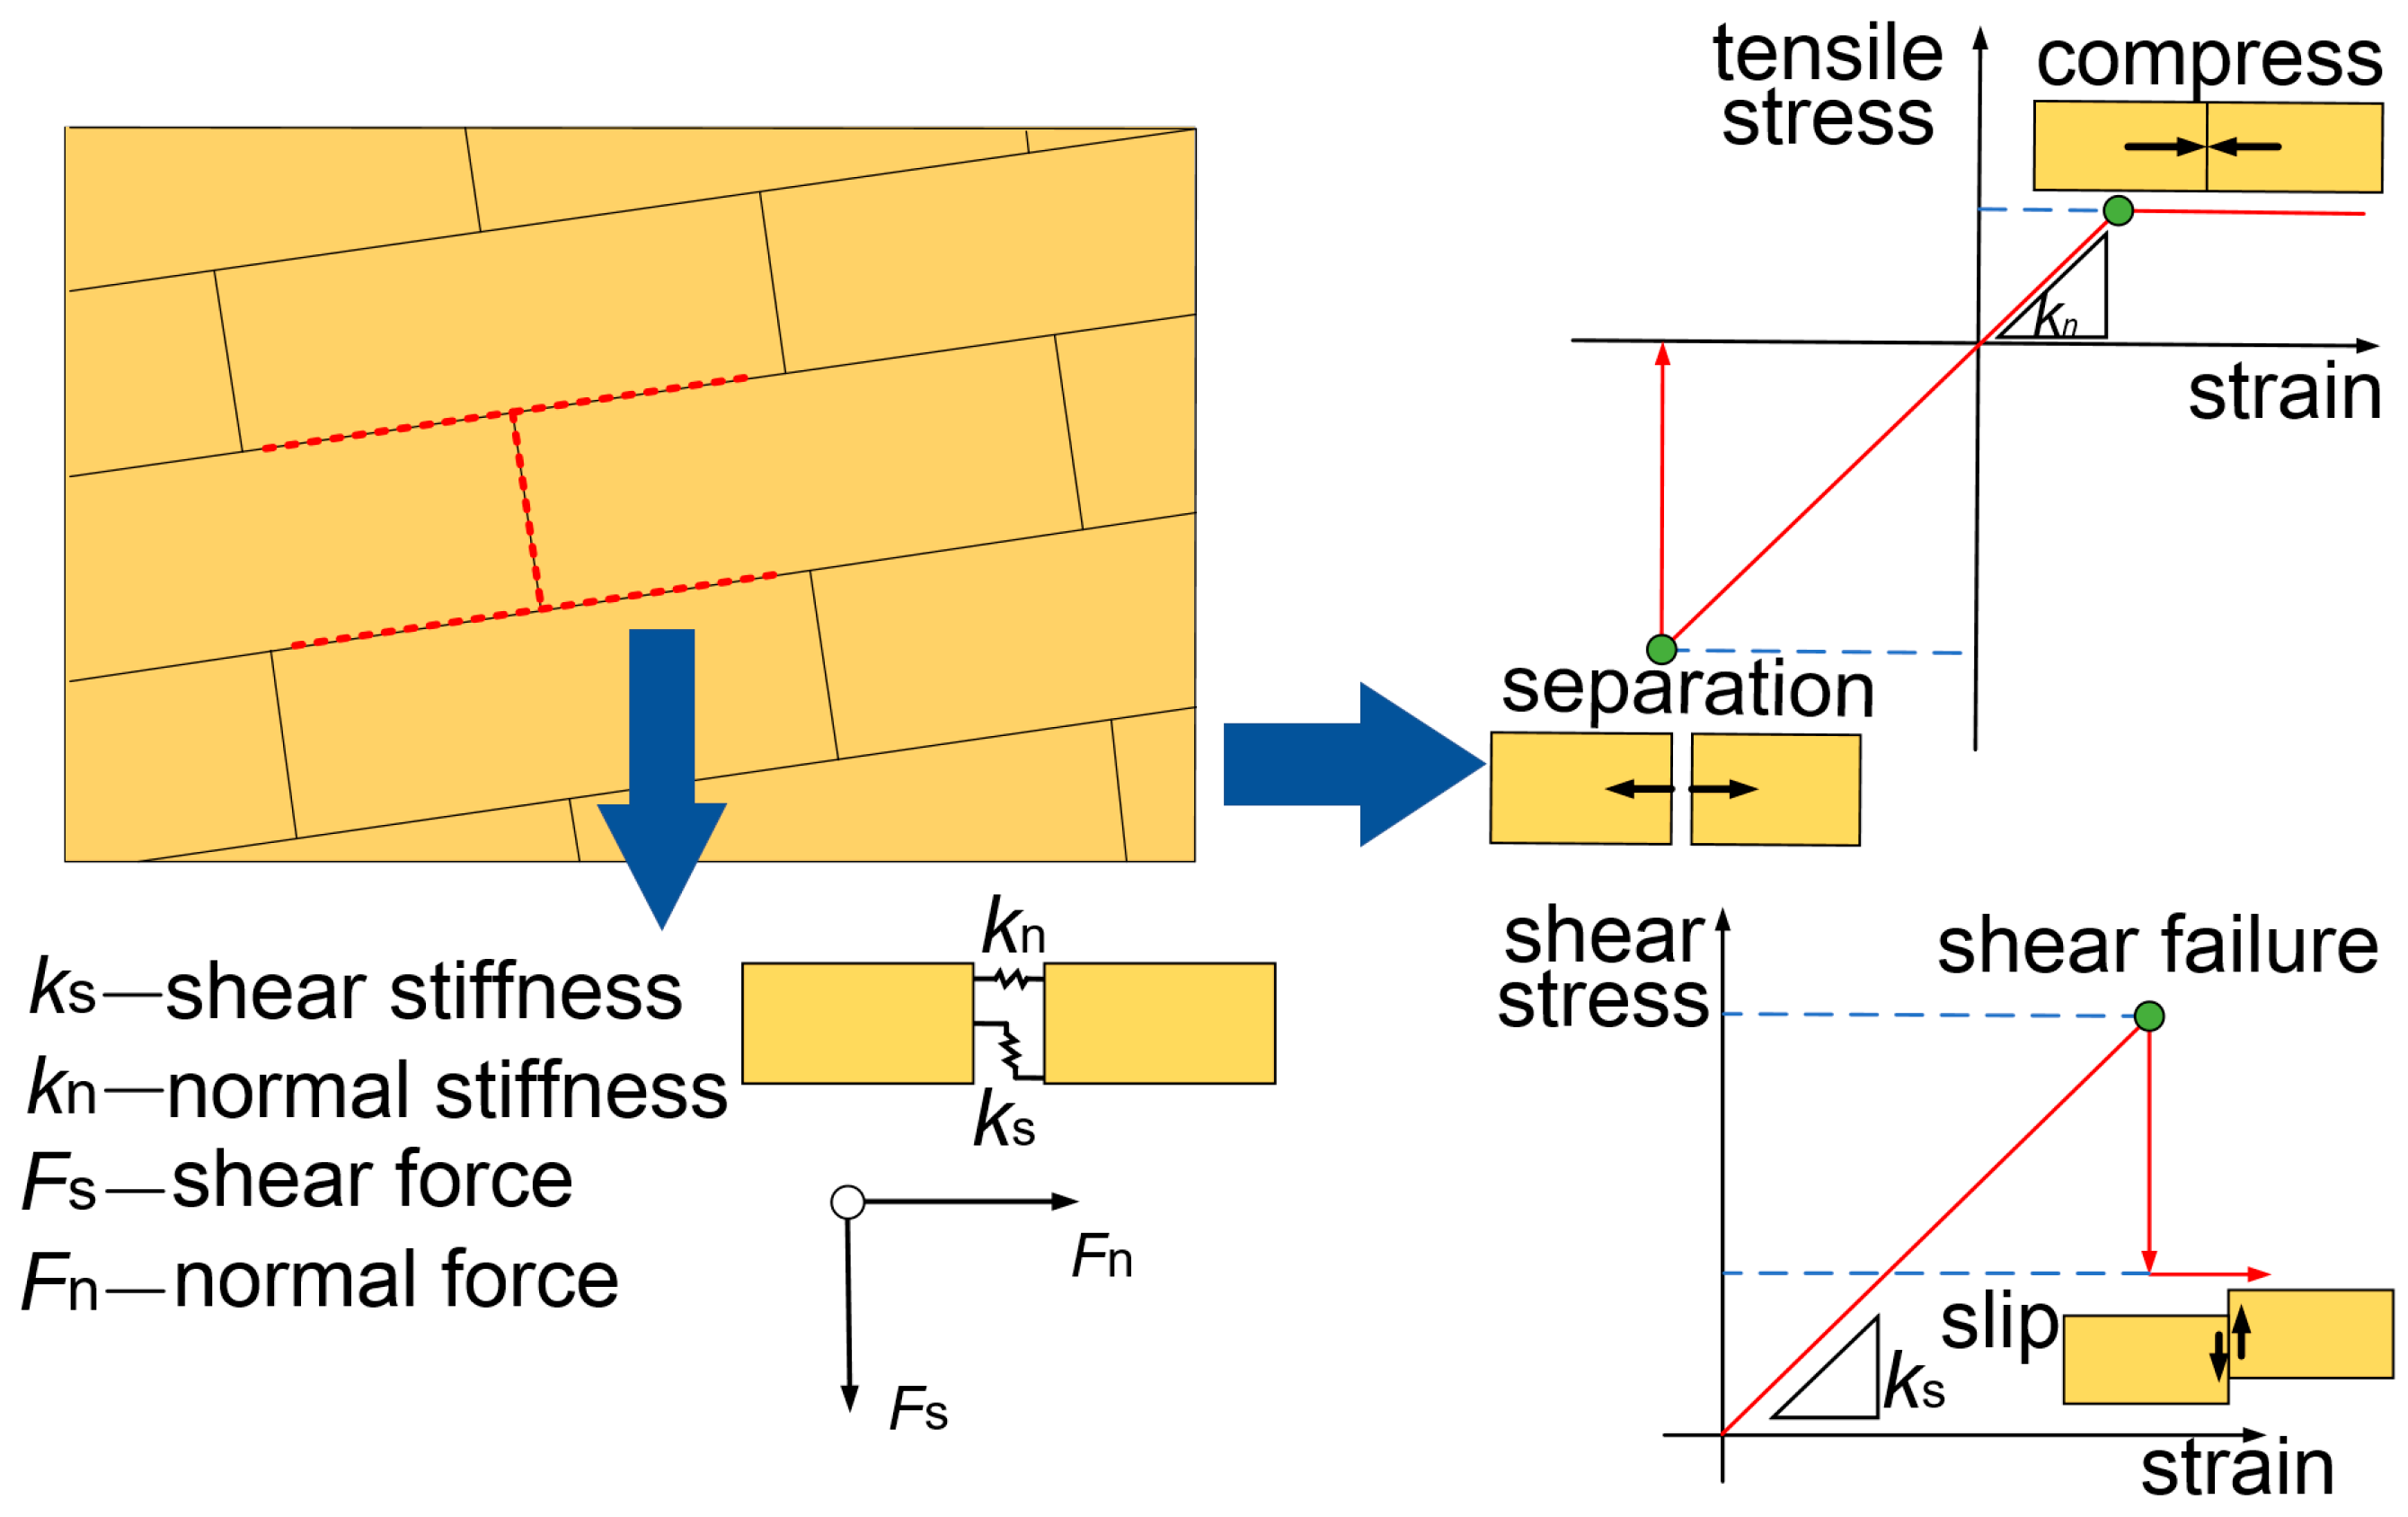
UDEC 7.00.76 (Universal Distinct Element Code) is a 2D numerical simulation software based on the discrete element method, designed for analyzing discontinuous media. The discontinuous medium model is primarily composed of discrete blocks and their contact surfaces, with the microscopic properties and constitutive contact behavior between the blocks shown in
Figure 3. In the discrete element simulation, the failure of the overlying strata mainly depends on the stress state of the joint contact surfaces. In the figure, k
n and k
s represent the normal stiffness and shear stiffness of the contact surfaces, respectively. Failure in the normal direction of the contact surface is primarily determined by the normal stiffness. If the normal stress acting between the blocks surpasses the tensile strength limit, the blocks separate, resulting in tensile failure. The shear stiffness plays a dominant role in governing failure along the shear direction of the contact surface. When the shear stress between the blocks exceeds the maximum shear strength, the blocks slide, resulting in shear failure [
36]. By simulating the interactions between the blocks, the software can accurately capture the discontinuous and complex mechanical behavior of the material. It has distinct advantages in simulating the response of block systems under both dynamic and static loads. Therefore, we decided to use UDEC simulation software to establish the numerical calculation model.
Owing to the intricate and dynamic field conditions at the working face, including its considerable burial depth, the transition of the roof bedrock from thin to thick, and the discontinuous characteristics of the rock material, modeling such conditions poses significant challenges. Earlier numerical models typically presumed uniform rock layer thickness. To account for the varying thickness of the roof bedrock in the working face, the “cut crack” command in UDEC was utilized during the modeling process. According to the joint inclination angle, the roof bedrock was divided into layers with thickness increasing progressively from left to right, as shown in
Figure 4, which effectively solves and simulates the change process of bedrock thickness.
To investigate the mechanisms of overburden rock failure and the evolution of stress caused by variations in bedrock thickness, the model block adopts the Mohr-Coulomb elastic model, while the joint contacts are represented using the Mohr-Coulomb slip model. The final model of the working face with unequal bedrock thickness is illustrated in
Figure 5.
The model dimensions are 480 m in length and 250 m in height. Reflecting the actual engineering scenario, the thicknesses of the bedrock and loose layer undergo continuous variation, and the action process of the two is highly complex due to the influence of rock combination and other factors. To facilitate the study, the gradient of bedrock thickness in the working face is modeled as a uniform change from left to right. The bedrock thickness in the model ranges from 43.8 m to 108.8 m, the loose layer thickness varies from 177 m to 99.4 m, The thickness of the coal seam floor varies between 23.2 m and 35.8 m, and the coal seam itself is 6 m thick. The bottom of the model is fixed, the top boundary is free, and horizontal movements are restricted at the left and right boundaries. The 515 m overlying loose layer is represented as a uniform load of 9.2 MPa, applied to the upper boundary according to its gravitational density and thickness. To prevent the inaccuracy of the simulation solution caused by the excessive excavation area of the coal seam, the coal seam is divided into 19 regions for excavation. Each section of the coal seam is excavated, and the next section of the coal seam is excavated after the solution is completed and stabilized. To avoid the boundary effect, 60 m and 40 m coal are reserved on the left and right sides of the excavation area as the boundary to ensure the accuracy and stability of the model solution to the greatest extent.
The rock mechanics parameters for this model are initially obtained from the field geological report, and then the rock mass and contact parameters are iteratively adjusted using a trial-and-error method to ultimately determine the rock mechanics parameters suitable for the simulation. The relevant rock mechanics parameters are shown in
Table 1.
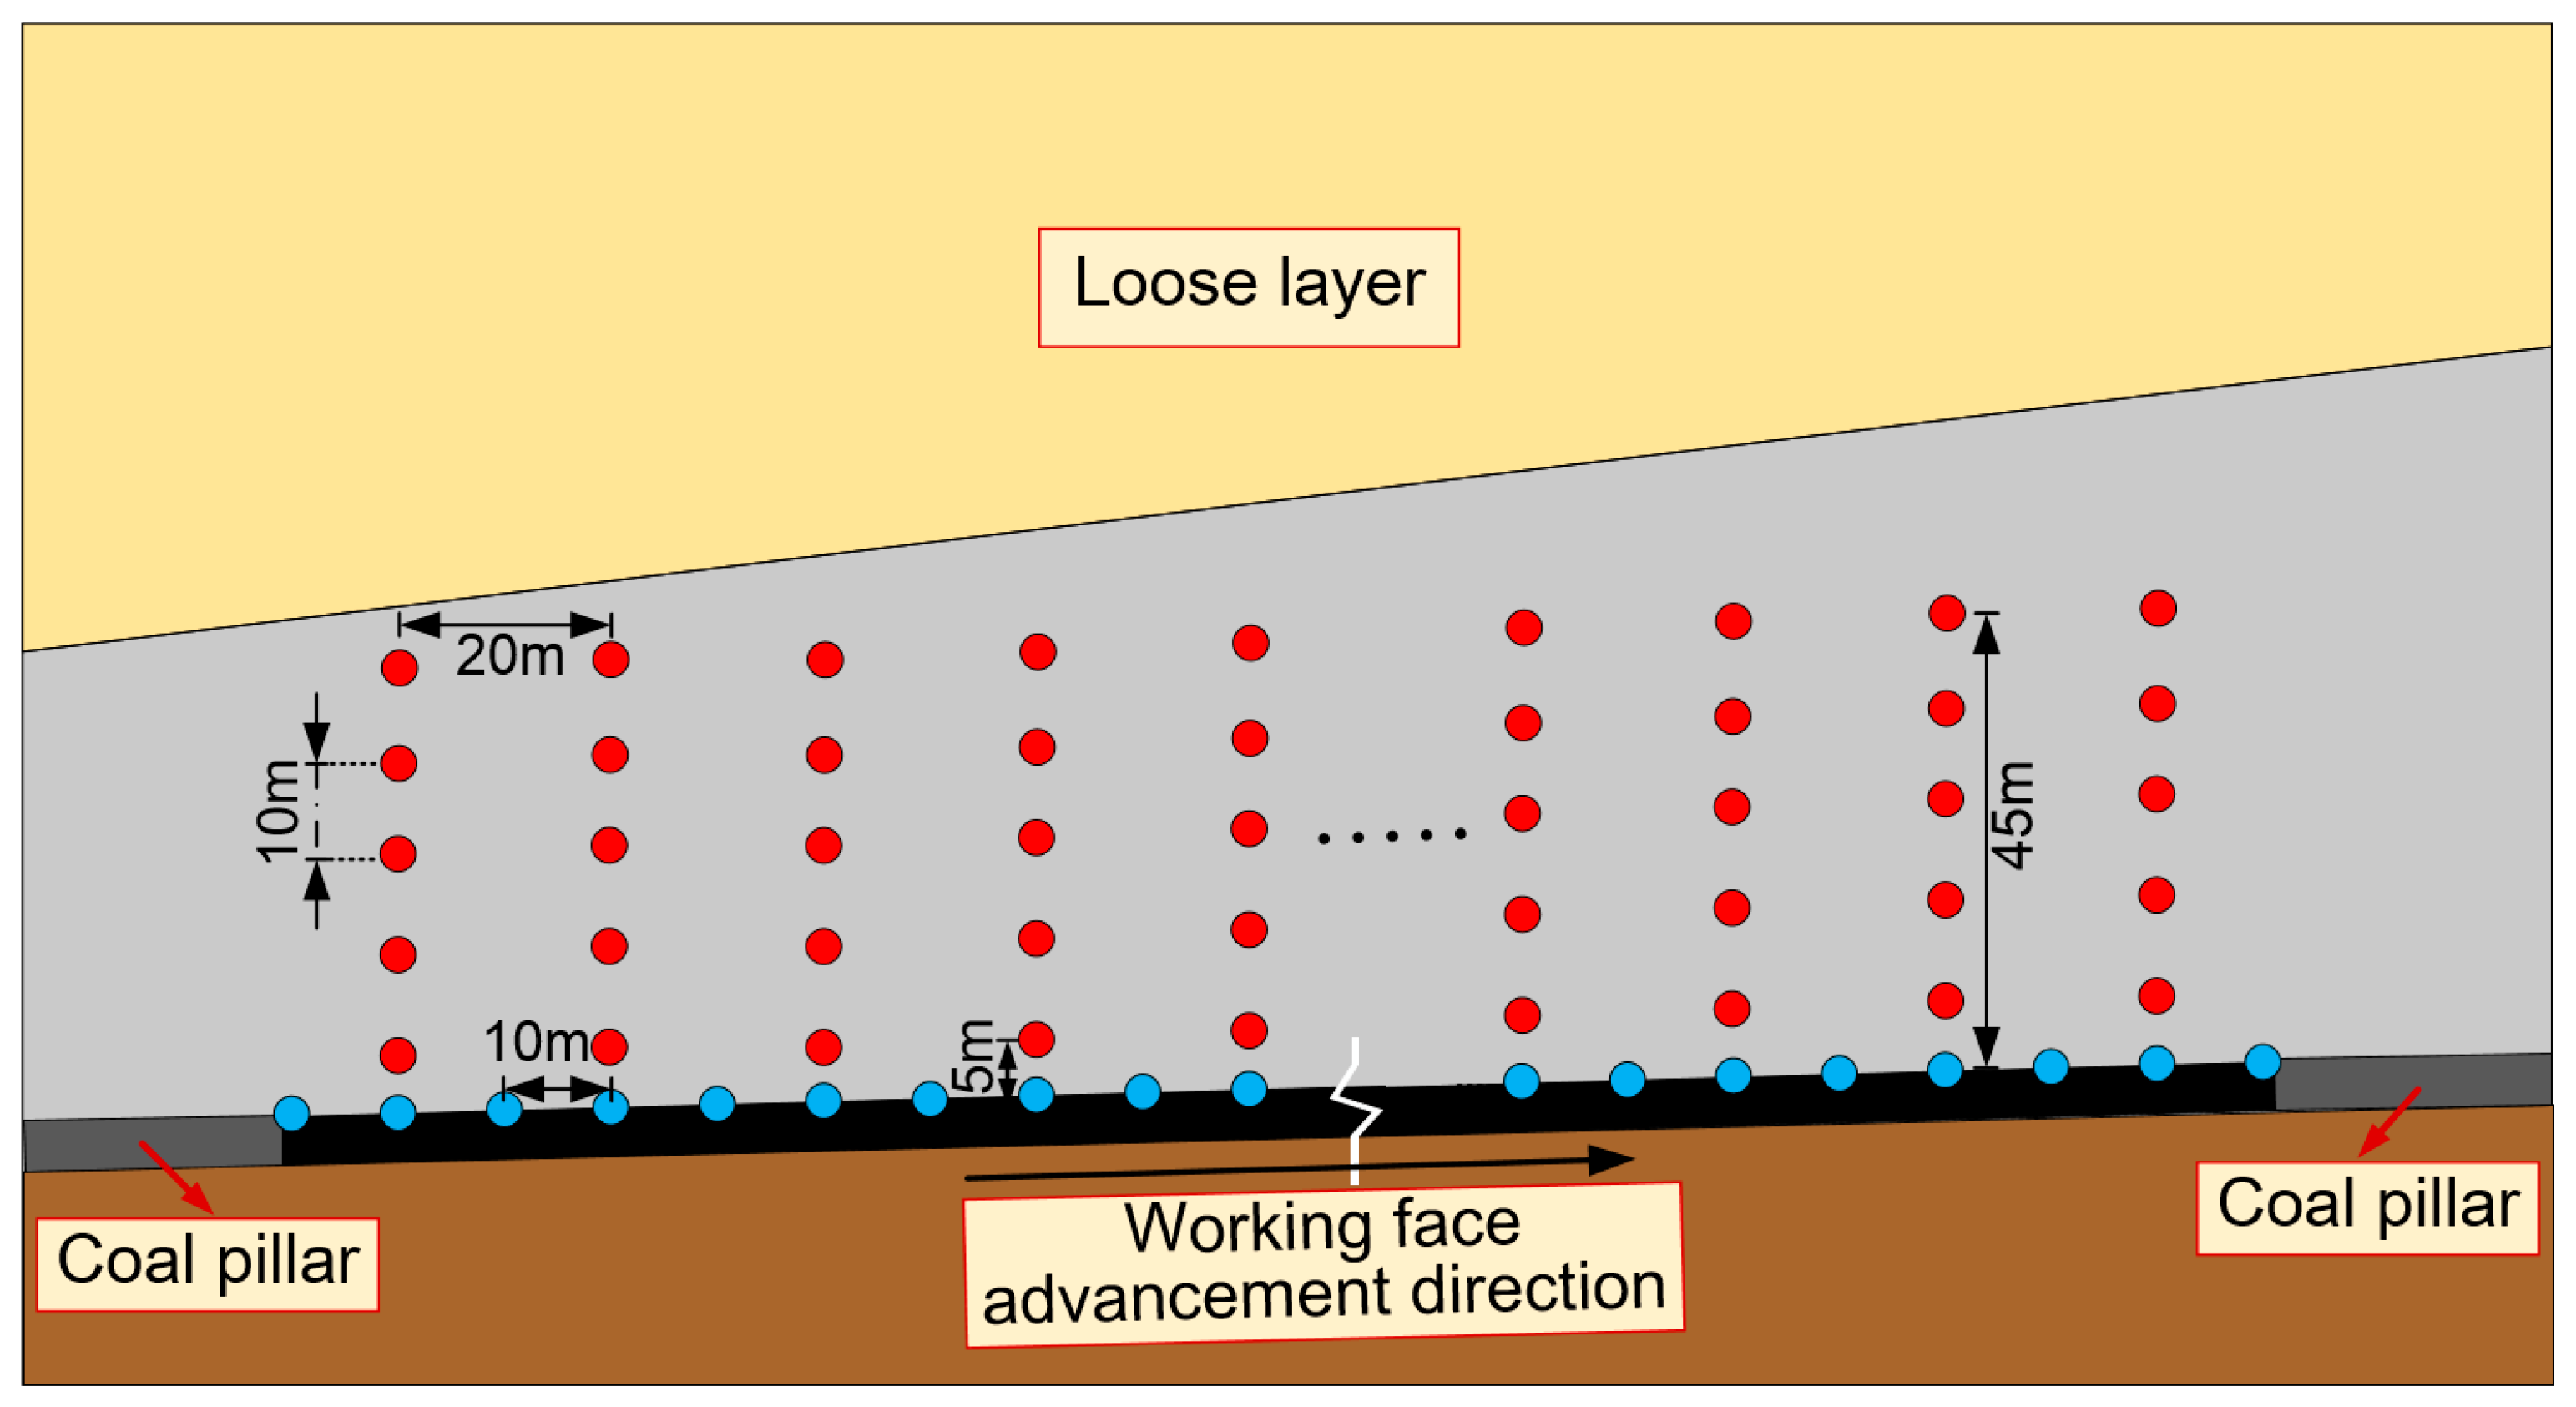
As seen in
Figure 6, measurement sites are set up during model setup to examine the movement and fracture patterns of the overlying strata. The red points represent displacement measurement points, while the blue points indicate stress measurement points. The displacement measurement points are arranged vertically, with 19 vertical lines, each containing 5 measurement points. The most distant point from the coal seam is located 45 m above it. The stress measurement points are spaced 10 m apart along the dip direction of the coal seam, with a total of 39 stress measurement points.
4. Numerical Simulation Analysis
4.1. Analysis of the Fracture Patterns of the Overlying Strata
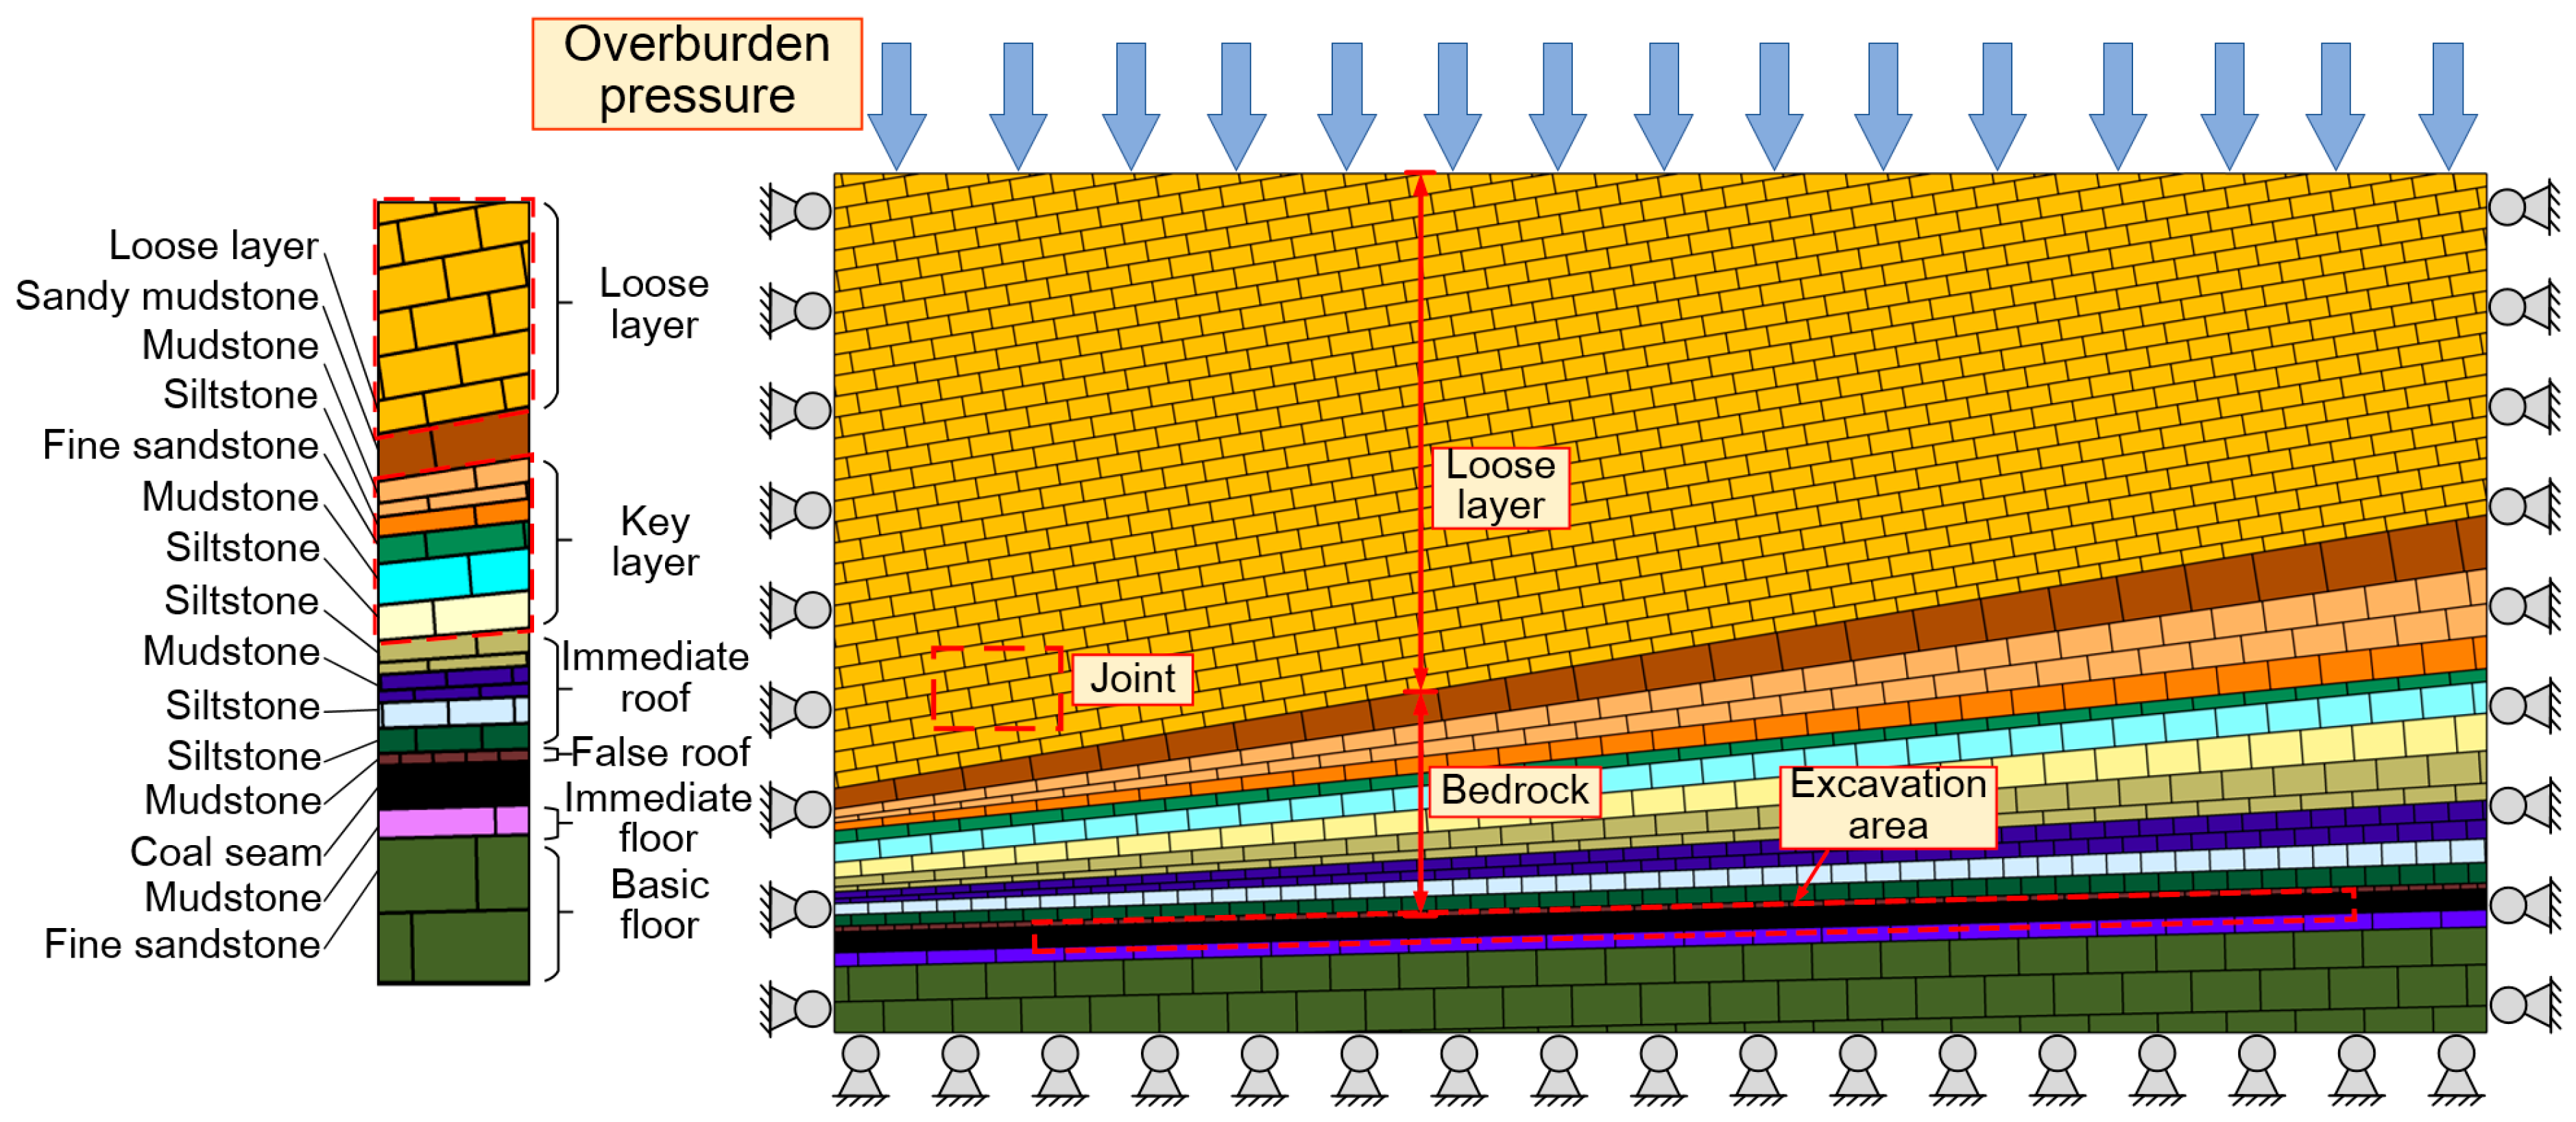
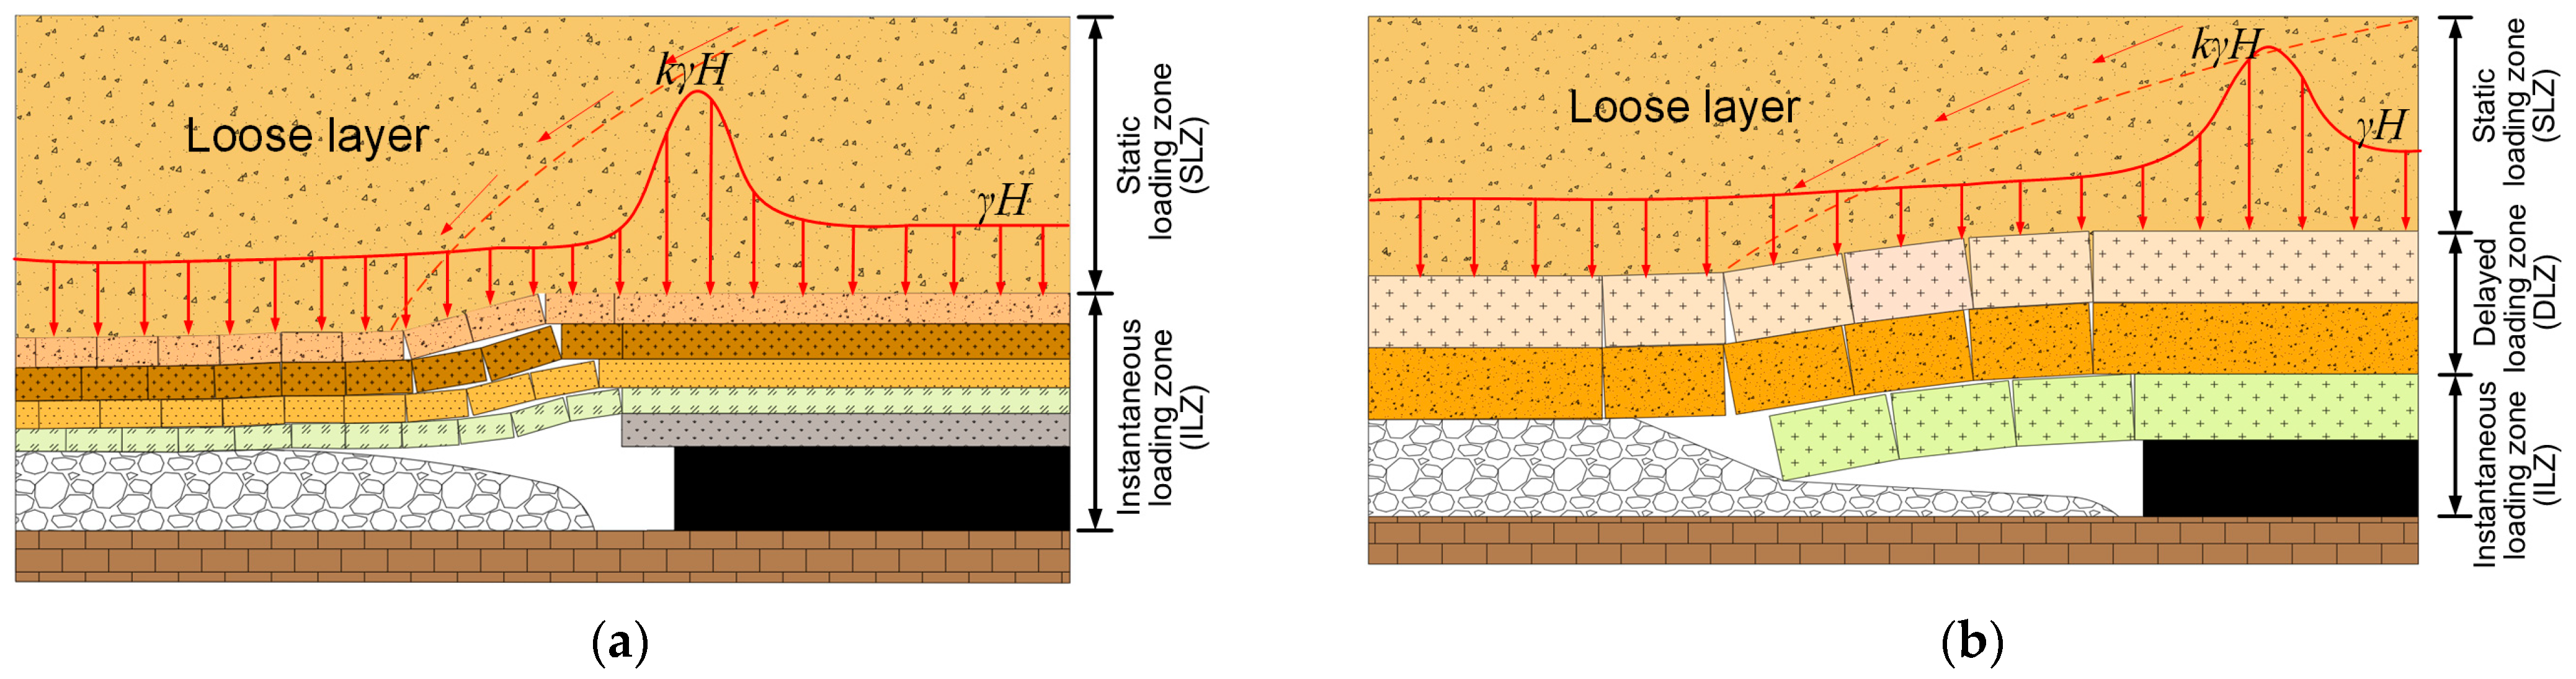
As the working face advances, the original stress balance within the rock strata is disrupted, leading to stress transfer. The breaking step distance and crushing degree of the overlying rock determine the size and mode of stress transfer. Therefore, if we want to study the law of stress change in the stope, we must first study the movement of the overlying rock and its breaking law. Aiming at the problem of bedrock fracture, the load three-zone theory, which was proposed by Jiang et al. [
37], divides the overlying strata on the working face into three zones: the immediate loading zone (ILZ), delayed loading zone (DLZ), and static loading zone (SLZ). The working face advances, causing the immediate loading zone to periodically collapse and break. After the working face advances, the immediate loading zone rock layer immediately fills the goaf, showing the characteristics of caving with mining. The delayed loading zone can form a stable bearing structure after the mining of the working face, and then gradually suspend, separate, and collapse over a period of time. The static load zone is less affected by mining, and continuous and uniform self-weight stress is mainly applied to the rock strata below it.
To clarify the fracture law of overlying strata under the condition of thick loose layers and unequal thickness bedrock, the excavation area in the coal seam model is excavated from left to right. The movement patterns of the overlying strata corresponding to different mining distances, as illustrated in
Figure 7, are observed as the working face progresses. The figure indicates that when the working face advances 40 m (
Figure 7a), the pseudo-roof composed of thin mudstone and low-tensile-strength sandstone in the immediate roof first experiences caving. Due to the short mining distance, the coal mass on both sides of the goaf functions as coal pillars, providing effective support to the rock layers above the sandstone. Consequently, only a few small fractures develop in the rock layers near the sandstone in the middle section above. As the mining advances 80 m (
Figure 7b), the increasing mining distance leads to a complete collapse of the rock layers within the immediate roof range. The pseudo-roof mudstone and the first layer of sandstone collapse as mining progresses. As the suspend distance of the second layer of sandstone increases, the rock layers first bend without detaching. Subsequently, the weaker mudstone above generates fractures and detachment phenomena. The second layer of sandstone, under its own weight and the pressure from the mudstone above, begins to collapse and detach from its layer. When the mining advances 120 m (
Figure 7c), the rock layers collapse to the key layer position. At this position, the sandstone briefly suspends, and fractures begin to appear at the middle part of its lower surface. These fractures rapidly develop from the bottom upwards toward the overlying mudstone and fine sandstone layers, causing the overlying strata to exhibit a trend of bending and collapsing toward the goaf. When mining advances to 160 m (
Figure 7d), the bedrock overall bends and undergoes collapse, forming a trapezoidal collapse shape. The number of fractures between rock blocks increases, leading to large-scale detachment phenomena occurring between the rock layers. The overall collapse of the bedrock creates space for the downward movement of the loose layer, which subsequently moves toward the goaf, resulting in an increasing amount of subsidence. When mining advances 200 m (
Figure 7e, the bedrock gradually thickens, and the effect of the key layer begins to become more prominent. After mining, only the pseudo-roof mudstone collapses, while the bedrock exhibits bending and subsidence. The amount of detachment decreases, and the collapse step increases. When the working face advances 260 m (
Figure 7f), the suspended distance of the strata above the goaf increases with the progression of the mining distance, and the thickness of the bedrock above the coal wall near the working face increases. The roof strata near the side of the working face remain relatively stable, and no collapse phenomenon is observed. When the working face is advanced by 320 m (
Figure 7g), the behavior of overburden rock breaking is similar to that observed when the working face has advanced by 260 m. The rock stratum exhibits significant collapse, while the key layer position displays a bending and sinking profile. As mining progresses, the roof strata located farther from the working face collapse more completely. When the working face advances 380 m (
Figure 7h), the thickness of the bedrock continues to increase, the key layer effect is more prominent, and the caving step distance of the overlying rock further increases. After coal extraction, the pseudo-top mudstone experiences immediate collapse, while the overall stability of the bedrock remains intact. This stability is evidenced by a reduction in the number of separation layers and cracks, as well as a general bending deformation of the rock layer.
The 2303 working face is mined under the condition of a thick loose layer, and the thickness of the loose layer and bedrock varies greatly. The tensile shear resistance and bending resistance of the loose layer are weak. The fracture morphology of overburdened rock shows different fracture effects with the change of mining depth, bedrock thickness, bedrock strength, and other factors. When the bedrock thickness is small, the bedrock is generally weak, and the key layer effect is not obvious. Consequently, the load-bearing three zones degrade to a structure described as “ILZ + SLZ”, with the bedrock collapsing and filling the goaf as the mining face progresses, as illustrated in
Figure 8a. After coal seam mining, the application of high static load pressure in the thick loose layer induces plastic fractures in the rock mass above the goaf, progressing from the bottom to the top. The fragmented rock mass is characterized by small sizes and weak bearing capacity, making it challenging to establish a stable hinged structure, thereby increasing the likelihood of further breakage. As the thickness of the bedrock increases, as illustrated in
Figure 8b, the key layer effect becomes more pronounced, resulting in enhanced bearing capacity of the bedrock. The bedrock adjacent to the coal wall develops a “cantilever beam” structure, which exhibits upper tension and lower compression, allowing it to support part of the self-weight stress generated by the overlying strata, consequently increasing the caving step of these strata.
To summarize, the bedrock thickness gradually increases with the advancement of the working face, leading to a more pronounced key layer effect and an enhancement in the bearing capacity of the bedrock. Consequently, the three zones of the overburden load transition from the “ILZ + SLZ” structure to the “LZ + DLZ + SLZ” structure. The fracture pattern of the overlying strata also changes from fragmented plastic failure that occurs progressively during mining to block-type failure. The collapse step also increases as the bedrock thickness increases.
4.2. Analysis of Movement Law
The subsidence of overburdened rock directly reflects the extent of breaking and caving in the overlying strata. Studying the subsidence at different heights helps assess the degree of strata separation and the stability of the surrounding rock. Based on the findings from overburdened rock subsidence, the support structure can be designed and optimized to enhance mining safety and economic efficiency, while also reducing the risk of sudden accidents. Therefore, studying the movement law of overburdened rock is an essential component of the mine safety production process.
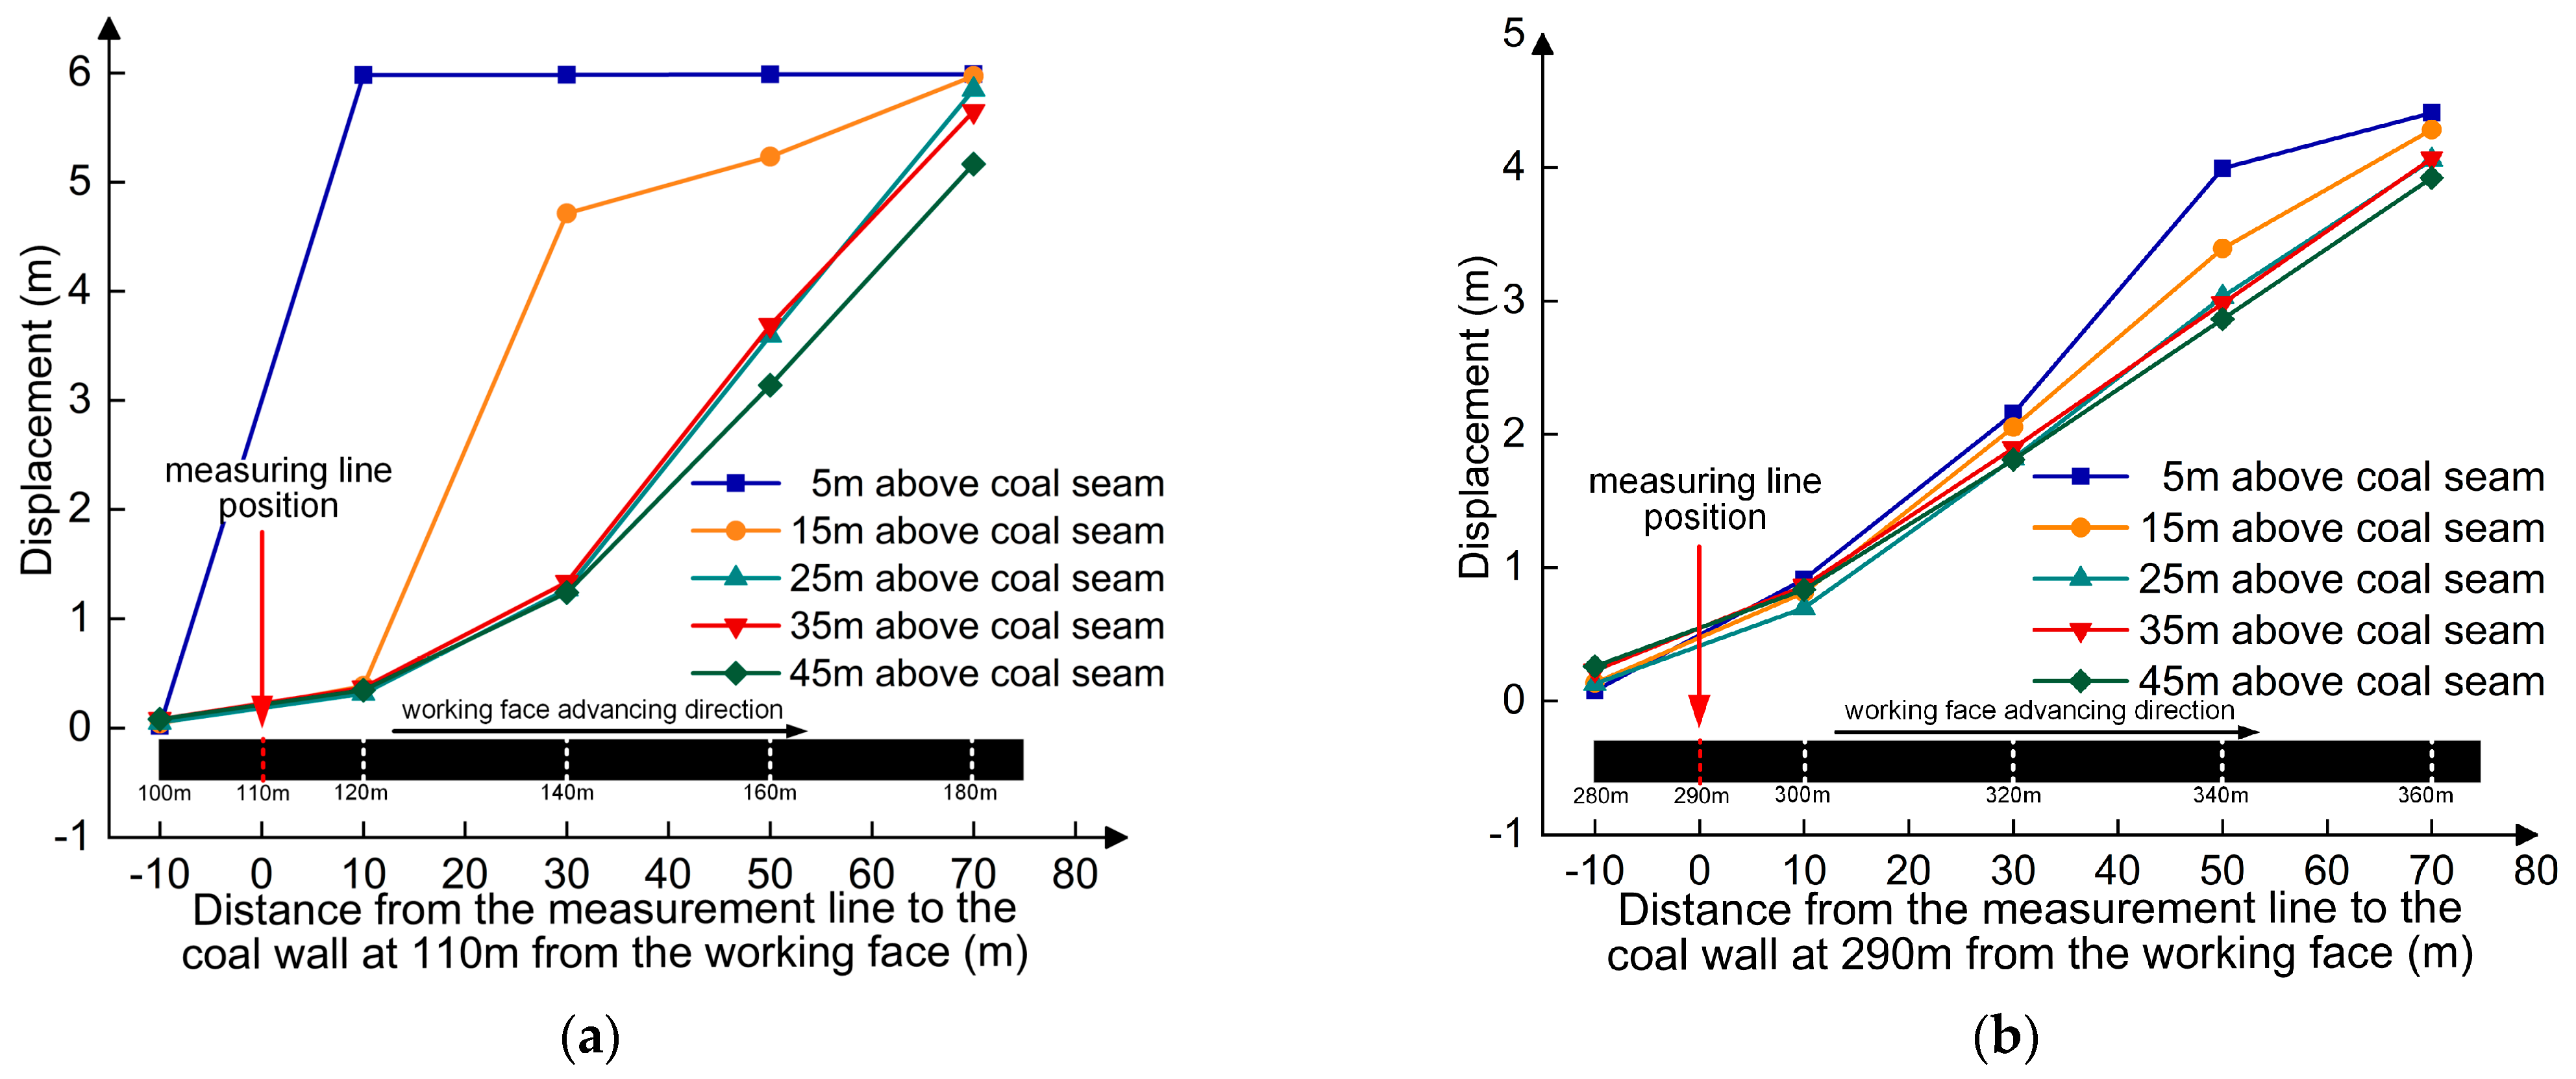
To investigate the movement law of overlying strata, the subsidence values of different strata are obtained by arranging displacement measuring points. After the excavation of the coal seam in the working face is completed, the final subsidence curve of overlying strata is illustrated in
Figure 9, which monitors subsidence at 5 m, 15 m, 25 m, 35 m, and 45 m above the coal seam. These results indicate that, for mining face lengths ranging from 30 m to 50 m and 350 m to 370 m, the subsidence of strata located more than 25 m above the coal seam remains within a 2 m range. The existence of border coal pillars on both sides of the mined region is responsible for this phenomenon, which restricts the movement of the roof strata above these pillars. Additionally, the upper strata are compacted under the high static load of the thick loose layer, thereby providing a certain bearing capacity that mitigates the subsidence of overlying strata. Overall, the subsidence of the overburdened rock decreases from an average of 5.8 m to an average of 4.5 m, indicating a trend of decreasing subsidence with increasing working face length. There are two primary reasons for this phenomenon. One is that the rock has bulkiness, thus preventing the subsidence of the upper rock layer from aligning closely with the coal seam’s mining height. The other is that as the working face advances, the thickness of the overlying bedrock increases, exerting a pressure-bearing effect on the high stress generated by the loose layer. This results in a decrease in pressure on the rock mass at the lower part of the key layer, leading to a reduction in both fragmentation and subsidence of the rock mass.
To further compare the movement behavior of rock strata under different bedrock thickness conditions, the 110 m and 290 m survey line positions are selected. The corresponding bedrock thicknesses of 67 m and 91 m are chosen as the comparison objects. As the working face advances, the subsidence of rock layers at different elevations above the coal seam is observed at these locations. The monitoring results are illustrated in
Figure 10. According to the subsidence data presented in
Figure 10a, it is clear that as the coal seam is mined near the 110 m survey line, the rock strata at 5 m above the coal seam first separate and collapse and the final collapse height is 6 m. As the working face progresses to 140 m, meaning the coal wall is 30 m from the survey line, and the rock layer of about 15 m above the coal seam is separated from the upper rock layer, caving and filling the goaf; The collapse patterns of rock layers located 25 m to 45 m above the coal seam follow a comparable trend. The caving speed is relatively slow within the 30 m distance from the coal wall of the working face to the measuring line position, with a subsidence of about 1 m. However, once the advancement of the working face exceeds the measuring line position by 30 m, the overburden-caving speed accelerates. Ultimately, when the coal wall of the working face is 70 m away from the measuring line position, the rock strata between 25 m and 45 m completely collapse, with a caving height of approximately 5.5 m.
According to the subsidence of rock strata depicted in
Figure 10b, it is evident that when the coal seam is excavated near the 290 m survey line, the overall subsidence of the rock mass above the coal seam is minimal, with subsidence measuring less than 1 m. When the working face progresses an additional 30 m, reaching a mining distance of 320 m, the subsidence of the strata overlying the coal seam starts to rise progressively, while the degree of interlayer separation remains small. At this stage, the difference in subsidence between the strata located 5 m and 55 m above the coal seam is within 0.5 m, indicating minimal interlayer separation and relatively intact overlying strata. When the coal seam is mined near the 290 m survey line, the overall subsidence of the rock mass above the coal seam is minimal, with subsidence measuring less than 1 m. As the working face advances by an additional 30 m, reaching a mining distance of 320 m, the subsidence of the overlying strata above the coal seam begins to increase gradually, while the degree of interlayer separation remains small. At this stage, the difference in subsidence between the strata located 5 m and 55 m above the coal seam is within 0.5 m, indicating minimal interlayer separation and relatively intact overlying strata. As the working face progresses to 340 m, bringing it 50 m away from the survey line, a more pronounced increase in subsidence is observed in the strata located 5 m and 15 m above the coal seam, while the subsidence of other rock strata increases linearly as the working face advances. As the working face continues to advance an additional 70 m, the peak subsidence of the rock strata is around 4.5 m.
By analyzing the overall and localized migration patterns of the overburden, it is evident that when the bedrock is thin, the rock strata are more susceptible to plastic failure under the self-weight stress imposed by the overlying loose layer. This leads to shorter caving steps, more pronounced upward fracture propagation, and larger interlayer separations, displaying a distinct “caving with mining” behavior. As the bedrock thickness increases, the caving step of the overburden increases, subsidence decreases, the integrity of the overburden improves, and interlayer separations become smaller. This phenomenon arises due to the enhanced bearing capacity of the bedrock as its thickness increases, making the key layer effect more pronounced and enabling the overlying rock to develop a stable beam-like structure. As a result, the roof rock layer exhibits less collapse and subsidence with the advancement of the working face, while the caving step length gradually increases.
4.3. Stress Evolution Patterns
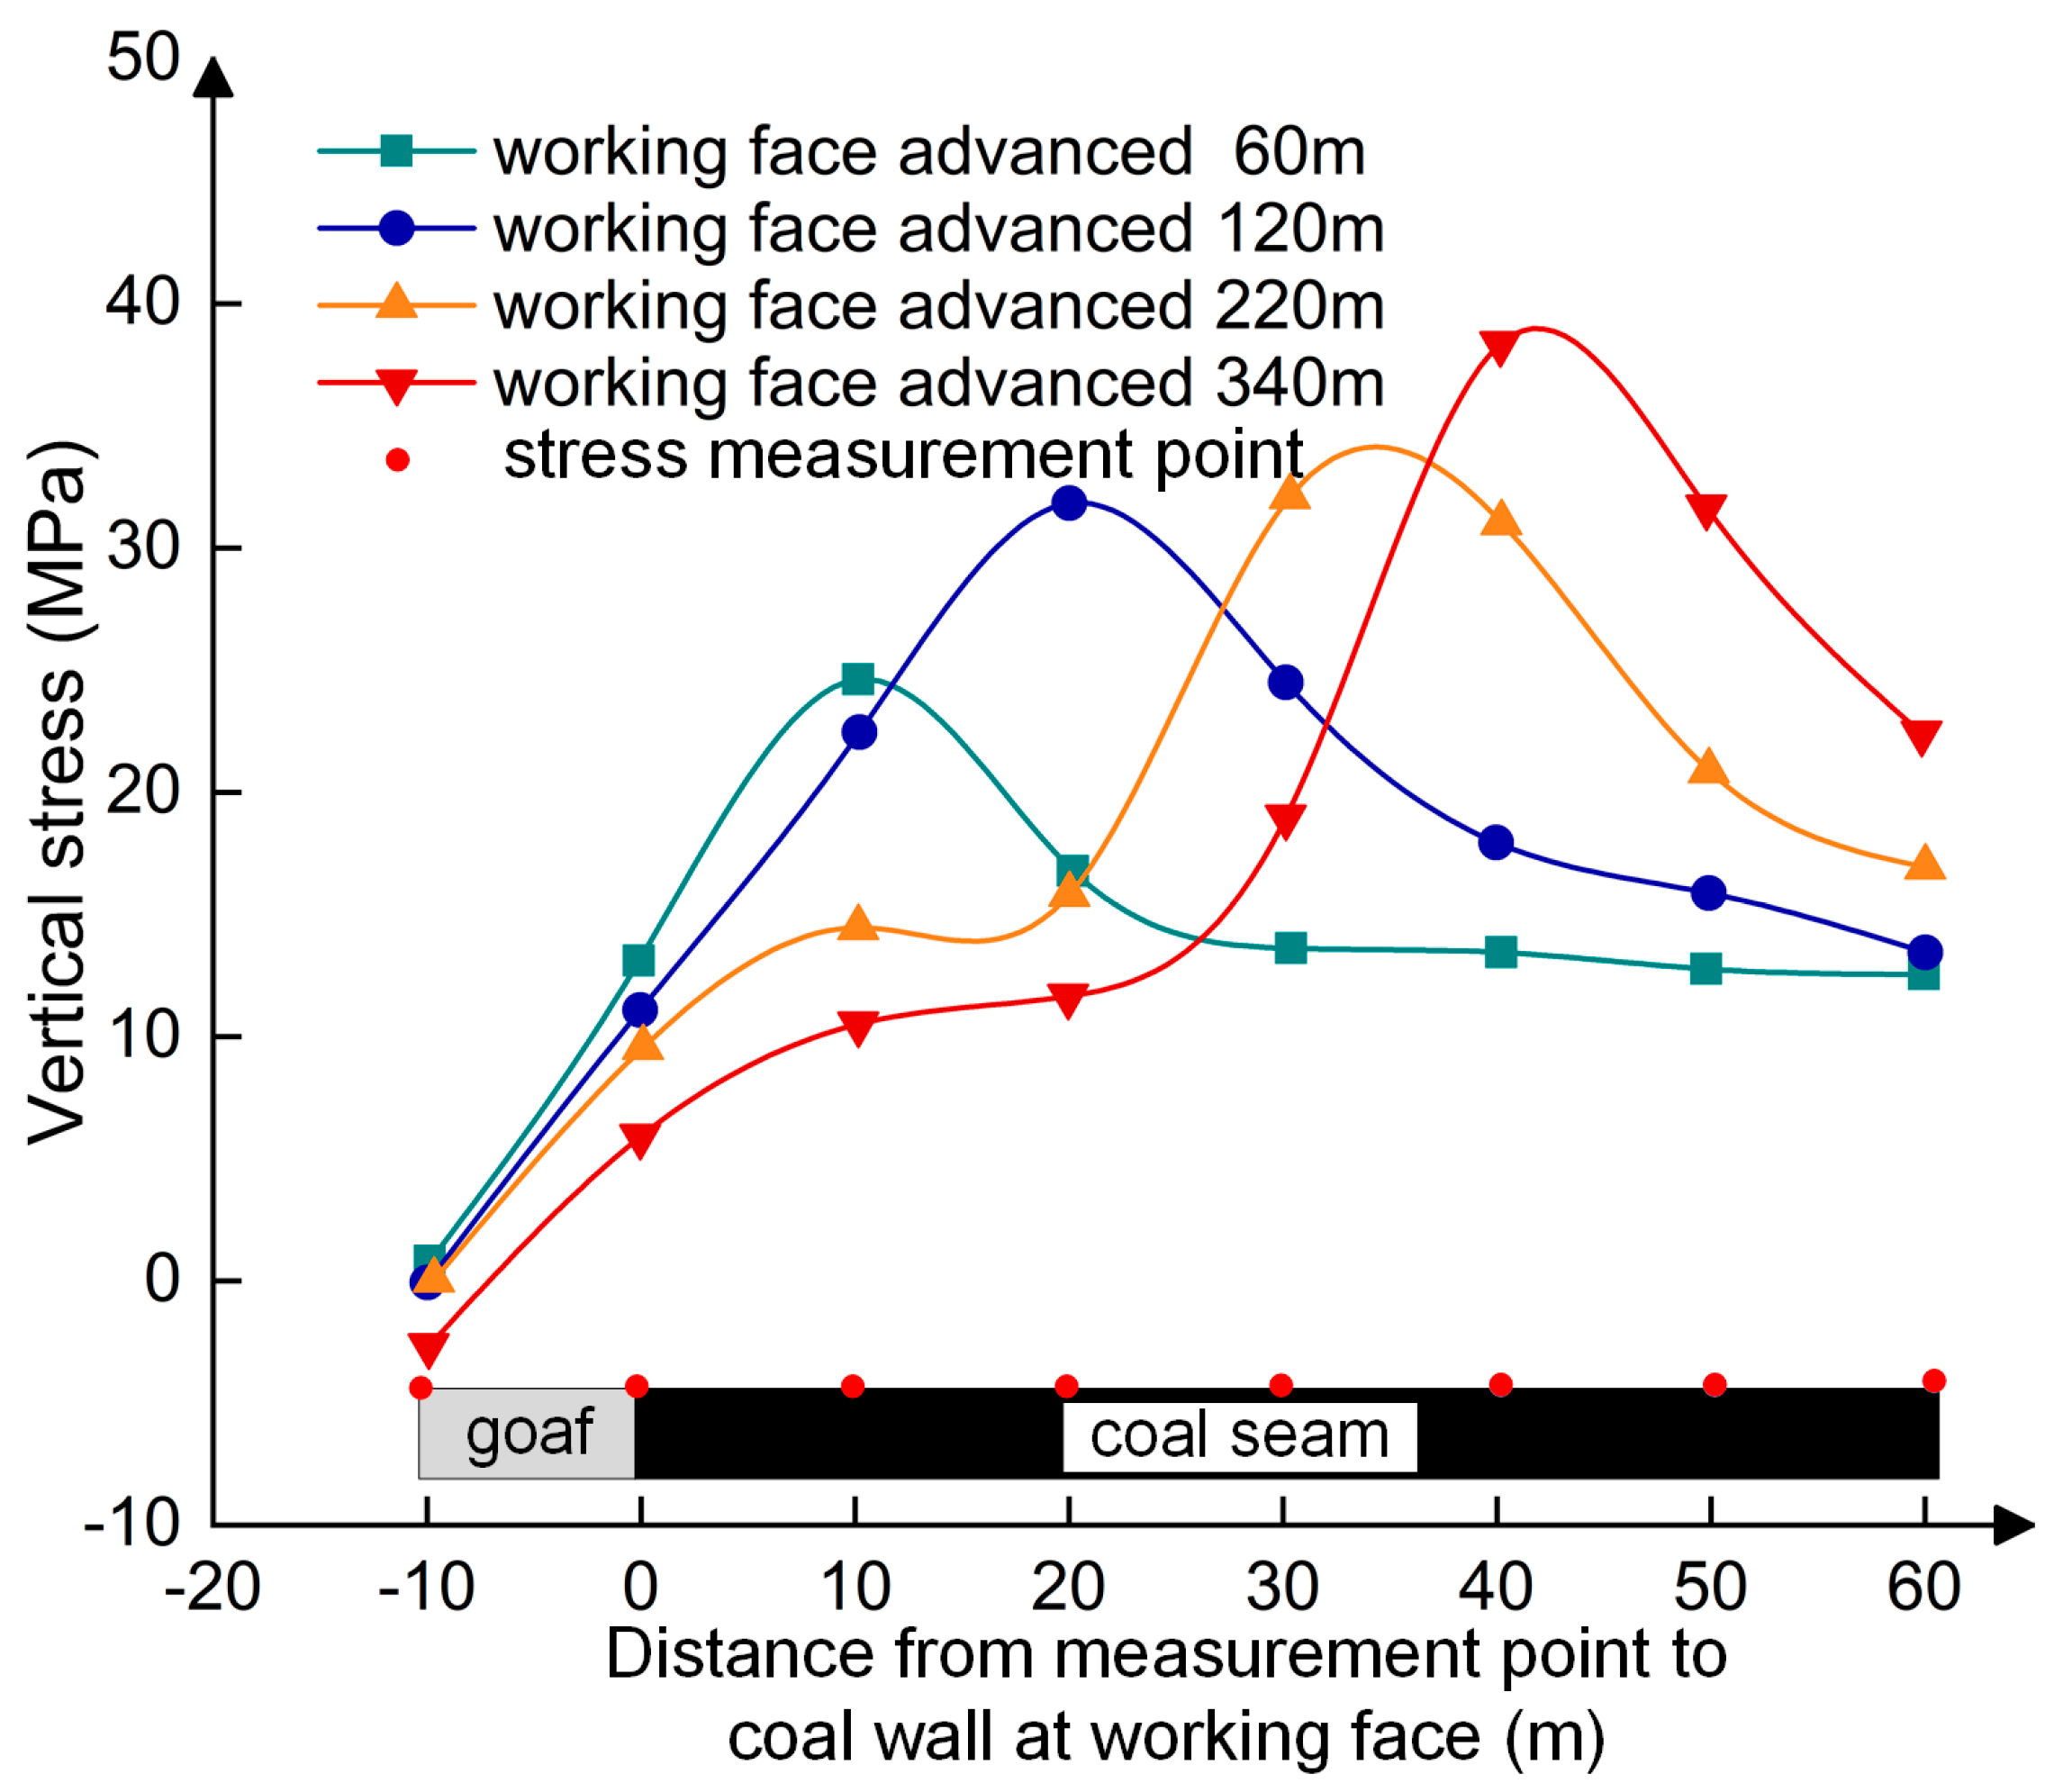
Following coal seam extraction, the immediate roof and overlying loose layers move toward the goaf, disrupting the original stress equilibrium. This shift causes stress to transfer toward the front of the working face, resulting in stress levels that significantly exceed the original in-situ stress, thereby creating a stress peak. To investigate the evolution of stress in the overlying strata, monitoring points are installed above the coal seam to record the roof stress at various distances from the mining face. The resulting vertical stress diagram is shown in
Figure 11.
As the working face advances to 60 m and 120 m, the vertical stress in the roof exhibits a trend of initially increasing and then decreasing. At a working face advancement of 60 m, the stress peak occurs approximately 11 m ahead of the coal wall, reaching a value of around 26 MPa, which subsequently decreases rapidly to the in-situ stress level. As the working face advances to 120 m, the stress peak is observed about 20 m ahead of the coal wall, with a value of approximately 33 MPa, before gradually returning to the in-situ stress level. At advancements of 220 m and 340 m, the stress distribution ahead of the working face follows a similar pattern. The stress initially increases slowly within a range of about 20 m ahead of the coal wall before rapidly rising to the stress peak. As the working face progresses, the stress peak continues to shift toward the coal wall, ultimately reaching values of 33 MPa and 38 MPa at 34 m and 42 m ahead of the working face, respectively, accompanied by a broader range of stress influence. The stress diagram indicates that as the working face advances, the bedrock thickness gradually increases, while the peak stress also rises and shifts deeper toward the coal wall.
To further study the stress variation in the overburden, the distribution of the maximum principal stress during the mining process was obtained through numerical simulation, as shown in
Figure 12. As the working face advances, a high-stress compression zone resembling a “triangle” forms above the coal pillar. The extent of this compression zone changes as the working face progresses.
Figure 12a illustrates the distribution of maximum principal stress after the working face has advanced 60 m. At this stage, the high-stress compression zone is primarily located above the coal pillars on both sides, exhibiting a relatively limited horizontal extent. The self-weight of the overlying rock is the principal factor contributing to the formation of the compression zone at this point.
Figure 12b depicts the maximum principal stress distribution following an advancement of 160 m. Here, the extent of the high-stress compression zone has increased, particularly above the coal wall of the working face, where the compression zone has expanded significantly. The expansion of the compression zone is attributed to the combined effects of the self-weight of the overlying rock and the transferred stress from the overburden above the goaf.
Figure 12c presents the maximum principal stress distribution after the working face has advanced 220 m. At this stage, the overburden on the left side of the goaf has completely collapsed, while the rock mass on the right side remains in a suspended state. The compression zone has further expanded into the rock mass above the goaf, merging with the compression zone on the left side, thereby gradually forming a continuous high-stress compression arch.
Figure 12d shows the maximum principal stress distribution when the working face has advanced 280 m. At this stage, the goaf rock mass has fully collapsed and compacted. The stress compression zone has increased, and as the bedrock thickness has increased, the compression zone above the coal wall has completely merged with the compression zone on the left side of the goaf, resulting in a larger-span high-stress compression arch. Consequently, the bearing capacity of the arch has improved, while the stress in the rock mass beneath the arch has decreased.
The analysis of vertical stress changes in the roof and the variations in maximum principal stress during the mining process indicates that the thickness variation of both the loose layer and the bedrock significantly influences the stress distribution induced by mining. As the thickness of the bedrock increases, the rock mass above the goaf progressively develops a robust load-bearing structure. The bearing structure is combined with the compressive rock mass below the goaf to form an arch structure with bearing capacity, so that the stress of the rock mass below the arch structure is reduced, and the bearing structure has the effect of transmitting stress. The stress generated by the rock mass above the goaf is transmitted to a farther distance in front of the coal wall by the bearing structure. The stronger the bearing capacity is, the more the transmitted stress is, and the wider the influence range is. Therefore, the phenomenon that the peak stress shifts to the depth in front of the coal wall with the increase of bedrock thickness is formed.
4.4. Mechanical Analysis of Key Layer Failure in Thick Loose Layer
The analysis of bedrock failure evolution under conditions of a thick loose layer reveals that variations in the thickness of both the bedrock and the loose layer result in differences in stress transmission mechanisms, distribution patterns, and modes of roof failure. These variations significantly impact roadway surrounding rock deformation and the development of effective control strategies. Consequently, examining the mechanical behavior of roof failure under varying bedrock thickness conditions is essential for ensuring the stability of roadway surrounding rock. This section further reveals the difference in the fracture distance of the key layer under unequal thickness bedrock conditions from the perspective of structural mechanics and compares it with the numerical simulation results.
4.4.1. Classification of Bedrock Thickness
To analyze the mechanical failure behavior of the roof strata, it is essential to first categorize the bedrock thickness. The classification of bedrock as thin or thick is determined by the relationship between the bedrock thickness and the heights of the caving zone and the water-conducting fracture zone. The water-conducting fracture zone refers to a region with water-conducting capacity that forms due to deformation, fracturing, and destruction of the overlying strata caused by coal mining activities. Bedrock that exceeds the height of the caving zone but is less than that of the water-conducting fracture zone is categorized as thin bedrock. Conversely, when the thickness of the bedrock surpasses the elevation of the water-conducting fracture zone, it is categorized as thick bedrock. The relevant calculation formulas are presented in
Table 2.
The compressive strength of the roof strata in this working face ranges from 72.36 MPa to 110.6 MPa, with a coal seam thickness of 6 m. Utilizing the aforementioned empirical formulas, the maximum height of the caving zone and the maximum height of the water-conducting fractured zone can be calculated as follows:
The maximum height of the water-conducting fracture zone measured at the working face is 76.79 m. According to the empirical formula, the predicted maximum height of the water-conducting fracture zone is 74.12 m, resulting in a 3.6% error between the calculated value and the actual measurement. Consequently, in this working face, bedrock with a thickness of less than 74 m is classified as thin bedrock, while bedrock with a thickness greater than 74 m is classified as thick bedrock. To analyze the breaking mechanical behavior of both the thin and thick bedrock sections during the continuous advancement of the working face, two stages—140 m and 240 m—are selected from numerous simulation results. This analysis focuses on the breaking force of the key layer in both bedrock sections. By examining the changes in vertical and horizontal stress at the 2303 working face during mining, and applying relevant mechanical principles and formulas, the suspension distance at which the key layer of the overlying rock breaks is deduced and calculated.
4.4.2. Mechanical Model of Key Layer in Thin Bedrock Section
When the working face advances to 140 m, the bedrock thickness measures 68 m, indicating a thin bedrock section.
Figure 13 illustrates the vertical and horizontal stress distribution associated with overburden mining at this stage. In this context, the positive values in the diagram should represent compressive stress, while the negative values should represent tensile stress. The diagram reveals that as the coal seam is mined, the direct roof strata experience a complete collapse, resulting in a vertical stress of approximately 7 MPa in the key layer, while the horizontal stress reaches about 15 MPa.
Based on the roof lithology and mining conditions of the working face, it is evident that under deep overburden with thick loose layers and thin bedrock, the reduced load-bearing capacity of the thin bedrock diminishes the key layer effect, thereby increasing the susceptibility of the working face roof to fracturing. The subsidence of roof separation and the generation of cracks often occur first in the middle of the goaf. With the advancement of the working face, the separation and cracks of the roof rock mass gradually develop to the upper and both sides and then the separated rock mass gradually suspends and breaks under the condition of self-weight stress and the pressure generated by the upper rock stratum. The rock mass above the goaf in the thin bedrock area forms a ’beam’ structure similar to the lower tension and upper compression so that the initial fracture position predominantly occurs in the mid-lower section of the rock stratum.
By analyzing the collapse of the roof strata in the thin bedrock area and the stress of the overlying strata in the working face, based on the mechanical model of the simply supported beam of the sub-critical layer constructed by Zou [
38], the fracture mechanics model of the key layer in the thin bedrock area of the working face is established as shown in
Figure 14.
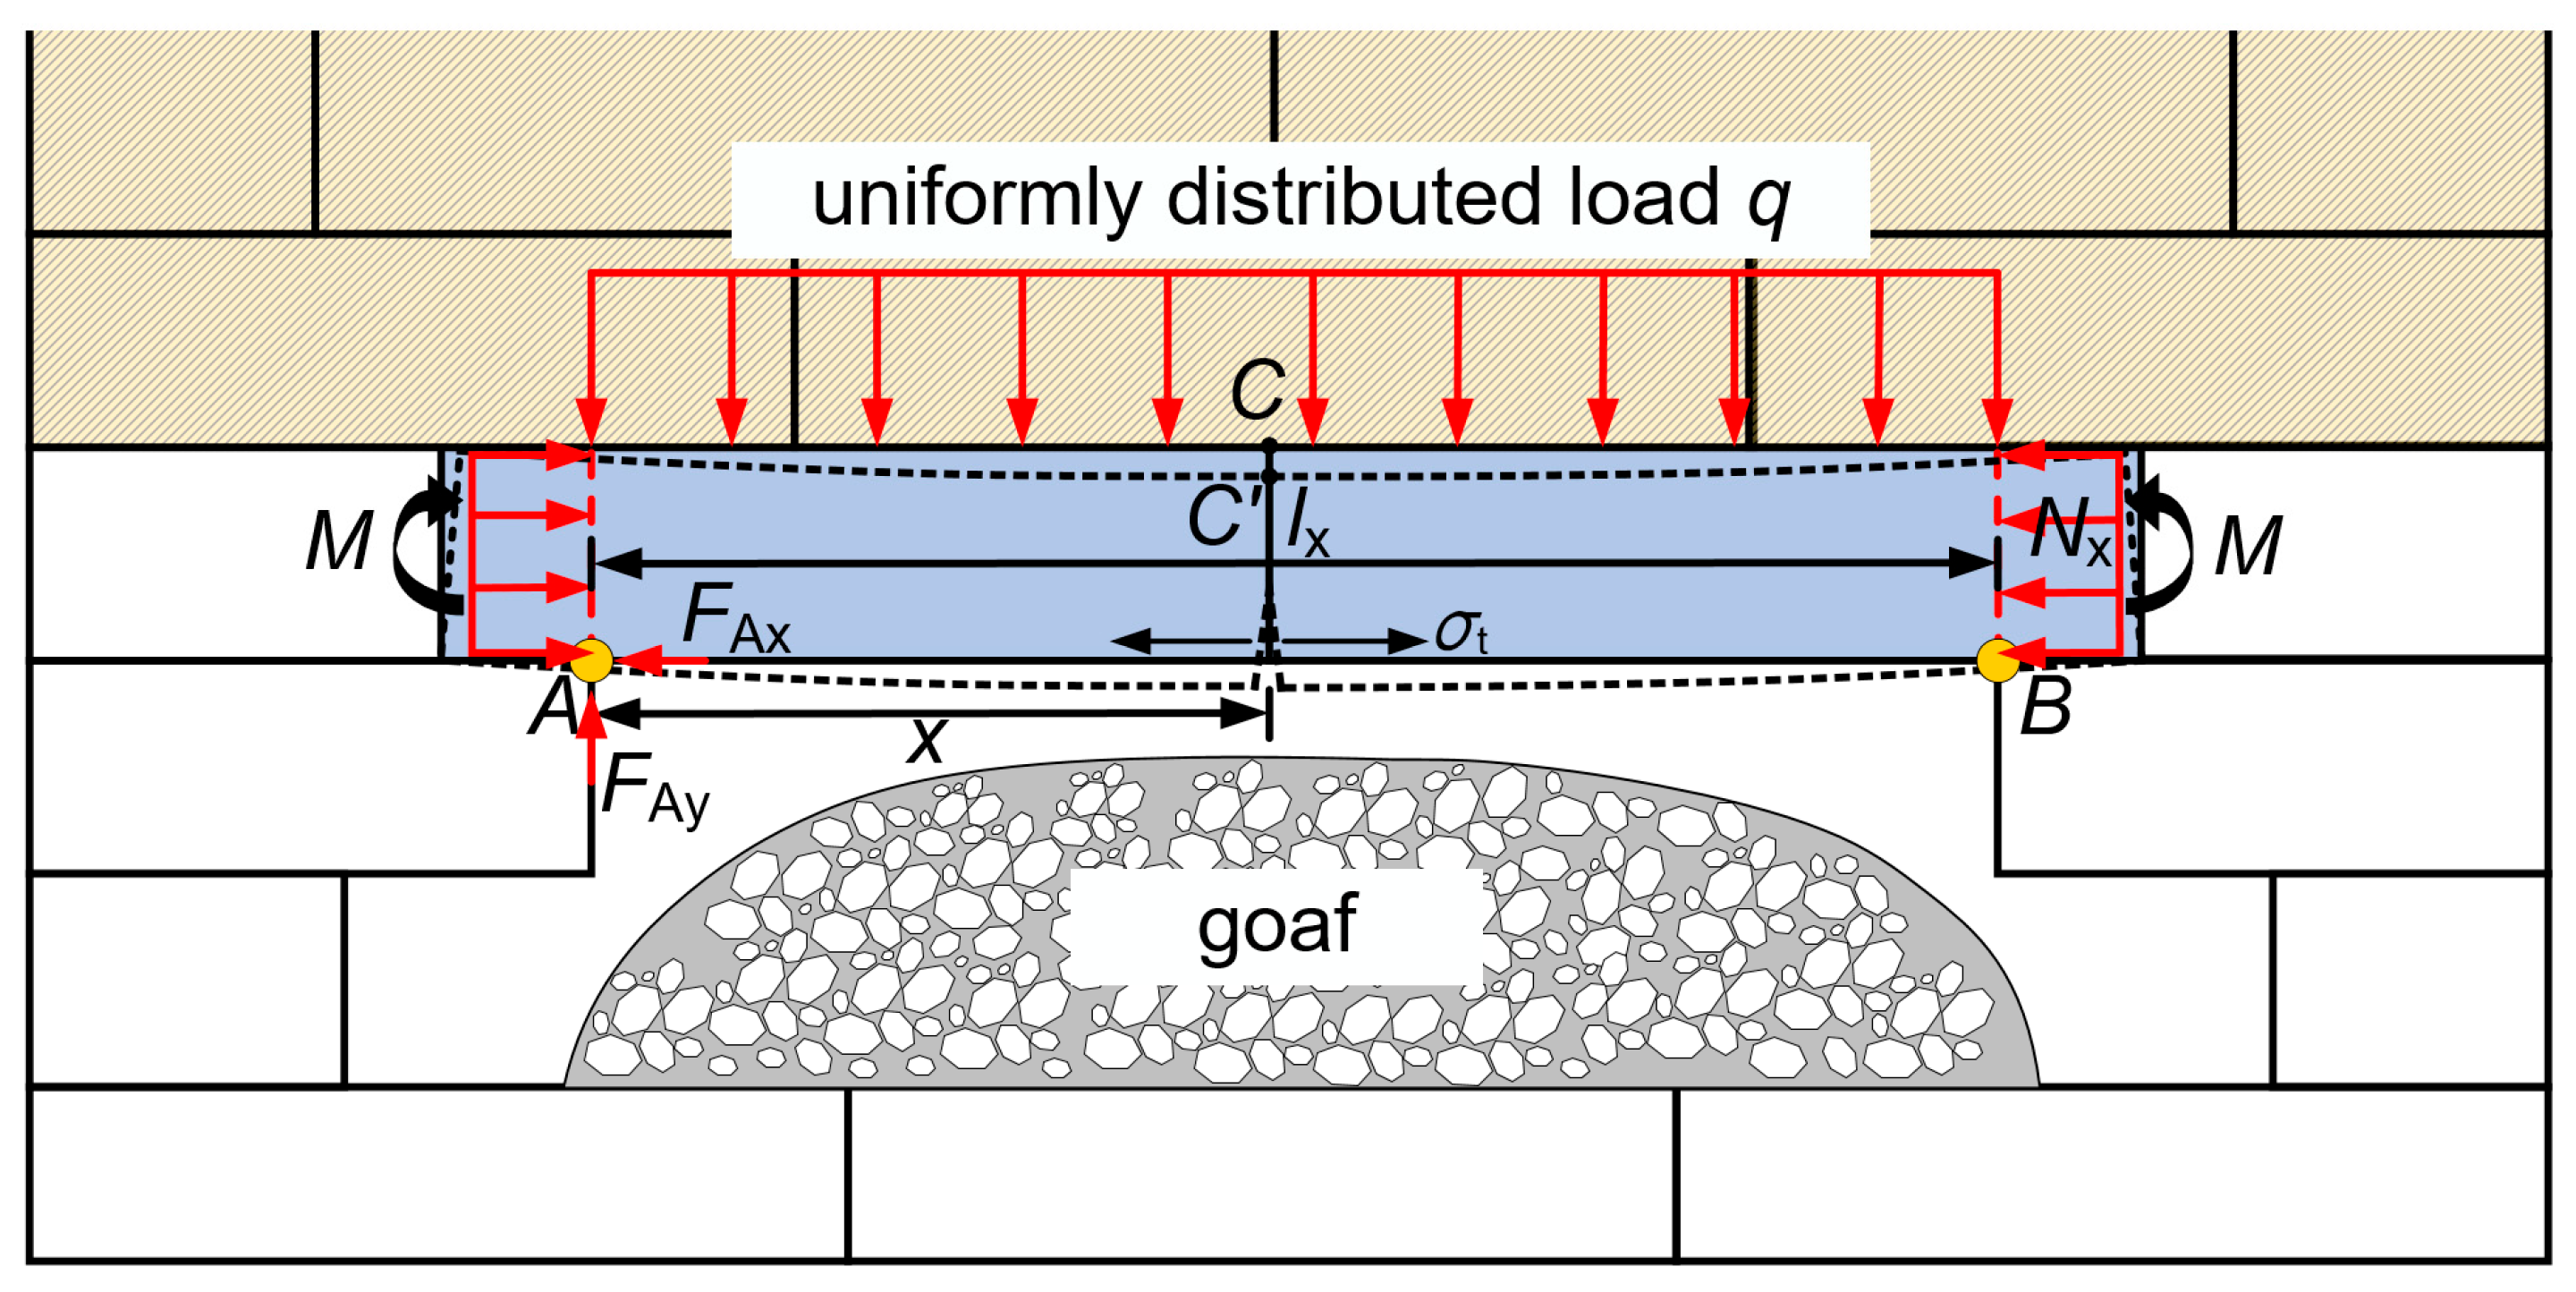
To facilitate the mechanical analysis, the following assumptions were adopted for the simply-supported beam model under thin bedrock conditions: (1) The x-axis is defined as the positive direction of the mining operation, the y-axis represents the vertical direction, and the z-axis is perpendicular to the xy-plane. The distance between the suspended roof and the beam is denoted as lx, while the distance from the center of the simply supported beam to the fixed support is denoted as x; (2) The axial displacement of the beam’s neutral axis is neglected, and the beam is assumed not to undergo bending in the z-direction; (3) In the mining suspended region, the object is treated as a simply supported beam with fixed ends. The vertical stress σyy generated by the overlying strata is considered as a vertically distributed load q on the beam, with horizontal constraints Nx and vertical constraints Fy from the adjacent rock mass on both sides, along with a moment constraint M, forming a simply supported beam model.
Under uniformly distributed loading on the upper surface of the simply-supported beam, the upper part of the simply supported beam is compressed, the lower part is pulled, and the midpoint C on the upper surface moves to C’. The distance between the center of the lower surface of the beam and the origin A is x, and the suspension distance of the beam is lx.
Within this model, the rotation angle of the beam is determined by both the beam’s slope and the shear deformation. Consequently, the deflection α comprises two parts, as expressed in the following equation:
where
αC is the rotation angle of the beam during minings; γ denotes the shear angle;
ωC is the deflection of the roof point C in the suspended area.
From the theory of material mechanics, the following equation is obtained:
where
Fsc is shear force;
T is the shear stiffness of rectangular beam,
T = 5
Ebh/[12 (1 +
v)].
Based on the theory of beam bending, the bending moment in the beam is directly proportional to the curvature. Combining this with the fundamentals of material mechanics, the expression for the bending moment
Mc is derived as follows:
where
E’ denotes the modified Young’s modulus,
E’ =
E/(1 −
v2),
v is Poisson ’s ratio;
I is the polar moment of inertia,
I =
bh3/12,
b is the width of the rectangular beam, take the unit width of 1 m,
h is the thickness of the rectangular beam.
According to the principles of material mechanics, the shear force is the first derivative of the bending moment, and the load is the first derivative of the shear force. Therefore, the following equation can be derived:
where
q is the uniform load on the simply supported beam, that is, the vertical stress
σyy.
By substituting Equation (5) into Equations (6) and (7), the following results are obtained:
Therefore, the mechanical equation of the simply supported beam is as follows:
The general solution of the deflection equation of the mechanical model of the simply supported beam in Equation (10) is as follows:
Substituting the general solution of Equation (11) into Equation (10), the following results can be obtained.
The fixed end position at the origin of the roof has the following mechanical relationship:
Substituting the particular solution in Equation (13) into Equation (12), the following results can be obtained:
By taking the coefficients in Equation (14) back to Equation (10) and Equation (12), the equations of bending deflection
ωC and bending moment
MC can be obtained as follows:
According to the principle of stress superposition, the equation of the maximum tensile stress and the maximum compressive stress of the beam can be obtained as follows:
In a simply supported beam, compressive forces act on the upper portion, while tensile forces affect the lower portion. This typically results in an initial fracture occurring at the midpoint of the lower surface. Therefore, the potential for beam failure can be assessed by comparing the rock’s tensile strength, [
σt], with the maximum tensile stress, as follows:
Substituting [
σt] from Equation (17) into Equation (16), the maximum cantilever span
lxmax for the beam under no-failure conditions is obtained as follows:
When the working face is mined to 140 m, the collapse height of the roof overburden measures approximately 25.5 m, while the suspension distance is around 93 m. The tensile strength of the siltstone at the key layer is approximately 3.6 MPa, and the total thickness of the key layer is about 30 m. The stress cloud diagram indicates a vertical stress of 7 MPa and a horizontal stress of 15 MPa. According to Equation (16), the maximum tensile force,
σtmax, is calculated to be 2.18 MPa. As per Equation (17), the beam remains intact at this stage. By substituting the tensile strength of the rock into Equation (18), it is evident that the maximum suspension distance,
lxmax, is 97.8 m. When mining progresses to 160 m, the suspension distance increases to approximately 116 m, surpassing the maximum suspension distance. This indicates that at a depth of 160 m, the key layer position of the thin bedrock section is likely to break and collapse, which aligns with the breaking results depicted in
Figure 7d.
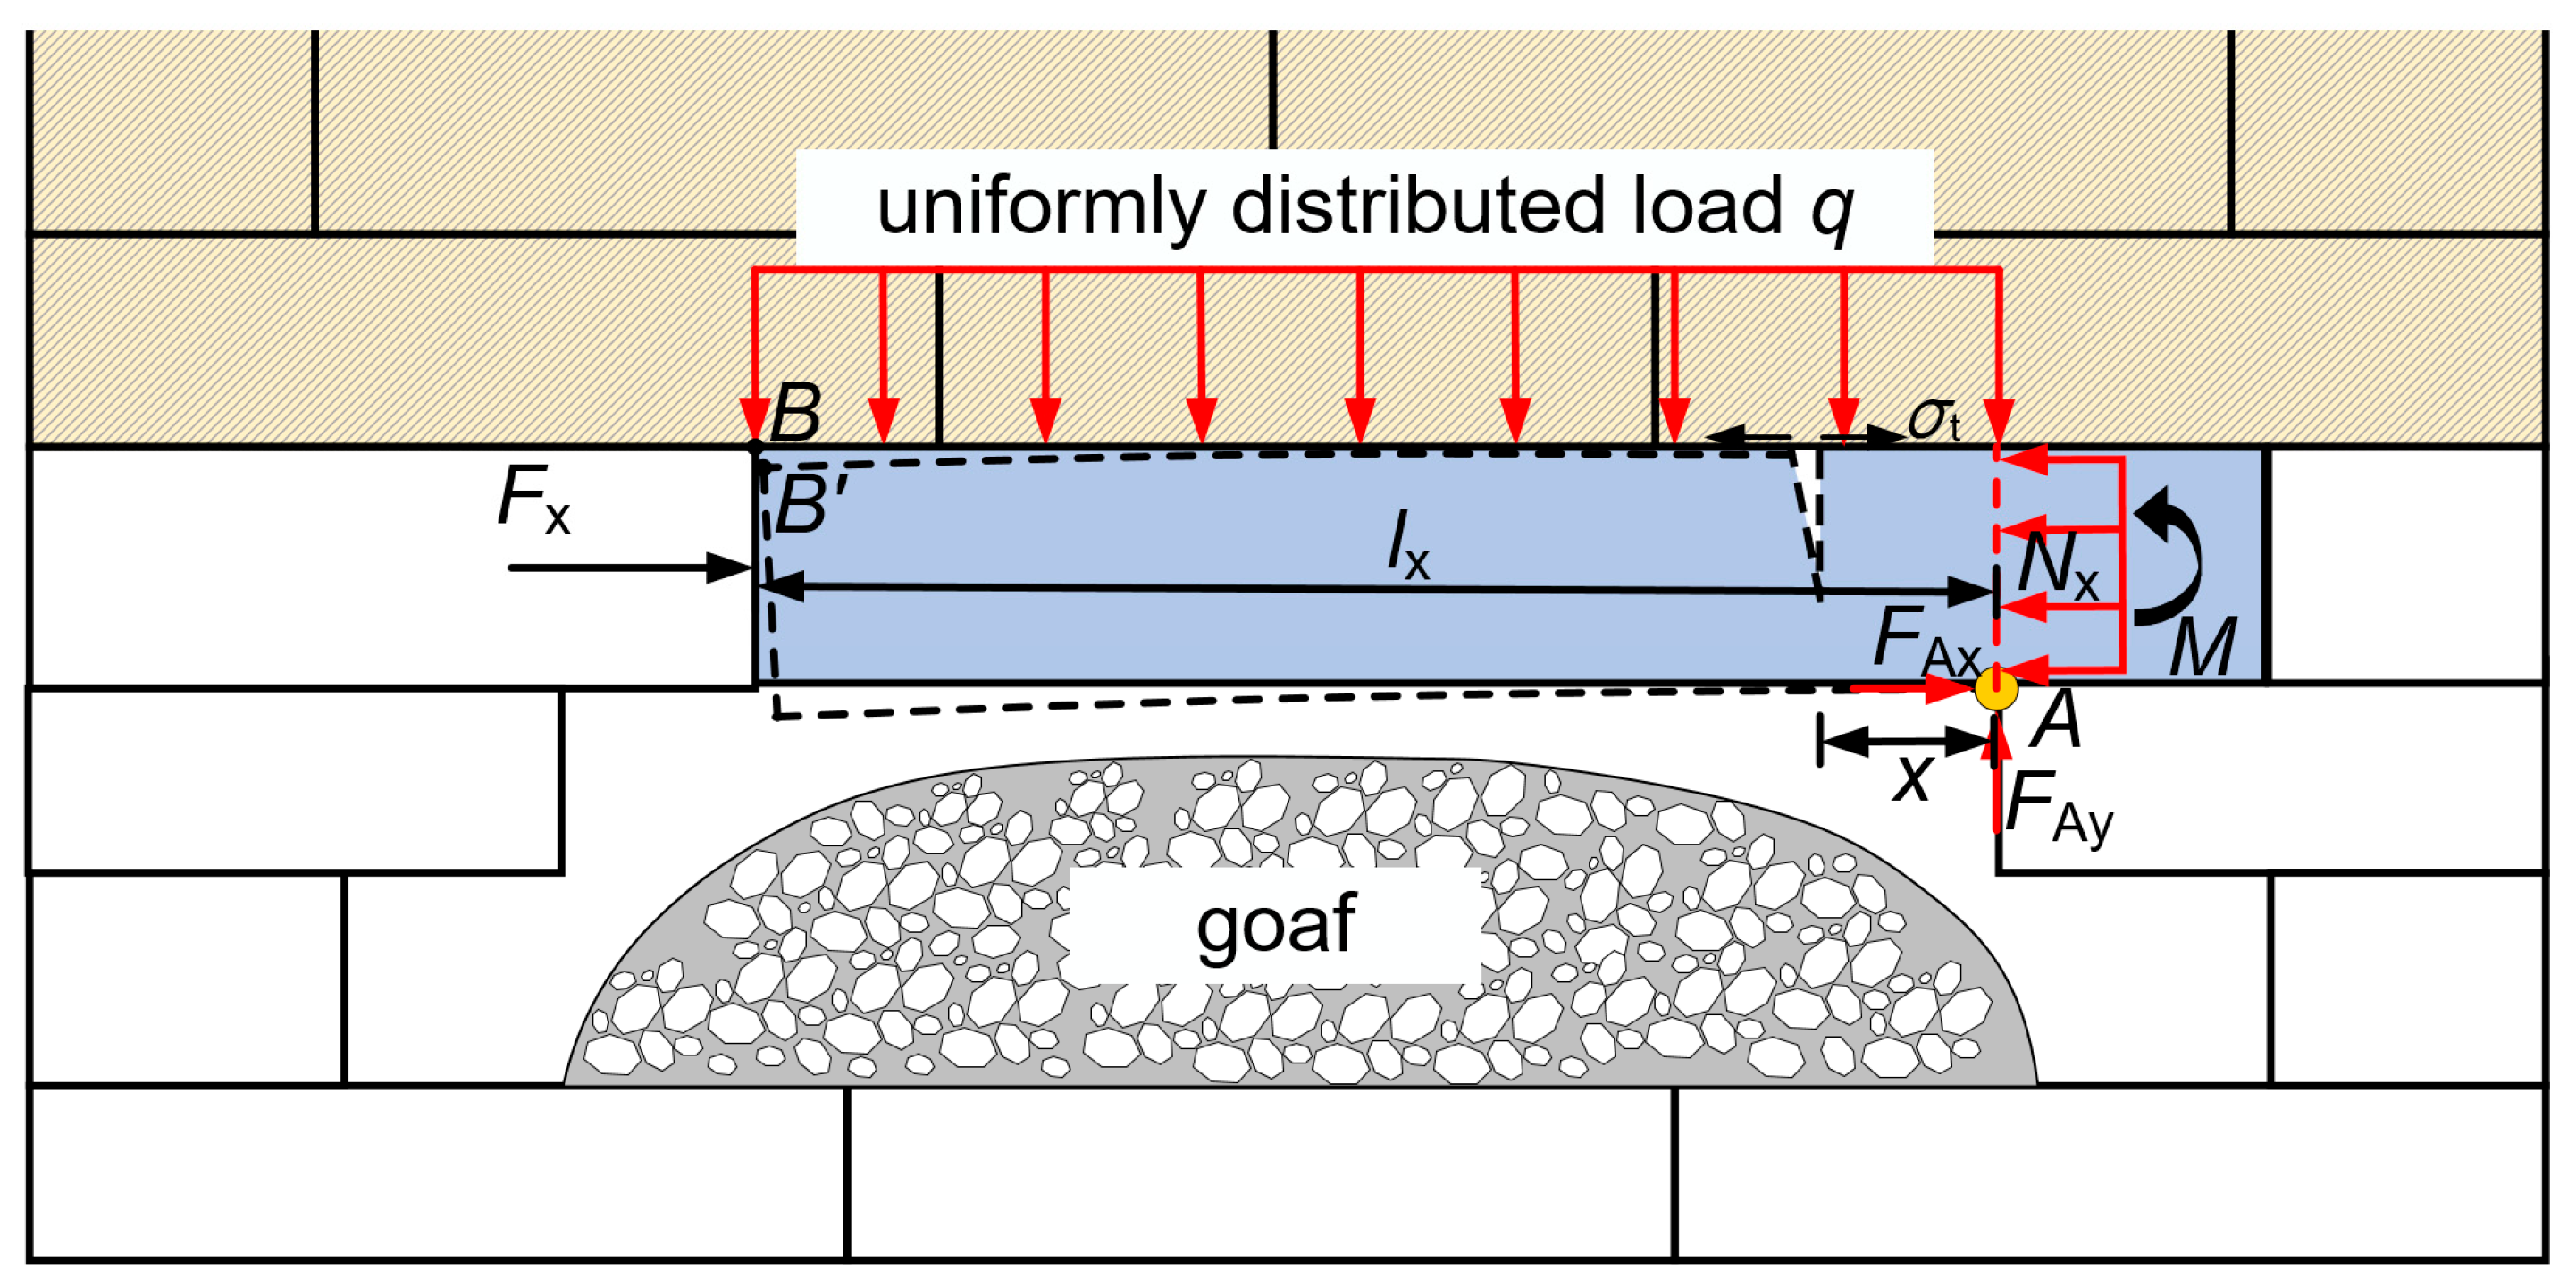
4.4.3. Mechanical Model of Key Layer in Thick Bedrock Section
When the working face advances to a distance of 240 m, the bedrock thickness reaches approximately 85 m, indicating a thick bedrock section.
Figure 15 illustrates the vertical and horizontal stress distributions in the overlying strata at this stage. The figure reveals that the vertical stress at the key layer location is approximately 2.5 MPa, while the horizontal mining stress is around 12.5 MPa.
As the working face advances to 240 m, the thickness of the bedrock increases, resulting in an enhanced bearing capacity. The pressure exerted by the overlying thick loose layer gradually leads to the collapse of the rock layer behind the working face. In the thick bedrock section, the high-level rock mass above the working face forms a ’beam’ structure that differs from that of the thin bedrock area. In this configuration, the upper part experiences tension while the lower part is subjected to compression. Consequently, the caving step distance of the overlying rock increases, and the suspended section of the key layer bends and sinks. The fracture model of the key layer in the thick bedrock section can be effectively analyzed using the ’cantilever beam’ mechanical model illustrated in
Figure 16.
To facilitate the mechanical analysis of the model, the following assumptions are made for the simply supported beam model in the thin bedrock area: (1) The mining direction along the working face is designated as the positive x-axis, the plumb line direction as the y-axis, and the z-axis is determined as perpendicular to the xy-plane. The suspension distance of the top strata is denoted as lx; (2) The axial displacement of the beam’s neutral axis is neglected, and the beam does not experience bending in the z-direction; (3) In the mining-induced suspended area, the object is considered as a cantilever structure with one end fixed and the other end hinged. The vertical stress σyy generated by the overlying strata acts as a uniformly distributed vertical load q on the beam, which is also subjected to horizontal constraints Fx and Nx from the adjacent rock mass on both sides, vertical constraints Fy, and a bending moment M. According to Saint-Venant’s principle, both ends of the beam are considered to be subjected to a uniform horizontal restraint force Nx.
According to the cantilever beam mechanical model, the following relationships hold at the fixed end A and hinged end B of the cantilever beam:
Substituting Equation (19) into Equation (12) results in the following equation:
Based on the principle of stress superposition, the formulas for the maximum tensile stress and maximum compressive stress in the beam are derived as follows:
By substituting the rock tensile strength into Equation (21), the maximum suspended distance lxmax when the beam does not break is obtained as follows:
By substituting the rock tensile strength,
σt, into Equation (21), the maximum suspended distance,
lxmax, at which the beam does not fail is obtained as follows:
When the working face advances to 240 m, the height of the overlying strata collapses in the goaf is approximately 35 m. At this stage, the suspended distance of the key layer is about 60 m. The tensile strength of the sandstone at the key layer location is approximately 3.6 MPa, and the total thickness of the key layer is about 43 m. According to the stress cloud diagram, the vertical stress is 2.5 MPa, and the horizontal stress is 12.5 MPa. Utilizing Equation (21), the maximum tensile force, σ
tmax, is calculated to be 2.1 MPa, indicating that the beam does not fail at this point as per Equation (17). By substituting the rock tensile strength into Equation (18), the maximum suspended distance,
lxmax, is calculated to be 63 m. When mining reaches 260 m, the suspension distance is approximately 69.8 m, which exceeds the maximum suspension distance. This suggests that, at this stage, the critical layer within the thick bedrock section will fracture and collapse. This observation aligns with the breaking results depicted in
Figure 7f.
The accuracy of the previously constructed numerical simulation model can be validated through the analysis and calculation results of the overlying rock-breaking force in the two bedrock sections. The numerical simulation results provide valuable insights into the stability control of the surrounding rock in the field.
5. Field Application and Analysis
The 2303 working face is deeply buried, and the roadway is in a high-ground stress environment. Under the condition of a thick loose layer and thin bedrock, the stress is relatively concentrated and the peak stress is close to the coal wall, resulting in the surrounding rock of the roadway being relatively broken. In contrast, under the conditions of a thick loose layer and thick bedrock, the stress influence range increases, and the stress peak shifts inward, making the surrounding rock of the roadway more stable. However, the roof is more likely to accumulate significant elastic energy, and its failure when the roof breaks poses a serious threat to mine safety.
5.1. Analysis of the Original Support Pressure Relief Scheme
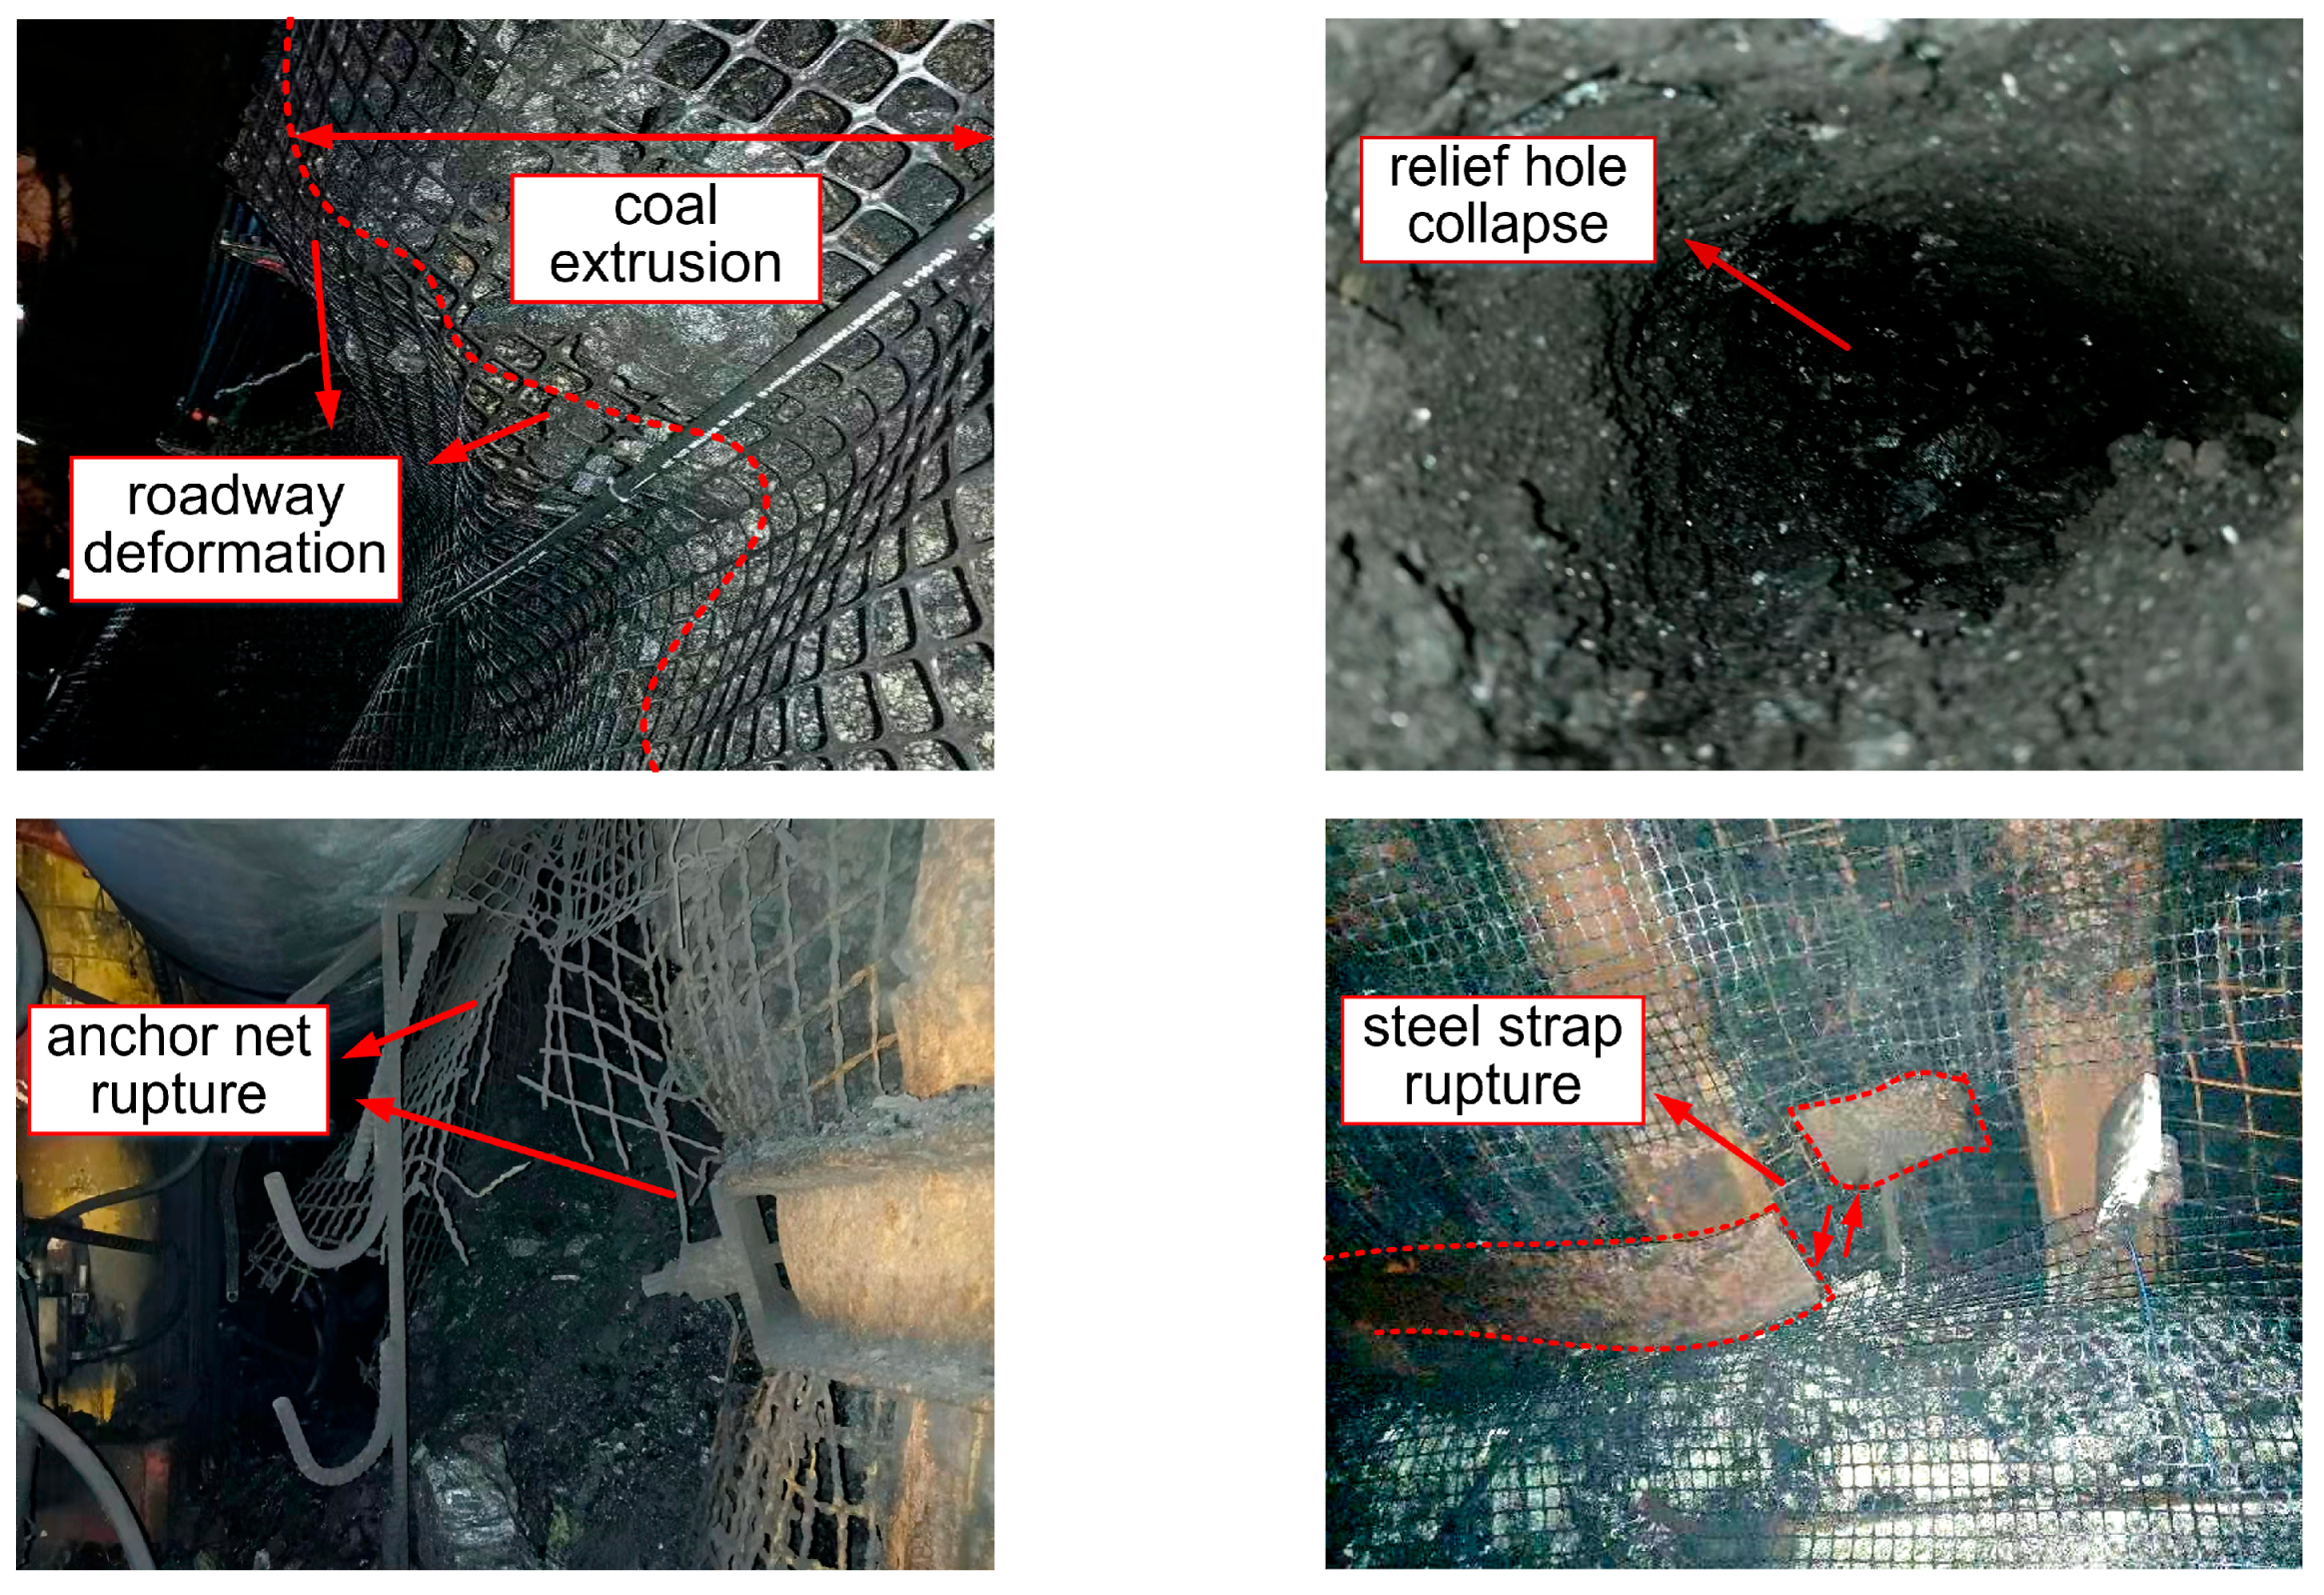
The 2303 track roadway is a thick coal seam top coal roadway with a rectangular cross-section. The original support scheme for the roadway employs an active support system consisting of an “anchor-mesh-rope beam + W-shaped steel belt”. The pressure relief technique utilizes standard large-diameter boreholes of 150 mm in diameter. Under this original support-pressure relief scheme, the stress in the surrounding rock of the roadway is partially relieved, and the deformation of the surrounding rock is somewhat controlled. However, owing to the significant burial depth of the roadway, the existence of large-diameter pressure relief boreholes weakens the structural integrity of the surrounding rock on the roadway surface. Particularly in the sections with thin bedrock, the shallow surrounding rock undergoes severe deformation under high static load. On-site deformation and failure are illustrated in
Figure 17, where severe spalling of the roadway sides, collapse of pressure relief holes, and convergence of the two sides, roof, and floor are observed. Failures in support materials, such as fractures in steel belts, anchor nets, and bolts, pose significant threats to worker safety and mine production. To effectively control the deformation of the surrounding rock, it is essential to propose a deformation control strategy designed to address the deformation and failure behaviors of the roadway under varying bedrock thickness conditions.
5.2. Support Scheme Optimization
Under the high static load exerted by the thick loose layer in the 2303 working face, the roof of the roadway in the thin bedrock section experiences severe damage, making it difficult to form a stable structural system. This results in distinct characteristics, including high peak stress, a concentrated influence range, and significant fluctuations in mining-induced stress. The high in-situ stress acts directly on the roadway’s surrounding rock, leading to pronounced deformation. To comply with anti-impact ground pressure regulations, it is necessary to introduce pressure relief holes or even repeatedly drill them. However, the presence of these pressure relief holes further compromises the roadway’s integrity and exacerbates the fragmentation of the surrounding rock. To address the deformation and failure of the surrounding rock in the thin bedrock section, a combination of measures can be implemented, such as grouting reinforcement, shallow sealing of pressure relief holes, optimization of active support systems, enhancement of passive support systems, and the use of large-diameter borehole pressure relief. These measures aim to improve the stiffness of the surrounding rock and alleviate stress concentrations.
In contrast, the thick bedrock section gradually develops a stable bearing structure due to the support provided by the upper rock layers. The high in-situ stress generated by the thick loose layer above is transmitted over a distance through this bearing structure, reducing the stress on the coal sides and roof of the roadway. As a result, the surrounding rock in the thick bedrock section maintains better stability and integrity. However, the transfer stress from the overlying strata above the goaf, coupled with the high ground stress generated by the loose layer, tends to cause stress concentration and energy accumulation above the coal pillars of the roadway. When the overburden fractures, the sudden release of elastic energy poses a significant threat to the safety of mine personnel and production operations. To address the failure characteristics of surrounding rock in thick bedrock sections, several measures can be employed to mitigate the impact of high stress on the surrounding rock. These include large-diameter pressure relief holes, hydraulic fracturing of the roadway roof, hydraulic slotting, blasting-induced roof breaking, and filling the goaf. Additionally, combining these methods with approaches such as optimizing the active support of the surrounding rock, enhancing passive support, shallow sealing of pressure relief holes, and grouting reinforcement can improve the integrity of the shallow surrounding rock and enhance overall stability.
In field engineering practice, the combined control scheme for deep roadway pressure relief should be selected reasonably based on the specific field conditions. Factors such as time constraints, construction conditions, and economic considerations must be taken into account. Additionally, the destructive effects of large-diameter boreholes on the integrity of shallow surrounding rock should be carefully evaluated, when the surrounding rock of the roadway surface is seriously broken, the shallow sealing of the pressure relief hole can be adopted to improve the integrity of the surrounding rock. Among various pressure relief support measures, active support and pressure relief holes are prioritized to enhance the integrity of the surrounding rock. Deep reaming of pressure relief holes is adopted to reduce the accumulation of elastic strain energy, and single hydraulic supports are installed to improve the impact resistance of the surrounding rock. In the thick bedrock section, supplementary measures including roof breaking for pressure relief were taken to reduce the stress of surrounding rock and prevent disasters. Therefore, this study proposes a combined support scheme of hole sealing–hole expansion–roof breaking–support’ to achieve the purpose of controlling the deformation of surrounding rock. The field experiment of this study is mainly carried out in the thin bedrock section. The optimization scheme of support and pressure relief technology of the roadway is shown in
Figure 18.
5.3. Field Testing and Monitoring
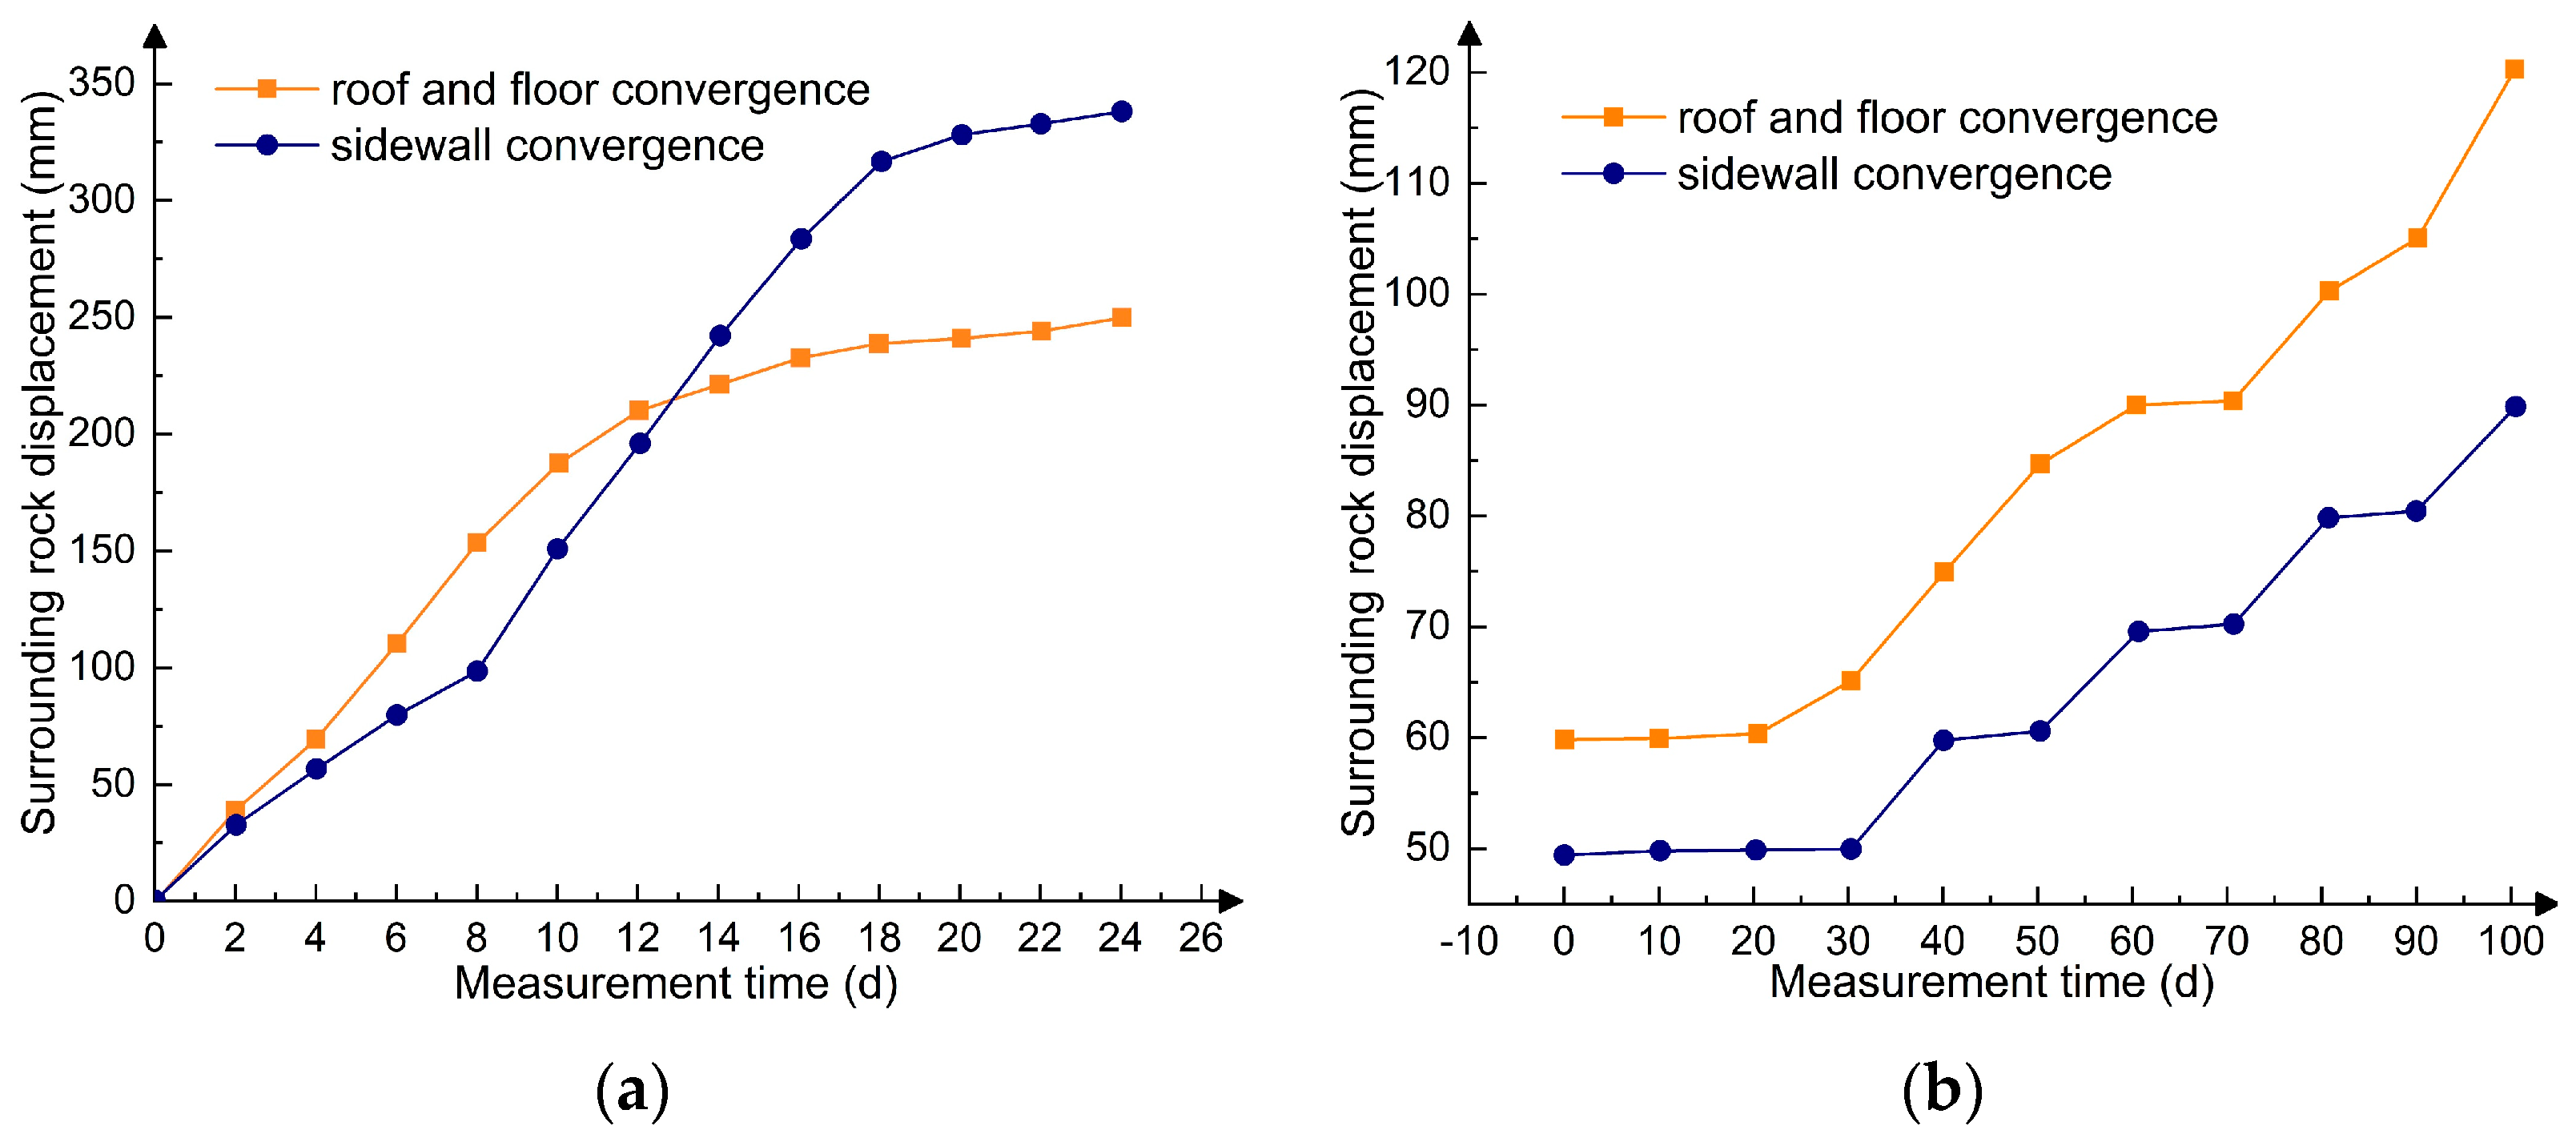
To verify the rationality and effectiveness of the combined control scheme, an industrial experiment was conducted in the 2303 track roadway. The “cross-point distribution method” was employed to monitor the displacement of the surrounding rock on both sides of the roadway, as well as the roof and floor. The monitoring results are presented in
Figure 19. The data reveal that, under the original support scheme, the convergence of the roof and floor increased by 340 mm, while the convergence of the two sides grew by 250 mm over 24 days. In contrast, after implementing the combined support scheme, the structural integrity and rigidity of the shallow surrounding rock were markedly improved. Following up to three months of monitoring, the maximum convergence of the two sides was reduced to just 88 mm, and the maximum convergence of the roof and floor was limited to 120 mm, effectively controlling the roadway’s surrounding rock deformation. Additionally, microseismic monitoring results indicated a reduction in high-energy events, further confirming the reliability of the combined control technology system.


 ,
, 


