Abstract
Carbonate reservoirs have various types of reservoir spaces and complex pore structures, so the evaluation of microscopic pore structures is of great significance to favorable reservoir identification. In order to accurately characterize the micro-pore structure of carbonate reservoir, this paper uses the NMR experiment, high-pressure mercury injection, and NMR logging data to establish a conversion model between the NMR T2 spectrum and the capillary pressure curve by piecewise power function method. The nuclear magnetic T2 spectrum of the reservoir is mainly bimodal, with small pore T2 ranging from 0.1 to 6 ms, the peak value being about 2 ms, and the large pore throat T2 ranging from 100 to 6000 ms. The throat radius of small pores is 0.04–0.1 μm, the peak value is 0.08 μm, and the throat of large pores is 0.1–10 μm. The Bash layer has the smallest pore throat radius and median radius, higher median pressure, and poorer pore structure. By converting the T2 spectrum of nuclear magnetic logging into a pseudo-capillary pressure curve, the continuous and quantitative characterization of reservoir pore structure parameters was achieved vertically. The secondary method has important reference significance for the quantitative characterization of pore structure in reservoirs of the same type.
1. Introduction
In the global scope, the oil and gas resources in carbonate reservoirs account for 60% of the total remaining oil and gas resources, which have huge exploration and development prospects. Domestic carbonate reservoirs are mainly distributed in the Tarim Basin, Sichuan Basin, etc., which are mainly fracture vuggy carbonate reservoirs [1,2,3,4,5,6,7,8]. The reservoir space is mainly porous, with fractures and pores developed [9,10]. Because of the complex sedimentary environment and multiple geneses, the carbonate reservoir is quite different from the conventional reservoir, which is mainly shown in the following aspects: First, the lithology is relatively complex, including dolomite, limestone, and a small amount of sandstone. The other is the diversity of pore types, including the intragranular pore, intergranular pore, dissolved pore, body cavity pore, and mold pore. The complex lithology and various pore types make the pore structure of carbonate reservoirs more complex, and it is difficult to accurately evaluate the reservoir parameters [11,12,13,14,15].
The evaluation of reservoir pore structure by logging data is mainly based on nuclear magnetic resonance logging data. The T2 distribution spectrum obtained from nuclear magnetic resonance logging can reflect the size and distribution of pores in formation rocks, so it is often used to study the characteristics of the reservoir pore structure. Nuclear magnetic resonance logging data are mainly used to evaluate the reservoir pore structure by building a pseudo-capillary pressure curve with nuclear magnetic data and directly extract parameters that can quantitatively characterize the reservoir pore structure from nuclear magnetic resonance logging T2. Numerous efforts have been made to evaluate the reservoir pore structure by using nuclear magnetic resonance data. In 2001, Yakov proposed the method of constructing a pseudo-capillary pressure curve based on the linear scale, which laid a foundation for using nuclear magnetic resonance data to construct a pseudo-capillary pressure curve to study the reservoir pore structure [16]. In 2004, Xiao et al. used an NMR T2 spectrum to continuously calculate the pore radius of caprock to evaluate the ability of caprock to trap oil and gas, and they proposed a method to determine the conversion coefficient of the capillary radius [17]. In 2005, He Yudan et al. divided the pores in the formation into two types, macropores and small pores, and segmented the nuclear magnetic data into pseudo-capillary pressure curves using power functions [18]. Zhou C, and Liang X, respectively, established the relationship between mercury saturation and characteristic parameters at the T2 sampling point to build a pseudo-capillary pressure curve to evaluate the reservoir pore structure [19,20]. In 2013, Yunhai et al. used the three-component decomposition method to decompose the nuclear magnetic resonance T2 spectrum to study the pore structure of the tight sandstone reservoir [21]. In 2016, Ruan Jianping studied the relationship between free fluid T2 and mercury injection pore throat distribution, established the relationship between the pore throat radius and nuclear magnetic T2 in two different pore throat scales, and then used nuclear magnetic data to invert reservoir pore size distribution to evaluate the reservoir pore structure [22]. In the same year, Liang X divided the nuclear magnetic resonance T2 spectrum into eight parts and combined these eight parts with mercury injection saturation to build a pseudo-capillary pressure curve, which has achieved good results in tight sandstone gas reservoirs [23]. In 2019, Liu Huai et al., based on the power function to construct the pseudo-capillary pressure curve, used the T2 cut-off value as the dividing point and used the power function to construct the pseudo-capillary pressure curve in sections [24]. Due to the fact that the above methods mainly target sandstone reservoirs, there is relatively little research on carbonate reservoirs with complex pore structures. The pore structure of sandstone reservoirs is less heterogeneous compared to carbonate rocks, so the methods used to study sandstone reservoirs are not applicable to carbonate reservoirs. Therefore, this paper mainly focuses on the research of nuclear magnetic mercury intrusion pore structure conversion models for carbonate reservoirs with diverse pore types and strong heterogeneity. This research is of great significance for quantitatively characterizing the pore structure of carbonate reservoirs with complex pore structures using nuclear magnetic resonance.
Based on the investigation of basic geological data, this paper uses continuous nuclear magnetic logging data in the study area to evaluate the pore structure of the reservoir. Based on mercury intrusion data and nuclear magnetic experiment data, a segmented power function method is used to establish a model that converts the nuclear magnetic T2 spectrum into a pseudo-capillary pressure curve. Then, the pseudo-capillary pressure is converted into quantitative pore throat distribution characteristics, and pore throat structure parameters are extracted. The micro-pore structure characteristics of different types of reservoirs are then analyzed.
2. Experiments and Methods
In this study, taking carboniferous carbonate reservoir in X oil reservoir in the eastern margin of Caspian Basin as an example and using the data of nuclear magnetic resonance and mercury injection experiment of 24 carbonate rocks, the characteristics of T2 spectrum and mercury injection pore structure were compared and analyzed, and the conversion model between T2 spectrum and pore structure was established. The pore structure of NMR logging was studied by using this conversion model, and the model was verified by comparing NMR logging and mercury injection experiment.
At present, mercury injection capillary pressure curve is the best method to reflect pore structure. However, due to the toxicity and high cost of mercury injection experiment, it is impossible to continuously core the whole well section. Therefore, the method of obtaining continuous pore throat structure parameters in the vertical direction of the formation through mercury intrusion data has limitations. Nuclear magnetic resonance logging can reflect the size of pores, and through research, it is found that nuclear magnetic resonance T2 spectrum is very similar to mercury injection capillary pressure curve. Through certain scale conversion, the capillary pressure curve can be obtained from nuclear magnetic logging. In order to distinguish from the real mercury injection capillary pressure curve, we call it pseudo-capillary pressure curve. Compared with mercury injection experiment, nuclear magnetic resonance logging has the advantage of continuous measurement of the whole well section. Therefore, continuous pseudo-capillary pressure curve can be obtained so that reservoir microscopic parameters representing pore structure can be obtained for the whole well section.
2.1. Theoretical Basis
The relationship between nuclear magnetic resonance T2 spectrum and pore structure radius. The transverse relaxation of nuclear magnetic resonance is the result of the comprehensive action of three different relaxation mechanisms of pore fluid. The total relaxation time can be summarized as follows [25]
where T2 is the total relaxation time and T2S is the surface relaxation time; T2B is the volume relaxation time; and T2D is the diffusion relaxation time, which is generated by the external magnetic field. When the fluid in the pore is single phase, T2B is generally constant. When the pore is completely filled with water, the volume relaxation time of water is generally 2–3 s, which is much greater than T2, so T2B can be ignored. When there is no gradient magnetic field, or the gradient magnetic field is very small, the diffusion relaxation term T2D can be ignored.
Surface relaxation is a process of energy attenuation caused by the continuous collision between fluid molecules in rock pores and particle surfaces. The surface relaxation rate depends on the surface relaxation strength of rock and the frequency of proton collision with pore surface, which can be expressed as the product of surface relaxation strength and pore surface area/volume ratio S/V.
where is the surface relaxation strength.
Formula (1) can be simplified as:
S/V is related to pore shape. It can be seen from the digital core technology that the rock pore space can be represented by the ball pipe model in which the ball represents the pore and the pipe represents the throat.
S/V is 3/r for spherical pores, 2/r for tubular throats, and r is the radius of the ball. Therefore, Equation (3) can be written as:
where FG is the shape factor. The T2 relaxation distribution of NMR reflects the distribution of rock pore size. Large pore size corresponds to large T2 relaxation time, while small pore size corresponds to small T2 relaxation time.
The pore space of rock is composed of many small pores and throats, which are compared to capillary pipes. The pore space of rock is like a network of interconnected capillary channels. Therefore, the rock space of the reservoir can be regarded as highly porous and highly porous media. When the capillary is simplified, there is a certain hydrodynamic relationship between capillary pressure and pore radius:
where PC represents capillary pressure, MPa, and σ Is the interfacial tension between mercury and air, equal to 480 dyn/cm;
The capillary pressure Pc is inversely proportional to T2, and Pc can be calculated using the following functions:
where g is a function. This is the mathematical basis of constructing pseudo-capillary pressure curve by T2 NMR spectroscopy.
It can be seen from Formula (7) that there is indeed a conversion relationship between capillary pressure and transverse relaxation time; that is, there is a conversion function difference. As long as the conversion function is found, the capillary pressure curve can be converted from the nuclear magnetic T2 spectrum. In order to distinguish the capillary pressure curve measured by mercury injection experiment, the capillary pressure curve converted from the nuclear magnetic T2 spectrum is called the pseudo-capillary pressure curve. However, there is a precondition for using this method to convert pseudo-capillary pressure curve: it is assumed that rock pores can be simplified to regular distribution; that is, spherical or columnar pipe distribution. This method is widely used to convert capillary pressure curves by nuclear magnetic resonance, which is simple and practical and is also the method used in this paper.
2.2. Experiment
NMR relaxation time can be used to analyze pore throat size distribution and calculate reservoir porosity, irreducible water saturation, and movable fluid content. The nuclear magnetic resonance experiment equipment is Newmark MINI-NMR, the temperature is 32 °C, and the field strength is 0.5 T. The waiting time is 5 s, the echo interval is 0.1 ms, the number of scans is 64, and the number of echoes is 10,000. The specific experimental steps and methods are as follows: drilling standard cores with a diameter of 25 mm from full diameter cores; wash the standard core first and then dry it; the permeability of standard core is measured by gas logging method; weighing standard core; vacuum the standard core; provide saturated formation water to standard core; standard core after weighing saturated formation water; calculate the porosity of standard core; saturated formation water and centrifuged core were tested by T2 NMR spectrum to obtain T2 cut-off value and movable fluid parameters.
For capillary pressure curve measurement, the equipment used in the experiment is 9505 mercury intrusion instrument, and the maximum test pressure is 159.5 MPa. First, the rock samples are washed, and then the porosity and permeability are measured. Secondly, the sample is placed in the mercury porosimeter, and mercury is slowly injected into the sample pores by increasing the injection pressure until mercury does not enter the rock pores. Then, continuously reduce the pressure to make the mercury in the injection sample throat and continuously withdraw until the mercury cannot be withdrawn, and then record the amount of mercury input and mercury withdrawal under different pressures in the process of mercury input and mercury withdrawal. Finally, the pore throat structure parameters and pore throat size distribution characteristics of the sample were calculated by the pressure and the corresponding mercury inflow.
3. Experimental Result
3.1. Nuclear Magnetic Resonance
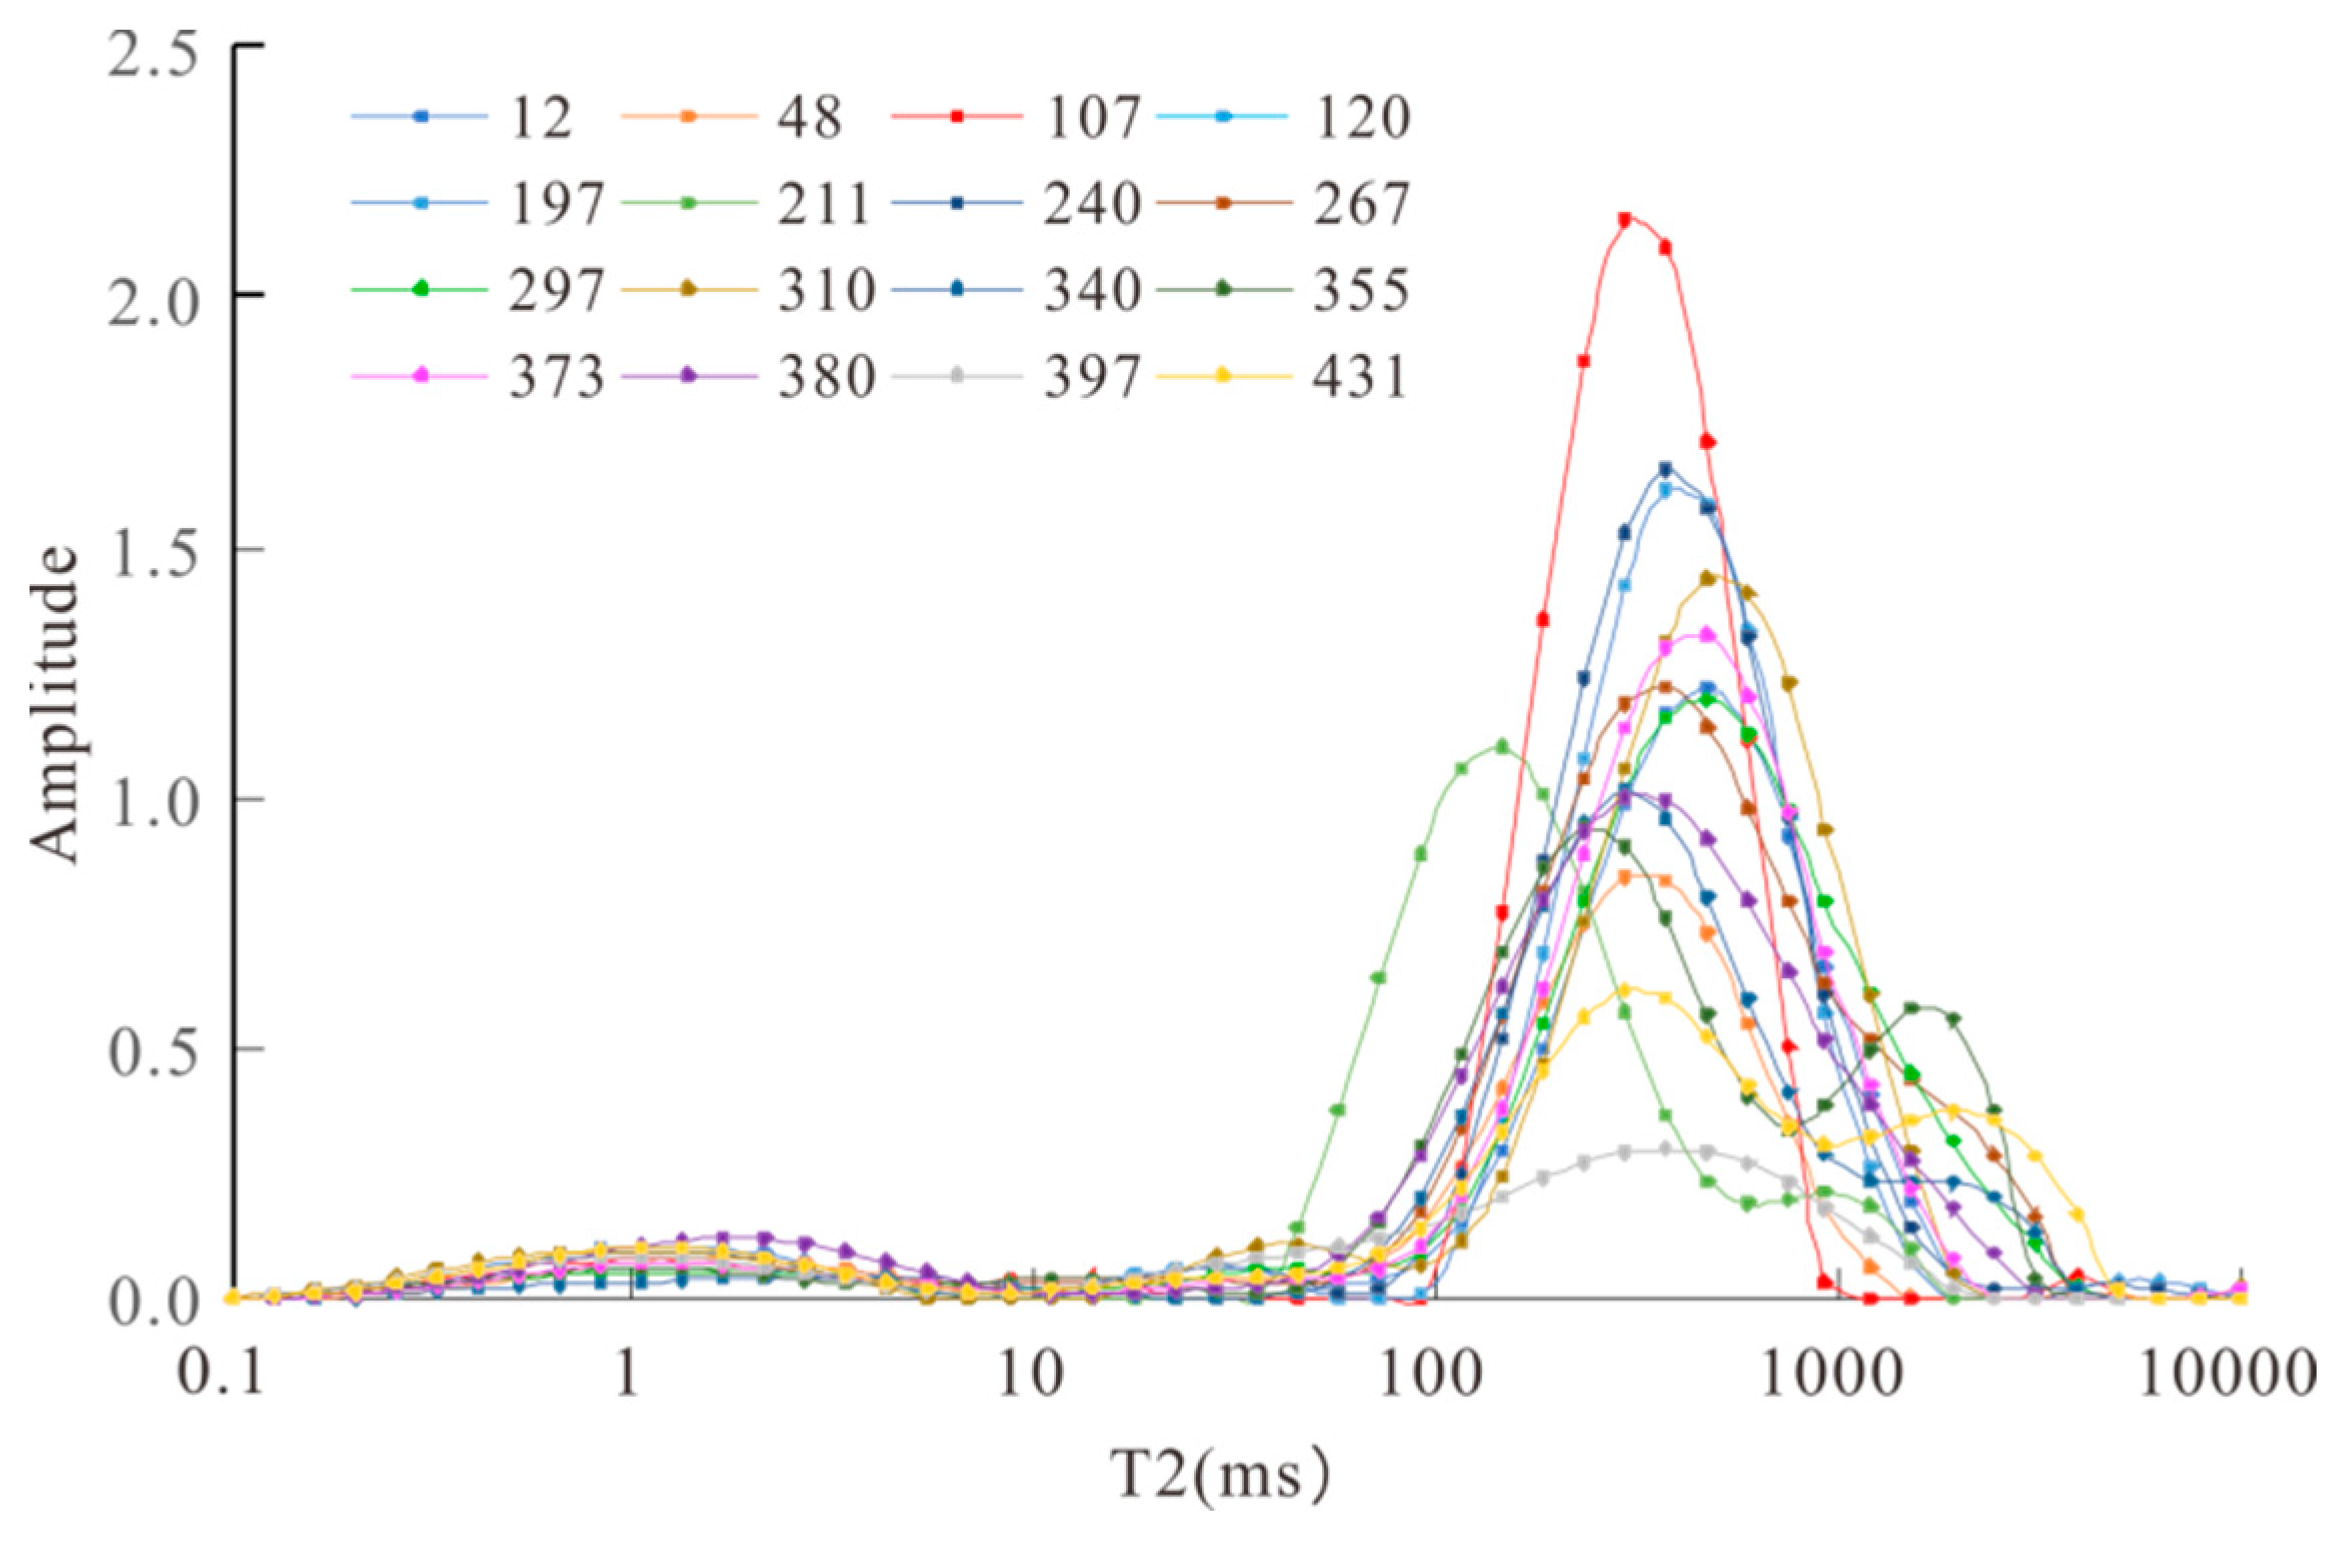
The nuclear magnetic resonance T2 spectrum shows that there are 2–3 peaks in the reservoir, and the left peak is 0.1–6 ms. The spectrum morphology of all samples is basically the same, and the peak value is about 2 ms, representing the small pore size in the sample. The macropore throat T2 is distributed in 100–6000 ms, mainly concentrated in 100–1000 ms. The macropore part of most samples is dominated by a single peak, and some samples have double peaks (Figure 1).
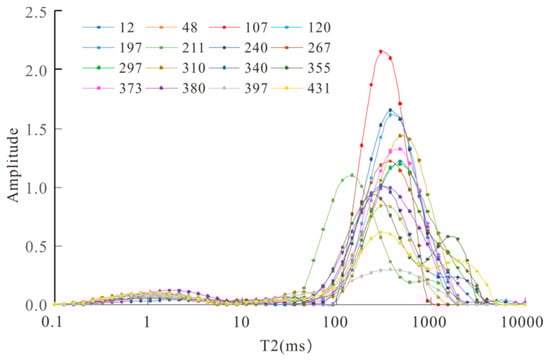
Figure 1.
T2 Spectrum distribution of nuclear magnetic resonance.
3.2. High-Pressure Mercury Intrusion
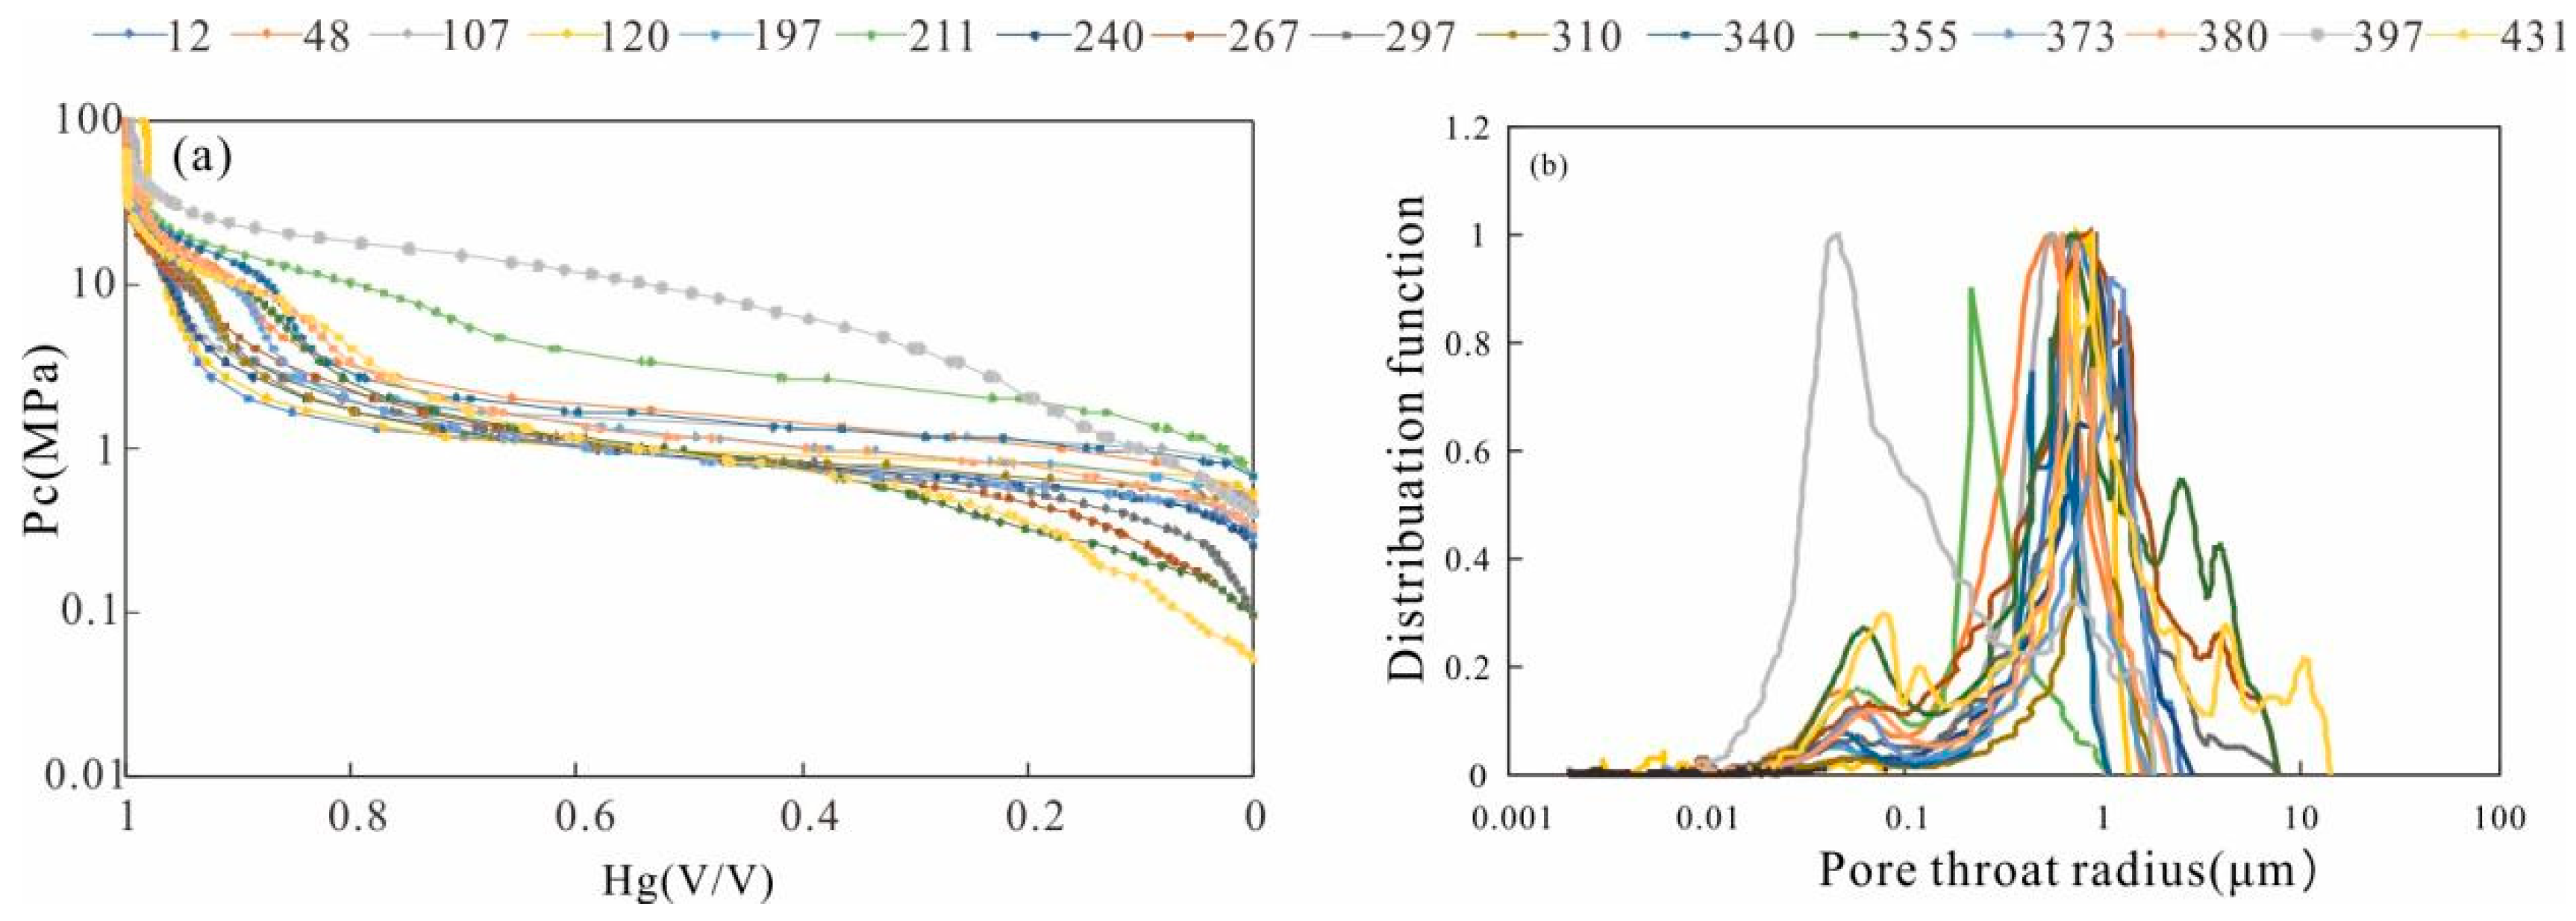
There are multiple steps in the mercury injection curve in Figure 2a, indicating that the reservoir space is different in size and types, and the displacement pressure is 0.1–1 Mpa. The pore size distribution curve in Figure 2b shows that there are two peaks in the size of the sample, and the pore throat radius of the small hole on the left is 0.04–0.1 μm. The peak value corresponds to 0.08 μm. The large pore throat is distributed in 0.1–10 μm. The peak is concentrated at 1 μm.
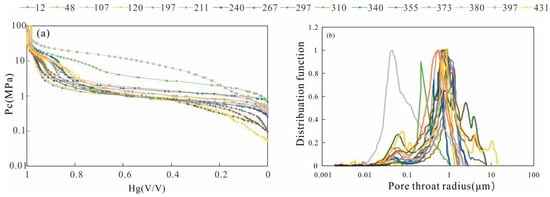
Figure 2.
(a) Characteristic diagram of mercury injection curve. (b) Distribution of pore throat radius.
4. Pore Structure Transformation Model
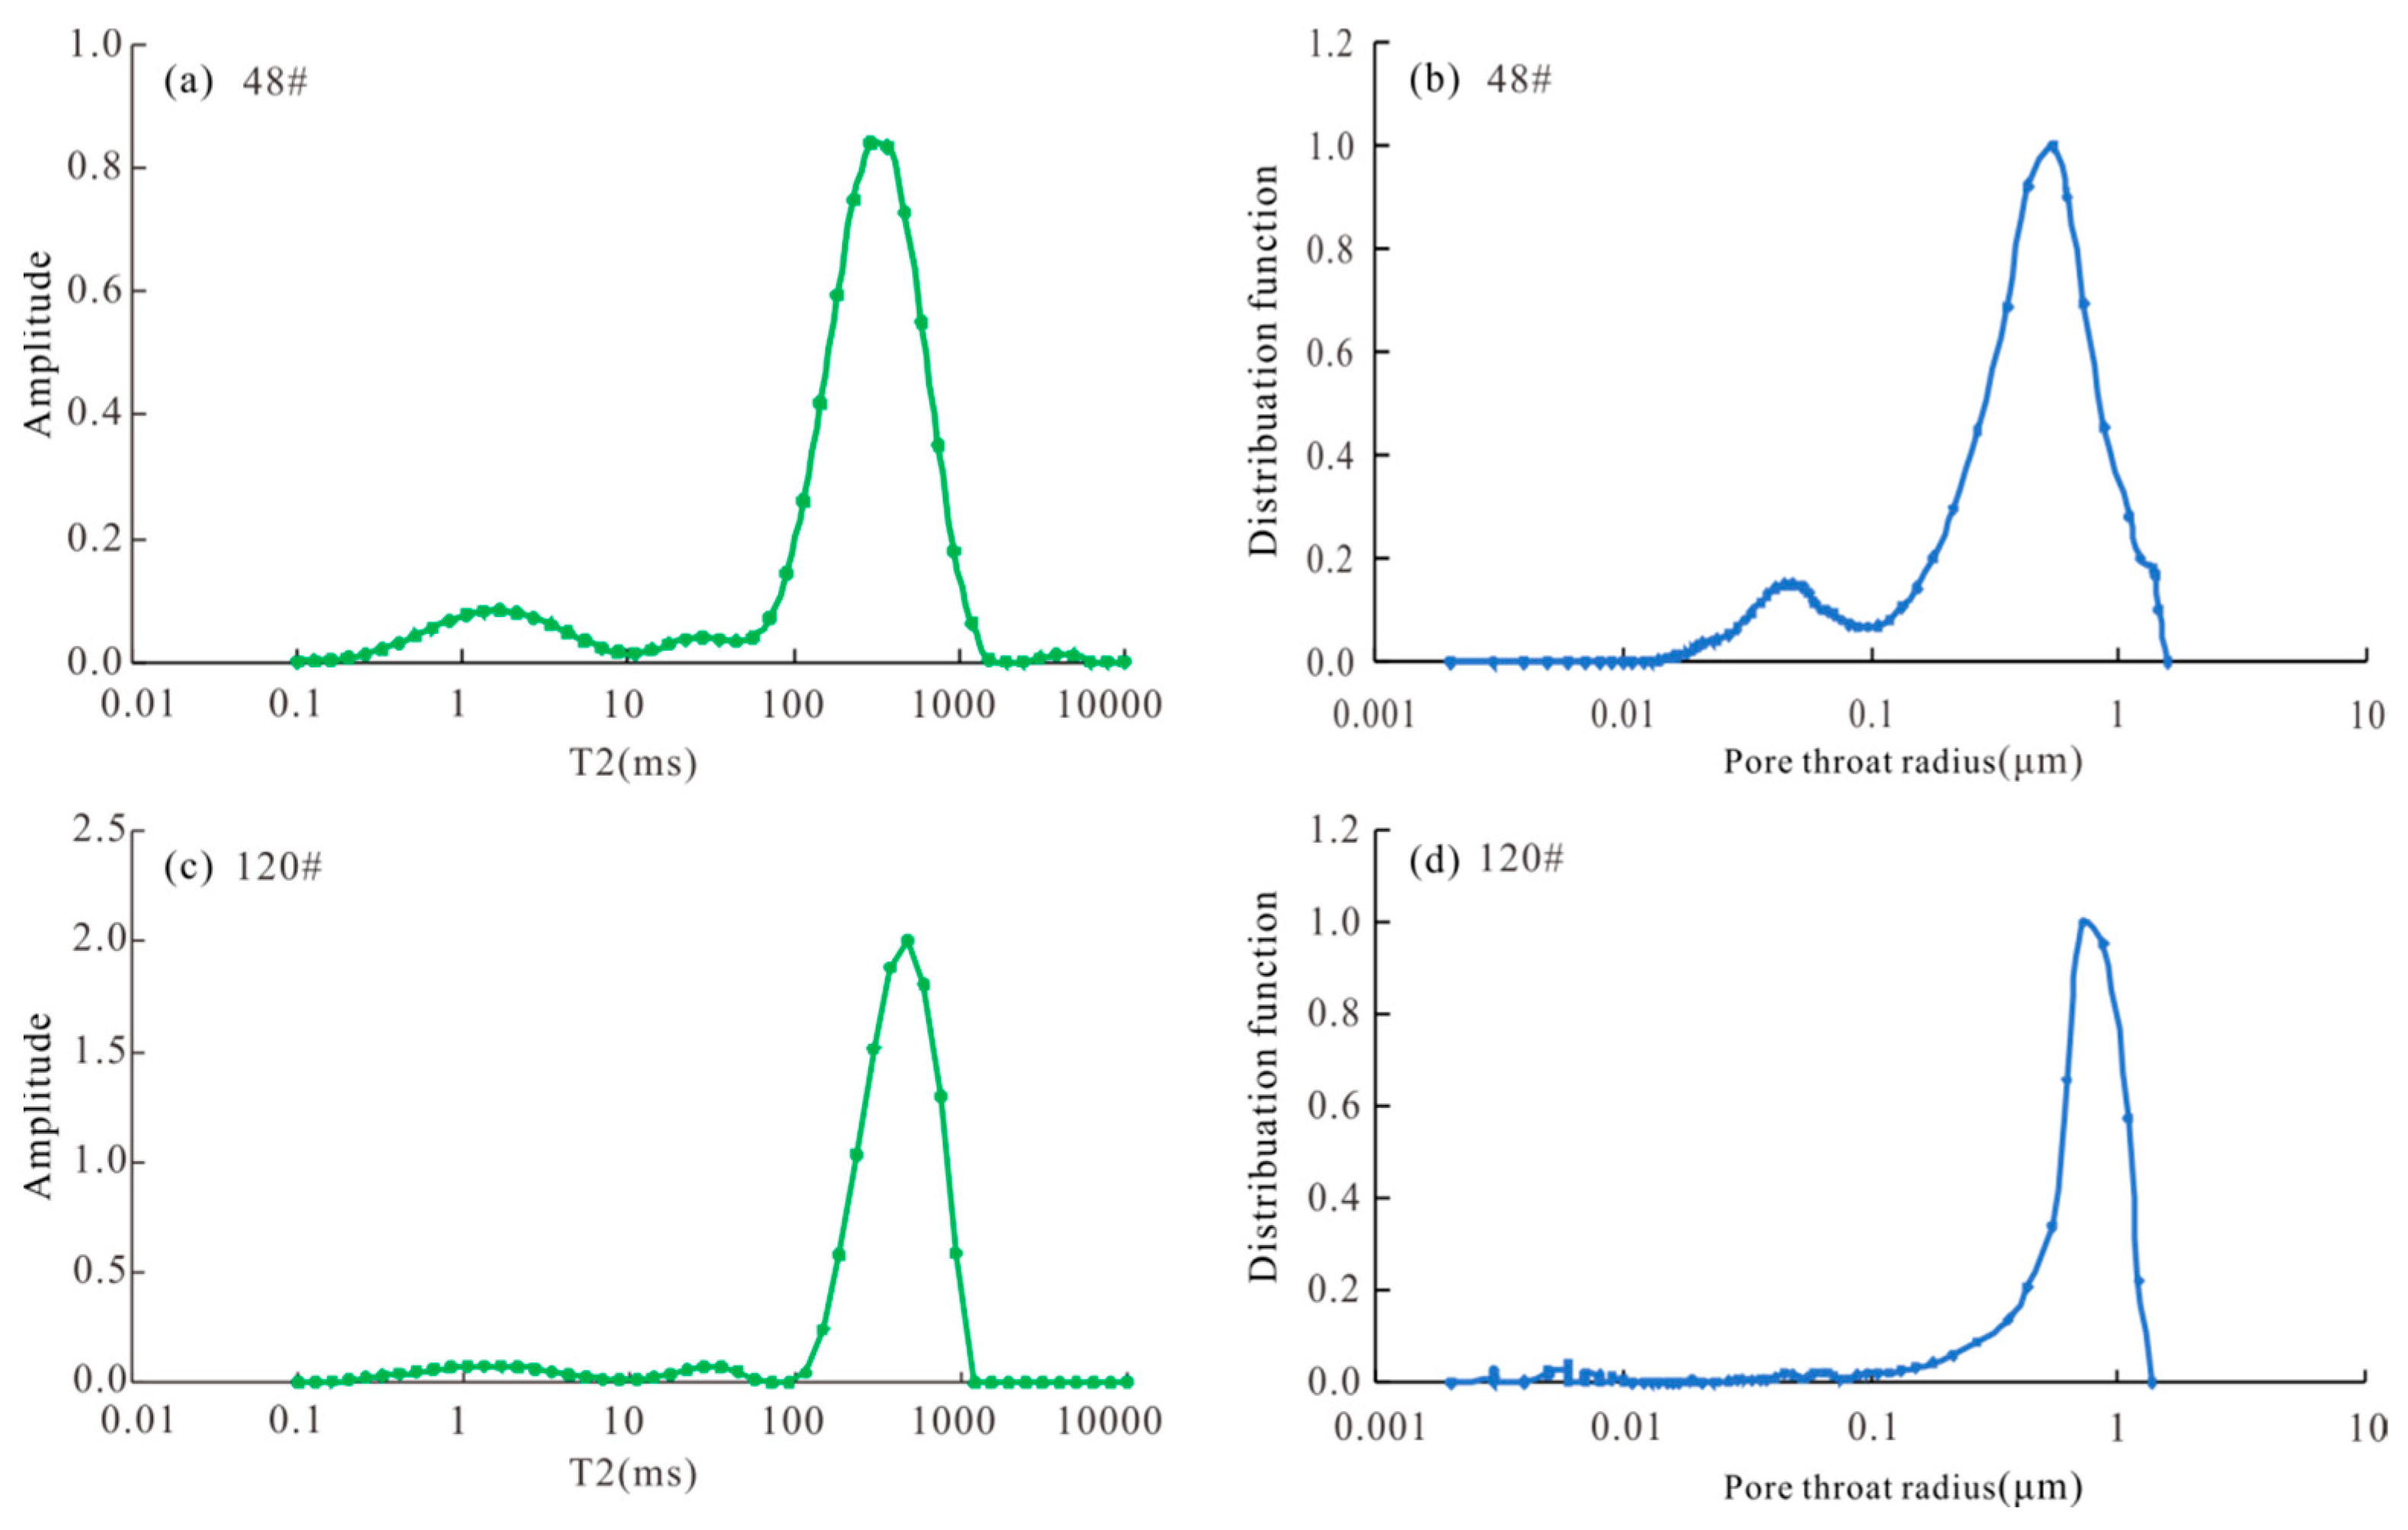
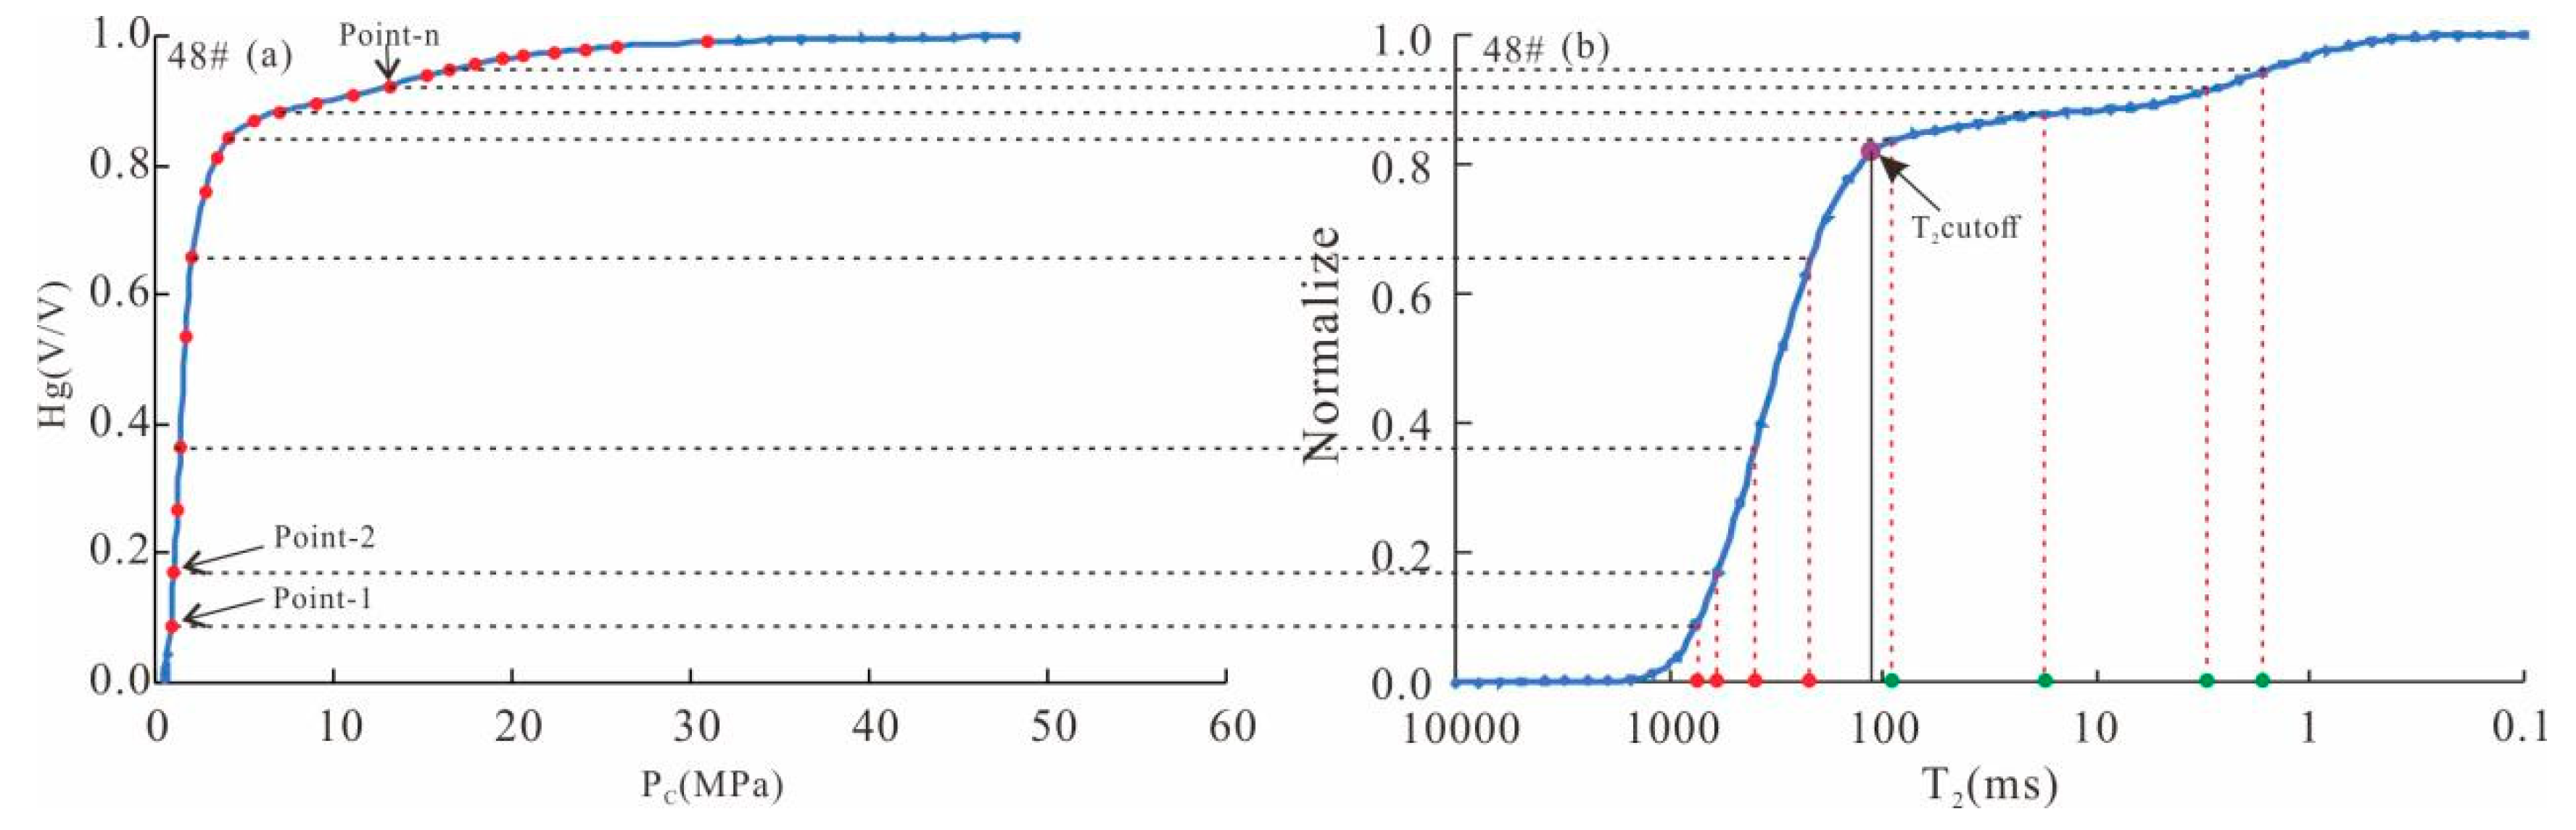
By comparing and analyzing the nuclear magnetic T2 spectra and mercury intrusion curves of all samples, samples 48 and 120, which can represent the characteristics of most experimental samples, were selected as examples in the article. Figure 3a shows the T2 spectrum distribution of the 48# sample, and there are mainly two peaks corresponding to the small pore throat and large pore throat, respectively. Figure 3b shows the pore throat radius distribution of the 48# sample, and the pore throat radius also shows two peaks; the left peak is the small pore, and the pore throat radius is 0.07 μm. There was a large aperture on the right, corresponding to a peak value of 0.8 μm. From the curve shape, the correspondence between the two is high. Figure 3c shows the T2 spectrum distribution of the 120# sample. The development of the small pore throat is weak, and the proportion of the pore throat is relatively low, mainly the macropore throat. The corresponding pore throat radius shows a peak value, which is 0.1–1.2 μm. The peak value corresponds to 0.9 μm (Figure 3d). The T2 curves and mercury intrusion curves of all samples have good correspondence in morphology, and the correspondence of the main peak is good. Therefore, the continuous T2 spectrum of nuclear magnetic logging can be converted into capillary pressure and the pore throat distribution curve to quantitatively characterize the pore throat characteristics of the reservoir.
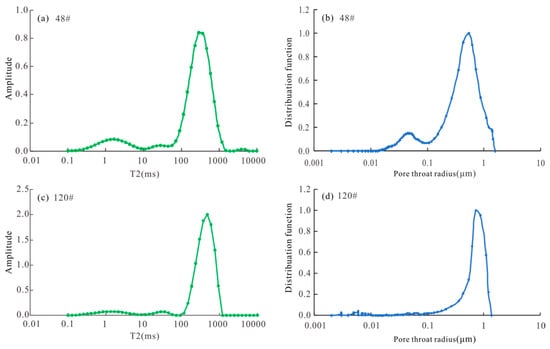
Figure 3.
(a) First, 48 # NMR T2 spectrum, (b) 48 # pore throat radius distribution map, (c) 120 # NMR T2 spectrum, (d) 120 # pore throat radius distribution map.
Look for the data sequence corresponding to mercury intrusion and nuclear magnetic resonance. Figure 4 shows both nuclear magnetic resonance and mercury intrusion reflect the cumulative change of pore size, from large to small, of 48#. The abscissa on the left corresponds to large pores, the right corresponds to small pores, and the ordinate is the cumulative probability distribution of different pore sizes. Figure 4a shows the cumulative mercury inflow saturation curve, and Figure 4b shows the normalized cumulative T2 spectrum. With the cumulative mercury inflow saturation as the benchmark, judge the relationship between the cumulative mercury inflow saturation and the cumulative normalized T2 spectrum amplitude. Obtain the cumulative saturation corresponding to each mercury inlet pressure point by point, and then determine the T2 value under the corresponding saturation so as to obtain the corresponding relationship between the mercury inlet pressure point and the T2 value of nuclear magnetic resonance.
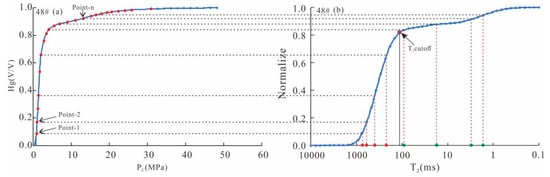
Figure 4.
(a) Mercury injection cumulative curve of 48#, (b) normalized NMR spectrum cumulative curve of 48#.
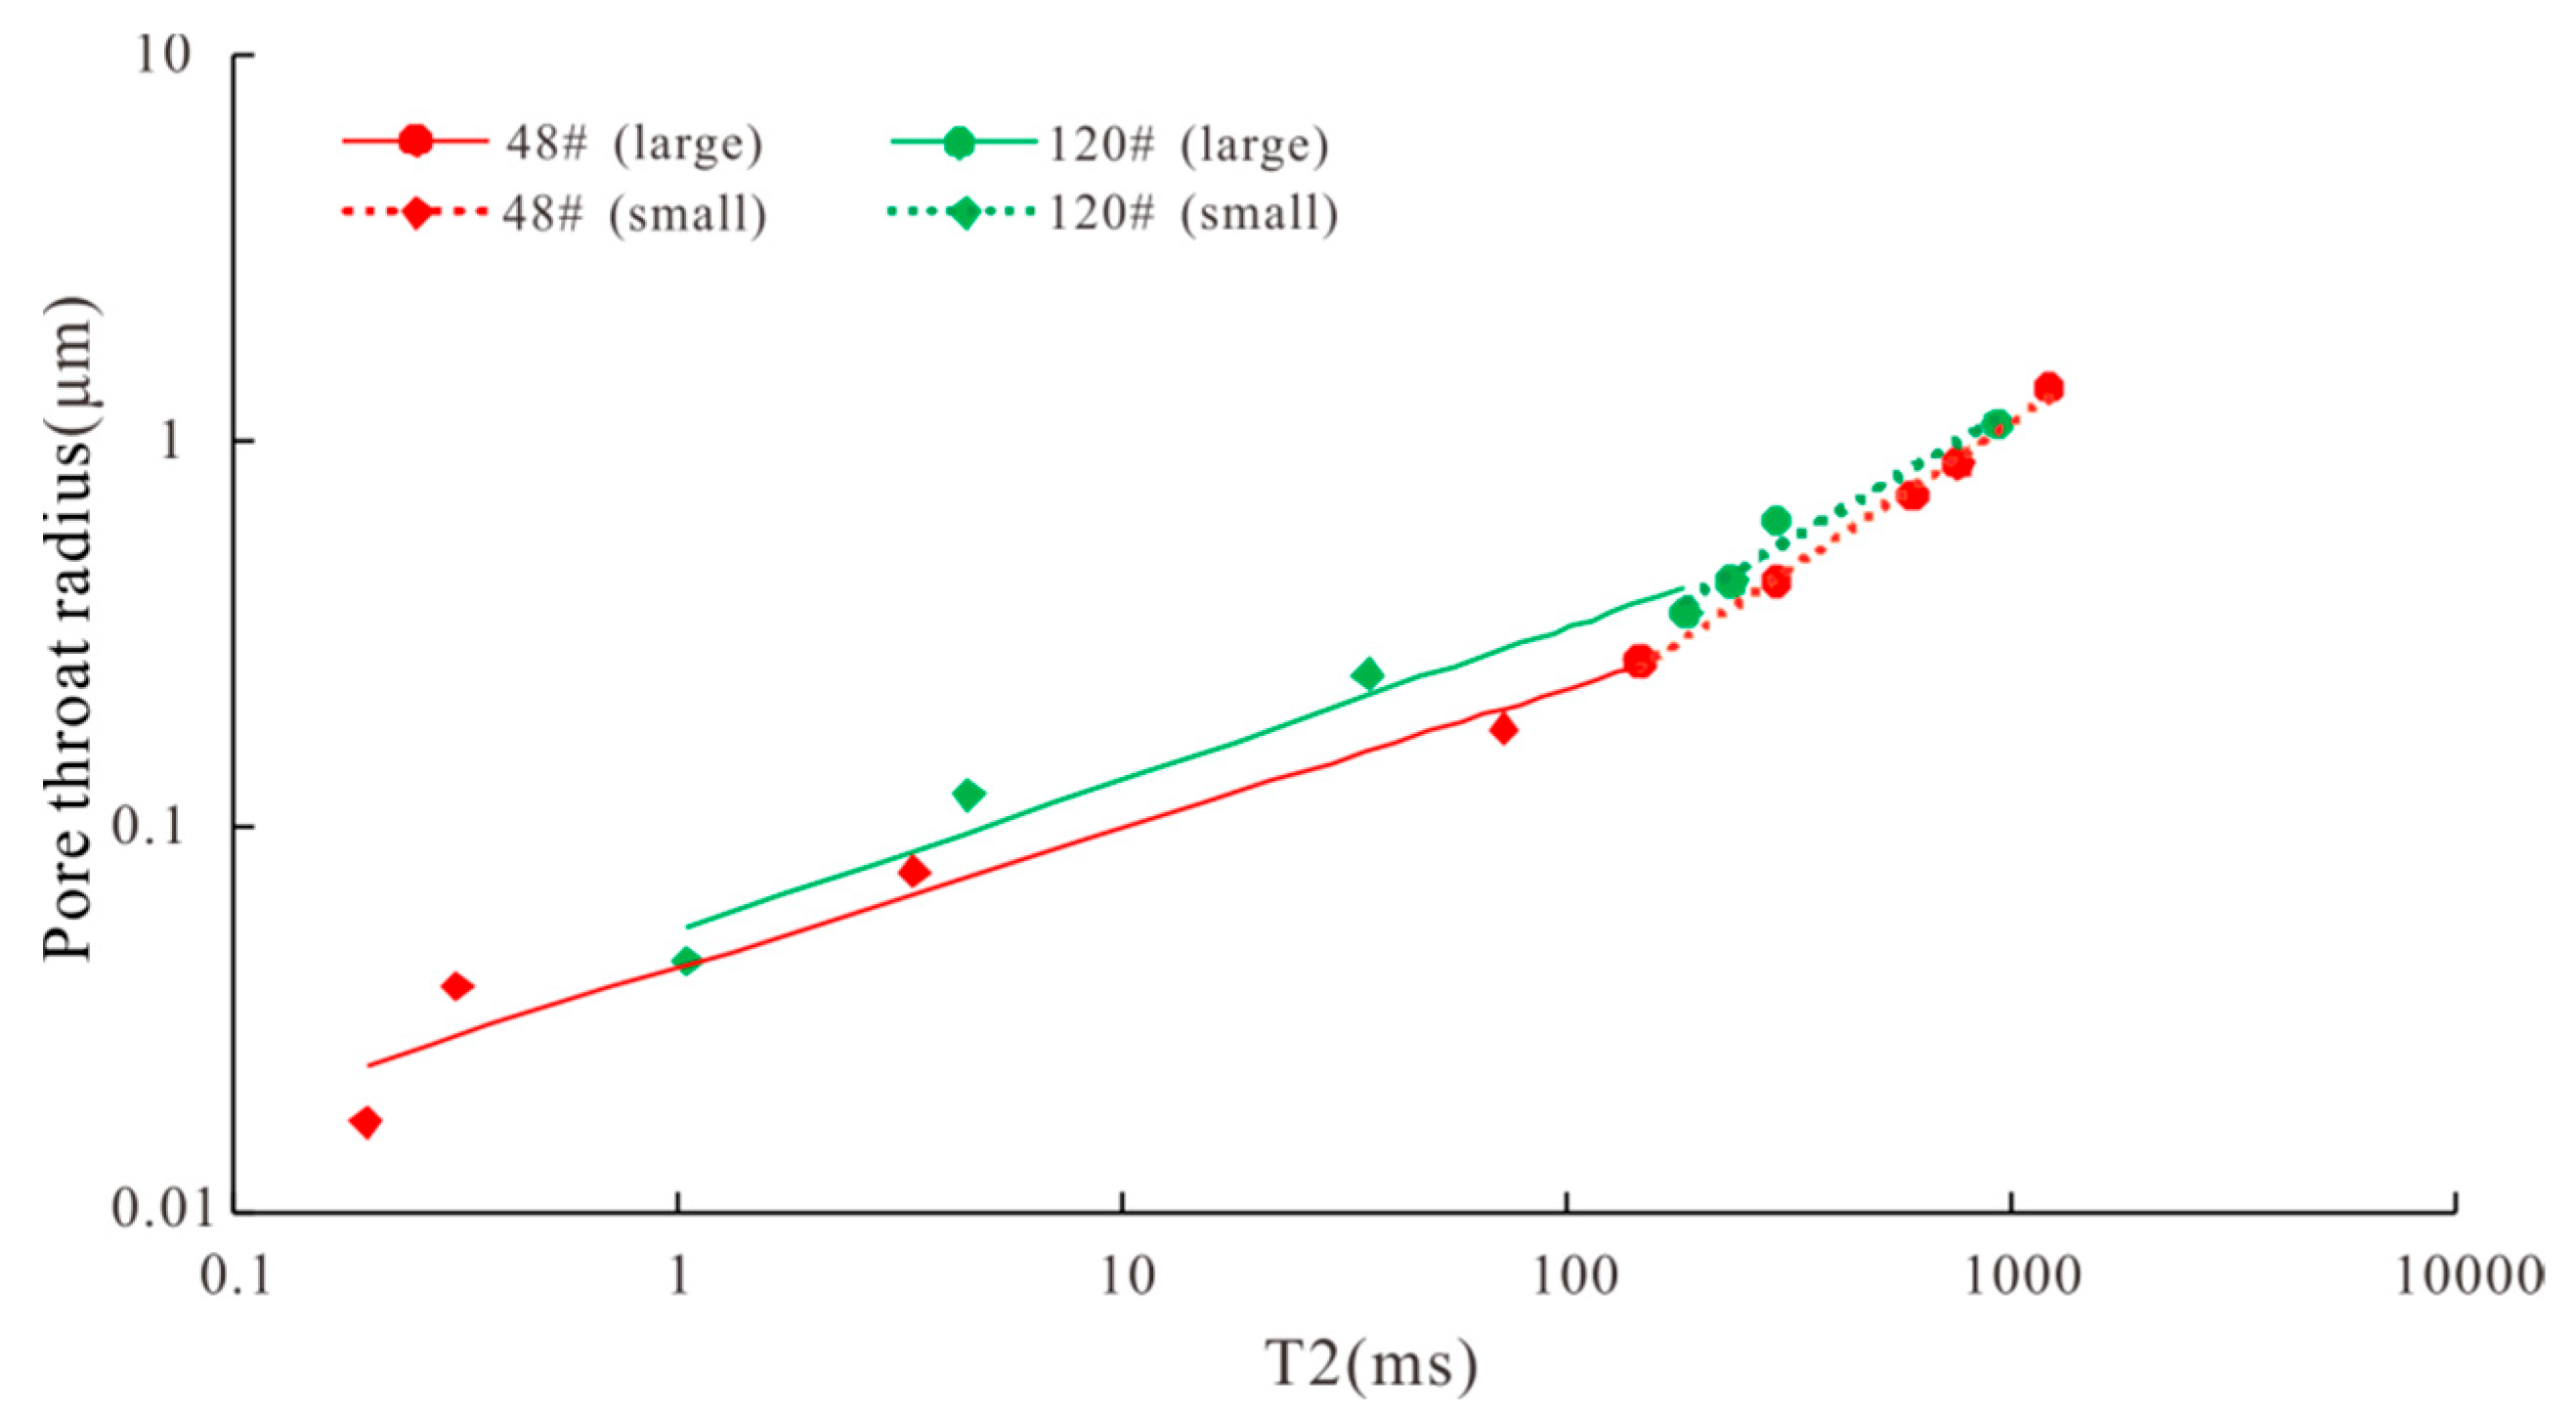
Figure 5 shows the cross plot of the T2 value and pore throat radius of 48# and 120# samples. It can be seen from the curve that the relationship between T2 and the pore throat radius is good, showing the characteristics of the two segments. Although there are three peaks in the sample, the two peaks on the left are relatively small, and the main peak is on the right. When establishing the conversion relationship between the nuclear magnetic T2 value and the mercury intrusion curve, it is not segmented based on the number of peaks but based on the corresponding values of the T2 value and the pore throat radius on the cumulative curve graph. In the intersection plot, there are two different slopes and inflection points as the basis for segmentation. Both double peak and triple peak conform to this method. The NMR T2 spectrum can be segmented to convert into the corresponding capillary pressure and pore throat distribution.

Figure 5.
Cross plot of T2 value and throat radius.
Taking the T2 cut-off value as the dividing point, if it is less than the T2 cut-off value, it is considered to belong to the small hole part, and if it is greater than or equal to the T2 cut-off value, it is considered to belong to the large hole part. The conversion coefficients of the small hole throat and the large hole throat are obtained by fitting according to the power function:
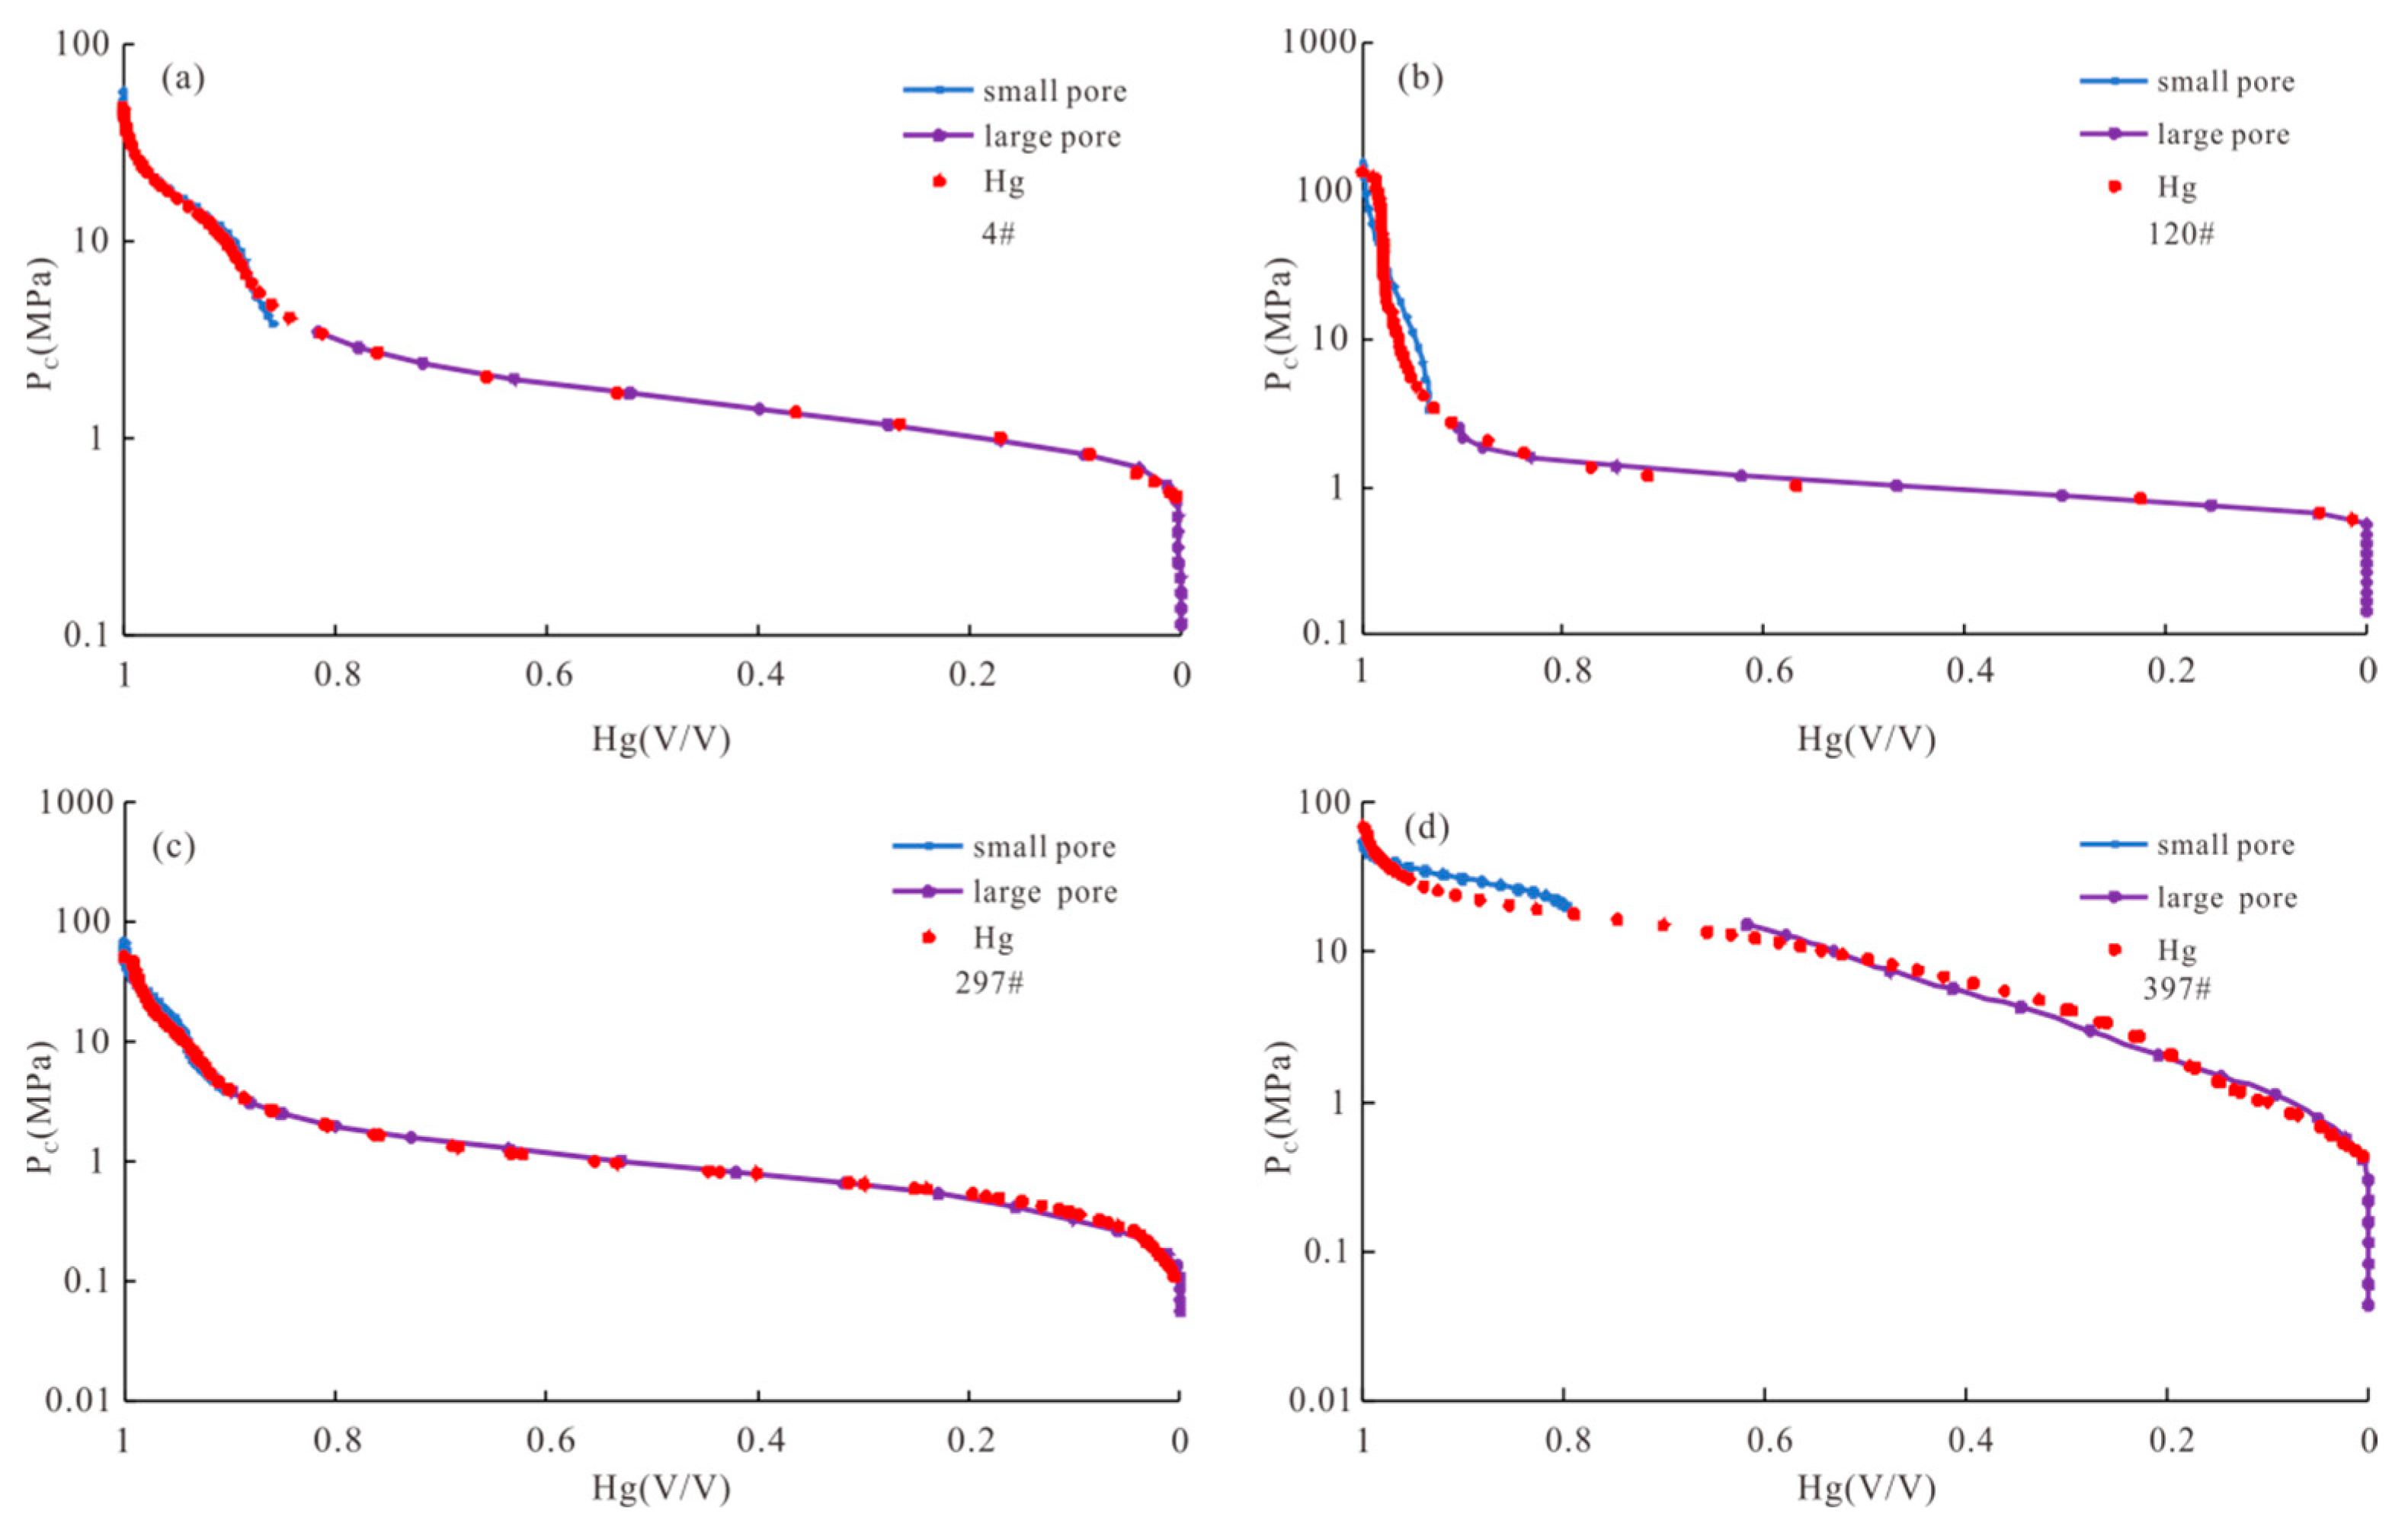
The comparison chart of the T2 spectrum and pore size distribution of the laboratory nuclear magnetic measurement of four cores in the study area is selected. From Figure 6, it can be clearly found that purple is the pseudo-capillary pressure calculated for the large pore throat part, and blue is the pseudo-capillary pressure calculated for the small pore throat part. For cores, the power function calibration method can scale the pseudo-capillary pressure curve very accurately, and the applicability of this method is strong and wide. The red dot is the measured value of mercury intrusion. The power function calibration method can accurately scale the pseudo-capillary pressure on some cores in the study block (Figure 6a,c), but there are also some cores that are difficult to build accurately (Figure 6b,d). The reason for this phenomenon is that the reservoir pore types are more complex. In general, the pseudo-capillary pressure converted from the T2 spectrum of nuclear magnetic logging in the study area can reflect the change of capillary pressure, and there is some internal relationship between the T2 spectrum of nuclear magnetic logging and the mercury injection capillary pressure curve, which can realize mutual conversion.

Figure 6.
Comparison between calculated pseudo-capillary pressure curve and measured (a–d).
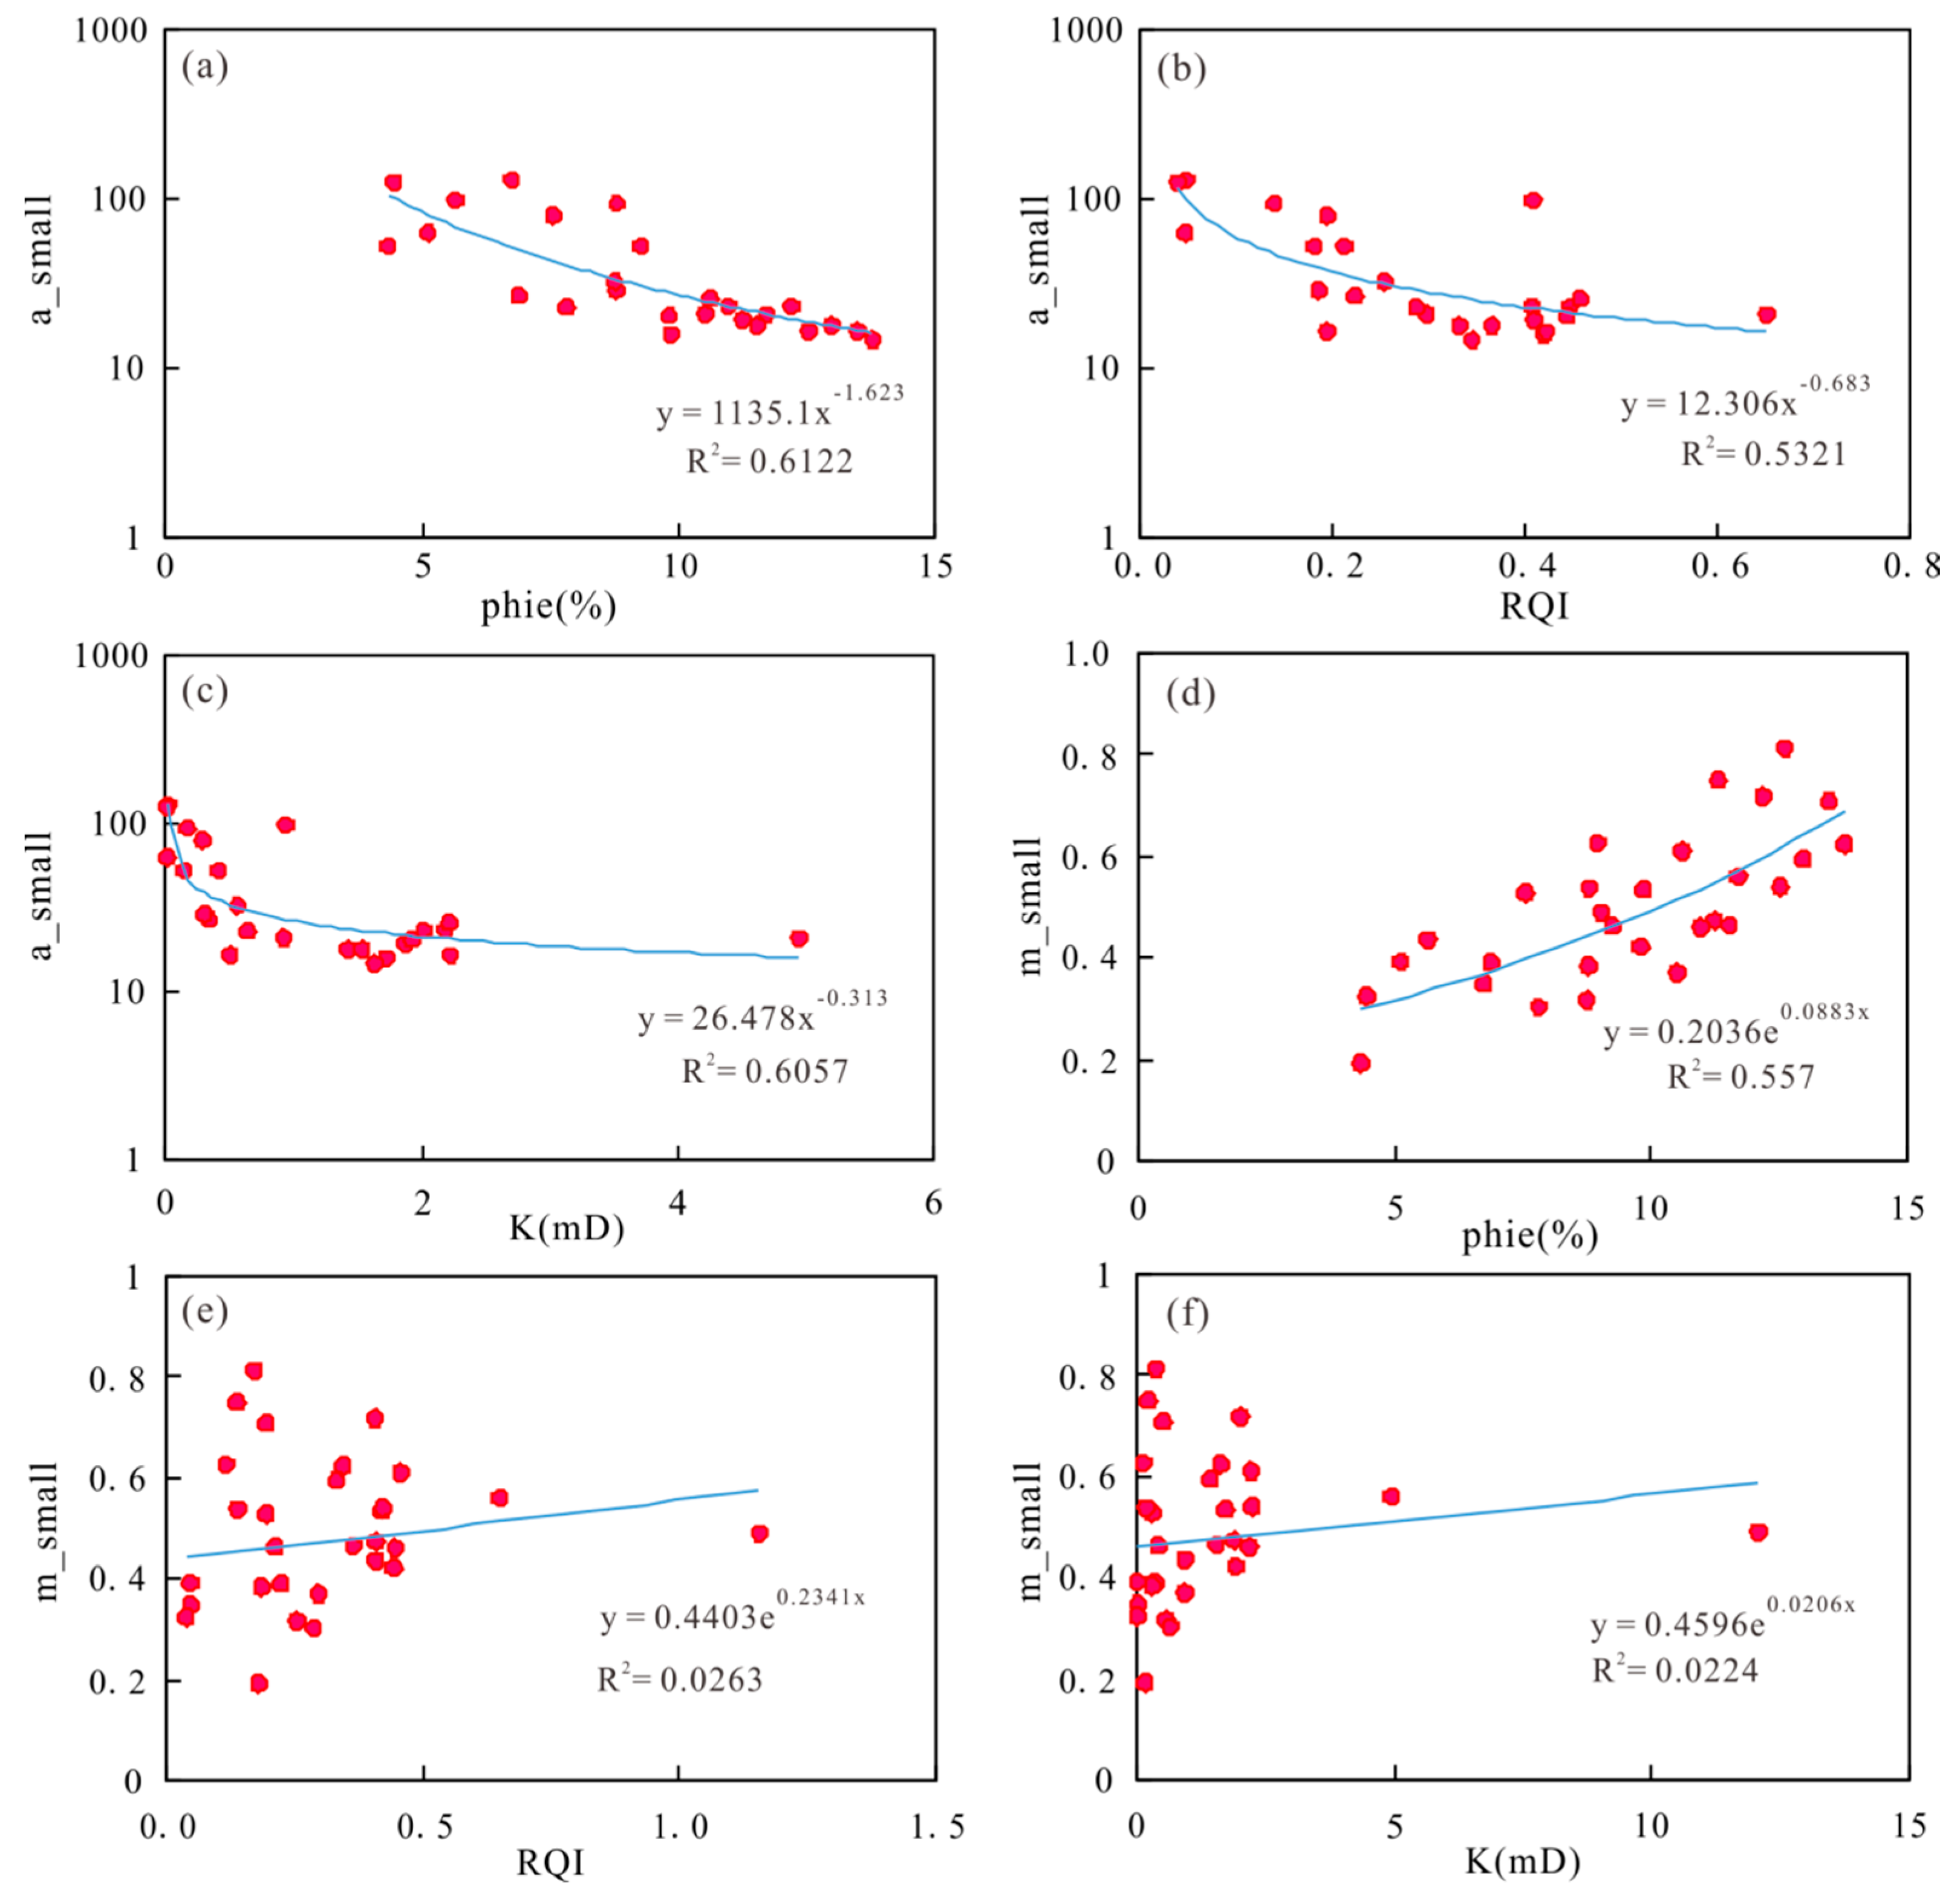
The conversion coefficients a and m of each experimental sample can be obtained by fitting. The conversion coefficients of each sample are different. Due to the difference in the sample pore structure, the conversion coefficients are different. There is an error in calculating the pseudo capillary pressure curve by using fixed values of a and m. Therefore, in order to calculate the pseudo-capillary pressure curve on the continuous well section, variable values of a and m need to be calculated. Figure 7 analyzes the fitting formula of porosity, reservoir quality index, permeability, and a value in the small pore throat, which shows a negative correlation with a, and the fitting coefficient of porosity is the highest (Figure 7a–c). Therefore, a calculation model is established to calculate the continuous a value with reservoir porosity. The specific calculation formula is shown in Formula (10):
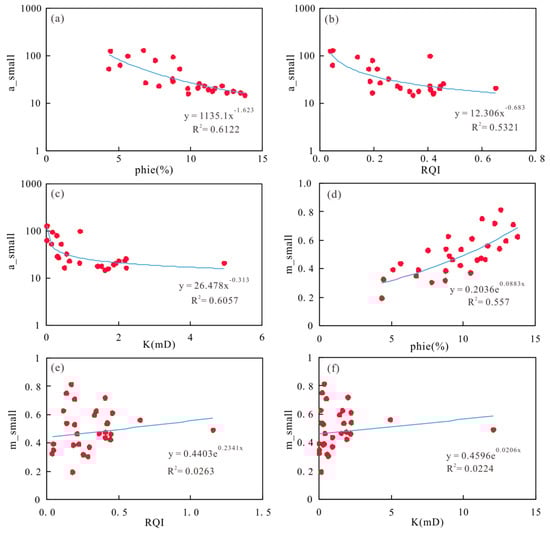
Figure 7.
Cross plot of conversion coefficient and macroscopic physical parameters of small pore throat (a–f).
M is positively correlated with porosity, reservoir quality index, and permeability. Porosity has a good correlation with m, while reservoir quality index and permeability have a weak correlation with m (Figure 7d–f). The calculation model is used to calculate the continuous m value by porosity. The calculation formula is shown in Formula (11):
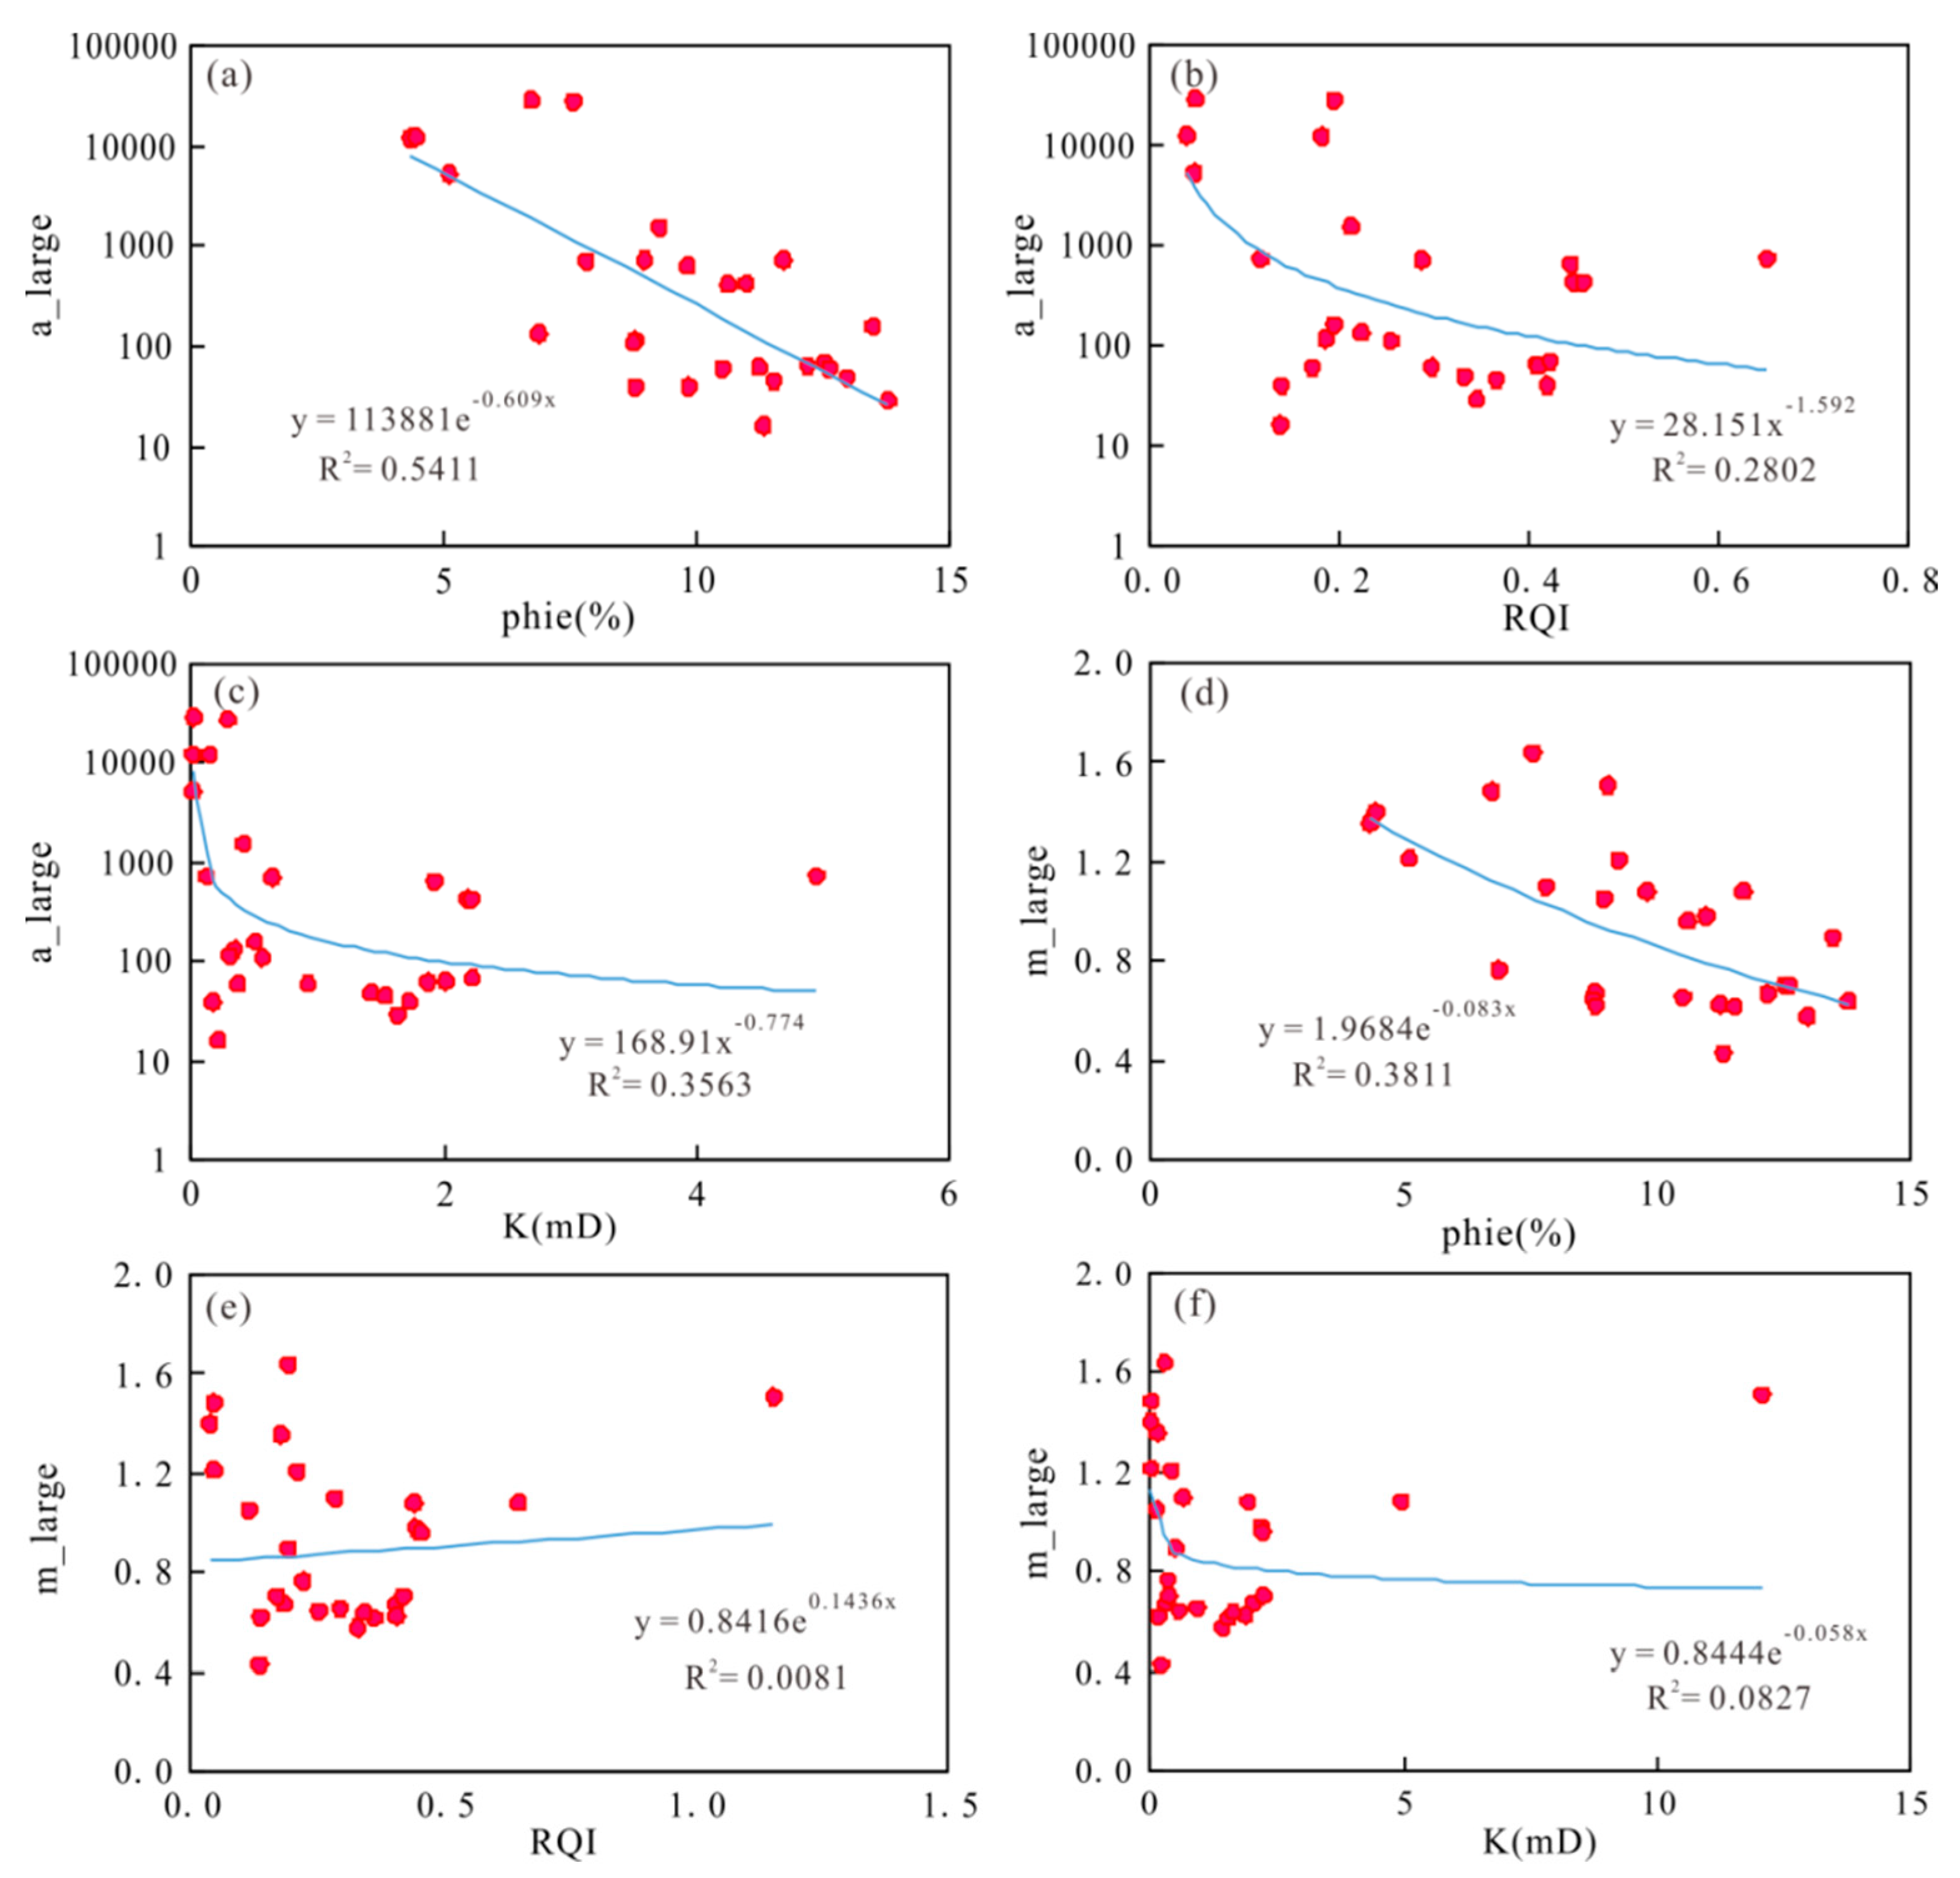
Figure 8 analyzes the fitting formula of porosity, reservoir quality index, permeability, and a value in the macropore throat and shows a negative correlation with a. Among them, the fitting coefficient of porosity and a is the highest, and the fitting coefficient of the reservoir quality index, permeability, and a is low (Figure 8a–c). Therefore, a calculation model is established to calculate the continuous a value with reservoir porosity. The specific calculation formula is shown in Formula (12):
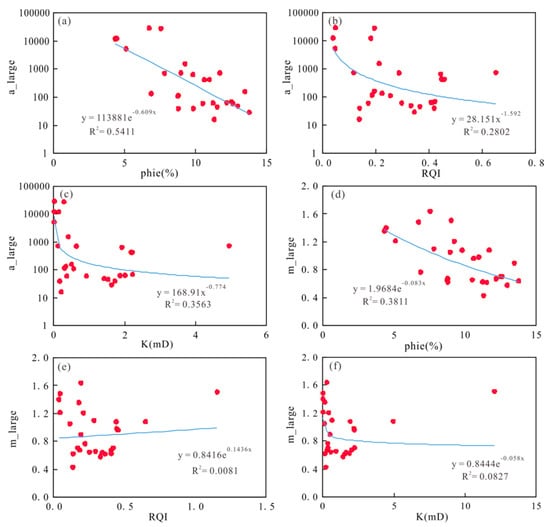
Figure 8.
Cross plot of conversion coefficient and macroscopic physical parameters of large pore throat (a–f).
There is a weak negative correlation between m and porosity, and there is no obvious correlation between m and the reservoir quality index and permeability (Figure 8d–f). Due to the complex pore space and large dissolution pores in carbonate reservoirs, the effect of volume relaxation on larger pores is more significant during nuclear magnetic resonance measurements. In order to simplify the nuclear magnetic resonance conversion capillary model, we mainly considered the influence of surface relaxation. Therefore, when there are pores in the experimental sample, there may be some errors between the nuclear magnetic experiment curve and the mercury intrusion curve, resulting in a weak correlation between the fitting.
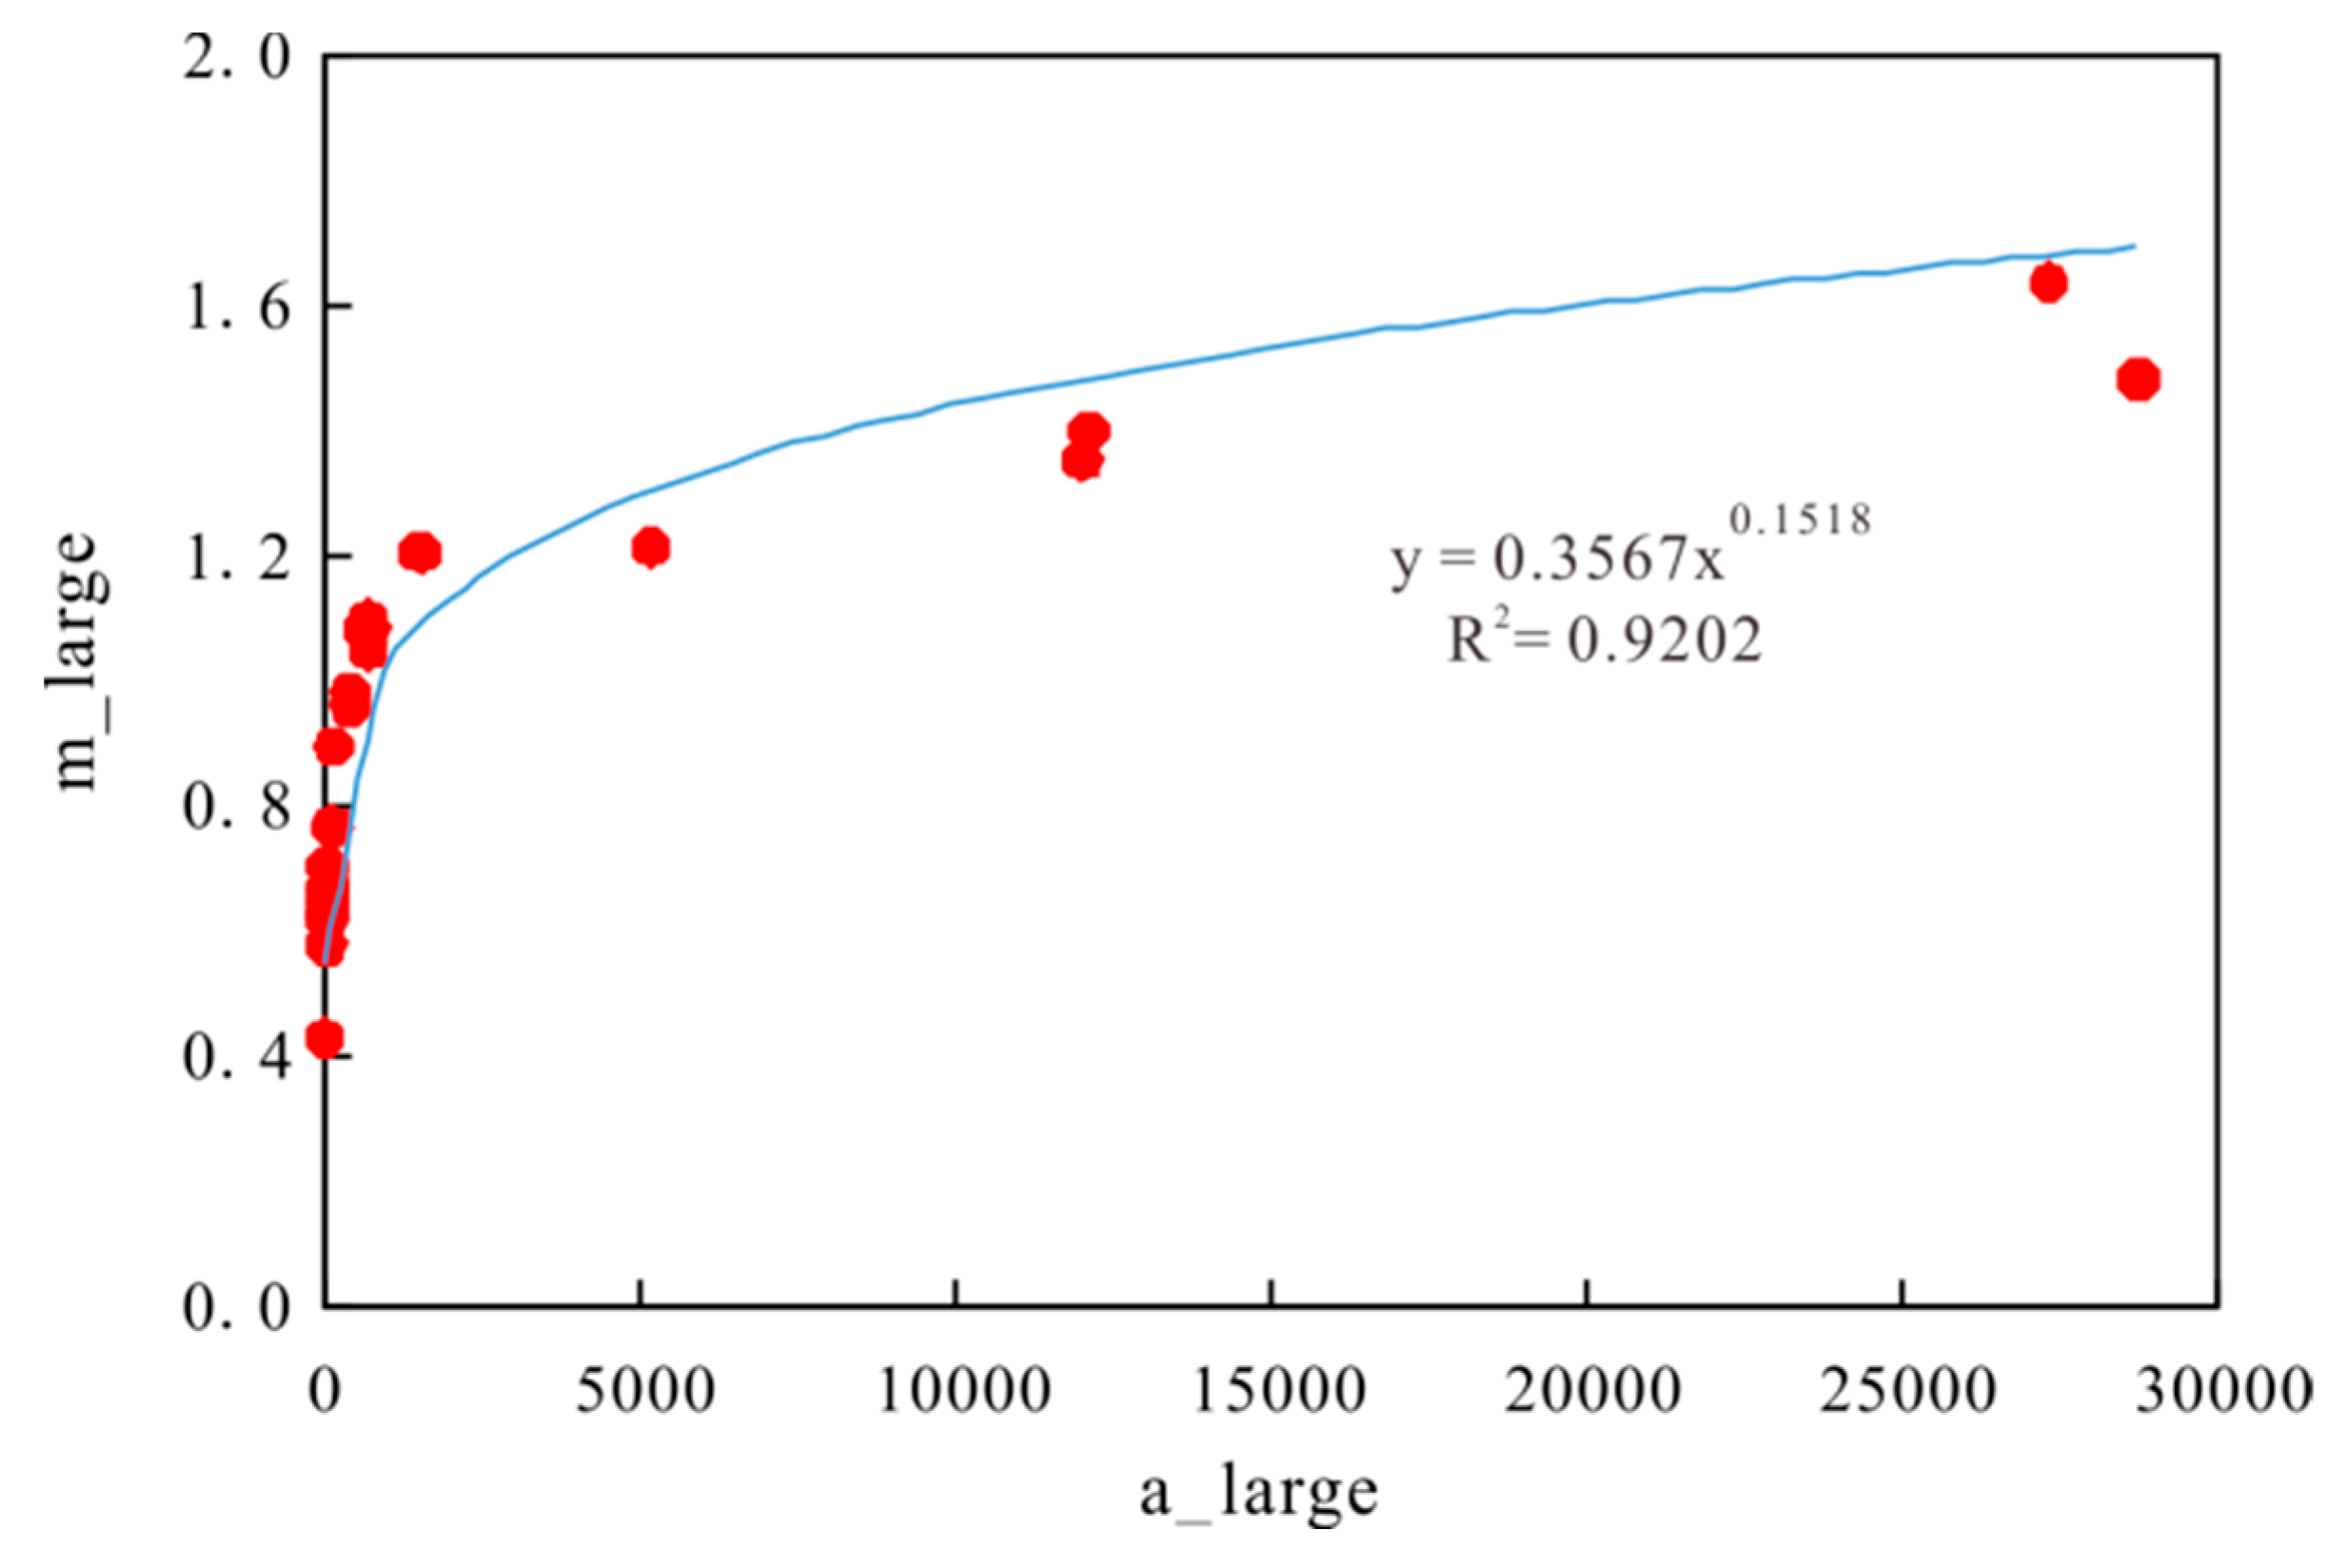
Due to the low correlation between m and the reservoir physical properties and other parameters, the correlation between macropore throat a and m is analyzed (Figure 9). The correlation between them is good. A calculation model is established to calculate the continuous m value by using a. The calculation formula is shown in Formula (13):
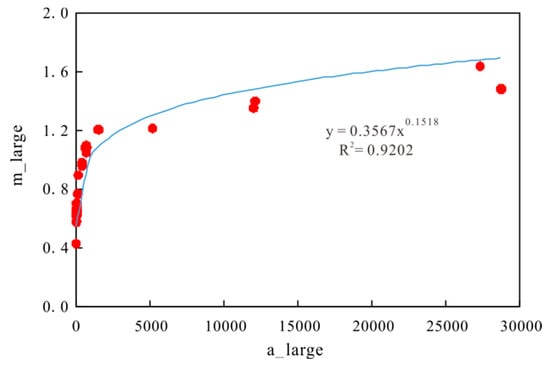
Figure 9.
Cross plot of a and m values of large pore throat.
5. Result Verification
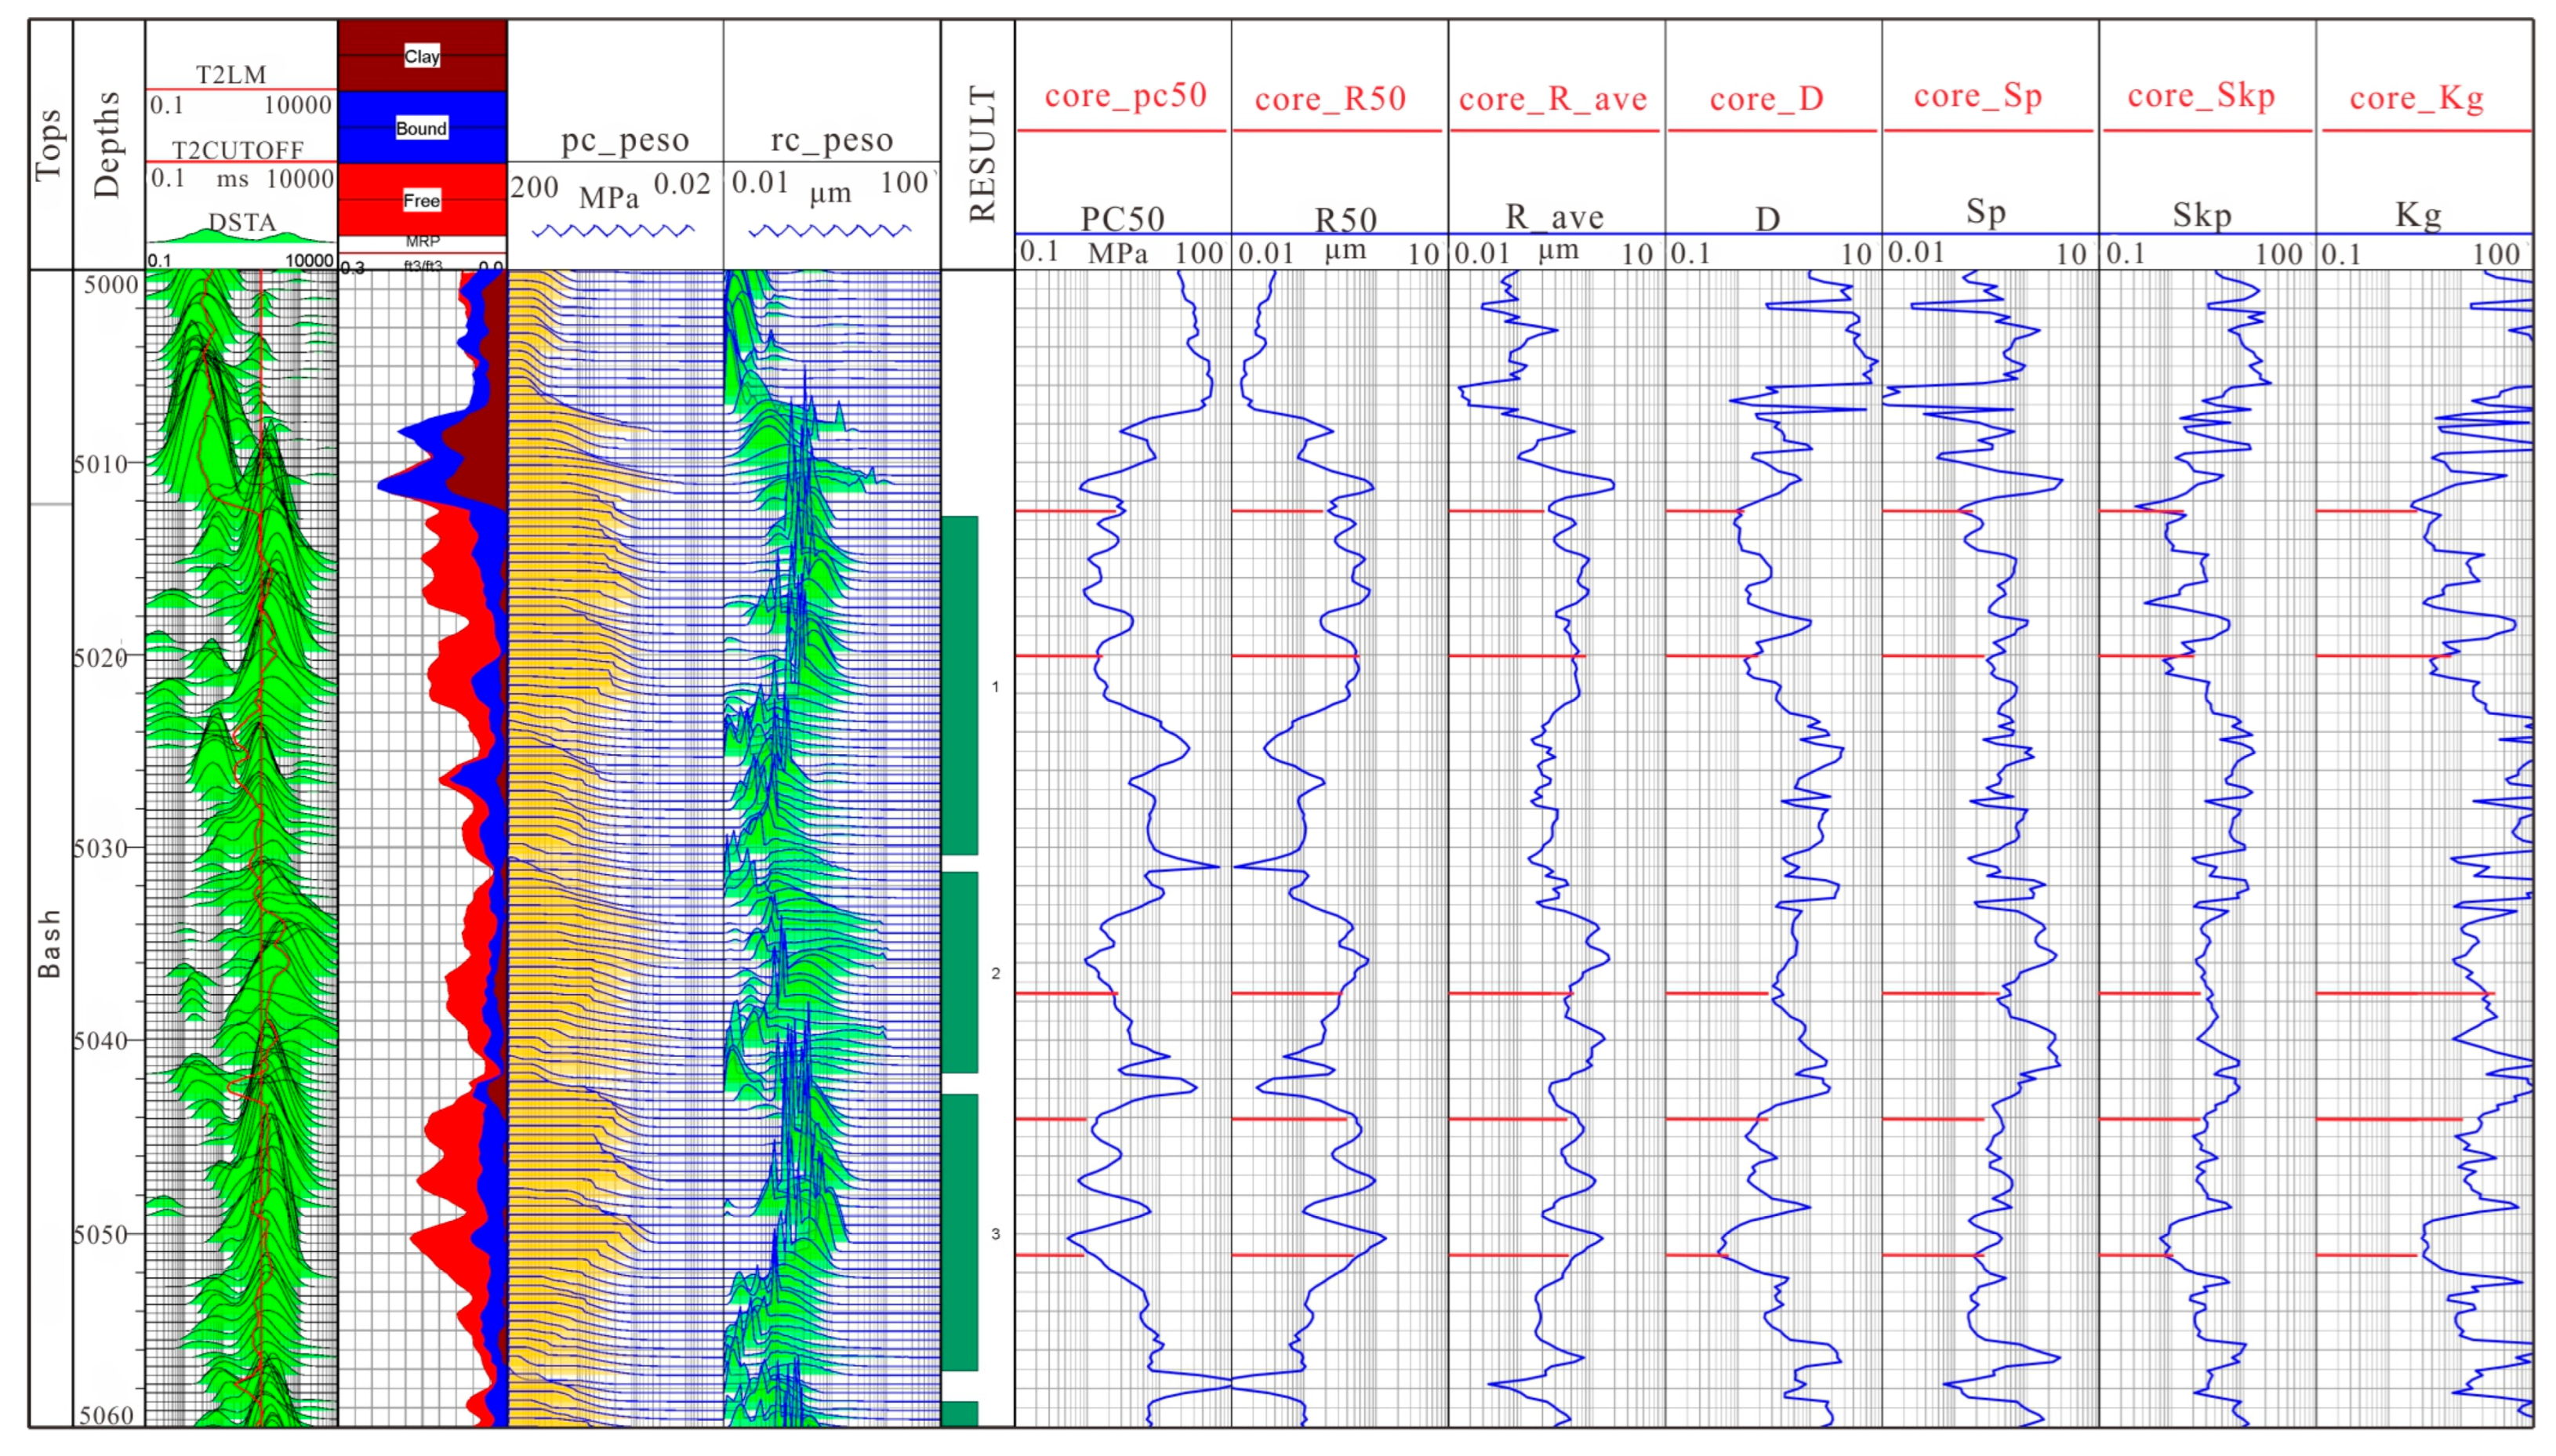
Figure 10 shows the results of the calculation of micro-pore structure parameters of well A in the study area using the methods introduced in this chapter. The fourth is the calculated pseudo-capillary pressure curve, the fifth is the calculated pseudo-pore size distribution, the sixth is the calculated median pressure, the seventh is the calculated median radius, the eighth is the calculated average pore throat radius, the ninth is the calculated relative sorting coefficient, the tenth is the calculated sorting coefficient, and the eleventh is the calculated skewness. The 12th track is the calculated peak state. It can be seen from the figure that, within the reservoir section, the T2 spectral peak of nuclear magnetic logging is backward, the initial mercury inflow pressure is low, the pore size distribution is dominated by large pore sizes, the median pressure is low, and the median radius is large. For the non-reservoir section, the T2 spectral peak of nuclear magnetic logging is in the front, the initial mercury inflow pressure is high, the aperture distribution is small, the aperture is dominant, the median pressure is high, and the median radius is small.
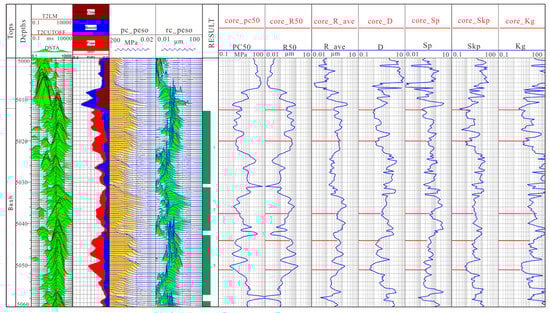
Figure 10.
Analysis results of pore structure of Well A.
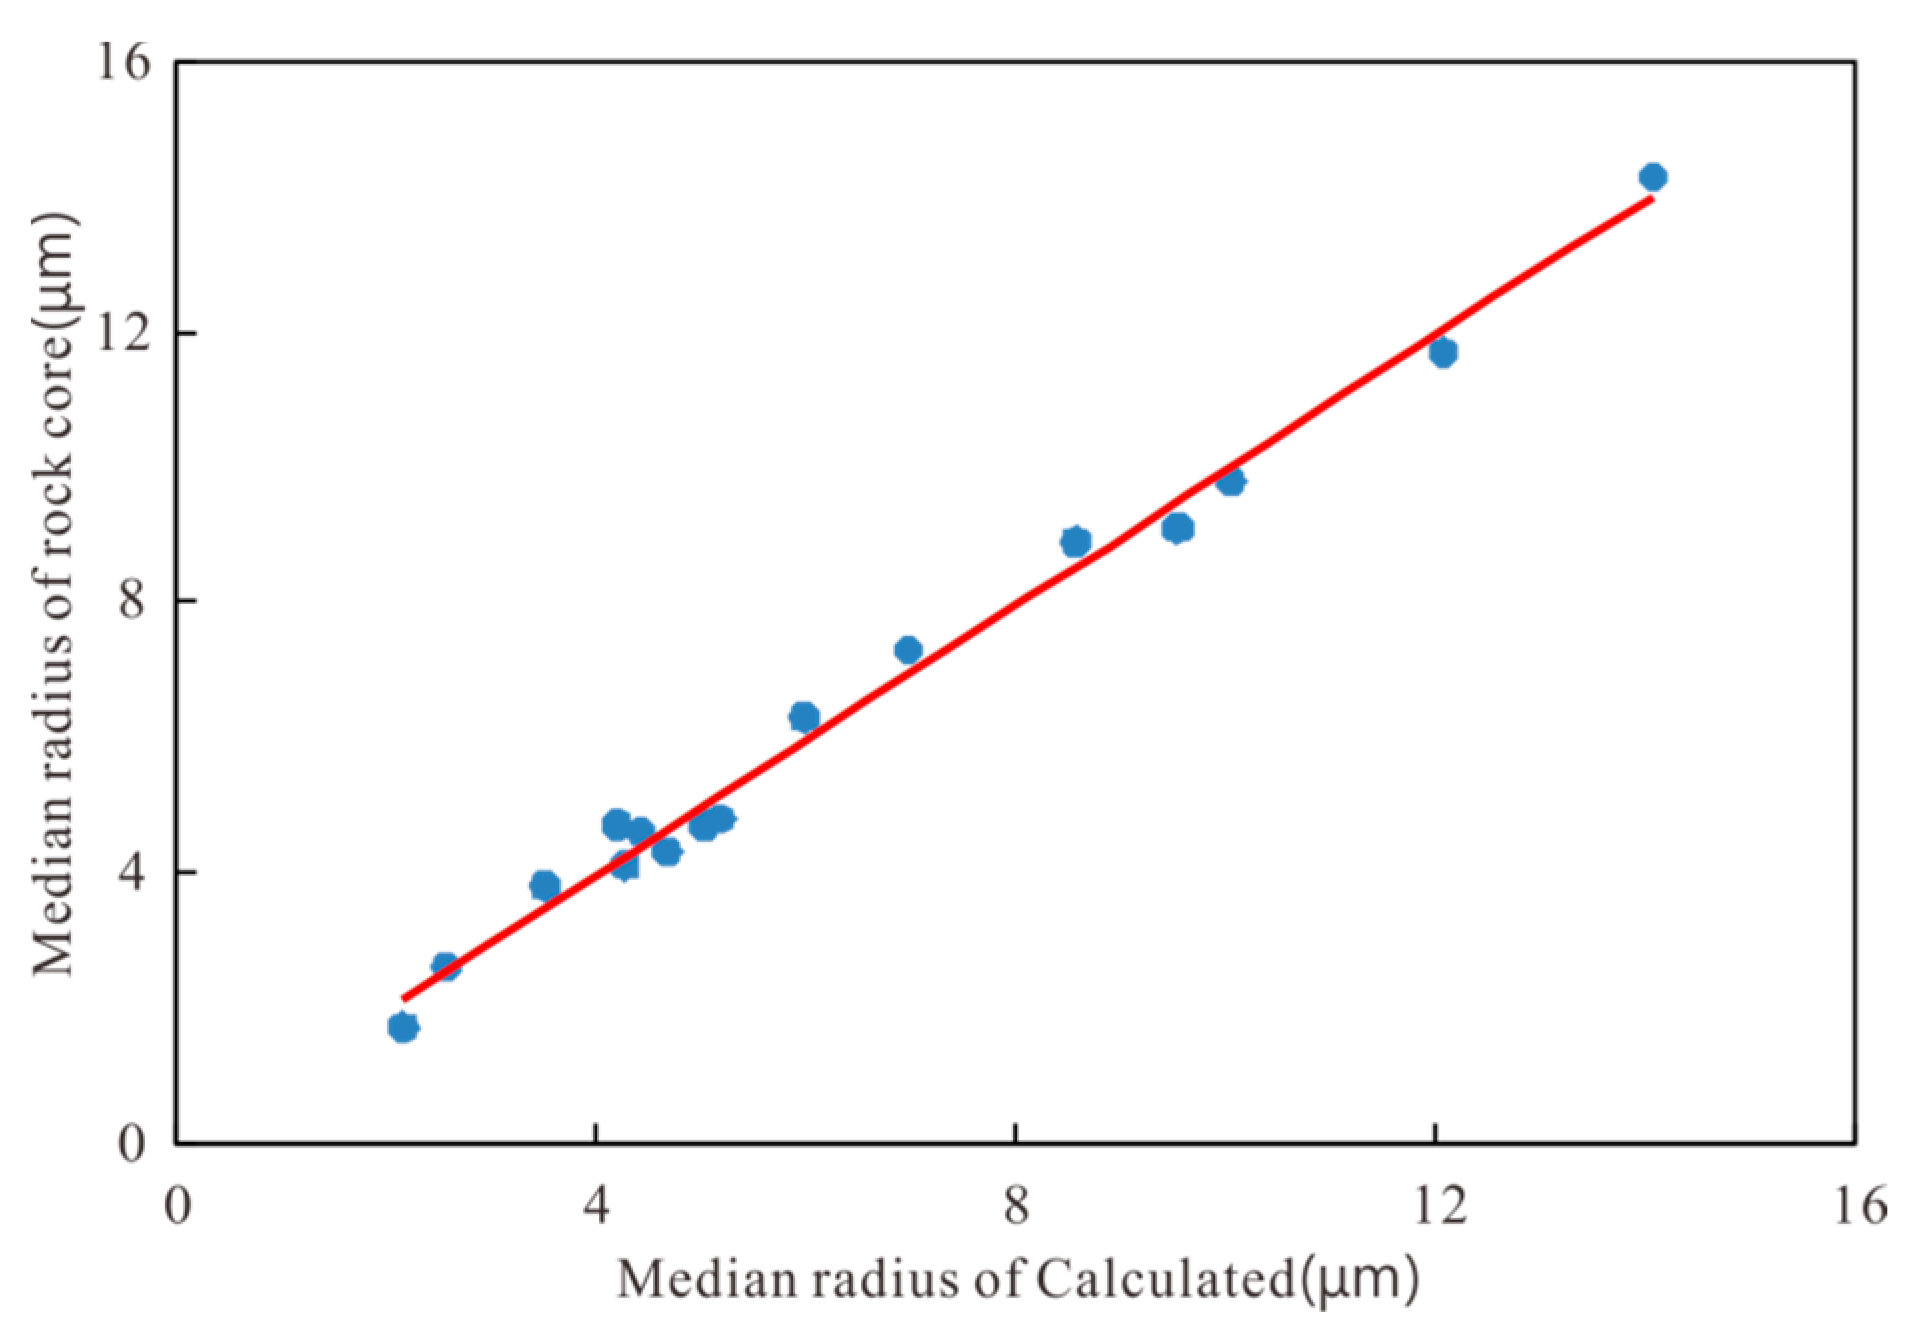
Figure 11 is the intersection diagram of the pore median radius of the mercury injection core analysis and the pore throat median radius calculated by the model. The data points are distributed on the 45-diagonal line, and the calculated results are in good agreement with the core analysis results, which proves that the established model is reliable.
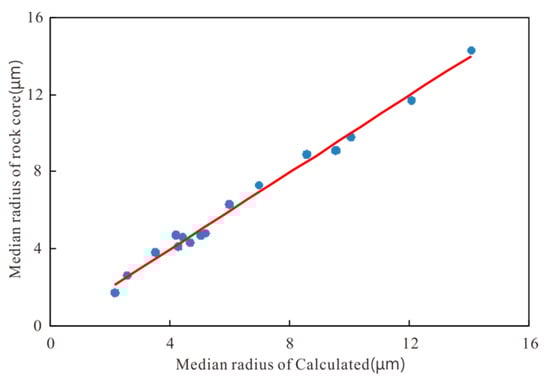
Figure 11.
Intersection diagram of median radius in rock core and calculated median radius.
6. Conclusions
- (1)
- The NMR T2 spectrum of the reservoir is mainly bimodal, with the small pore T2 distributed in 0.1–6 ms, the peak value of which is about 2 ms, and the large pore T2 distributed in 100–6000 ms, mainly concentrated in 100–1000 ms. The throat radius of small pores is 0.04–0.1 μm, the peak value is 0.08 μm, the throat of large pores is 0.1–10 μm, and the peak value is concentrated in 1 μm.
- (2)
- There are obvious segmentation characteristics between the pore throat radius and the nuclear magnetic T2 value. In the capillary pressure conversion model, the a value and m value of small pore throat have a good correlation with reservoir porosity, the a value of large pore throat has a high correlation with porosity, and the m value of large pore throat has a good correlation with the a value. With the calculation model of continuous conversion parameters a, M can be built by using continuous porosity parameters.
- (3)
- The pseudo-capillary pressure curve and pore structure parameters have a very good corresponding relationship with the reservoir. The initial mercury inlet pressure in the reservoir section is low, the pore size distribution is large, the middle pore size is dominant, the median pressure is low, and the median radius is large. The T2 spectrum peak of NMR logging in the non-reservoir section is ahead, the initial mercury injection pressure is high, the pore size distribution is small, the pore size is dominant, the median pressure is high, and the median radius is small.
Author Contributions
L.Z.: methodology, J.W.: data curation, S.W.: writing—original draft preparation, J.H.: writing—review and editing, X.Z.: visualization, T.Z.: supervision. All authors have read and agreed to the published version of the manuscript.
Funding
This paper was supported by the CNPC Major Projects on Oil and Gas(2022DJ3210).
Data Availability Statement
The data used to support the findings of this study are included within the article.
Conflicts of Interest
Authors were employed by the company PetroChina. The remaining authors declare that the research was conducted in the absence of any commercial or financial relationships that could be construed as a potential conflict of interest. The PetroChina had no role in the design of the study; in the collection, analyses, or interpretation of data; in the writing of the manuscript, or in the decision to publish the results.
References
- Zhao, W.; Shen, A.; Qiao, Z.; Zhang, J.; Ni, X. Theoretical progress in carbonate reservoir and discovery of large marine oil and gas fields in China. China Pet. Explor. 2022, 27, 1–15. [Google Scholar]
- Ning, C.; Sun, L.; Hu, S.; Xu, H.; Pan, W.; Li, Y.; Zhao, K. Karst types and characteristics of the Ordovician fracture-cavity type carbonate reservoirs in Halahatang oilfield, Tarim Basin. Acta Pet. Sin. 2021, 42, 15–32. [Google Scholar]
- Wu, X.; Liu, Z.X.; Wang, J.; Zheng, M.; Chen, X.; Qi, X. Potential, distribution and key exploration fields. Earth Sci. Front. 2022, 29, 146. [Google Scholar] [CrossRef]
- Fu, J. Geological characteristics and exploration potential of tight limestone natural gas accumulation in Taiyuan formation, Ordos Basin. Earth Sci. Front. 2023, 30, 20–29. [Google Scholar] [CrossRef]
- Li, M.; Zhou, Y.; Zhao, Y.; Geng, F.; Qiao, G.; Hao, J. Geochemical characteristic and fluid origins of fracture-and cave filling calcites of ordovician in YuBei area, Tarim Basin. Pet. Geol. Exp. 2022, 44, 593–602. [Google Scholar]
- Liu, Y.; Hu, M.; Zhang, S. Types, structural evolution difference and petroleum geological significance of CambrianOrdovician carbonate platforms in Gucheng-Xiaotang area, Tarim Basin, NW China. Pet. Explor. Dev. 2022, 49, 1–12. [Google Scholar] [CrossRef]
- Li, F.; Guo, R.; Song, S. Reservoir Characteristics of carbonate rock of Mishrif Formation in Cretaceous, M Oilfield in the Middle East. J. China Univ. Pet. (Ed. Nat. Sci.) 2021, 45, 12–24. [Google Scholar]
- Feng, Z.; Shao, H.; Liu, Y.; Lu, X.; Zhao, W.; Bai, X.J.; Xu, Z.Y. Study on the relationship between the Ordovician diagenetic fluid and carbonate reservoir development in Gucheng area, Tarim Basin. China Pet. Explor. 2022, 27, 47–60. [Google Scholar]
- Mu, L.; Chen, Y.; Xu, A.; Wang, R. Technological progress and development directions of PetroChina overseas oil and gas field production. Pet. Explor. Dev. 2020, 47, 120–128. [Google Scholar] [CrossRef]
- Mu, L.; Ji, Z. Technological progress and development directions of PetroChina overseas oil and gas exploration. Pet. Explor. Dev. 2019, 46, 1027–1036. [Google Scholar] [CrossRef]
- Chen, J. Pore structure characteristics and depletion development rules of deep high-pressure carbonate gas reservoirs. Spec. Oil Gas Reserv. 2022, 29, 80–87. [Google Scholar]
- Liu, Q.; Cai, Z.; Xue, Y. Full pore size characterization of dolomite pore structure of Xiaolbulake Formation in the Peripheral Area of Keping, Tarim Basin. Sci. Technol. Eng. 2022, 22, 5213–5221. [Google Scholar]
- Hou, J.; Lin, Y.; Zhao, W.; Luo, M.; Li, J.; Wang, S. Logging evaluation of Carboniferous carbonate reservoir in North Truwa Oilfield, Kazakhstan. Mar. Orig. Pet. Geol. 2022, 27, 103–112. [Google Scholar]
- Fang, X.; Feng, H.; Wu, H.; Wang, Y. Study on a quantitative rock type discrimination model for porous carbonate reservoirs: A case by the Late Cretaceous Mishrif Formation in the West Qurna oilfield, Iraq. Prog. Geophys. 2022, 37, 1013–1023. (In Chinese) [Google Scholar]
- Zhang, Y.; Yang, Z.; Huang, Y.; Li, H.; Hou, H.; Zhu, G. Study on reservoir characteristic and remaining oil distribution of low permeability pore type carbonate rock. J. Jilin Univ. (Earth Sci. Ed.) 2021, 51, 659–668. [Google Scholar]
- Rabbani, A.; Assadi, A.; Kharrat, R.; Dashti, N.; Ayatollahi, S. Estimation of Carbonates Permeability using Pore Network Parameters Extracted From Thin Section Images and Comparison with Experimental Data. J. Nat. Gas Sci. Eng. 2017, 42, 85–98. [Google Scholar] [CrossRef]
- Xiao, L.; Liu, T.; Fu, R. Application of nuclear magnetic resonance log to trapping capability evaluation. Acta Pet. Sin. 2004, 25, 38–41. [Google Scholar]
- He, Y.; Mao, Z.; Xiao, L.; Zhang, Y. A New Method to Obtain Capillary Pressure CurveUsing NMR T2 Distribution. J. Jilin Univ. (Earth Sci. Ed.) 2005, 35, 177–181. [Google Scholar]
- Zhou, C.; Liu, T.; Ma, Z.; Liu, Z.; Lui, G. Evaluation of pore structure using sphere-cylinder model. Acta Pet. Sin. 2006, 27, 92–96. [Google Scholar]
- Liang, X.; Wei, Z. A New Method to Construct Reservoir Capillary Pressure Curves using NMR Log Data and its Application. Appl. Geophys. 2008, 5, 92–98. [Google Scholar] [CrossRef]
- Cong, Y.; Fan, Y.; Deng, S.; Ye, Q.; Chen, F. The Research on Pore Structure in Tight Sand Reservoir Based on the Three-Component Decomposition Theory of the NMR T2 Spectrum. Well Log. Technol. 2013, 37, 600–604. [Google Scholar]
- Yan, J.; Wen, D.; Li, Z.; Geng, B.; Cai, J.; Liang, Q.; Yan, Y. The quantitative evalution method of low permeable sandstone pore structure based on nuclear magnetic resonance (NMR) logging. Chin. J. Geophys. 2016, 59, 1543–1552. [Google Scholar]
- Liang, X.; Zou, C.; Mao, Z.; Jin, Y.; Zhu, J. A New Technique for Synthetizing Capillary Pressure (Pc) Curves using NMR Logs in Tight Gas Sandstone Reservoirs. J. Pet. Sci. Eng. 2016, 145, 493–501. [Google Scholar]
- Liu, Z.; Ou-Yang, C.; Wang, C.; Han, D.; Wu, Q.; Gao, X. CConstruct NMR Capillary Pressure Curves by Piecewise Power Function Based on T2 Cutoff Values. Chin. J. Magn. Reson. 2019, 36, 45–54. [Google Scholar]
- Xiao, L. Principle and Application of Nuclear Magnetic Resonance Logging; Petroleum Industry Press: Beijing, China, 2007. [Google Scholar]
Disclaimer/Publisher’s Note: The statements, opinions and data contained in all publications are solely those of the individual author(s) and contributor(s) and not of MDPI and/or the editor(s). MDPI and/or the editor(s) disclaim responsibility for any injury to people or property resulting from any ideas, methods, instructions or products referred to in the content. |
© 2025 by the authors. Licensee MDPI, Basel, Switzerland. This article is an open access article distributed under the terms and conditions of the Creative Commons Attribution (CC BY) license (https://creativecommons.org/licenses/by/4.0/).