Abstract
Poly(3-hydroxybutyrate-co-3-hydroxyvalerate) (PHBV) is thermoplastic, biodegradable, and derived from renewable-source polymers; thus, it can be used as an alternative to traditional synthetic polymers to reduce damage to the environment. The production of cassava starch generates a high amount of cassava bagasse (about 93% of processed roots) in the separation step of starch. The utilization of this waste is essential due to the difficulty of transportation and storage, besides the detriment caused to the environment by its incorrect disposal. This work aimed to evaluate the possibility of using cassava bagasse as a reinforcement in the production of biocomposites with PHBV matrices by compression molding. The physical–chemical and thermal properties of these biocomposites were characterized. The residue can be used as a filler in compression-molded PHBV biocomposites. The most suitable formulation was 10 wt. %, despite the presence of some cassava bagasse (CB) agglomerations. This film could be used as rigid packaging for chilled or shelf-aqueous food.
1. Introduction
The agro-industries generate a significant amount of solid waste. Specifically, the fruit and vegetable industries contribute 16% of total food processing waste, with 48% of the edible mass of fruits and vegetables discarded during production [1]. The food and beverage industry in Europe alone produces up to 37 million tons of agro-industrial waste. This issue will escalate significantly, considering that agro-industrial waste increases proportionally with the growing human population, projected to reach 9.3 billion by 2050 [2]. Researchers have explored alternative applications for these solid agro-wastes, such as their use as fillers in composites. Environmental concerns and availability as low-cost sources of lignocellulosic materials are driving factors for their utilization. Additionally, incorporating them into polymer matrices can enhance specific material properties [3,4,5].
Cassava (Manihot esculenta crantz) is one of the oldest root and tuber crops that humans use to produce food, feed, and beverages. Currently, cassava is made in 103 countries worldwide, with demand from millions of people living in tropical America, Africa, and Asia [6]. It is the fifth most abundant starch crop produced in the world after maize, rice, wheat, and potato [7]. Its starch industry generates cassava bagasse with a high moisture content (about 85%) as the main residue [8,9]. These difficulties lead to the improper disposal of what is not sold to be used as animal feed in neighboring lands [10]. This agro-waste represents about 93% of the processed cassava roots. It has a remaining starch content of about 45 to 60% (dry basis) [11], 15–18% cellulose, 4–5% hemicelluloses, 1.5–2.0% protein, and 0.4–0.5% reducing sugars, with low levels of lignin (2–3%) and pentosans (2%) [12]. Due to the substantial starch quantity and the considerable cellulose fiber presence, using cassava bagasse as a reinforcement in composites is a possible application of this agro-waste in materials potentially suitable for biodegradable industry packing [13,14].
Many researchers have studied different forms of cassava bagasse applications, including its use as a natural filler for composite materials. Versino et al. (2015) [11] added 0.5 and 1.5 wt. % of CB in a thermoplastic cassava starch matrix with glycerol at 20 wt. % as a plasticizer, which was processed by compression molding. The thermal stability of the biocomposites was not affected by the presence of CB, and the mechanical properties were enhanced, as could be noticed by the increase in the maximum tensile strength and the elastic modulus values of the biocomposite films, with the 1.5% addition of CB being the one that increased these properties the most.
Another environmental concern is the packaging sector. This sector represents the most significant application of plastics, the majority of which are petroleum-based, such as polyethylene and polypropylene, and they usually are non-biodegradable [15]. Because of their short service time, they end up in landfills, with these being the leading waste management tools worldwide—almost 60% of plastic solid waste is disposed of in this way [16]. Thus, there is a critical need to find a new eco-friendly substitute. Biopolymers, described as bio-sourced or biodegradable, appear to be a good option [17].
Polyhydroxyalkanoates (PHAs) are a family of biopolyesters and are among the most extensively studied biopolymers. PHAs have the advantage of meeting both definitions of a biopolymer in that they are bio-based and biodegradable. Their production occurs naturally in numerous microorganisms and plants. These biopolymers are formed in certain microorganisms because of their defense mechanism or as a storage material [18,19,20]. Poly(3-hydroxybutyrate-co-3-hydroxyvalerate) (PHBV) is an aliphatic polyester that belongs to the PHA family. In addition, PHBV is compostable [21], recyclable [22], and can be processed by standard techniques, such as extrusion [23], spinning [24], injection molding [25], compression molding [26], and additive manufacturing [17]. However, due to some characteristics of PHBV, like its slow crystallization rate, relatively tricky processing, very high crystallinity, short processing window, tendency to brittleness, and high cost, producing a biocomposite using natural fibers is a way to adjust these characteristics and lower the material cost for food packaging applications [27].
Some biocomposites were manufactured with PHBV as a matrix and natural residues from aliment industries as fillers, like wheat [28], spent coffee grounds [29], palm fiber residues [30], and coir fiber [31]. The composites produced with wheat demonstrated that increasing the fiber content enhanced the water–vapor transfer rate. The authors explained the hydrophilicity of the fibers by the structural changes induced by the presence of fibers. In this case, they could fulfill the requirements of respiring fresh food products, such as strawberries, thus enabling them to be preserved better than currently used polyolefins. The addition of coir fiber in the PHBV matrix increased the specific toughness and the strain-at-break. Additionally, its addition led to an increase in the PHBV crystallinity degree [32]. These results and research show great interest in using the by-products of the agricultural industry in PHBV matrices.
The reuse of food industry waste for packaging applications has increased over the past decades, primarily due to the environmental issues associated with the high use of single-use polymer-based packaging. This has significantly contributed to the accumulation of plastic waste in landfills and surface and marine water sources. Consequently, waste from tapioca (cassava) production industries is emerging as an excellent alternative for such applications. Brazil is one of the leading producers and exporters of this food gum worldwide.
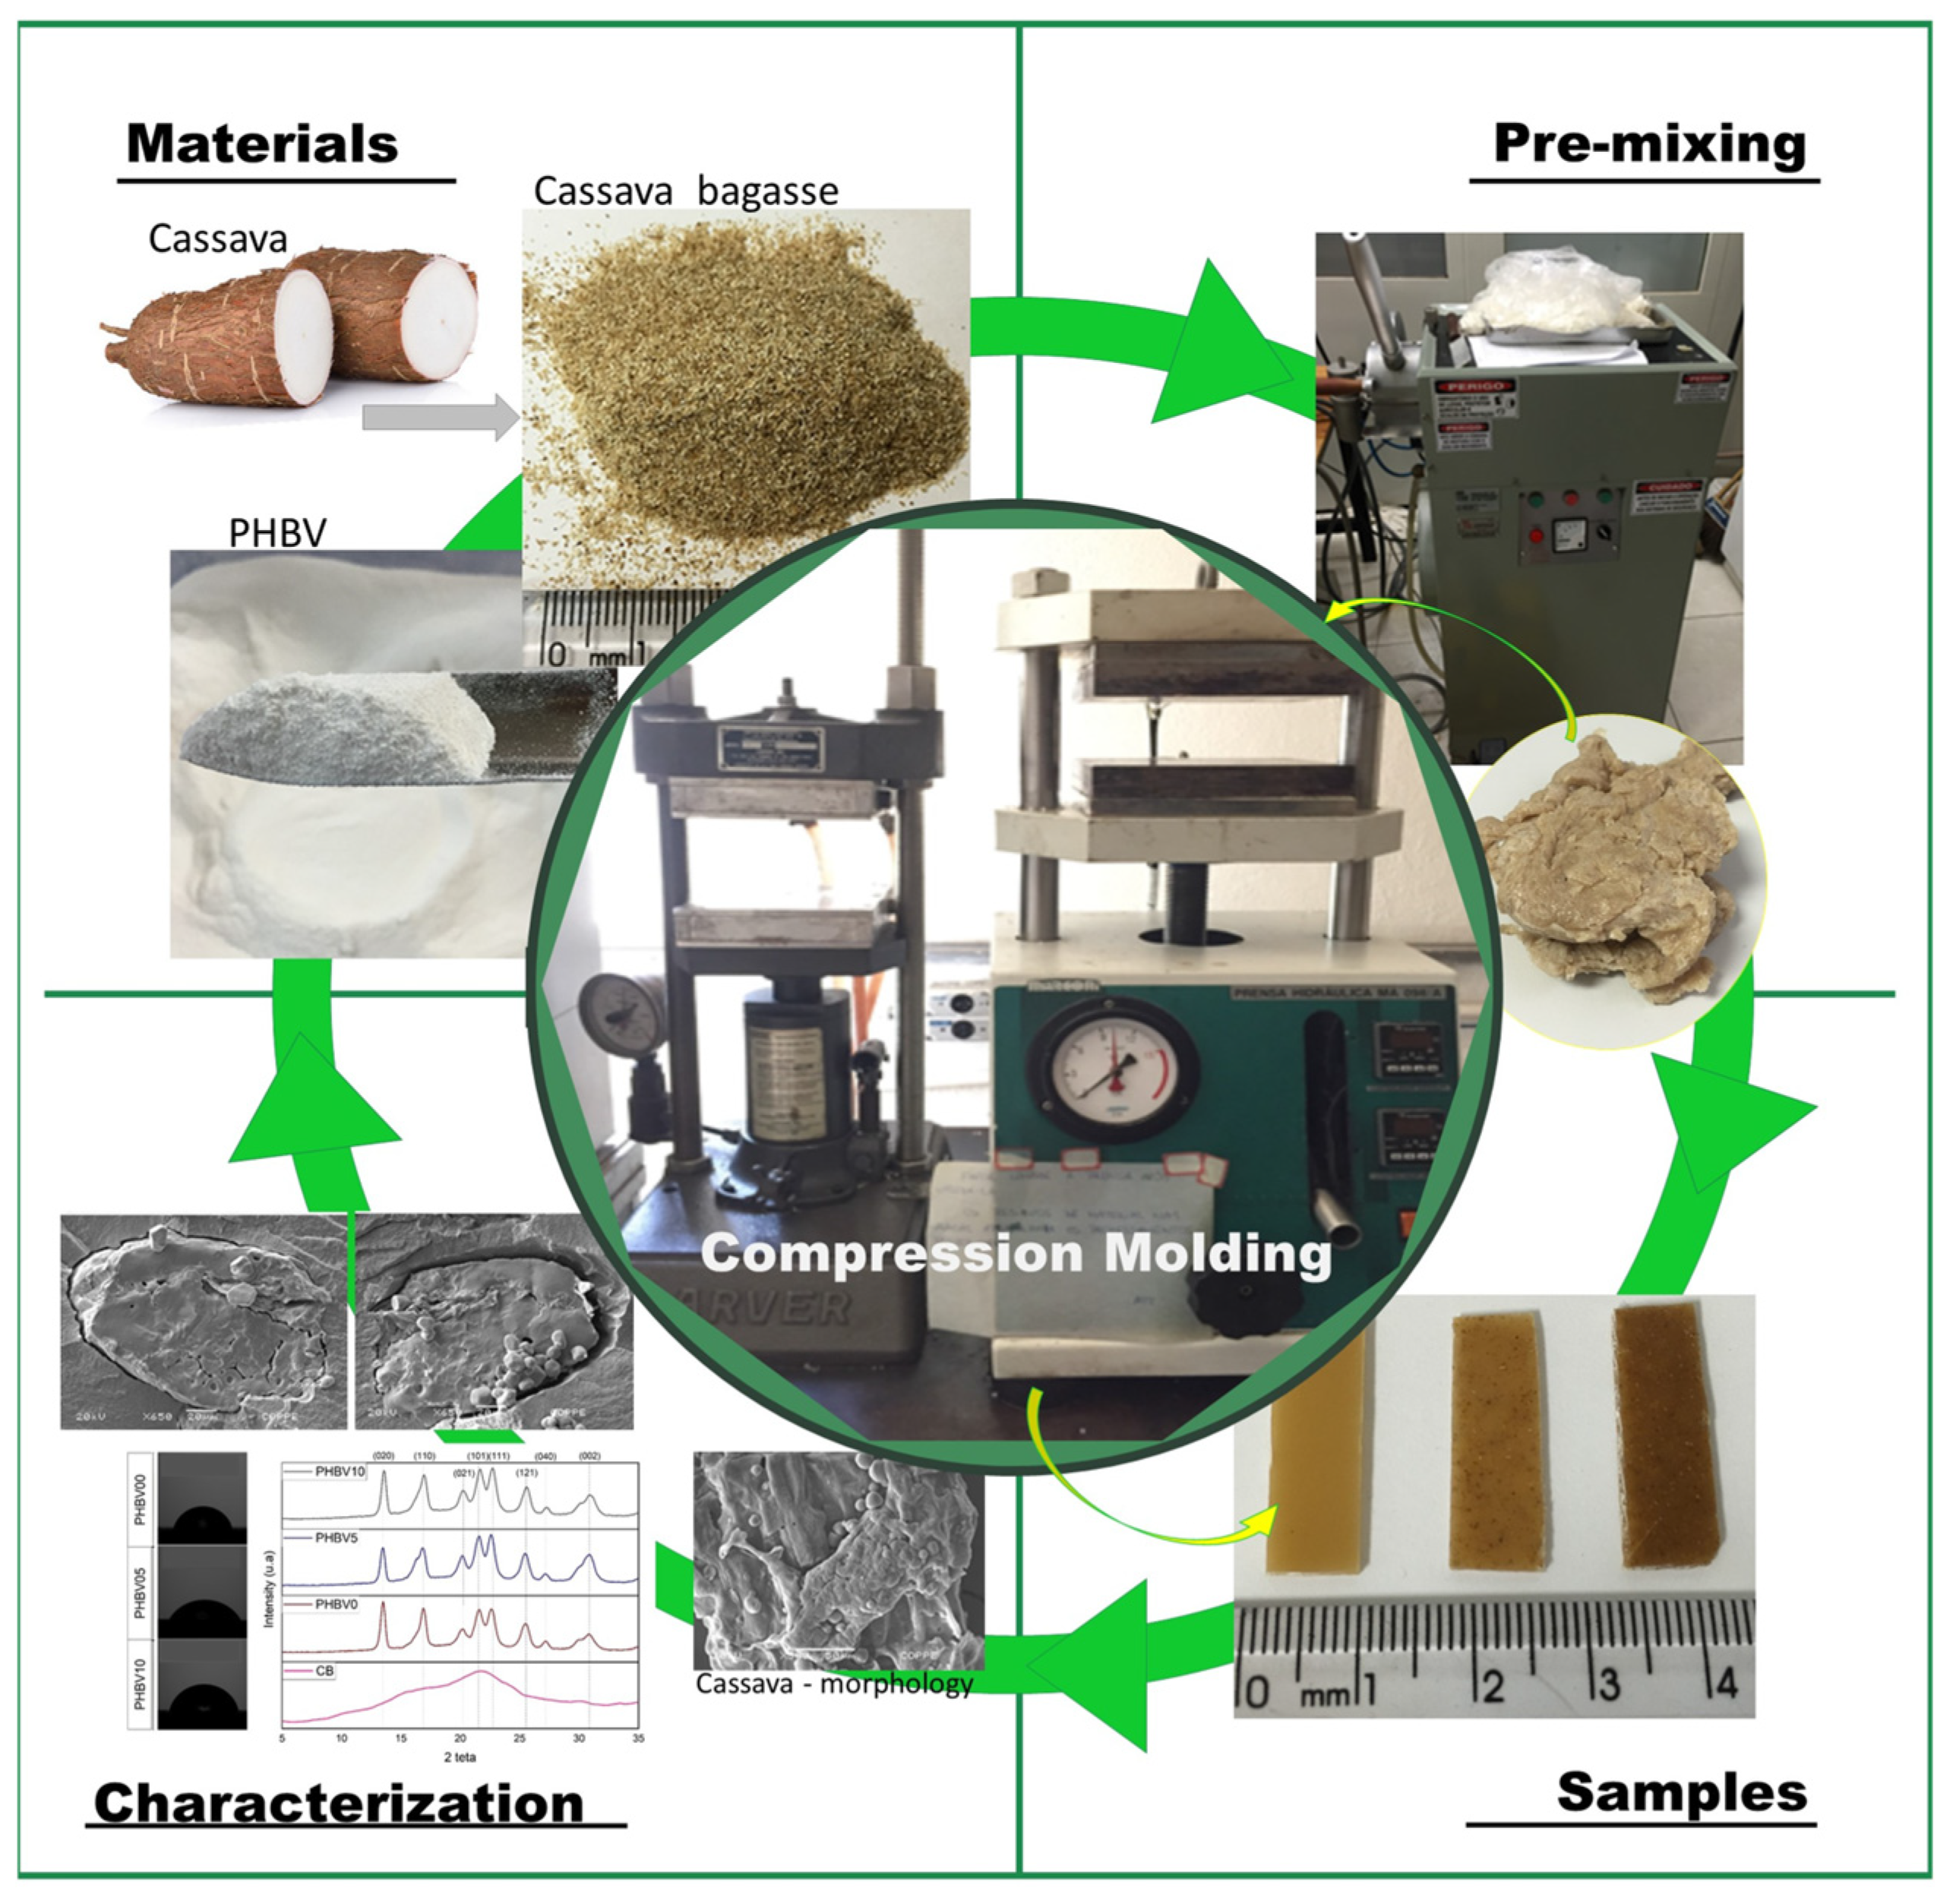
The current work aims to evaluate the incorporation of inexpensive cassava bagasse as a filler in a comparatively costly biodegradable polymer, PHBV matrix. In that way, it would be a new application for cassava bagasse that aims to improve the PHBV properties in the food packaging sector. Effects of the incorporation of this residue were investigated, analyzing the possible migration of the plasticizer to different types of food, the morphology, the thermal, and the chemical interaction between the filler and the matrix, as shown in Figure 1. No studies in the consulted literature have reported cassava bagasse in a PHBV matrix.
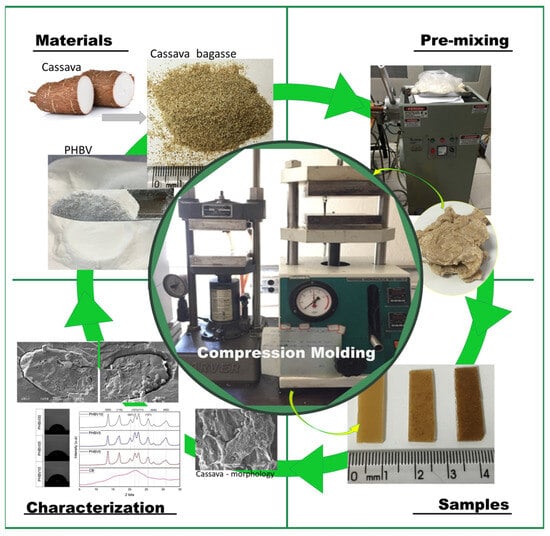
Figure 1.
Illustration of biocomposite processes cassava bagasse and poly(3-hydroxybutyrate-3-co-hydroxyvalerate) (PHBV) by compression molding.
2. Materials and Methods
2.1. Materials
The residue of cassava starch production, called cassava bagasse (CB), was milled to yield particles <3.5 mm, sieved using a 0.35 mesh sieve, and used without further treatment after sieving. It was provided by EMBRAPA ALIMENTOS from Halo-tek-Fadel Industrial LTDA, Brazil. This material was characterized, revealing that its composition is primarily starch (~70%), followed by fibers (17%), and carbohydrates (~1%), among other components [33,34]. Triacetin, used as a plasticizer, was acquired from Sigma-Aldrich, São Paulo, Brazil. Poly(3-hydroxybutyrate-co-3-hydroxyvalerate) (PHBV) in powder containing 4.0% of 3-hydroxyvalerate was purchased from PHB Industrial SA (São Paulo, Brazil). Mn: 88 Kg/mol; Mw: 171 Kg/mol and DI: 1.94 measured by gel permeation chromatography (GPC).
2.2. Composite Preparation
Biocomposites of CB/PHBV were mixed in homogenizer MH-50-M (MH LTD equipment LTDA, São Paulo, Brazil) with triacetin at 5 wt.% in different CB proportions. The compositions used were 0/100, 5/95, and 10/90 of CB/PHBV; they were named PHBV0, PHBV5, and PHBV10, respectively. Samples were then hot-pressed at 168 °C and 10 tons for 20 min to form sheets with an average thickness of 1.2 mm in Hydraulic Press MA 098/A (Marconi). Next, those were cooled in Hydraulic Press Model CS/N 41000-915 (Carver Inc., Wabash, IN, USA) at 30 °C and 0.5 tons for 5 min [35].
2.3. Characterization
2.3.1. FTIR-ATR Spectroscopy
The interaction and chemical composition between the polymeric matrix (PHBV) and the filler (CB) were assessed through infrared spectrometry using Spectrum 100 equipment from PerkinElmer (Boston, MA, USA) with a ZnSe crystal and attenuated total reflectance (ATR) accessory in the range of 4000 to 550 cm−1, with a resolution of 4 cm−1 and 32 scans.
2.3.2. NMR Relaxometry
Low-resolution nuclear magnetic resonance was applied to determine the spin–lattice relaxation times of the hydrogen nucleus (T1H), using a Maran Ultra 23 spectrometer (Oxford Instrument, UK), operating at 23 MHz, employing inversion–recovery pulse sequence (recycle delay—180°—τ—90°—acquisition time). The conditions employed were as follows: temperature of 30 °C; t values varying from 0.1 to 5000 ms with recycle interval of 5 s, using 40 points with 4 accumulations. The spin–lattice relaxation times were obtained with the aid of the WinFit program, and the distribution curves were fitted with the WinDXP program.
2.3.3. Differential Scanning Calorimetry (DSC)
The DSC experiments were performed using a DSC 8000 Differential Scanning Calorimeter (Perkin-Elmer, Hopkinton, MA, USA). Nitrogen was used as purge gas at a 40 mL/min flow rate for the DSC cell. Samples of about 10 mg were weighted and used in the analysis. They were first heated from 50 °C to 210 °C at a rate of 10 °C/min to eliminate the thermal history of the sample and subsequently cooled rapidly to 50 °C at a rate of 150 °C/min. The second heating cycle was conducted using the same conditions as the first cycle. From the second heating cycle curve, it was possible to obtain the crystallization temperature (Tc), the melting temperature (Tm), the melting enthalpy (ΔHf), and the crystallization enthalpy (ΔHc). The degree of crystallinity (XC) was calculated based on the melting enthalpy of the sample (ΔHf), on the melting enthalpy of 100% crystalline polymer (ΔH0m), and on the weight fraction of the PHBV (WPHBV) presented in the sample according to Equation (1).
In this study, the melt enthalpy of 100% crystalline polymer was regarded as 146 J/g, as the proportion of hydroxy valerate in the PHBV sample is less than 10% [36].
2.3.4. Thermogravimetric Analysis (TGA)
The thermal stability was evaluated using thermal gravimetric analysis (TGA) carried out with PerkinElmer Pyris 1 Thermogravimetric Analyzer (PerkinElmer Inc., Shelton, CT, USA) under a nitrogen atmosphere, heated from 23 °C to 800 °C at a rate of 10 °C/min. The mass of each sample was approximately 10 mg.
2.3.5. X-Ray Diffraction (XRD)
The X-ray diffraction was conducted using a Shimadzu XRD-6000 (Shimadzu Co., Kyoto, Japan) equipped with CuKα (λ = 0.1542 nm) radiation at 30 kV and 30 mA. The samples were recorded in an angular 2θ range of 5° to 35°, at a speed of 2°/min and with a step size of 0.02°. It was performed to verify changes in the pattern of X-ray diffraction with the addition of different filler levels and the crystallinity of the samples estimated in terms of the degree of crystallinity (Xc) using Equation (2):
where IC is the integrated area of diffraction peaks; Ia is the area under the amorphous halo; and k is a constant characteristic proportionality for each polymer, which value for PHBV can be 0.96 ± 0.03 once the hydroxy valerate content in the PHBV sample is less than 10% [37].
2.3.6. Contact Angle
The wettability of the CB/PHBV samples was assessed using a Ramé-Hart goniometer apparatus, model NRL A 100-00 (Cedar Knolls, NJ, USA), employing a sessile drop method. Approximately 2 µL of ultrapure water was deposited onto the sample surface, and the analysis was conducted in triplicate (N = 3) at room temperature.
2.3.7. Scanning Electron Microscopy (SEM)
The morphology of cassava bagasse (CB) and the cross-section of biocomposites (PHBV0, PHBV5, and PHBV10) were evaluated using scanning electron microscopy (SEM) on biocomposite film samples. The analysis was assessed using a JEOL JSM-6460 LV (JEOL, Tokyo, Japan) scanning electron microscope at an accelerating voltage of 20 kV; the samples were sputter-coated with gold before imaging. The samples were frozen in liquid nitrogen and fractured for this analysis to obtain a clean cross-section.
2.3.8. Migration Test
The migration test was carried out according to Reis et al. (2016) [38]. The samples measuring 10 × 10 × 1.2 mm were washed with distilled water and subsequently immersed in 70% ethanol for 1 min. Then, they were dried at 40 °C for 24 h. The samples were weighed, and the migration test was adapted from Resolution 105/99 of ANVISA [39]. Sterilized beakers were used to place each sample, separately adding 4.4 mL of each simulant for subsequent test submission according to the time and temperature indicated in Table 1. Each test was performed in duplicate.

Table 1.
Selected parameters for the migration test according to Resolution 105/99 of ANVISA. Adapted from ANVISA [39].
After the time stipulated for the test, the samples were removed from the simulants and washed with 2 mL of the respective simulants. The samples were transferred to metallic capsules and set in an oven at 100 °C for 24 h. Next, the capsules with the samples were cooled in a desiccator and then weighed, obtaining the dry residue (R) to calculate the total migration, according to Equation (3):
where Q is the total migration (mg·kg−1); R is the dry mass of the residue (mg); A is the total area of the sample in contact with the simulants (dm2); and S/V is the ratio area/mass of water corresponding to the volume of actual contact between the plastic and food. However, S/V = 6 dm2·kg−1 was used as recommended by Resolution 105/99 on general packaging and plastic equipment provisions. Contact ANVISA Food once the evaluation is held using generic (representative) materials, not the final packaging.
2.3.9. Water Uptake
The water uptake of the samples was determined by measuring the difference between the weight at the initial time of the test and the constant final weight of the sample. The specimen dimensions were 10 × 10 × 1.2 mm. Three samples were tested for each material. First, the samples were dried overnight at 70 °C. Next, they were cooled in a desiccator at room temperature and weighed using a four-digital balance. Then, all samples were immersed in distilled water at pH = 6 and 25 °C. After 24 h, the samples were removed and blotted to eliminate the excess water on the surface. After weighing, the water uptake WU (%) of the samples was calculated according to Equation (4):
M0 and M1 are the sample weights before and after immersion in distilled water, respectively [40].
3. Results and Discussion
3.1. Cassava Bagasse Characterization
Initially, an initial characterization of the CB residue was carried out to corroborate the composition, focusing on the morphological and chemical properties of the cassava bagasse and its biocomposites (CB/PHBV). Figure 1 shows cassava bagasse’s morphology and composition evaluation (CB). For this, the CB was characterized morphologically by SEM (Figure 2A). CB’s composition and thermal behavior are evaluated in Figure 2B and Figure 2C, respectively.
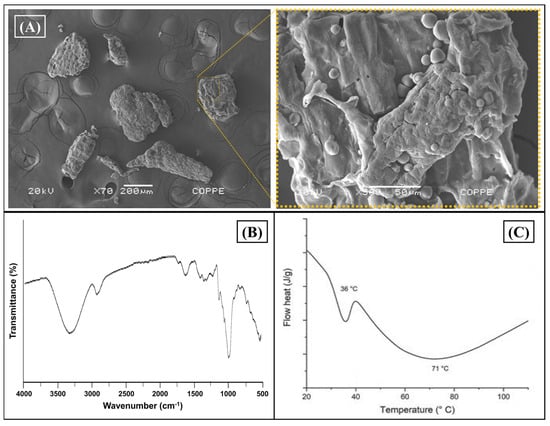
Figure 2.
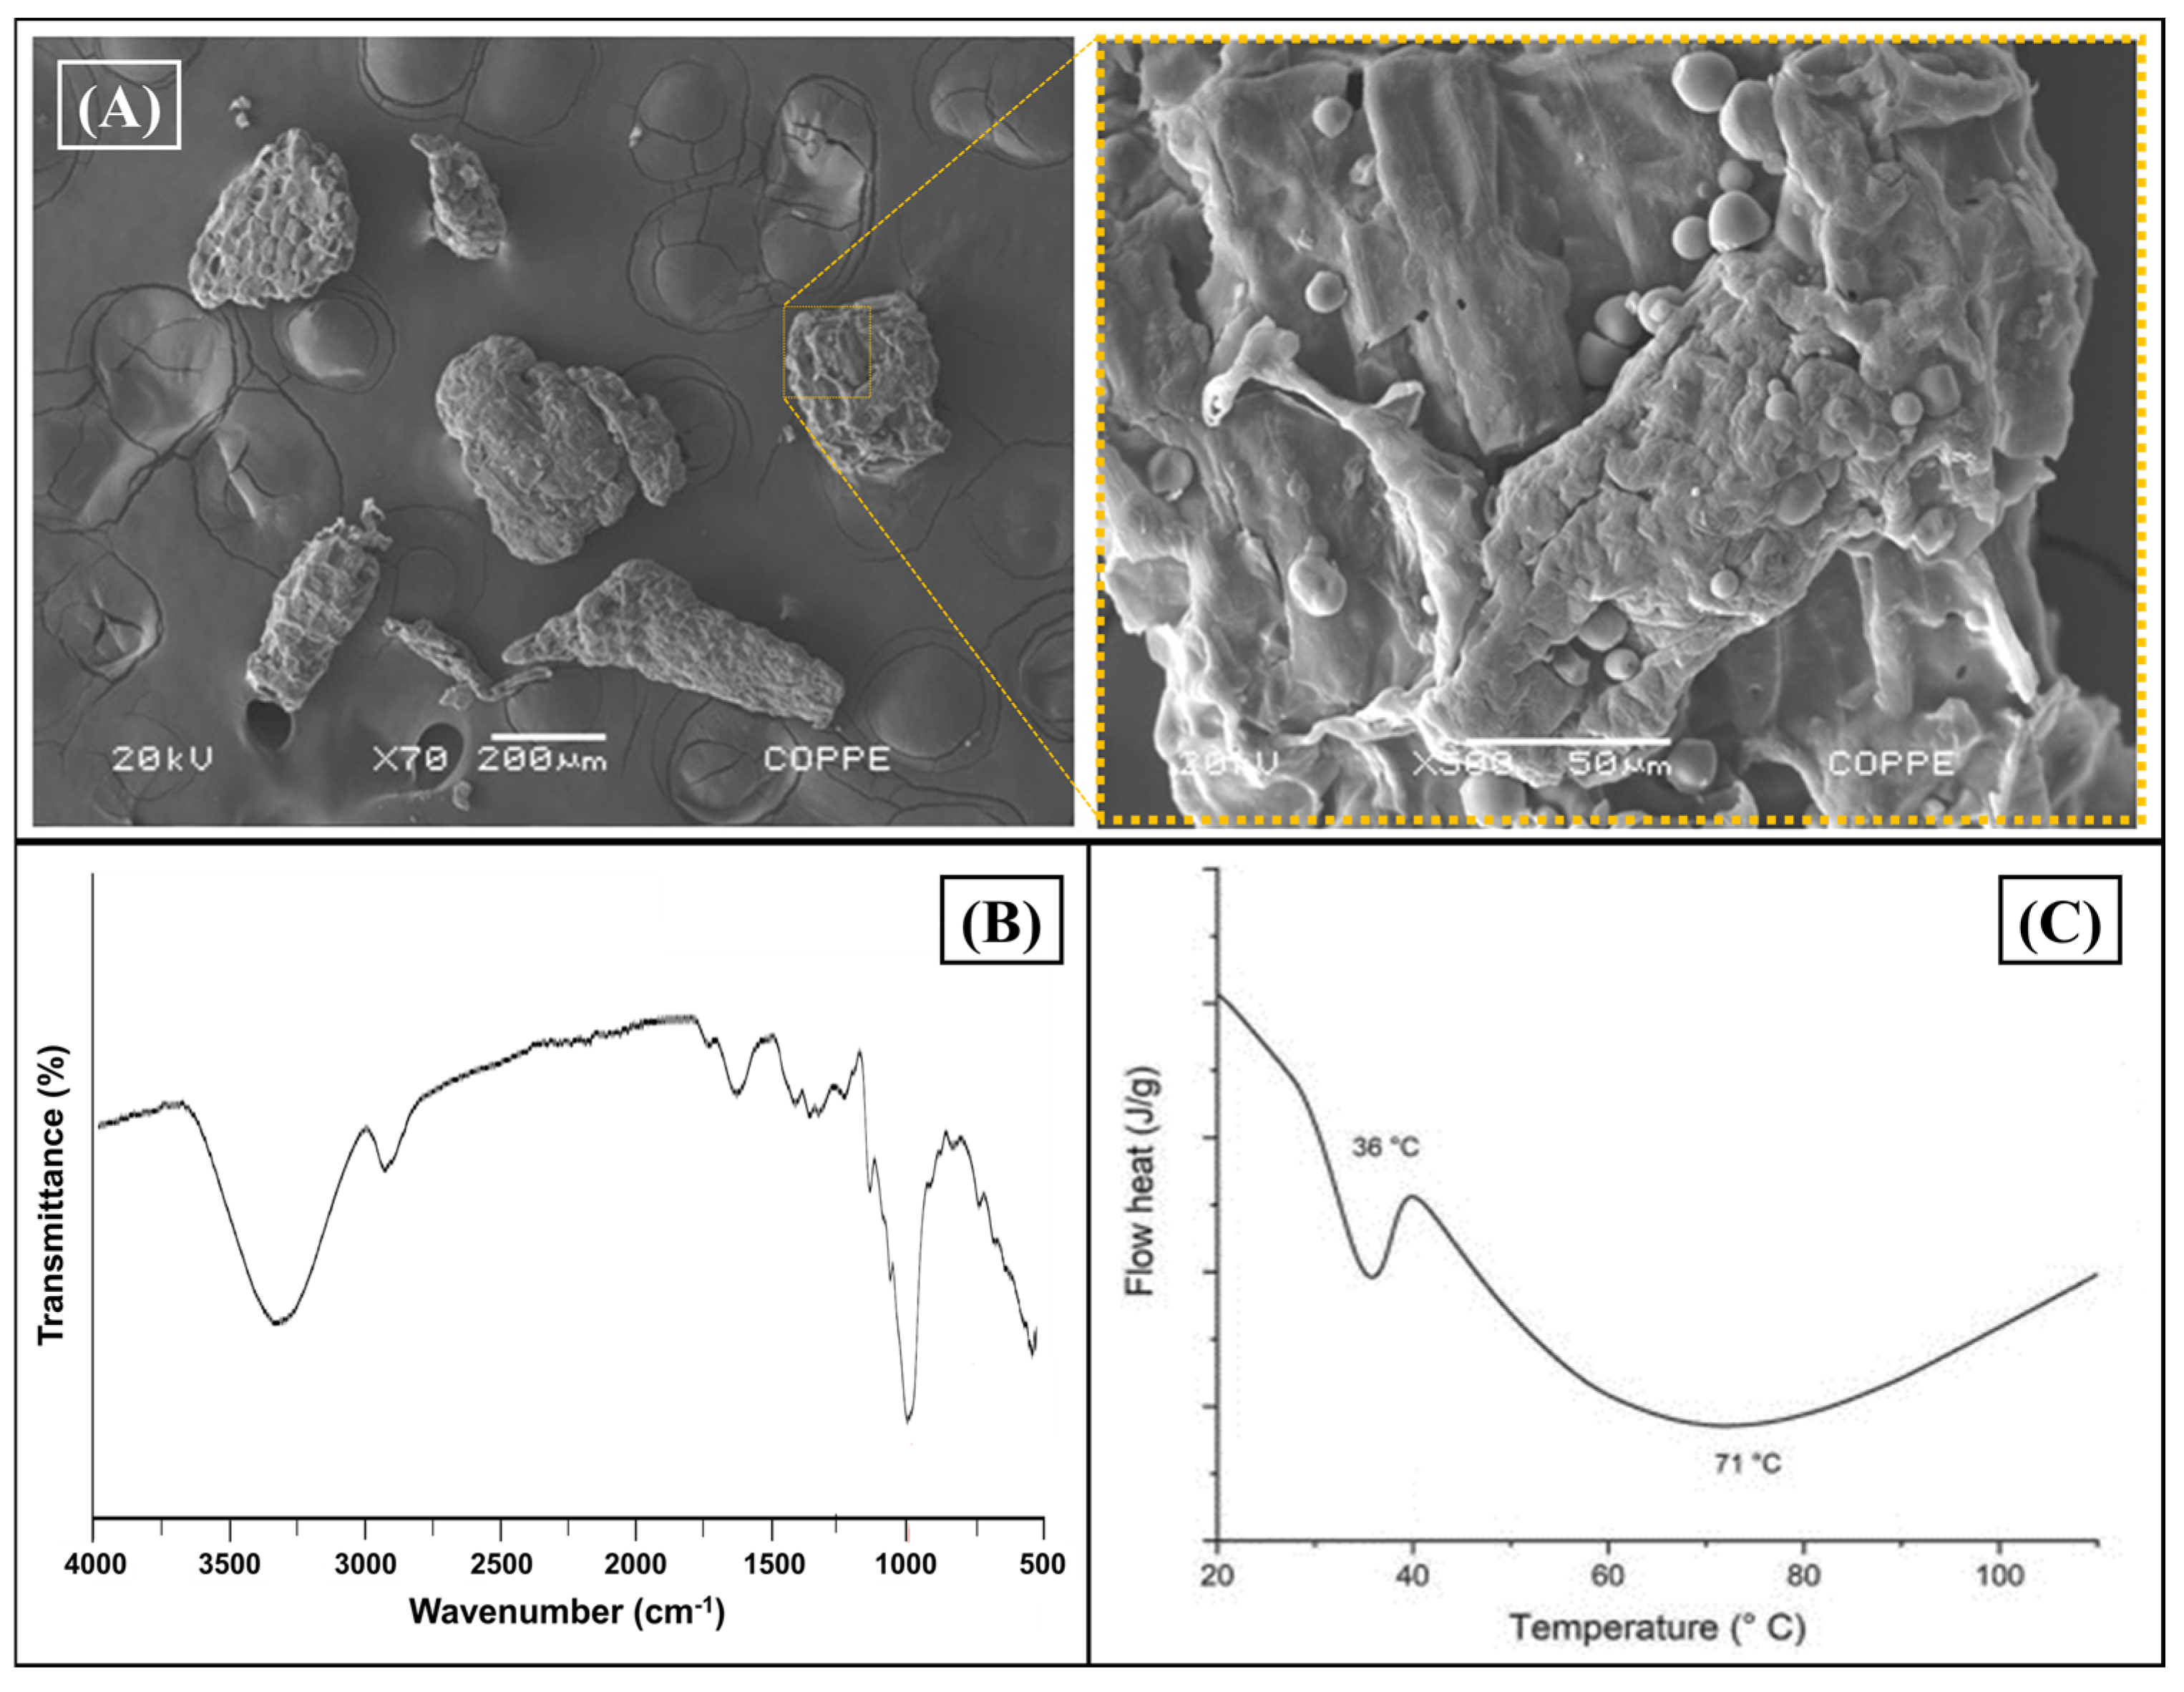
Cassava bagasse characterization. (A) SEM images in two magnifications. Left: 70× and right: 500×; (B) FTIR-ATR spectrogram of CB as receded; and (C) thermal evaluation by DSC (1st cycle heat).
Figure 2A depicts the morphology of cassava bagasse residue (CB), revealing the formation of characteristic clusters typical of residues from virgin starch of this natural source. On the other hand, it was possible to observe in Figure 2A (left) the heterogeneous particle size distribution of cassava bagasse, ranging from 200 μm to 600 μm, with a granular morphology of regular spherical shape characteristic of virgin starch from cassava [41]. Yet, Figure 2A(right) shows an SEM image with more magnification (500×) where one can see the sponge morphology with possible composition by fibers and starch. This result concurs with reports found in the literature for this bagasse [42].
FTIR-ATR evaluated cassava bagasse’s chemical composition (Figure 2B). Verifying a prominent band in 3312 cm−1 typical of the stretching vibration of O-H bonds characteristic of the hydroxyl groups present in the macromolecules was possible in the spectrum. Furthermore, the stretching vibrations observed at 2918 cm−1 correspond to the deformation of methyl bonds from the cellulose and hemicellulose. Meanwhile, the band allocated around 1723 cm−1 indicates the stretching vibration of the ester function from the hemicellulose. Finally, the band at 1613 cm−1 is related to the presence of C = C bonds, characteristic of the lignin.
The C–O bending referring to the hydroxyl groups and CH2 symmetric deformation are verified at 1613 and 1362 cm−1, respectively. The bands at 1308 and 1122 cm−1 can be attributed to C–H symmetric deformation and C–O–C asymmetric stretching. The bands in the 997 to 726 cm−1 range are assigned to C–O stretching and ring vibrations [43,44].
Finally, the thermal behavior of CB was evaluated by DSC, showing one thermal event allocated around 60 °C, as observed in Figure 2C. The endothermic peak is attributed to overlapping events, i.e., melting of starch, gelatinization effect, and glass transitions over a wide range of temperatures, as shown in the literature for this residue [45].
3.2. Chemical Composition of Biocomposites
3.2.1. Chemical Composition of CB/PHBV Biocomposites
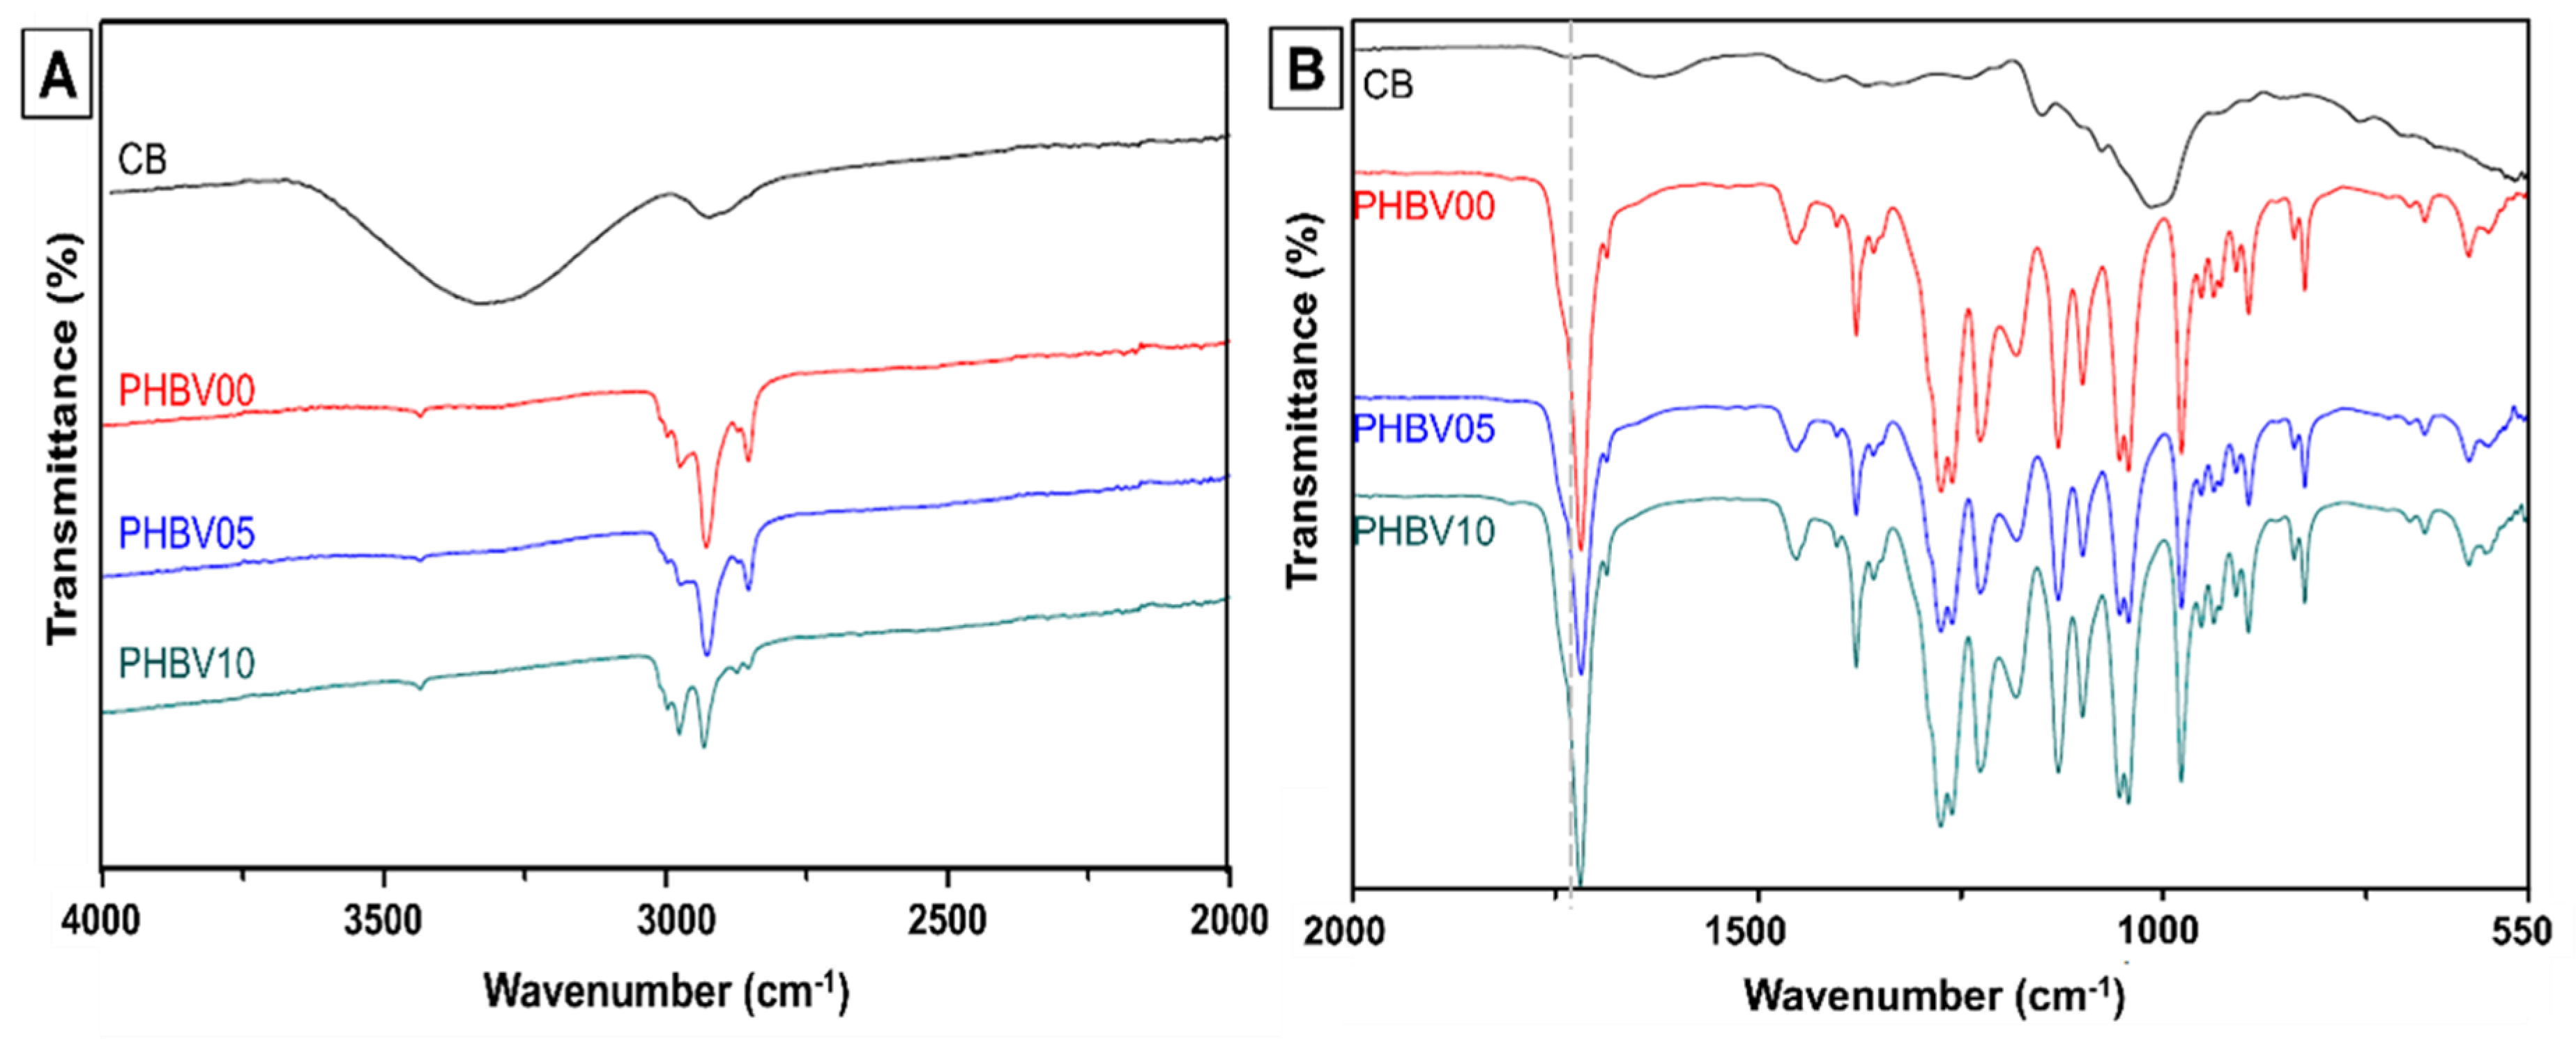
Figure 3 shows the chemical composition of biocomposites blended with PHBV with three different mass fillers of cassava bagasse denoted as PHBV0, PHBV05, and PHBV10. For the most visualization, the FTIR spectra were divided into two regions, the range of 4000 to 2000 cm−1 (Figure 3A) and the second from 2000 to 550 cm−1 (Figure 3B).
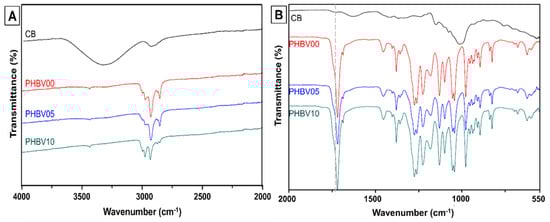
Figure 3.
Chemical and compositional evaluation of CB/PHBV biocomposites by infrared spectroscopy. (A) Range between 4000 and 2000 cm−1; and (B) range evaluation in 2000 to 550 cm−1.
In the FTIR spectrum of PHBV0 (Figure 3), bands were observed in the regions of 3015 to 2950 cm−1 (with specific bands at 2996 cm−1 and 2976 cm−1), 2945 to 2925 cm−1 (band at 2934 cm−1), and 2885 to 2850 cm−1 (band at 2854 cm−1). These bands are attributed to the asymmetric stretching of the CH3 group, the stretching of the CH2 group, and the symmetric stretching of CH3, respectively [46,47]. A prominent band at 1718 cm−1, corresponding to the stretching of the ester (C=O) group present in the crystalline structure of PHBV, was identified, along with a small peak at 1740 cm−1, related to the stretching of the C=O bond in the amorphous region of PHBV [48]. The bands in the range of 1500 to 800 cm−1, associated with the bending vibrations of CH3 and CH bonds and the stretching of C–O–C and C–C bonds, are strongly overlapped [49].
The spectra of the PHBV5 and PHBV10 samples did not show significant differences compared to the PHBV0 spectrum. On the other hand, a substantial overlap of the bands from PHBV and CB was observed in the 1500 to 800 cm−1 region. This overlap is attributed to the low concentration of filler in the biocomposites (5 and 10 wt. %). This phenomenon was also observed by Wadaugsorn et al. (2022) [50] in PBAT/CB starch biocomposites, where lower concentrations of CB starch functioned as dispersed granules, thereby reducing the exposure of starch and hindering the clear distinction of the vibration bands. Furthermore, other studies have reported similar results that utilize lignocellulosic materials as fillers for biocomposite production [46,51].
3.2.2. Low-Resolution Nuclear Magnetic Resonance (NMR)
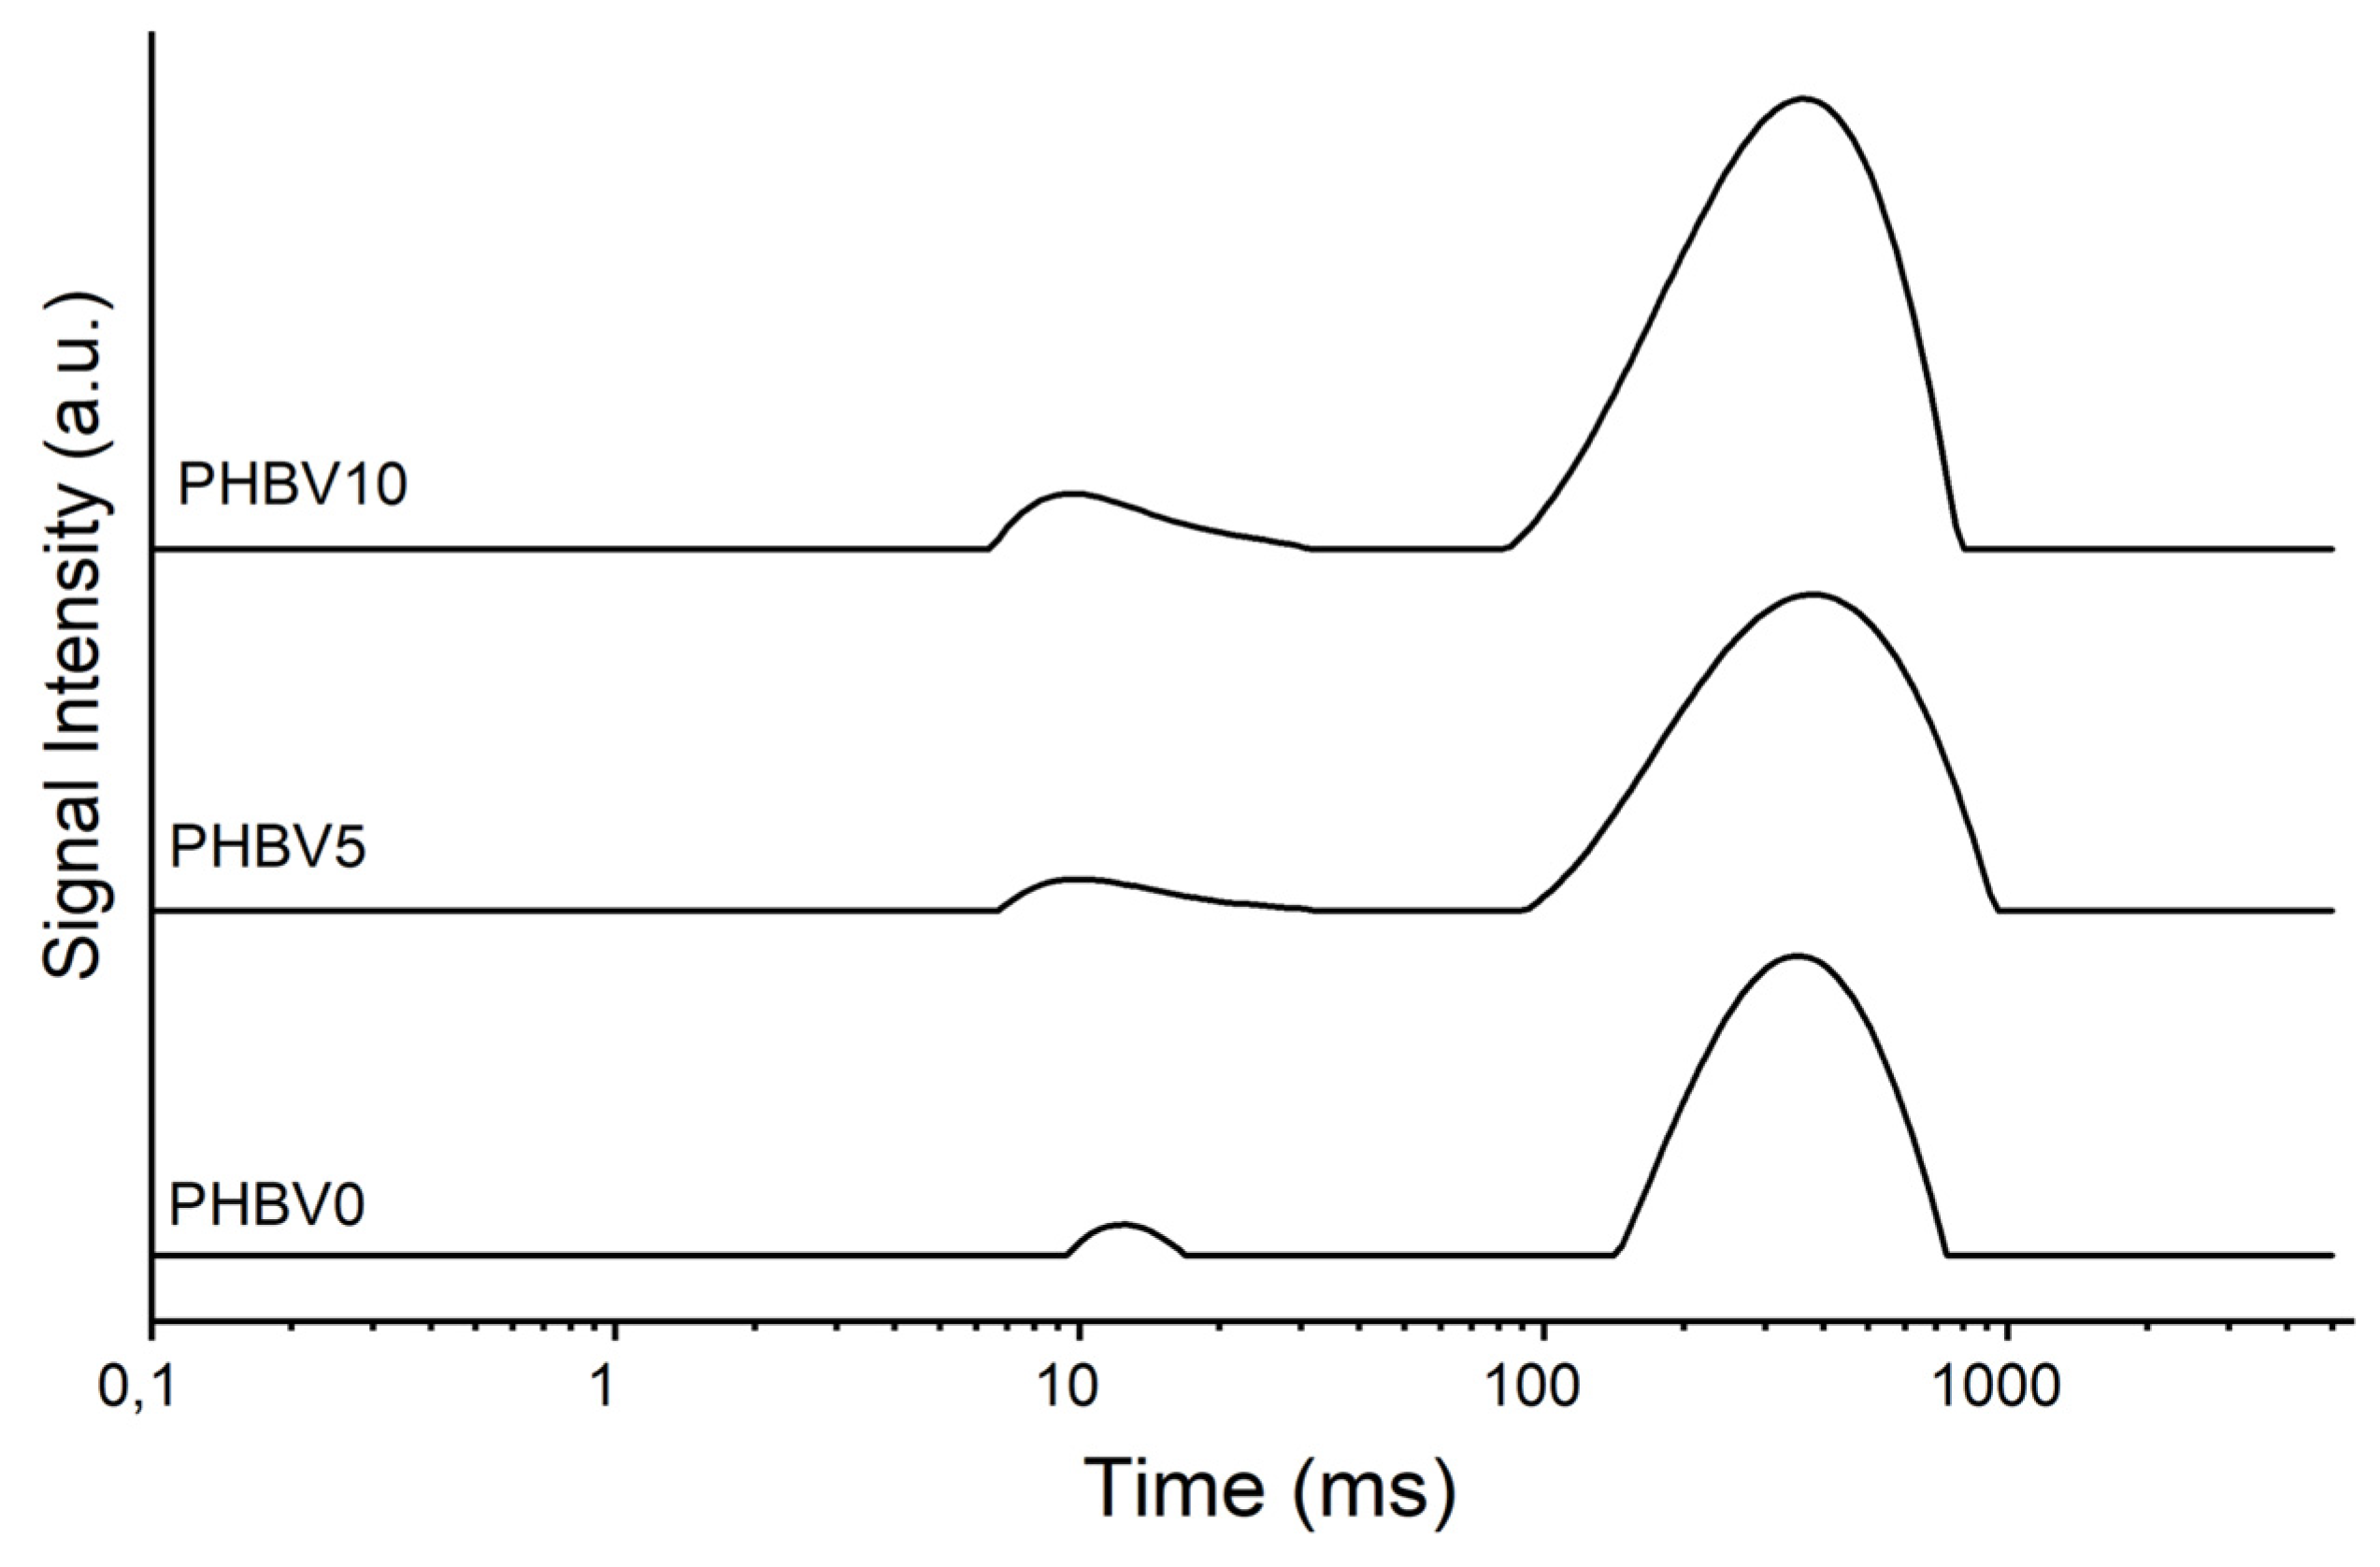
The relaxation data measured from the one-fit exponential by low-resolution nuclear magnetic resonance are shown and listed in Figure 4 and Table 2, for the PHBV as received, the produced films, and the CB. The significant contribution of the domain that controls the relaxation process can be revealed by its evaluation. The hydrogen spin–lattice relaxation is regulated by the dipolar intermolecular interaction process in solids [52].
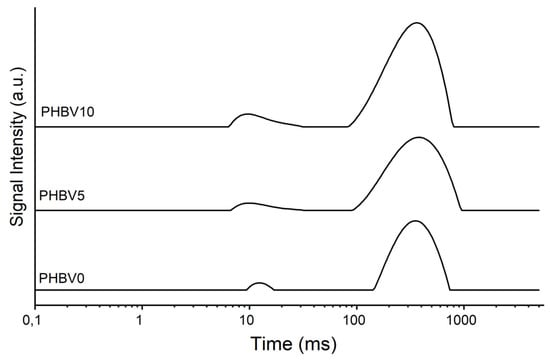
Figure 4.
NMR of PHBV0, PHBV5, and PHBV10.
Table 2.
T1H values were obtained with one-fit data for the PHBV as-received, PHBV0, PHBV5, and PHBV10.
The T1H decreased as the amount of CB increased in the plasticized PHBV matrix, probably due to the increased molecular mobility of the polymer chains. This result suggests that a new intermolecular organization was formed in the material, leading to a polymer-polymer chain separation [36].
In Figure 4, it can be observed that the curves for PHBV5 and PHBV10 exhibit shapes and amplitudes that progressively differ from those of PHBV0, suggesting that the presence of cassava bagasse (CB) residue affects the relaxation properties of the system. This observation aligns with the decrease in T1H reported in Table 2, which can be attributed to an increase in the molecular mobility of the polymer chains, likely caused by interactions induced by the CB.
Figure 4 shows the T1H relaxation curves for PHBV samples with different cassava bagasse loadings (PHBV0, PHBV5, and PHBV10). It is observed that the curve profiles vary significantly with the addition of the filler. The PHBV0 sample exhibits a relatively narrow curve with moderate intensity, indicating a matrix with lower molecular mobility. Adding 5% bagasse (PHBV5) results in a curve with a shape and intensity similar to that of PHBV0, suggesting that the filler is well-dispersed and its influence on molecular mobility is limited. In contrast, the curve for the sample with 10% bagasse (PHBV10) displays a broader and shifted peak, accompanied by an increase in intensity. This behavior indicates greater average molecular mobility, likely due to the heterogeneous dispersion of the filler, leading to the formation of more pronounced amorphous regions. Thus, the figure reveals that the bagasse filler influences the molecular dynamics of PHBV, with the effect being most evident in the PHBV10 sample, which shows more significant structural disorganization.
As seen in the DSC data, the polymer’s degree of crystallinity (XC) increased with the augmentation of the CB amount in the biocomposite. One hypothesis for this behavior is the polymer chain mobility facilitated by the presence of the CB, favoring the crystallization of the polymer chains.
3.3. Differential Scanning Calorimetry (DSC)
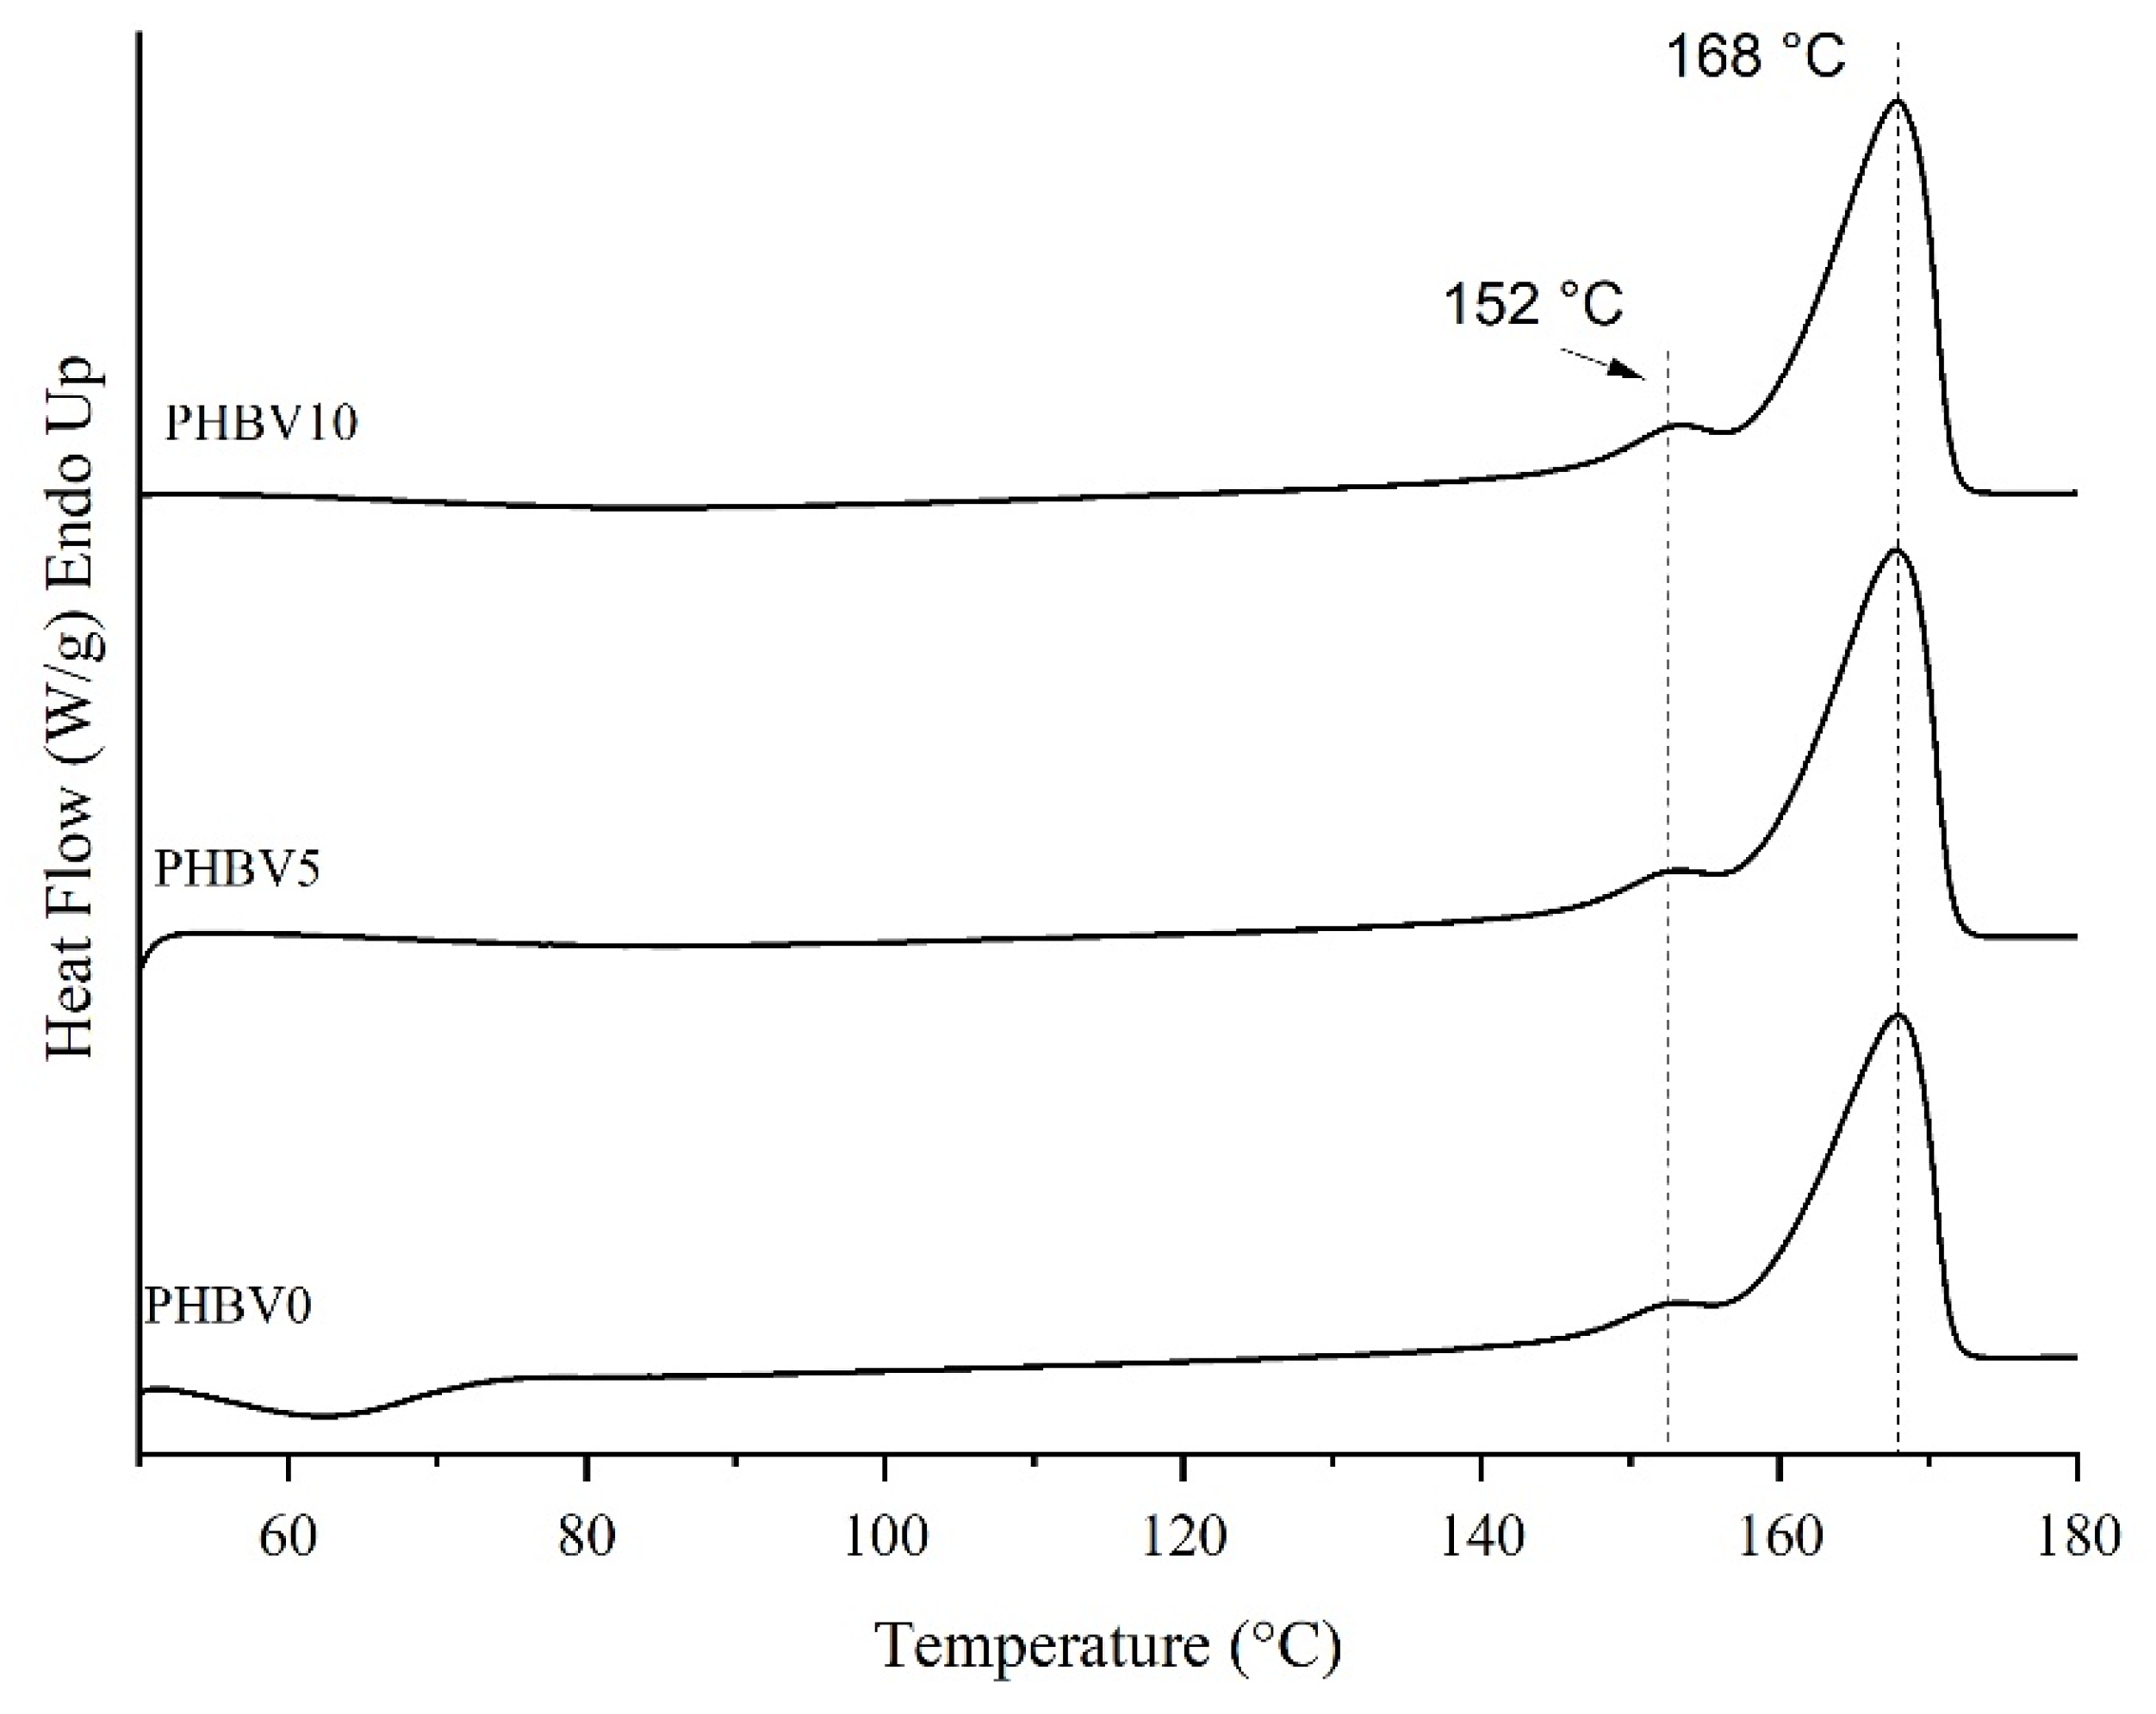
The thermograms of the second heating cycle of the differential scanning calorimetry (DSC) samples are shown in Figure 5, and their thermal parameters are summarized in Table 3. Crystallization temperatures (Tc) of the samples PHBV5 and PHBV10 were not seen in the second cycle. However, for the PHBV0 sample, it was possible to verify the presence of a crystallization exothermic peak at 62.6 °C. In the case of biocomposites, the crystallization event most probably occurred in the cooling step and/or at a temperature lower than TC of PHBV0. Thus, it is possible to propose that the CB performed as a nucleating agent since it facilitated the bio-composite crystallization.
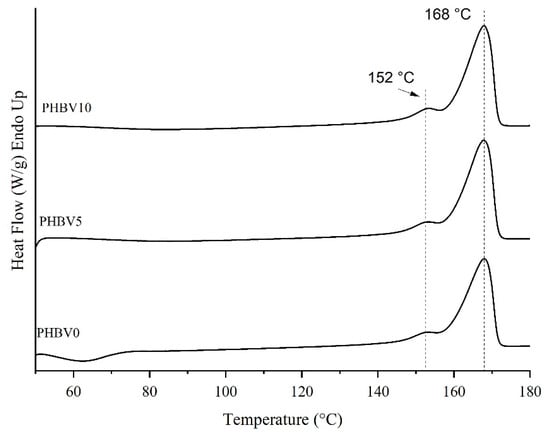
Figure 5.
DSC thermograms of 2nd heating cycle of PHBV0, PHBV5, and PHBV10.
Table 3.
Thermal transitions and crystallinity degree of biocomposites.
The degree of crystallinity (Xc) of PHBV was almost unaffected by the five wt. % of CB presence. On the other hand, there was an increase of 10% of Xc in the PHBV matrix with the maximum filler content. PHBV5 and PHBV10 are compared to the neat polymer matrix (PHBV0). These results mean that the addition of 10 wt. % of CB enhanced the crystalline phase of the PHBV.
The CB addition up to 10 wt. % did not significantly affect the Tm and the ΔHm of the PHBV matrix in biocomposites compared to that of PHBV0. In this way, it can be supposed that CB did not influence the crystal thickness of the PHBV matrix in the biocomposite samples. A similar result was also observed for PHBV composites filled with olive husk flour and lignocellulosic filler [53]. All DSC curves presented shoulders, which could be attributed to forming crystals with different characteristics [54].
Finally, correlating the crystallinity degree measured by DSC with the analysis of longitudinal relaxation times (T1H) provides valuable insights into the interaction and distribution of the cassava bagasse load within the PHBV polymer matrix. The results show that PHBV0 exhibited a crystallinity degree of 46.5% and a T1H of 313 ms, reflecting a relatively rigid and well-ordered matrix after processing. With the addition of 5% bagasse (PHBV5), the crystallinity degree slightly increased to 47.2%, while the T1H remained almost unchanged (300 ms), indicating good load dispersion and adequate interaction between the matrix and the bagasse. On the other hand, the formulation with 10% bagasse (PHBV10) resulted in a significant increase in crystallinity (51.1%) and T1H (625 ms), suggesting the formation of heterogeneous microdomains, with rigid crystalline regions near the load particles and more mobile amorphous areas. These results indicate that while PHBV5 presents a more uniform dispersion and a good structural balance, PHBV10 may experience load agglomeration, resulting in a heterogeneous distribution that impacts molecular mobility and the matrix properties.
3.4. Thermal Gravimetric Analysis (TGA)
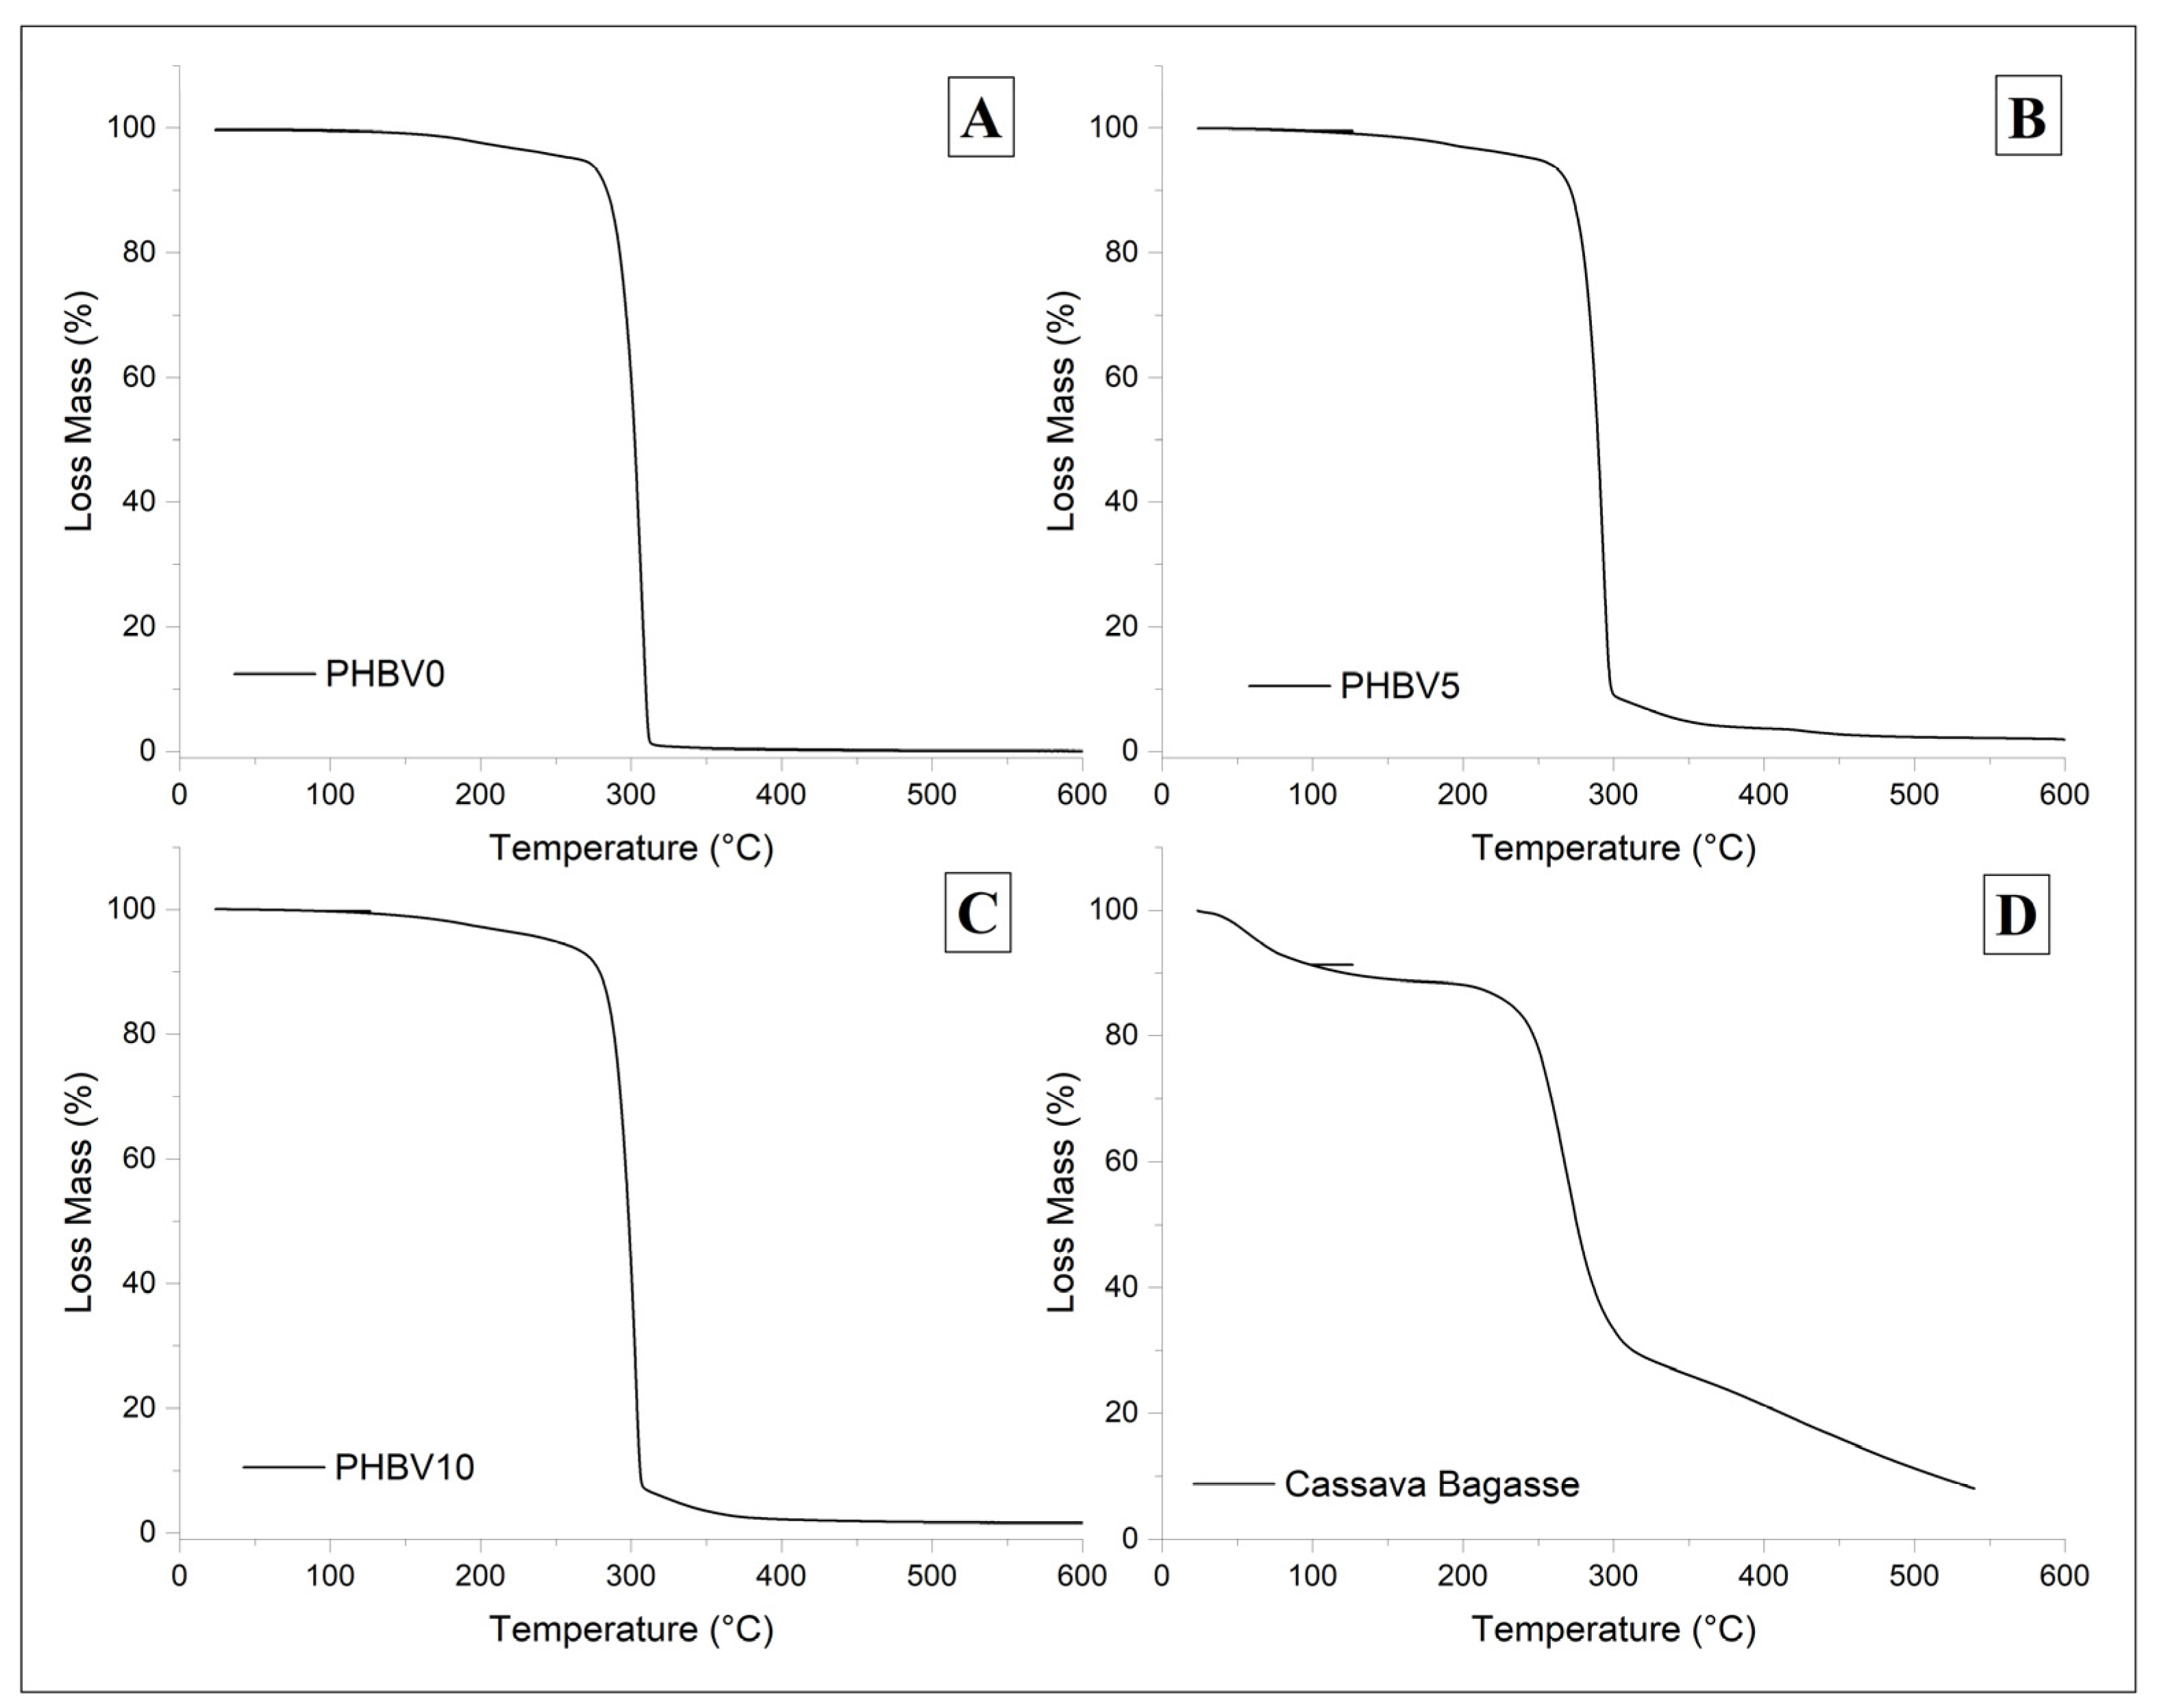
Thermal gravimetric analysis (TGA) thermograms for PHBV0, PHBV5, PHBV10, and CB are shown in Figure 6. The corresponding data in Table 4 present the decomposition temperatures, where Tonset is the mass loss onset temperature, Tpeak is the maximum rate of weight loss temperature, and weight loss is the percentage of mass degraded in the 1st, 2nd, and 3rd step weight loss.
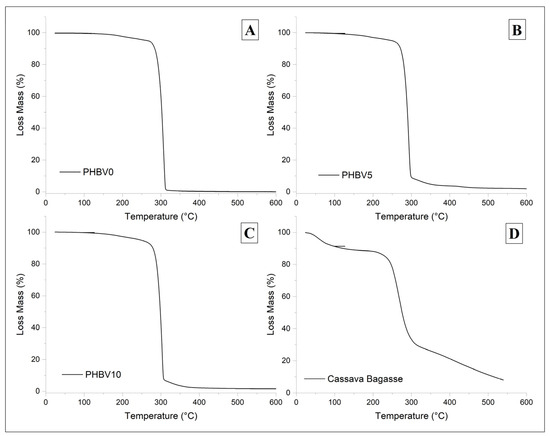
Figure 6.
TGA thermogram of biocomposites varying the amount of CB, (A) PHBV0, (B) PHBV5, (C) PHBV10, and (D) neat CB specimen.
Table 4.
Thermal degradation temperatures (Tpeak and Tonset) and weight loss obtained from TGA measurements for PHBV-based biocomposites (PHBV0, PHBV5, and PHBV10) and cassava bagasse (CB).
The biocomposite materials displayed similar TGA curves (Figure 6B,C) as the plasticized matrix (Figure 6A), i.e., PHBV0, with two degradation steps with Tonset around 95 °C and 285 °C. The first can be attributed to moisture and/or plasticizer evaporation, and the second to PHBV decomposition [55]. However, it was possible to observe a third weight loss in the biocomposite specimens at around Tonset = 302 °C. This third-step weight loss is probably related to the second-step weight loss of the filler, which was attributed to the degradation of starch, hemicellulose, and other low-molecular-weight components present in cassava bagasse. The thermal stability was practically maintained by adding the filler with a negligible decrease of 1.6% and 4.7% in Tpeak for PHBV5 and PHBV10, respectively, compared to PHBV0. Although the biocomposites’ degradation temperatures were slightly lowered, they remained above the processing level (168 °C) [56].
The TGA profile of the CB specimen showed the first weight loss stage (Figure 6D) at Tpeak = 61 °C possibly related to water and low molecular weight component decomposition, and the second one at Tpeak = 337.8 °C can be attributed to the lignin and cellulose decomposition present in CB [56].
3.5. X-Ray Diffraction (XRD)
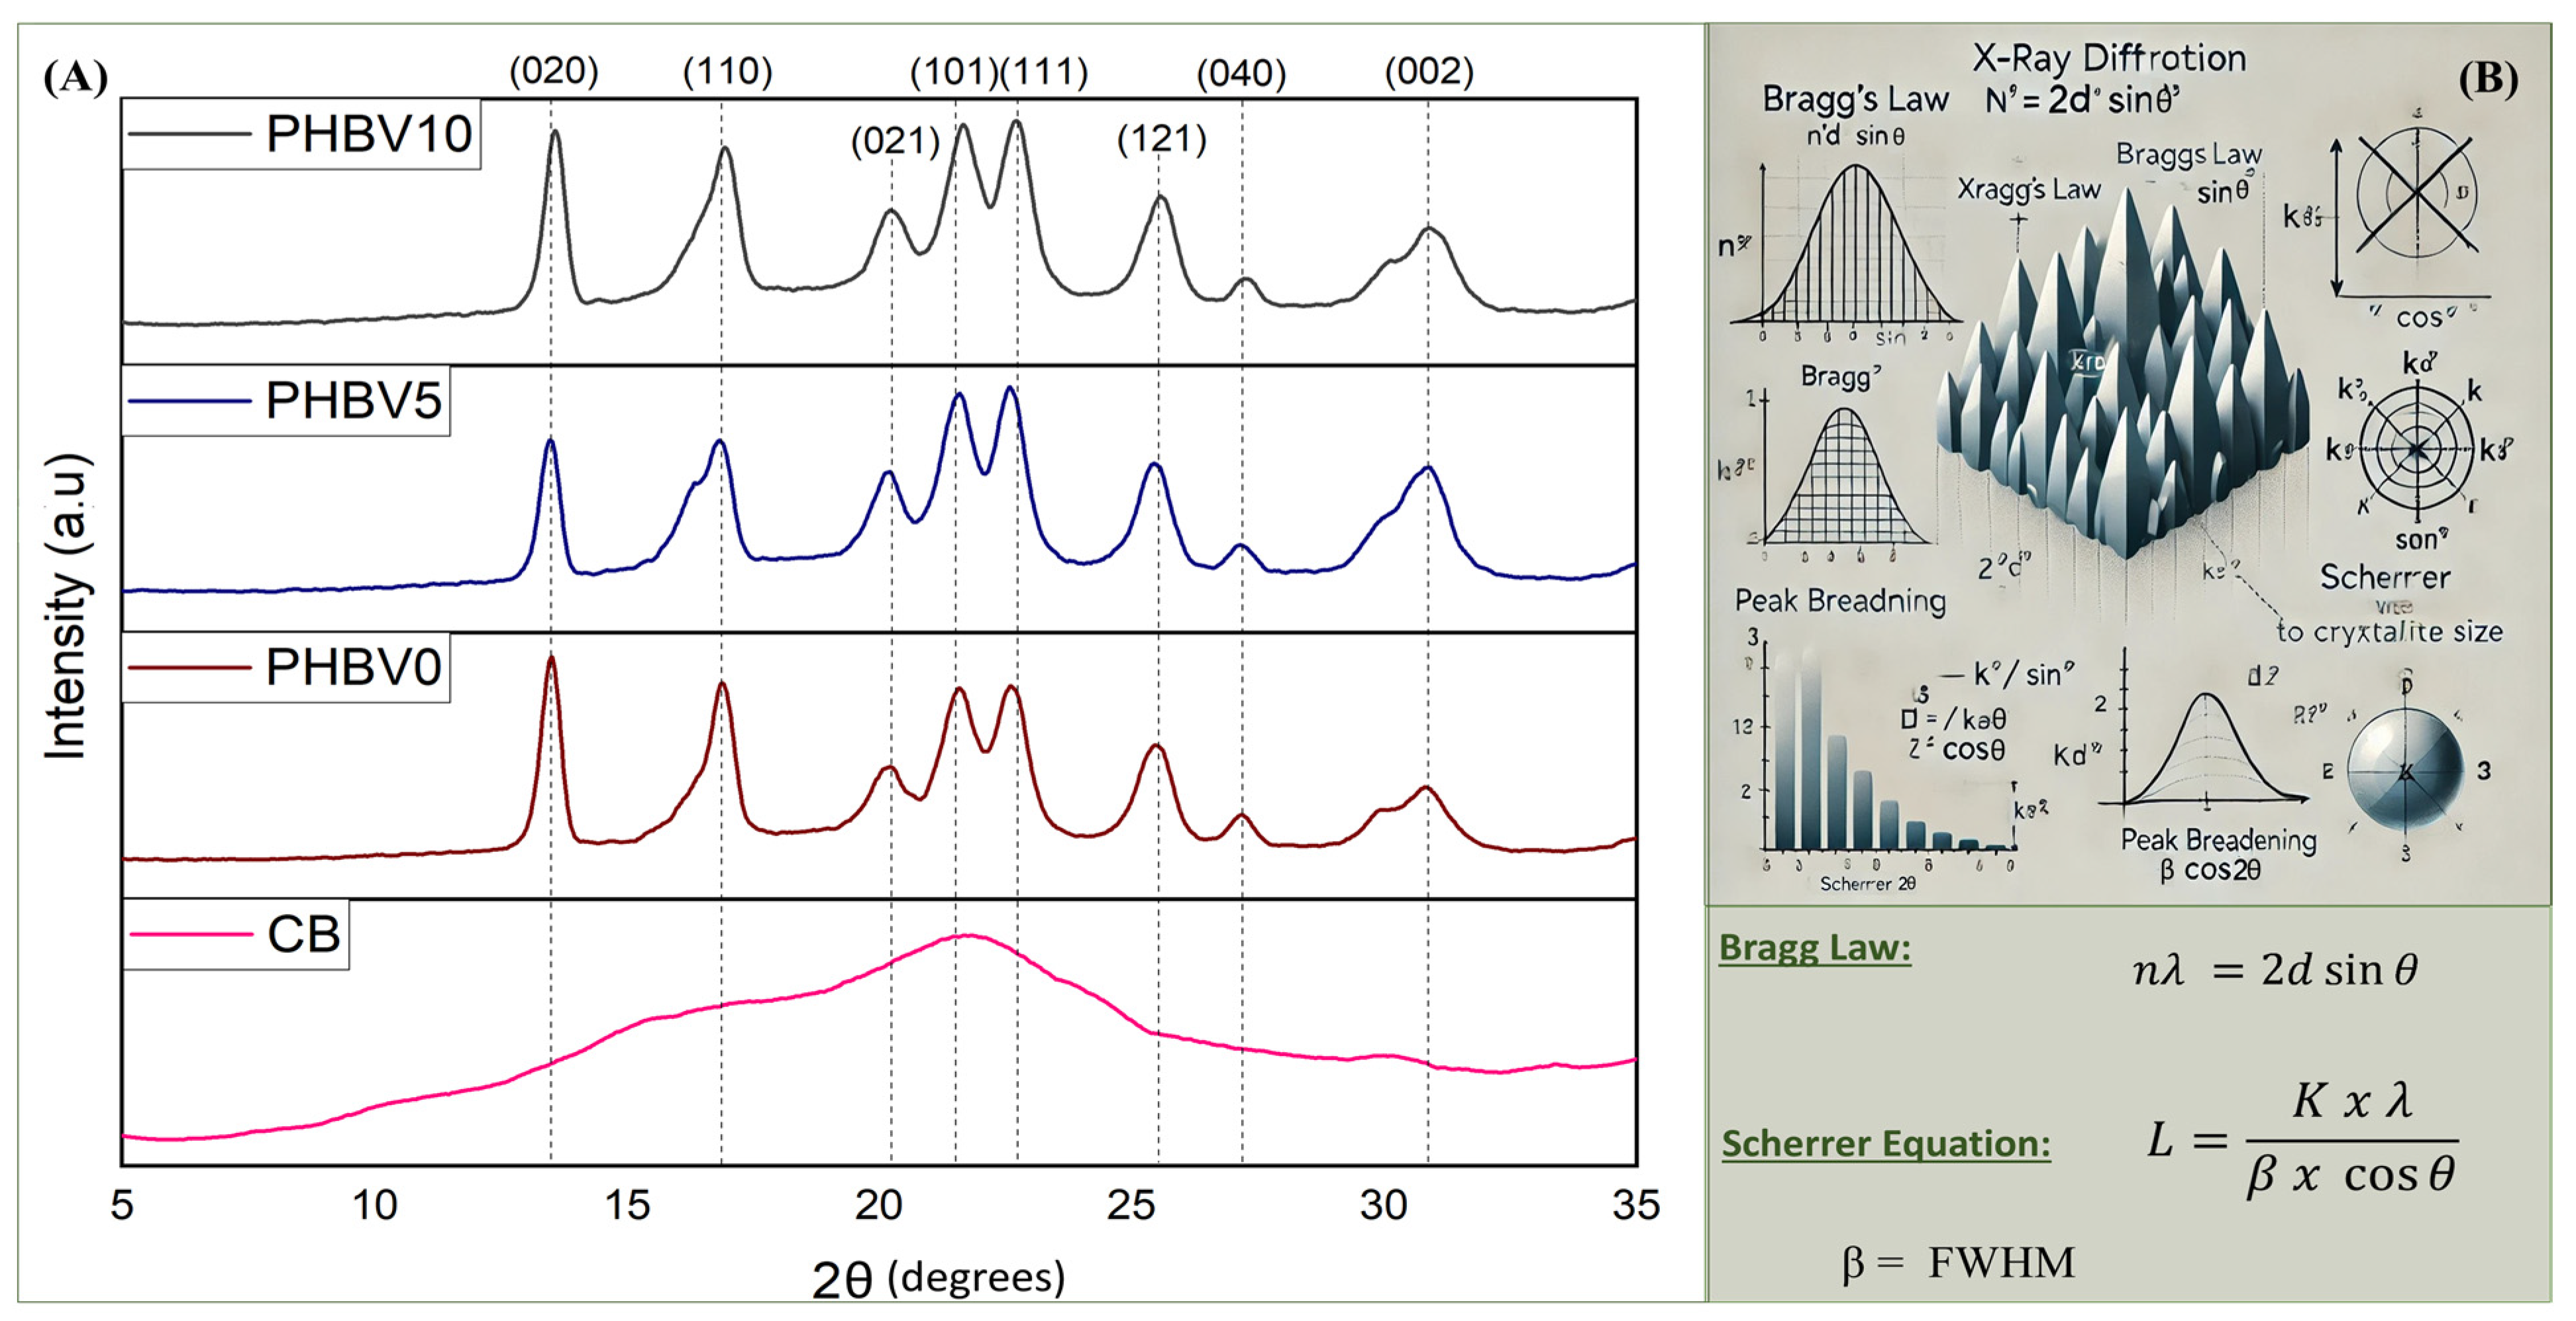
The obtained diffractograms to evaluate the pattern of X-ray diffraction and the crystallinity of the produced films and the CB are shown in Figure 7. The diffractograms for all biocomposites showed the characteristic peaks of the crystalline structure of PHBV, which is very similar to that presented for the PHB homopolymer due to the low 3HV content in PHBV employed in this work [36]. The profiles presented well-defined diffraction peaks (2θ) at 13.5°, 16.9°, 20.0°, 21.6°, 22.6°, 25.5°, 27.1, and 30.8°, which correspond to the (020), (110), (021), (101), (111), (121), (040), and (002) crystallographic planes [46,57]. Additionally, the X-ray diffraction patterns of biocomposite samples showed peaks at the same position as the PHBV peaks. Therefore, the CB addition in the PHBV matrix did not affect the diffraction pattern of the polymer, which can indicate that the CB in the PHBV matrix did not form new crystalline structures [54,58]. A significant change in the intensity of the peaks was not observed.
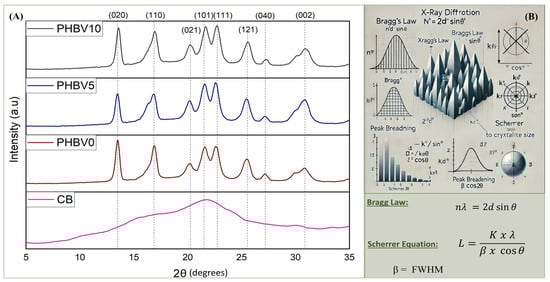
Figure 7.
X-ray diffractograms (A) of CB, PHBV0, PHBV5, and PHBV10; (B) illustrates the principles of X-ray diffraction calculations, including Bragg’s Law and the Scherrer equation.
The diffraction profile of the CB exhibited a predominance of an amorphous halo, indicating the low crystallinity of the material. However, it was possible to identify a large peak (2θ) at around 22°. Teixeira et al. (2009) [59], in their work utilizing cassava bagasse containing about 17.5 wt. % fibers and 82.5 wt. % starch, found two peaks (2θ) well-defined at 12.5° and 22.5°. According to the authors, it can be assumed that both peaks are characteristic of the cellulose.
The crystallinity degree (XC) and distance of crystalline planes are presented in Table 5. In this, it is observed that the Xc of all biocomposites were not affected by the presence of the CB, once the values obtained were 43.2%, 42.3%, and 42.0% for PHBV0, PHBV5, and PHBV10, respectively. As expected, the CB did not contribute to the crystallinity of the biocomposites due to its low crystallinity character.
Table 5.
Crystallinity degree and crystalline dimension in a specific direction (L) from the Scherrer equation, using the FWHM for each crystalline plane for every biocomposite sample of CB/PHBV.
A possible discrepancy between the crystallinity degree results obtained using DSC and those calculated via XRD has been observed. The DSC results suggest a direct interaction between CB and the polymeric matrix, as they indicate an increase in Xc with the addition of CB. However, the XRD data show no significant variations in crystallinity as a function of CB concentration. This discrepancy highlights the different sensitivities of these characterization techniques and suggests that their chemical differences significantly influence the polymer–filler interactions. CB exhibits a highly hydrophilic character, while PHBV is a hydrophobic polymer, so the interfacial interactions between these components are likely limited.
Furthermore, Table 5 presents the interplanar distance (L) between crystallites, calculated for each crystalline plane using the Scherrer equation [60]. These calculations were performed following the physical principles outlined in Figure 7B, which were used to determine the full width at half maximum (FWHM). Additionally, the degree of crystallinity was calculated using Bragg’s Law. The results indicate variations in interplanar distances for almost all crystalline planes when CB is incorporated, with a predominant decrease in PHBV0/PHBV5, as shown in Table 5. However, a slight increase in interplanar spacing was observed for PHBV0/PHBV10, suggesting weaker interactions between the polymer and cassava bagasse at higher CB concentrations. These findings correlate well with the T1H relaxation times obtained from NMR analysis.
The DSC results indicate an increase in the degree of crystallinity of the composites as CB concentration increases. This behavior suggests that CB may act as a nucleating agent, promoting the formation of crystalline nuclei and facilitating the growth of crystalline domains within the PHBV matrix.
However, XRD analysis revealed that the overall crystallinity remained unchanged, suggesting that the lignocellulosic filler does not significantly affect the total crystalline fraction detected by this technique. Nevertheless, variations in interplanar distance and crystallite size were observed upon CB incorporation, indicating that CB induces structural rearrangements within the crystalline domains without necessarily modifying the overall crystalline content.
On the other hand, T1H values obtained by NMR decreased with the increasing CB concentration, indicating higher molecular mobility and an increase in the amorphous fraction of the polymer matrix. This apparent contradiction can be explained by the heterogeneous effect of CB on the PHBV structure. While CB may act as a local nucleating agent, promoting crystallization in specific regions, its limited interaction with the polymer matrix may lead to less organized regions surrounding the filler particles. This effect may result in the formation of amorphous domains and, consequently, an increase in chain mobility, as detected by NMR [61,62].
Thus, the results suggest that the addition of CB to PHBV leads to a mixed structural behavior, as follows:
- Increased crystallinity by DSC, indicating a nucleating effect;
- Unchanged overall crystallinity by XRD, but with modifications in crystallite organization;
- Reduced T1H values by NMR, reflecting increased molecular mobility in amorphous regions.
This behavior can be attributed to the heterogeneous dispersion of CB within the matrix, which simultaneously promotes crystalline nuclei formation and amorphous regions, resulting in a complex composite structure with interconnected crystalline and amorphous phases.
3.6. Wettability Test on Biocomposites
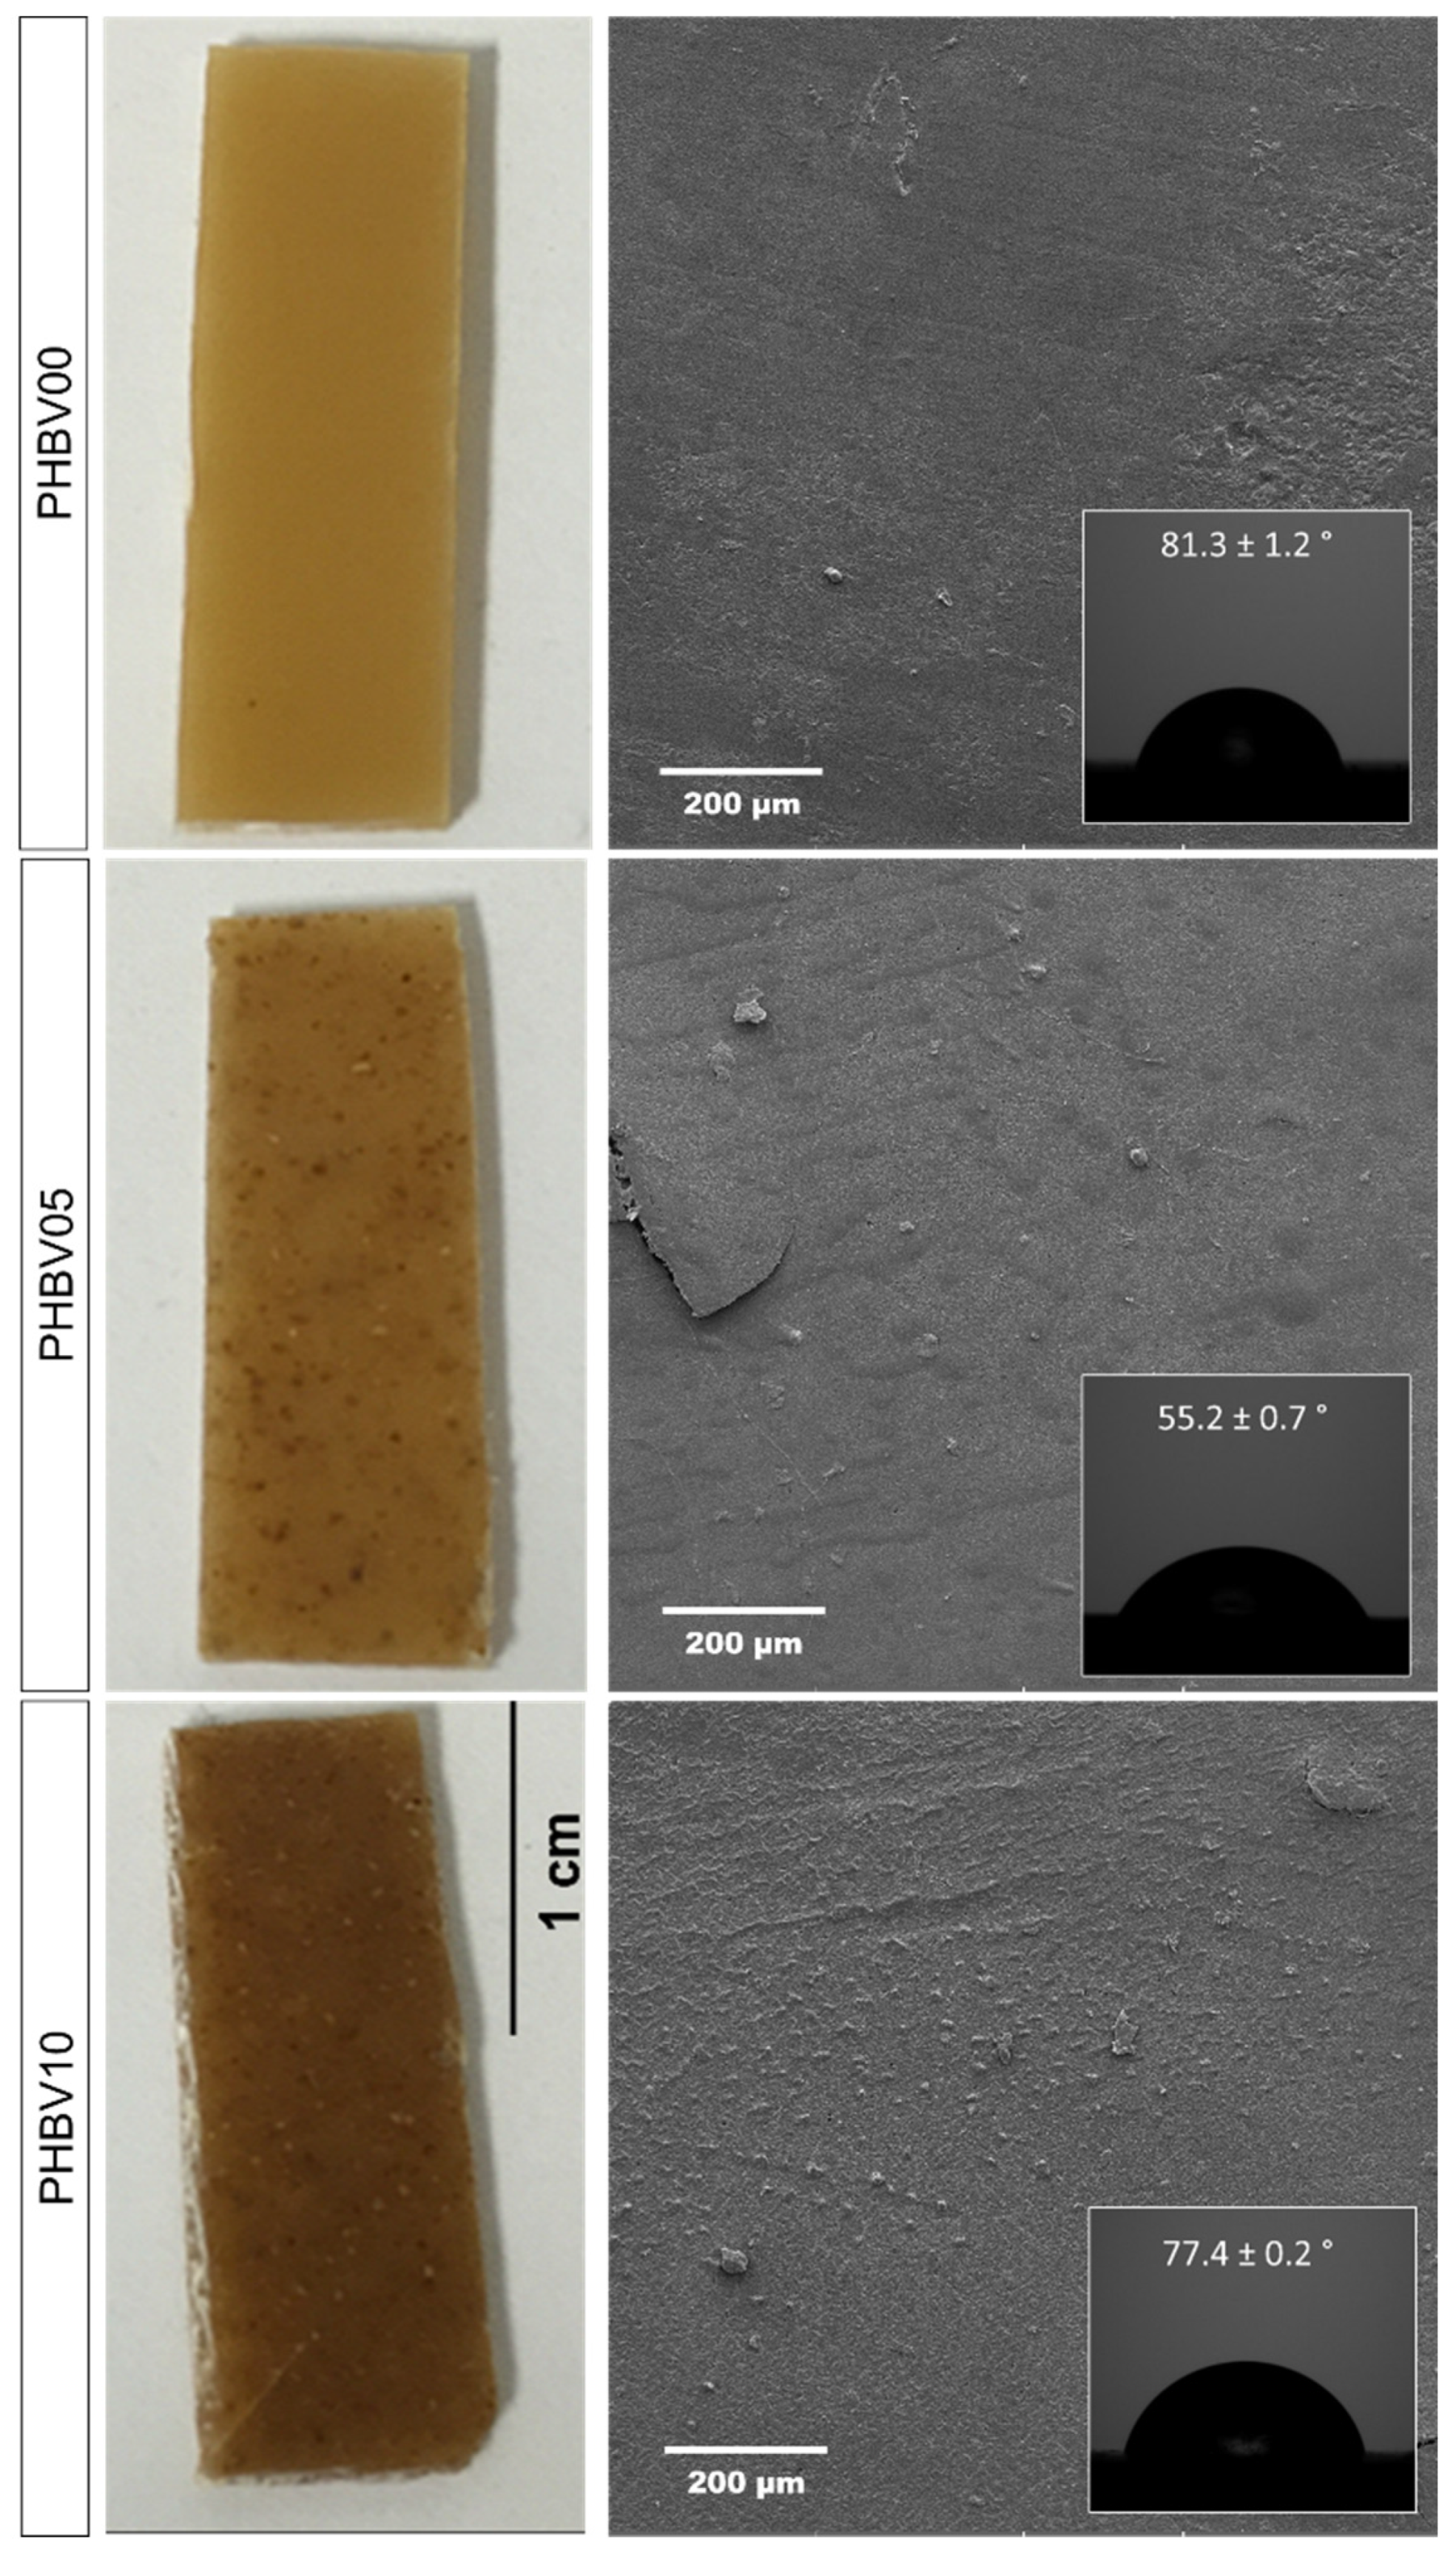
A wettability analysis was performed to assess the distribution of cassava bagasse particles on the surface of the biocomposites. The PHBV samples with varying concentrations of CB were tested using sessile drop analysis (~2 µL) with ultra-pure water. Figure 8 shows the surface of the PHBV samples with CB and the corresponding contact angles.

Figure 8.
Photographs of CB/PHBV composites with three different CB concentrations, evaluating the wettability contact angle and surface for one of the samples.
The PHBV0 samples, processed hot, exhibited good powder fusion, resulting in homogeneous polymer samples with smooth surfaces, as shown in Figure 8. PHBV demonstrates hydrophobic characteristics, with an internal contact angle of approximately 81.3 ± 1.2° between the water droplet and the PHBV0 sample surface. This result is consistent with the literature reports for this polymer. However, the wettability of samples incorporating cassava bagasse showed a decreased contact angle. This reduction is primarily attributed to the hydrophilic nature of starch, the major component of the residue (CB), as discussed in this manuscript. The contact angles were approximately 81°, 52°, and 72° for the PHBV0, PHBV5, and PHBV10 samples, respectively. This indicates that the lowest CB content resulted in greater wettability. In contrast, higher CB content led to an approximate 20° increase in contact angle, likely due to potential agglomeration of the filler (Figure 7), creating greater surface roughness and thus increasing the contact angle [46].
3.7. Scanning Electron Microscopy (SEM)
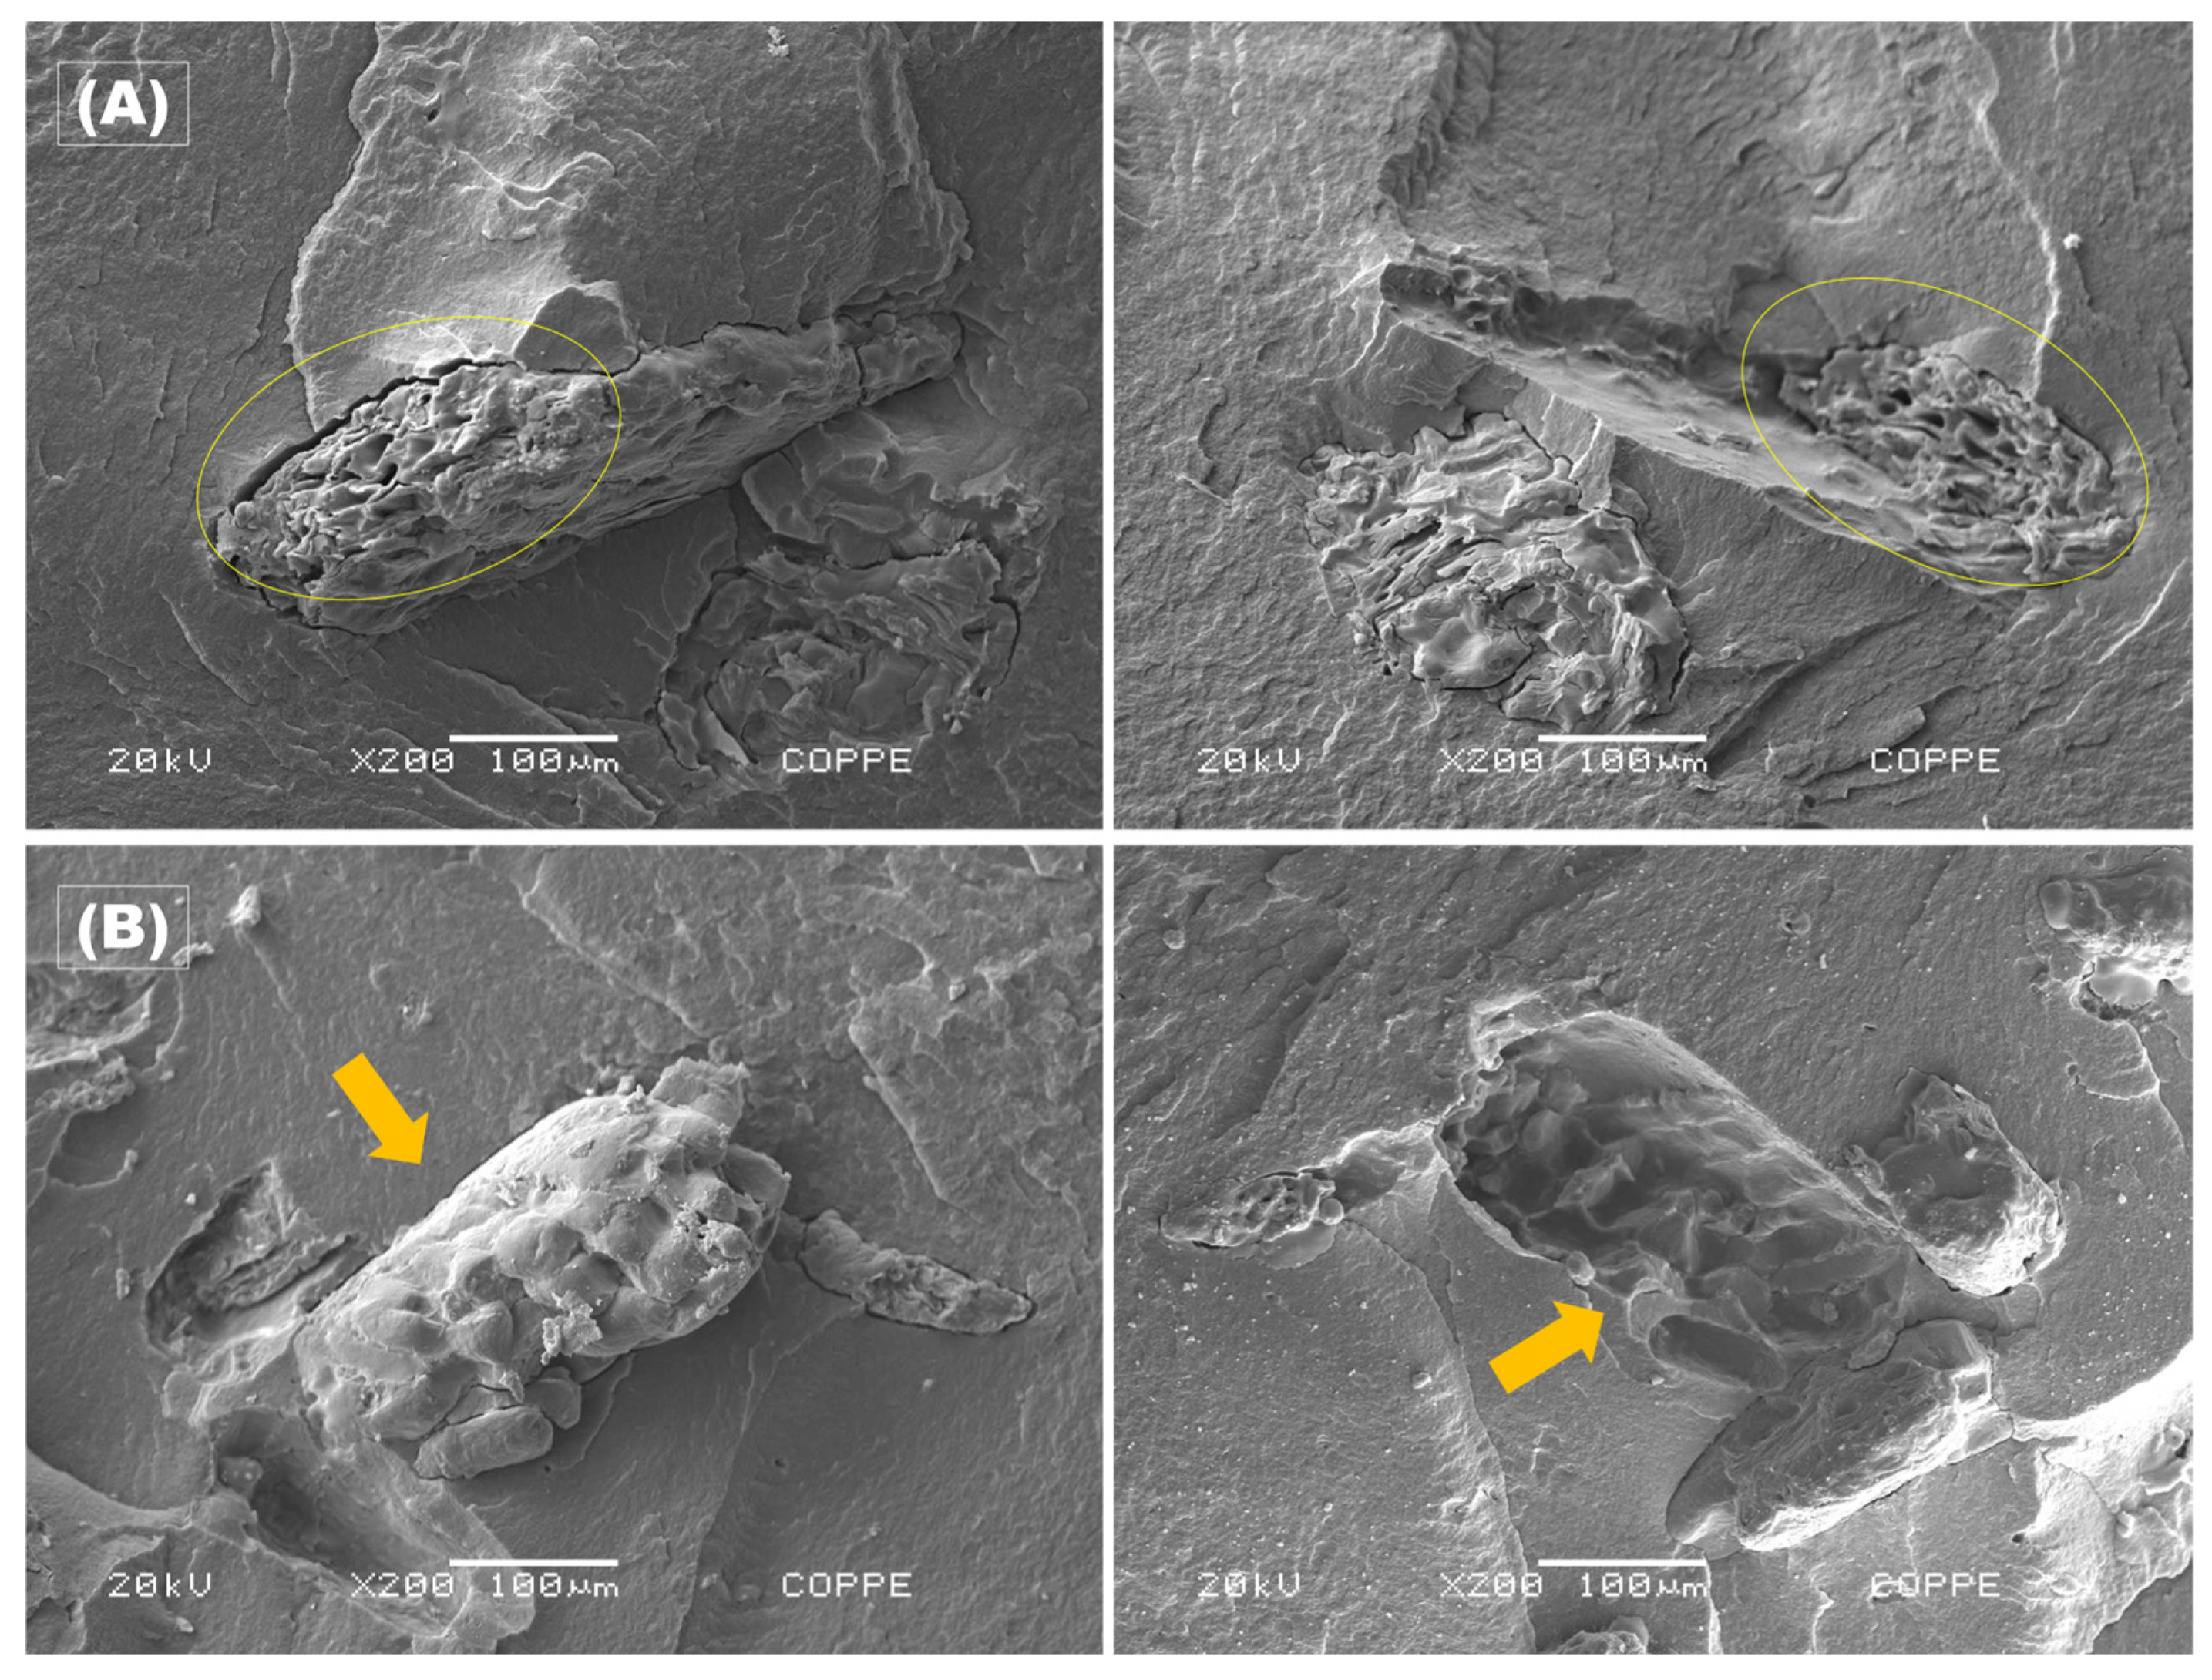
Figure 9 shows the microstructures of PHBV-based biocomposite cross-sections of the cassava bagasse films which were qualitatively assessed by scanning electron microscopy (SEM) observation.

Figure 9.
SEM images of the cross-section of both sides fractured, highlighting the CB agglomerates for the two studied concentrations: (A) PHBV5 – yellow circles; and (B) PHBV10 – orange arrows.
Figure 9 displays the SEM micrographs of the fracture surfaces of CB/PHBV samples for the two investigated compositions. Figure 9A(left) shows a cluster of CB particles in the formulation containing 5 wt.%, whereas Figure 9A(right) highlights the void left by this cluster (indicated in yellow). A similar behavior is evident in the samples with 10 wt. % of CB on both fracture surfaces (Figure 9B), where a cluster of residual particles detaches from the surface, leaving a void on the opposing fracture surface (Figure 9B(left)) atop a smoother polymeric matrix, as indicated by an orange arrow.
As mentioned earlier, both sides of the cross-section of PHBV5 and PHBV10 in Figure 9 exhibit broken filler due to the fragile fracture of the samples. This is indicative that there was a good adhesion of the cassava bagasse in the PHBV matrix, although the hydrophobic characteristic of the polymer matrix, the hydrophilic characteristic of the filler, and the small gap between the filler and the matrix that can be seen in Figure 9. However, some fillers were pulled out of the matrix, as indicated by the arrow in Figure 9B, which suggests that not all particles were properly added to the matrix. Some cassava rope granules exhibited gelatinization during the process, primarily for the lower concentration (PHBV5), indicating the granules’ oval morphology loss, as depicted in Figure 9A(right). In contrast, the starch granules in the 10% formulation were largely preserved. This discrepancy is primarily attributed to the higher heat diffusion over the starch grains in the PHBV5 samples during the hot-pressing process, leading to gelatinization, a phenomenon observed to a lesser extent in the PHBV10 samples (Figure 9B). These findings are consistent with those reported in the literature for similar processing using various virgin starches [51,63,64,65].
3.8. Migration Test
The average total migration values obtained by the migration test of the produced films are shown in Table 6.
Table 6.
Total migration average results (mg/kg) of PHBV0, PHBV5, and PHBV10 in specific simulants as Resolution 105/99 ANVISA [34].
According to Resolution 105/99 ANVISA, 5.0 mg/kg is the maximum tolerance for the complete migration of plastic packages in contact with food in Brazil. From Table 5, it was possible to observe that all produced films obtained an average total migration inferior to 5.0 mg/kg. These results indicate the possibility of using these materials as food packaging at 5 °C and 40 °C—simulating chilled and shelf food, respectively—in contact with aqueous and oily food, corresponding to the distilled water and olive oil simulants, respectively. However, the values of the films in contact with olive oil were all negative, indicating that there was probably oil adsorption in the films.
3.9. Water Uptake (WU)
Water uptake (WU) average values and standard deviation of the films are presented in Table 7.
Table 7.
Water uptake (WU) average values and standard deviation of PHBV0, PHBV5, and PHBV10.
The WU parameter of PHBV0 is negligible regarding its hydrophobic nature. The cassava bagasse addition in the PHBV matrix increased the WU value of the material by 60% for PHBV5 and 175% for PHBV10 compared to PHBV0, as expected. An explanation of this behavior could be the polar character of the cassava bagasse that enhances the water uptake of the material and/or the presence of a gap at the interface between the filler and the matrix, as was seen by SEM images, which can facilitate moisture retention [40].
These results align with the water uptake (WU) values reported in the literature for lignocellulosic composites. The values observed for CB/PHBV composites (Table 7) in this study (0.75% for PHBV0, 1.22% for PHBV5, and 2.08% for PHBV10) are comparable to those of other polymeric materials used in packaging applications. For instance, polyester resin composites containing 10% and 20% MDF residue exhibited WU values of 1.44% and 3.77%, respectively, demonstrating the influence of lignocellulosic fillers on moisture absorption in polymer matrices [66]. Similarly, chitosan-based films, known for their hydrophilic nature, exhibit significantly higher water absorption due to their porous structure [67]. Additionally, hybrid composites of glass and natural fibers reported in the literature display WU values ranging from 1% to 2.7% after prolonged water exposure [68]. These comparisons indicate that while CB increases the hydrophilicity of PHBV composites, the measured WU values remain within the typical range for bio-based packaging materials. Furthermore, strategies such as surface treatments, polymer blending, or processing modifications could further enhance the water resistance of PHBV/CB composites for specific packaging applications
4. Conclusions
PHBV-based biocomposites employing residue of cassava starch production (cassava bagasse) were successfully fabricated by compression molding. This study aimed to examine the fabricated films’ thermal, physical–chemical, and morphological properties for packaging food applications. The cassava bagasse can be used as a filler in the PHBV matrix. It was possible to observe that the addition of CB in the plasticized PHBV matrix did not affect some properties compared to PHBV0, such as the crystal thickness of the PHBV, the crystalline structures, the crystallinity degree of the biocomposite, and the thermal stability. However, the filler addition could act as a nucleating agent and enhance the crystallinity degree of the PHBV, as shown by DSC and NMR relaxometry analysis once the CB presence probably increased the polymer chain mobility, facilitating the polymer crystallization. This role of the CB could reduce the problems related to the secondary crystallization of PHBV, which leads to physical aging during storage. From SEM analysis, the fractured filler caused by the fragile fracture can indicate good adhesion of the cassava bagasse in the PHBV matrix. However, it was seen that some fillers were pulled out of the matrix, and the ones that were fractured presented a small space between the filler–matrix interface.
The results reported in this work showed that these materials represent an alternative to chilled and shelf-aqueous food packaging applications. However, their use still requires a detailed analysis, considering the specific needs of each case and the safety needs of each food. Thus, producing biocomposites with a PHBV matrix could be a potential solution for cassava bagasse use, reducing the environmental concerns caused by its incorrect disposal. At the same time, it reduces the cost of the polymer and improves some properties.
Author Contributions
Conceptualization, F.R.D. and P.H.M.C.; methodology, P.H.M.C.; validation, F.R.D., P.H.M.C. and J.M.A.-M.; formal analysis, P.H.M.C. and J.M.A.-M.; investigation, F.R.D.; resources, R.M.d.S.M.T.; data curation, F.R.D., P.H.M.C. and J.M.A.-M.; writing—original draft preparation, F.R.D., P.H.M.C. and J.M.A.-M.; writing—review and editing, R.M.d.S.M.T.; visualization, J.M.A.-M.; supervision, R.M.d.S.M.T.; project administration, R.M.d.S.M.T.; funding acquisition, R.M.d.S.M.T. All authors have read and agreed to the published version of the manuscript.
Funding
This research was funded by the following Brazilian agencies: Coordenação de Aperfeiçõamento de Pessoal de Nível Superior—Capes, National Council for Scientific and Technological Development—CNPq, and Fundação Carlos Chagas Filho de Amparo à Pesquisa do Estado do Rio de Janeiro—FAPERJ for financial support.
Data Availability Statement
The data supporting this study’s findings are available from the corresponding authors upon reasonable request.
Acknowledgments
The authors extend their gratitude to the Microscopy Nucleus of COPPE at the Federal University of Rio de Janeiro (UFRJ), Rio de Janeiro, Brazil, for their support with the use of the microscopes and the Multi-user Laboratory of Materials Characterization of COPPE/UFRJ, for the support with FTIR, XDR, and thermal analysis.
Conflicts of Interest
The authors declare no conflicts of interest.
References
- Paini, J.; Benedetti, V.; Ail, S.S.; Castaldi, M.J.; Baratieri, M.; Patuzzi, F. Valoration of wastes from the food production industry: A review towards as integrated agri-food processing biorefinery. Waste Biomass Valor. 2022, 13, 31–50. [Google Scholar] [CrossRef]
- Astudillo, Á.; Rubilar, O.; Briceño, G.; Diez, M.C.; Schalchli, H. Advances in agroindustrial waste as a substrate for obtaining eco-friendly microbial products. Sustainability 2023, 15, 3467. [Google Scholar] [CrossRef]
- Zhao, F.; Liu, X.; Zhao, J.; Feng, T.; Guo, W. Plant fiber-reinforced composites based on injection molding process: Manufacturing, service life, and remanufacturing. Polym. Compos. 2024, 45, 4876–4899. [Google Scholar] [CrossRef]
- Tariq, A.; Bhawani, S.A.; Moheman, A.; Alotaibi, K.M. Introduction to agro-industrial waste. In Extraction of Natural Products from Agro-Industrial Wastes; Bhawani, S.A., Khan, A., Ahmad, F.B., Eds.; Elsevier: Amsterdam, The Netherlands, 2023. [Google Scholar] [CrossRef]
- Hossain, M.T.; Shahid, M.A.; Akter, S.; Ferdous, J.; Afroz, K.; Refat, K.R.I.; Faruk, O.; Jamal, M.S.I.; Uddin, N.; Samad, A.B. Cellulose and starch-based bioplastic: A review of advances and challenges for sustainability. Polym-Plast. Technol. Mater. 2024, 63, 1329–1349. [Google Scholar] [CrossRef]
- Parmar, A.; Sturm, B.; Hensel, O. Crops that feed the world: Production and improvement of cassava for food, feed, and industrial uses. Food Secur. 2017, 9, 907–927. [Google Scholar] [CrossRef]
- Abotbina, W.; Sapuan, S.M.; Ilyas, R.A.; Sultan, M.T.H.; Alkbir, M.F.M.; Sulaiman, S.; Harussani, M.M.; Bayraktar, E. Recent developments in cassava (Manihot esculenta) based biocomposites and their potential industrial applications: A comprehensive review. Materials 2022, 15, 6992. [Google Scholar] [CrossRef]
- Pandey, A.; Soccol, C.R.; Nigam, P.; Soccol, V.T.; Vandenberghe, L.P.S.; Mohan, R. Biotechnological potential of agro-industrial residues. II: Cassava bagasse. Bioresour. Technol. 2000, 74, 81–87. [Google Scholar] [CrossRef]
- Thuppahige, V.T.W.; Moghaddam, L.; Welsh, Z.G.; Wang, T.; Karim, A. Investigation of critical properties of Cassava (Manihot esculenta) peel and bagasse as starch-rich fibrous agro-industrial wastes for biodegradable food packaging. Food Chem. 2023, 422, 136200. [Google Scholar] [CrossRef]
- Nath, P.C.; Ojha, A.; Debnath, S.; Sharma, M.; Nayak, P.K.; Sridhar, K.; Inbaraj, B.S. Valorization of food waste as animal feed: A step towards sustainable food waste management and circular bioeconomy. Animals 2023, 13, 1366. [Google Scholar] [CrossRef]
- Versino, F.; López, O.V.; García, M.A. Sustainable use of cassava (Manihot esculenta) roots as raw material for biocomposites development. Ind. Crops Prod. 2015, 65, 79–89. [Google Scholar] [CrossRef]
- Nair, M.P.D.; Padmaja, G.; Sajeev, M.S.; Sheriff, J.T. Bioconversion of cellulo-starch waste from Cassava starch industries for ethanol production: Pretreatment technique and improved enzyme systems. Ind. Biotechnol. 2012, 8, 300–308. [Google Scholar] [CrossRef]
- Fuente-Arias, C.I.L.; Gonzáles-Martínez, C.; Chiralt, A. Lamination of starch/polyesters by thermocompression for food packaging purposes. Sustain. Food Technol. 2023, 1, 296–305. [Google Scholar] [CrossRef]
- Salazar-Sánchez, M.R.; Delgado-Calvache, L.I.; Casas-Zapata, J.C.; Villada-Castillo, H.S.; Solanilla-Duque, J.F. Soil biodegradation of a blend of cassava starch and polylactic acid. Ing. Investig. 2022, 42, e93710. [Google Scholar] [CrossRef]
- Awogbemi, O.; Van Kallon, D.V.; Ray, R.C. Transformation of cassava wastes into useful products. In Transforming Agriculture Residues for Sustainable Development, Waste as a Resource; Arora, J., Joshi, A., Ray, R.C., Eds.; Springer: Cham, Germany, 2024; pp. 353–370. [Google Scholar] [CrossRef]
- Balwada, J.; Samaiya, S.; Mishra, R.P. Packaging plastic waste management for a circular economy and identifying a better waste collection system using analytical hierarchy process (AHP). Procedia CIRP 2021, 98, 270–275. [Google Scholar] [CrossRef]
- Da Conceição, M.N.; Anaya-Mancipe, J.M.; Coelho, A.W.F.; Cardoso, P.H.M.; Thiré, R.M.S.M. Application of starch-rich mango by-product as filler for the development of an additive manufacturing filament compound. Int. J. Biol. Macromol. 2024, 260, 129519. [Google Scholar] [CrossRef]
- Scheliga, C.G.; Teixeira, C.M.L.L.; Mancipe, J.M.A.; Calderari, M.R.C.M. The residual crude glycerol enhancement of the amoniacal nitrogen bioremediation by microalgae and bacteria consortium with concomitant production of PHAs and pigments of industrial interest. Algal Res. 2023, 76, 103301. [Google Scholar] [CrossRef]
- Policastro, G.; Panico, A.; Fabbricino, M. Improving biological production of poly(3-hydroxybutyrate-co-3-hydroxyvalerate) (PHBV) co-polymer: A critical review. Rev. Environ. Sci. Bio/Technol. 2021, 20, 479–513. [Google Scholar] [CrossRef]
- Koller, M.; Mukherjee, A. A new wave of industrialization of PHA biopolyesters. Bioengineering 2022, 9, 74. [Google Scholar] [CrossRef]
- Eslami, H.; Grady, M.; Mekonnen, T.H. Biobased and compostable trilayer thermoplastic films based based on poly(3-hydroxybutyrate-co-3-hydroxyvalereate) (PHBV) and thermoplastic starch (TPS). Int. J. Biol. Macromol. 2022, 220, 385–394. [Google Scholar] [CrossRef]
- Zaverl, M.; Seydibeyoğlu, M.Ö.; Misra, M.; Mohanty, A. Studies on recyclability of polyhydroxybutyrate-co-valerate bioploastic: Multiple melt processing and performance evaluations. J. Appl. Polym. Sci. 2012, 125, E324–E331. [Google Scholar] [CrossRef]
- Jost, V.; Langowski, H.C. Effect of different plasticisers on the mechanical and barrier propierties of extruded cast PHBV films. Eur. Polym. J. 2015, 86, 302–312. [Google Scholar] [CrossRef]
- Rabello, L.G.; Ribeiro, R.C.C.; Pinto, J.C.C.S.; Thiré, R.M.S.M. Chemical recycling of green poly(3-hydroxybutyrate-co-e-hydroxyvalerate) (PHBV)-based air filters through hydrolysis. J. Environ. Chem. Eng. 2024, 12, 111816. [Google Scholar] [CrossRef]
- Sleiman, G.; Colomines, G.; Deterre, R.; Petit, I.; Leroy, E.; Belhabib, S. PHBV crystallization under injection molding conditions: Influence of packing pressure and mold temperature. J. Renew. Mater. 2018, 6, 270–276. [Google Scholar] [CrossRef]
- Frącz, W.; Janowski, G.; Smusz, R.; Szumski, M. The influence of chosen plant fillers in PHBV composites on the processing conditions, mechanical properties and quality of molded pieces. Polymers 2021, 13, 3934. [Google Scholar] [CrossRef]
- Bairwan, R.D.; Yahya, E.B.; Gopakumar, D.; Abdul Khalil, H.P. Recent advances in poly(3-hydroxybutyrate-co-3-hydroxyvalerate) biocomposites in sustainable packaging applications. Adv. Mater. Lett. 2024, 15, 24011739. [Google Scholar] [CrossRef]
- Berthet, M.A.; Angellier-Coussy, H.; Chea, V.; Guillard, V.; Gastaldi, E.; Gontard, N. Sustainable food packaging: Valosising wheat straw fibers for turing PHBV-based composites properties. Compos. Part A: Appl. Sci. Manuf. 2015, 72, 139–147. [Google Scholar] [CrossRef]
- Majrashi, M.A.A.; Dev Bairwan, R.; Mushtaq, R.Y.; Khalil, H.P.S.A.; Badr, M.; Alissa, M.; Abdullah, C.K.; Ali, B.A.; Rizg, W.; Hosny, K.M. Novel enhancement of interfacial interaction and properties in biodegradable polymer composites using green chemically treated spend coffee ground microfiller. Int. J. Biol. Macromol. 2024, 266, 131333. [Google Scholar] [CrossRef]
- Zanini, N.; Carneiro, E.; Menezes, L.; Barud, H.; Mullinari, D. Plam fibers residues from agro-industries as reinforcement in biopolymer filaments for 3D-printed scaffolds. Fibers Polym. 2021, 22, 2689–2699. [Google Scholar] [CrossRef]
- Torres-Giner, S.; Hilliou, L.; Melendez-Rodriguez, B.; Figueroa-Lopez, K.J.; Madalena, D.; Cabedo, L.; Covas, J.A.; Vicente, A.A.; Lagaron, J.M. Melt processability, characterization, and antibacterial activity of compression-molded green composite sheets made of poly(3-hydroxybutyrate-co-3-hydroxyvalerate) reinforced with coconut fibers impregnated with oregano essential oil. Food Packag. Shelf. Live 2018, 17, 39–49. [Google Scholar] [CrossRef]
- Berthet, M.A.; Gontard, N.; Angellier-Coussy, H. Impact of fiber moisture content on the structure/mechanical properties relationships of PHBV/wheat straw fibers biocomposites. Compos. Sci. Technol. 2015, 117, 386–391. [Google Scholar] [CrossRef]
- Valeranio, I.H.; Marques, G.L.; Freitas, S.P.; Couri, S.C.; Penha, E.M.; Gonçalves, M.M. Cassava Pulp enzymatic hydrolysate as a promising feedstock for ethanol production. Braz. Arco Biol. Technol. 2018, 61, e18161214. [Google Scholar] [CrossRef]
- Matheus, J.R.V.; de Farias, P.M.; Satoriva, J.M.; de Andrade, C.J.; Fai, A.E.C. Cassava starch film for food packaging: Trend over the las decade and future research. Int. J. Biol. Macromol. 2023, 225, 658–672. [Google Scholar] [CrossRef]
- Thiré, R.M.S.M.; Ribeiro, T.A.A.; Andrade, C.T. Effect of starch addition on compression-molded poly(3-hydroxybutyrate)/starch blends. J. Appl. Polym. Sci. 2006, 100, 4338–4347. [Google Scholar] [CrossRef]
- Macedo, J.S.; Costa, M.F.; Tavares, M.I.B.; Thiré, R.M.S.M. Preparation and characterization of composites based on polyhydroxybutyrate and waste powder from coconut fibers processing. Polym. Eng. Sci. 2010, 50, 1466–1475. [Google Scholar] [CrossRef]
- Branciforti, M.C.; Corrêa, M.C.S.; Pollet, E.; Agnelli, J.A.M.; Nascente, P.A.P.; Avérous, L. Crystallinity study of nano-biocomposites based on plasticized poly(hydroxybutyrate-co-hydroxyvalerate) with organo-modified montmorillonite. Polymer Testing 2013, 32, 1253–1260. [Google Scholar] [CrossRef]
- Reis, D.C.C.; Morais, A.C.L.; Carvalho, L.H.; Alves, T.S.; Barbosa, R. Assessment of the morphology and interaction of PHBV/clay bionanocomposites: Uses as food packaging. Macromol. Symp. 2016, 367, 113–118. [Google Scholar] [CrossRef]
- Agência Nacional de Vigilância Sanitária (ANVISA). Regulamento Técnico Critérios Gerais e Classificação de Materiais para Embalagens e Equipamentos em Contato com Alimentos; Diário Oficial República Federativa do Brasil: Brasília, Brazil, 1996. Available online: https://antigo.anvisa.gov.br/documents/10181/2718376/%282%29RES_105_1999_COMP.pdf/6ebe53f3-a039-466f-99b0-908e9ef9ea60 (accessed on 2 February 2023).
- Kaci, M.; Cimmino, S.; Silvestre, C.; Duraccio, D.; Benhamida, A.; Zaida, L. Ethylene butyl acrylate glycidyl methacrylate terpolymer as an interfacial agent for isotactic poly(propylene)/wood flour composites. Macromol. Mater. Eng. 2006, 291, 869–876. [Google Scholar] [CrossRef]
- Garske, R.P.; Mercali, G.D.; Thys, R.C.S.; Cladera-Oliveira, F. Cassava starch and chickpea flour pre-treated by microwave as a substitute for gluten-free bread additives. J. Food Sci. Technol. 2023, 60, 53–63. [Google Scholar] [CrossRef]
- Suárez-Castillo, G.M.; Salcedo-Guadalupe, J.G.; Contreras-Lozano, K.P.; Rangel-Pérez, M.G.; Cervera-Ricardo, M.A.; Figueroa-Flórez, J.A. Increase in the degree of substitution of cassava starches by dual modification process. Rev. Mex. Ing. Quim. 2024, 23, 1–15. [Google Scholar] [CrossRef]
- Diehl, M.; Silva, L.F.O.; Schnorr, C.; Netto, M.S.; Bruckmann, F.S.; Dotto, G.L. Cassava bagasse as an alternative biosorbent to uptake methylene blue environmental pollutant from water. Environ. Sci. Pollut. Res. 2023, 30, 51920–51931. [Google Scholar] [CrossRef]
- Raouf, R.M. Analyse the mechanical, electrical, thermal, and structural properties of the starch/polyvinyl alcohol bio-composite. Polym-Plastic Technol. Mater. 2024, 63, 667–679. [Google Scholar] [CrossRef]
- Joshi, P.; Gupta, K.; Uniyal, P.; Jana, A.; Banerjee, A.; Kumar, N.; Ghosh, D.; Srivastava, M.; Ray, A.; Khatri, O.P. Cassava starch-derived aerogel as biodegradable packaging materials. Mater. Chem. Phys. 2023, 296, 127282. [Google Scholar] [CrossRef]
- Da Conceição, M.N.; dos Santos, M.C.C.; Mancipe, J.M.A.; Pereira, P.S.C.; Ribeiro, R.C.C.; Thiré, R.M.S.M.; Bastos, D.C. A biodegradable composite of poly(3-hydroxybutyrate-co-3-hydroxyvalerate) (PHBV) with short cellulose fiber for packaging. Mater. Res. 2023, 26 (Suppl. S1). [Google Scholar] [CrossRef]
- Toledo, A.L.M.M.; Rodrigues, E.J.R.; Cavalcante, M.P.; Dutra-Filho, J.C.; Tavares, M.I.B. Spectroscopic evidence of successful in situ insertion of sol-gel silica in a poly(3-hydroxybutyrate) matrix. J. Thermoplast. Compos. Mater. 2022, 35, 1408–1421. [Google Scholar] [CrossRef]
- Rabello, L.G.; Alvares, M.R.N.; Ribeiro, R.C.C.; Jardim, P.M.; Thiré, R.M.S.M. Correlation between solution relative viscosity and the microstructural properties of the poly(3-hydroxybutyrate-co-3-hydroxyvalerate)—PHBV solution blow spun mats. Express Polym. Lett. 2023, 17, 1239–1256. [Google Scholar] [CrossRef]
- Liu, Q.S.; Zhu, M.F.; Wu, W.H.; Qin, Z.Y. Reducing the formation of six-membered ring ester during thermal degradation of biodegradable PHBV to enhance its thermal stability. Polym. Degrad. Stab. 2009, 94, 18–24. [Google Scholar] [CrossRef]
- Wadaugsorn, K.; Panrong, T.; Wongphan, P.; Harnkarnsujarit, N. Plasticized hydroxypropyl cassava starch blended PBAT for improved clarity blown films: Morphology and properties. Ind. Crops Prod. 2022, 176, 114311. [Google Scholar] [CrossRef]
- Florez, J.P.; Fazeli, M.; Simão, R.A. Preparation and characterization of thermoplastic starch composite reinforced by plasma-treated poly (hydroxybutyrate) PHB. Int. J. Biol. Macromol. 2019, 123, 609–621. [Google Scholar] [CrossRef]
- Bruno, M.; Tavares, M.I.T.; Motta, L.M.; Miguez, E.; Preto, M.; Fernandez, A.O.R. Evaluation of PHB/clay nanocomposite by spin-lattice relaxation time. Mater. Res. 2008, 11, 483–485. [Google Scholar] [CrossRef]
- Ibrahim, I.M.; Alsafadi, D.; Alamry, K.A.; Hussein, M.A. Properties and applications of poly(3-hysroxybutyrate-co-3-hydroxyvalerate) biocomposites. J. Polym. Environm. 2021, 29, 1010–1030. [Google Scholar] [CrossRef]
- El-Taweel, S.H.; Al-Hamdi, A. Starch as a successful biodegradable nucleating agent in biodegradable PHBV/PHO blends. J. Therm. Anal. Calorim. 2024, 149, 1351–1364. [Google Scholar] [CrossRef]
- Edhirej, A.; Sapuan, S.M.; Jawaid, M.; Zahari, N.I. Preparation and characterization of cassava bagasse reinforced thermoplastic cassava starch. Fibers Polym. 2017, 18, 162–171. [Google Scholar] [CrossRef]
- Hassaini, L.; Kaci, M.; Touati, N.; Pillin, I.; Kervoelen, A.; Bruzaud, S. Valorization of olive husk flour as a filler for biocomposites based on poly(3-hydroxibutyrate-co-3-hydroxyvalerate): Effects of silane treatment. Polym. Testing 2017, 59, 430–440. [Google Scholar] [CrossRef]
- Xu, Y.; Zou, L.; Lu, H.; Wei, Y.; Hua, J.; Chen, S. Preparation and characterization of electrospun PHBV/PEO mats: The role of solvent and PEO component. J. Mater. Sci. 2016, 51, 5695–5711. [Google Scholar] [CrossRef]
- Benini, K.C.C.C.; Cioffi, M.O.H.; Voorwald, H.J.C. PHBV/cellulose nanofibrils composites obtained by solution casting and electrospinning process. Matéria (Rio J.) 2017, 22, e11837. [Google Scholar] [CrossRef]
- Teixeira, E.M.; Róz, A.L.; Carvalho, A.J.F.; Curvelo, A.A.S. Preparation and characterization of thermoplastic starches from cassava starch, cassava root and cassava bagasse. Macromol. Symp. 2005, 229, 266–275. [Google Scholar] [CrossRef]
- Anaya-Mancipe, J.M.; de Figueiredo, A.C.; Rebello, L.G.; Dias, M.L.; Thiré, R.M.S.M. Evaluation of the polycaprolactone hydrolytic degradation in acid solvent and its influence on the electrospinning process. J. Appl. Polym. Sci. 2024, 141, e55662. [Google Scholar] [CrossRef]
- Jarrells, T.W.; Munson, E.J. Comparison of differential scanning calorimetry, power X-ray diffraction, and solid-state nuclear magnetic resonance spectroscopy for measuring crystallinity in amorphous solid dispersions—Application to drug-in-polymer solubility. J. Pharm. Sci. 2022, 111, 2765–2778. [Google Scholar] [CrossRef]
- Venkatram, S.; Mc Collum, J.; Stingelin, N.; Brettmann, B. A close look at polymer degree crystallinity versus polymer crystalline quality. Polym. Int. 2023, 72, 855–860. [Google Scholar] [CrossRef]
- Singh, N.; Singh, J.; Kaur, L.; Sodhi, N.S.; Gill, B.S. Morphological, thermal and rheological properties of starches from different botanical source. Food Chem. 2003, 81, 219–231. [Google Scholar] [CrossRef]
- Kayode, B.I.; Kayode, R.M.O.; Salami, K.O.; Obilana, A.O.; George, T.T.; Dudu, O.E.; Adebo, O.A.; Njobeh, P.B.; Diarra, S.S.; Oyeyinka, S.A. Morphology and physicochemical properties of starch isolated from frozen cassava root. LWT 2021, 147, 111546. [Google Scholar] [CrossRef]
- Han, H.; Hou, J.; Yang, N.; Zhang, Y.; Chen, H.; Zhang, Z.; Shen, Y.; Huang, S.; Guo, S. Insight on the changes of cassava and potato starch granules during gelatinization. Int. J. Biol. Macromol. 2019, 126, 37–43. [Google Scholar] [CrossRef]
- Gomes, J.W.; Godoi, G.S.; de Souza, L.G.M.; de Souza, L.G.V.M. Water absorption and mechanical properties of polymer composites using waste MDF. Polímeros 2017, 27, 48–55. [Google Scholar] [CrossRef]
- Assis, O.B.G.; da Silva, V.L. Caracterização estrutural e da Capacidade de absorção de água em filmes finos de quitosana processados em diversas concentrações. Polímeros 2003, 13, 223–228. [Google Scholar] [CrossRef]
- Fontan Junior, O.; Oliveira, F.S.; Silva, D.A.K. Caracterização mecânica, térmica e perfil de absorção de água de compósitos híbridos de vidro/fibra de pupunheira em matriz poliéster insaturado. Rev. Elect. Mater. 2010, 5, 1–9. [Google Scholar]
Disclaimer/Publisher’s Note: The statements, opinions and data contained in all publications are solely those of the individual author(s) and contributor(s) and not of MDPI and/or the editor(s). MDPI and/or the editor(s) disclaim responsibility for any injury to people or property resulting from any ideas, methods, instructions or products referred to in the content. |
© 2025 by the authors. Licensee MDPI, Basel, Switzerland. This article is an open access article distributed under the terms and conditions of the Creative Commons Attribution (CC BY) license (https://creativecommons.org/licenses/by/4.0/).