Article

The Oil/Water Two-Phase Flow Behavior of Dual-Porosity Carbonates

1
State Key Laboratory of Petroleum Resources and Prospecting, China University of Petroleum, Beijing 102249, China
2
School of Mining and Petroleum Engineering, University of Alberta, Edmonton, AB T6G 1H9, Canada
*
Author to whom correspondence should be addressed.
Processes 2025, 13(3), 713; https://doi.org/10.3390/pr13030713
Submission received: 20 December 2024 / Revised: 25 February 2025 / Accepted: 26 February 2025 / Published: 1 March 2025
(This article belongs to the Section Energy Systems)

Abstract

:
Dual-porosity carbonates exhibit abundant macropores and micropores, yet the mechanisms governing oil/water flow at the dual-porosity scale remain inadequately understood. This study investigates the flow behavior in dual-porosity carbonates during forced imbibition. Initially, carbonate characteristics were extracted using a random field method to generate two types of porous media. Subsequently, the multiple-relaxation-time color-gradient lattice Boltzmann method, validated by experimental and analytical solutions, was employed to systematically evaluate the effects of wettability, capillary number, and oil/water viscosity ratio on oil displacement efficiency in dual-porosity carbonates during forced imbibition. The reliability of the simulated oil displacement efficiency was verified through core waterflooding experiments. The results reveal that under water-wet conditions, fluid flow paths in dual-porosity carbonates are strongly influenced by the blockage of micrite particles at low capillary numbers, while at high capillary numbers, the fragmentation of large continuous oil droplets interacting with micrite particles leads to more unstable interfaces. Under non-water-wet conditions, dominant capillary forces enhance oil displacement within macropores of dual-porosity carbonates. Under the same conditions, water-wet conditions are more favorable for improving oil displacement efficiency. As the capillary number increases, oil displacement efficiency exhibits a pronounced non-monotonic trend under non-water-wet conditions, attributed to the alternating dominance of viscous and capillary forces. Additionally, with an increase in oil/water viscosity ratio, the decline in oil displacement efficiency is less pronounced for dual-porosity carbonates compared to single-porosity carbonates, particularly under non-water-wet conditions at high capillary numbers.

Graphical Abstract

1. Introduction

Carbonate reservoirs are widely distributed worldwide and hold abundant reserves, primarily located in North America [1] and the Middle East [2], providing substantial economic benefit [3,4]. In the Middle East, the reservoir space of carbonate oil reservoirs is predominantly pore-based, with fractures being underdeveloped [5]. These formations, shaped by complex sedimentary and diagenetic processes, exhibit dual-porosity structures and highly heterogeneous fluid flow systems due to differences in grain size and micrite content [6,7]. This heterogeneity results in the coexistence of macropores and micropores, with micropores typically concentrated in micrite-rich regions along the edges of macropores, causing varying degrees of throat blockage. During water injection, significant amounts of oil and gas become trapped, restricting efficient reservoir development [8]. Compared to single-porosity reservoirs, dual-porosity carbonate reservoirs exhibit more complex fluid storage and flow patterns, making fluid flow behavior more challenging to characterize [9,10]. Consequently, studying oil/water two-phase flow behavior in dual-porosity carbonate reservoirs is crucial for enhancing oil recovery [11,12].
The pore structure plays a critical role in governing fluid flow behavior within reservoirs [13,14,15]. Extensive studies have investigated the spontaneous and forced imbibition behaviors of the wetting phase in single-porosity porous media [16,17,18]. In recent years, the influence of heterogeneity on fluid flow behavior has garnered significant attention in carbonate reservoirs [8,19,20]. Soulaine et al. [21] demonstrated that tiny pores can significantly impact the overall flow characteristics in porous media, particularly their contribution to permeability. Carrillo et al. [22] observed that tiny pores, which are often undetectable with imaging techniques, enhance the connectivity of fluid pathways, thereby influencing relative permeability, residual saturation, and fluid breakthrough time. Neglecting these tiny pores can result in significant errors in simulation outcomes. Suo et al. [23] investigated the effects of pores at different scales on immiscible fluid fingering patterns, revealing that micropores can suppress the formation of certain fingering patterns. Gao et al. [24] classified the pores in water-wet carbonate rocks into macropores and micropores, utilizing micro-CT imaging to study steady-state oil and water flow, and highlighted the significant contribution of movable oil in micropores to waterflooding efficiency. Spurin et al. [25] used micro-focus CT imaging to confirm the intermittent flow between micropores and macropores in carbonate rock samples. This intermittent flow often leads to fluid snap-off at the pore scale, significantly affecting relative permeability. Wang et al. [26] applied CT scanning technology at uniform resolution to study the effects of heterogeneity and capillary number on the oil displacement efficiency of heterogeneous carbonate rocks. Most of these studies focus on the impacts of micropores and pore structure heterogeneity on permeability and relative permeability observed under CT imaging. However, due to the resolution limitations of imaging technology, the pore-scale mechanisms governing oil/water two-phase flow in dual-porosity porous media remain poorly understood. This necessitates further research at the pore scale, providing a theoretical foundation for improving oil recovery in carbonate reservoirs.
Fluid flow characteristics in heterogeneous carbonate reservoirs are typically investigated using numerical simulations, experiments, and theoretical analysis. Experiments provide intuitive and controllable means of investigation but are constrained by high costs and practical challenges, particularly under complex or extreme conditions. In contrast, numerical simulations, on the other hand, are more cost-effective and capable of modeling scenarios that are difficult to reproduce experimentally. Consequently, they are widely applied in studying fluid flow characteristics at the pore scale. Common direct numerical simulation approaches include the lattice Boltzmann method (LBM) [27,28] and grid-based computational fluid dynamics (CFD) [29,30]. CFD methods typically solve the Navier–Stokes (N-S) equations in combination with interface tracking algorithms to define immiscible fluid boundaries, such as the volume of fluid (VOF) [31,32], level-set (LS) [33], and phase field [34,35] methods. The VOF method depends heavily on mesh resolution, requiring exceptionally fine meshes to accurately capture interfaces in complex pore geometries, which significantly increases computational costs. The LS method faces stability issues when modeling interfaces with high curvature or complex geometries. The phase field method requires carefully calibrated input parameters to accurately represent physical phenomena such as interfacial tension and contact angle, which can be challenging to achieve. The LBM, a mesoscale technique grounded in the N-S or convection–diffusion equations [27,36], has seen significant advancements in multiphase modeling. These include the pseudopotential model [37,38], color-gradient model [27,39,40], free energy model [41,42], and mean phase field model [43]. Among these, the color-gradient model stands out in simulating oil/water two-phase flows under conditions of negligible gravity effects and small viscosity ratio differences. It directly captures the impacts of interfacial tension and contact angle on fluid flow behavior. Additionally, the color-gradient model is particularly well suited for multiscale fluid flow simulations, enabling the transition from microscopic to macroscopic scales and effectively illustrating the evolution of fluid interfaces within micropores in dual-porosity porous media.
In this work, thin-section photomicrographs and mercury injection experiments are initially performed to determine the pore structure characteristics of single-porosity and dual-porosity carbonate rock porous media. Subsequently, a forced imbibition model based on the multiple-relaxation-time color-gradient LBM is developed, and the accuracy of the model is validated through the analytical solution and experimental data of capillary imbibition. The model incorporates the initial oil/water distribution characteristics in reservoirs with varying wettability and is used to analyze the distinct interface evolution patterns in dual-porosity and single-porosity media. Finally, the reliability of the oil displacement efficiency simulation results is further confirmed through core waterflooding experiments, and the effects of wettability, capillary number, and viscosity ratio on oil displacement efficiency during the forced imbibition process are evaluated for single-porosity and dual-porosity carbonate rocks. These findings are crucial for enhancing oil recovery in carbonate reservoirs.

2. Materials and Methods

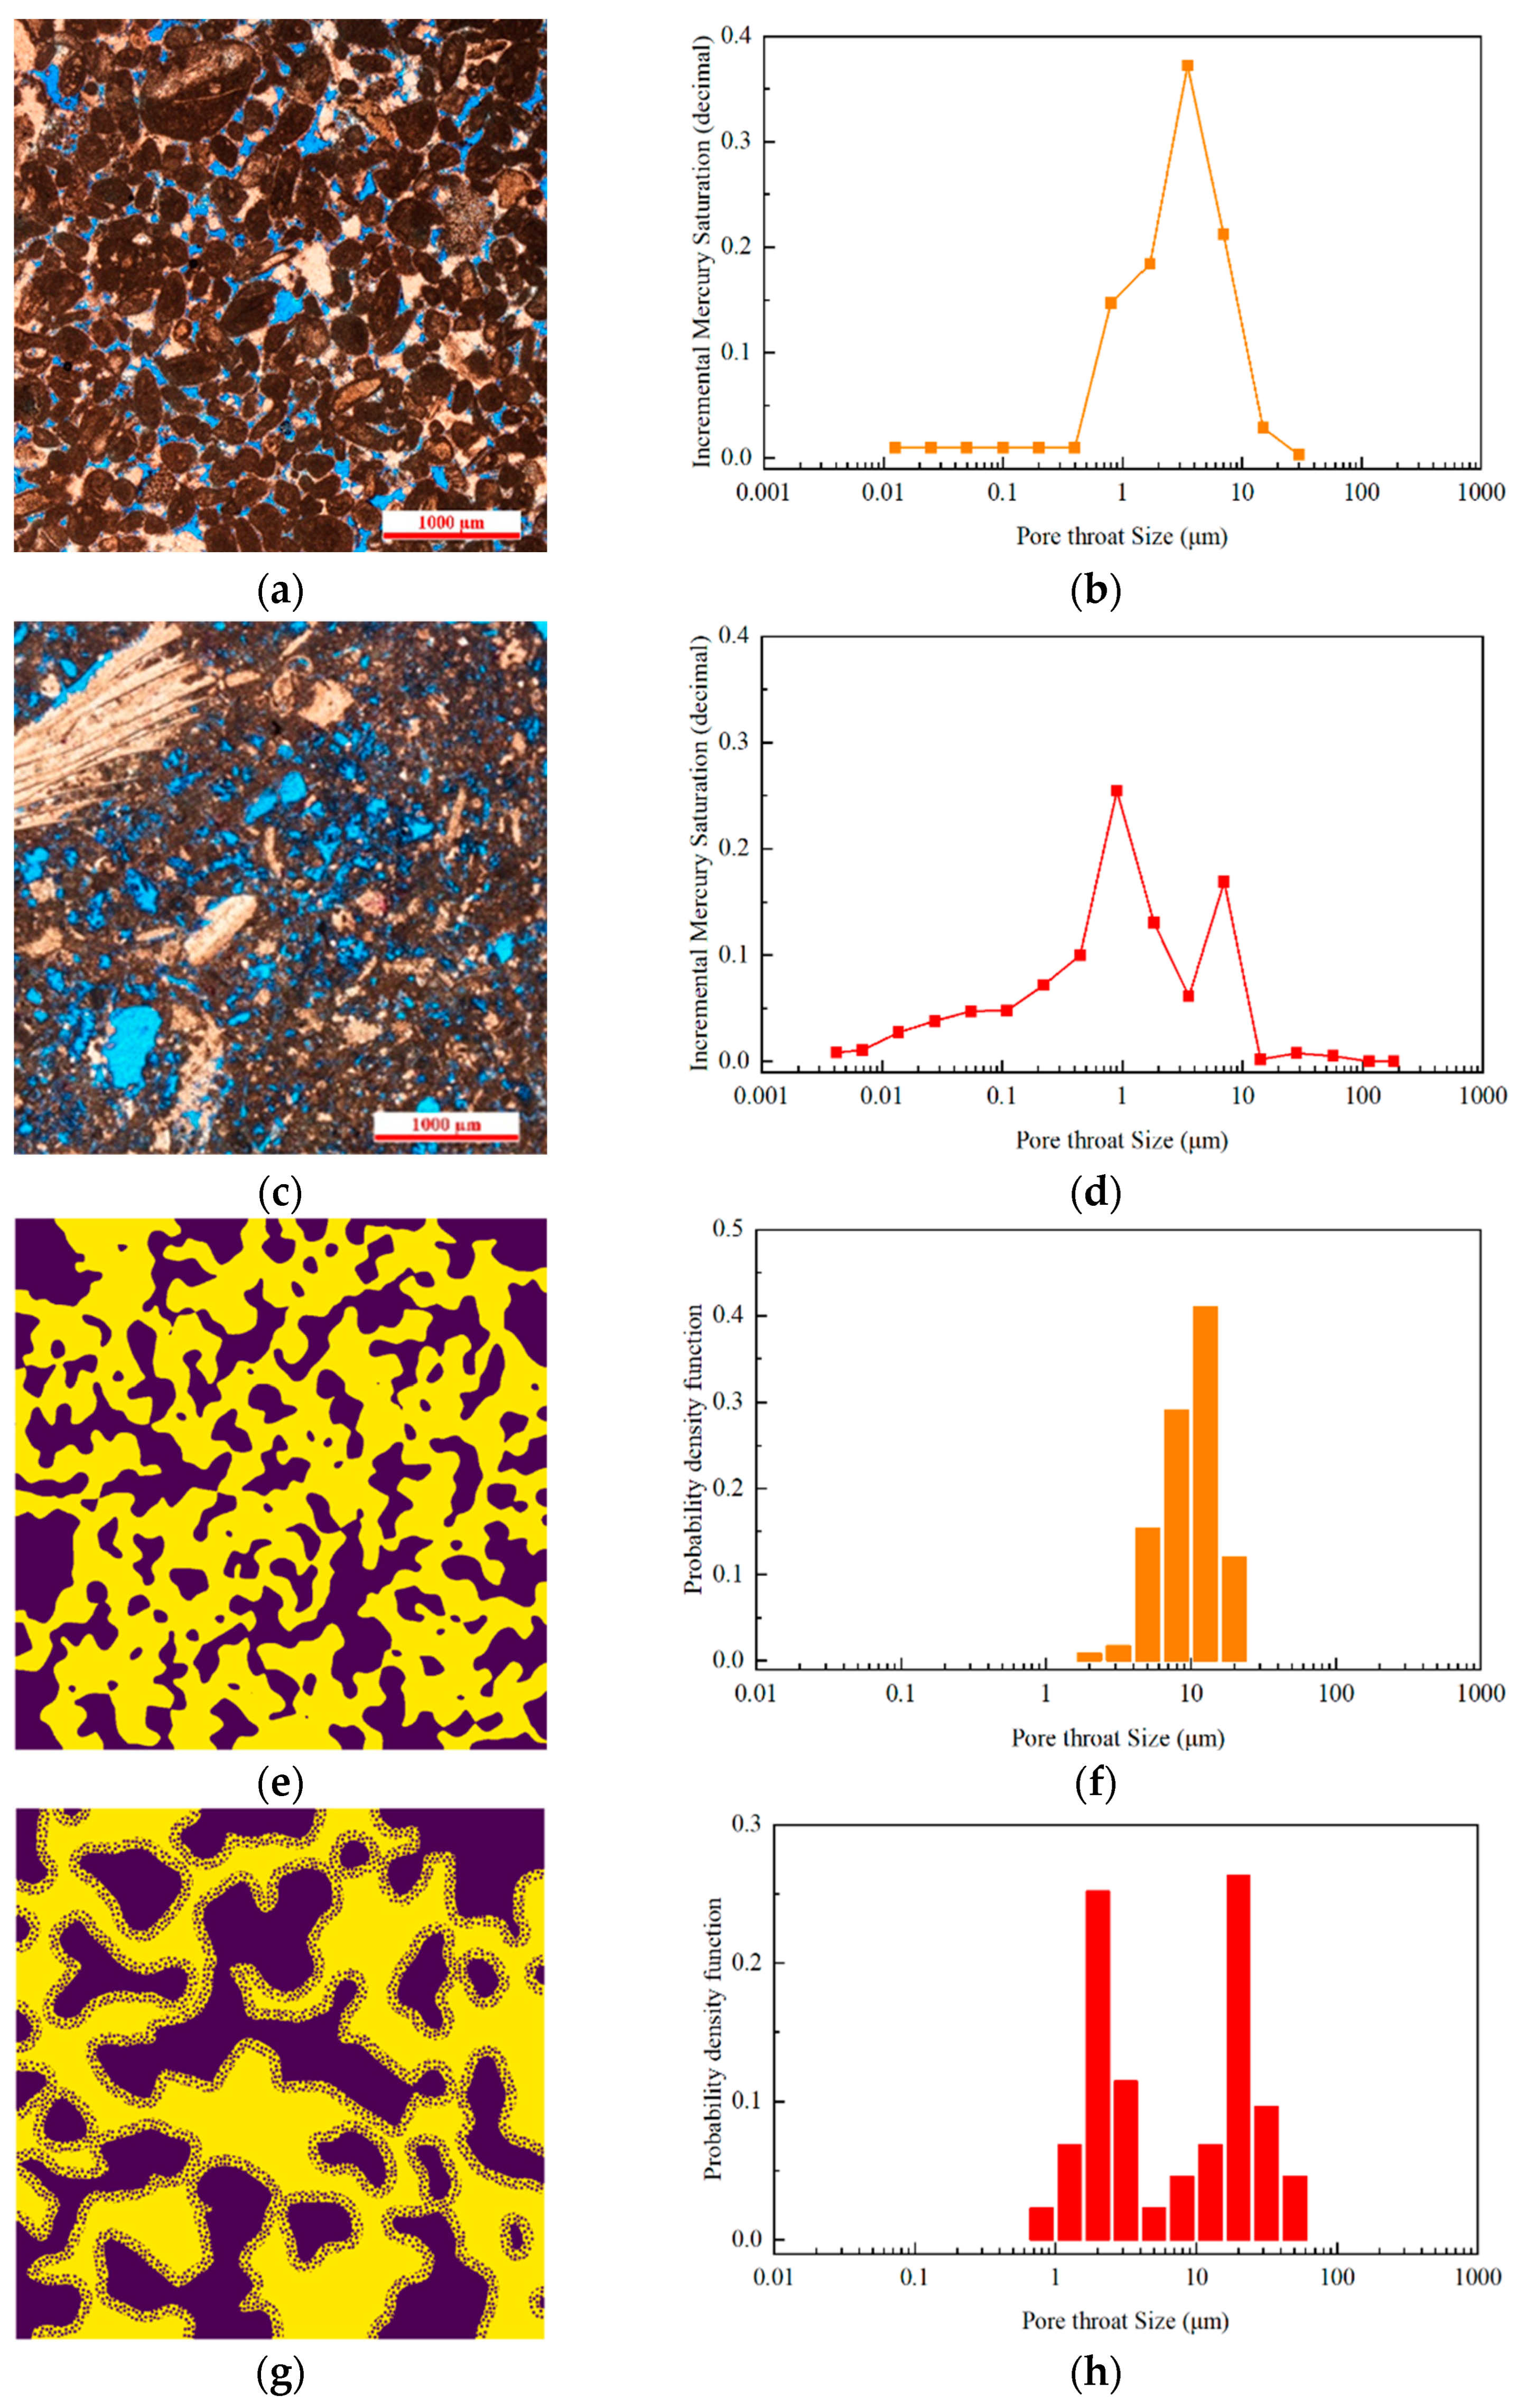
2.1. Porous Medium Generation

Figure 1 illustrates the typical pore structure characteristics of carbonate rocks. Figure 1a,c show thin-section photomicrographs of single-porosity and dual-porosity carbonate rocks, respectively, captured using a Polarized Light Microscope (PLM) (Puxi General Instrument Co., Ltd., Beijing, China). The thin sections were prepared with blue epoxy resin injection and staining to highlight the pore spaces. Both the thin sections and core plugs used for analysis were obtained from a Middle Eastern porous carbonate oilfield. In Figure 1a, single-porosity carbonate rocks exhibit pores in blue, grains in light brown, and non-permeable organic matter in black. In contrast, Figure 1c shows the dual-porosity structure, where the grain size ranges from 250 to 500 μm, while micrite measures approximately 4 μm [6], with pores in blue, grains in light brown, and micrite in dark brown. Pore throat size distribution (PTSD) is widely used to differentiate single-porosity and dual-porosity carbonate rocks [44,45,46]. Figure 1b,d present the PTSD obtained from mercury intrusion experiments conducted on core plugs corresponding to the thin sections in Figure 1a,c. These experiments were performed using a PoreMaster PM33-13 automated mercury intrusion instrument (Quantachrome Instruments, FL, USA), revealing the distinctive characteristics of single-porosity and dual-porosity systems. Single-porosity carbonate rocks show a narrower range of pore sizes, whereas dual-porosity carbonate rocks demonstrate a bimodal distribution due to the coexistence of macropores and micropores.
The geometry models of single-porosity and dual-porosity porous media (as shown in Figure 1e,g) were generated using the PoreSpy library in the Python programming environment (version 3.11) [47]. Macropores were created using random noise combined with Gaussian blur normalization, while micropores were generated through a random sequential addition approach [48]. The single-porosity porous medium, with dimensions of 1000 μm × 1000 μm, exhibits a porosity of 0.547 and a permeability of 434 mD. For the dual-porosity medium, due to significant particle size variation, the model dimensions were expanded to 1200 μm × 1200 μm. The dual-porosity medium has a porosity of 0.535, including 0.107 microporosity, and a permeability of 483 mD. The PTSD of the reconstructed porous media shown in Figure 1f,h was generated using the pore network model method, aligning closely with the characteristic patterns observed in natural carbonate rocks.

2.2. Lattice Boltzmann Method

The color-gradient model developed by Liu et al. [49] is employed to simulate immiscible two-phase flow in porous media. In contrast to the Bhatnagar–Gross–Krook (BGK) approximation, the multiple-relaxation-time (MRT) scheme is adopted due to its advantages in improving numerical stability and reducing spurious velocities at phase interfaces. The total distribution function is defined as the sum of the distribution functions of the two colored fluids, each undergoing collision and streaming at every time step, as expressed in Equation (1):
f i k ( x + e i δ t , t + δ t ) f i k ( x , t ) = Ω i k ( x , t )
where f i k ( x , t ) represents the distribution function at position x and time t in the i th velocity direction, ei is the lattice velocity in the i th velocity direction, δt is the time step, the superscript k (k = R or B) denotes the red or blue phase, and Ω i k ( x , t ) is the collision operator.
The collision operator used in the MRT algorithm consists of the following three sub-operators:
Ω i k = ( Ω i k ) ( 3 ) [ ( Ω i k ) ( 1 ) + ( Ω i k ) ( 2 ) ]
where ( Ω i k ) ( 1 ) is the single-phase MRT collision operator:
( Ω i k ) ( 1 ) = M 1 S M i j ( f j k f j k , e q ) + Φ i
where M is a transformation matrix, S is a diagonal relation matrix, and f i k , e q is the equilibrium distribution function of f i k , commonly expressed as
f i k , e q = ρ k w i [ 1 + ( 3 e i u c 2 ) + 9 2 ( e i u c 4 ) 2 3 2 ( u c ) 2 ]
where wi is the weight factor. For the D2Q9 model, u is the local fluid velocity, c = 1.0 is the lattice speed, and the lattice velocity e i is defined as e 0 = ( 0 , 0 ) , e 1 , 3 = ± c , 0 , e 2 , 4 = 0 , ± c , e 5 , 7 = ± c , ± c , and e 6 , 8 = c , c . In addition, an extra term Φi is introduced to represent the effect of body force G.
( Ω i k ) ( 2 ) is the perturbation operator which generates interfacial tension:
( Ω i k ) ( 2 ) = A k 2 ρ N w i ( e i ρ N ) 2 ρ N 2 B i
where ρN is the phase field function and is defined as ρ N ( x , t ) = ρ R ( x , t ) ρ B ( x , t ) ρ R ( x , t ) + ρ B ( x , t ) , and Bi is a parameter defined as B 0 = χ 3 χ + 6 c 2 ,   B 1 4 = χ 6 χ + 12 c 2 ,   B 5 8 = 1 6 χ + 12 c 2 , where χ is a free parameter taken as 4 in this study. In addition, interfacial tension (σ) can be expressed as
σ = 2 9 A τ c 4 δ t
where A = k A k , Ak is the fraction of interfacial tension contributed by fluid k.
( Ω i k ) ( 3 ) is the recoloring operator that mimics the phase segregation and maintains the phase interface:
( Ω i R ) ( 3 ) ( f i R ) = ρ R ρ f i * + β ρ R ρ B ρ w i cos ( φ i ) ( Ω i B ) ( 3 ) ( f i B ) = ρ B ρ f i * β ρ B ρ R ρ w i cos ( φ i )
where f i * is the post-perturbation value of the total distribution function; β is the segregation parameter and is fixed at 0.7 to maintain a relatively thin interface; φi is the angle between the phase field gradient ∇ρN and the lattice vector ei.
The macroscopic density and velocity fields are derived from the mass and momentum conservation equations for each fluid.
ρ k = i f i k
ρ u = k i f i k e i
where ρk is the density of fluid k, and ρ is the total density of R and B fluids.
Using Chapman–Enskog analysis, the pressure is calculated as p = 1 3 ρ c 2 , and the dynamic viscosity is expressed as η = 1 3 ρ c 2 ( τ 1 2 ) δ t . A harmonic mean is applied to account for the disparity in viscosity ratios between R and B fluids.
1 η = 1 + ρ N 2 η R + 1 ρ N 2 η B
where ηk (k = R or B) is the dynamic viscosity of fluid k.
To minimize discretization errors, the local gradients of the phase field are computed using a 9-point finite difference scheme, as described below:
ρ N ( x ) χ α = 3 c 2 i w i ρ N ( x + e i δ t ) e i α
The virtual density scheme is employed to model the contact angle at the solid wall, where different contact angles are achieved by adjusting the phase field at the solid wall.
In this study, the densities of oil and water are assumed to be equal, which is reasonable as the effect of gravity at the pore scale is negligible compared to capillary and viscous forces. The viscosities of water and oil, represented by μw and μo, are 0.5 cp and 1.5 cp, respectively, yielding a viscosity ratio of M = μo/μw =3. The conversion between lattice units and physical units is provided in Table 1.

2.3. Simulation Set-Up

Table 2 presents a summary of the initial and boundary conditions for the simulations. The initial fluid distribution in carbonate reservoirs is significantly influenced by pore structure and wettability. Therefore, differences in the initial oil/water distribution are incorporated into models with varying pore structures and wettability, as illustrated in Figure 2. The initial water saturations under water-wet conditions are 0.13 and 0.3 for single-porosity and dual-porosity porous media, respectively (Figure 2a,c), which are consistent with experimental observations. Under non-water-wet conditions, the initial fluid in both single-porosity and dual-porosity porous media is oil (Figure 2b,d). When applying the LBM to simulate flow in porous media, the fundamental variable is the particle distribution function. Macroscopic fluid properties, such as velocity and pressure, need to be refined into microscopic particle distributions, and the same applies to boundary conditions. For both single-porosity and dual-porosity porous media, a halfway bounce-back boundary (no-slip solid boundary condition) is applied to the solid walls and the left and right sides of the domain. The inlet constant velocity boundary at the top and the outlet fixed pressure boundary at the bottom are handled using the non-equilibrium bounce-back scheme proposed by Zou and He [50]. It is worth mentioning that the LBM numerical model used in this study was independently compiled by our team in a Python programming environment (version 3.11) and does not rely on any commercial numerical simulation software.
During the waterflooding process, the capillary number (Ca), a dimensionless parameter, significantly influences fluid distribution and oil displacement efficiency (Ro), representing the ratio of viscous forces to capillary forces. It can be expressed as Ca = μwνwow, where μw denotes the dynamic viscosity of water, vw is the water injection velocity, and σow is the interfacial tension between oil and water. Previous studies have shown that as the capillary number increases, the oil displacement efficiency generally improves [51,52]. However, these observations are valid only for waterflooding reservoirs with a uniform pore structure, similar wettability, and viscosity ratios. In this study, 78 sets of forced imbibition simulations were performed to investigate the oil/water two-phase forced imbibition mechanisms in dual-porosity and single-porosity carbonate rocks. Detailed simulation parameters are provided in Table 3.

3. Results and Discussion

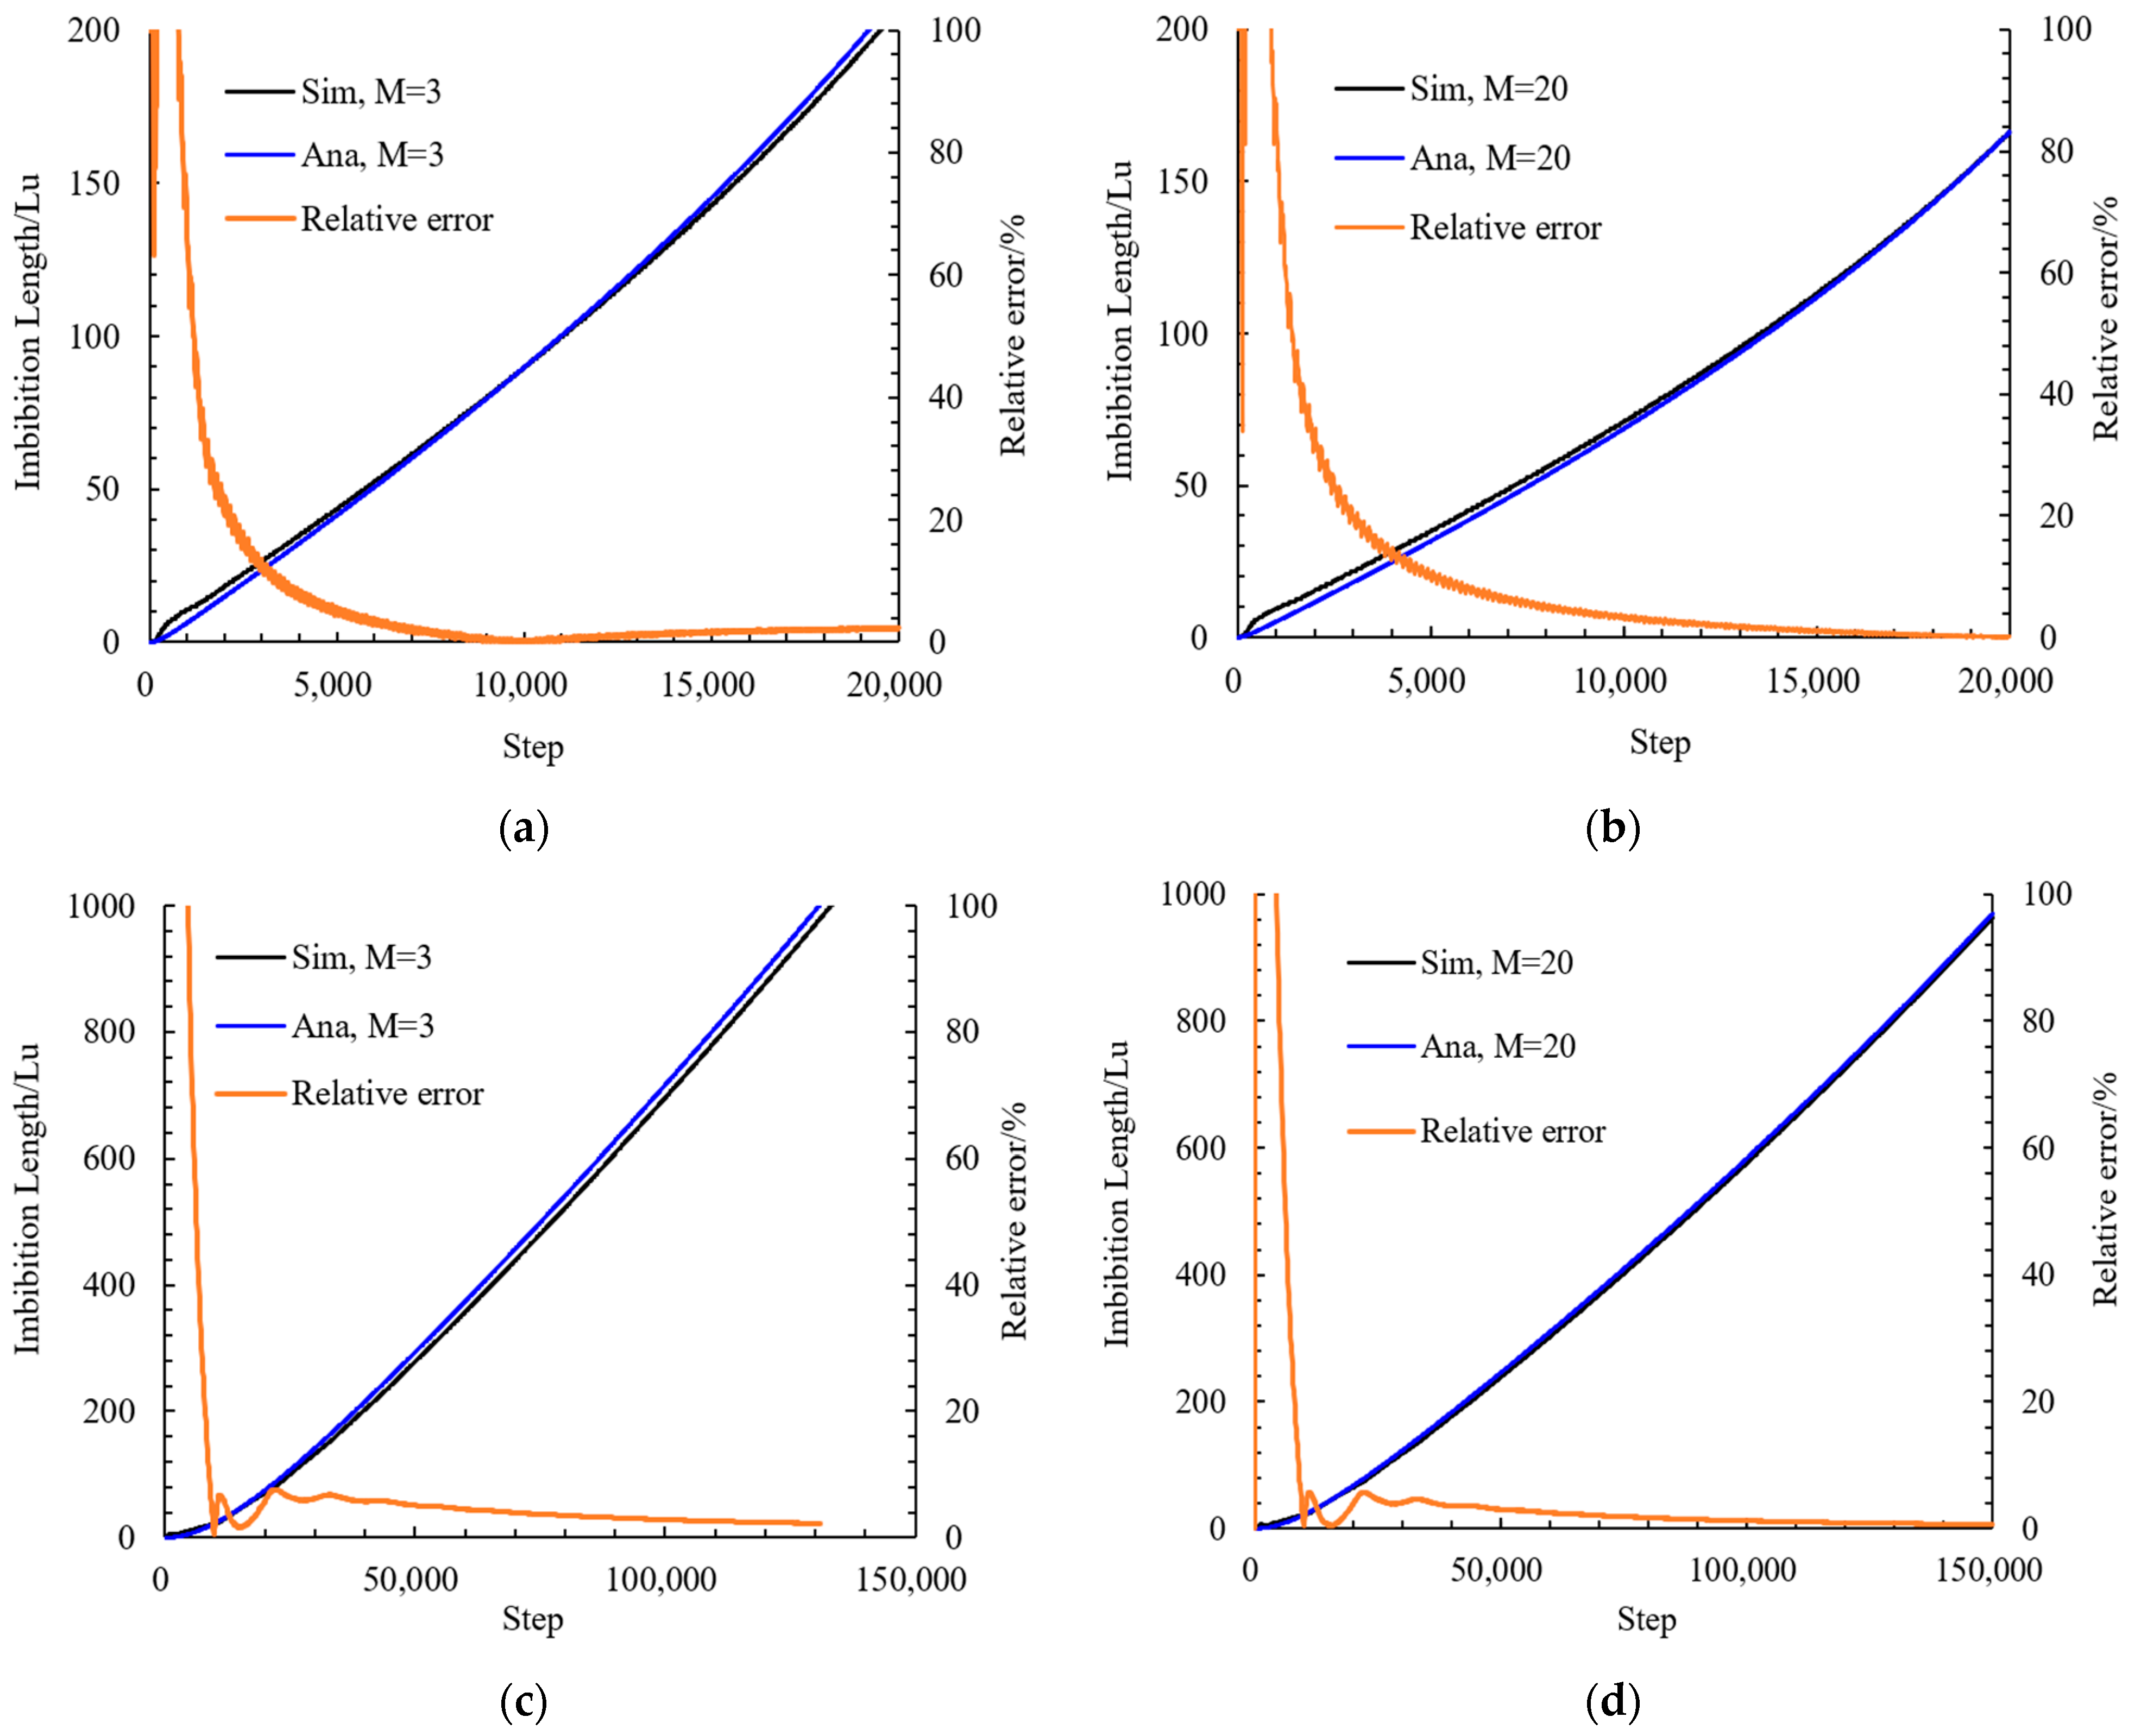
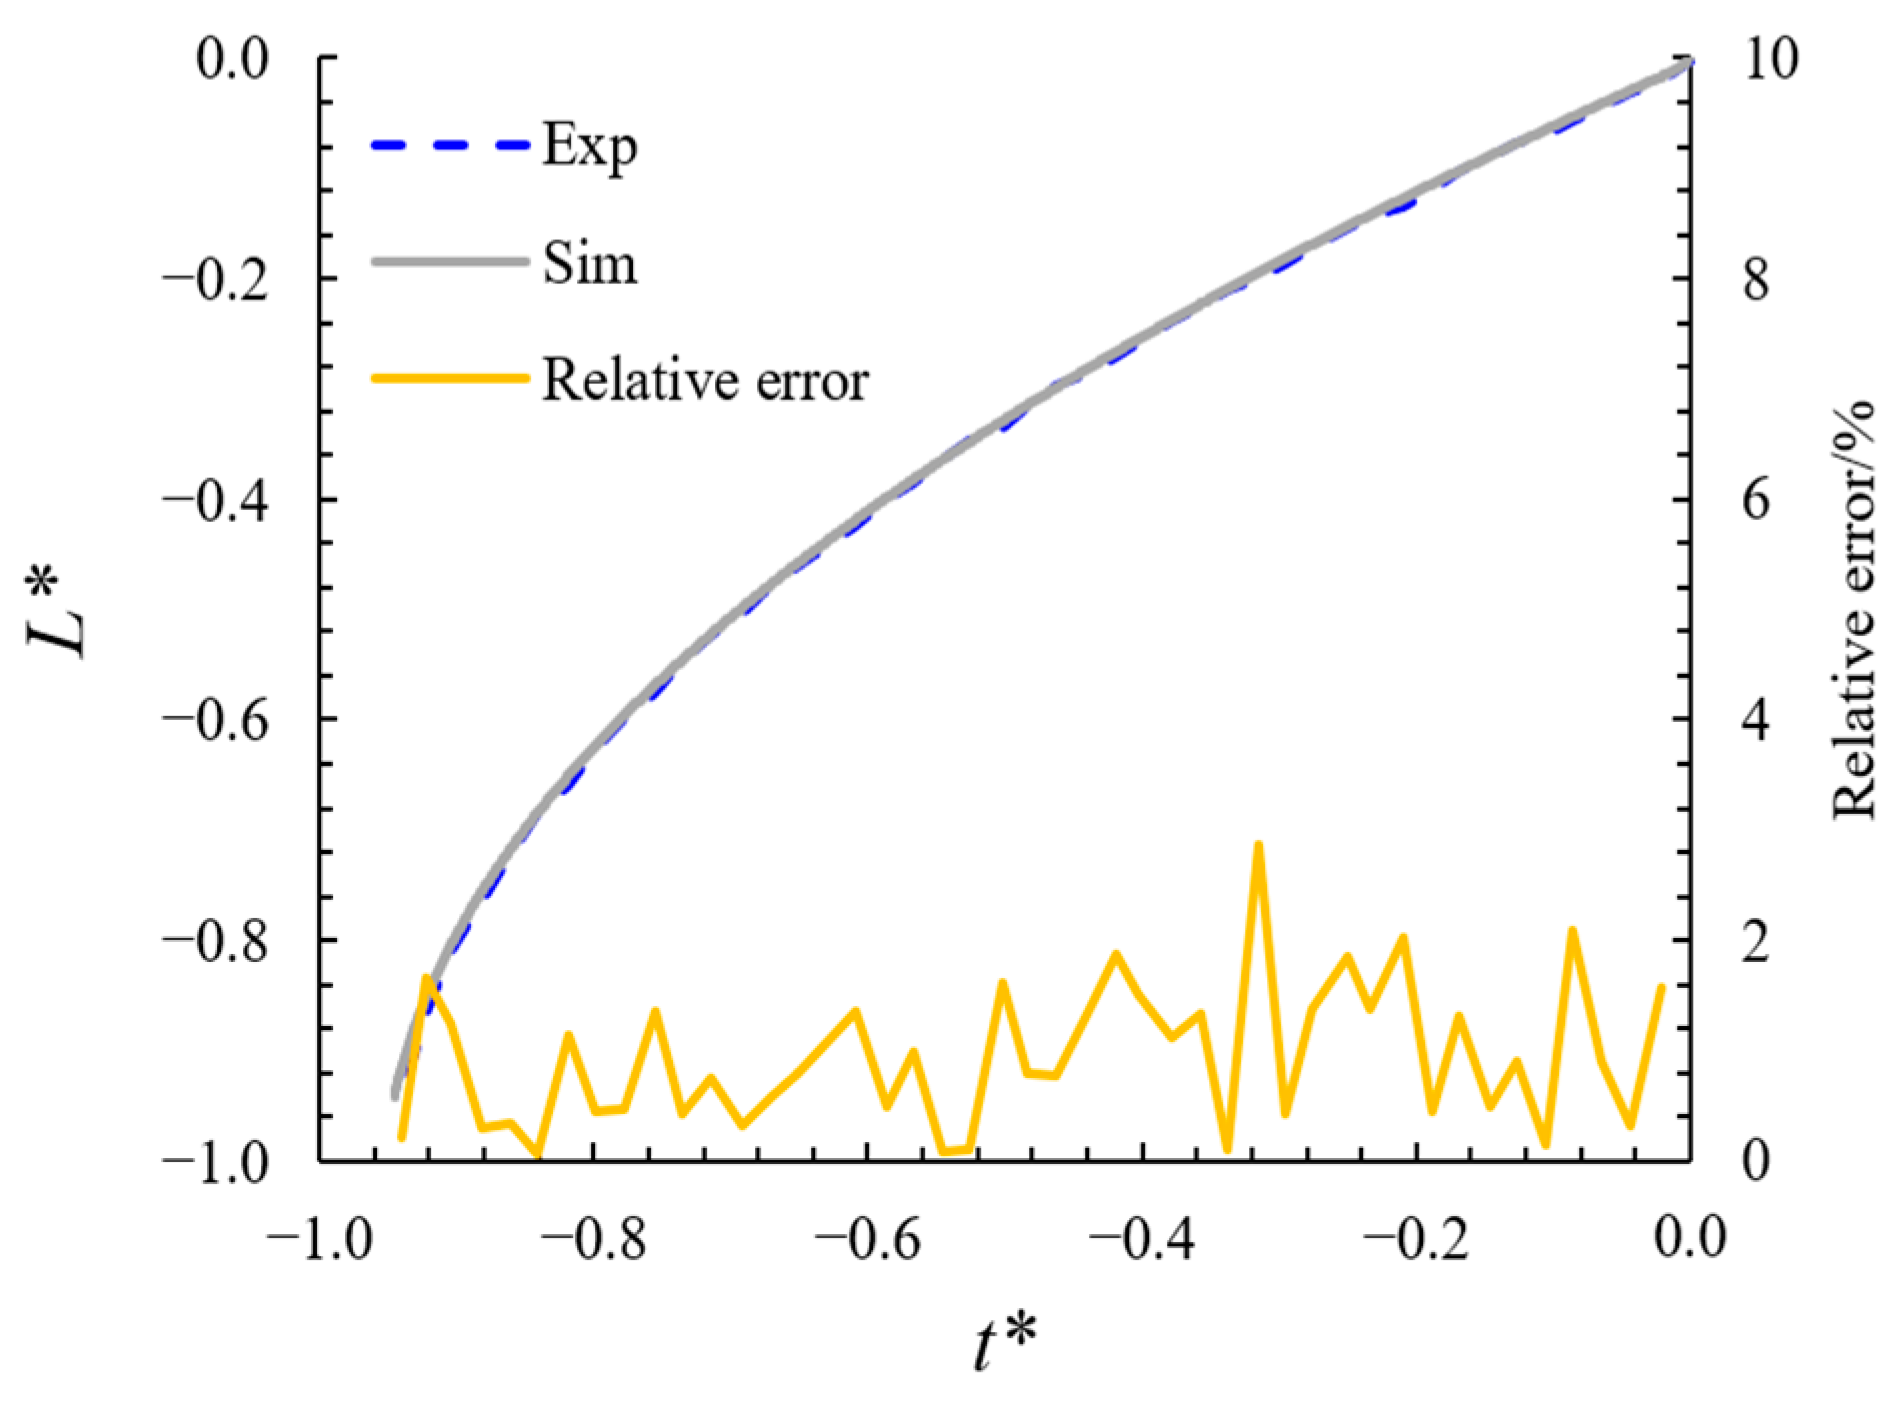
3.1. Model Validation

To assess the reliability of the proposed model in simulating two-phase flow within a dual-porosity porous medium, capillary intrusion simulations with various pore diameters were first conducted and compared with analytical solutions. In addition, the LBM used in this study was further validated by previous spontaneous imbibition experimental data. Derived from the foundational work of Washburn [53], capillary intrusion serves as a standard benchmark for evaluating the capability of multiphase models to simulate interfacial flow. As depicted in Figure 3, the velocity of a wetting fluid advancing into a horizontal capillary is governed by the balance among the interfacial pressure difference, capillary pressure, inertial forces, and the viscous resistance of the fluid.
The effect of gravity is neglected, and the force equilibrium is expressed as [54]
2 σ cos θ d 12 d 2 [ μ R l + ( L l ) μ B ] d l d t L d l 2 d 2 t = 0
where σ is the interfacial tension, θ is the contact angle, d is the width of the capillary tube, μB and μR denote the dynamic viscosities of the blue (non-wetting) and red (wetting) phases, respectively, x is the position of the interface, and L is the length of the capillary tube. The simulation system consists of a two-dimension lattice domain. Outside the capillary region, periodic boundary conditions are applied in both the x and y directions. The capillary boundaries are subject to halfway bounce-back boundary, and the capillary length is set to L = 400 or 2000 lattices. Simulations were conducted with σ = 0.1, ρB = ρR = 1, d = 10 or 100, and M = 3 or 20. Figure 4 presents a comparison between the simulation results and the predictions from Equation (12), along with the relative error between them. The relative error is larger during the early time steps, which is attributed to the very small imbibition length at the beginning. However, the validity of the model is not solely dependent on the initial error but rather on the overall error behavior throughout the entire simulation. Despite the larger relative error at the initial stages, the error decreases rapidly and stabilizes as the simulation progresses. Specifically, once the imbibition length reaches 0.2 L, the relative error remains consistently below 3%. This indicates that the model demonstrates good convergence and reliability under different simulation conditions, showing excellent agreement with theoretical predictions.
Next, the accuracy of the LBM adopted in this study was further validated using physical experimental data. Due to the scarcity of liquid–liquid imbibition experimental data in capillaries, we selected the continuous imbibition experimental data of an ethanol–silicone oil system conducted by Andre et al. [55] as the benchmark for validation. Ethanol and silicone oil were used as the wetting and non-wetting fluids, respectively. Since the experiments were performed in a three-dimensional cylindrical tube, while the simulations in this study are based on a two-dimensional numerical model, dimensionless imbibition length (L*) and dimensionless imbibition time (t*) were adopted to normalize and scale both the experimental and simulation results for easier comparison. Specifically, L* and t* are defined as
L = μ R μ B μ B l ( t ) L t = ( μ R μ B ) σ d cos θ κ μ B 2 L 2 t
where κ is the conversion factor. For a three-dimensional cylindrical tube, κ = 4; for the two-dimensional simulation, κ = 3. To ensure that the simulation conditions are consistent with the experimental set-up, the values of L and d in Figure 3 were set to 300 and 20, respectively (matching the aspect ratio of the experiment), with a viscosity ratio of M = 34 for the two fluids. The contact angle at the wall was set to θ = 45°, and the boundary conditions were the same as those in the analytical solution validation section. Figure 5 presents a comparison between the simulated imbibition process and the experimental results, along with their relative error (all below 3%). It should be noted that, due to the lower viscosity of the wetting fluid compared to the non-wetting fluid, the normalized imbibition length ranges from −1 to 0. Together with Figure 4 and Figure 5, these results demonstrate the accuracy of the LBM model used in this study.

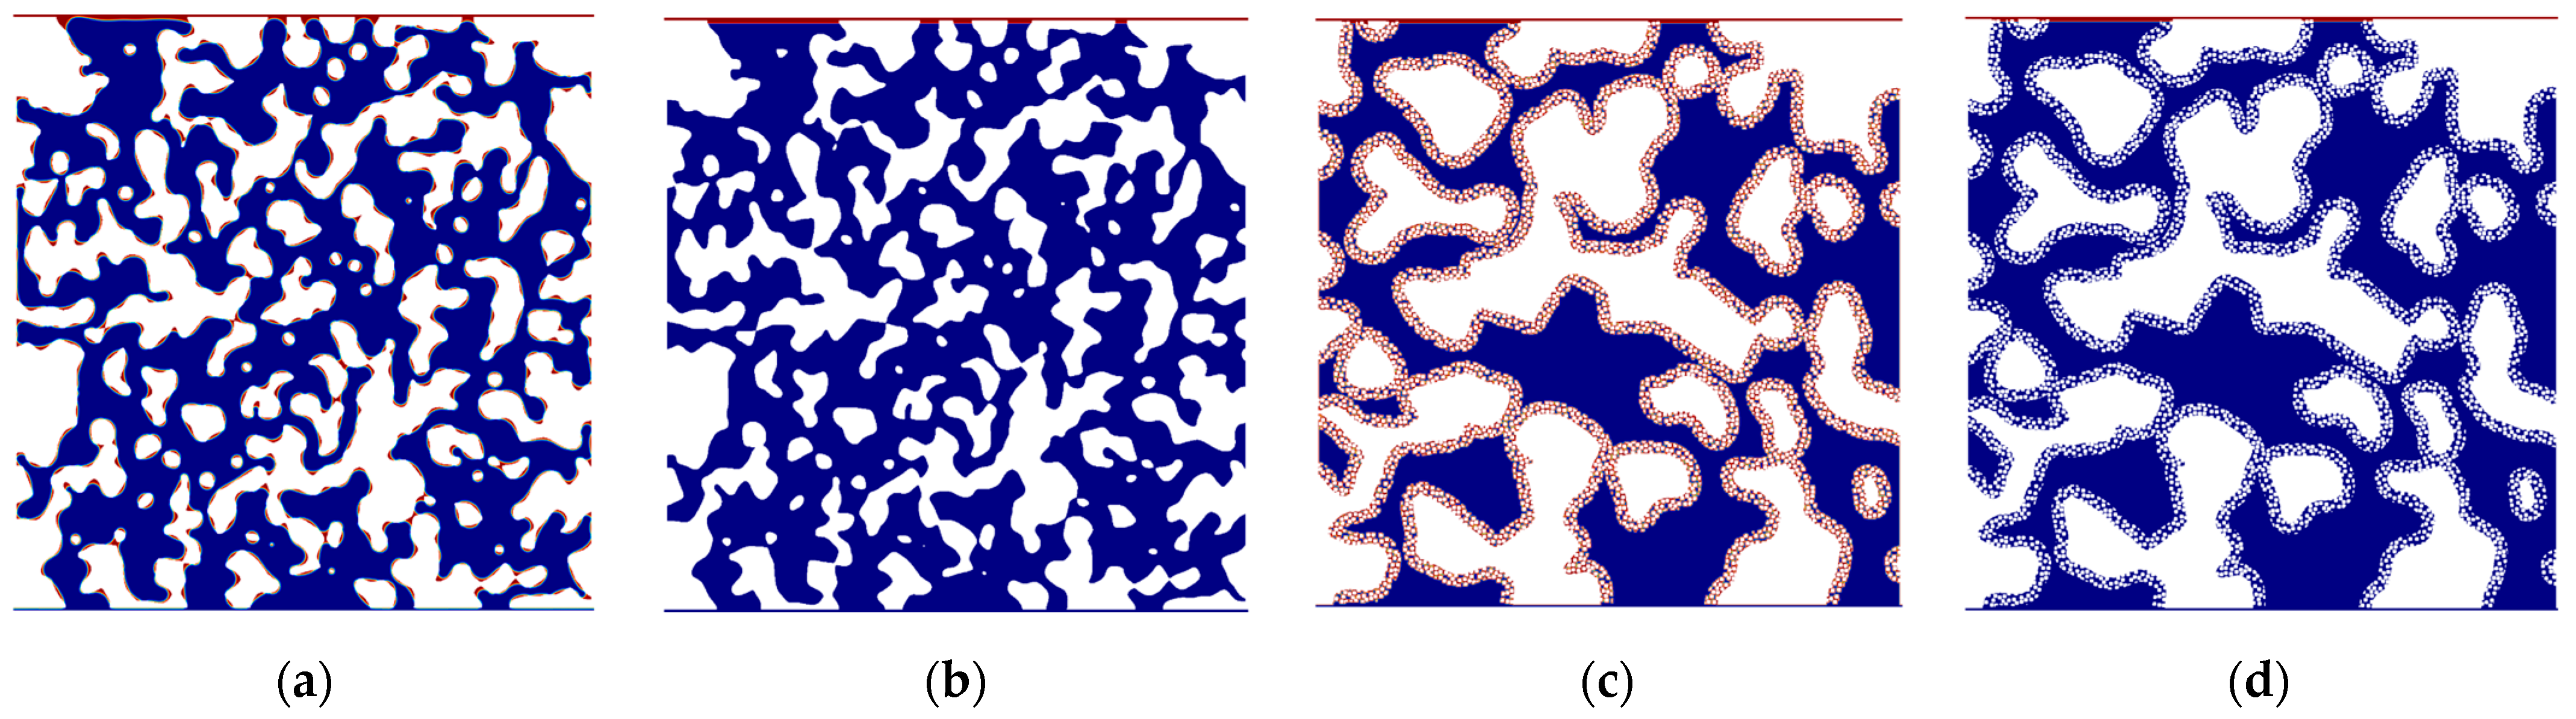
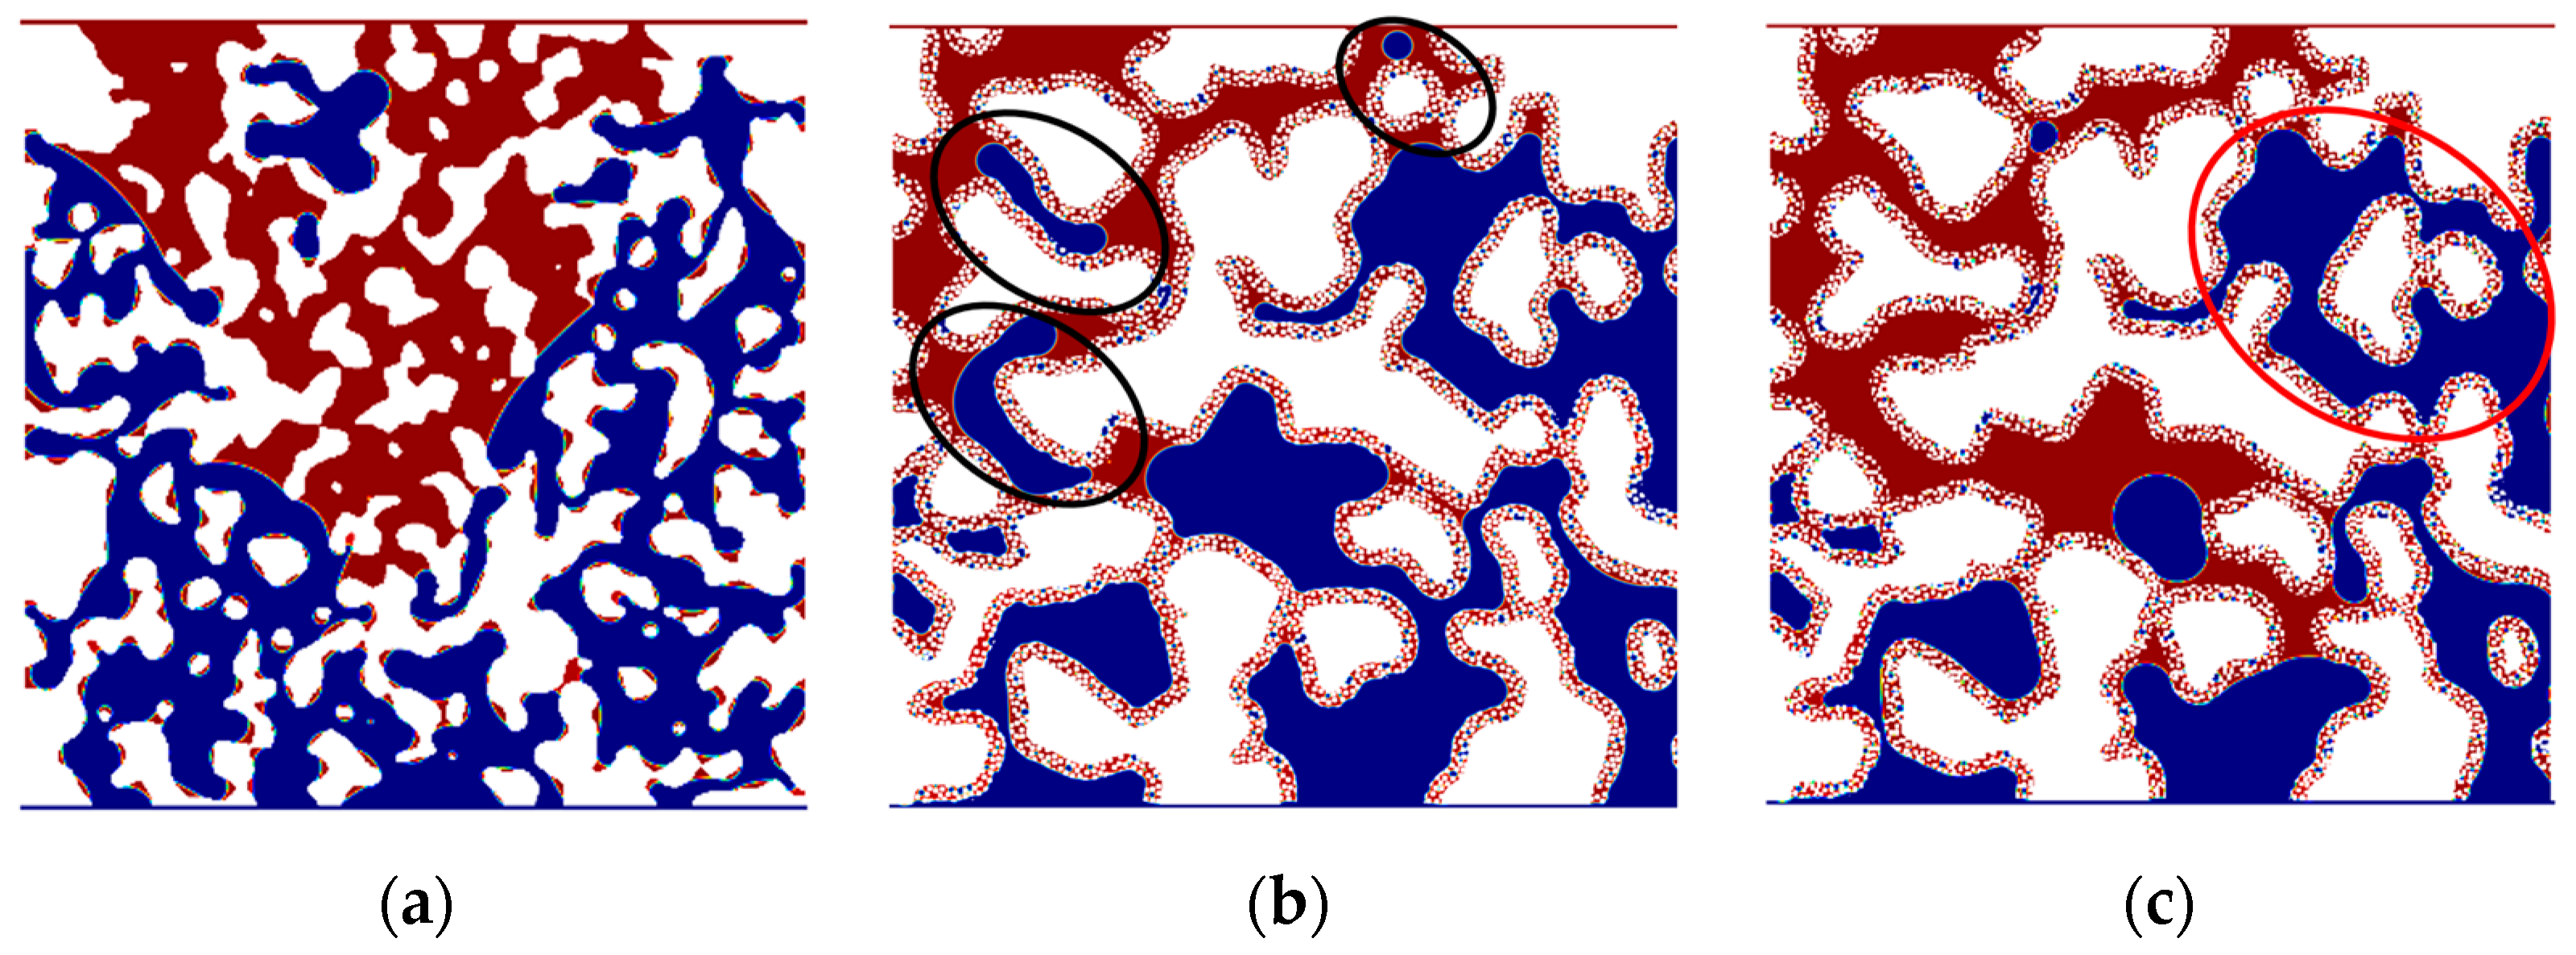
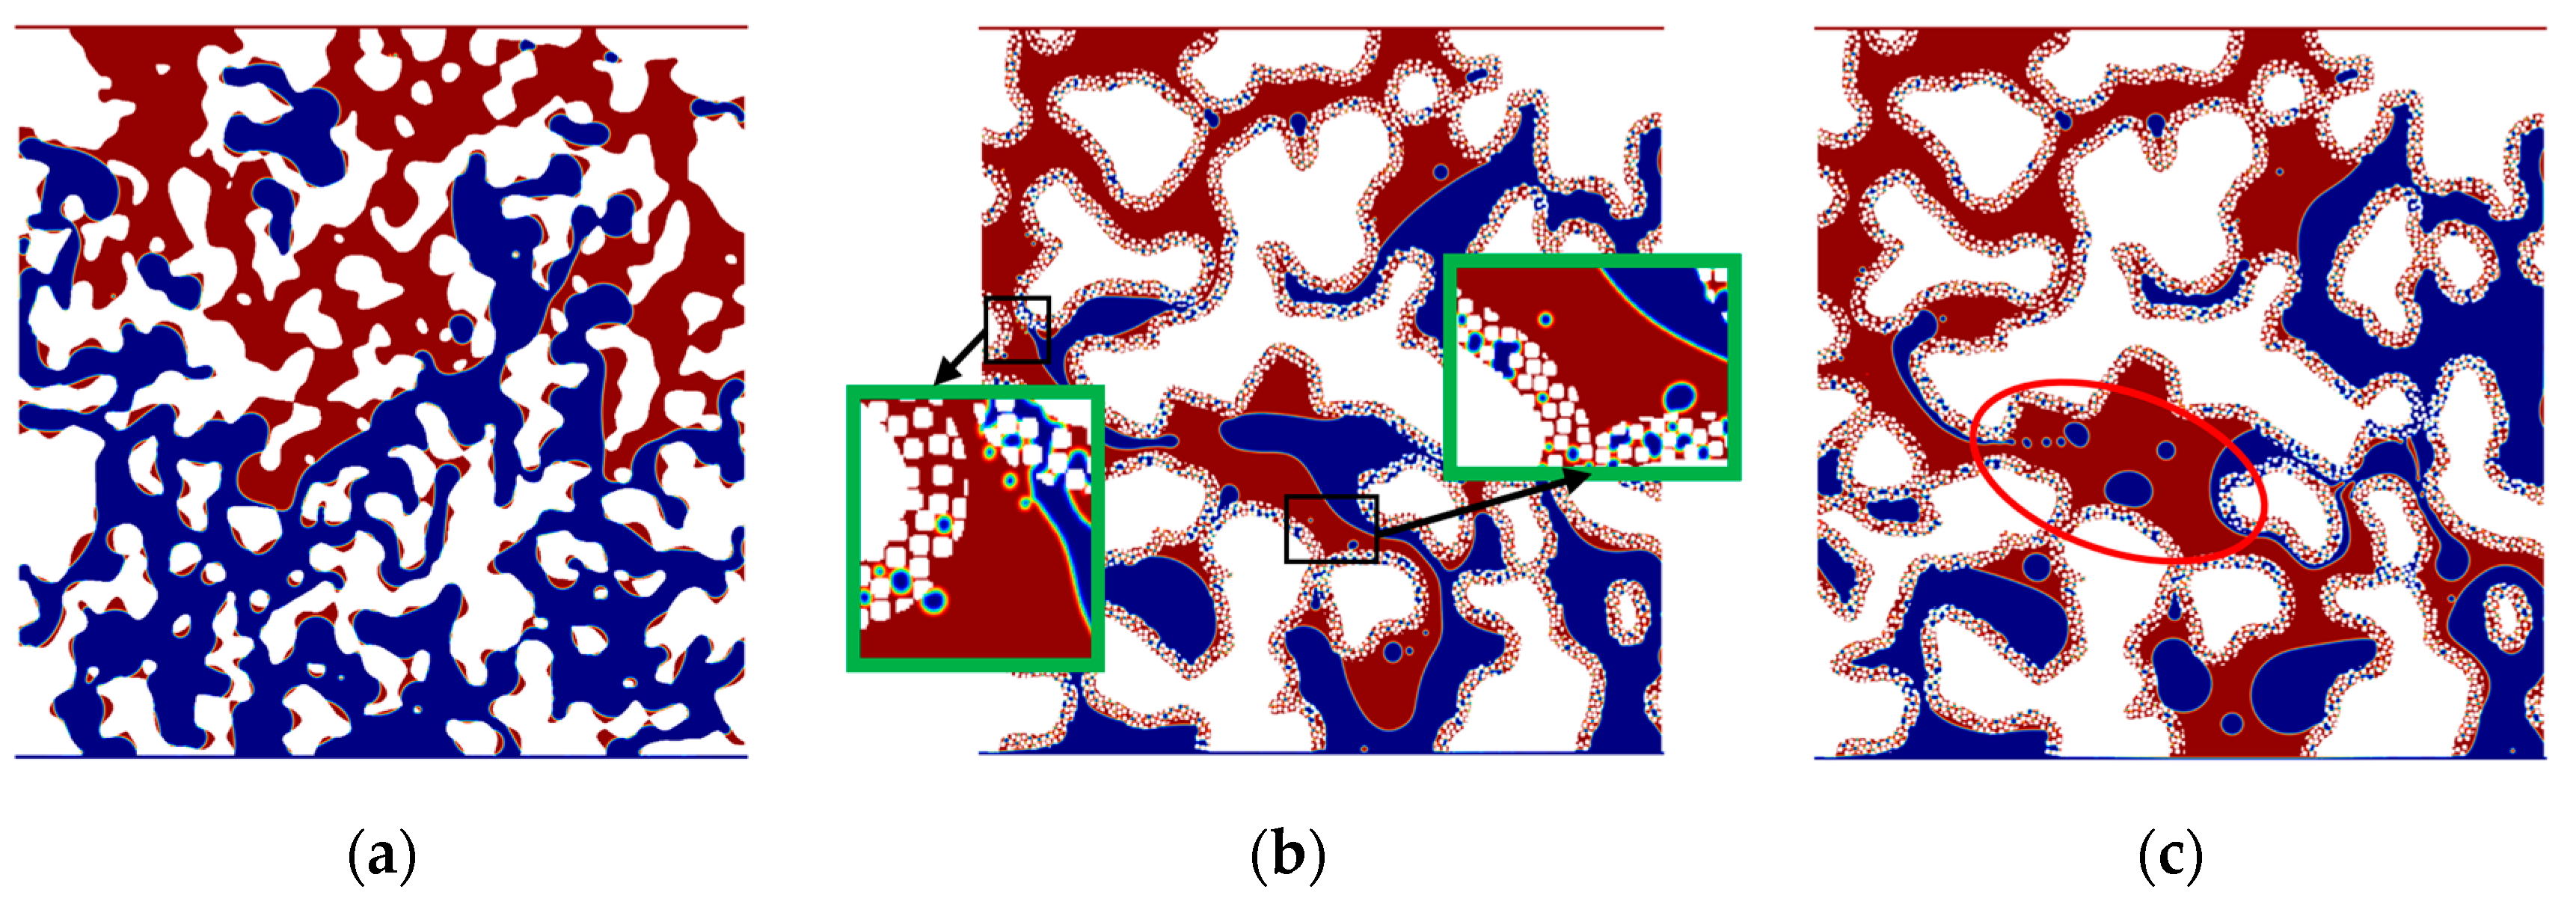
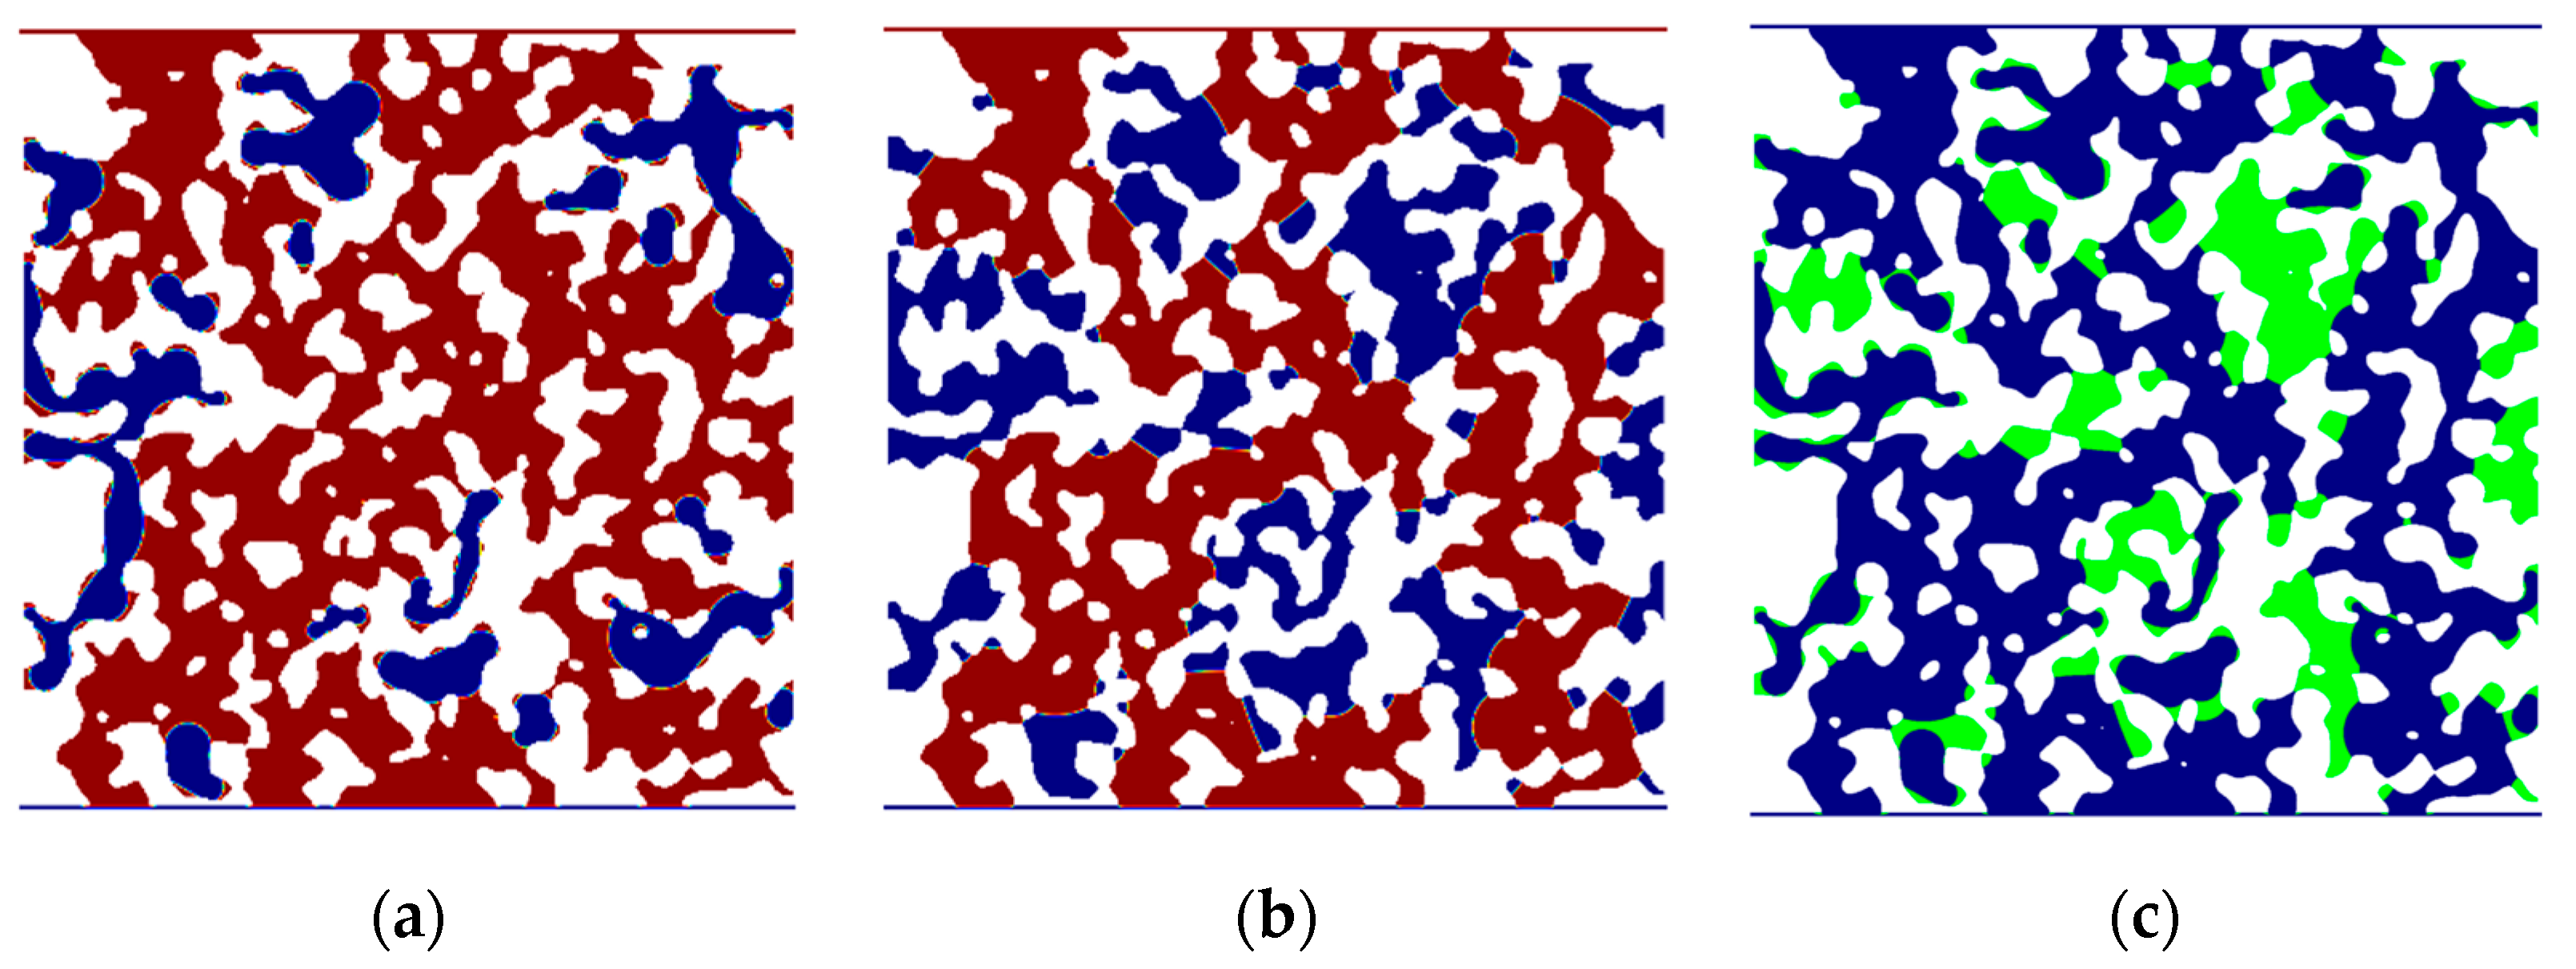
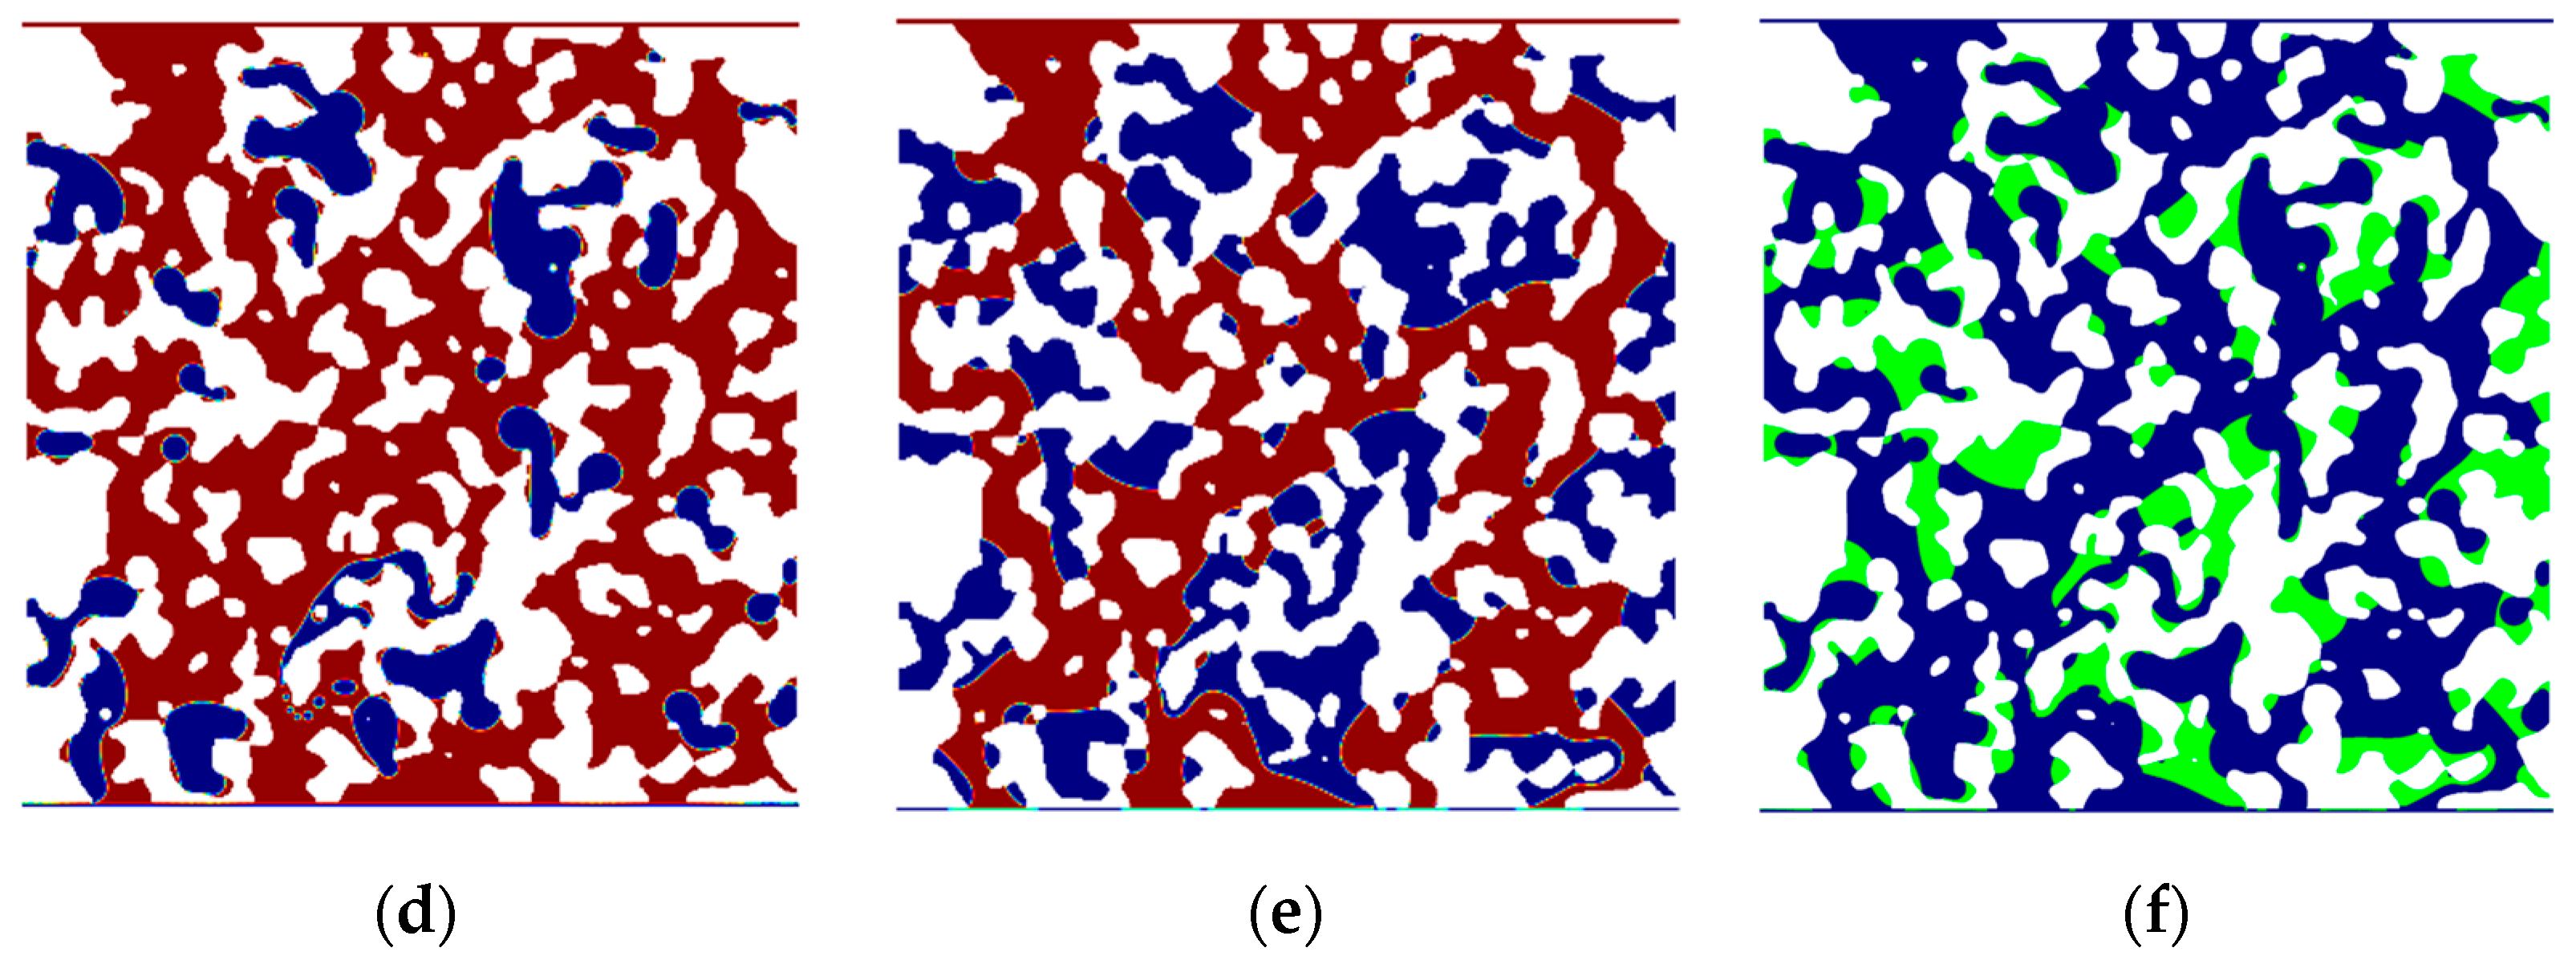
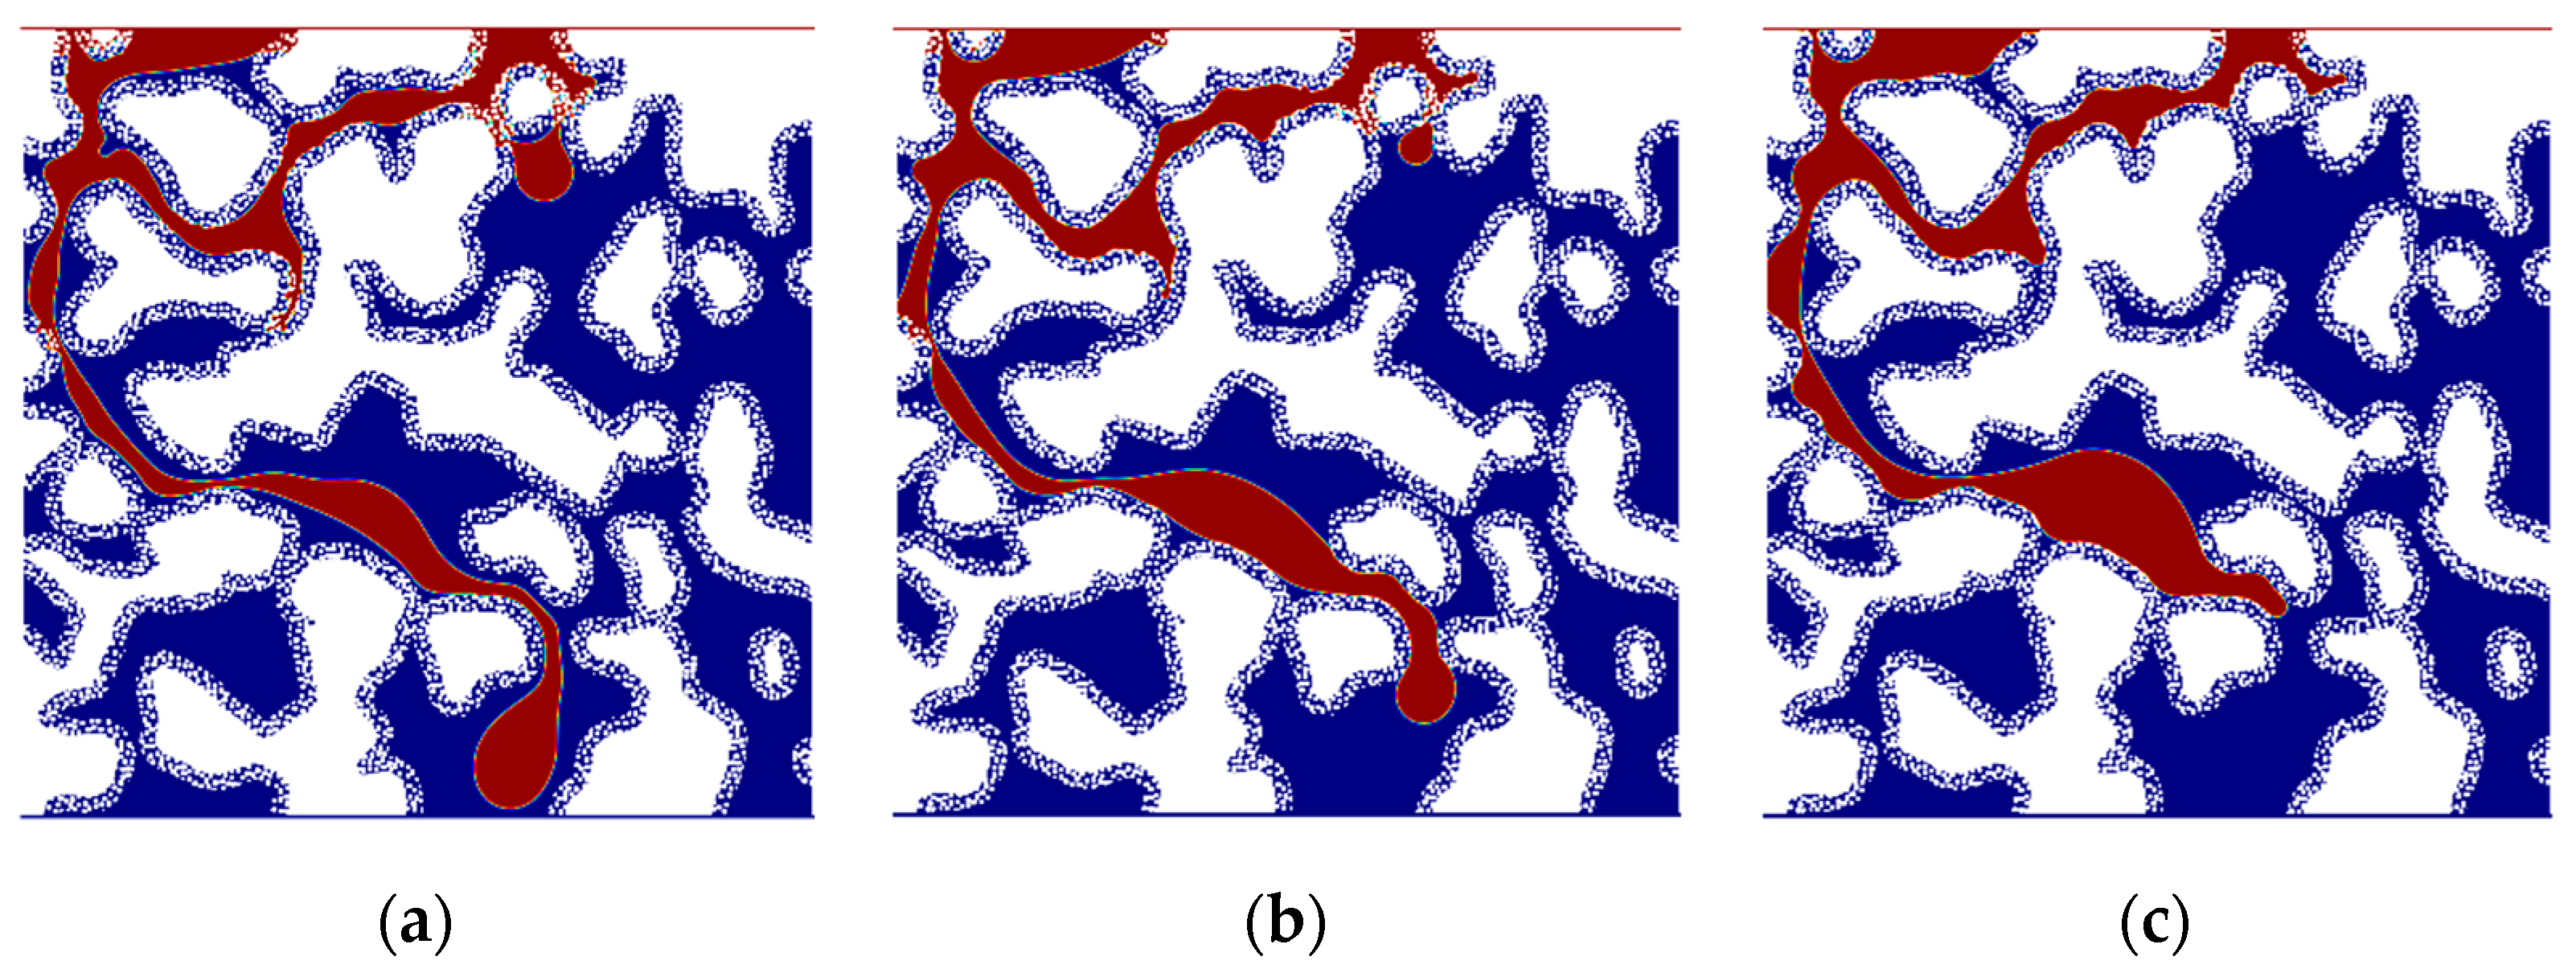
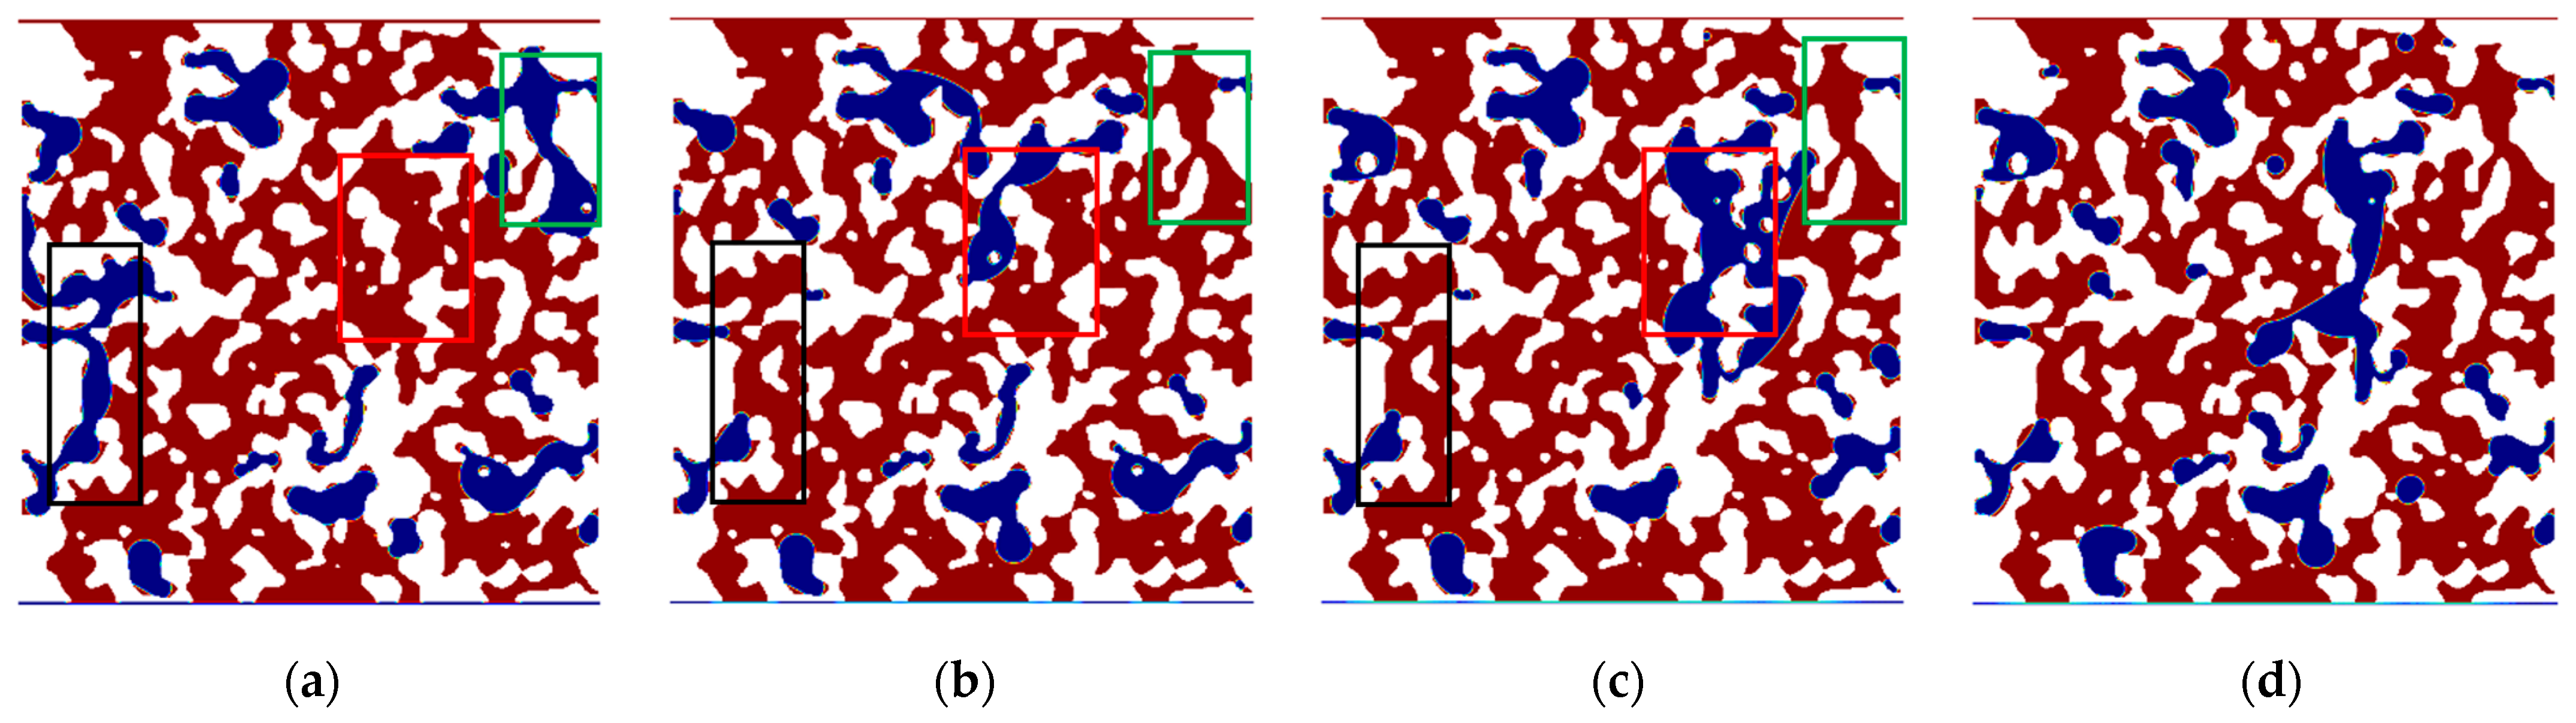
3.2. The Interface Evolution Pattern

In water-wet single-porosity porous media with low Ca, the fluid interface advances in a relatively uniform manner during the forced imbibition process (Figure 6a). At a low Ca, the combined action of water driving forces and capillary forces overcomes flow resistance, leading to capillary fingering predominantly in narrow pore throats. Blind-end pores hinder the stable advancement of the fluid interface, while both the capillary valve effect and cooperative pore filling effect contribute to its stabilization. Notably, due to the uniform size distribution of pore throats, capillary fingering is not prominent in single-porosity porous media. Theoretically, in more heterogeneous single-porosity porous media, capillary fingering might occur at extremely low Ca, resulting in water bypass and the formation of significant residual oil.
In water-wet dual-porosity porous media with low Ca, the inherent dual-porosity structure results in a non-uniform fluid interface advancement pattern. However, the larger specific surface area of micropores increases the initial water saturation compared to single-porosity media, enhancing water mobility within micropores. This, in turn, promotes relatively uniform interface advancement in some local macropores. The non-uniform interface advancement is primarily attributed to the differential blockage of micrite particles along flow paths. Partial blockage of macropore throats by micrite particles slows the interface advancement in macropores of varying sizes, leading to oil entrapment and increasing the likelihood of residual oil formation (Figure 6b). When micrite particles completely block macropore throats, the driving forces at low Ca are insufficient to overcome the flow resistance in narrow micropore throats, resulting in local interface stagnation (Figure 6c).
In water-wet single-porosity porous media under high Ca conditions, viscous fingering is observed, characterized by the preferential displacement of larger pore throats by water phase (Figure 7a). At high Ca, viscous forces dominate over capillary forces, causing some interfaces to transition from concave to convex, thereby altering the apparent wettability. Capillary forces, governed by the dynamic contact angle, resist the advancement of the fluid interface. Concurrently, the capillary valve resistance is higher in smaller pores, leading to a greater disparity in the advancement speed of the fluid interface between smaller and larger pores. This results in a less uniform advancement pattern compared to that observed under low Ca conditions.
Compared to single-porosity porous media, water-wet dual-porosity porous media with high Ca exhibit more pronounced non-uniform interface advancement during forced imbibition. In micropores, a portion of the oil is transferred to macropore throat regions under the influence of imbibition (Figure 7b). Furthermore, the continuous oil phase fragments into discontinuous droplets, which collide with small micrite particles, creating more unstable fluid interfaces (Figure 7c). These mechanisms, on the one hand, promote the transport of fragmented oil droplets through smaller macropore throats. On the other hand, small oil droplets undergo repeated coalescence and fragmentation. When smaller droplets coalesce with larger isolated oil droplets, their flow resistance increases, resulting in higher residual oil saturation.
In both single-porosity and dual-porosity porous media under neutral wetting conditions, capillary forces primarily act as resistance due to capillary valve effects and the impact of injection velocity. This resistance becomes even more pronounced under oil-wet conditions. Compared to water-wet systems (Figure 8a,d), the interfacial advancement in non-water-wet single-porosity media differs significantly, making it challenging to displace oil in regions with smaller pore throats (Figure 8b,e). Furthermore, through image analysis, we obtained the distribution of residual oil that is displaced in water-wet single-porosity porous media but remains trapped in oil-wet single-porosity porous media (Figure 8c,f). The results indicate that the differential residual oil is primarily located in the pore regions connected to smaller pore throats and at pore corners. Additionally, under high-Ca conditions, the differential residual oil is more widely scattered compared to low-Ca conditions. This is due to the relatively increased viscous forces, which allow water to break through a few more pore throats under oil-wet conditions, while restricting the filling of pore blind ends. When capillary forces are dominant, the fluid interface exhibits a marked tendency to contract spontaneously, minimizing the total fluid interface area [56]. Water flowing through narrow pore throats tends to fill the larger pore bodies entirely. In dual-porosity media, the more complex geometry of macropores enhances this mechanism, facilitating the displacement of oil trapped in the corners of macropores (Figure 9). When viscous forces dominate, the fluid interface can break through a greater number of small pore throats in single-porosity media and micropore throats in dual-porosity media, allowing water to access a larger number of pore body regions. However, the pore-filling trend driven by capillary forces diminishes under these conditions.
Overall, the mechanisms driving the formation of residual oil differ between single-porosity and dual-porosity porous media under varying Ca and wettability conditions. Additionally, diverse interfacial evolution patterns significantly influence Ro. A detailed analysis of the variation in Ro with Ca and wettability in both types of porous media is presented below.

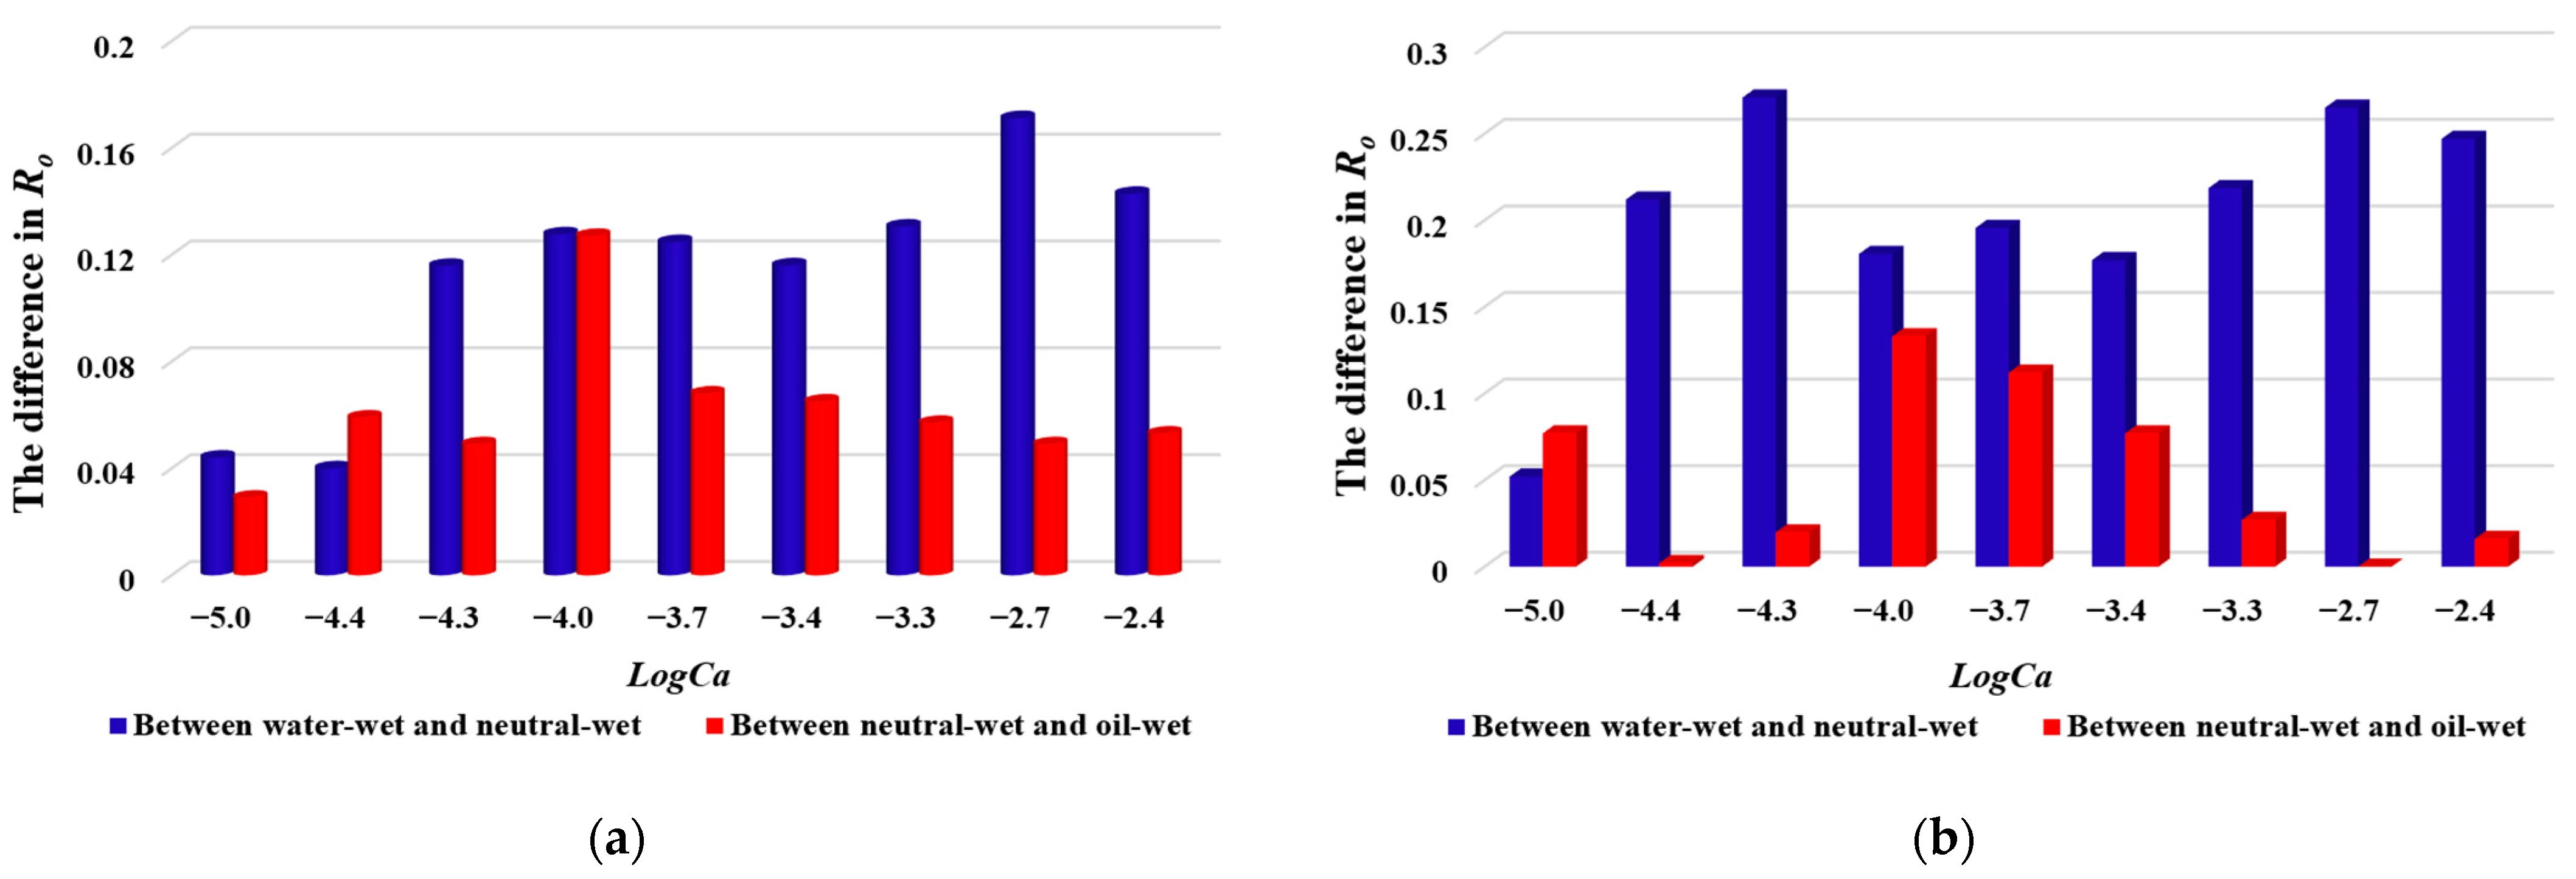
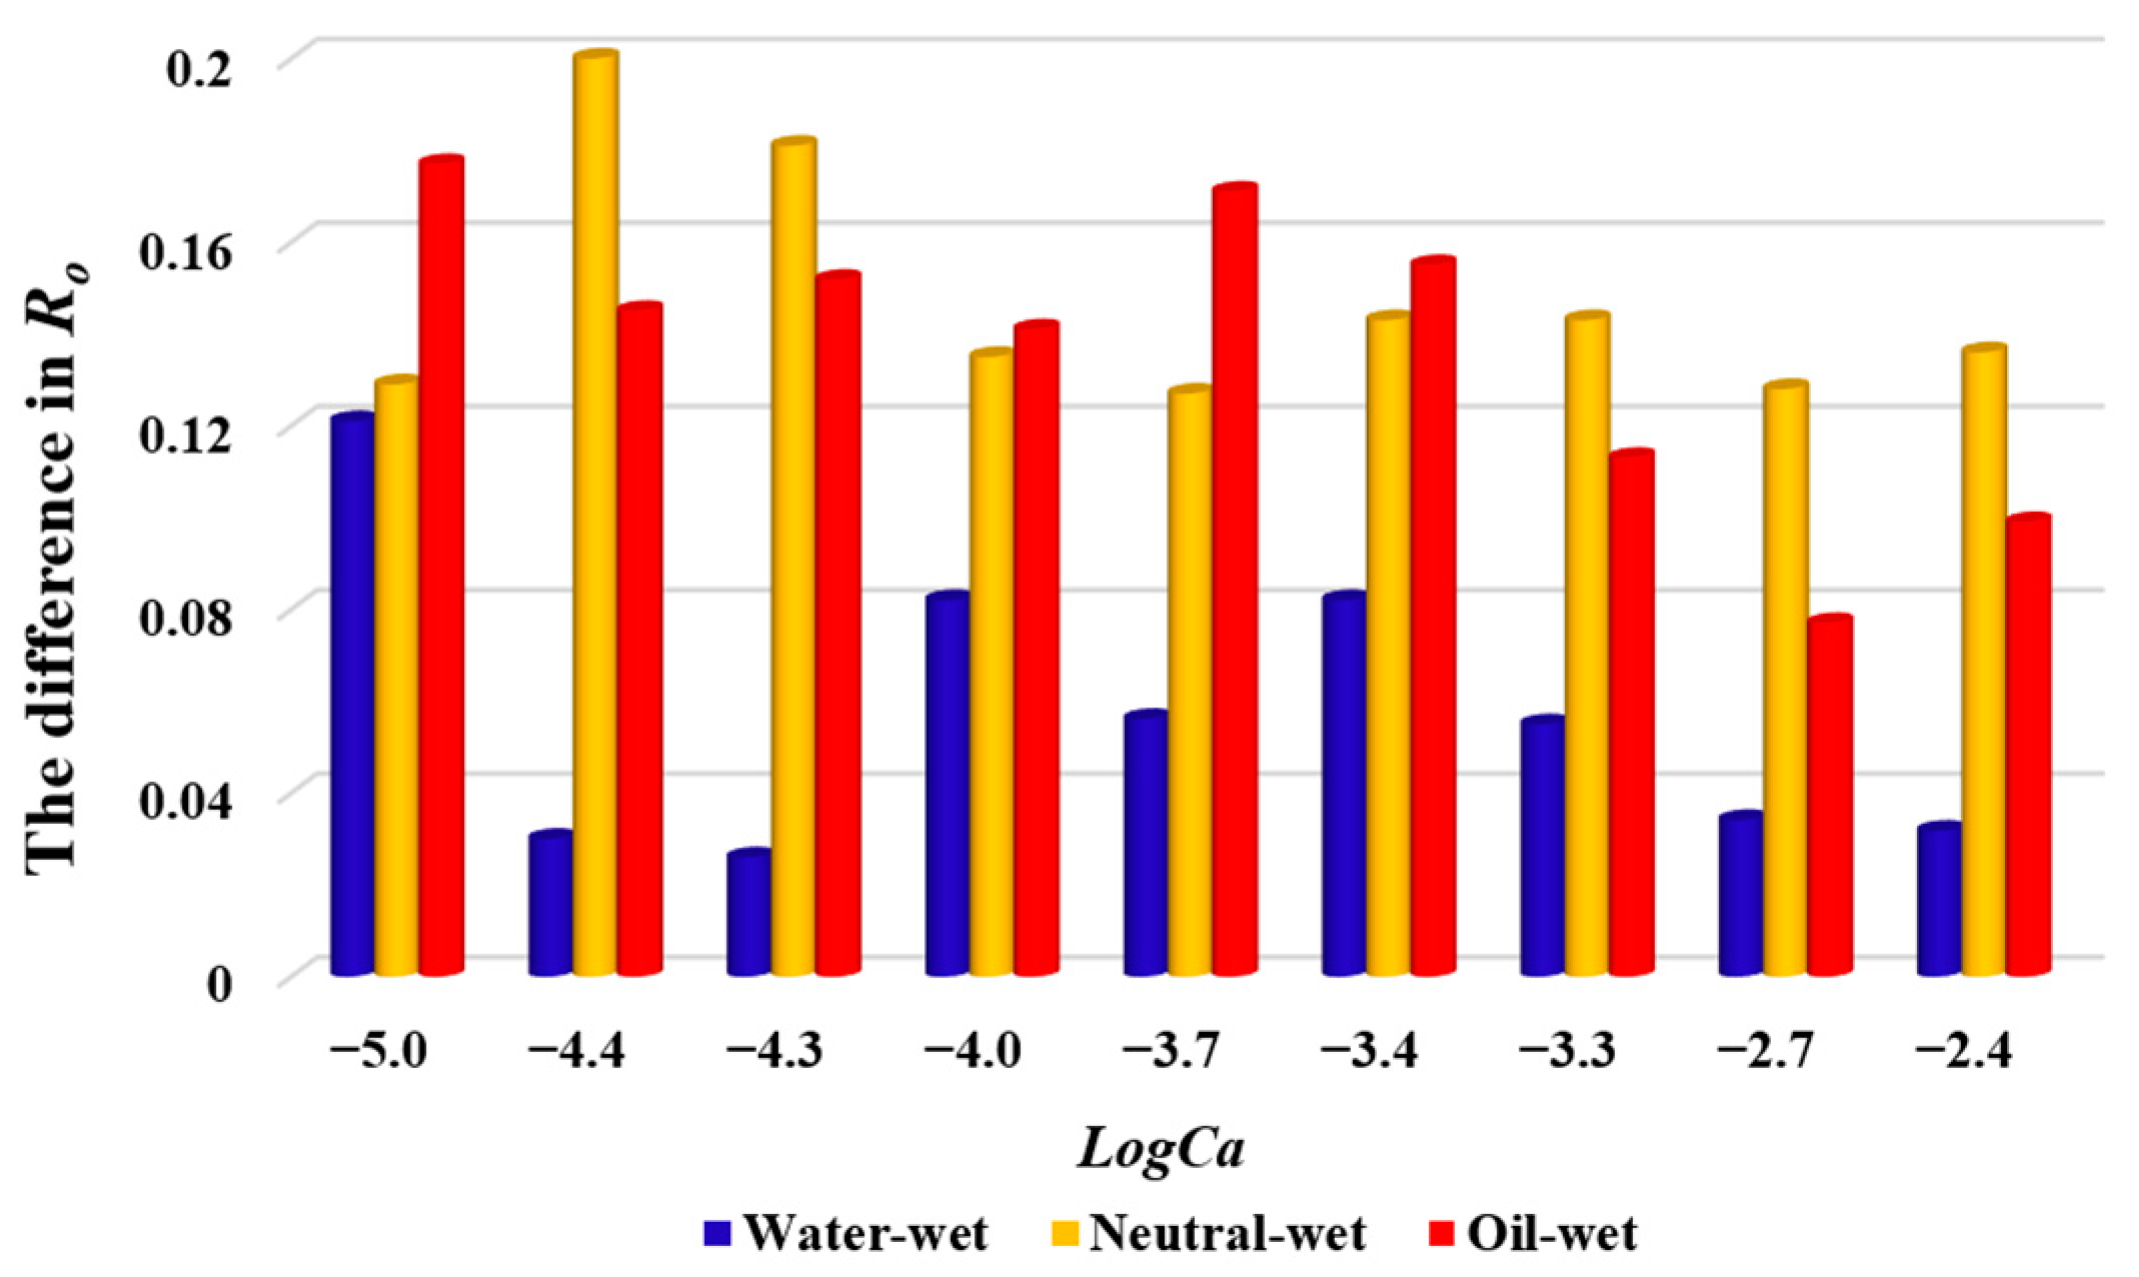
3.3. Effect of Wettability on Oil Displacement Efficiency

Figure 10 illustrates the Ro values under varying wettability and Ca conditions for single-porosity and dual-porosity systems. To verify the reliability of the Ro simulation results, this study conducted core waterflooding experiments based on the experimental procedure in references [57,58], while also expanding the Ca range based on previous research [58]. The experimental data demonstrate that the simulation results closely match the observed variations in Ro under different wettability conditions, revealing fluctuations in Ro (Figure 10). The following section will systematically analyze the effect of wettability on Ro based on numerical simulation results.
Within the studied logarithmic Ca range (logCa = −5 to logCa = −2.4), Ro is highest in water-wet single-porosity porous media, followed by neutral-wet and oil-wet states. As shown in Figure 11, at the same Ca, the difference in Ro between water-wet and neutral-wet porous media is greater than that between neutral-wet and oil-wet porous media. During waterflooding in water-wet single-porosity porous media, the proportion of capillary forces acting as driving forces at the fluid interface is significantly higher than in neutral-wet and oil-wet media. Under neutral-wet conditions, due to the capillary valve effect and changes in interfacial morphology, a portion of the capillary forces at the fluid interface is converted into resistance. Consequently, the Ro of neutral-wet single-porosity systems is comparable to that observed under oil-wet conditions. For dual-porosity porous media, the relationship between wettability and Ro mirrors that of single-porosity systems. Furthermore, when logCa exceeds −3.7, the Ro difference between neutral-wet and oil-wet porous media diminishes. This occurs because, at these Ca values, both neutral-wet and oil-wet porous media have penetrated most of the accessible macropore body regions during waterflooding, with only minor differences in the local distribution of oil and water within smaller pore throats and pore bodies.
Under all conditions, the Ro of relatively homogeneous single-porosity porous media is higher than that of dual-porosity porous media. Figure 12 compares the Ro values for the two types of porous media under three wettability conditions. Under water-wet conditions, the Ro difference between single-porosity and dual-porosity porous media is smaller than under other wettability states. When the initial water in the micropores occupies a significant proportion, it improves the connectivity of the water phase within the micropores, reducing the likelihood of oil retention. At high Ca, the variation in Ro indicates that the positive effect of enhanced water phase connectivity on displacement in dual-porosity systems is outweighed by the scale difference and heterogeneity introduced by micrite particles. As a result, micrite particles have a more pronounced negative impact on Ro. Under non-water-wet conditions, the Ro difference becomes more significant. This is primarily attributed to the excessive capillary resistance at micropore throats, which impedes the mobilization of oil trapped in the micropores as well as oil in macropores not reached by the water phase. Additionally, the geometry of macropores in dual-porosity porous media is more irregular, leading to a significant amount of trapped oil within individual pores that cannot be overlooked.

3.4. Effect of Ca on Oil Displacement Efficiency

Firstly, the waterflooding process in single-porosity and dual-porosity porous media under water-wet conditions is analyzed. As depicted in Figure 10, for single-porosity systems, Ro initially increases with increasing Ca, then decreases, and eventually stabilizes with a slight upward trend at higher Ca. Significant changes in residual oil distribution are observed when logCa ranges from −4.3 and −3.7 (Figure 13a–c). The weak heterogeneity of single-porosity porous media reduces pronounced distinctions between capillary and viscous fingering effects. At a logCa of −4.0, the displacement front advances most stably, achieving a maximum Ro of 0.771 (Figure 13b). This indicates that compact displacement likely dominates near logCa of −4.0. Beyond logCa of −3.7, variations in residual oil distribution become minimal (Figure 13c,d). Furthermore, as Ca increases, the water phase invades only a limited number of additional pore throats and blind ends.
In water-wet dual-porosity porous media, Ro initially increases, then gradually decreases, and subsequently rises again with increasing Ca. The maximum Ro reaches 0.7. At low Ca, the fluid interface movement within individual macropores remains relatively stable. However, the non-uniform fluid interface movement across different flow paths causes oil entrapment, as illustrated in Figure 14a,b. Between logCa = −4.3 and −3.4, increasing Ca exacerbates the non-uniformity of the fluid interface, leading to a greater amount of trapped oil. Most of the residual oil is retained in upswept macropores. Further increases in Ca (from logCa = −3.4 to −2.7) enable the water phase to penetrate additional macropore regions (Figure 14c,d). Under water-wet conditions with high Ca, the fragmentation effect of micrite particles and the imbibition effect result in isolated oil droplets being retained in the macropores. Nonetheless, Ro tends to increase (Figure 14d), indicating that the expansion of the swept area driven by increased viscous forces becomes the dominant factor at this stage.
Under neutral-wet and oil-wet conditions, Ro exhibits a similar trend to that observed under water-wet conditions, albeit with notable quantitative differences. Under neutral-wet conditions, the maximum Ro is reached at a logCa of approximately −4, with values of 0.643 for single-porosity systems and 0.508 for dual-porosity systems. In contrast, under oil-wet conditions, the dual-porosity systems achieve a maximum Ro of 0.437 at high Ca, while single-porosity systems show more pronounced fluctuations in Ro.
Figure 15 illustrates the primary factors influencing Ro in dual-porosity porous media under oil-wet conditions. As Ca increases, a reduction in Ro suggests that the enhanced viscous forces at this stage weaken the pore-filling effect driven by interfacial tension. These viscous forces are insufficient to enable water to invade additional macropores, leading instead to an increase in oil saturation within individual macropores. At this stage, capillary forces dominate Ro. With a further rise in Ca, Ro begins to increase, indicating that the relative enhancement of viscous forces in this range allows water to access additional macropores. At this stage, viscous forces dominate Ro. Under neutral-wet conditions, the dominant factors affecting Ro in dual-porosity porous media are similar to those under oil-wet conditions, albeit with notable quantitative differences. From Figure 9, distinct peak positions for Ro are evident under neutral-wet and oil-wet conditions. The maximum Ro for oil-wet systems occurs at a higher Ca compared to neutral-wet systems. At the same Ca, neutral-wet conditions exhibit lower capillary resistance, enabling the water phase to access a larger fraction of the porous medium compared to oil-wet conditions. Once the water phase has reached most of the macropores, further increases in Ca diminish the effect of interfacial tension, leading to a reduction in Ro. Additional increments in Ca do not result in further macropore access. Additionally, before a logCa of −4, Ro increases rapidly in neutral-wet dual-porosity porous media, whereas in oil-wet systems, Ro rises more gradually between logCa = −3.7 and −2.4. This difference arises from the higher capillary resistance in oil-wet conditions, requiring a wider range of Ca increments to overcome blockages caused by micrite particles.
For neutral-wet single-porosity systems, as Ca increases, the absence of initial water saturation leads to less uniform front advancement compared to water-wet conditions, with the process being predominantly driven by viscous forces. At higher Ca values, the overall homogeneity reduces the likelihood of breakthrough across additional pore throats. The increase in viscous forces primarily limits the filling of pore blind ends, causing a slight decline in Ro (Figure 16a–d). Figure 16e,f show the differences in residual oil as the logCa increases from −4 to −3.7 and −3.3. The region representing the difference in residual oil, marked in green, becomes thicker, which further suggests that it becomes difficult for the water phase to fill the pore blind ends. Under oil-wet conditions, the relatively low heterogeneity, combined with the smaller pore volume governed by individual pore throats compared to dual-porosity media, results in more frequent fluctuations in Ro. The water phase alternates between filling blind ends and breaking through additional pore throats.

3.5. Effect of Viscosity Ratio on Oil Displacement Efficiency

For waterflooding carbonate reservoirs, unfavorable viscosity ratios are typically less than 20. Figure 17 illustrates the effect of viscosity ratio on Ro under oil-wet and water-wet conditions in single-porosity and dual-porosity porous media. The results indicate that an increase in viscosity ratio significantly reduces Ro across various Ca values. In dual-porosity porous media, the reduction in Ro with increasing viscosity ratio is less pronounced than in single-porosity porous media. This is because changes in viscosity ratio do not significantly alter the displacement pattern in dual-porosity porous media. Compared with single-porosity porous media, dual-porosity porous media exhibit lower tortuosity during forced imbibition and less frequent fluid interface changes. Consequently, under higher viscosity ratios, single-porosity porous media are more prone to residual oil formation due to viscous fingering. Under high Ca conditions, the fluid interface is more uniform in both types of porous media under water-wet conditions than under oil-wet conditions. Additionally, the initial water at pore edges suppresses viscous fingering. Thus, at high Ca, the reduction in Ro with increasing viscosity ratio is more substantial under oil-wet conditions compared to water-wet conditions.

4. Conclusions

This study investigates the pore-scale mechanisms of forced imbibition in single-porosity and dual-porosity porous media using the color-gradient LBM model. The accuracy of the numerical method was validated by comparing it with the analytical solution and experimental data for capillary imbibition. The reliability of the oil displacement efficiency simulation results was further confirmed through core waterflooding experiments. The interface evolution patterns in both types of porous media are characterized, and the effects of wettability, capillary number, and viscosity ratio on oil displacement efficiency are systematically analyzed.
  • In dual-porosity porous media under water-wet conditions and low capillary numbers, micrite particle blockage significantly alters flow paths, affecting interface progression and oil entrapment. At high capillary numbers, the imbibition effect and oil fragmentation caused by micrite particles generate more unstable interfaces. Under neutral-wet and oil-wet conditions, when capillary forces dominate, oil displacement within the macropores of dual-porosity porous media becomes more favorable.
  • Under identical conditions, single-porosity porous media exhibit higher oil displacement efficiency than dual-porosity porous media. Both structures show the highest efficiency under water-wet conditions, while neutral-wet and oil-wet conditions lead to lower oil displacement efficiency. Dual-porosity porous media are more significantly influenced by the capillary resistance of micropore throats, which hinders the mobilization of oil in micropores and inaccessible macropores. As the capillary number increases, the difference in oil displacement efficiency between neutral-wet and oil-wet conditions diminishes. This indicates that wettability modification and improved waterflooding techniques can help mitigate the challenges posed by capillary resistance in dual-porosity carbonate reservoirs, ultimately improving oil recovery.
  • Dual-porosity porous media demonstrates a distinct non-monotonic variation in oil displacement efficiency as a function of the capillary number. The efficiency initially increases, followed by a gradual decline, and then rises again. In non-water-wet porous media, the initial increase is primarily controlled by viscous forces, while the subsequent decline is dominated by capillary forces. Understanding this non-monotonic behavior can aid in designing injection parameters that balance viscous and capillary forces, enabling more effective oil recovery in complex carbonate systems.
  • Dual-porosity porous media demonstrate a smaller reduction in oil displacement efficiency as viscosity ratios increase compared to single-porosity porous media. Under high capillary numbers, the decline in oil displacement efficiency is more pronounced in oil-wet conditions than in water-wet conditions.
  • In summary, this study emphasizes the role of micrite particles and capillary resistance in oil displacement efficiency in dual-porosity media, aiding the optimization of waterflooding and wettability alteration techniques. The numerical simulation framework also supports efficient development of complex carbonate reservoirs and paves the way for future experimental validation and field applications.

Author Contributions

Conceptualization, M.W.; methodology, M.W. and K.W.; software, M.W.; validation, M.W. and Q.Z.; formal analysis, M.W. and Q.Z.; investigation, M.W., T.W., and W.D.; writing—original draft preparation, M.W. and T.W.; writing—review and editing, K.W. All authors have read and agreed to the published version of the manuscript.

Funding

This work was supported by the National Natural Science Foundation of China (Grant NO. 52174041, 52104051, 52204058, and 51874319).

Data Availability Statement

The original contributions presented in this study are included in the article. Further inquiries can be directed to the corresponding author.

Conflicts of Interest

The authors declare no conflict of interest.

References

  1. Manrique, E.J.; Muci, V.E.; Gurfinkel, M.E. EOR Field Experiences in Carbonate Reservoirs in the United States. SPE Reserv. Eval. Eng. 2007, 10, 667–686. [Google Scholar] [CrossRef]
  2. Song, X.; Li, Y. Optimum Development Options and Strategies for Water Injection Development of Carbonate Reservoirs in the Middle East. Pet. Explor. Dev. 2018, 45, 723–734. [Google Scholar] [CrossRef]
  3. Xu, Z.-X.; Li, S.-Y.; Li, B.-F.; Chen, D.-Q.; Liu, Z.-Y.; Li, Z.-M. A Review of Development Methods and EOR Technologies for Carbonate Reservoirs. Pet. Sci. 2020, 17, 990–1013. [Google Scholar] [CrossRef]
  4. Moore, C.H.; Wade, W.J. Carbonate Reservoirs: Porosity and Diagenesis in a Sequence Stratigraphic Framework; Newnes: Oxford, UK, 2013; ISBN 0-444-53832-1. [Google Scholar]
  5. Dernaika, M.; Mansour, B.; Al-Jallad, O.; Koronfol, S. Overview of Carbonate Rock Types in the Middle East. In Proceedings of the SPE Middle East Oil and Gas Show and Conference, Manama, Bahrain, 21 March 2019; SPE: Manama, Bahrain, 2019; p. D042S098R002. [Google Scholar]
  6. El Husseiny, A.; Vanorio, T. Porosity-Permeability Relationship in Dual-Porosity Carbonate Analogs. Geophysics 2017, 82, MR65–MR74. [Google Scholar] [CrossRef]
  7. Miller, K.; Vanorio, T.; Yang, S.; Xiao, X. A Scale-Consistent Method for Imaging Porosity and Micrite in Dual-Porosity Carbonate Rocks. Geophysics 2019, 84, MR115–MR127. [Google Scholar] [CrossRef]
  8. Hu, J.; Yang, S.; Jiang, Y.; Deng, H.; Wang, M.; You, L.; Li, Q.; Bai, H.; Shen, B. Experimental Study on Edge Water Invasion of Strongly Heterogeneous Carbonate Gas Reservoirs Based on NMR Technology. Processes 2024, 12, 1361. [Google Scholar] [CrossRef]
  9. Zhao, L.; Nasser, M.; Han, D. Quantitative Geophysical Pore-type Characterization and Its Geological Implication in Carbonate Reservoirs. Geophys. Prospect. 2013, 61, 827–841. [Google Scholar] [CrossRef]
  10. Li, H.-B.; Zhang, J.-J.; Cai, S.-J.; Pan, H.-J. A Two-Step Method to Apply Xu–Payne Multi-Porosity Model to Estimate Pore Type from Seismic Data for Carbonate Reservoirs. Pet. Sci. 2020, 17, 615–627. [Google Scholar] [CrossRef]
  11. Zhang, H.; Peng, W.; Hao, P.; Du, M. A Heterogeneous Model for Simulating Fluid Flow in Naturally Fractured-Vuggy Carbonate Reservoirs. Int. J. Oil Gas Coal Technol. 2019, 20, 397. [Google Scholar] [CrossRef]
  12. Kang, L.; Guo, W.; Zhang, X.; Liu, Y.; Gao, J.; Shao, Z.; Li, M.; Sun, Y. Two-Phase Flow Model and Productivity Evaluation of Gas and Water for Dual-Medium Carbonate Gas Reservoirs. Front. Earth Sci. 2022, 9, 823764. [Google Scholar] [CrossRef]
  13. Li, J.; Liu, Y.; Gao, Y.; Cheng, B.; Meng, F.; Xu, H. Effects of Microscopic Pore Structure Heterogeneity on the Distribution and Morphology of Remaining Oil. Pet. Explor. Dev. 2018, 45, 1112–1122. [Google Scholar] [CrossRef]
  14. Guo, C.; Wang, X.; Wang, H.; He, S.; Liu, H.; Zhu, P. Effect of Pore Structure on Displacement Efficiency and Oil-Cluster Morphology by Using Micro Computed Tomography (μCT) Technique. Fuel 2018, 230, 430–439. [Google Scholar] [CrossRef]
  15. Namaee-Ghasemi, A.; Ayatollahi, S.; Mahani, H. Insights into the Effects of Pore Structure, Time Scale, and Injection Scenarios on Pore-Filling Sequence and Oil Recovery by Low-Salinity Waterflooding Using a Mechanistic DLVO-Based Pore-Scale Model. SPE J. 2023, 28, 1760–1776. [Google Scholar] [CrossRef]
  16. Riaz, A.; Tang, G.-Q.; Tchelepi, H.A.; Kovscek, A.R. Forced Imbibition in Natural Porous Media: Comparison between Experiments and Continuum Models. Phys. Rev. E 2007, 75, 036305. [Google Scholar] [CrossRef]
  17. Liu, H.; Sun, S.; Wu, R.; Wei, B.; Hou, J. Pore-Scale Modeling of Spontaneous Imbibition in Porous Media Using the Lattice Boltzmann Method. Water Resour. Res. 2021, 57, e2020WR029219. [Google Scholar] [CrossRef]
  18. Qin, C.; Wang, X.; Hefny, M.; Zhao, J.; Chen, S.; Guo, B. Wetting Dynamics of Spontaneous Imbibition in Porous Media: From Pore Scale to Darcy Scale. Geophys. Res. Lett. 2022, 49, e2021GL097269. [Google Scholar] [CrossRef]
  19. Wennberg, O.P.; Casini, G.; Jonoud, S.; Peacock, D.C.P. The Characteristics of Open Fractures in Carbonate Reservoirs and Their Impact on Fluid Flow: A Discussion. Pet. Geosci. 2016, 22, 91–104. [Google Scholar] [CrossRef]
  20. Qi, C.; Liu, Y.; Dong, F.; Liu, X.; Yang, X.; Shen, Y.; Huang, H. Study on Heterogeneity of Pore Throats at Different Scales and Its Influence on Seepage Capacity in Different Types of Tight Carbonate Reservoirs. Geofluids 2020, 2020, 1–7. [Google Scholar] [CrossRef]
  21. Soulaine, C.; Gjetvaj, F.; Garing, C.; Roman, S.; Russian, A.; Gouze, P.; Tchelepi, H.A. The Impact of Sub-Resolution Porosity of X-Ray Microtomography Images on the Permeability. Transp. Porous Med. 2016, 113, 227–243. [Google Scholar] [CrossRef]
  22. Carrillo, F.J.; Soulaine, C.; Bourg, I.C. The Impact of Sub-Resolution Porosity on Numerical Simulations of Multiphase Flow. Adv. Water Resour. 2022, 161, 104094. [Google Scholar] [CrossRef]
  23. Suo, S.; Liu, M.; Gan, Y. Fingering Patterns in Hierarchical Porous Media. Phys. Rev. Fluids 2020, 5, 034301. [Google Scholar] [CrossRef]
  24. Gao, Y.; Qaseminejad Raeini, A.; Blunt, M.J.; Bijeljic, B. Pore Occupancy, Relative Permeability and Flow Intermittency Measurements Using X-Ray Micro-Tomography in a Complex Carbonate. Adv. Water Resour. 2019, 129, 56–69. [Google Scholar] [CrossRef]
  25. Spurin, C.; Bultreys, T.; Bijeljic, B.; Blunt, M.J.; Krevor, S. Intermittent Fluid Connectivity during Two-Phase Flow in a Heterogeneous Carbonate Rock. Phys. Rev. E 2019, 100, 043103. [Google Scholar] [CrossRef]
  26. Wang, D.; Liu, F.; Sun, J.; Li, Y.; Wang, Q.; Jiao, Y.; Song, K.; Wang, S.; Ma, R. Lattice-Boltzmann Simulation of Two-Phase Flow in Carbonate Porous Media Retrieved from Computed Microtomography. Chem. Eng. Sci. 2023, 270, 118514. [Google Scholar] [CrossRef]
  27. Liu, Y.; Min, J.; Zhang, X. A Novel Micro-Continuum Lattice Boltzmann Approach for Multiscale Modeling Immiscible Two-Phase Flow in Porous Media. Phys. Fluids 2024, 36, 083345. [Google Scholar] [CrossRef]
  28. Chen, L.; Kang, Q.; Mu, Y.; He, Y.-L.; Tao, W.-Q. A Critical Review of the Pseudopotential Multiphase Lattice Boltzmann Model: Methods and Applications. Int. J. Heat Mass Transf. 2014, 76, 210–236. [Google Scholar] [CrossRef]
  29. Khadri, S.O.; Hussein, I.A.; Sadooni, F.; Shirif, E. CFD Estimation of Gas Production in Tight Carbonates Using Single and Dual-Porosity Models. Sci. Rep. 2023, 13, 22668. [Google Scholar] [CrossRef] [PubMed]
  30. Wang, W.; Liu, P.; Zhou, C.; Bate, B.; Chen, Y. Numerical Pore-Scale Investigation of Two-Phase Displacement with Non-Newtonian Defending Fluid. Phys. Fluids 2024, 36, 093105. [Google Scholar] [CrossRef]
  31. Raeini, A.Q.; Blunt, M.J.; Bijeljic, B. Modelling Two-Phase Flow in Porous Media at the Pore Scale Using the Volume-of-Fluid Method. J. Comput. Phys. 2012, 231, 5653–5668. [Google Scholar] [CrossRef]
  32. Ambekar, A.S.; Mattey, P.; Buwa, V.V. Pore-Resolved Two-Phase Flow in a Pseudo-3D Porous Medium: Measurements and Volume-of-Fluid Simulations. Chem. Eng. Sci. 2021, 230, 116128. [Google Scholar] [CrossRef]
  33. Jettestuen, E.; Helland, J.O.; Prodanović, M. A Level Set Method for Simulating Capillary-controlled Displacements at the Pore Scale with Nonzero Contact Angles. Water Resour. Res. 2013, 49, 4645–4661. [Google Scholar] [CrossRef]
  34. Shi, H.; Zhu, Q.; Chen, Z.; Li, J.; Feng, D.; Zhang, S.; Ye, J.; Wu, K. Pore-Scale Modeling of Water–Gas Flow in Heterogeneous Porous Media. Phys. Fluids 2023, 35, 072114. [Google Scholar] [CrossRef]
  35. Li, B.; Yu, H.; Ji, D.; Wang, F.; Lei, Z.; Wu, H. Pore-Scale Imbibition Patterns in Layered Porous Media with Fractures. Phys. Fluids 2024, 36, 012120. [Google Scholar] [CrossRef]
  36. Taghilou, M.; Rahimian, M.H. Investigation of Two-Phase Flow in Porous Media Using Lattice Boltzmann Method. Comput. Math. Appl. 2014, 67, 424–436. [Google Scholar] [CrossRef]
  37. Wu, Y.; Gui, N.; Yang, X.; Tu, J.; Jiang, S. Improved Stability Strategies for Pseudo-Potential Models of Lattice Boltzmann Simulation of Multiphase Flow. Int. J. Heat Mass Transf. 2018, 125, 66–81. [Google Scholar] [CrossRef]
  38. Ezzatneshan, E.; Goharimehr, R. A Pseudopotential Lattice Boltzmann Method for Simulation of Two-Phase Flow Transport in Porous Medium at High-Density and High–Viscosity Ratios. Geofluids 2021, 2021, 1–18. [Google Scholar] [CrossRef]
  39. Leclaire, S.; Parmigiani, A.; Malaspinas, O.; Chopard, B.; Latt, J. Generalized Three-Dimensional Lattice Boltzmann Color-Gradient Method for Immiscible Two-Phase Pore-Scale Imbibition and Drainage in Porous Media. Phys. Rev. E 2017, 95, 033306. [Google Scholar] [CrossRef]
  40. Lafarge, T.; Boivin, P.; Odier, N.; Cuenot, B. Improved Color-Gradient Method for Lattice Boltzmann Modeling of Two-Phase Flows. Phys. Fluids 2021, 33, 082110. [Google Scholar] [CrossRef]
  41. Inamuro, T.; Konishi, N.; Ogino, F. A Galilean Invariant Model of the Lattice Boltzmann Method for Multiphase Fluid Flows Using Free-Energy Approach. Comput. Phys. Commun. 2000, 129, 32–45. [Google Scholar] [CrossRef]
  42. Huang, H.; Zheng, H.; Lu, X.; Shu, C. An Evaluation of a 3D Free-energy-based Lattice Boltzmann Model for Multiphase Flows with Large Density Ratio. Numer. Methods Fluids 2010, 63, 1193–1207. [Google Scholar] [CrossRef]
  43. Mirhoseini, M.; Banaee, A.; Jalali, A. A Novel Phase-Field Lattice Boltzmann Framework for Diffusion-Driven Multiphase Evaporation. Phys. Fluids 2024, 36, 083314. [Google Scholar] [CrossRef]
  44. Wang, M.; Wu, K.; Chen, Z.; Li, J.; Feng, D. Classification and Evaluation of Microscopic Pore Structure in Carbonate Rocks by Integrating MICP-Based Dynamic Information. In Proceedings of the SPE Western Regional Meeting, Palo Alto, CA, USA, 18 April 2024; SPE: Palo Alto, CA, USA, 2024; p. D031S015R007. [Google Scholar]
  45. Bauer, D.; Youssef, S.; Fleury, M.; Bekri, S.; Rosenberg, E.; Vizika, O. Improving the Estimations of Petrophysical Transport Behavior of Carbonate Rocks Using a Dual Pore Network Approach Combined with Computed Microtomography. Transp. Porous Med. 2012, 94, 505–524. [Google Scholar] [CrossRef]
  46. Kim, K.; Lee, Y.; Hwang, S.; Seo, J.; Sung, W. Improved Capillary Pressure Model Considering Dual-Pore Geometry System in Carbonate Reservoirs. J. Pet. Sci. Eng. 2011, 78, 601–608. [Google Scholar] [CrossRef]
  47. Gostick, J.; Khan, Z.; Tranter, T.; Kok, M.; Agnaou, M.; Sadeghi, M.; Jervis, R. PoreSpy: A Python Toolkit for Quantitative Analysis of Porous Media Images. J. Open Source Softw. 2019, 4, 1296. [Google Scholar] [CrossRef]
  48. Tarjus, G.; Schaaf, P.; Talbot, J. Random Sequential Addition: A Distribution Function Approach. J. Stat. Phys. 1991, 63, 167–202. [Google Scholar] [CrossRef]
  49. Liu, H.; Valocchi, A.J.; Werth, C.; Kang, Q.; Oostrom, M. Pore-Scale Simulation of Liquid CO2 Displacement of Water Using a Two-Phase Lattice Boltzmann Model. Adv. Water Resour. 2014, 73, 144–158. [Google Scholar] [CrossRef]
  50. Zou, Q.; He, X. On Pressure and Velocity Boundary Conditions for the Lattice Boltzmann BGK Model. Phys. Fluids 1997, 9, 1591–1598. [Google Scholar] [CrossRef]
  51. Fulcher, R.A.; Ertekin, T.; Stahl, C.D. Effect of Capillary Number and Its Constituents on Two-Phase Relative Permeability Curves. J. Pet. Technol. 1985, 37, 249–260. [Google Scholar] [CrossRef]
  52. Guo, H.; Song, K.; Hilfer, R. A Critical Review of Capillary Number and Its Application in Enhanced Oil Recovery. In Proceedings of the SPE Improved Oil Recovery Conference, Tulsa, OK, USA, 31 August–4 September 2020; SPE: Tulsa, OK, USA, 2020; p. D031S046R001. [Google Scholar]
  53. Washburn, E.W. The Dynamics of Capillary Flow. Phys. Rev. 1921, 17, 273–283. [Google Scholar] [CrossRef]
  54. Diotallevi, F.; Biferale, L.; Chibbaro, S.; Lamura, A.; Pontrelli, G.; Sbragaglia, M.; Succi, S.; Toschi, F. Capillary Filling Using Lattice Boltzmann Equations: The Case of Multi-Phase Flows. Eur. Phys. J. Spec. Top. 2009, 166, 111–116. [Google Scholar] [CrossRef]
  55. André, J.; Okumura, K. Capillary Replacement in a Tube Prefilled with a Viscous Fluid. Langmuir 2020, 36, 10952–10959. [Google Scholar] [CrossRef] [PubMed]
  56. Dasgupta, S.; Katava, M.; Faraj, M.; Auth, T.; Gompper, G. Capillary Assembly of Microscale Ellipsoidal, Cuboidal, and Spherical Particles at Interfaces. Langmuir 2014, 30, 11873–11882. [Google Scholar] [CrossRef] [PubMed]
  57. Xiao, R.; Gupta, R.; Glotzbach, R.C.; Sinha, S.; Teletzke, G.F. Evaluation of Low-Salinity Waterflooding in Middle East Carbonate Reservoirs Using a Novel, Field-Representative Coreflood Method. J. Pet. Sci. Eng. 2018, 163, 683–690. [Google Scholar] [CrossRef]
  58. Wang, M.; Li, Y.; Wu, K.; Chen, Z.; Li, J.; Feng, D.; Zhu, Q.; Guo, S. Quantitative Characterization of Microscopic Pore Structure and Oil Recovery Evaluation in Porous Carbonate Reservoirs. Pet. Geol. Recovery Effic. 2024, 31, 96–107. [Google Scholar] [CrossRef]
Figure 1. The pore structure of carbonate reservoirs with single porosity and dual porosity. (a) Thin-section photomicrograph of single-porosity carbonate rock. (b) Pore throat size distribution (PTSD) of single-porosity test cores. (c) Thin-section photomicrograph of dual-porosity carbonate rock. (d) PTSD of dual-porosity test cores. (e) Reconstructed single-porosity porous medium. (f) PTSD of reconstructed single-porosity porous medium. (g) Reconstructed dual-porosity porous medium. (h) PTSD of reconstructed dual-porosity porous medium. (Note: In (e) and (g), purple represents solid phase, and yellow represents pore space).
Processes 13 00713 g001
Figure 2. Initial fluid distribution in single-porosity and dual-porosity porous media with different wettability. The solid grain, oil, and water are in white, blue, and red, respectively. The initial water saturation is 0.13 for (a), 0.3 for (c), and 0 for both (b,d). (a) Water-wet single-porosity. (b) Non-water-wet single-porosity. (c) Water-wet dual-porosity. (d) Non-water-wet dual-porosity.
Processes 13 00713 g002
Figure 3. Schematic diagram of capillary invasion, inspired by Liu et al. [49]. Red and blue fluids represent wetting phase and non-wetting phase, respectively.
Processes 13 00713 g003
Figure 4. Comparison of imbibition lengths obtained from analytical solutions and LBM. (a) d = 10, M = 3; (b) d = 10, M = 20; (c) d = 100, M = 3; (d) d = 100, M = 20.
Processes 13 00713 g004
Figure 5. Comparison of normalized imbibition lengths obtained from experiments [55] and LBM. L* is the dimensionless imbibition length and t* is the dimensionless imbibition time.
Processes 13 00713 g005
Figure 6. Comparison of interfacial evolution patterns between single-porosity and dual-porosity porous media under water-wet conditions and logCa = −4.3: (a) 0.03 s, logCa = −4.3, single porosity; (b) 0.015 s, logCa = −4.3, dual porosity; (c) 0.03 s, logCa = −4.3, dual porosity.
Processes 13 00713 g006
Figure 7. Comparison of interfacial evolution patterns between single-porosity and dual-porosity porous media under water-wet conditions and logCa = −2.4: (a) 0.014 s, logCa = −2.4, single porosity; (b) 0.014 s, logCa = −2.4, dual porosity; (c) 0.02 s, logCa = −2.4, dual porosity.
Processes 13 00713 g007
Figure 8. Comparison of the ultimate oil/water distribution in single-porosity porous media at different wettability and logCa. Green represents the residual oil that is displaced in water-wet single-porosity porous media but remains trapped in oil-wet single-porosity porous media under the same logCa. (a) Water-wet, logCa = −4.3; (b) oil-wet, logCa = −4.3; (c) residual oil distribution difference, logCa = −4.3; (d) water-wet, logCa = −2.4; (e) oil-wet, logCa = −2.4; (f) residual oil distribution difference, logCa = −2.4.
Processes 13 00713 g008aProcesses 13 00713 g008b
Figure 9. Effect of capillary forces on pore filling during the initial stage of displacement (t = 0.01 s) in oil-wet dual-porosity porous media. (a) IFT = 1 mN/m, logCa = −4; (b) IFT = 10 mN/m, logCa = −3.3; (c) IFT = 40 mN/m, logCa = −2.4.
Processes 13 00713 g009
Figure 10. Oil displacement efficiency vs. capillary number of single-porosity and dual-porosity porous media under three wettability conditions.
Processes 13 00713 g010
Figure 11. The difference in oil displacement efficiency attributable to variations in wettability. (a) Single-porosity porous media. (b) Dual-porosity porous media.
Processes 13 00713 g011
Figure 12. The difference in oil displacement efficiency between two types of porous media.
Processes 13 00713 g012
Figure 13. Comparison of the ultimate oil/water distribution in single-porosity porous media at different logCa. (a) LogCa = −4.3. (b) LogCa = −4.0. (c) LogCa = −3.7. (d) LogCa = −2.7.
Processes 13 00713 g013
Figure 14. Comparison of the ultimate oil/water distribution in dual-porosity porous media at different logCa. (a) LogCa = −4.3. (b) LogCa = −4. (c) LogCa = −3.4. (d) LogCa = −2.7.
Processes 13 00713 g014
Figure 15. Schematic diagram of the main controlling factors of Ro for dual-porosity porous media under oil-wet conditions.
Processes 13 00713 g015
Figure 16. Comparison of the ultimate oil/water distribution in neutral-wet single-porosity porous media at different logCa. Green represents the residual oil that exists in (b) or (c) but not in (a). (a) LogCa = −4. (b) LogCa = −3.7. (c) LogCa = −3.3. (d) LogCa = −2.7. (e) Residual oil difference between (a) and (b). (f) Residual oil difference between (a) and (c).
Processes 13 00713 g016aProcesses 13 00713 g016b
Figure 17. The oil displacement efficiency vs. oil/water viscosity ratio for (a) single-porosity porous media and (b) dual-porosity porous media.
Processes 13 00713 g017aProcesses 13 00713 g017b
Table 1. The conversion relationship between lattice units and physical units.
Physical QuantityLattice UnitsPhysical Units
Length1 lu1 × 10−6 m
Mass1 mu1 × 10−15 kg
Time1 ts5 × 10−8 s
Table 2. Initial and boundary condition settings.
Porous Media Initial Sw 1Top InletBottom OutletSolid Wall,
Left and Right Sides
Contact Angle
Single-porosity0.13 (water-wet)Non-equilibrium bounce-back scheme (fixed velocity)Non-equilibrium bounce-back scheme (fixed pressure)Halfway bounce-back boundaryVirtual density scheme
0 (non-water-wet)
Dual-porosity0.3 (water-wet)
0 (non-water-wet)
1 Sw represents water saturation.
Table 3. The simulation parameters of single-porosity and dual-porosity models under various wettability states and logCa.
NumberInjection Rate
(m/s)
Interfacial Tension
(mN/m)
Contact Angle
(°)
LogCaViscosity Ratio
10.01130−2.43, 10, 20
20.01190−2.43
30.011150−2.410, 20
40.011030−3.33
50.011090−3.33
60.0110150−3.33
70.014030−43, 10, 20
80.014090−43
90.0140150−43, 10, 20
100.005130−2.73
110.005190−2.73
120.0051150−2.73
130.0051030−3.73
140.0051090−3.73
150.00510150−3.73
160.0054030−4.33, 10, 20
170.0054090−4.33
180.00140150−4.33, 10, 20
190.001130−3.43
200.001190−3.43
210.0011150−3.43
220.0011030−4.43
230.0011090−4.43
240.00110150−4.43
250.0014030−53
260.0014090−53
270.00140150−53
Disclaimer/Publisher’s Note: The statements, opinions and data contained in all publications are solely those of the individual author(s) and contributor(s) and not of MDPI and/or the editor(s). MDPI and/or the editor(s) disclaim responsibility for any injury to people or property resulting from any ideas, methods, instructions or products referred to in the content.

