Abstract
Many studies have shown that the thermal evolution degree is the main factor affecting the micropore structure of coal reservoirs. However, within the same thick coal seam, the Ro,max of the entire coal seam is not much different, which affects the determination of the main controlling factors of pore structure heterogeneity. Therefore, No. 8 coal collected from Benxi Formation in the eastern margin of Ordos was taken as an example, and 16 samples were selected for low-temperature liquid nitrogen, carbon dioxide adsorption, and industrial component tests. Based on heterogeneity differences of Ro,max, industrial components and pore volume distribution of adsorption pores (pore diameter is less than 100 nm), the main controlling factors affecting the micropore structure of ultra-thick coal seams, were discussed. Then, the surface free energy theory was used to study the influencing factors affecting surface free energy variations during coal adsorption. First of all, Ro,max is not the main controlling factor affecting the micropore-fracture structure, as the effects of industrial components on the micropore structure are obvious, which indicates that industrial components are the main factors affecting vertical differences in the micropore structure within the same thick coal seam. Second of all, Ro,max and industrial components affect the adsorption process. When the adsorption pressure is lower, the adsorption volume and adsorption potential increase rapidly. When the adsorption pressure is higher (pressure is larger than 15 Mpa), the adsorption capacity and potential tend to be stable. Moreover, the maximum surface free energy increases with the increase in coal rank, which indicates that the degree of thermal evolution is the core factor affecting the adsorption free energy, but it is also controlled by the influence of industrial components (ash content). Lastly, micropores affect the adsorption capacity, and mesopores have little effect on the adsorption capacity, since micropores restrict the adsorption capacity and change the adsorption process by affecting surface free energy variations. The refined characterization of pore-fracture structures in deep coal reservoirs plays a crucial role in the occurrence and seepage of coalbed gas. This research can provide a theoretical basis for the efficient development of deep coalbed gas in the target area. This study aims to identify the primary factors controlling micropore structures in No. 8 coal from the Benxi Formation and to analyze the role of industrial components, which has been overlooked in previous research.
1. Introduction
With studies on deep coalbed methane theories, the exploration and development of deep coalbed methane has achieved a breakthrough [1,2,3]. Differing from shallow coalbed methane, the relevant literature shows that deep coalbed methane is represented by higher temperature, pressure, and gas saturation. Higher free gas content has become the main factor in realizing a breakthrough in deep coalbed methane production capacity. It should be noted that the change in Ro,max controlled by the depth of the same coal seam is smaller, and the main controlling factors affecting the pore structure of deep coalbed methane are different from those of shallow coalbed methane, which also indicates that the pore and fracture structure of deep coal seams needs to be further studied.
Related studies have been carried out on the pore and fracture structure of deep coal seams. Among them, low-temperature liquid nitrogen (LTN2 GA), carbon dioxide adsorption (LPCO2 GA), high-pressure mercury (HPMI), and nuclear magnetic resonance (NMR) were used to characterize the micropore structure of coal reservoirs [4,5,6,7,8]. Based on this, the above experimental tests were used to analyze the pore and fracture structure of deep coal seams. The No. 8 coal seam in the eastern margin of Ordos Basin was used to study the pore and fracture structure of a deep coal seam using LTN2 GA and LPCO2 GA tests [9,10]. The results indicated that coal facies are a factor in the development of pores and fractures in deep coal reservoirs. The No. 8 coal seam in Ordos Basin was divided by its coal facies and it was discussed that coal facies are the main controlling factor of the pore and fracture structure of coal reservoirs [11]. The Kubai coalfield in the northern margin of the Tarim Basin was chosen as an example to study the main controlling factors of the pore and fracture structure of deep coal reservoirs, and it was indicated that the metamorphic degree and industrial components of coal were the main controlling factors [12]. Based on this, the pore-fracture structure of deep coal reservoirs and main controlling factors have been studied.
Based on this, 16 samples from the No. 8 coal seam of the Benxi Formation were selected in the eastern margin of Ordos as the research target to describe the pore structure of deep coal reservoirs. Unlike previous studies, this research classifies coal samples based on their thermal evolution degree. It provides a refined characterization of the pore-fracture structural features for micropores (0.3–0.6 nm, 0.6–0.8 nm, and 0.8–1.5 nm) and mesopores (2–10 nm, 10–50 nm, and 50–100 nm). Firstly, based on the analysis of industrial components and Ro,max, the ash content, moisture content, and volatile matter content of all of the samples were studied. Secondly, the pore volume distribution of nanopores (<2 nm and 2–100 nm) of different coal grades and industrial components was determined by LTN2 GA and LPCO2 GA tests. On this basis, the main controlling factors affecting the pore-fracture structure are clarified. Finally, the adsorption space and adsorption potential of different coal samples were calculated by introducing the surface free energy theory and adsorption potential theory, surface free energy variations in the adsorption process were studied, and the main control factors affecting surface free energy in the methane adsorption process were discussed.
2. Geological Background
Covering an extensive area of roughly 371,000 square kilometers, the Ordos Basin is a significant geological feature that originated from the tectonic interactions between the Yangtze and North China plates [13]. This basin is characterized by six major structural divisions: the northern Yimeng Uplift, the western fault thrust zone, the eastern Jinxi Flexural Fold Belt, the central Yishan Slope Belt, the southern Weibei Uplift, and the western Tianhuan Depression [14]. The focus of this study lies on the eastern periphery of the Ordos Basin, where the Benxi and Shanxi formations are recognized as the primary coal-bearing formations. When the Benxi Formation was being deposited, the northern section of the basin featured deltaic plains, the central area was dominated by delta fronts, and the southern region was marked by shallow lagoons. Collectively, these features indicate a sedimentary environment typical of nearshore deltaic and barrier coast tidal flat-lagoon systems [15,16,17]. Structurally, the study area is positioned on the Yishan Slope, with its eastern boundary in close proximity to the western Shanxi Fold Belt (Figure 1). The primary coal seam of interest in this region is the No. 8 seam within the Benxi Formation, which is buried at depths ranging from 2400 to 3500 m and exhibits a thickness that varies between 3 and 10 m, averaging around 6 m. For the purposes of this research, a total of 16 coal reservoir rock samples were extracted from wells M1, Q3, and J3.
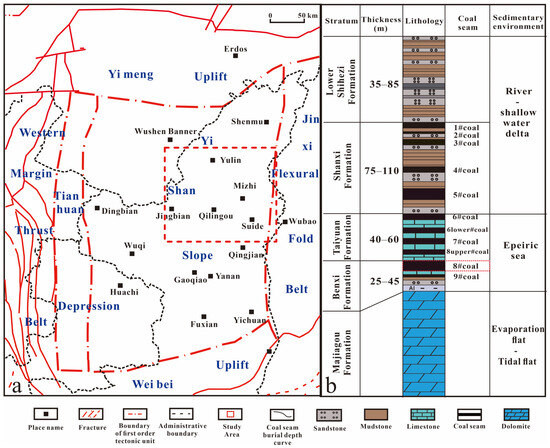
Figure 1.
Study area and sample location (a) and histogram of targeted layer (b) [18].
3. Experimental Methods
The coal samples from the study area were transported to the laboratory after being specially packaged for analysis. The tests were performed following the guidelines of the Chinese national standard GB/T 19222-2003 [19]. For the maceral analysis, the Chinese standard GB/T 6948-1998 was used, with 500 points measured on a 3 × 3 cm2 polished surface for each sample [20]. Additionally, 16 samples were analyzed for their industrial properties according to the Chinese standard GB/T 212-2001 [21]. The details of all samples are summarized in Table 1.

Table 1.
Basic information of coal samples.
Low-temperature carbon dioxide adsorption test (LTCO2 GA). The LTCO2 GA test was conducted using an Autosorb-iQ-MP-C analyzer (Quantachrome Instruments U.S. Co., Ltd., Boynton Beach, FL, USA). Coal samples with a 60–80 mesh size were subjected to methane adsorption tests. To prepare the samples, a degassing process was employed, maintaining a temperature of 105 °C for 12 h to eliminate moisture and volatile components. Subsequently, the degassed samples were analyzed at 273 K using high-purity CO2 as the adsorbent. The procedure followed the guidelines of GB/T 21650.3-2011. The density functional theory (DFT) model was used to assess various structural parameters, such as pore volume, specific surface area, average pore diameter, and the distribution of micropores (diameter < 2 nm) [22,23,24,25,26].
The high-temperature and high-pressure isothermal adsorption test (HTHP). The HTHP test was conducted using an MesoMR-HTHP analyzer (Suzhou Niumag Analytical Instrument Co., Ltd., Suzhou, China). The experimental analysis of the samples was conducted following the standard “Experimental Method for High-pressure Isothermal Adsorption of Coal” (GB/19560-2008). To prepare the samples for testing, they were ground to a fine particle size of 200 mesh and subjected to degassing in an oven. Subsequently, the samples were immersed in a water bath at 30 °C for 12 h under vacuum conditions to ensure thorough treatment. High-purity helium (99.9% volume fraction) was then used to measure the free space volume within the sample container prior to evacuation. Following this, high-purity methane (99.9% volume fraction) was introduced as the adsorbate. The gas pressure was gradually increased stepwise until reaching the maximum experimental pressure of 30 MPa. Throughout the entire adsorption process, both gas pressure and adsorption data were continuously monitored and recorded in real time [27,28,29].
LTN2 GA and LPCO2 GA were selected due to their superior sensitivity in characterizing micropores smaller than 100 nm, which are critical for understanding adsorption capacity. Alternative methods were deemed unsuitable as they lack the precision required for this scale of analysis.
Adsorption Theory and Calculation Methods
Adsorption parameter. The Langmuir model enables the prediction of adsorption capacities across a range of pressures. This model is extensively utilized to depict the behavior of adsorption under constant temperature conditions [28]:
where V is the adsorption volume, cm3·g−1; VL is the maximum adsorption volume, cm3·g−1; PL is the Langmuir pressure, MPa; and P is the reservoir pressure, MPa.
Equal adsorption heat. The focus is primarily on quantifying the thermal changes that occur per unit mass when a sample undergoes gas adsorption or desorption. Through the determination of equivalent adsorption heat, the adsorptive properties of coal toward methane can be effectively assessed. This parameter is subsequently utilized within the Clausius–Clapeyron Equation [30], as follows:
where is the equivalent adsorption heat, kJ·mol−1; R is the gas constant; T is the temperature, K.
By integrating Equation (2), Equation (3) is derived, as follows:
4. Results and Discussion
4.1. Coal Sample Types Using Coal Rank and Sub-Macerals
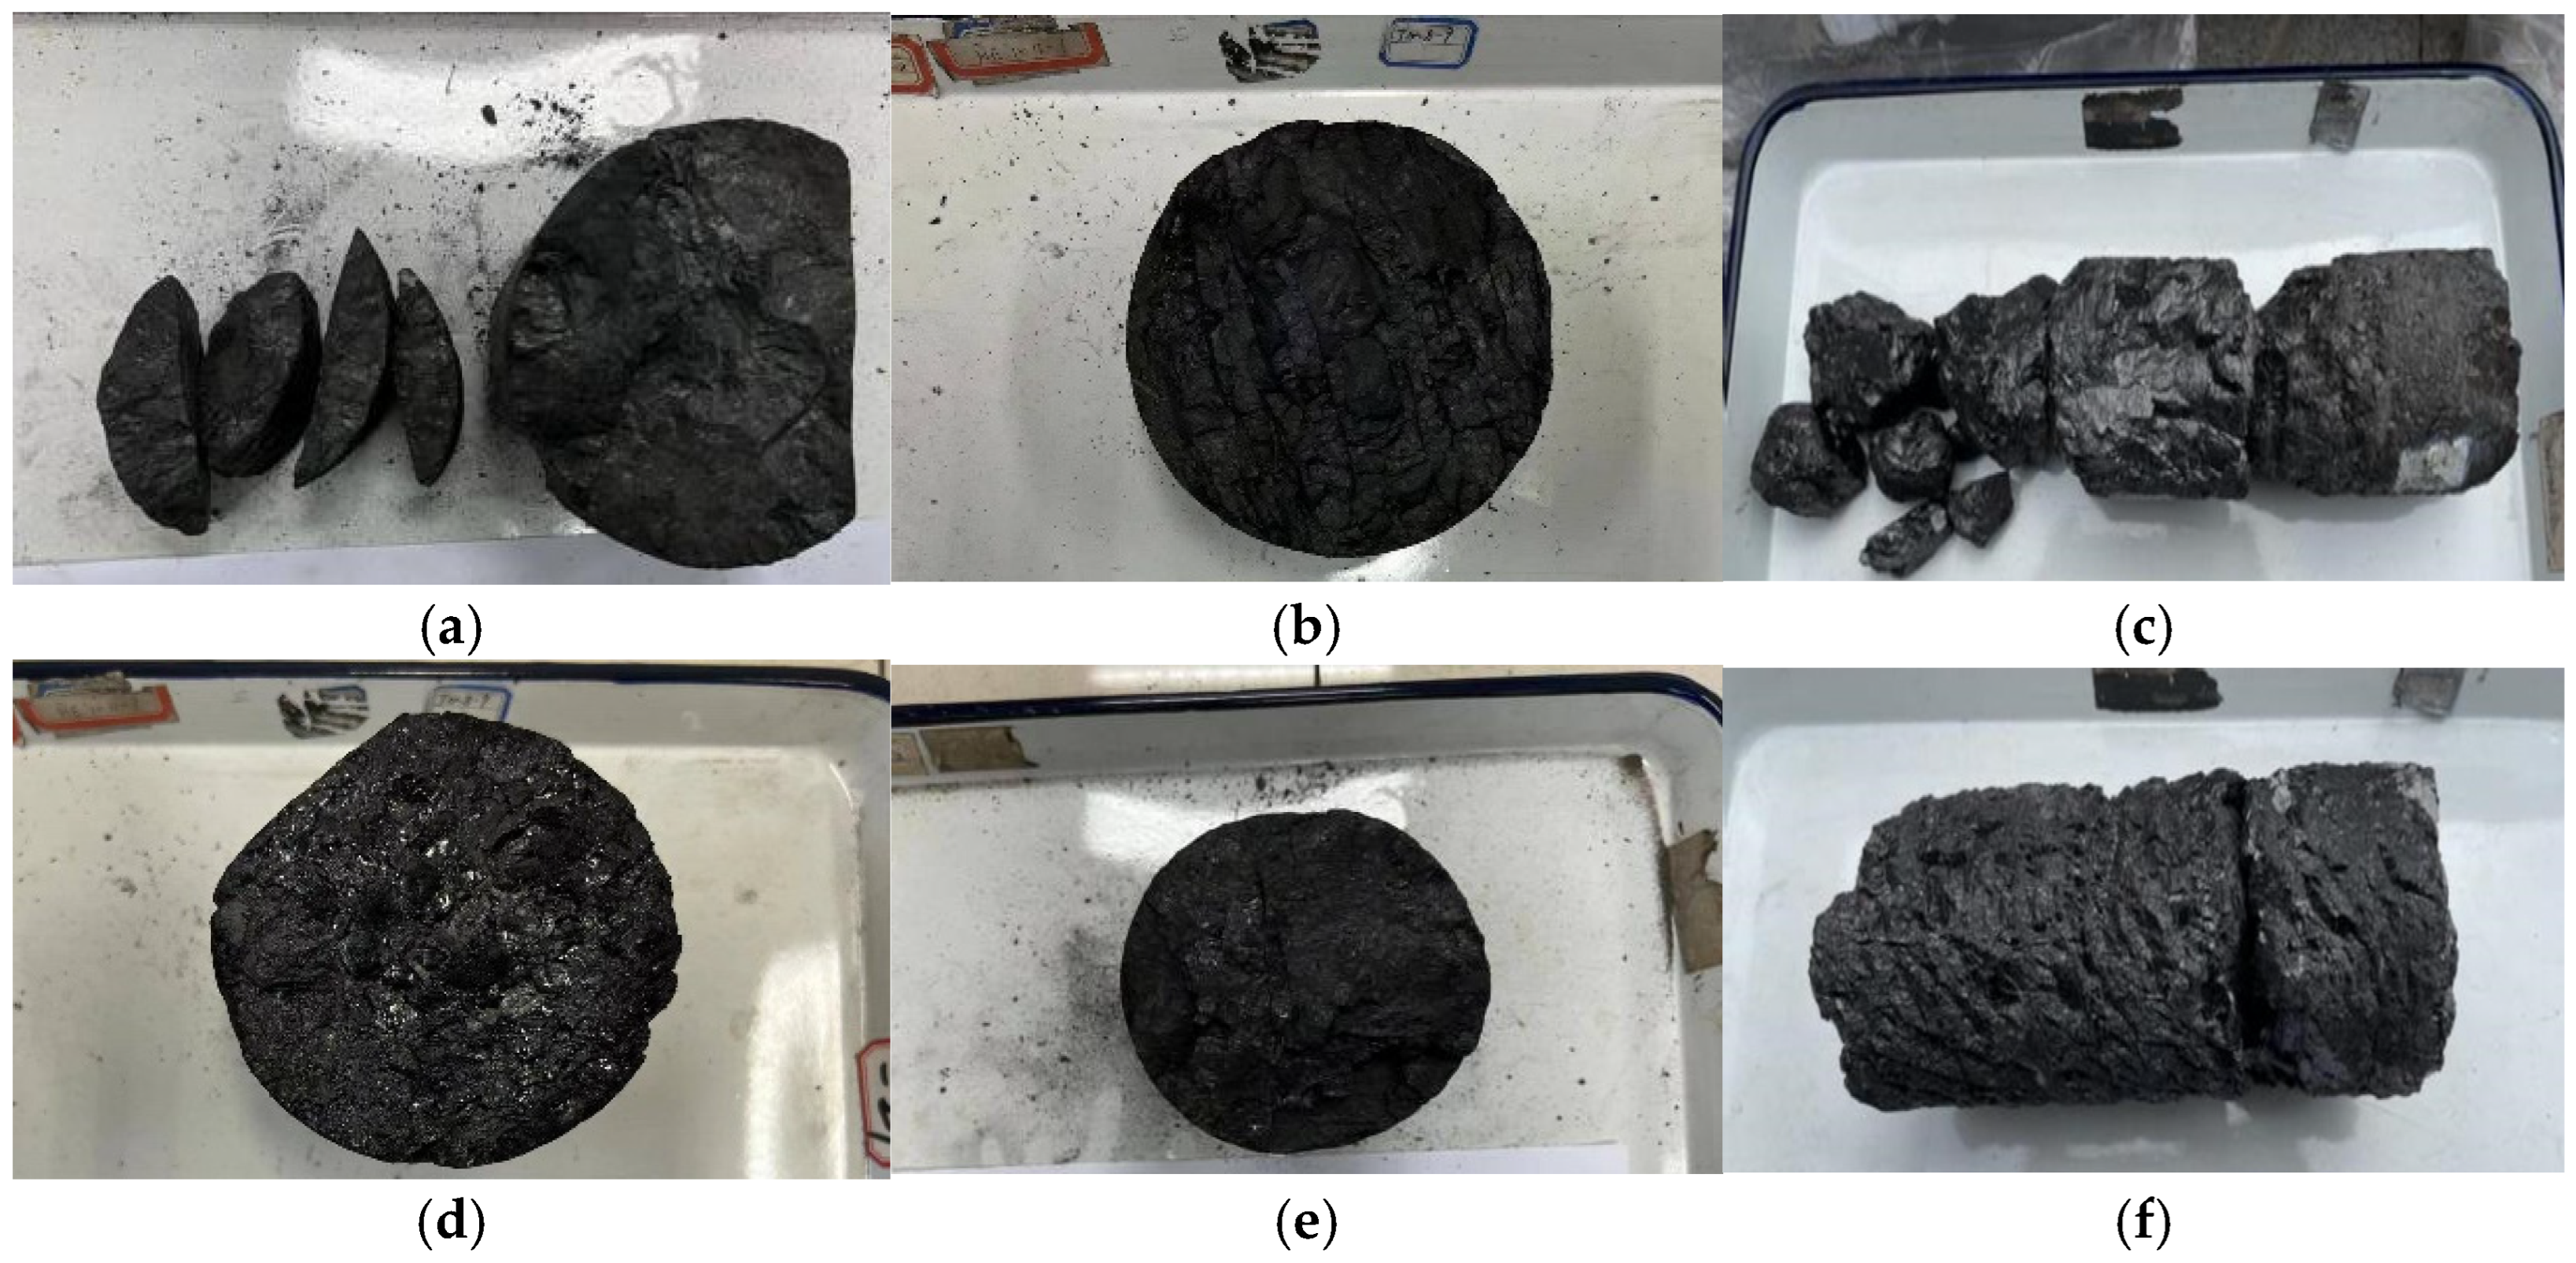
Naked eye observations of hand specimens indicated that the coal structures of the selected samples were mostly intact (Figure 2), but it should be noted that sample M16 was broken into granular, mostly fragmented, and granular coal. This indicated that some areas in the region are subjected to tectonic compressive stress, leading to a relatively fragmented coal structure. At the same time, the selected samples were semi-dark and semi-bright coal in terms of macroscopic coal rock composition, which was mainly due to the fact that the sub-macerals of this type of sample mostly develop inertinite dominated by semi-filamentous bodies (Figure 3). On the whole, the quality of this kind of coal was medium. Primary structure was the main structure of the samples, and tectonic structure was developed occasionally. The main macro coal components were semi-dark and semi-bright coal, and the coal seam structure was without gangue. In general, the coal seam development was relatively continuous.
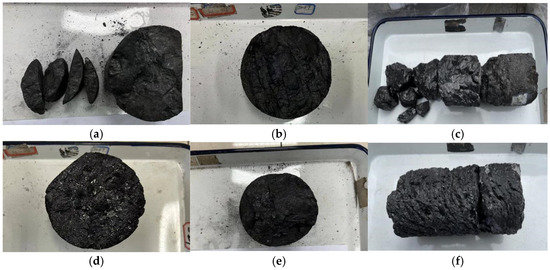
Figure 2.
Typical macroscopic coal rock types and coal body structures of coal samples. (a) Sample M2, semi-dull coal; (b) sample M5, semi-dull coal and primary structure coal; (c) sample M8, semi-bright coal and fragmented coal; (d) sample M10, semi-bright coal and primary structure coal; (e) sample M13, semi-dull coal and primary structure coal; (f) sample M16, semi-dull coal and mylonite coal.
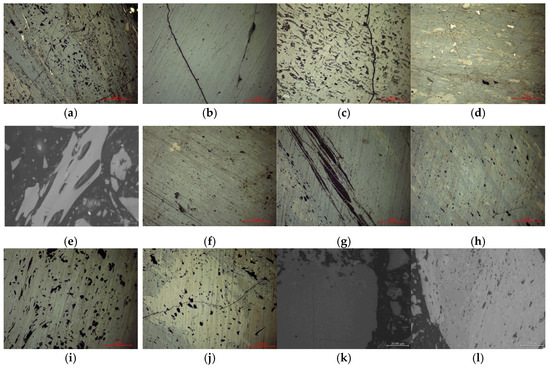
Figure 3.
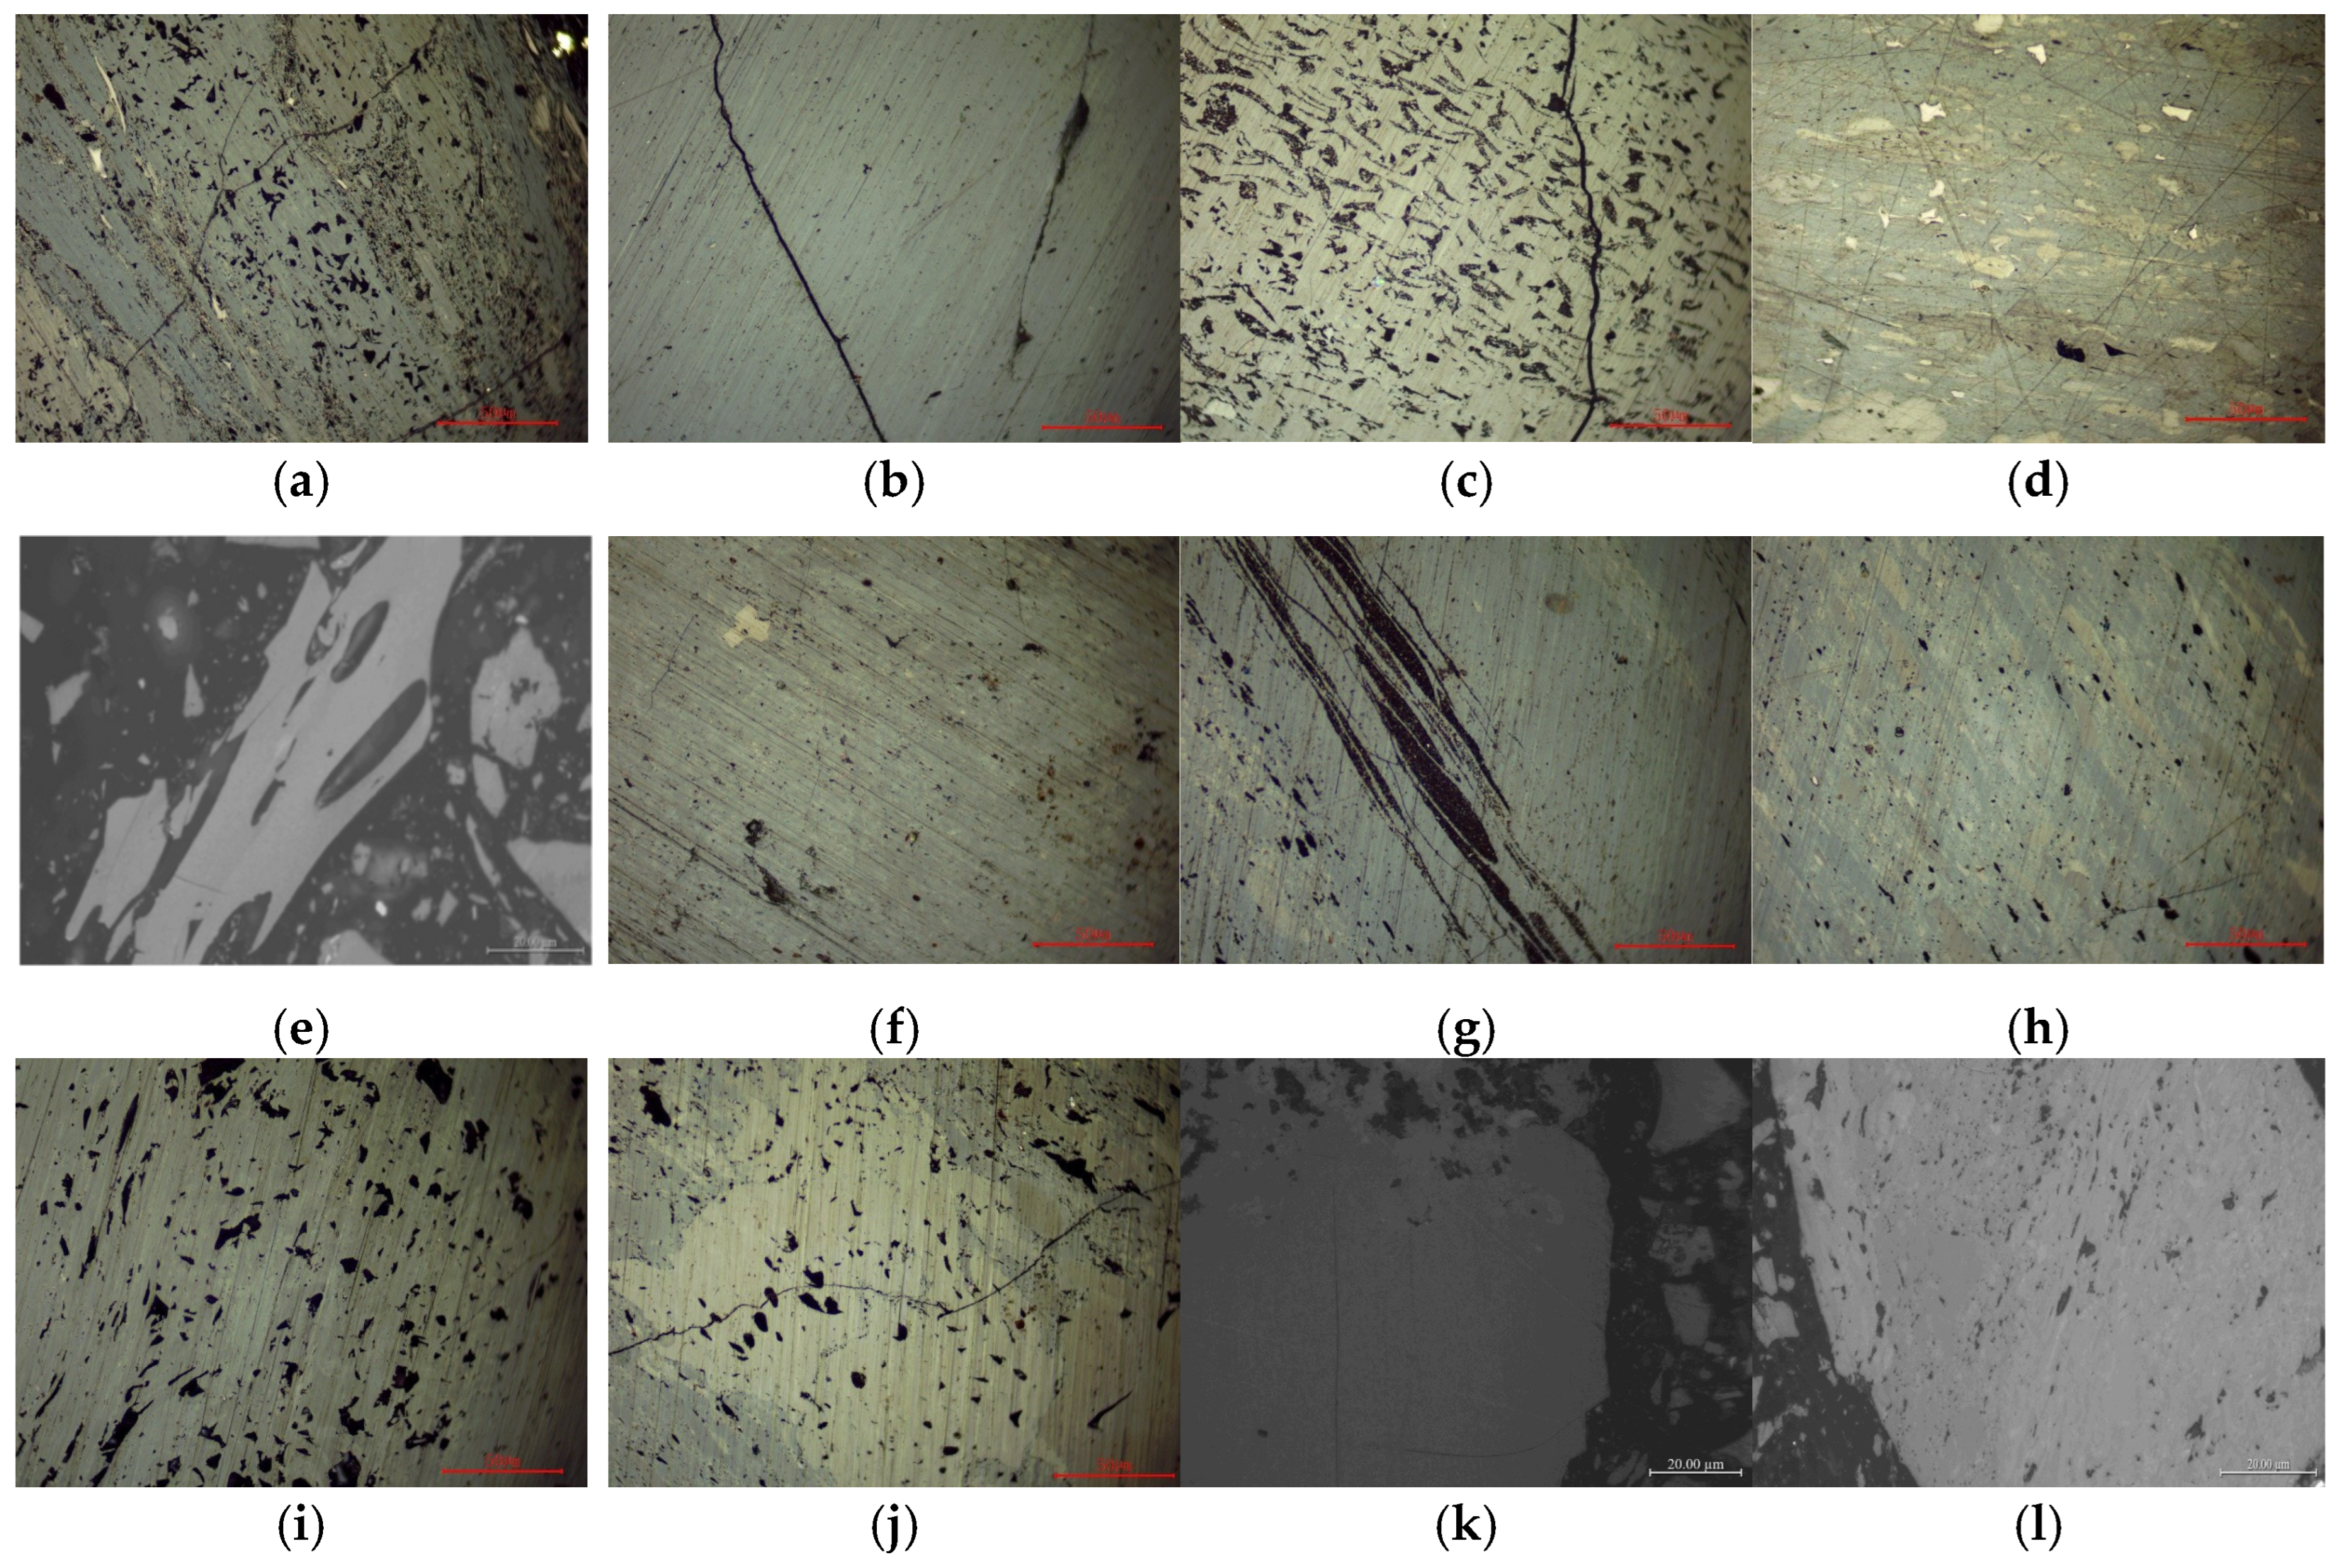
Microscopic features of submicroscopic components. (a) sample M5, telinite; (b) sample M4, homogenous vitrinite; (c) sample M1, semi-fusinite; (d) sample M2, matrix vitrinite and cemented clastic inertinite; (e) sample M8, semi-fusinite; (f) sample M10, matrix vitrinite; (g) sample M9, structural vitrinite and clay-filled cell cavity; (h) sample M9, matrix vitrinite and cemented clastic inertinite; (i) sample M13, structural vitrinite 2; (j) sample M13, semi-fusinite; (k) sample M14, homogenous vitrinite; (l) sample M16, matrix vitrinite with cemented banded semi-filamentous bodies, coarse particles, and clay minerals.
The microscopic observations of the submicroscopic components indicated that there were occasionally macroscopic fissures in the selected samples (Figure 3b), which were mainly developed in homogeneous vitrinite. In general, the submicroscopic components of the samples were mainly vitrinite, followed by inertinite, and less exinite. Homogeneous vitrinite was the main submicroscopic component of the vitrinite (Figure 3a–d). In the inertinite group, most of them were filled with silk bodies and semi-silk bodies, which were mostly filled with homogeneous vitrinite in the form of cavities (Figure 3e–h). It should be noted that most of the submicroscopic components such as silk bodies and semi-silk bodies were filled with homogeneous vitrinite.
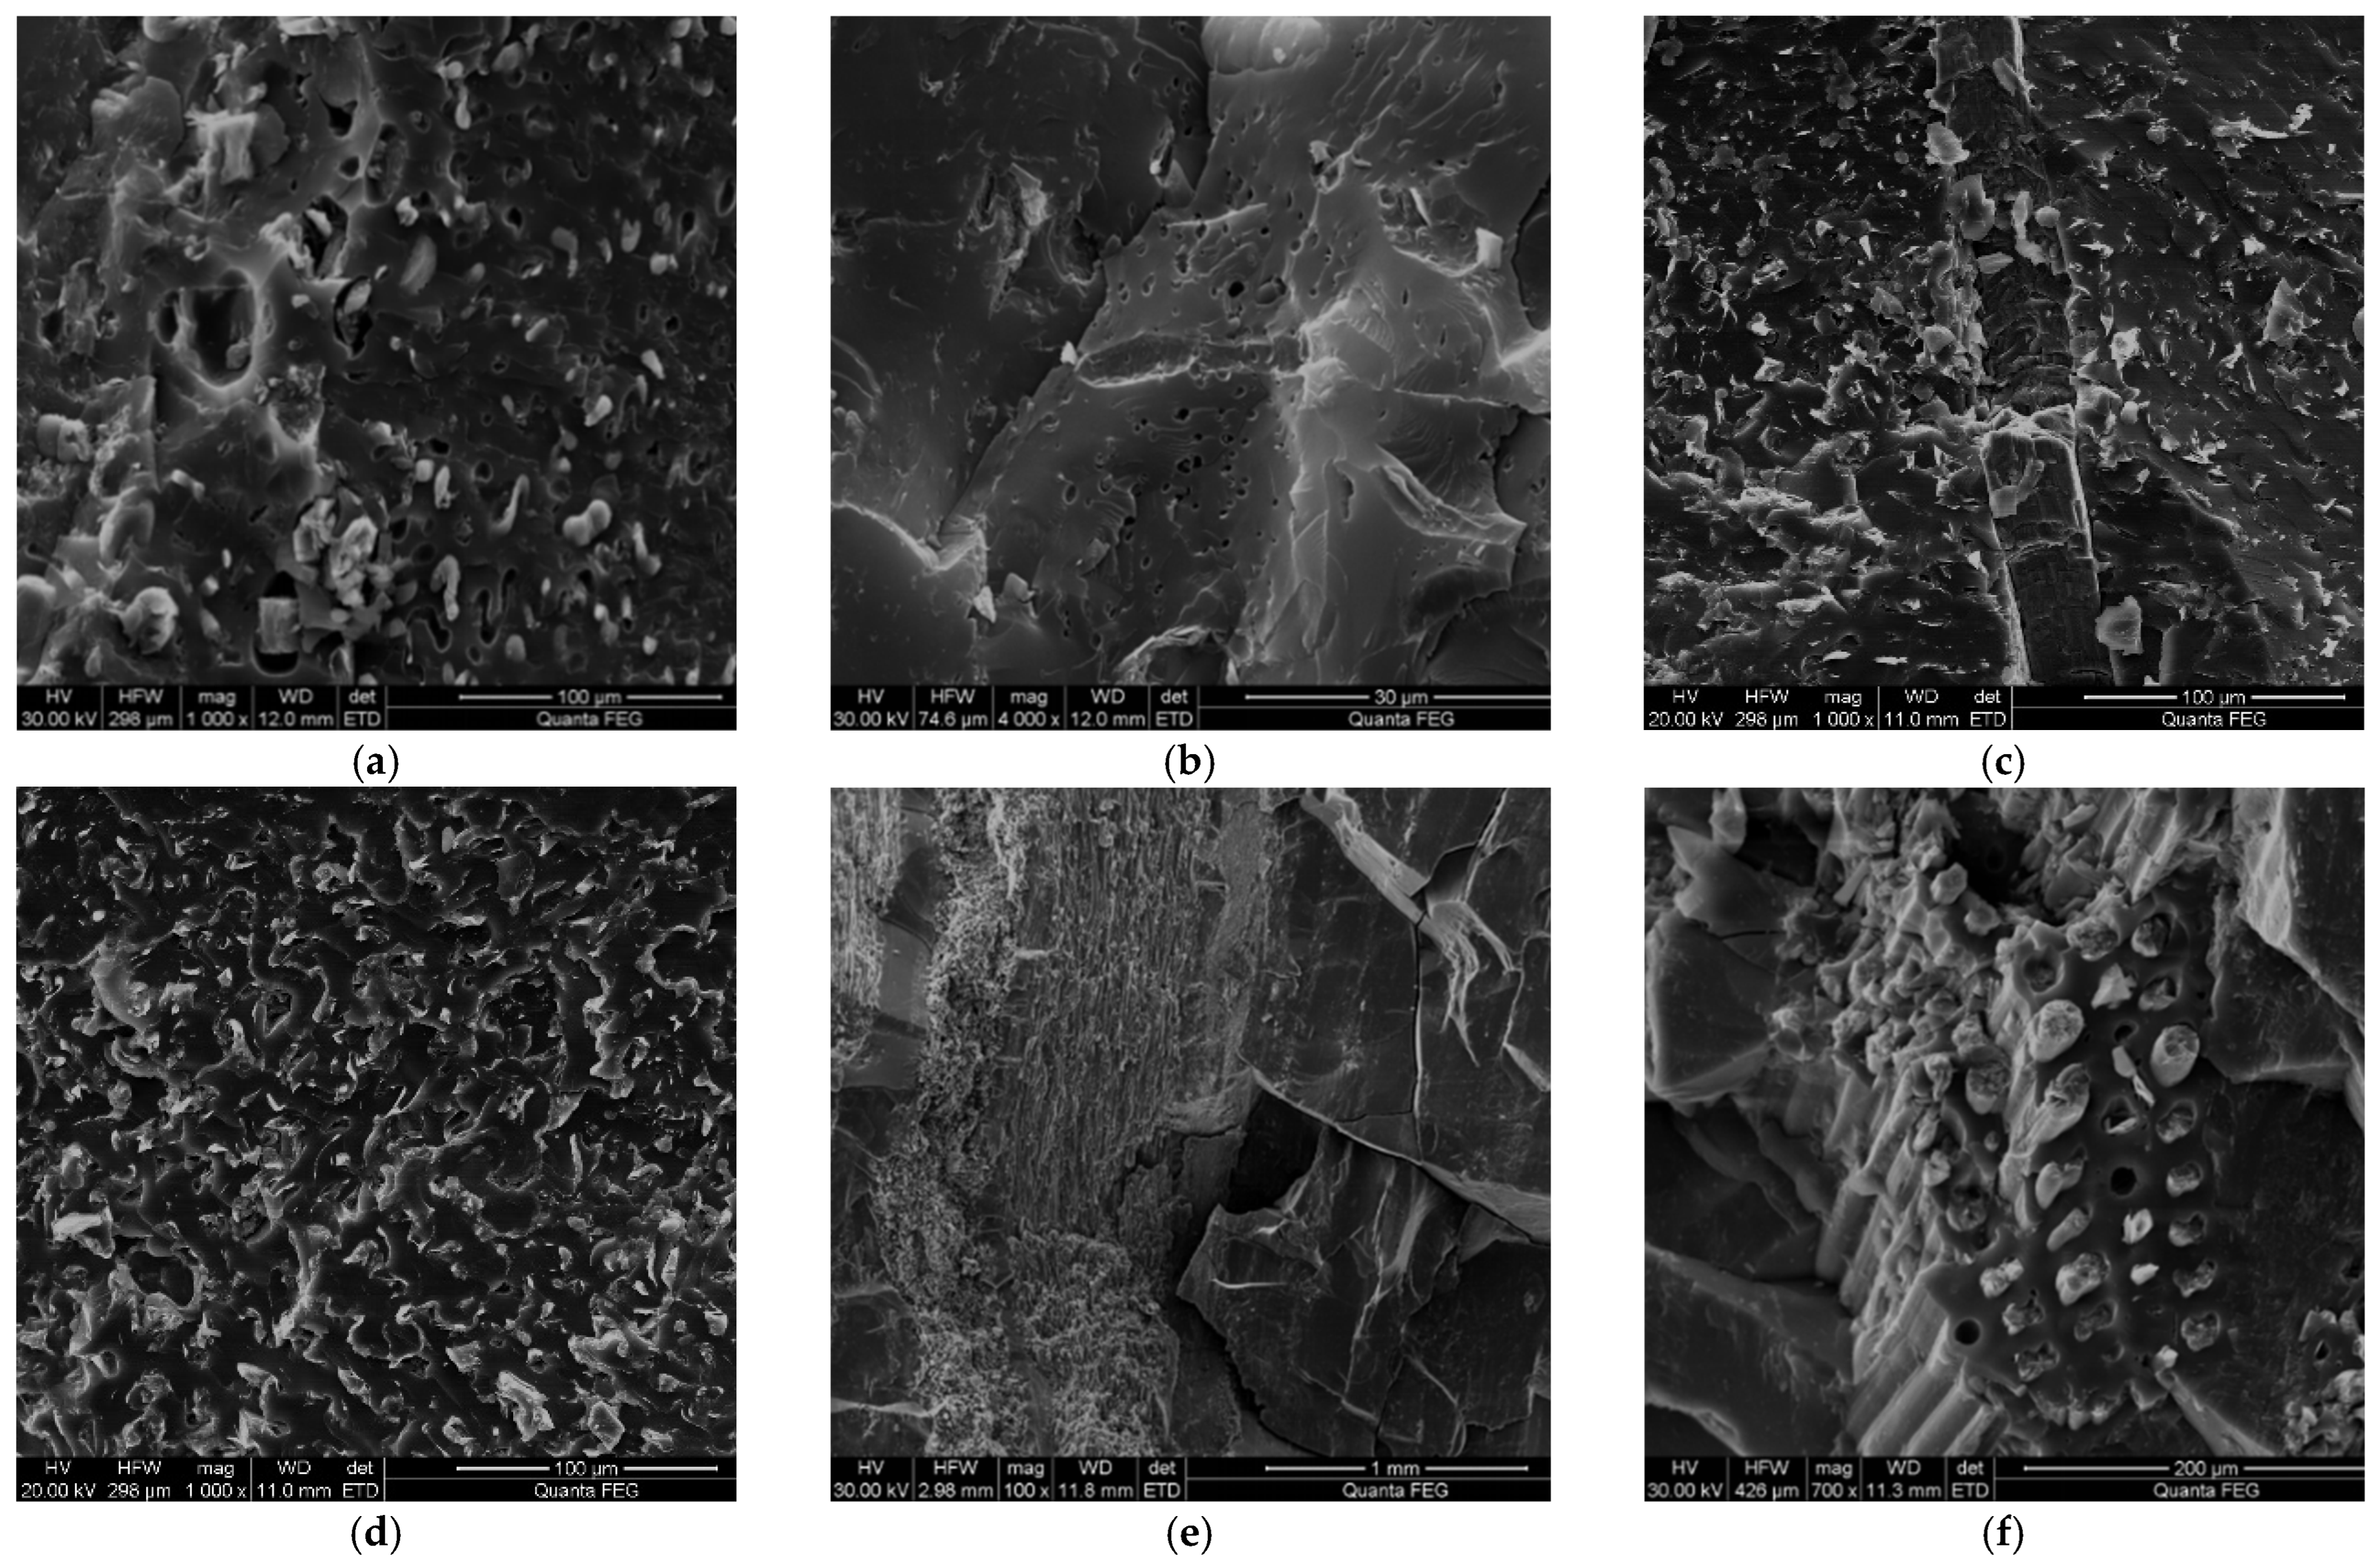
Based on the experimental results of the SEM analysis, the porosity and mold hole can be observed in Figure 4a. A developed stomatal group, short fissures, can be observed in Figure 4b. Hydrostatic fractures can be observed in Figure 4c, as well as mineral-filled fractures. In Figure 4d, the deformed cavity pores are filled with clay, and stomata are occasionally seen. In Figure 4e, the bedding is visible, the fracture of the hydrostatic fracture, the fracture of the oblique bedding. Figure 4f shows that filamentous bodies remain in the cavity pores, and the cavity pores are mostly filled with clay.
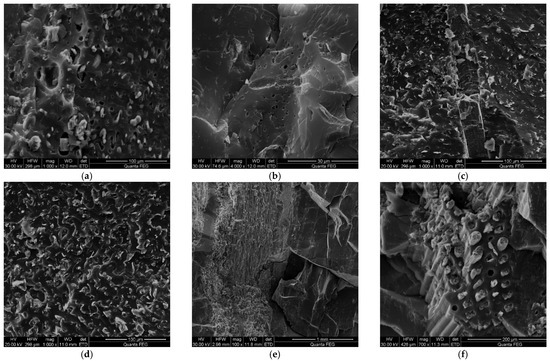
Figure 4.
The development characteristics of pores and fractures observed under SEM (a–f).
To achieve a refined description of coal lithological quality and nanoporous structure under different coal ranks and industrial components, the samples were classified according to Ro,max. The samples M1 to M5 were Type A, and Ro,max ranged from 1.68 to 1.79%. Samples M6 to M12 belonged to Type B, and the range of Ro,max was 1.88~1.97%. The samples M13 to M16 belonged to Type C, and the range of Ro,max was 2.01~2.72%.
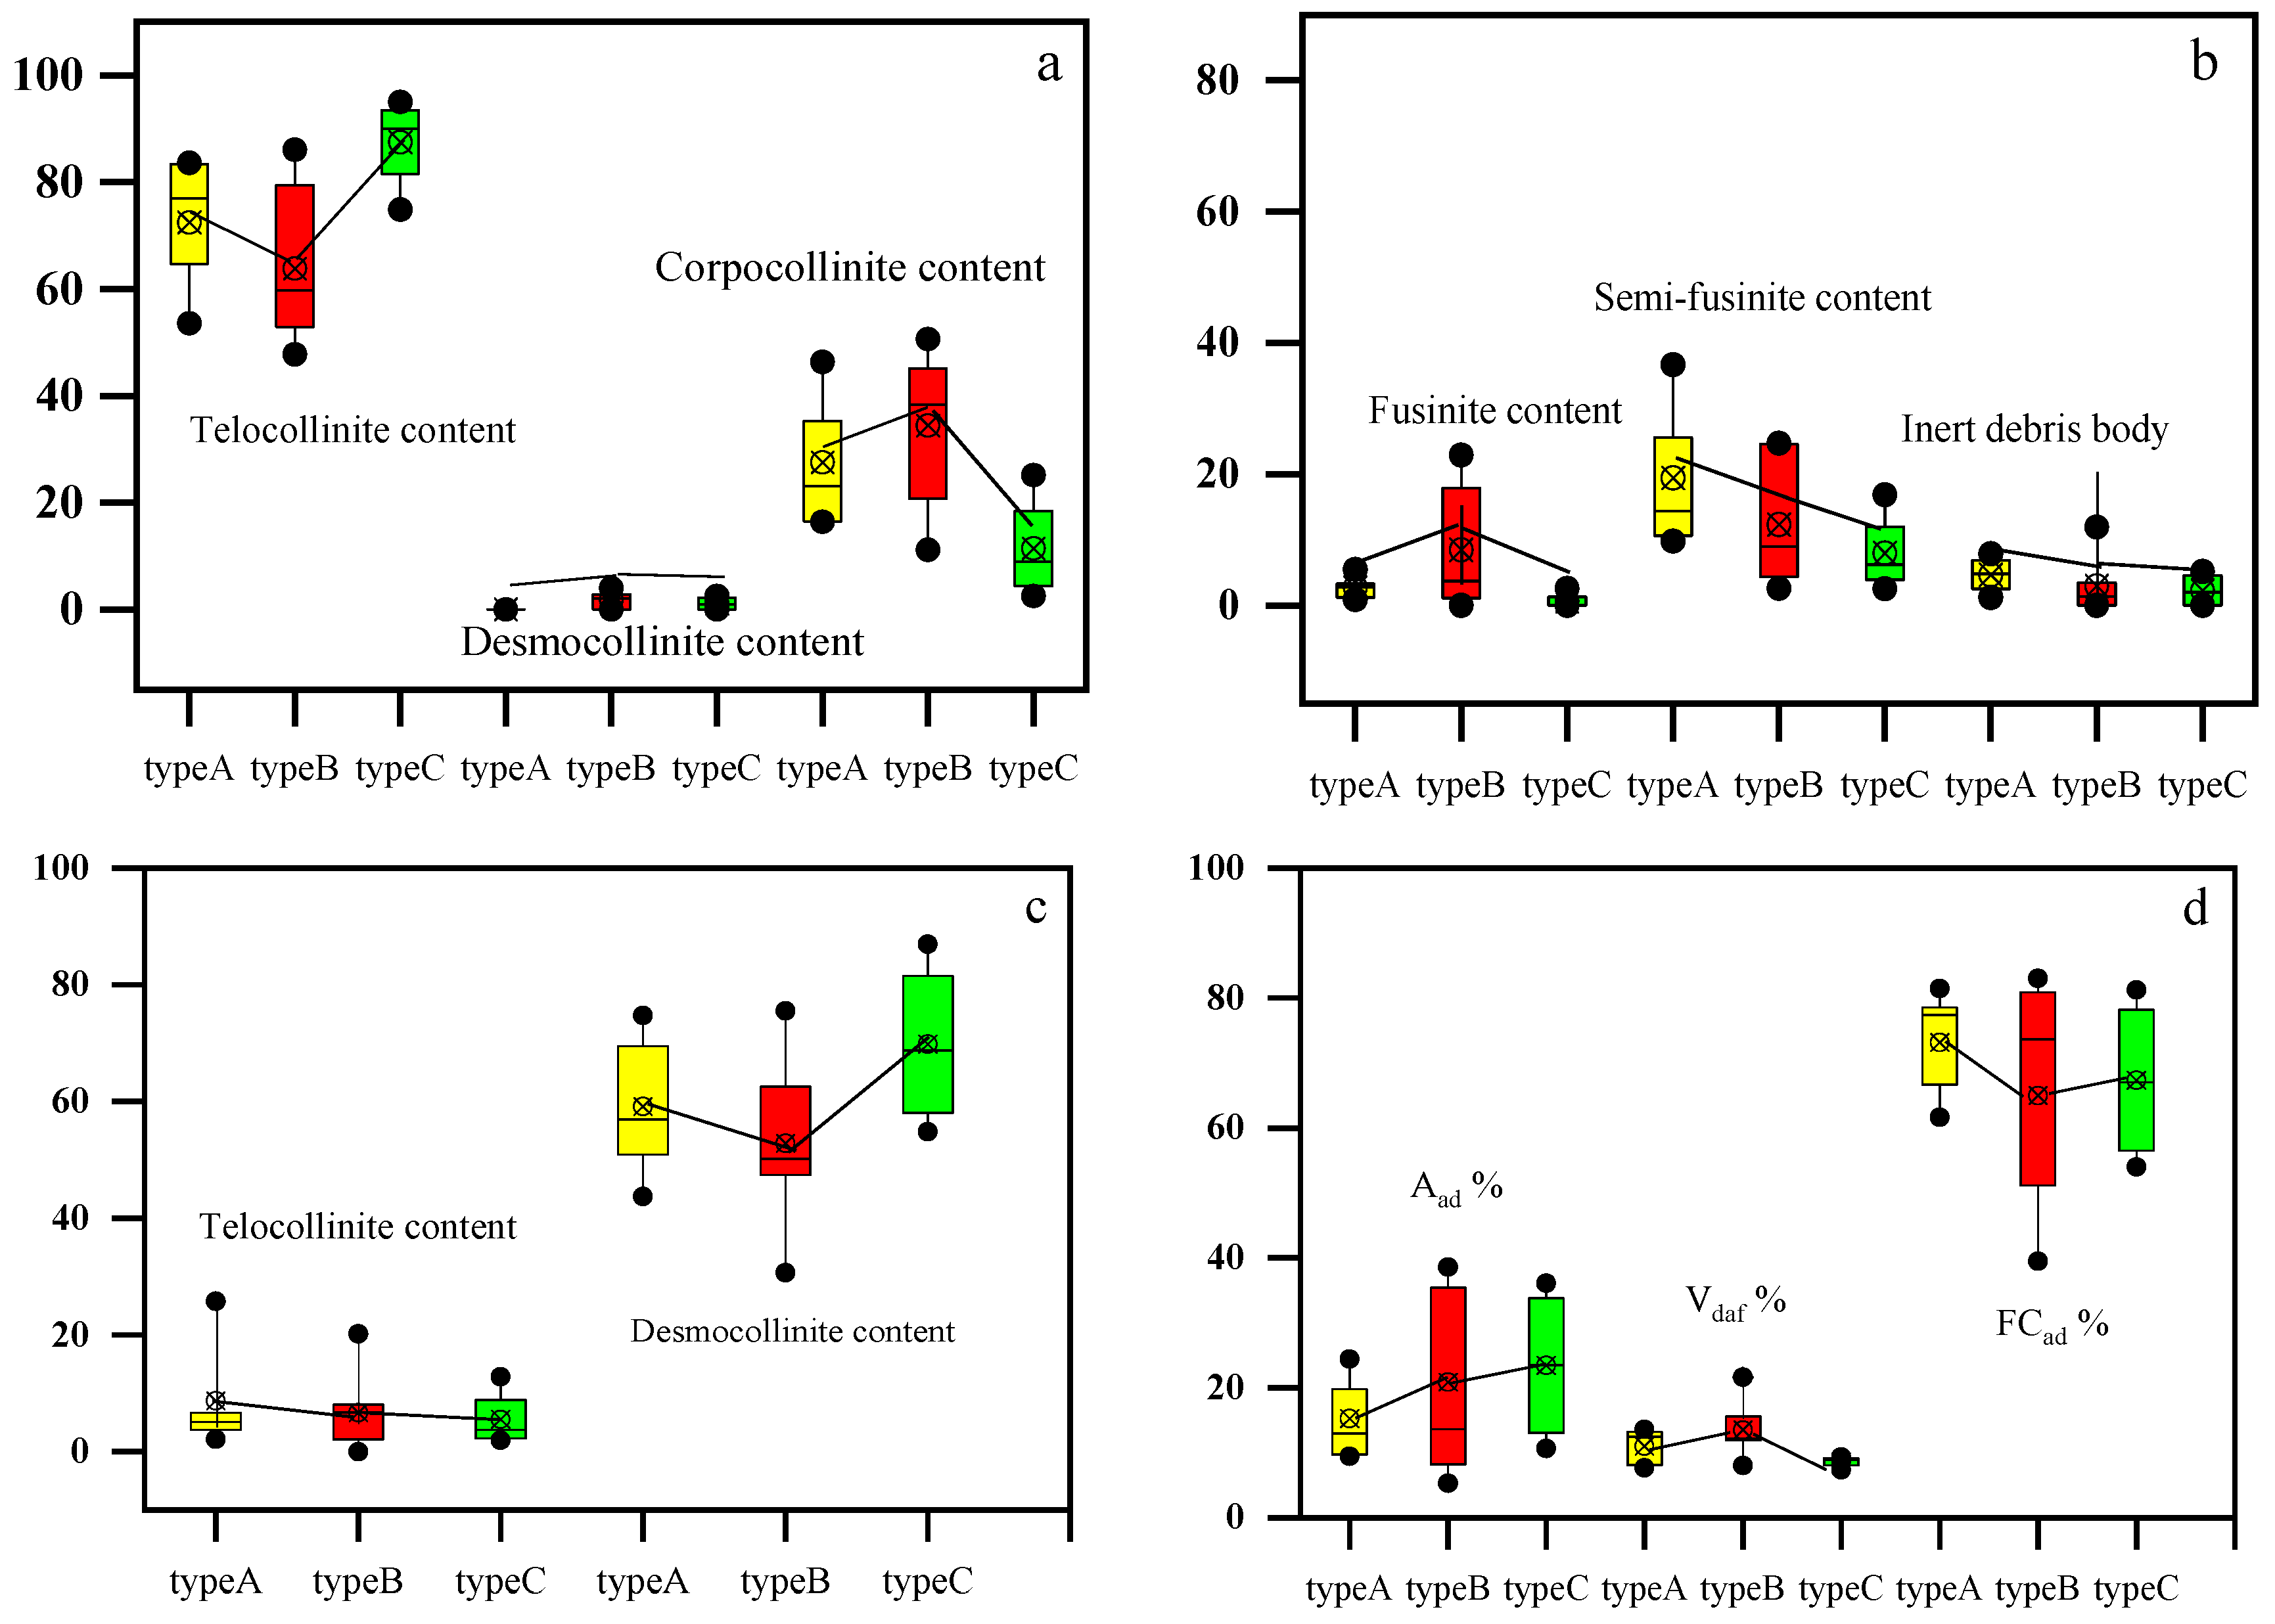
The statistical structure indicated that (Figure 5), there were significant differences in the submicroscopic groups between the different types of samples. First of all, compared with Type A and Type B, the vitrinite content of Type C was the highest, but the inertinite content was the lowest. The content of Type B vitrinite was the lowest, and the content of inertinite was the highest. The exinite content of the three types of samples was less, and the difference was not obvious. Secondly, compared with Type A and Type C, the plastid content of Type B was the highest and semi-plastid content decreased with the increase in Ro,max. The inert debris content in the three types of samples was not high and the difference was not obvious. At the same time, the mass vitrinite content was low, and the difference was not obvious. However, the vitrinite content in the matrix was significantly different, with the highest content in Type C and the lowest content in Type B.
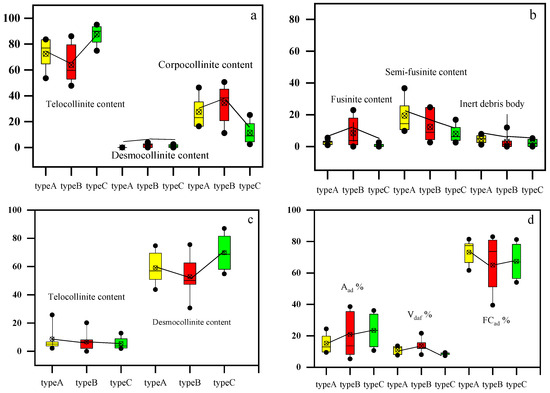
Figure 5.
The content of macerals, sub-macerals, and industrial components in coal samples collected from three types (a–d).
It should be noted that there were significant differences in ash content among different samples. The ash content of Type A was mostly distributed between 10 and 20%. Compared with Type A, the ash contents of Type B and Type C were significantly different. This also fully indicated that Ro,max had no correlation with the industrial components.
4.2. Adsorption Pore Distribution Heterogeneity Using Pore Structure Experiments
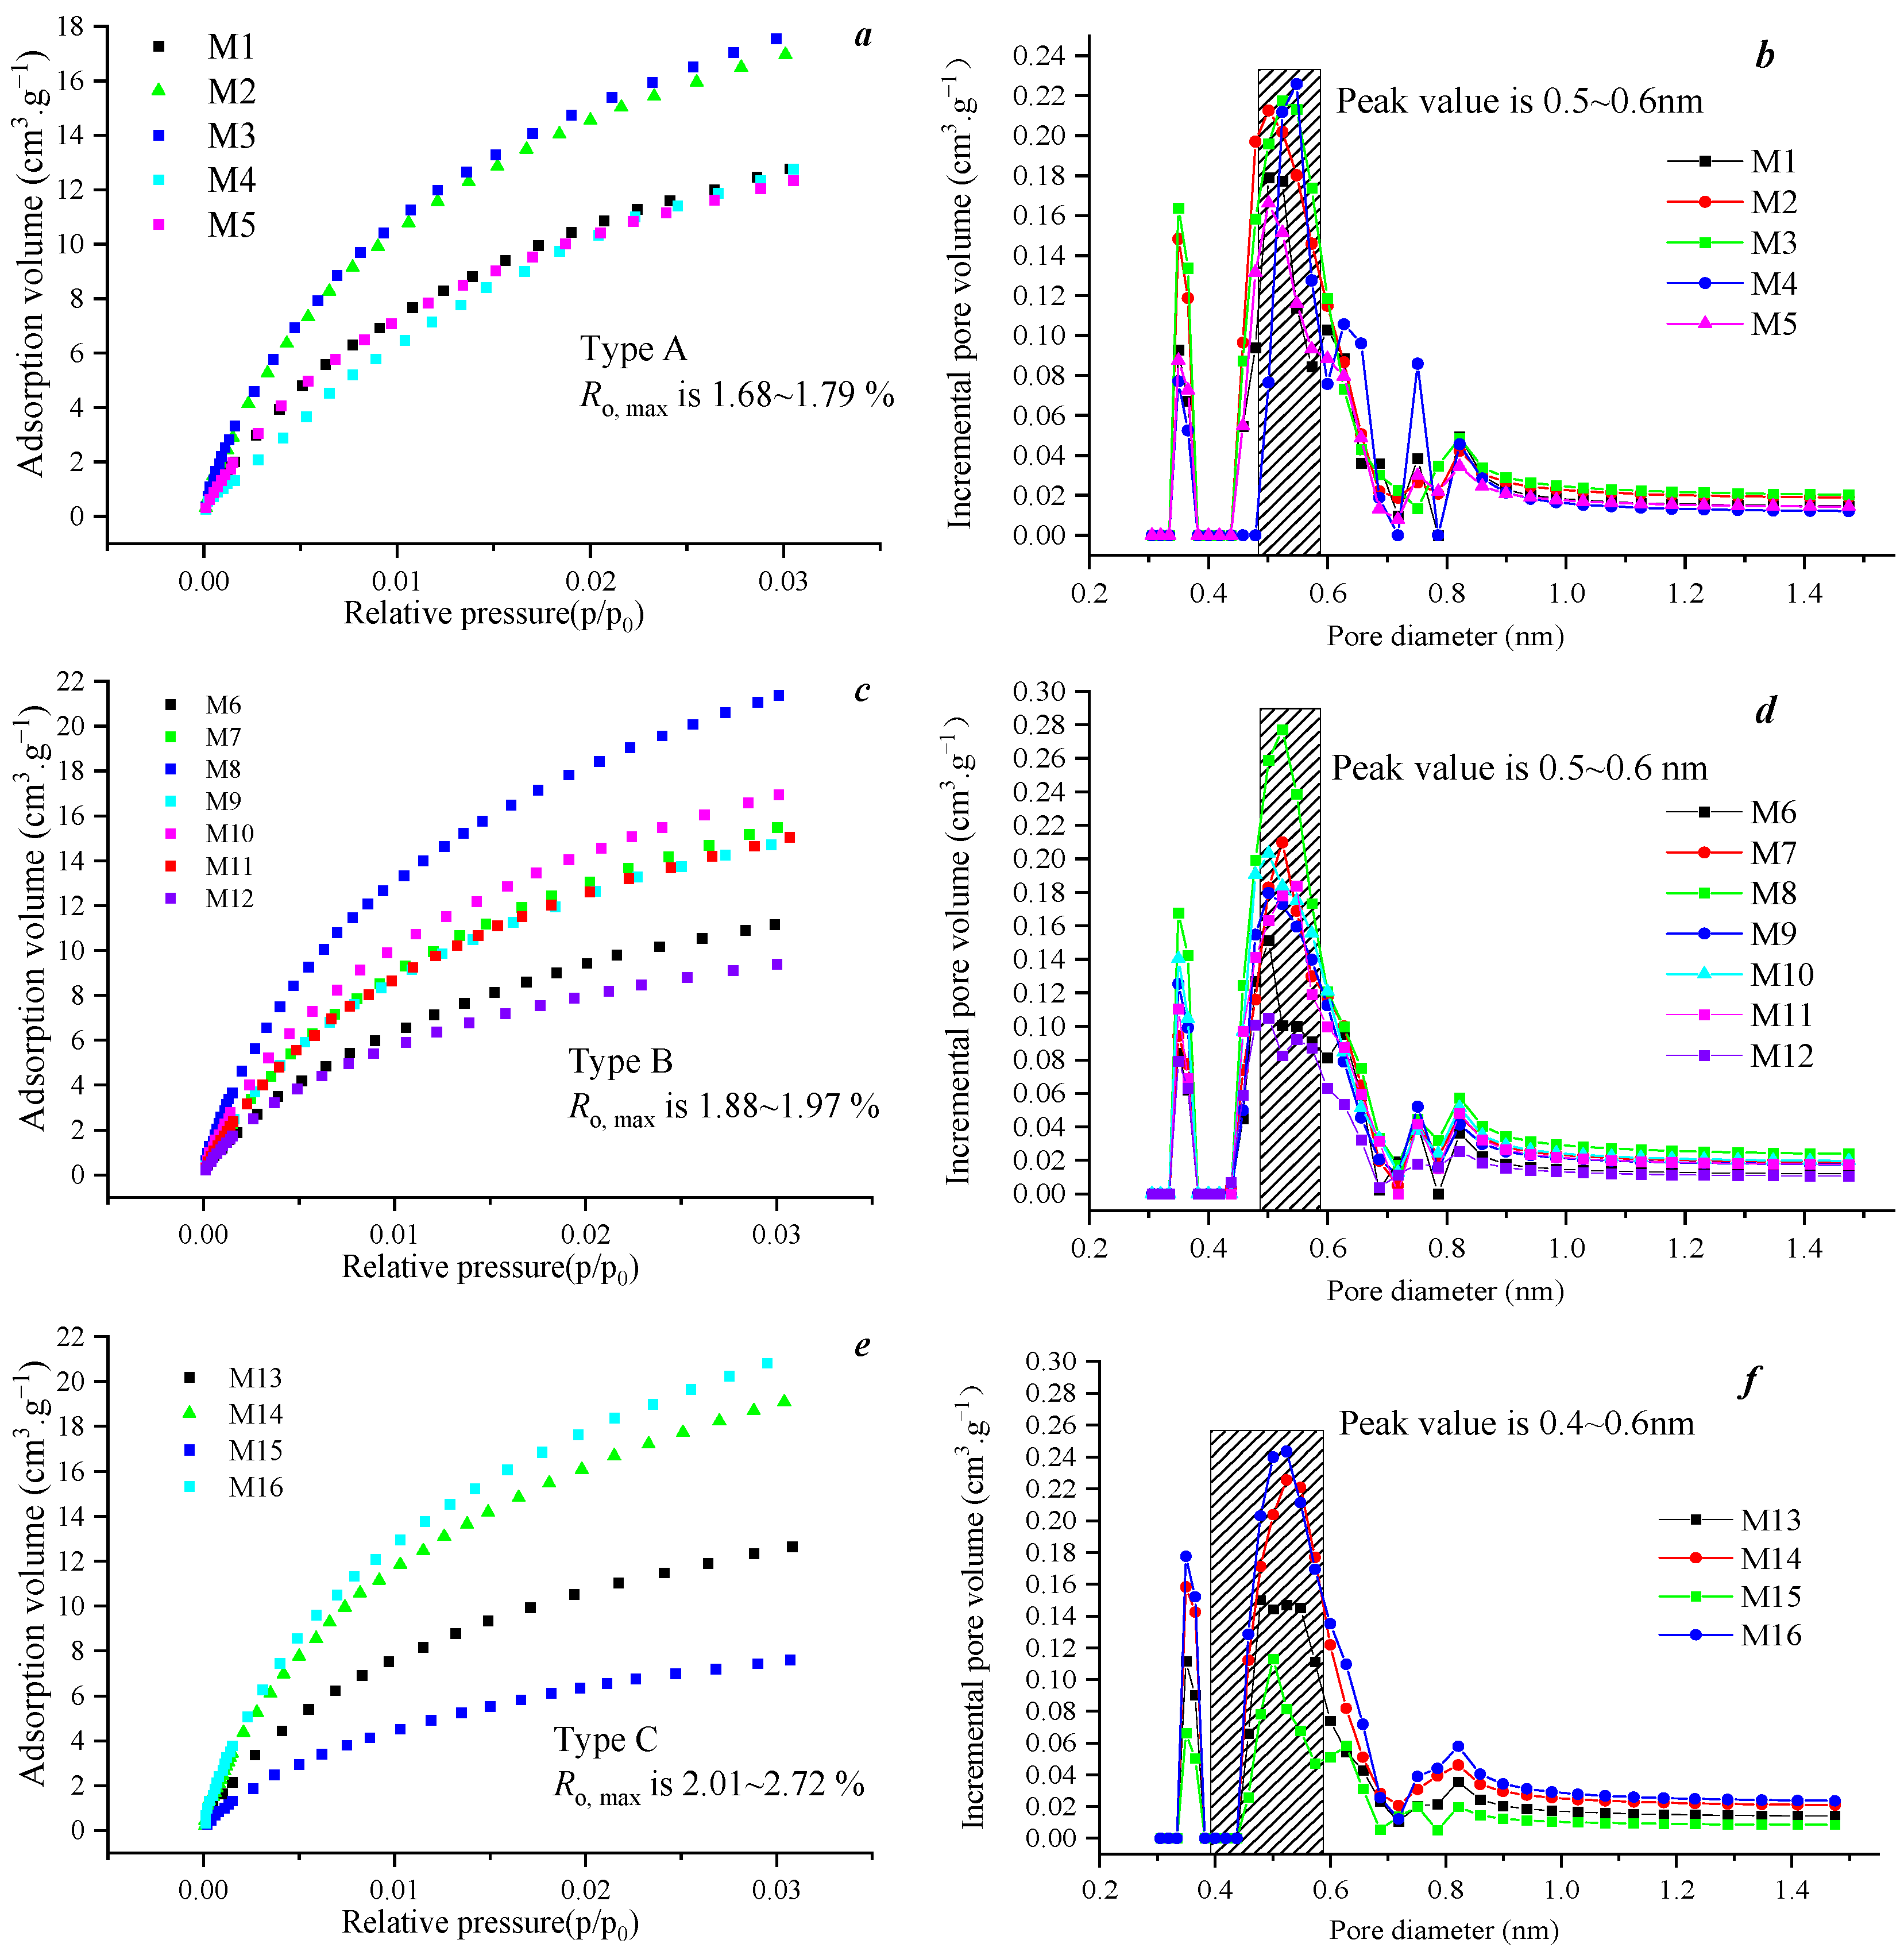
The results of the characterization experiment of micropores based on CO2 isothermal adsorption are shown in Figure 6. Figure 6a indicates that the maximum CO2 adsorption capacity of the sample was 10~18 m3/g, and the micropore pore size distribution indicated an obvious three-peak state, with 0.5–0.6 nm as the main pore size. Different from Type A samples, the maximum CO2 adsorption capacity of Type B samples was 8~20 m3/g, and the maximum CO2 adsorption capacity of each sample was quite different, which was mainly due to the large difference in industrial components (ash content) in this kind of sample (Figure 6d). The pore size distribution of these samples indicated a weak three-peak state, which was dominated by a two-peak state. In general, the main pore size was still 0.5–0.6 nm, but different from the Type A samples, the pore volume of the 0.5–0.6 nm pore size in these samples was mostly below 0.18 m3/g, which was smaller than Type A. There was a significant difference in the maximum CO2 adsorption capacity of Type C, which was between 4 and 18 m3/g. The pore morphology was weakly trimodal, but the main pore size varied. The above results indicated that coal rank was not the main factor affecting the pore size distribution of micropores.
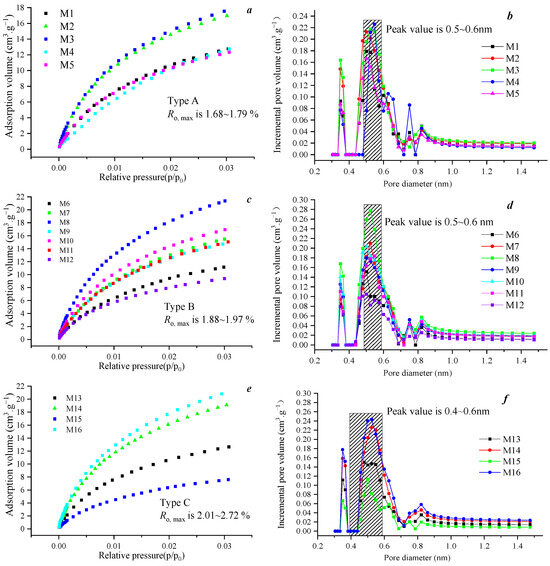
Figure 6.
CO2 adsorption curves for Type A, B, and C coal samples. Adsorption volume (measured in cm3/g) is plotted against pore diameter, categorized into three intervals (0.3–0.6 nm, 0.6–0.8 nm, and 0.8–1.5 nm) (a–f). The rectangular shade indicates the body aperture range (b,d,f).
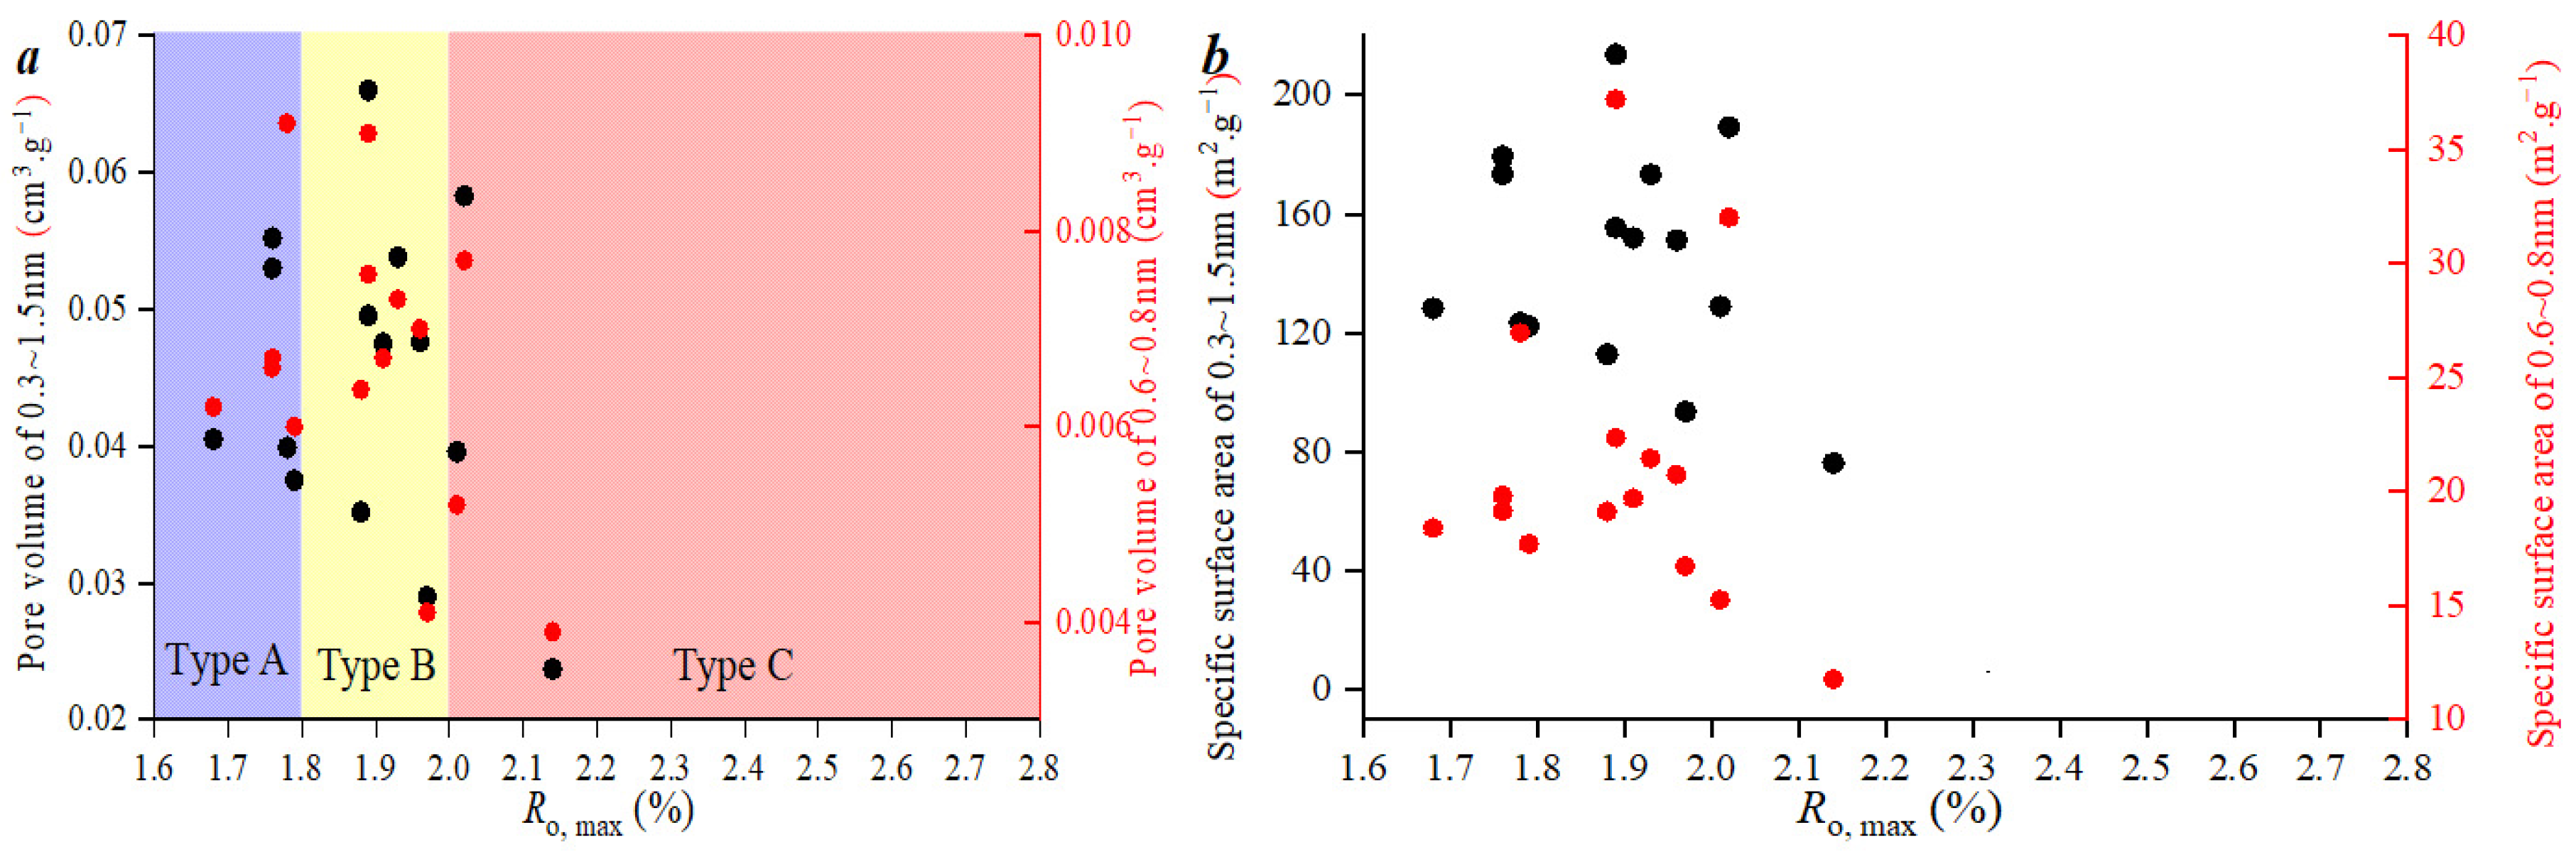
The statistical results indicated that there were obvious differences in the pore size distribution of different types of micropores. According to the pore size distribution (Figure 6b,d,f), the pore size distribution of micropores was bimodal or trimodal. According to the peak position, the micropores were divided into three pore size intervals of 0.3–0.6 nm, 0.6–0.8 nm, and 0.8–1.5 nm, with 0.6 nm and 0.8 nm as the boundary. By comparison, the pore volume of Type C was significantly higher than that of Type A and Type B, since the thermal evolution degree of coal in this kind of sample was higher, which led to the formation of more micropore space under the same conditions, but the law was not obvious. According to Figure 7b, there were also significant differences in the specific surface area and pore volume in different pore size distribution ranges. The overall performance was that the pore volume and pore specific surface area of 0.6–0.8 nm in Type A were lower than those in other two types, but the pore volume of 0.8–1.5 nm was weakly matched with the samples. This indicated that the pore sizes in this part were not solely controlled by the degree of coal metamorphism. Similar phenomena were observed in the pore size ranges of 0.6–0.8 nm and 0.8–1.5 nm.
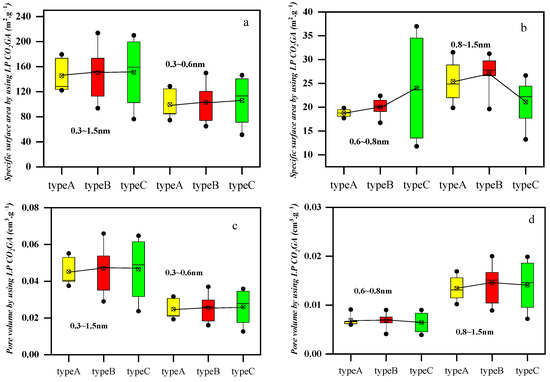
Figure 7.
Different coal rank coal samples’ meso-PV and SSA (a–d).
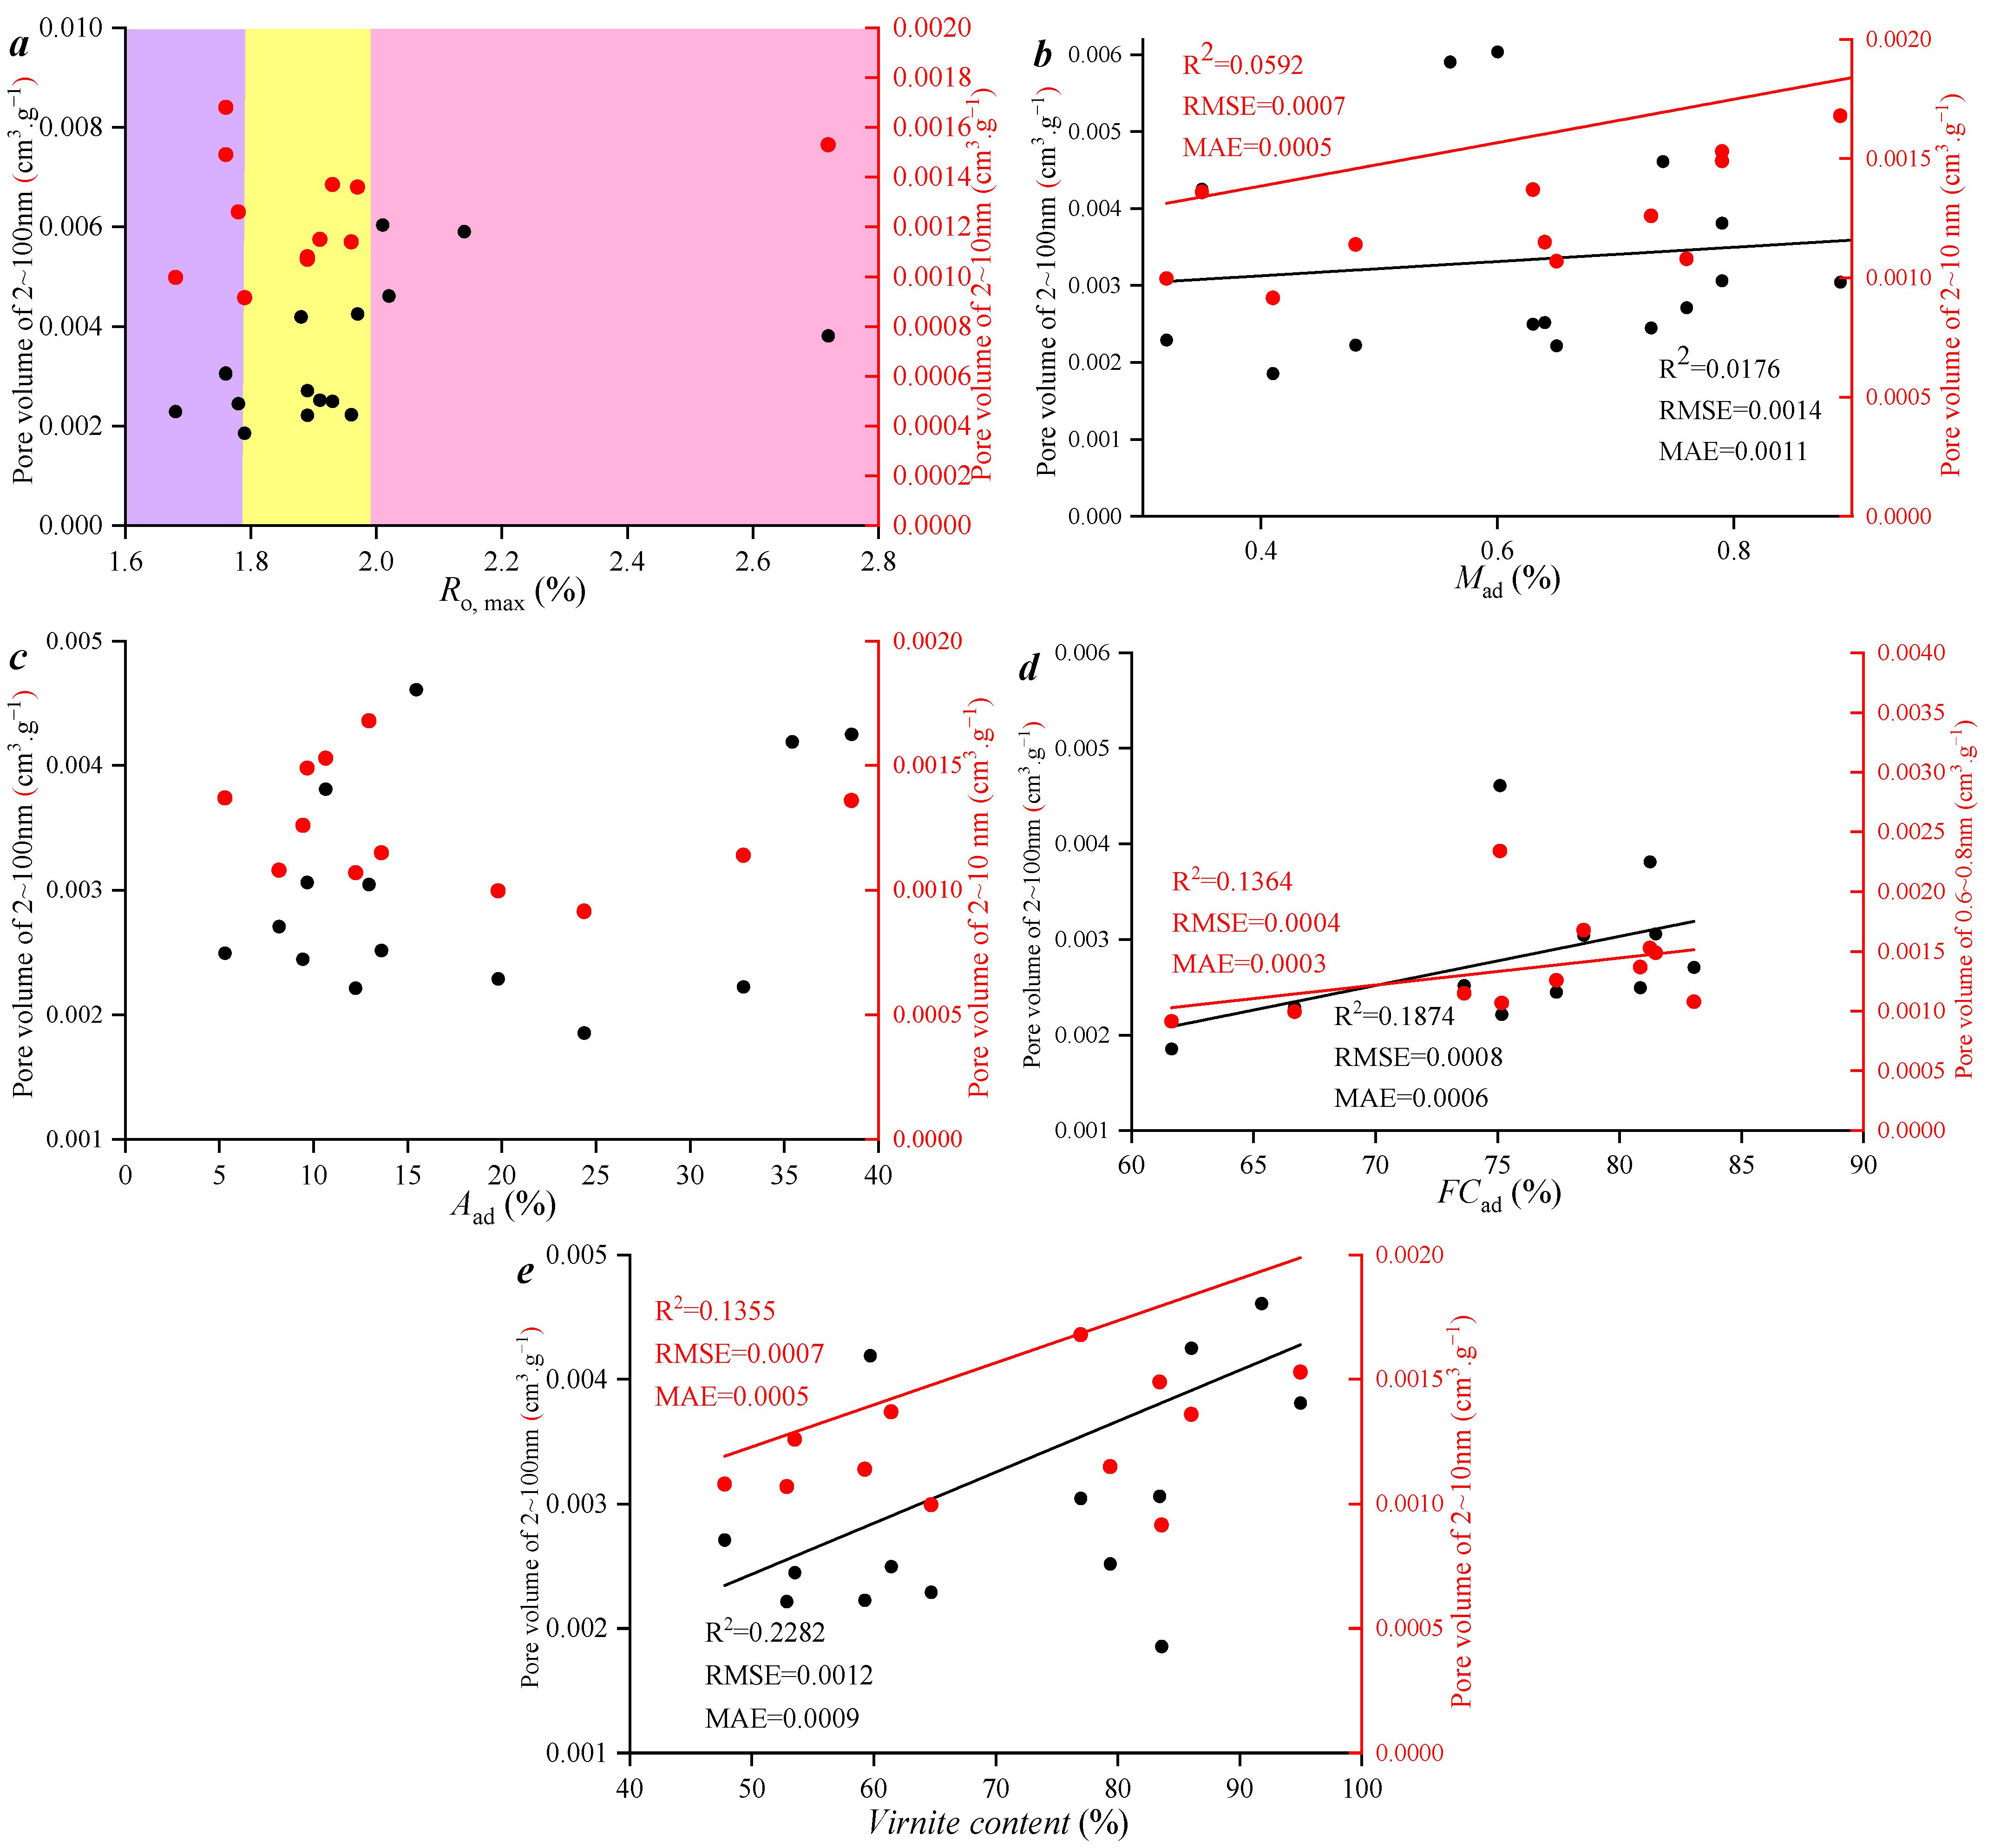
Based on the results of the LPCO2 GA test (Figure 8), the pore volume of micropores decreased with the increase in Ro,max. It should be noted that when Ro,max was lower than 2.0, the correlation between Ro,max and micropore volume was weak, since it was also related to the large difference in ash content between different types. Similarly, the correlation between Ro,max and pore volume in different pore size stages (0.6–0.8 nm) was weak, which fully indicated that the coal rank of the selected samples in the study area was not the main controlling factor affecting the pore volume of micropores.
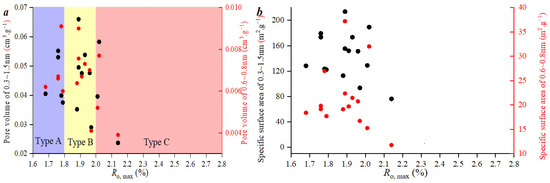
Figure 8.
Relationship between Ro,max and micropore volume (a) and specific surface area (b).
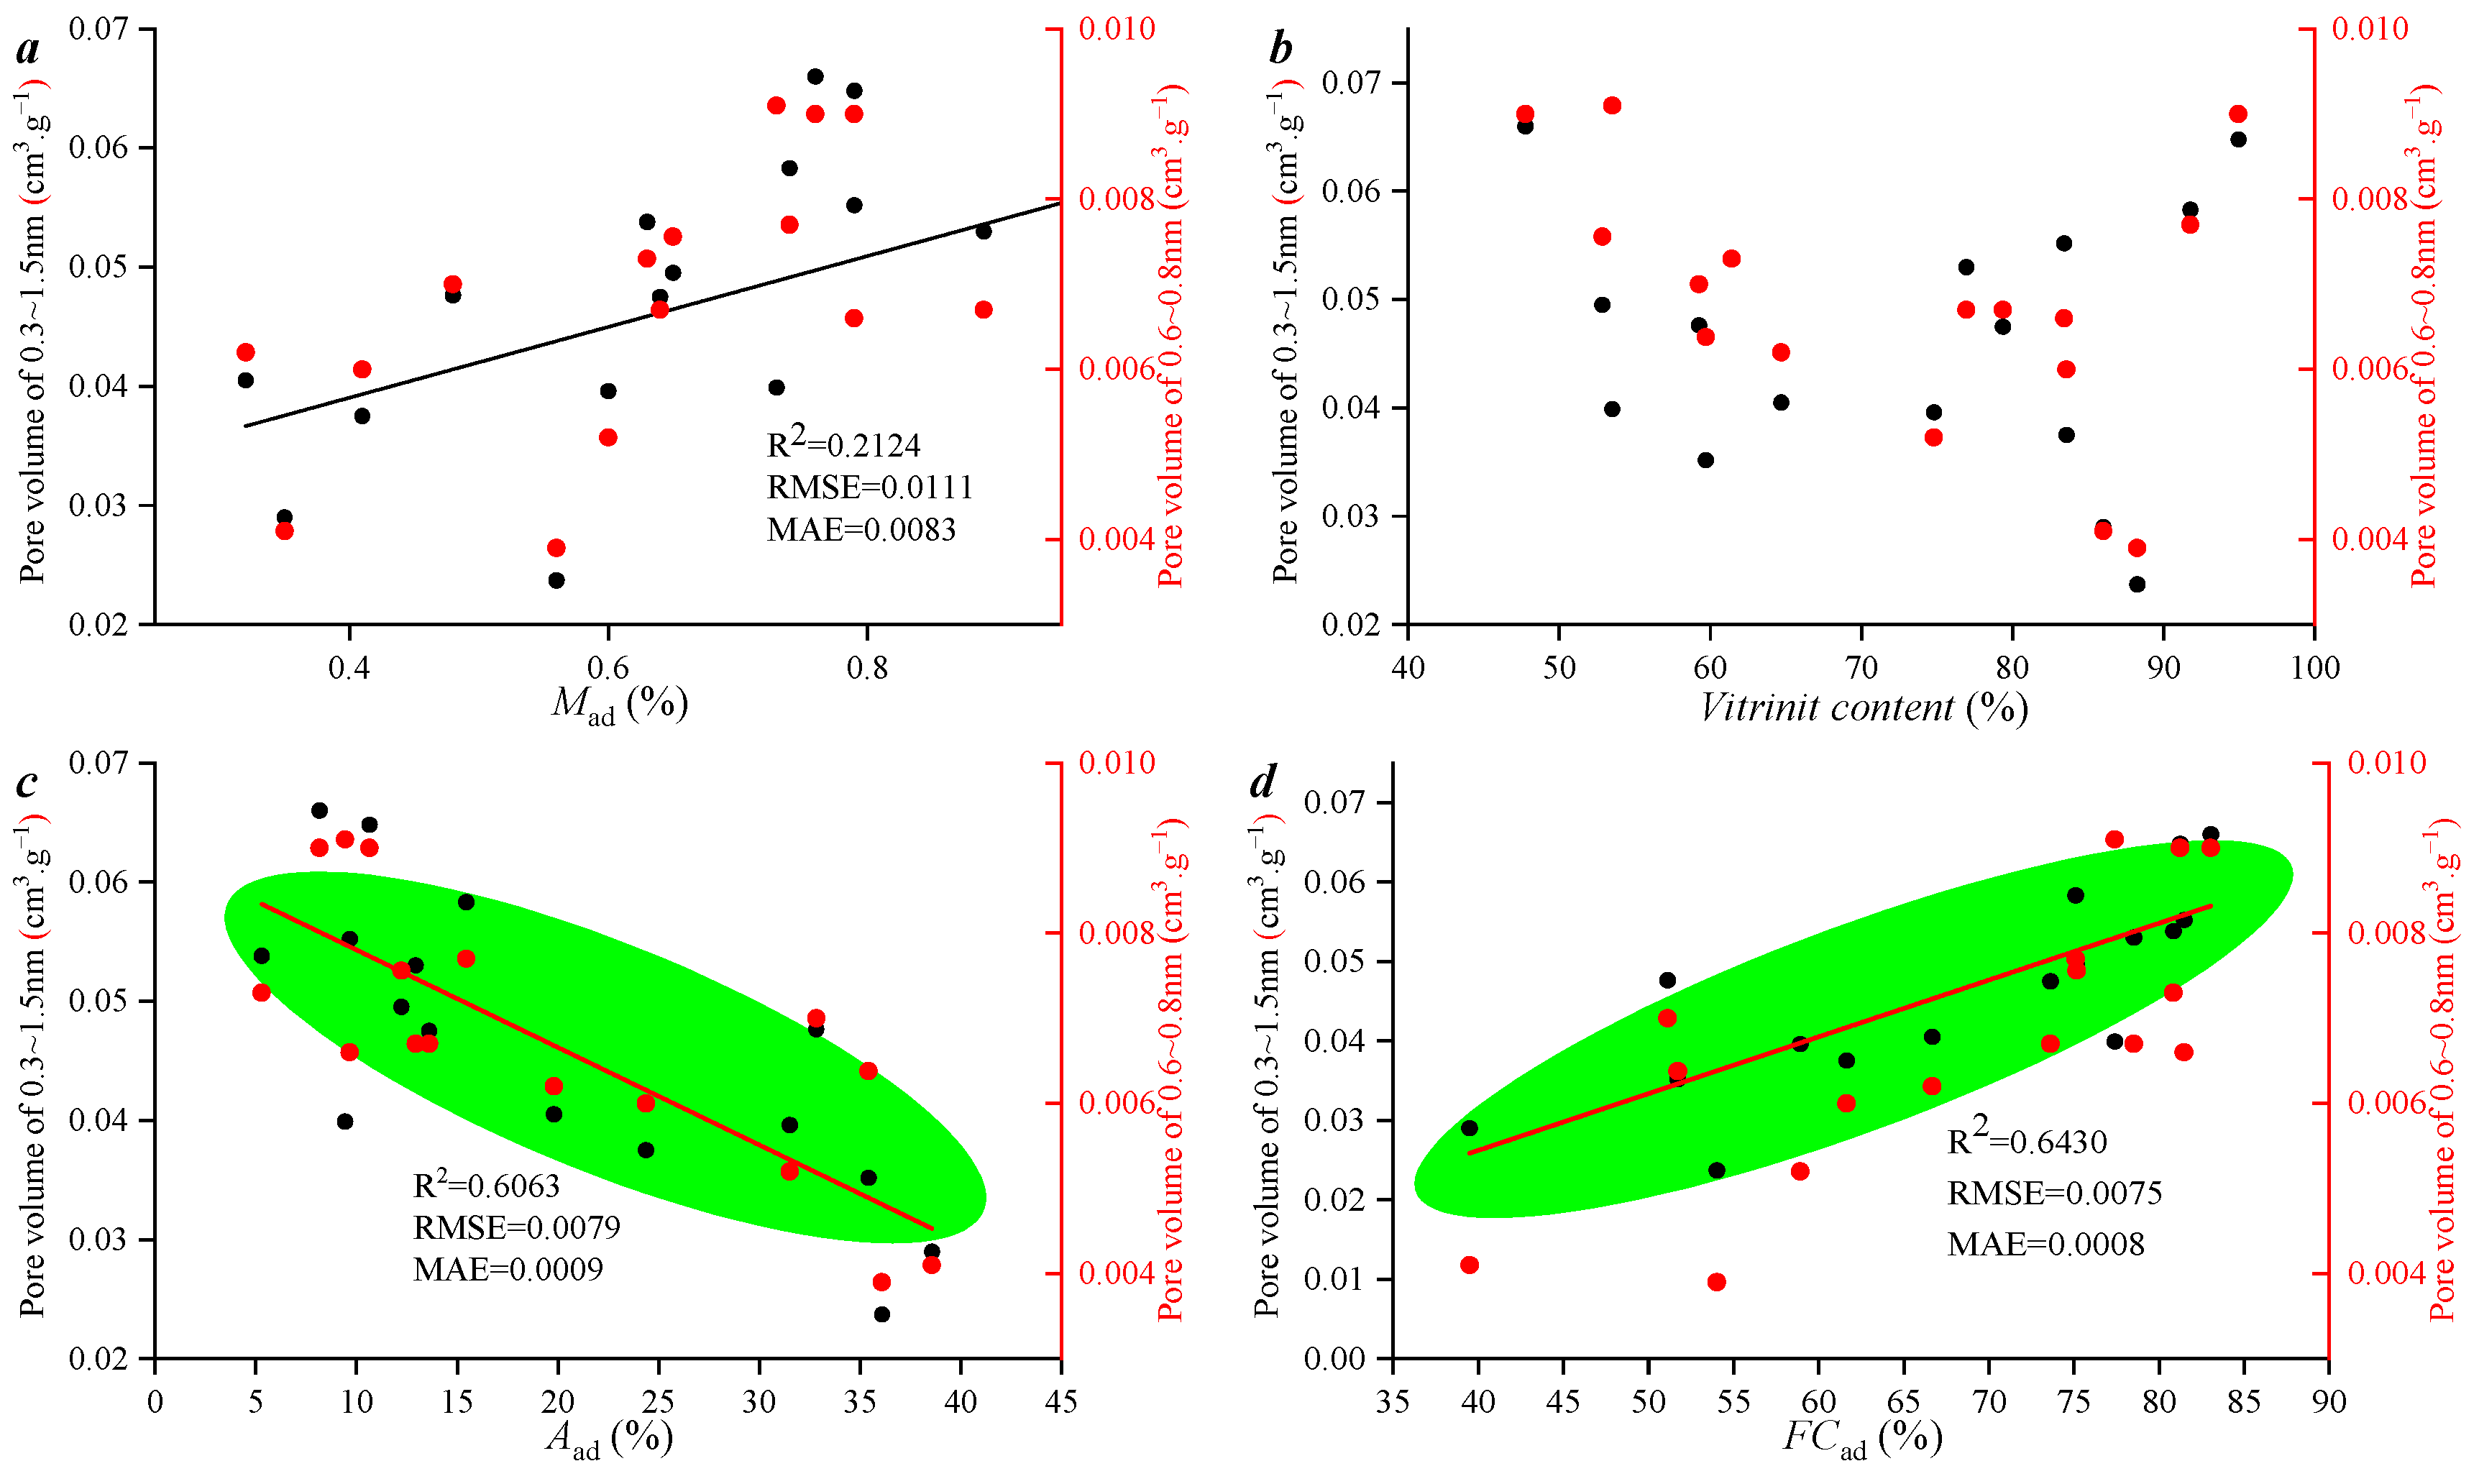
Figure 9 indicates that there was a significant correlation between the pore volume of micropores and the industrial components. The pore volume of micropores was positively correlated with the increase in water content. Different from the moisture content, the maceral content and micropore pore volume indicated a phased variation. It is worth noting that there was a significant linear correlation between the ash content and micropore pore volume. With the increase in fixed carbon content and the decrease in ash content, the pore volume of micropores increased and the linear fitting degree was higher than 0.6. Ash fills the pore volume of micropores, leading to a decrease in the pore volume of micropores and a decrease in the specific surface area of micropores. On the whole, the difference in micropore volume between different types was small, which was mainly controlled by coal rank and ash content.
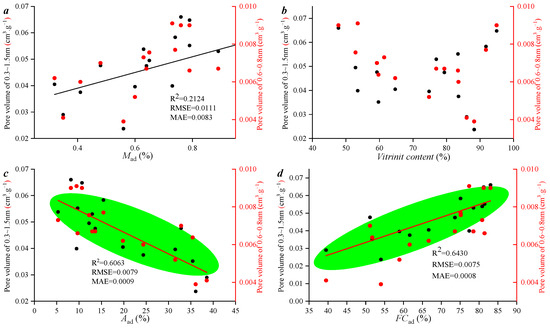
Figure 9.
Correlation between microporous PV and maceral content (b) and industrial components (a,c,d). (The green area reflects the different correlation of the samples).
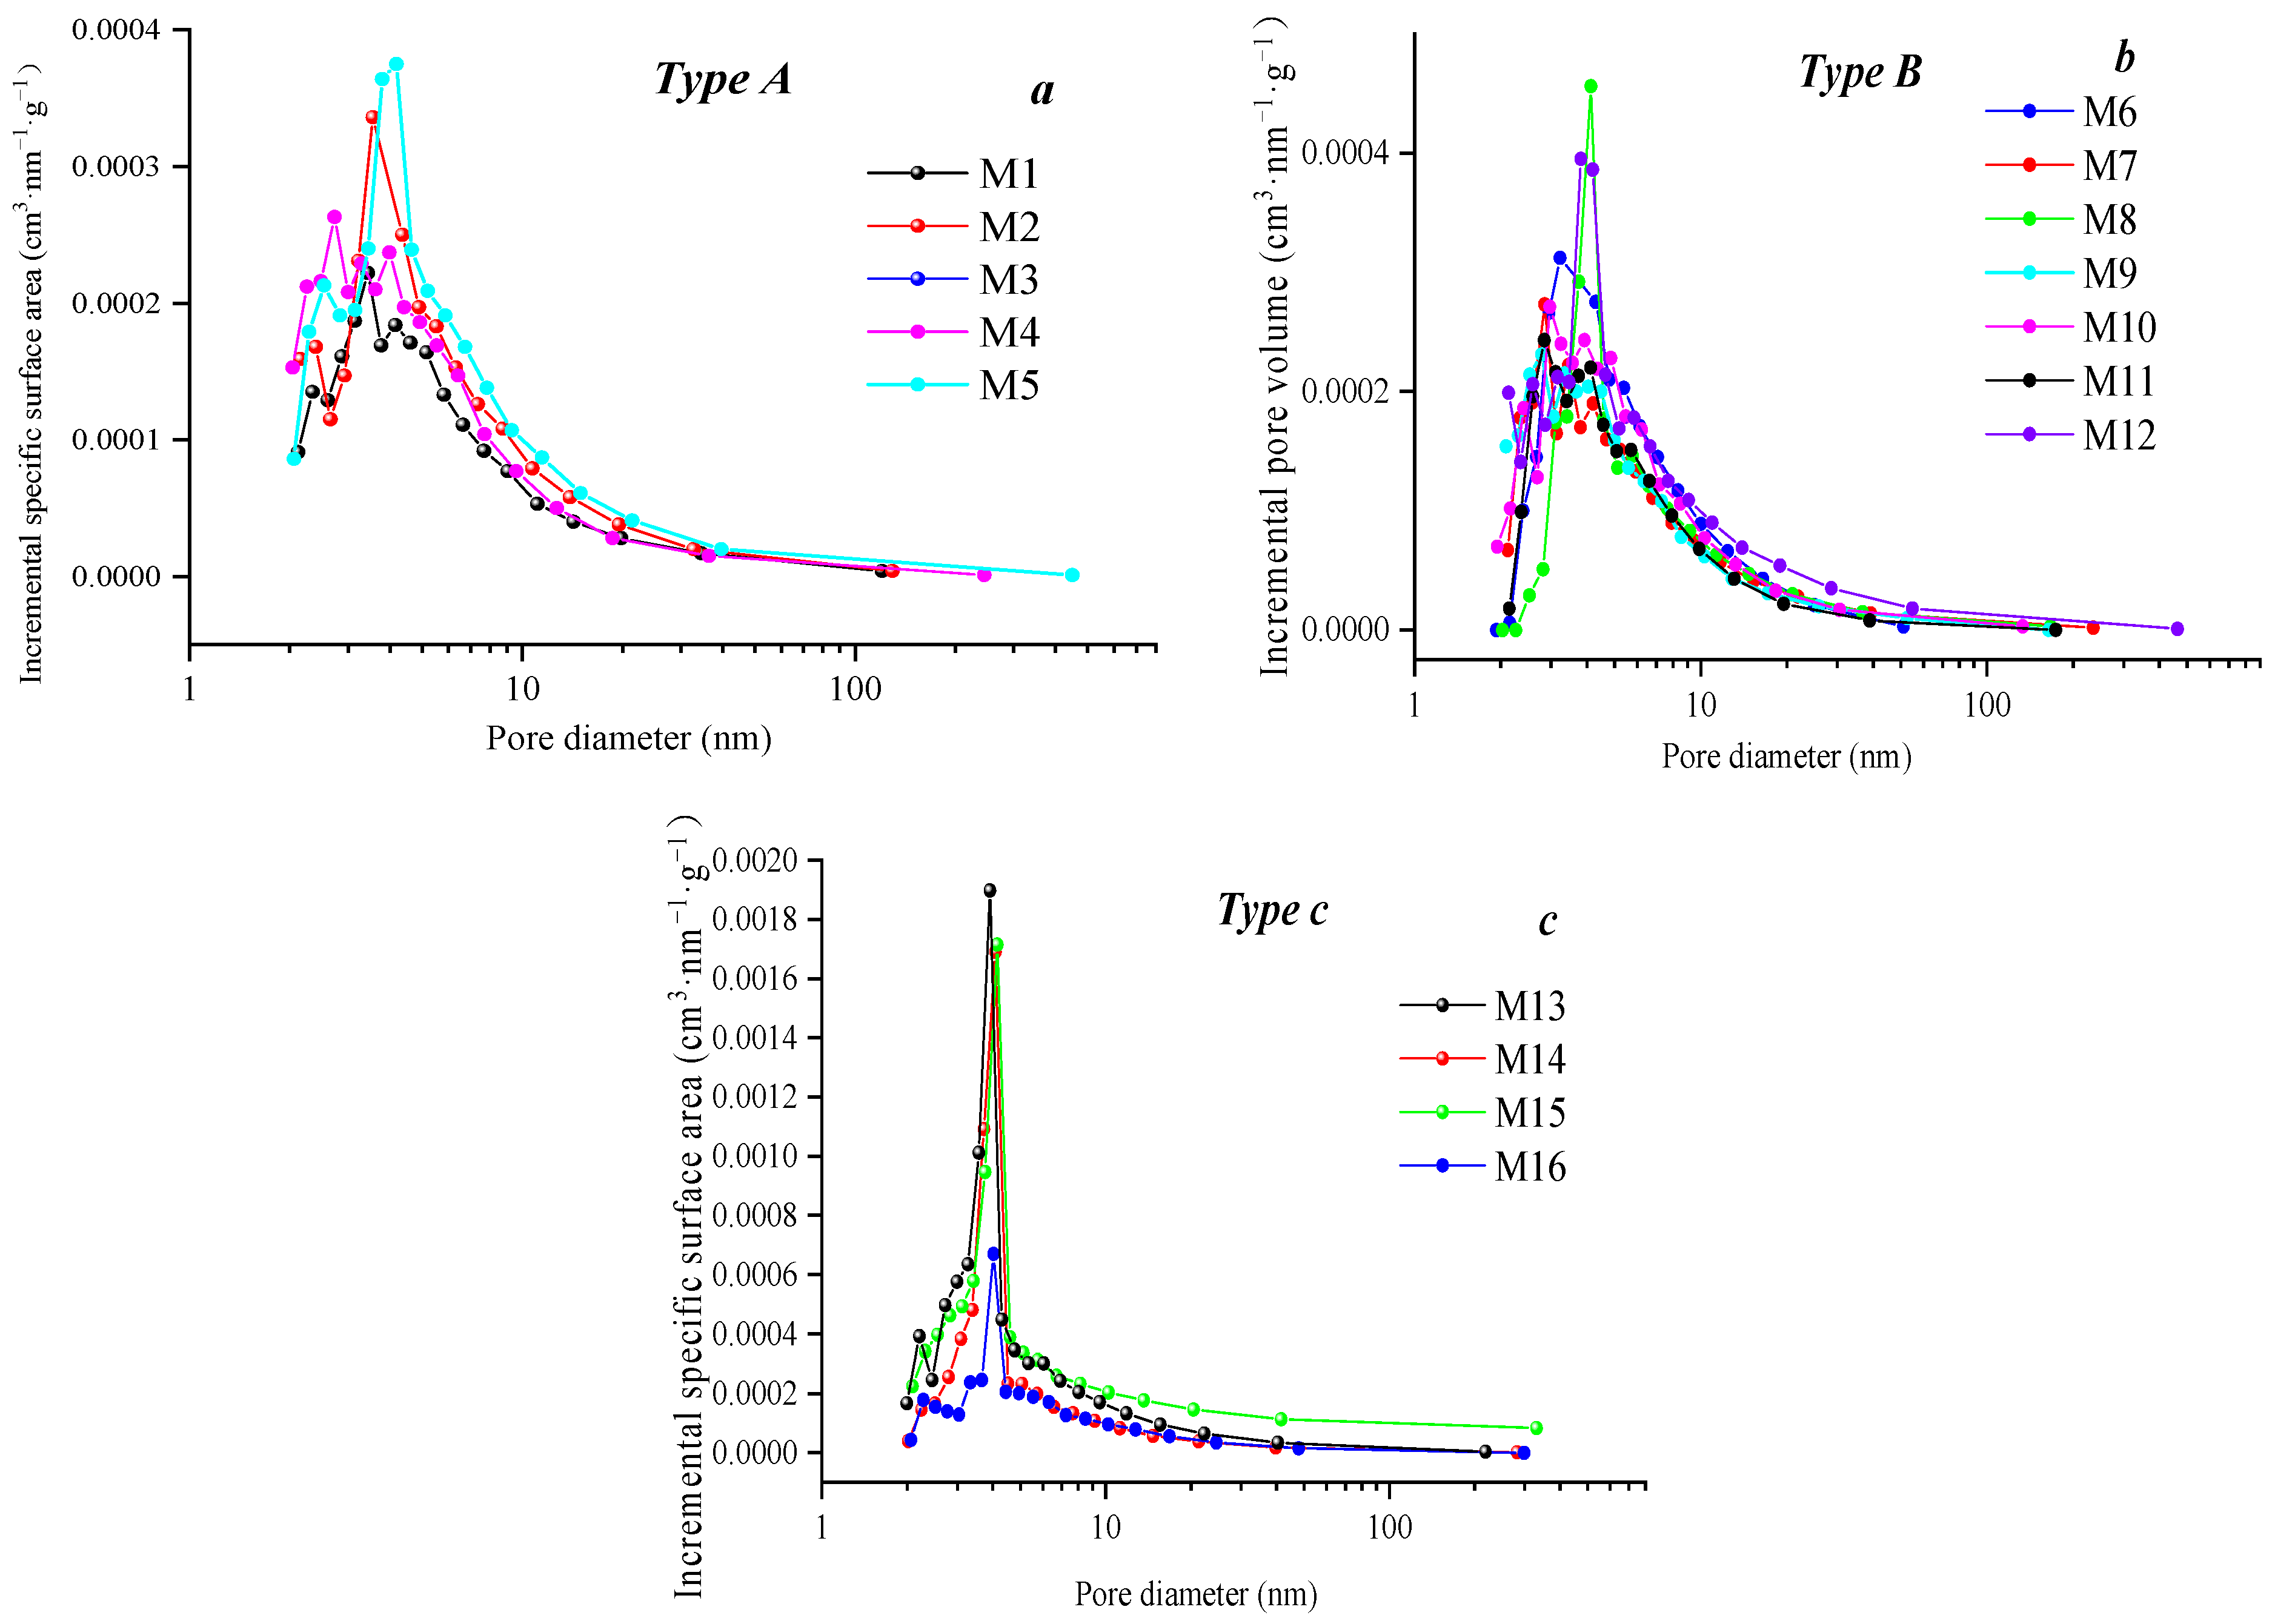
The characteristics of mesopore (2–100 nm) development were tested using the LTN2 GA test. The results indicated that the mesopore distribution was obviously unimodal and 2–10 nm was the main pore size (Figure 10). Different from Type A and Type B, the pore volume of Type C was obviously weak, and there were obvious variations. This indicated that there were obvious differences in the mesopore size distribution among samples.
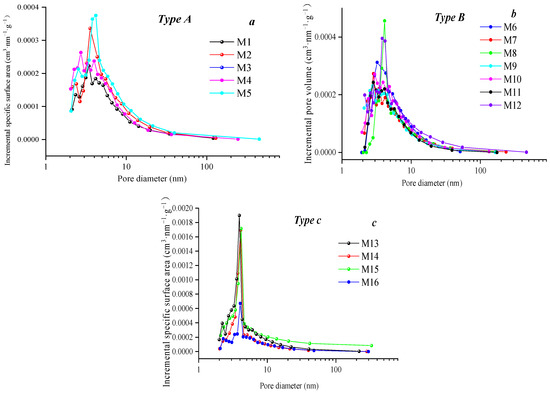
Figure 10.
PV of mesopores based on the nitrogen adsorption–desorption test for different coal ranks (a–c).
The statistical results indicated that the pore volume of mesopores in Type C was significantly higher than that of the other two types due to the higher degree of thermal evolution (Ro,max is lager than 2.0) in this type (Figure 11). A higher degree of thermal evolution promotes the transformation of organic pores in mesopores to open pores and semi-open pores. Different from the mesopore volume, the difference in the mesopores’ specific surface area among the samples was small, which was mainly affected by the properties of the mesopores. The relevant literature indicates that mesopores provide large pore volume and are subject to pore morphology and pore type. The small specific surface area of such samples led to weak variations in the specific surface area among samples.
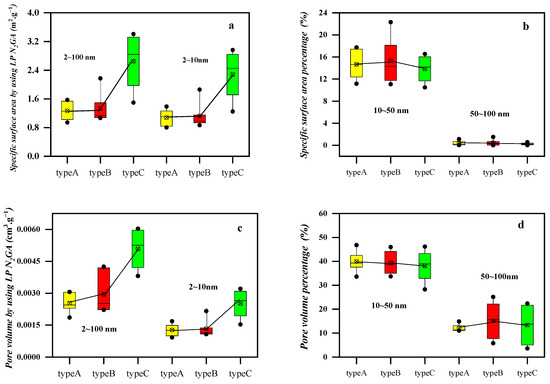
Figure 11.
Different coal rank coal samples’ meso-PV and SSA (a–d).
Different from Figure 9, Ro,max had a certain correlation with mesopore volume, but the correlation was weak (Figure 12), since mesopores are mainly affected by the comprehensive constraints of coal rank, coal macroscopic type, and coal rock quality [31]. By contrast, the correlation between industrial components (ash content) and mesopore volume was weak, although higher ash content can block mesopores and lead to a decrease in mesoporous pore volume. With larger mesopore volumes, the mesopore volume blocked by ash content in a certain range was not enough to affect the overall mesoporous pore volume. At the same time, the content of different vitrinites also had a positive correlation with the pore volume of mesopores, since the development of organic pores in mesopores is mostly related to vitrinites [31].
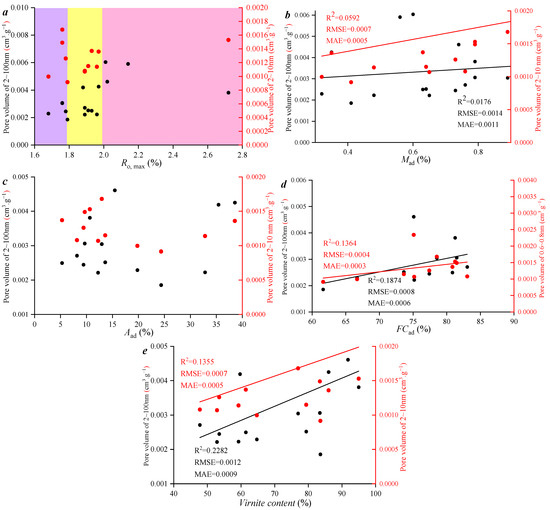
Figure 12.
Correlation between meso-PV and maceral content (e) and industrial components for different coal ranks (a–d).
4.3. Adsorption Ability of Nanopores and Key Factors
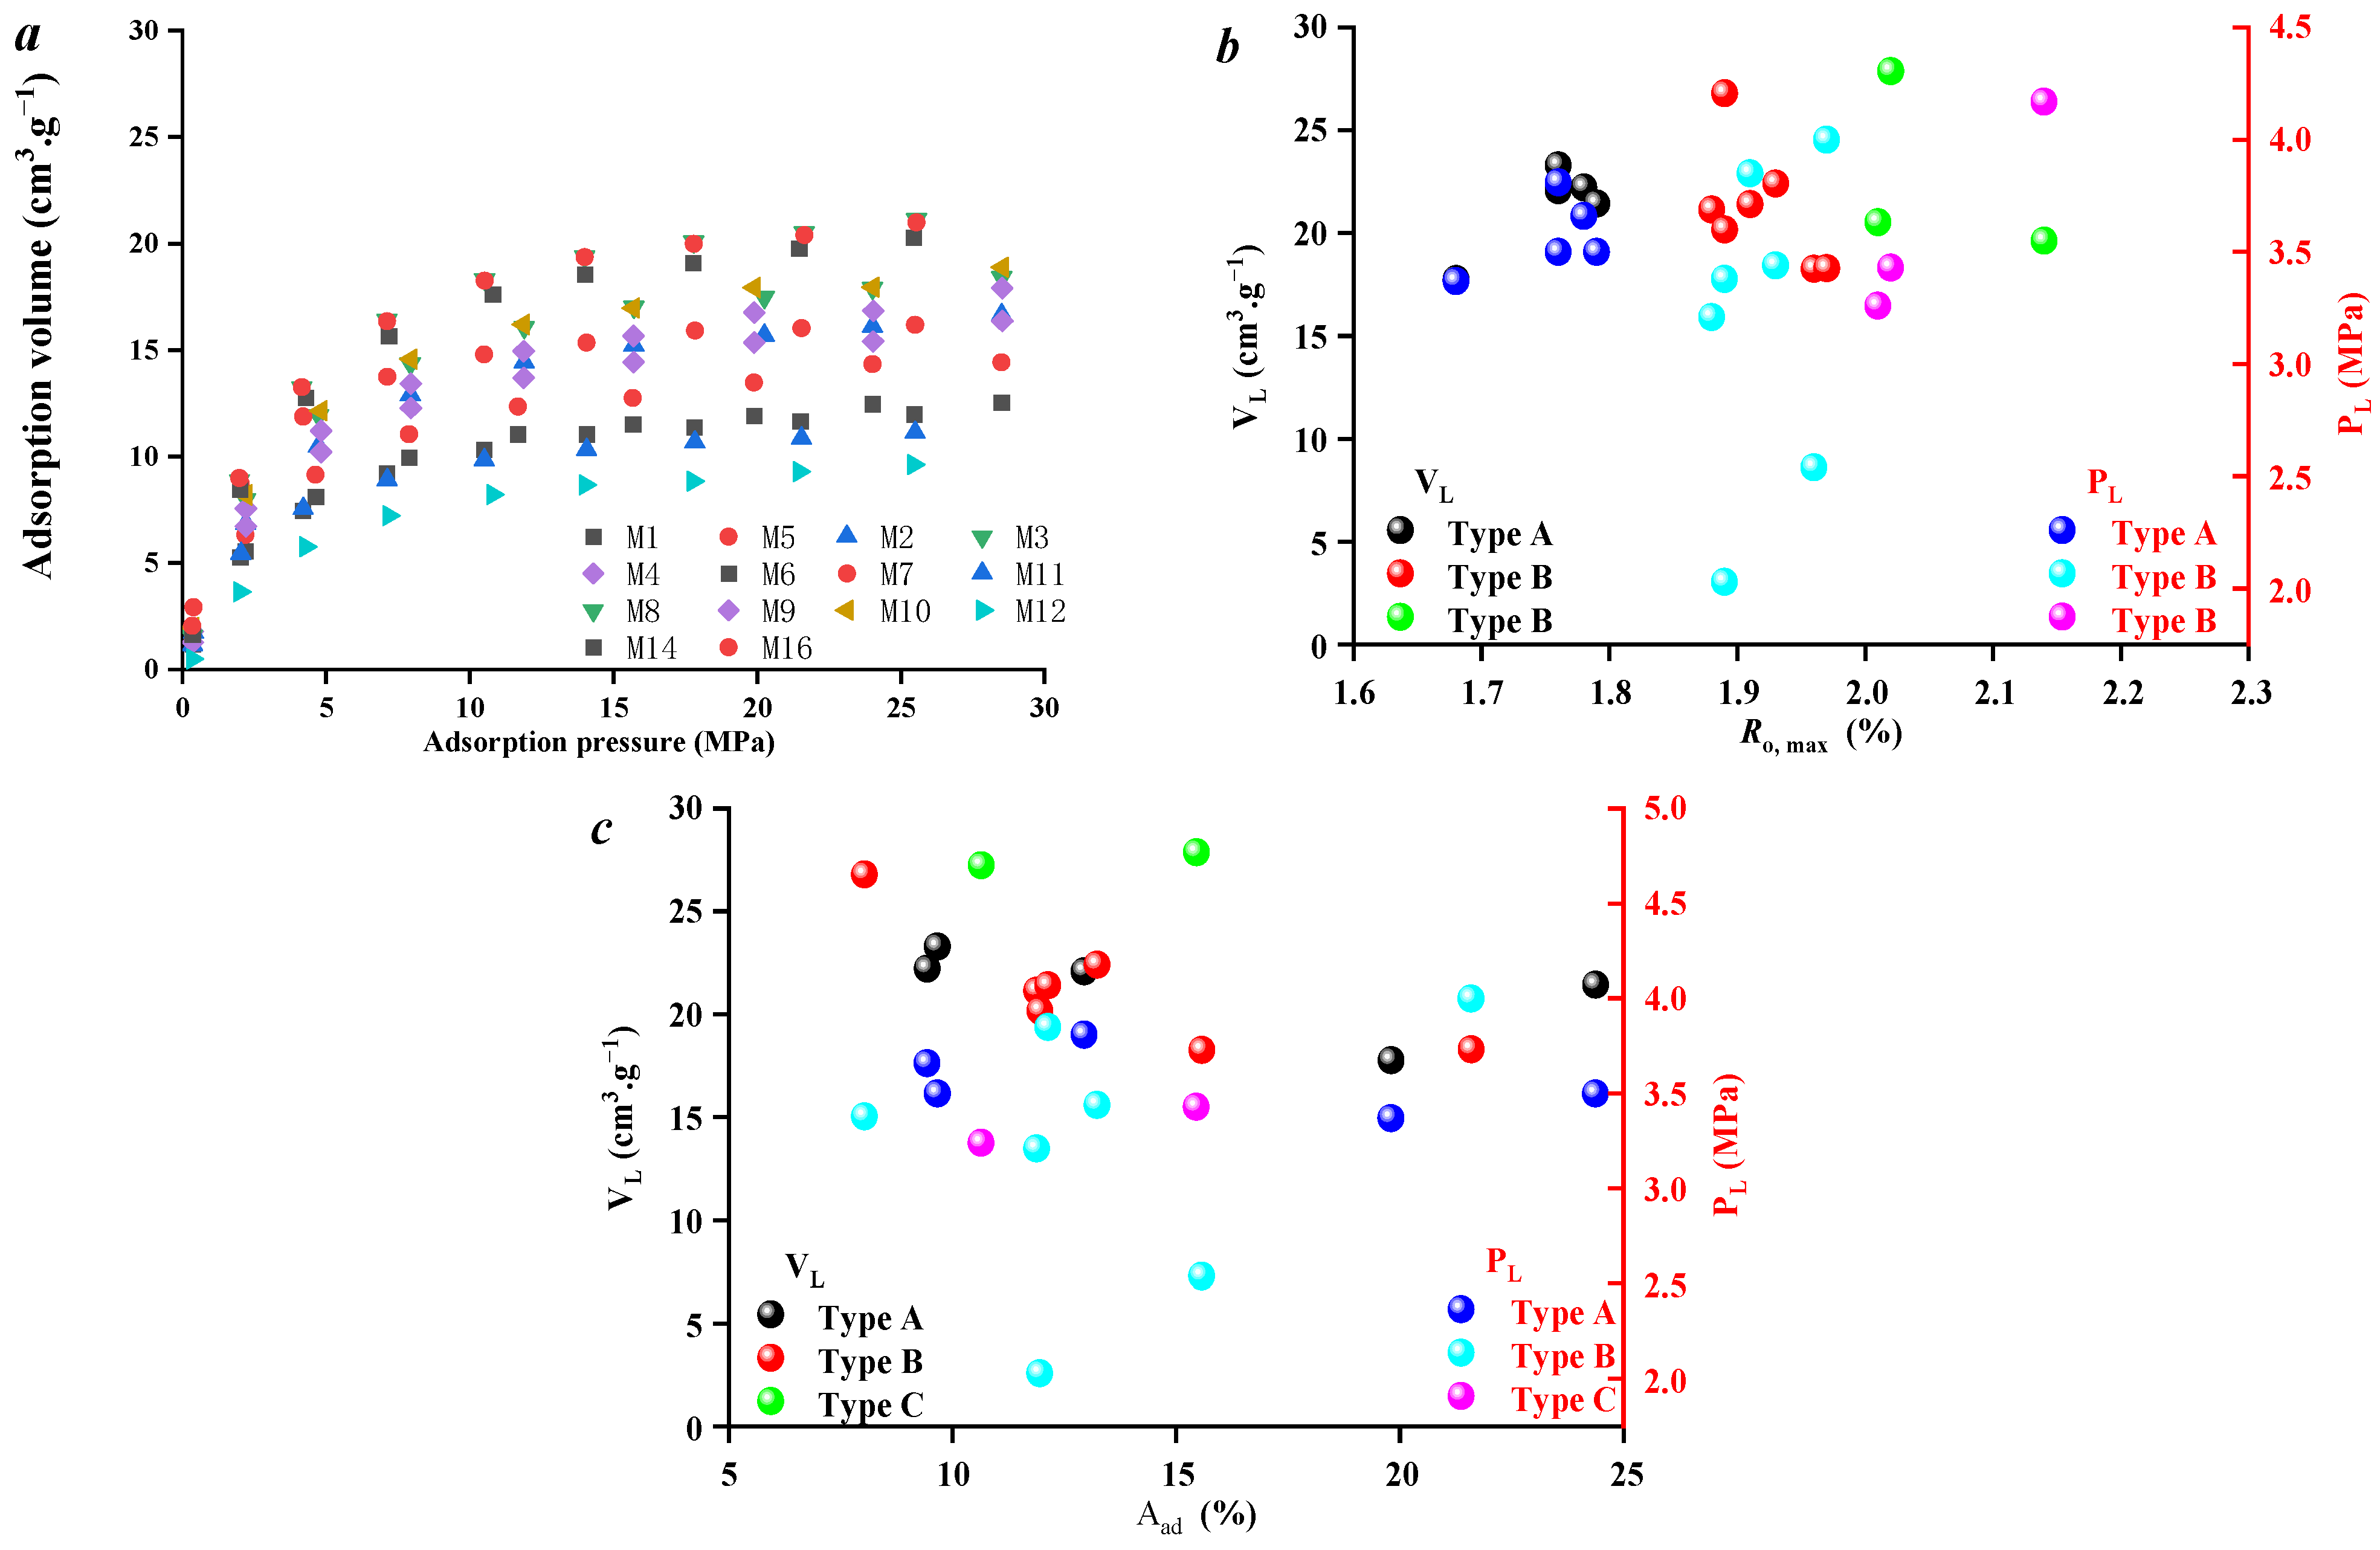
Based on the high-temperature and high-pressure isothermal experiments, the adsorption capacity of all samples was quantitatively characterized. Figure 13a indicates that the maximum methane adsorption capacity of all samples was 7~20 cm3/g. The isothermal adsorption curves of all samples met the Langmuir equation. With the increase in adsorption pressure, the methane adsorption capacity tended to be stable when the adsorption pressure was 15 Mpa. At the same time, the correlations between Ro,max and Langmuir volume (VL) and Langmuir pressure (PL) were weak, since Ro,max was not the main controlling factor affecting the pore structure of micropores. The relevant literature indicates that micropore volume and specific surface area account for more than 95% of coal samples, so micropores are the main factors restricting methane adsorption and desorption (Figure 13b). At the same time, according to the correlation between the ash content and Langmuir adsorption parameters (VL, PL), with the increase in ash content, VL and PL decreased, which indicated that ash content was the main controlling factor affecting methane adsorption capacity. With the increase in ash content, the adsorption capacity of selected methane samples decreased, which again indicated the importance of ash content to the evaluation of gas content in deep coal reservoirs.
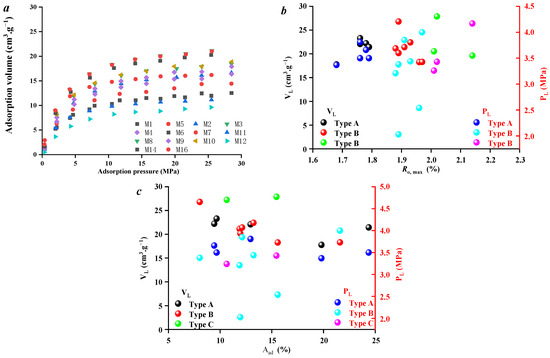
Figure 13.
Isothermal adsorption curves (a) and correlations between VL, PL, ash content (c), and Ro,max (b) for samples.
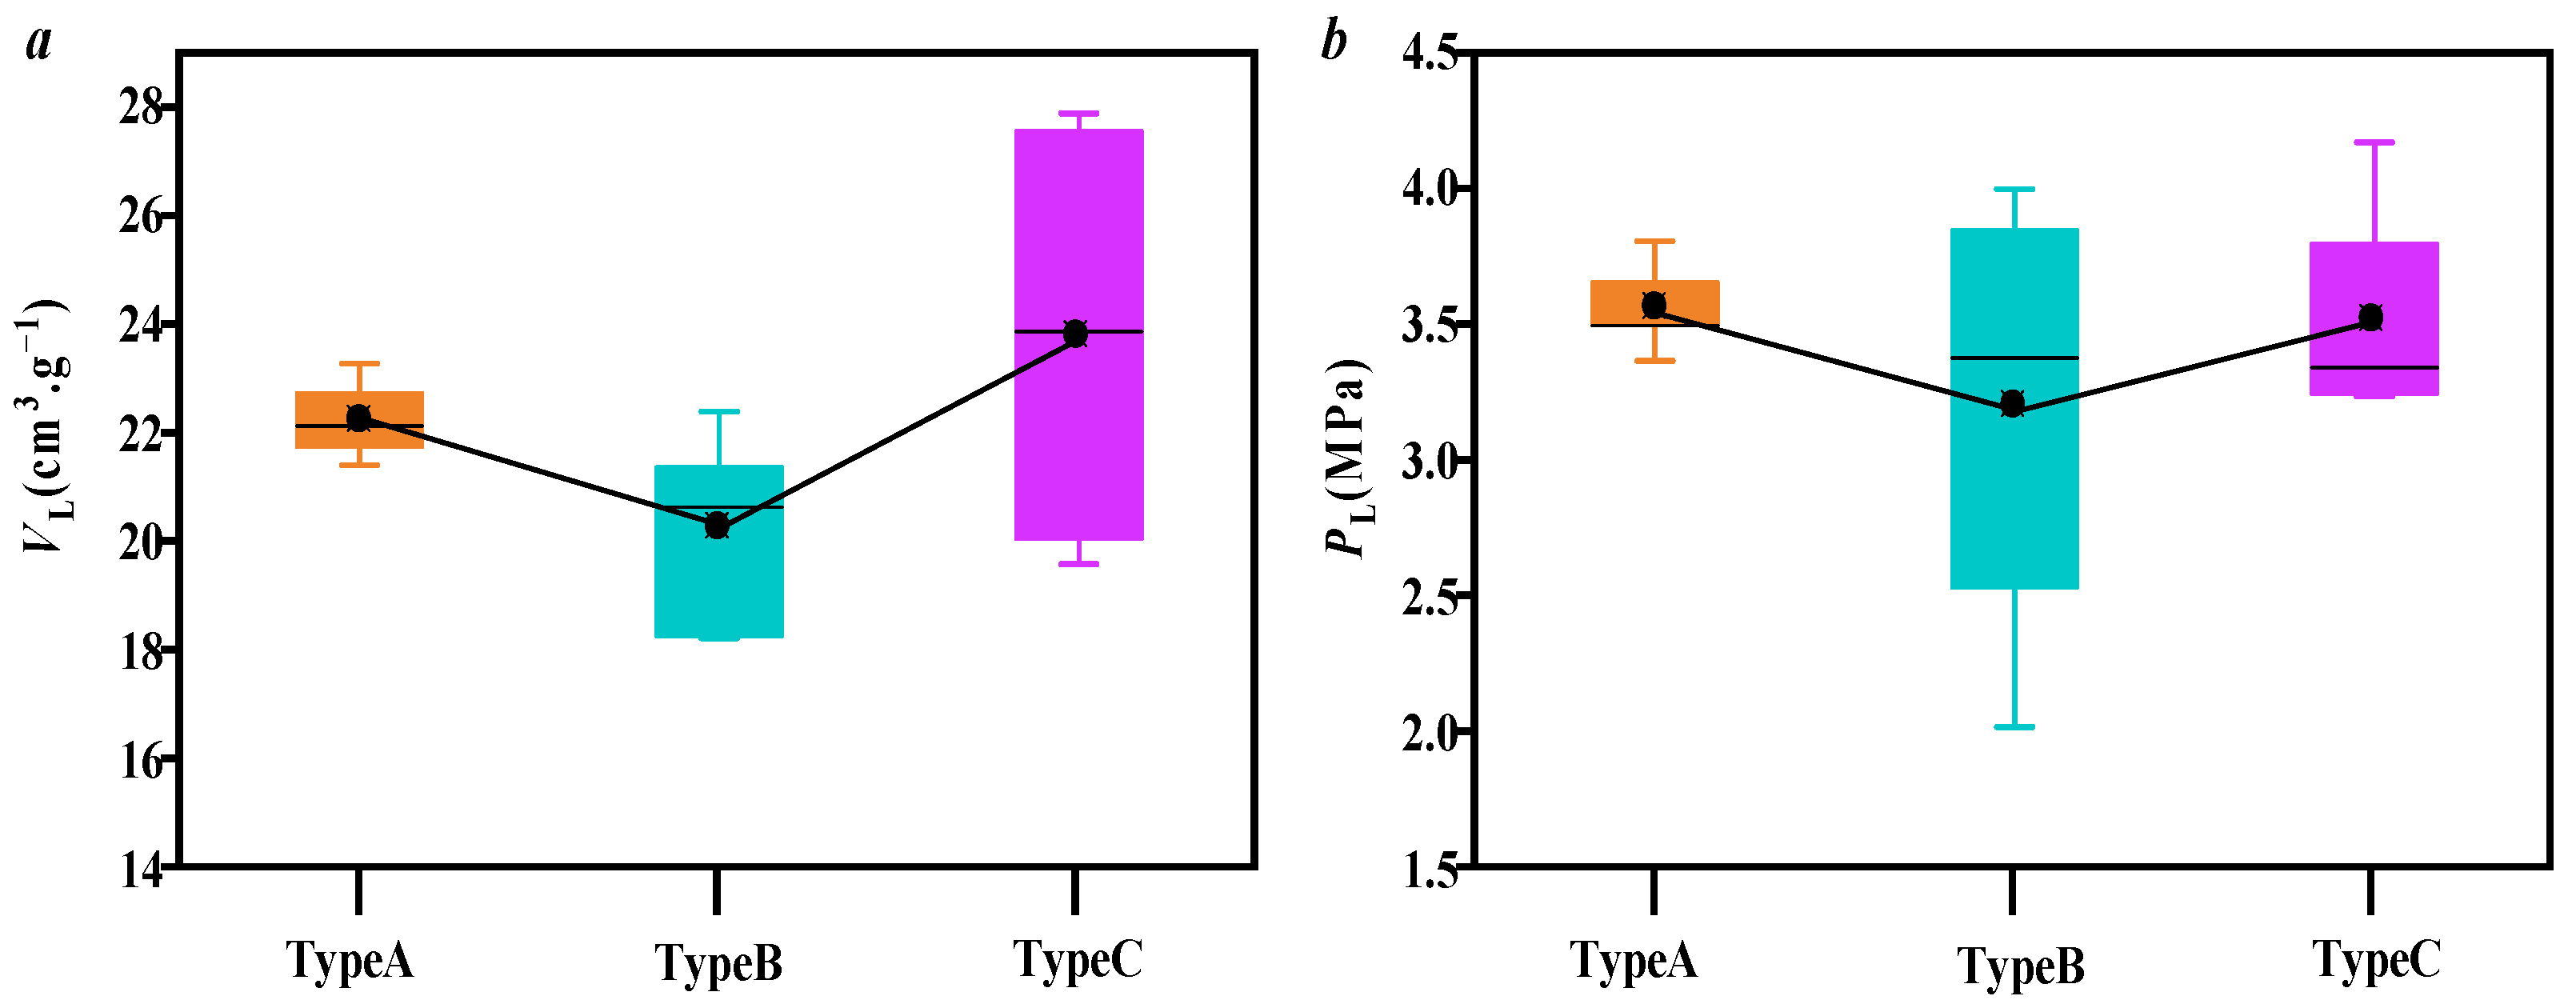
The comparison indicated that there were obvious variations in VL and PL among different samples (Figure 14). The specific performance was that VL of Type A was between 21 and 23 m3/t, VL of Type B was less than 21 m3/t, and VL of Type C fluctuated greatly, which was mainly due to the relative dispersion of ash content in the samples. Different from VL, the correlation difference of PL among different types was not obvious, since PL is mainly affected by the comprehensive influence of coal rank, ash content, macerals, and other factors [32].
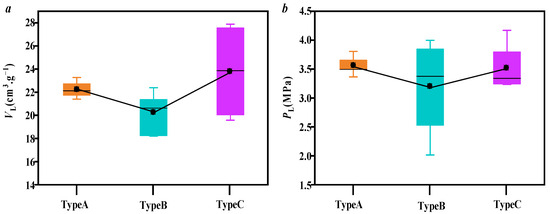
Figure 14.
Isothermal adsorption curves and adsorption parameters of different coal facies: (a,b), VL and PL of different coal facies.
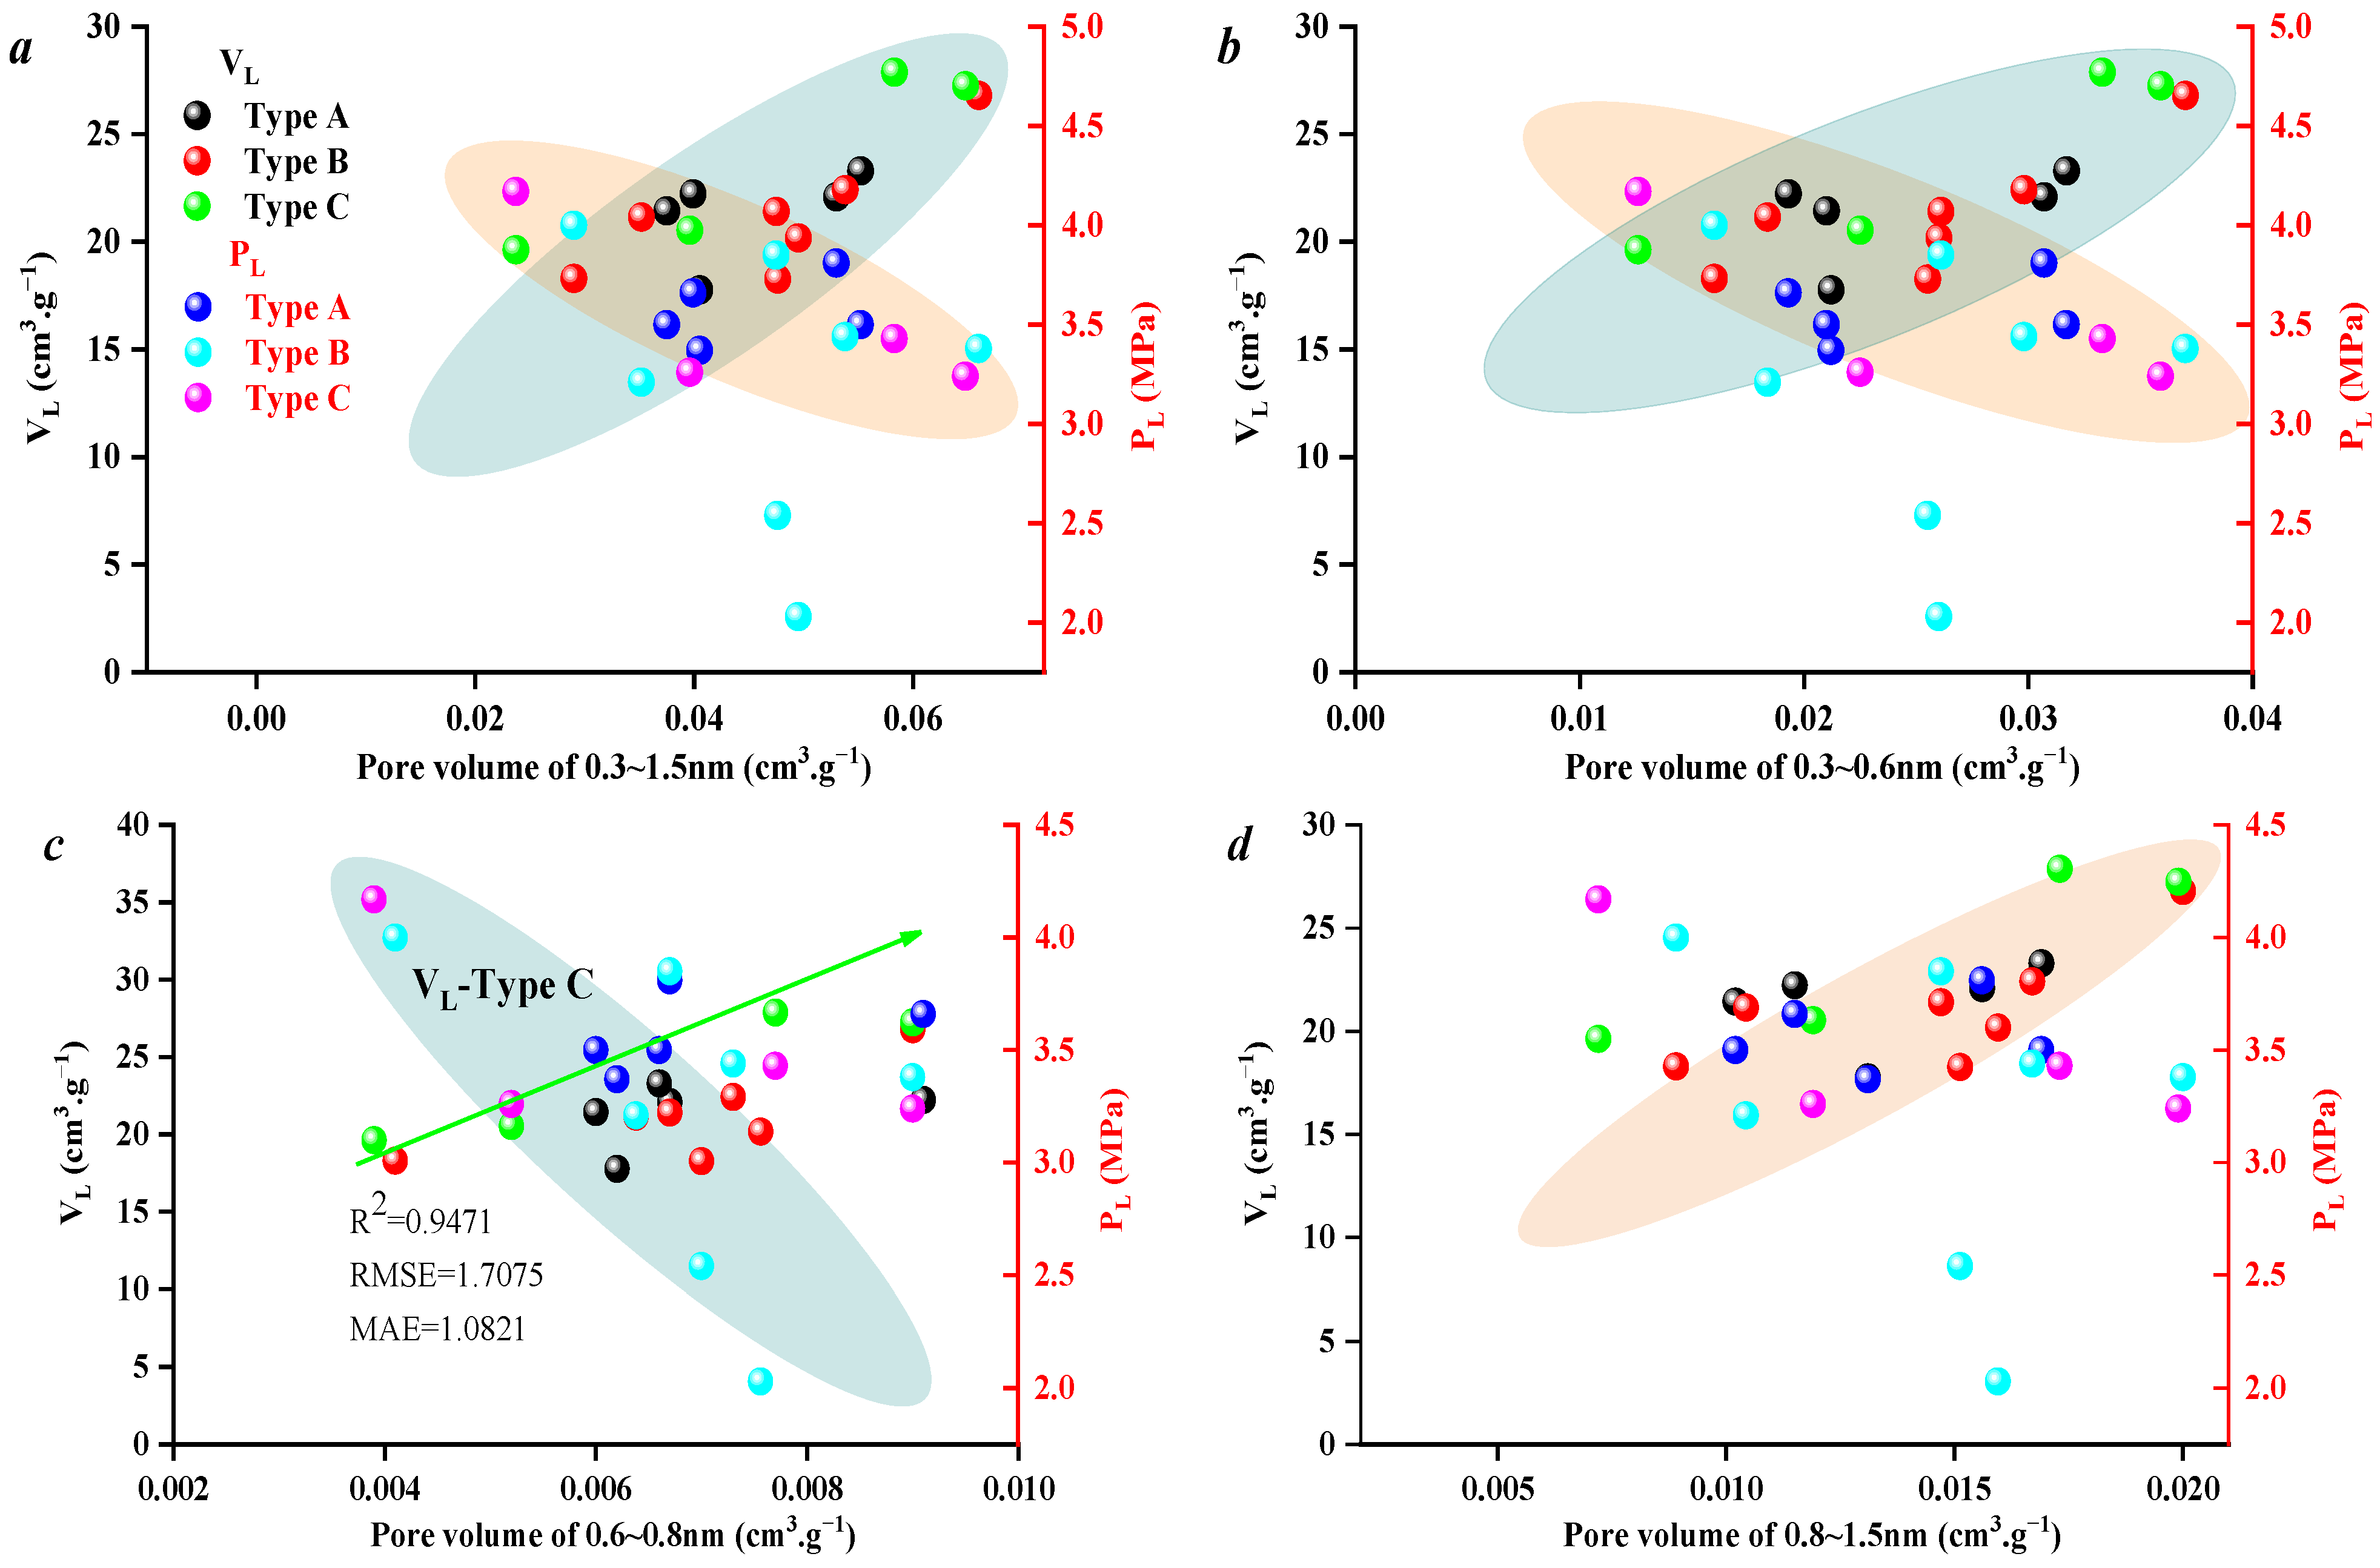
Based on the correlation between the micropore structure and the adsorption parameters (Figure 15), the results indicated that with the increase in pore volume from 0.3 to 1.5 nm, VL and PL showed significant increasing and decreasing trends, respectively, which also indicated that the pore size of this stage mainly affected the adsorption capacity of coal samples. Similarly, a pore volume of 0.3~0.6 nm also had a certain correlation with VL and PL, but the correlation was significantly weaker than a pore volume of 0.3~1.5 nm. It was indicated that the 0.3~0.6 nm pore size was not the main pore size affecting methane adsorption capacity. Figure 15c indicates that with the increase in 0.6~0.8 pore volume, VL increased, but the correlation was still not obvious. The correlation with the 0.8~1.5 nm pore size was relatively good. In general, the methane adsorption capacity was not restricted by the pore size at a certain stage but was affected by the pore size of 0.3~1.5 nm as a whole.
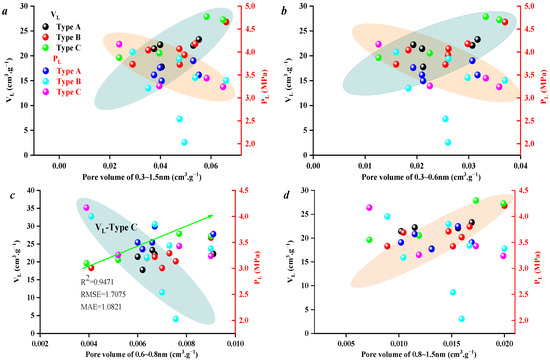
Figure 15.
Relationship between micropore structure and adsorption parameters (a–d).
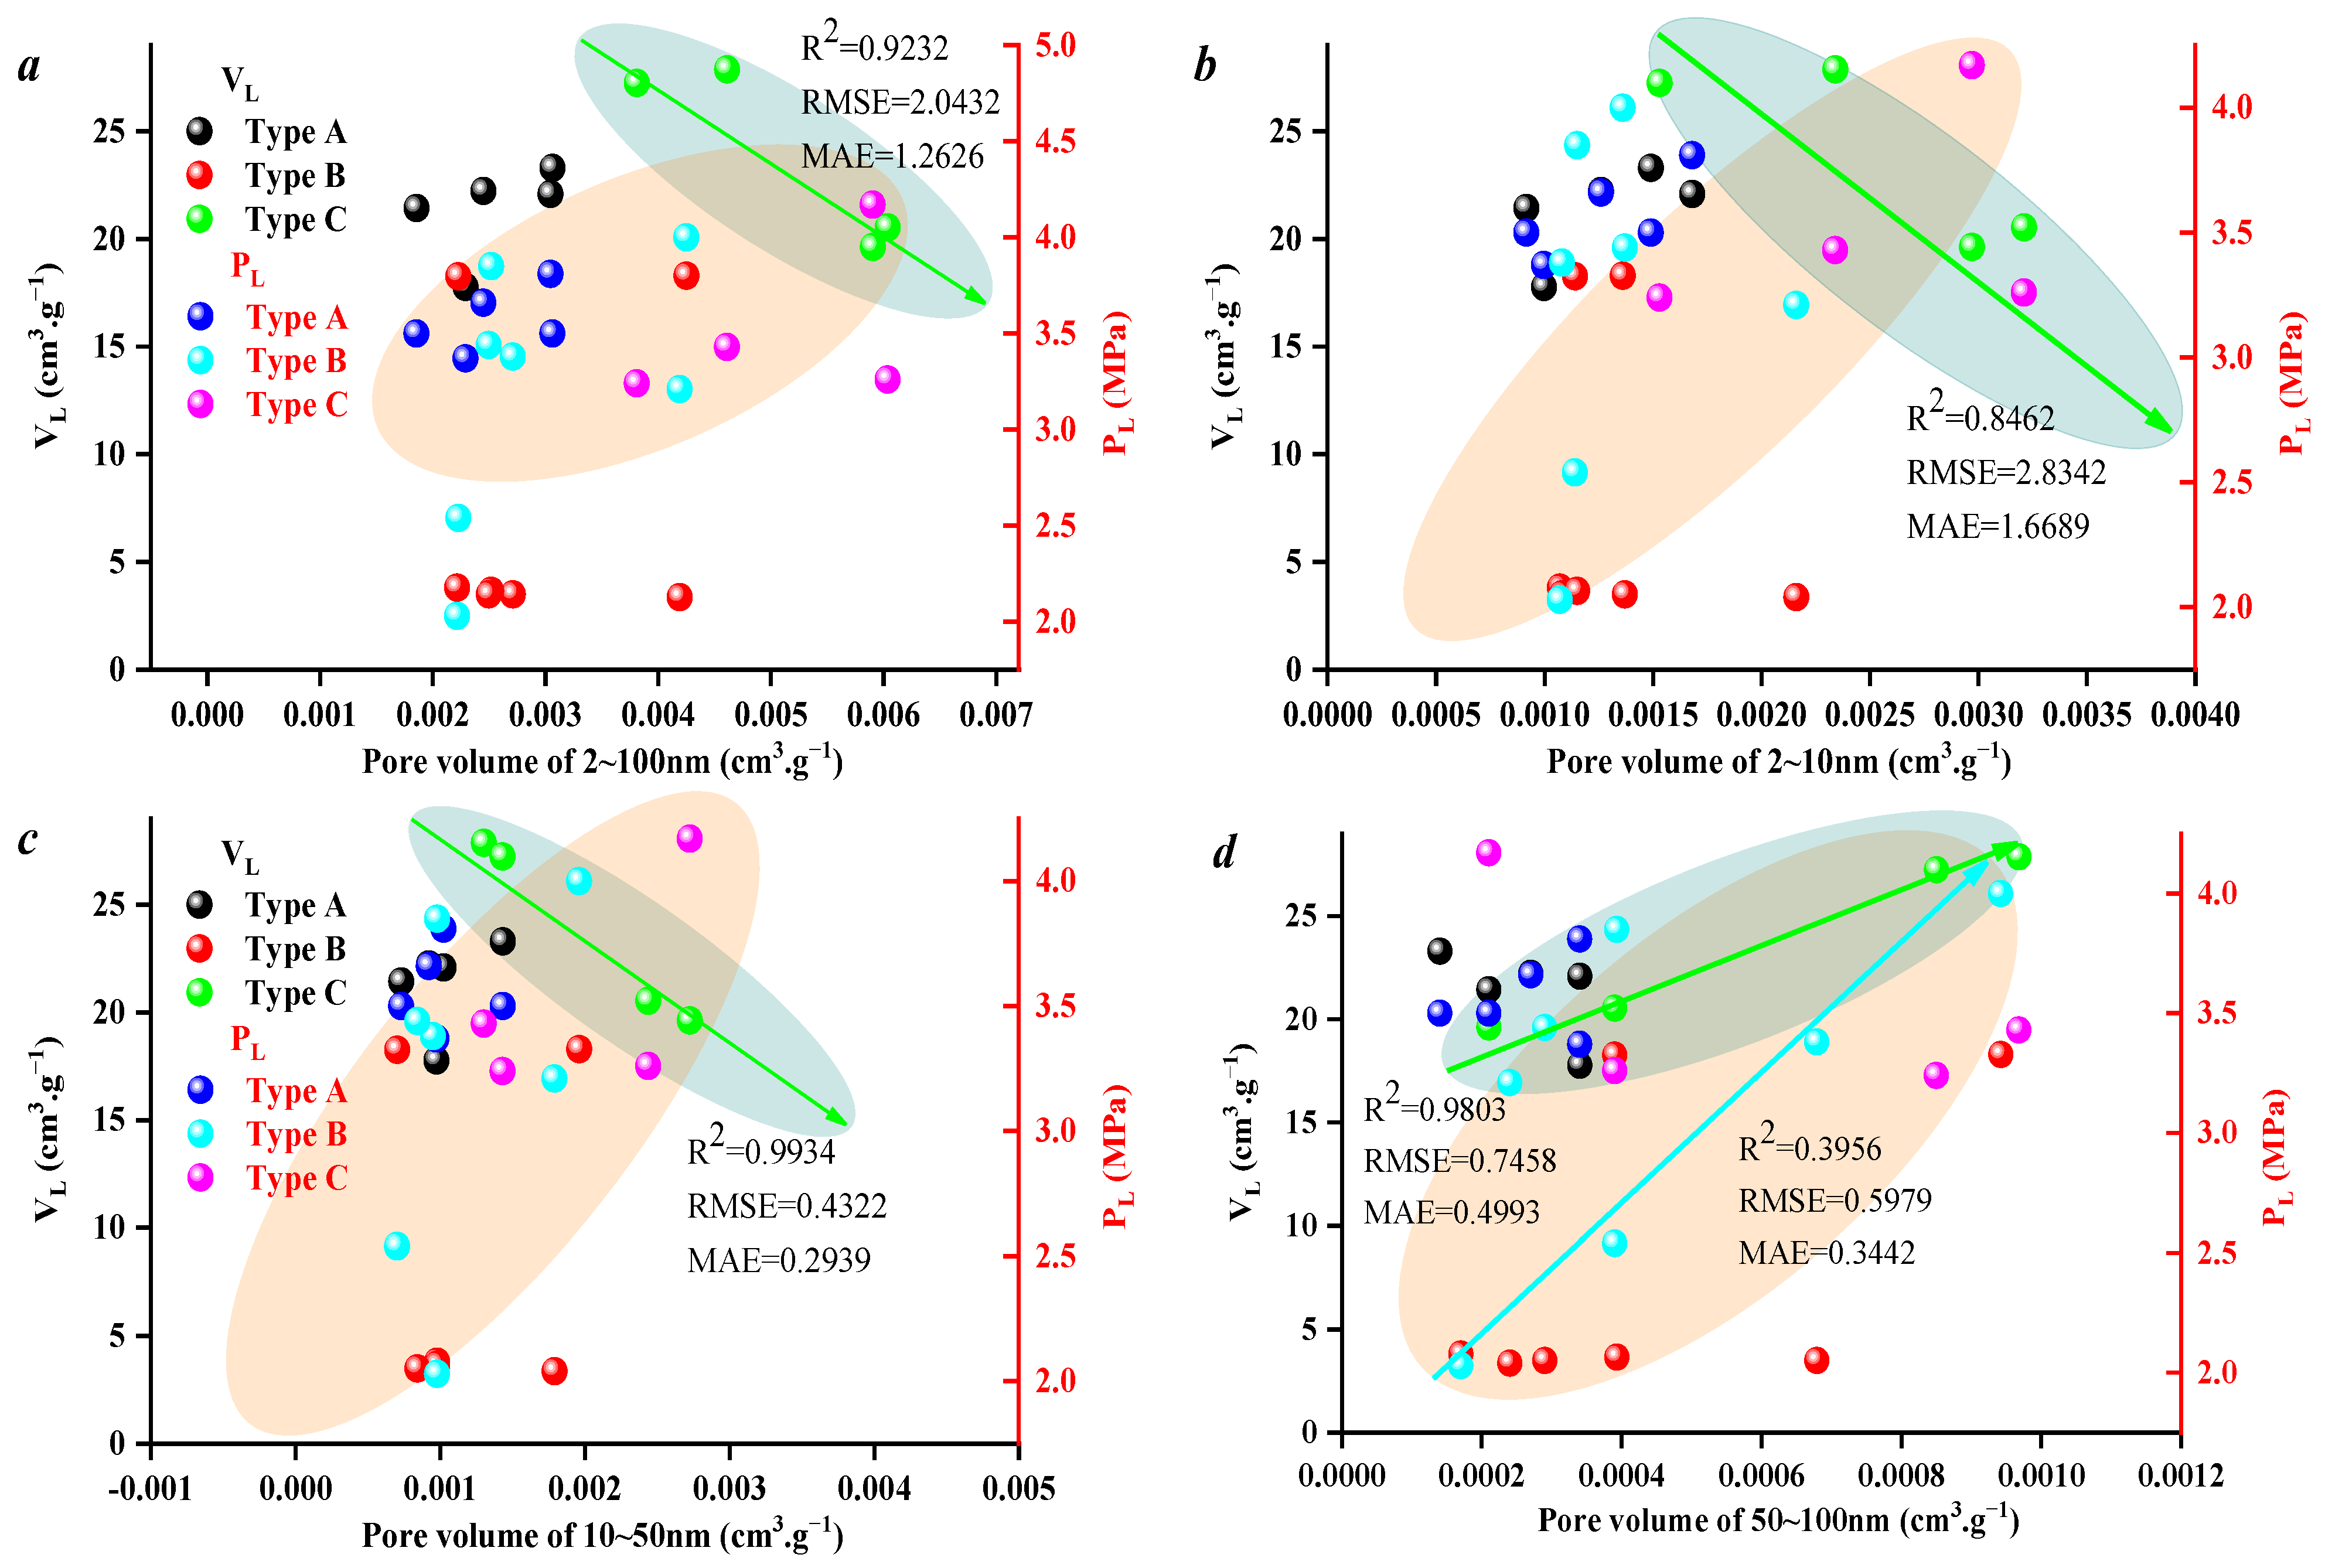
The correlation between pore structure volume and adsorption capacity of the 2~100 nm pore size is shown in Figure 16. Compared with micropores, the pore volume at different pore size stages between 2 and 100 nm pores had less correlation with VL and PL, which was mainly affected by the structural characteristics of 2~100 nm pores. The literature indicates that the pore volume in 2~100 nm pores is relatively large, but the specific surface area provided by this part of pores is small, which is about 5% of the total specific surface area of coal samples [33].
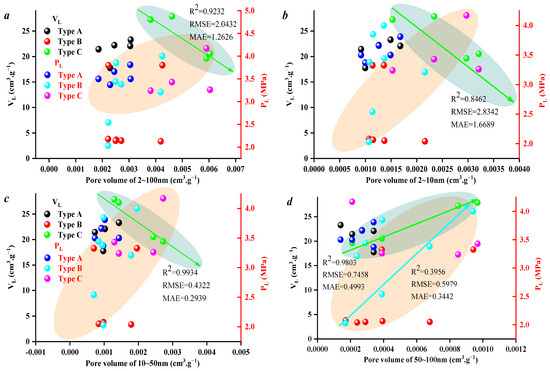
Figure 16.
Relationship between 2~100 nm structure and adsorption parameters (a–d).
5. Conclusions
Based on this, 16 samples from the No. 8 coal seam of the Benxi Formation were selected in the eastern margin of Ordos as the research target to describe the pore structure of deep coal reservoirs. Firstly, through the analysis of industrial components and Ro,max, the ash content, moisture content, and volatile matter content of all of the samples were studied. Secondly, the pore volume distribution of nanopores (pore diameter is less than 100 nm) of different coal grades and industrial components was determined by LTN2 GA and LPCO2 GA tests. On this basis, the main controlling factors affecting the pore fracture structure were clarified. Finally, the adsorption space and adsorption potential of different coal samples were calculated by introducing the surface free energy theory and adsorption potential theory. Surface free energy variation in the adsorption process was studied, and the main controlling factors affecting surface free energy in the methane adsorption process were discussed. The results are as follows:
- (1)
- Ro,max is not the main controlling factor affecting the micropore-fracture structure, as the effects of industrial components on the micropore structure are obvious, which indicates that industrial components are the main factors affecting the vertical difference in micropore structure within the same thick coal seam.
- (2)
- Ro,max and industrial components affect the adsorption process. When the adsorption pressure is lower, the adsorption volume and adsorption potential increase rapidly. When the adsorption pressure is higher (pressure is larger than 15 Mpa), the adsorption capacity and potential tend to be stable. Moreover, the maximum surface free energy increases with the increase in coal rank, which indicates that the degree of thermal evolution is the core factor affecting the adsorption free energy, but it is also controlled by the influence of industrial components (ash content).
- (3)
- Micropores affect the adsorption capacity, and mesopores have little effect on the adsorption capacity, since micropores restrict the adsorption capacity and change the adsorption process by affecting surface free energy variations.
These findings emphasize the importance of selecting low-ash coal types for methane extraction, as the ash content significantly influences the adsorption capacity. Additionally, the results could guide the development of carbon capture and storage strategies in similar geological formations.
Author Contributions
Conceptualization, J.W. and S.H.; Resources, J.W.; Data curation, J.Z.; Writing—original draft, R.Y. and H.G.; Writing—review and editing, Y.H., X.Y. and H.G.; Project administration, Y.H. All authors have read and agreed to the published version of the manuscript.
Funding
The project is supported by the CNPC Major Science and Technology Project “Enrichment Law of Deep Coalbed Methane and Optimization of Favorable Areas” (Numbers 2023ZZ18, 2023ZZ1803) and the China National Petroleum Corporation Logging Co., Ltd. Project “Research on Key Techniques for Logging Evaluation of Deep Coalbed Methane” (Number CNLC2023-8B02).
Data Availability Statement
The original contributions presented in this study are included in the article. Further inquiries can be directed to the corresponding author.
Conflicts of Interest
Authors Yufei He, Jinbin Wan, Renjie Yang and Jingbo Zeng were employed by Geological Research Institute, China National Logging Corporation. Author Xiaomin Yang was employed by Exploration and Development Research Institute of Changqing Oilfield Company. The remaining authors declare that the research was conducted in the absence of any commercial or financial relationships that could be construed as a potential conflict of interest. The China National Logging Corporation had no role in the design of the study; in the collection, analyses, or interpretation of data; in the writing of the manuscript, or in the decision to publish the results.
References
- Jia, H.M.; Hu, Q.J.; Zhang, C.; Li, K.X.; He, S.; Sang, G.J.; Li, J.; Liu, C.C. Characteristics and development practice of deep coalbed methane reservoir in the southern part of Ningwu Basin. J. China Univ. Min. Technol. 2024, 30, 1–13. [Google Scholar]
- Chen, Z.L.; Wang, Y.H.; Liu, X.; Cui, B.; Yang, S.; Li, X.; Fang, Q.L. Integrated practice of key technologies and geological engineering for deep coalbed methane development in southern Yanchuan. Coal Geol. Explor. 2024, 30, 1–11. [Google Scholar]
- Xu, C.G.; Ji, H.Q.; Wang, C.W.; Zhu, X.S. Enrichment law and exploration countermeasures of deep coalbed methane in Linxing-Shenfu block, eastern margin of Ordos Basin. Coal Geol. Explor. 2024, 52, 1–11. [Google Scholar]
- Yang, Z.B.; Li, C.L.; Guo, Q.Z.; Wang, B.; Liu, C.Q.; Qu, H.L.; Liang, Y.H.; Wang, Y.Q. Distribution law of different occurrence states of deep coalbed methane in Baijiahai Uplift, Junggar Basin, Xinjiang. J. China Univ. Min. Technol. 2024, 30, 1–11. [Google Scholar]
- Qin, H.L.; Yao, H.F.; Jia, X.B.; Li, P.F.; Meng, Y.J. Characteristics of pores and fractures in deep coal reservoirs based on NMR. Coal Technol. 2019, 38, 55–58. [Google Scholar]
- Wu, J.; Sun, Q.; Shi, X.F.; Gao, L.J. Study on pore structure and fluid difference occurrence characteristics of deep coal seam. Coal Geol. Explor. 2024, 52, 89–100. [Google Scholar]
- Deng, Z.; Wang, H.Y.; Jiang, Z.X.; Ding, R.; Li, Y.Z.; Wang, T. The influence of pore and fracture structure of deep coal reservoir on coalbed methane occurrence-taking Daning-Jixian block in the eastern margin of Ordos Basin as an example. Coal Sci. Technol. 2024, 52, 106–123. [Google Scholar]
- Hou, X.W.; Liu, S.M.; Zhu, Y.M.; Yang, Y. Experimental and theoretical investigation on sorption kinetics and hysteresis of nitrogen, methane, and carbon dioxide in coals. Fuel 2020, 168, 117349. [Google Scholar] [CrossRef]
- Zhao, W.B.; Liu, H.L.; Wang, H.C.; Liu, D.X.; Li, X.B. The control effect of relative pore structure of coal-taking Yulin 8 # coal in Ordos Basin as an example. Coal Sci. Technol. 2024, 30, 1–17. [Google Scholar]
- Zhao, W.B.; Liu, H.L.; Wang, H.C.; Liu, D.X.; Li, X.B. The micro-pore characteristics of coal seam and the control of sedimentary environment on pore structure-Taking No.8 coal seam in Ordos Basin as an example. Coal Sci. Technol. 2024, 52, 142–154. [Google Scholar]
- Xiao, C.Y.; Han, D.L.; Zhang, J.J.; Chen, S.Z.; Qin, Z.Y.; Veerle, V. Effect of Coal Rank and Coal Facies on Nanopore–Fracture Structure Heterogeneity in Middle-Rank Coal Reservoirs. ACS Omega 2024, 9, 33279–33292. [Google Scholar] [CrossRef]
- Liu, Y.Y. Study on Physical Properties and Main Controlling Factors of Coal Reservoir in Kubai Coalfield; China University of Geosciences: Beijing, China, 2021. [Google Scholar]
- Guo, X.J.; Wang, L.; Yao, X.Z.; Li, X.; Zhang, L.K.; Wang, X.S. Geological characteristics of deep coal rock and main controlling geological factors of coalbed methane enrichment-Taking M area in eastern Ordos Basin as an example. Pet. Geol. Exp. 2024, 31, 1–11. [Google Scholar]
- Hu, J.B.; Liu, Z.D.; Duan, Y.S.; Ding, F.F. Sensitivity of small-scale faults curvature along the layer. Explor. Min. Geol. 2023, 59, 891–900. [Google Scholar]
- Pan, D. Sedimentary Systems’ Feature and Tectonic Evolution of the Upper Palaeozoic of the Ordos Basin; China University of Geosciences: Beijing, China, 2013. [Google Scholar]
- Liu, X.X. Study on the Sedimentary Environment of Upper Carboniferous Benxi Formation of Eastern Ordos Basin, China; Chengdu University of Technology: Chengdu, China, 2019. [Google Scholar]
- Chang, X.C.; Han, R.Y.; Zhang, J.J. Prediction of coal body structure of deep coal reservoirs using logging curves: Principal component analysis and evaluation of factors influencing coal body structure distribution. Nat. Resour. Res. 2024, 1–22. [Google Scholar] [CrossRef]
- Zhao, Z.; Xu, W.L.; Zhao, Z.Y.; Yi, S.W.; Yang, W.; Zhang, Y.Q.; Sun, Y.S.; Zhao, W.B.; Shi, Y.H.; Zhang, C.L.; et al. Geological characteristics and exploration breakthrough of coal-rock gas in Benxi Formation of Carboniferous in Ordos Basin. Pet. Explor. Dev. 2024, 51, 262–278. [Google Scholar] [CrossRef]
- GB/T 19222-2003; Sampling of Coal Petrology. Chinese National Standard: Beijing, China, 2003.
- GB/T 6948-1998; Microscopical Determination of the Reflectance of Vitrinite in Coal. Chinese National Standard: Beijing, China, 1998.
- GB/T 212-2001; Proximate Analysis of Coal. Chinese National Standard: Beijing, China, 2001.
- Mahamud, M.M.; Menéndez, J.M.; Sarquís, P.E. CO2 activation of chars: Effect of burn-off on texture and fractal properties. Fuel Process. Technol. 2014, 119, 41–51. [Google Scholar] [CrossRef]
- Tutolo, B.M.; Luhmann, A.J.; Kong, X.Z.; Saar, M.O.; Seyfried, W.E. CO2 sequestration in feldspar-rich sandstone: Coupled evolution of fluid chemistry, mineral reaction rates, and hydrogeochemical properties. Geochim. Cosmochim. Acta 2015, 160, 132–154. [Google Scholar] [CrossRef]
- Song, Y.; Zou, Q.L.; Su, E.; Zhang, Y.J.; Sun, Y.J. Changes in the microstructure of low-rank coal after supercritical CO2 and water treatment. Fuel 2020, 279, 118493. [Google Scholar] [CrossRef]
- Wang, L.L.; Long, Z.J.; Song, Y.; Qu, Z.H. Supercritical CO2 adsorption and desorption characteristics and pore structure controlling mechanism of tectonically deformed coals. Fuel 2022, 317, 123485. [Google Scholar] [CrossRef]
- Chandra, D.; Bakshi, T.; Bahadur, J.; Hazra, B.; Vishal, V.; Kumar, S.; Sen, D.; Singh, T.N. Pore morphology in thermally-treated shales and its implication on CO2 storage applications: A gas sorption, SEM, and small-angle scattering study. Fuel 2023, 331, 125877. [Google Scholar] [CrossRef]
- Küster, F.; Nikrityuk, P.; Junghanns, M.; Nolte, S.; Tünnermann, A.; Ackermann, R.; Richter, A.; Guhl, S.; Meyer, B. In-situ investigation of single particle gasification in a defined gas flow applying TGA with optical measurements. Fuel 2017, 194, 544–556. [Google Scholar] [CrossRef]
- Zhang, J.J.; Wei, C.T.; Zhao, C.J.; Zhang, T.; Lu, G.W.; Zou, M.J. Effects of nano-pore and macromolecule structure of coal samples on energy parameters variation during methane adsorption under different temperature and pressure. Fuel 2021, 289, 119804. [Google Scholar] [CrossRef]
- Zhao, W.B.; Liu, H.L.; Wang, H.C.; Liu, D.X.; Li, X.B. Research on the controlling effect of coal facies on pore structure—Deeply buried coal seam 8# in Yulin Area, Ordos Basin. Coal Sci. Technol. 2023, 52, 142–154. [Google Scholar]
- Zikovsky, L. Temperature dependence of adsorption coefficients of 222Rn on activated charcoal determined by adsorption-desorption method. Health Phys. 2001, 80, 175–176. [Google Scholar] [CrossRef]
- Zhang, J.J.; Wei, C.T.; Luo, J.H.; Lu, G.W.; Quan, F.K.; Zheng, K.; Peng, Y.J. Volume and Surface Distribution Heterogeneity of Nano-pore in Coal Samples by CO2 and N2 Adsorption Experiments. Acta Geol. Sin. Engl. Ed. 2020, 94, 1662–1675. [Google Scholar] [CrossRef]
- Yao, P.; Zhang, J.J.; Lv, D.; Vandeginste, V.; Chang, X.C.; Zhang, X.Y.; Wang, D.D.; Han, S.B.; Liu, Y. Effect of water occurrence in coal reservoirs on the production capacity of coalbed methane by using NMR simulation technology and production capacity simulation. Geoenergy Sci. Eng. 2024, 243, 213353. [Google Scholar] [CrossRef]
- Zhang, J.J.; Wei, C.T.; Yan, G.Y.; Lu, G.W. Structural and fractal characterization of adsorption pores of middle–high rank coal reservoirs in western Yunnan and eastern Guizhou: An experimental study of coals from the Panguan syncline and Laochang anticline. Energy Explor. Exploit. 2019, 37, 251–272. [Google Scholar] [CrossRef]


Disclaimer/Publisher’s Note: The statements, opinions and data contained in all publications are solely those of the individual author(s) and contributor(s) and not of MDPI and/or the editor(s). MDPI and/or the editor(s) disclaim responsibility for any injury to people or property resulting from any ideas, methods, instructions or products referred to in the content. |
© 2025 by the authors. Licensee MDPI, Basel, Switzerland. This article is an open access article distributed under the terms and conditions of the Creative Commons Attribution (CC BY) license (https://creativecommons.org/licenses/by/4.0/).