Article

Quantitative Identification of Emission Sources and Emission Dynamics of Pressure-Relieved Methane Under Variable Mining Intensities

1
School of Mine Safety, North China Institute of Science & Technology, Langfang 065201, China
2
College of Safety Science and Engineering, Xi’an University of Science and Technology, Xi’an 710054, China
3
School of Emergency Management and Safety Engineering, China University of Mining and Technology-Beijing, Beijing 100083, China
4
School of Safety Science and Engineering, Anhui University of Science and Technology, Huainan 232001, China
*
Author to whom correspondence should be addressed.
Processes 2025, 13(3), 704; https://doi.org/10.3390/pr13030704
Submission received: 28 January 2025 / Revised: 23 February 2025 / Accepted: 26 February 2025 / Published: 28 February 2025

Abstract

:
This study addresses the abnormal emission of pressure-relieved methane under high-intensity mining conditions by integrating geostatistical inversion, FLAC3D-COMSOL coupled numerical simulations, and stable carbon–hydrogen isotopic tracing. Focusing on the 12023 working face at Wangxingzhuang Coal Mine, we established a heterogeneous methane reservoir model to analyze the mechanical responses of surrounding rock, permeability evolution, and gas migration patterns under mining intensities of 2–6 m/d. Key findings include the following: (1) When the working face advanced 180 m, vertical stress in concentration zones increased significantly with mining intensity, peaking at 12.89% higher under 6 m/d compared to 2 m/d. (2) Higher mining intensities exacerbated plastic failure in floor strata, with a maximum depth of 47.9 m at 6 m/d, enhancing permeability to 223 times the original coal seam. (3) Isotopic fingerprinting and multi-method validation identified adjacent seams as the dominant gas source, contributing 77.88% of total emissions. (4) Implementing targeted long directional drainage boreholes in floor strata achieved pressure-relief gas extraction efficiencies of 34.80–40.95%, reducing ventilation air methane by ≥61.79% and maintaining return airflow methane concentration below 0.45%. This research provides theoretical and technical foundations for adaptive gas control in rapidly advancing faces through stress–permeability coupling optimization, enabling the efficient interception and resource utilization of pressure-relieved methane. The outcomes support safe, sustainable coal mining practices and advance China’s Carbon Peak and Neutrality goals.

1. Introduction

In recent years, global research on clean energy transitions and environmental sustainability has grown substantially [1,2,3]. Against this backdrop, coal and gas co-mining has emerged as an advanced mining philosophy, emphasizing the simultaneous and effective extraction of methane during coal production to maximize resource utilization while minimizing safety risks [4]. Gas drainage technology not only prevents gas overlimit incidents and coal–gas outbursts, thereby safeguarding miners’ lives, but also plays a vital role in developing coalbed methane resources and reducing greenhouse gas emissions [5,6]. Within China’s strategic push toward its “Carbon Peak and Carbon Neutrality” goals, efficient gas extraction holds profound significance for optimizing energy structures, curbing greenhouse gas emissions and achieving these dual carbon targets [7,8].
The escalating mining depths exacerbate technical challenges through low-permeability coal seams, where elevated geostresses and structural damage significantly impair drainage efficiency [9,10]. Protective seam mining has emerged as an economically viable pressure-relief permeability enhancement technology [11,12]. This technique achieves the following: (1) stress redistribution through overburden unloading, (2) fracture network development via mining-induced damage evolution, (3) permeability enhancement through porosity generation (up to 300% increase), and (4) outburst risk elimination via methane pressure reduction [13,14,15].
Despite its advantages, variable mining intensities significantly influence pressure-relief effectiveness. Rapid face advancement intensifies methane emission dynamics, potentially directing 60–80% of desorbed gas toward goaf areas and return airways. Without proper control measures, this may trigger methane exceedance incidents, jeopardizing face safety [16,17]. Current research emphasizes mining intensity as the dominant control parameter for emission flux in longwall configurations [18].
Although pressure-relief gas control technology via protective layer mining has been widely applied in engineering practice [19], critical gaps remain in existing research: (1) Limitations in Quantitative Gas Source Analysis: Most studies rely on single methods (e.g., statistical models or numerical simulations) for gas source contribution analysis [20,21], lacking cross-validation via multi-method integration, resulting in high uncertainty in source apportionment [22]. (2) The Neglect of Dynamic Mining Intensity Effects: Current models predominantly assume fixed mining intensities [23], failing to systematically investigate abrupt gas migration mechanisms under high-intensity mining [18]. (3) The Simplified Treatment of Geological Heterogeneity: Existing numerical models often assume homogeneous coal seams [14], inadequately capturing the impact of complex geological conditions on pressure-relief efficiency [24].
Despite significant advancements in natural gas extraction technologies, critical research gaps persist in the precise quantification of gas emissions under specific stratigraphic conditions, particularly at varying mining intensities. To address this gap, this study introduces a novel methodology combining integrated FLAC3D-COMSOL coupling simulations with stable carbon–hydrogen isotopic analysis. This approach enables the following: (1) the precise reconstruction of heterogeneous methane reservoirs within the protective coal seams of the Wangxingzhuang Mine; (2) the detailed decoding of mining intensity-dependent emission mechanisms; and (3) the targeted formulation of gas drainage strategies. By bridging theoretical modeling with empirical isotopic validation, this work not only resolves limitations inherent to prior methodologies but also delivers a comprehensive solution to enhance gas recovery efficiency and operational safety in multi-seam mining. Crucially, the findings directly support China’s Carbon Peak and Carbon Neutrality policy by advancing sustainable methane utilization and emission reduction frameworks [25,26,27].

2. Theoretical Analysis

2.1. Migration Dynamics and Transport Mechanisms of Pressure-Relieved Methane in Coal Seams

Under static conditions (non-mining state), coalbed methane maintains steady-state equilibrium through continuous adsorption–desorption cycles within the coal matrix, with the original gas distribution pattern remaining undisturbed in both coal seams and surrounding rock formations [28]. Following protective layer extraction operations, a dual stress-relief mechanism emerges: (1) substantial reduction in overburden pressure triggers coal matrix decompaction, and (2) geomechanical unloading induces structural damage through energy release. These coupled effects produce three-dimensional fracture network propagation, significantly enhancing coal seam porosity and permeability through two fundamental mechanisms: pressure-dependent sorption swelling reversal and matrix shrinkage-induced flow path development. Such petrophysical modifications facilitate accelerated methane desorption kinetics and effective gas drainage, achieving simultaneous reduction in reservoir pressure and gas content in protected seams. Substantial empirical evidence confirms the engineering efficacy of protective layer mining for reservoir stimulation, with notable theoretical contributions including Academician Qian Minggao’s pioneering “O-shaped ring” theory elucidating stress-dependent gas migration patterns during extraction processes [29]. Complementary field studies by Yang’s research team [24] employing CT scanning and 3D reconstruction techniques quantitatively characterized the stratified fracture architecture facilitating gas transport in stimulated coal masses. Figure 1 systematically illustrates this multi-phase permeability enhancement mechanism.
The dynamic mining advancement disrupts initial gas-phase equilibrium, initiating methane desorption–diffusion processes along concentration gradients toward low-pressure zones. Methane emission sources exhibit spatiotemporal heterogeneity, comprising four primary components: (1) residual gas in fragmented coal, (2) coal wall emissions, (3) goaf gas accumulation, and (4) adjacent seam gas migration. Post-extraction gas liberation occurs through two dominant pathways: (a) ventilation-driven discharge via return airways, and (b) air leakage-induced gas recirculation creating hazardous accumulations near upper corners [30]. Current computational fluid dynamics models require further validation against field measurements to fully capture these complex gas transport phenomena.

2.2. Numerical Model Theoretical Equations

A dual pore medium was typically used in the present study on gas-containing coal gas–solid coupling models, meaning that the coal body is thought to be made up of fractures and a matrix that contains the coal skeleton and pores [31]. The following are the fundamental presumptions of this physical model: (1) the coal body is an ideal continuum with elastic and plastic properties; (2) isothermal circumstances satisfy the ideal gas equation; and (3) Darcy’s law of percolation and Fick’s law of diffusion govern gas flow in pores and fractures, respectively [32,33].
The coal body stress field equation can be derived by taking into account the gas-containing coal body’s adsorption–desorption properties:
G u i , j j + G 1 2 μ u j , j i α m p m , i α f p f , i + p i = 0
This equation is based on the stress equilibrium of a dual pore-fracture medium model [34] where G is the shear modulus, MPa; u is the displacement, m, and μ is the Poisson’s ratio; α m is the effective stress coefficient of the pore; α f is the effective stress coefficient of the fissure; p i is the volumetric stress, MPa; u i , j j is the second-order partial derivatives of the displacement component in the i-direction in the j-direction; and p m , i and p f , i are the first-order partial derivatives of the coal body matrix, and coal body fissure gas pressure in the i-direction, respectively.
The permeability of coal is cubically related to its porosity [35]. Based on this relationship, the formula for calculating permeability is derived as follows:
k = k 0 1 + c p f φ f φ f 0 3
k = ( 1 + c p f ) 1 + α m ( p m p m 0 ) + α f ( p f p f 0 ) E φ f 0 + a φ f 0 K 1 E 1 p m p m + b p m 0 p m 0 + b 3
where φ f is the porosity of coal fissure, %; φ f 0 is the initial porosity of coal fissure, %; K 1 is the bulk modulus of coal, MPa; p m is the coal matrix gas pressure, Pa; p m 0 is the initial gas pressure of the coal matrix, Pa; p f is the gas pressure of coal fissure, Pa; p f 0 is the initial gas pressure in coal fissure, Pa; a is the Langmuir volume constant, m3/t; b is Langmuir pressure constant, MPa; k is the coal body’s absolute permeability, mD; ρ g is the coal body’s initial permeability, mD; and c is the Klinkenberg coefficient.
The mass of gas stored in the coal matrix per unit volume includes both the gas adsorbed in the pores and the gas free in the pores [36]. The mass of gas in coal seam fractures equals the mass of gas in the free state. Gas volume is stored in each volume of coal body.
ρ = ρ 1 + ρ 2 = ρ g ρ s a p m p m + b + φ m p m M c R T
where ρ is the amount of stored gas in unit volume of coal body, kg/m3; ρ 1 is the adsorbed gas content in the unit coal matrix, kg/m3; ρ g is the density of gas, kg/m3; ρ s is the density of coal, kg/m3; ρ 2 is the mass of free gas in coal matrix, kg/m3; φ m is the porosity of coal matrix, %; M c is the molar mass of gas, kg/mol; R is the ideal gas constant, 8.314 J/(mol·K); and T is the internal temperature of coal, K.
The gas in the fracture flows out in the Darcy seepage mode as the negative energy source, and the mass conservation law corresponds to the unit volume of coal [37]:
Q 1 = m t = M c τ R T ( p m p f )
ρ g φ f t = Q 1 ( ρ g v )
υ = k μ p f
After bringing Equation (4) into Equation (5), the time dependence equation of gas pressure within the coal body matrix is obtained:
p m t = V m ( p m p f ) ( p m + b ) 2 τ a b R T ρ s + τ φ m V m ( p m + b ) 2
where Q 1 is the amount of gas change (mass source) per unit of coal body matrix, kg/m3·s; v is the speed of gas seepage in the cracks of the coal body, m/s; μ is the dynamic viscous damping coefficient of gas, Pa·s; and τ is the time constant associated with the gas flow process, s.
The preceding equations describe the migration mechanism and law of gas in coal. After face mining, gas pressure in the coal seam varies, affecting coal structure, porosity, permeability, and other coal seam characteristics, as well as gas movement in the coal body. The fluid–structure coupling model is defined as the combination of Equations (1), (5) and (7). Diffusion and percolation are the mechanisms by which gas moves through the coal body. Drilling destroys the stress equilibrium of the raw coal body, causing the adsorbed gas in the coal body matrix to desorb and diffuse into the cracks according to Fick’s law, thus engaging in percolation. The gas–solid coupling model of coal and gas is created by the interaction and coupling of gas migration in coal and the coal stress field.

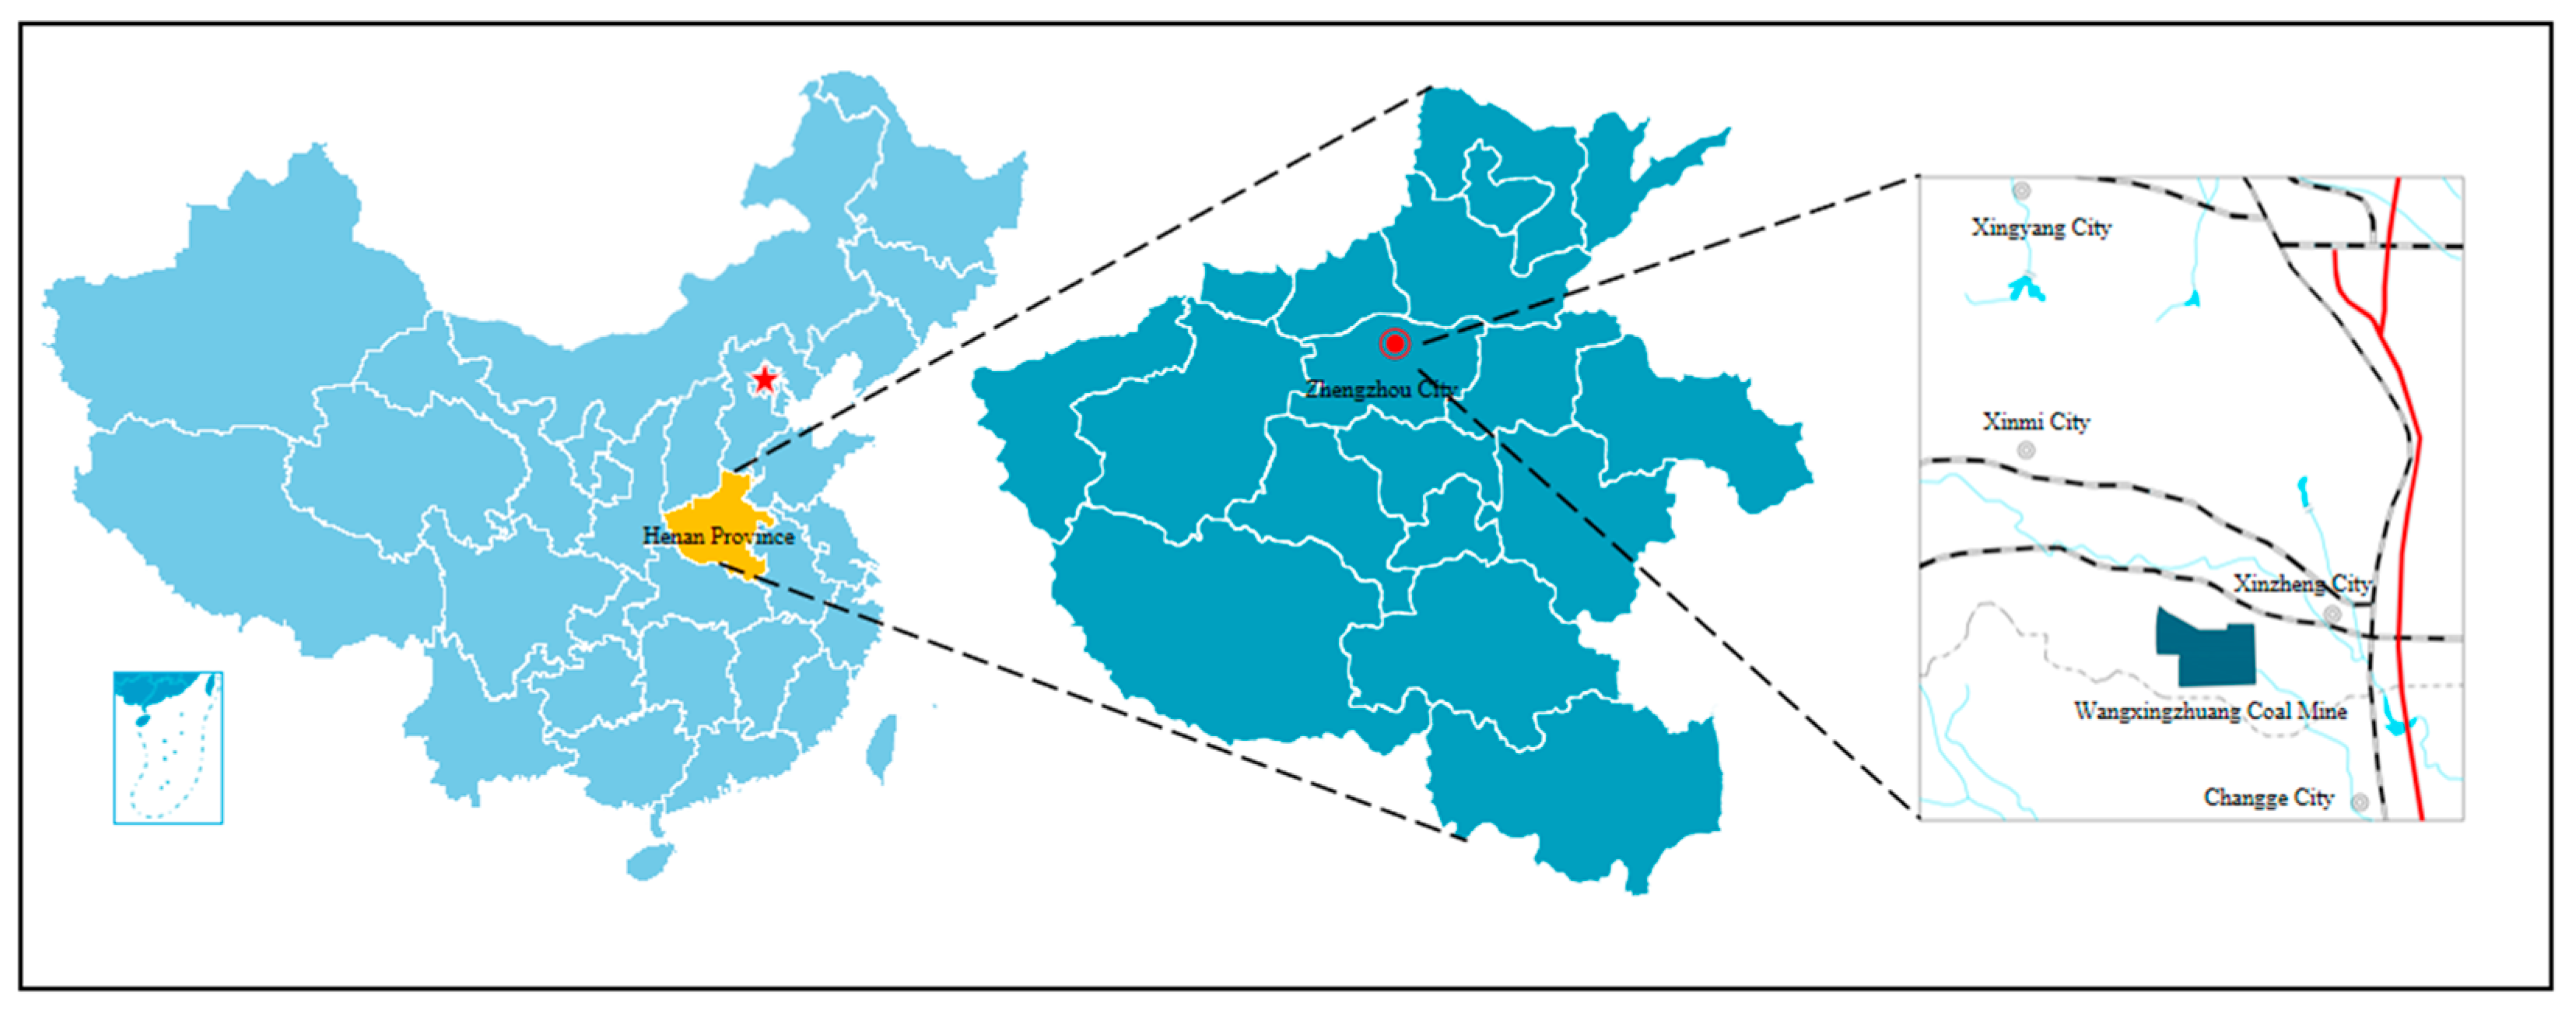
3. Engineering Background

3.1. Overview of the Test Area

Wangxingzhuang Coal Mine is located in the southwestern part of Xinzheng City, within Zhengzhou City, Henan Province, China, and is shown in Figure 2. The mine uses vertical shafts to extract seams No. 23 and 21, which are about 20 m apart. The seam No. 21 is prone to the risk of coal and gas outbursts. The thickness of seam No. 23 ranges from 0 to 6.54 m, with an average of 1.54 m, and is largely minable. In contrast, the seam No. 21 exhibits thickness varying from 0 to 21 m, with an average thickness of 6.8 m, and is characterized as a ‘three soft’ seam, indicating a soft roof, floor, and coal body, which exhibits typical features of deep coal seams in China. This seam is notably impermeable, making gas extraction challenging.
For the purposes of this study, the 12021 and 12023 working faces have been designated as the experimental areas. The 12023 working face, which consists of fine-grained sandstone and mudstone above and sandy mudstone below, exhibits a broad and gentle monoclinal structure. The seam’s dip angle varies from 6 to 14 degrees, averaging at 8 degrees, with an average seam thickness of 1.7 m, and is considered to have a relatively simple structure. The 12021 working face, situated beneath, presents the following geological features: an average coal seam thickness of 7.0 m, an average inclination angle of 8 degrees, a seam depth ranging from 385 to 427 m, an inclined width of 170 m, and a strike length of 640 m.

3.2. Gas Base Parameters

Table 1 and Table 2 show the results from evaluating the gas parameters of the 12021 and 12023 working faces. The 12023 working face has a maximum initial gas pressure of 0.36 MPa and peak gas content of 6.50 m3/t. In comparison, the 12021 working face has a higher initial gas pressure of 0.78 MPa and a higher gas content of 10.52 m3/t. The seam’s firmness coefficient is 0.14, with permeability coefficients of 0.0145 m2/(MPa) for both permeability and gas permeability, along with an additional coefficient of 0.0145 m2/(MPa2·d). The coal seam features a loose structure and low permeability, complicating gas extraction efforts. This is further evidenced by the borehole’s gas flow attenuation coefficient of 0.07 d−1. These parameters are critical for designing tailored gas control strategies, as the seam No. 21 poses substantial safety and operational challenges during mining.
Given the geological context and a thorough review of the gas parameters for each seam at Wangxingzhuang Mine, the decision was made to designate the seam No. 23, which presents comparatively lower gas pressure, as the upper protective layer for extraction. The actual initial gas pressure data measured at the 12021 working face were visualized on a gas pressure contour map, revealing localized gas pressures of approximately 0.80 MPa in areas prone to gas aggregation, indicating a heightened risk of gas outbursts and the potential for coal and gas outburst incidents, as depicted in Figure 3. The blue line in Figure 3 delineates the partial scope of the numerical simulation study.

4. Numerical Simulation

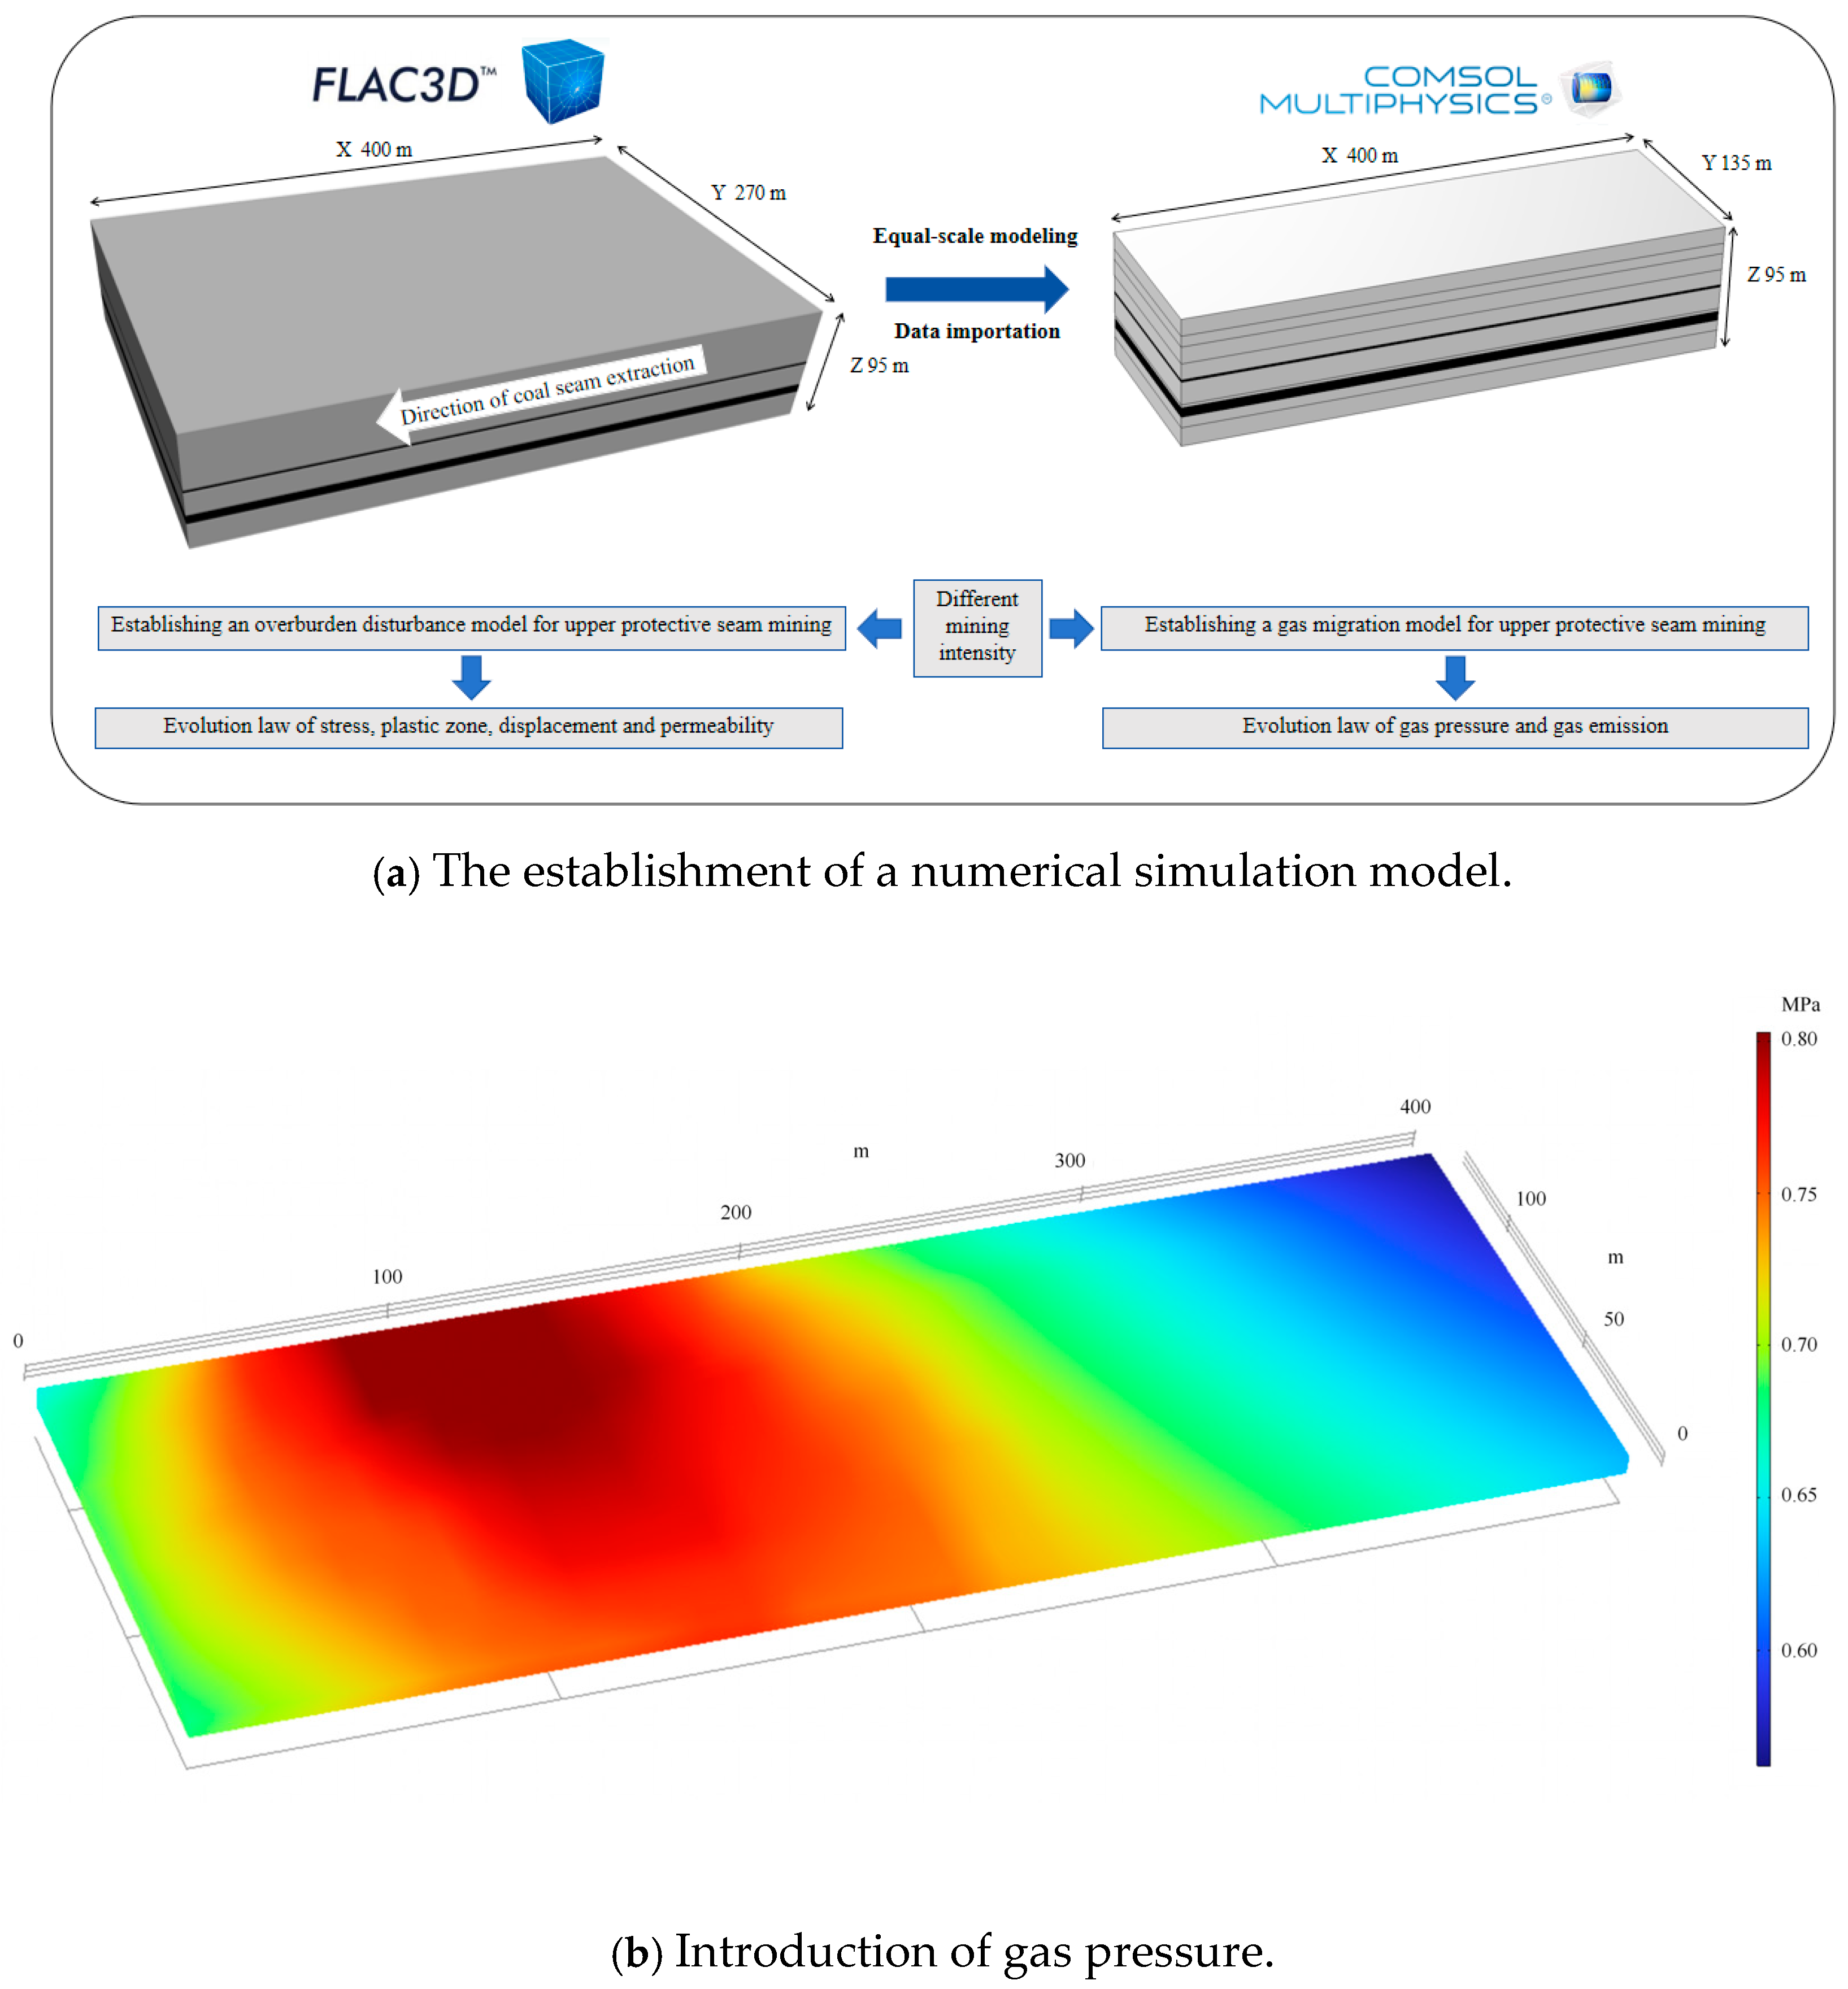
4.1. Model Construction

This work uses the FLAC3D-COMSOL linked numerical simulation approach, as shown in Figure 4. The study object is Wangxingzhuang Coal Mine’s 12023 protective layer working face. FLAC3D (v6.0) software was used to create a proportionate horizontal coal seam model (X × Y × Z = 400 m × 270 m × 95 m). Although the stress distribution exhibits symmetry at the Y = 135 m plane, the full model was retained in FLAC3D to fully capture the effects of actual geological conditions, such as non-uniform stress fields and localized lithological variations. While the full model increases computational demands, it avoids the potential underestimation of plastic failure depth and stress release rate caused by symmetric boundary constraints. Subsequent COMSOL (v6.1) simulations (based on the symmetric Y = 135 m plane) were employed to simplify gas migration analysis, focusing on dominant mechanisms under symmetric conditions (Figure 4). This two-stage modeling approach balances computational efficiency with geological authenticity. The linked simulation was accomplished by importing stress–strain data from FLAC3D into COMSOL using the technique described in Figure 4a.
The grid convergence study assessed the sensitivity of the simulation results to grid resolution by testing three grid configurations: coarse grid (FLAC3D element size = 2 m, COMSOL element size = conventional), baseline grid (FLAC3D = 1 m, COMSOL element size = refined), and fine grid (FLAC3D = 0.5 m, COMSOL element size = highly refined). Figure 5 shows the data change in one monitoring point with different grid densities. The results showed that the difference in maximum vertical stress in the stress concentration zone between the baseline and fine grids was less than 2%, confirming grid independence.
To accurately portray gas geological conditions, the model’s beginning condition was set to the real gas pressure of the coal seam. Given the comparatively low gas pressure of the seam No. 23, the starting pressure for the whole coal seam was set consistently at 0.36 MPa. The geological conditions of the seam No. 21 were carefully reversed using geological statistical numerical modeling. In the COMSOL simulation, the isobar map of the observed gas pressure was identified and integrated into the model as the beginning condition for the seam No. 21 to replicate its non-uniform occurrence features and increase simulation accuracy.
Furthermore, the structural stress was simulated by increasing the lateral pressure coefficient (K = 1.15) to better model and anticipate gas migration behavior throughout the mining operation of the protected coal seam. To prevent boundary impacts during mining, a 50 m coal pillar was left at each end of the coal seam. The mining intensity was expressed by digging various distances. Combining the real production situation on site with experimental needs, mining intensities of 2, 4, and 6 m/d were represented by digging 2, 4, and 6 m, respectively. Table 3 and Table 4 indicate the particular values for coal and rock mechanical characteristics, as well as the key simulation parameters.

4.2. Analysis of Numerical Simulation Results

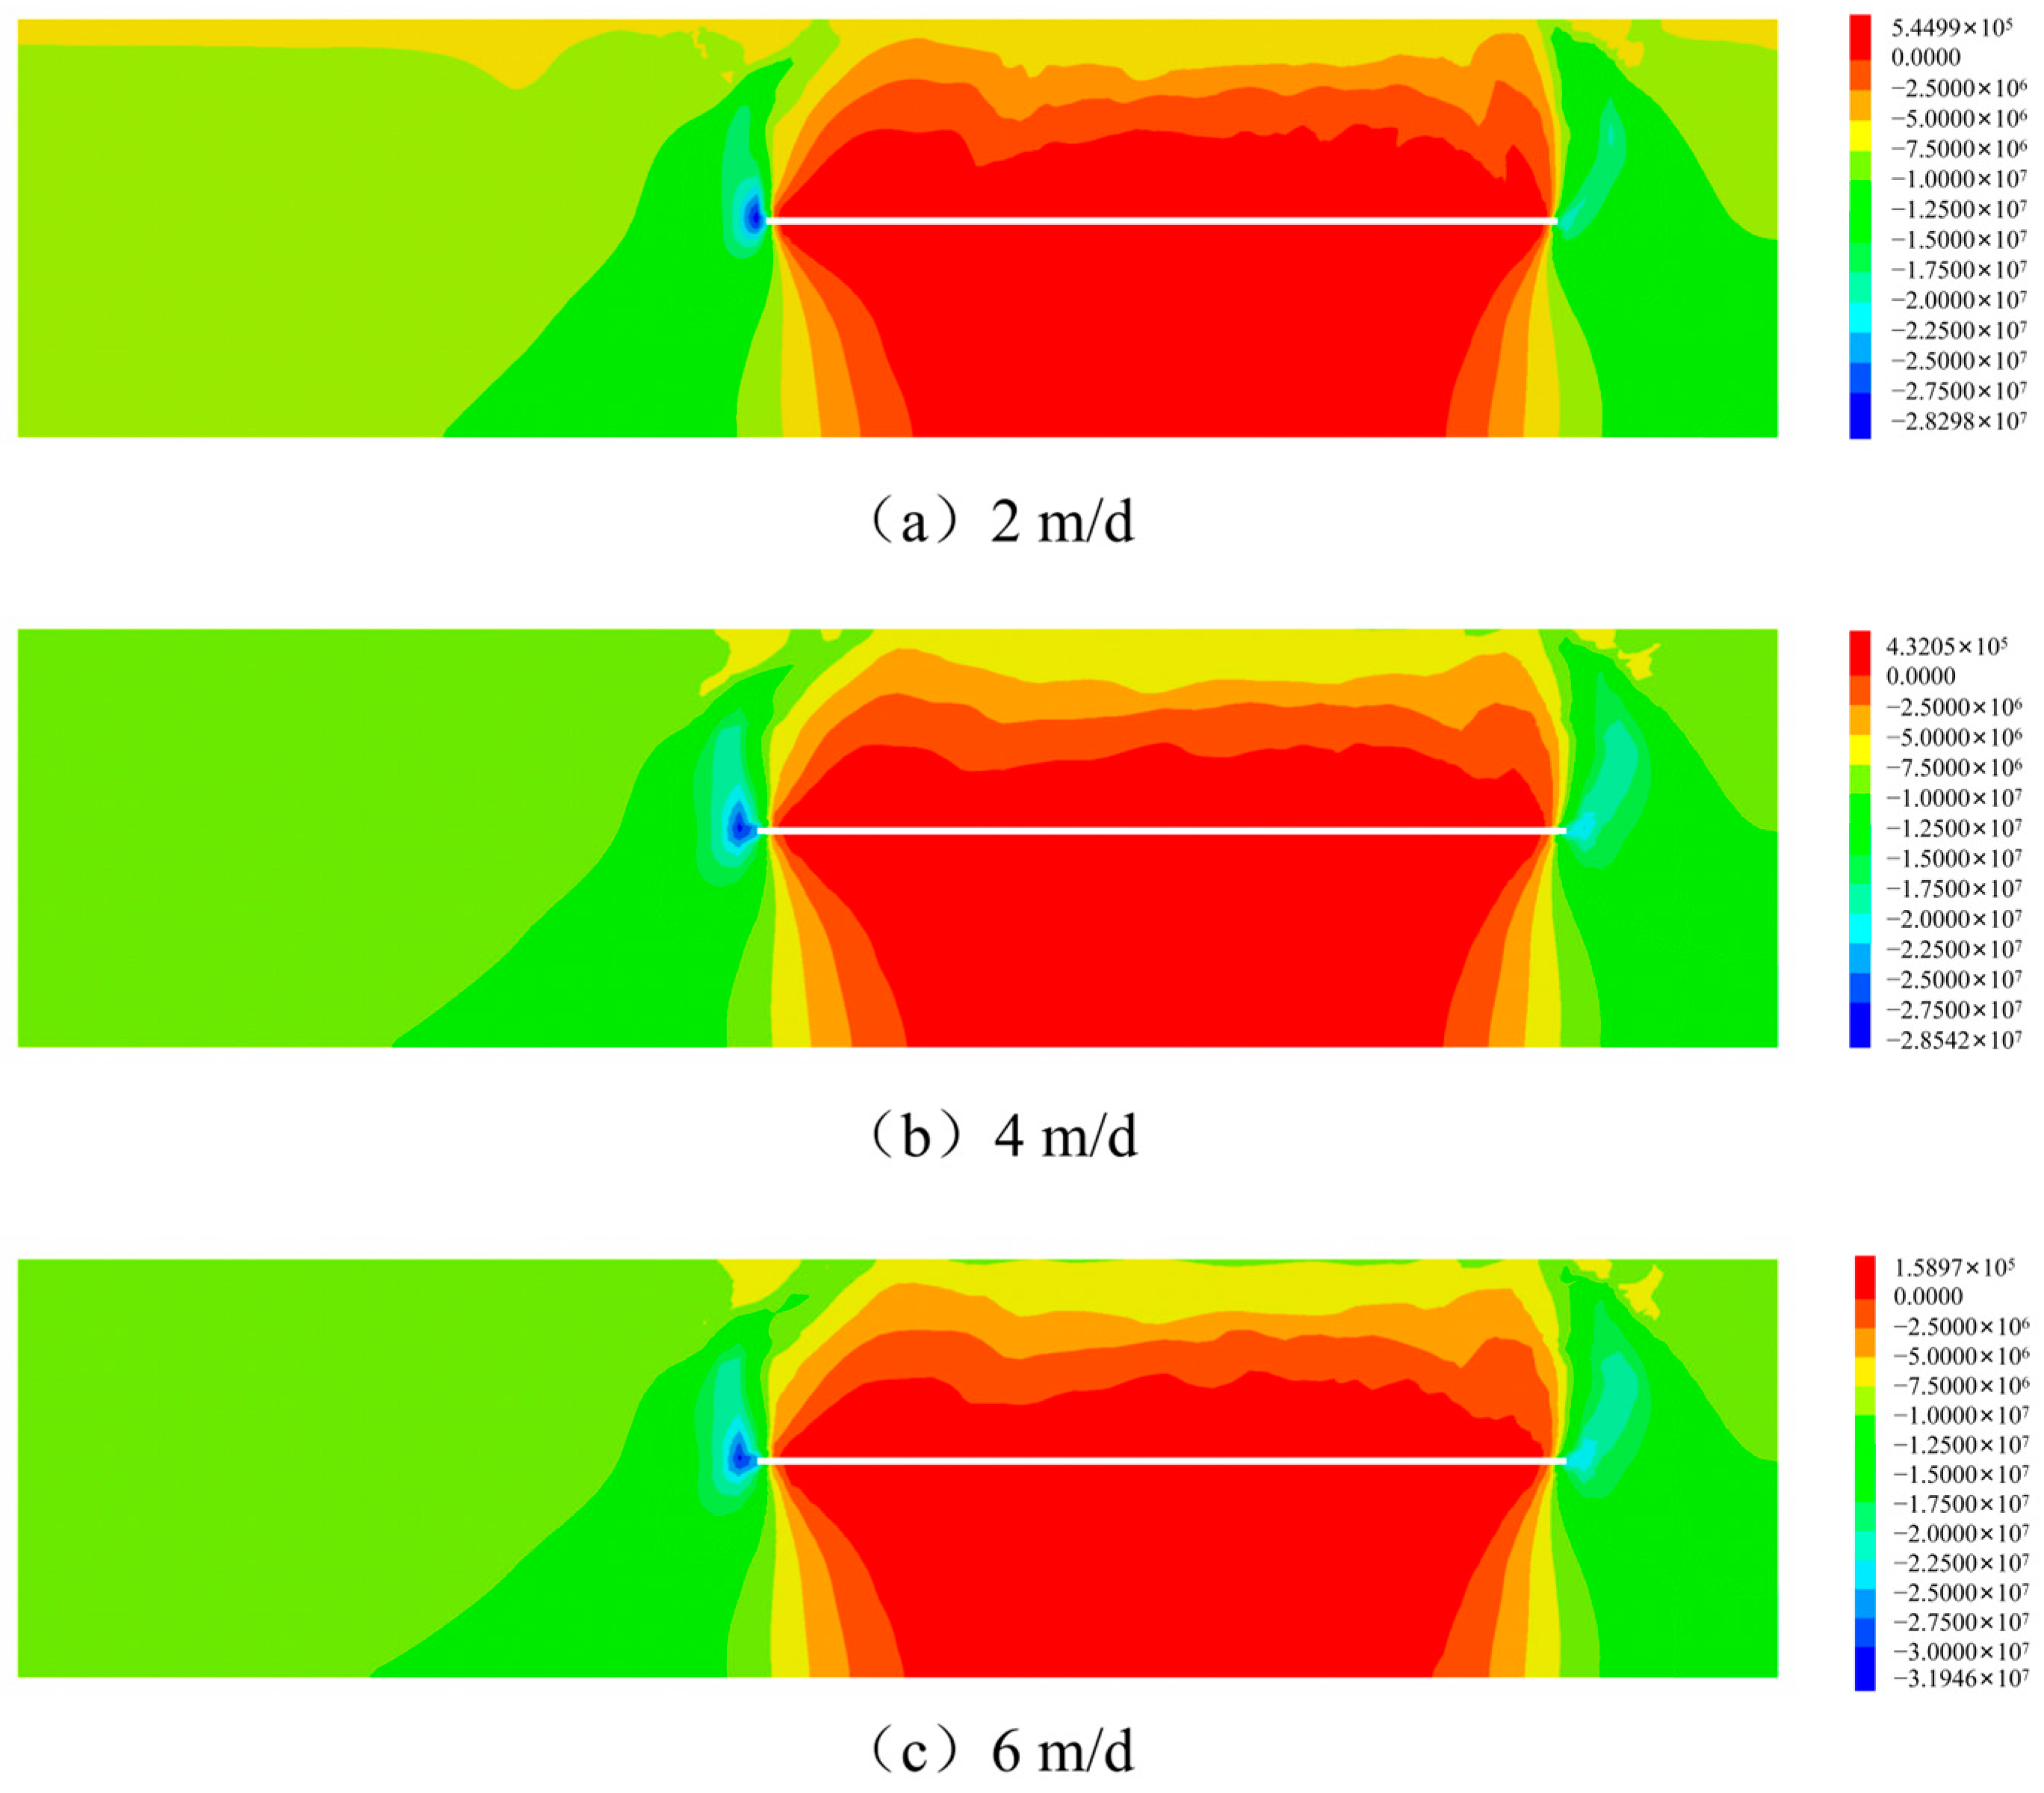
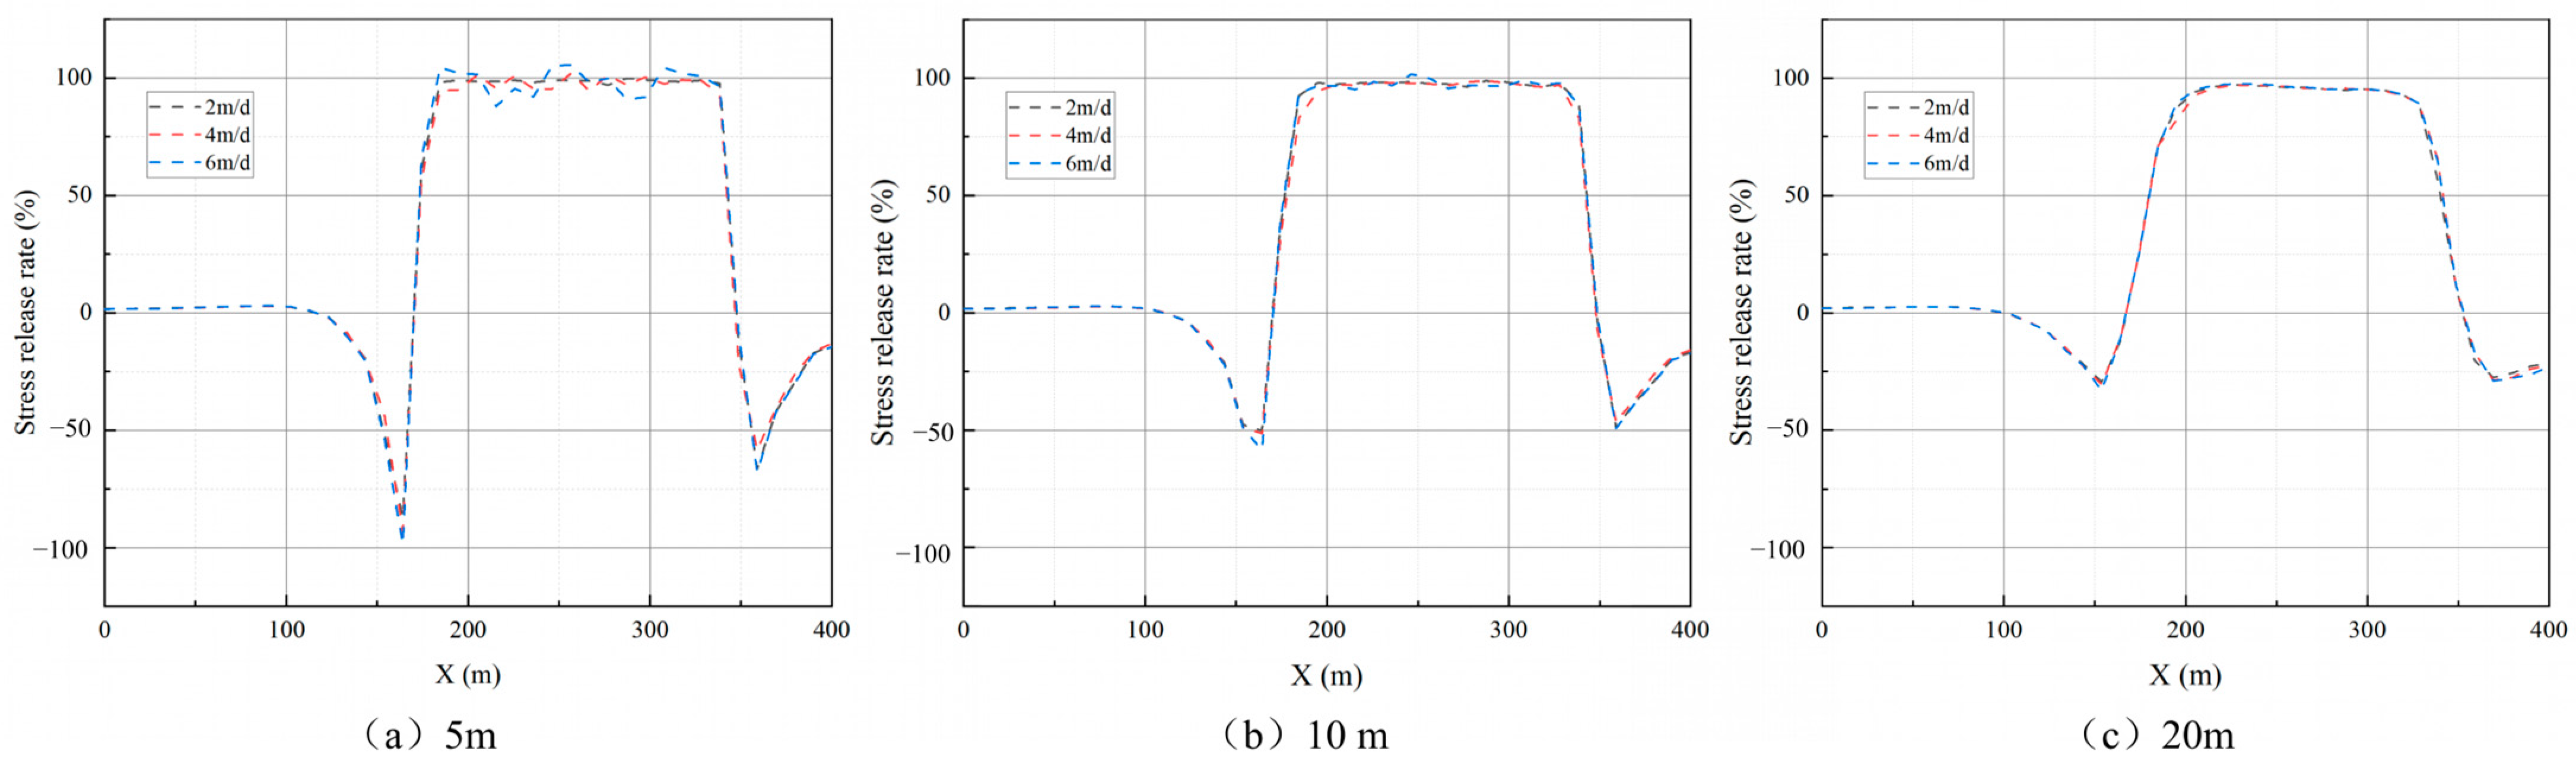
4.2.1. Mechanical Failure Characteristics Under Different Mining Intensities

(1)
Analysis of vertical stress
Figure 6 depicts the vertical stress distribution throughout the advancing process of the protective layer working surface at 2, 4, and 6 m/d. As shown in Figure 6, following mining, the overlying rock stress experiences a process of destruction and rebalancing, during which the coal wall is pressed by the overlaying rock above the goaf, and stress concentrations occur within 50 m of the goaf. When the working face is progressed to 200 m, the stress distribution at various mining intensities is a roughly symmetrical trapezoid. When the advancing speed is 2 m/d, the maximum vertical stress in the stress concentration area in the advancing direction of the working face is 28.30 MPa; when the advancing speed is 4 m/d, this value increases by 0.83%, with a slight increase; when the advancing speed is 6 m/d, this value increases by 12.89%, with a significant increase. The vertical stress is higher in the stress concentration region.
Figure 7 depicts the matching stress release rate under the bottom plate of the protective layer’s working face throughout the advancing process at 2, 4, and 6 m/d. As shown in Figure 7a, when the working face of the protective layer is advanced to 180 m, the 5 m monitoring line below the floor shows obvious pressure release and pressure concentration. However, a stress release zone of coal and rock mass is formed under the goaf, but the performance varies depending on the mining intensity. When the propulsion speed is 2 m/d, the stress release rate remains steady at around 100%. As mining intensity increases, the oscillation amplitude of stress release rate approaching 100% grows greater. Figure 7b shows that the stress release rate at 10 m below the floor’s bottom decreases in comparison to the same period, the peak value decreases from 100% to 98%, and the oscillation degree near the peak value of 6 m/d decreases, indicating that the influence on the gob’s downward extension is gradually weakened. Figure 7c shows that, in the coal body of the protected layer 20 m below the mining hole, the maximum stress release rate remains steady at 97%. At the same time, it is clear that, as the mining intensity of the working face increases, the stress concentration phenomenon in the advancing direction worsens, and, similar to the change in stress release rate under the goaf, the stress concentration degree decreases with the downward movement of the monitoring line, from −97% to −33%.
Overall, mining the protective layer reduces strain on the coal and rock mass underneath it. As the mining intensity of the working face increases, so does the range and degree of this impact, and the mining influence of the seam No. 21 steadily improves.
(2)
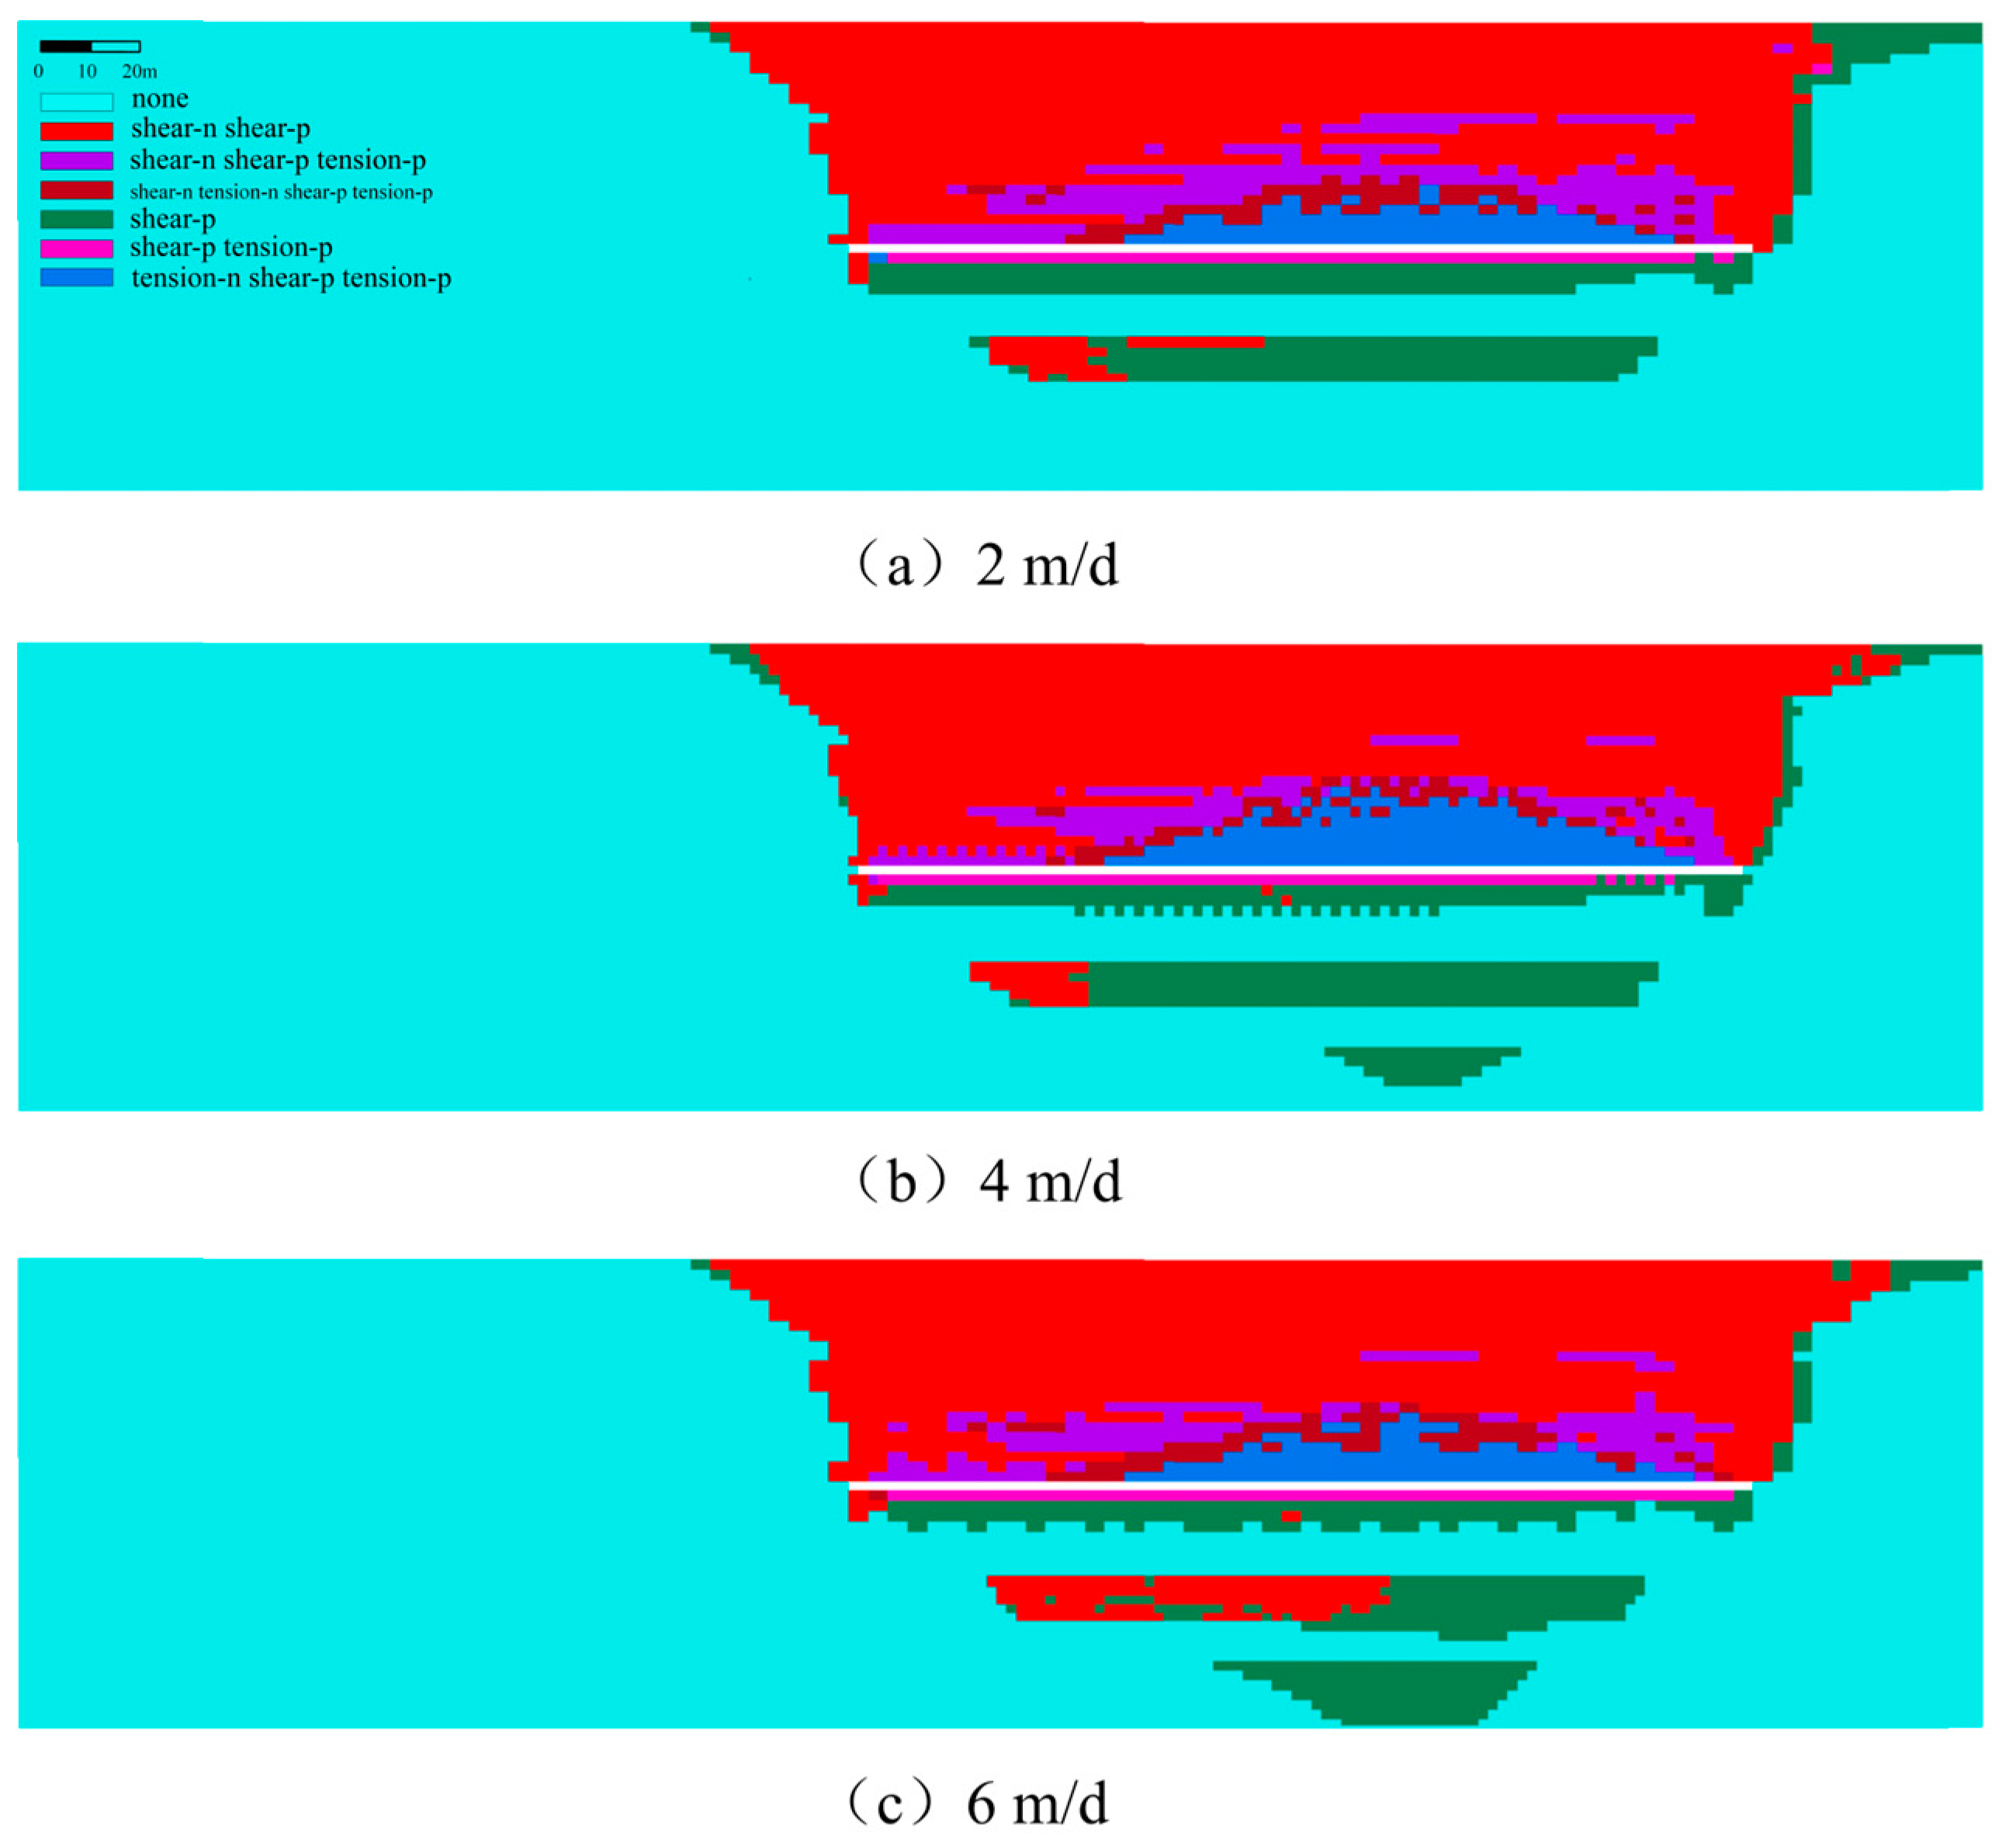
Analysis of plastic zone
The cloud map illustrated in Figure 8 is used to analyze the distribution of the plastic zone of coal and rock mass while advancing the protective layer working face. Figure 8 shows that, following coal seam mining, shear and tensile failure occurs in the coal and rock mass of nearby coal seams, with shear failure being the most common failure type. Mining causes very little damage to the bottom coal rock bulk, but the top coal rock layers in the goaf suffer considerable damage and caving. In comparison to the higher layer, the bottom layer of coal rock is less impacted by mining, but the upper layer displays more visible damage and caving. At this point, the growth of the fracture network in the coal seam becomes exceedingly intricate; the number of fractures increases, as does the distribution pattern. Rapid propulsion causes the coal body to be subjected to high stress in a short period of time, reducing its strength and increasing the likelihood of shear and tensile failure. The porosity and fracture rate of the coal body rise as the degree of coal crushing increases, providing more routes for the rapid release of gas, and the increased number of these channels allows the gas to move from the deep of the coal seam to the gob and working face faster.
As illustrated in Figure 8a, when the working face is progressed from 2 m/d to 180 m, the deepest plastic failure depth directly below the working face can be approximately 26.3 m, and such failure extends to both sides in the seam No. 21. Figure 8b indicates that the plastic zone of the goaf floor has a maximum failure depth of 42.0 m. Figure 8c demonstrates that the greatest depth of plastic failure has increased marginally to 47.9 m. It demonstrates that quicker propulsion causes a bigger region of plastic deformation because it accelerates the rate of stress accumulation and release in the ground. In contrast, the slower the progress, the smaller the region of plastic deformation, since the ground stress has more opportunity to gradually dissipate. At higher propulsion rates (such as 6 m/d), the bottom plate may be subjected to more stress, resulting in a deeper depth of failure. At slower propulsion rates, such as 2 m/d, the floor failure depth may be reduced because the stress distribution is more uniform, and the formation has more time to react.
(3)
Analysis of pressure-relief range of bottom plate
Figure 9 depicts the expansion and deformation rate of the seam No. 21 in relation to the trend and dip of the top and bottom plates during the advancing process of the protective layer working face at 2, 4, and 6 m/d. Figure 9 shows that the protected layer’s expansion rate progressively increases from both sides to the middle and remains steady at more than 3‰, meeting Chinese rules on protective layer mining growth and deformation [38]. As a result, it may be concluded that mining the higher protective layer has the desired impact. Based on a critical value of 3‰, the working face has an effective discharge angle of 62°, while the dip has an effective discharge angle of 58°. The pressure-relief range on both sides is symmetric. Based on this pressure-relief range, a 3D pressure-relief model of protective layer mining is created in COMSOL for future modeling.

4.2.2. Gas Transportation Patterns
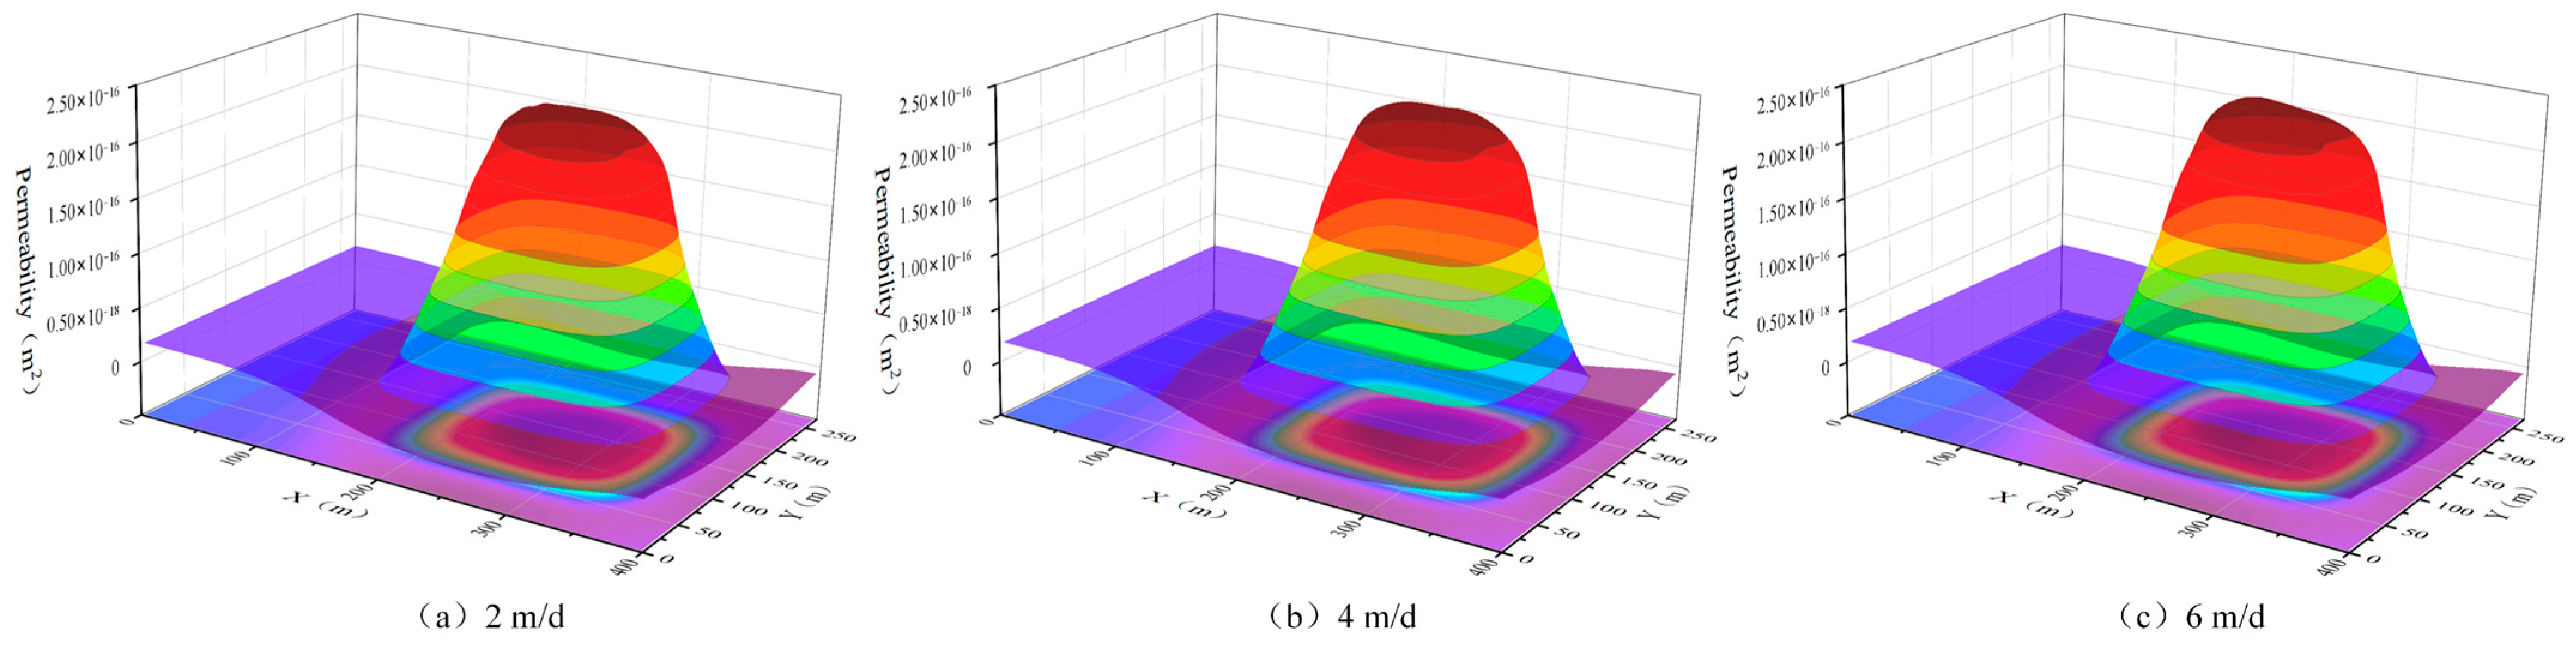
(1)
Analysis of permeability
Figure 10 illustrates the permeability distribution of seam No. 21 during the advancement process under three mining intensities: 2, 4, and 6 m/d on the protective layer working face. As mining space expands, the depressurization of floor strata intensifies, leading to a decrease in effective stress and an extension of floor failure depth towards seam No. 21. Permeability rises rapidly in the plastic failure zone, peaking at the center of the goaf, indicating the strongest permeability enhancement in this area. Near the goaf, the permeability of the protected coal seam drops below pre-pressure-relief levels due to rock mass compression from stress concentration, gradually increasing towards the periphery until it matches the original coal body’s permeability. As the working face progresses, the permeability spectrum of coal and rock broadens, making the enhancement effect more pronounced. At a mining intensity of 2 m/d and a distance of 180 m, the permeability of seam No. 21 reaches 2.45 × 10⁻¹⁶ m2, 218 times that of the original seam. At 6 m/d, the permeability values are 2.47 × 10⁻¹⁶ and 2.51 × 10⁻¹⁶ m2, 220 and 223 times the original, respectively, showing increases of 0.82% and 2.45%. This study demonstrates that increased mining activity elevates the coal seam’s peak permeability.
Figure 9 and Figure 10 illustrate that mining operations induce significant expansion deformation in the coal body of the protected layer within the high-strength pressure-relief and reflection enhancement zone, leading to a substantial rise in permeability. This pressure relief triggers extensive gas desorption, which moves from interlayer cracks to floor cracks. The formation of a network fracture system in the floor strata enhances connectivity between the protected layer and the coal face, establishing an effective pathway for gas flow. This process not only facilitates gas release but also creates a migration route essential for coal mine safety and gas management. The permeability of coal is closely linked to its porosity and fracture rate. Rapid advancements increase both the porosity and fracture rate of coal, thereby boosting its permeability. As permeability rises, the resistance to gas flow within the coal body decreases, while the speed and volume of gas emissions increase significantly.
(2)
Transportation of gas from this coal seam
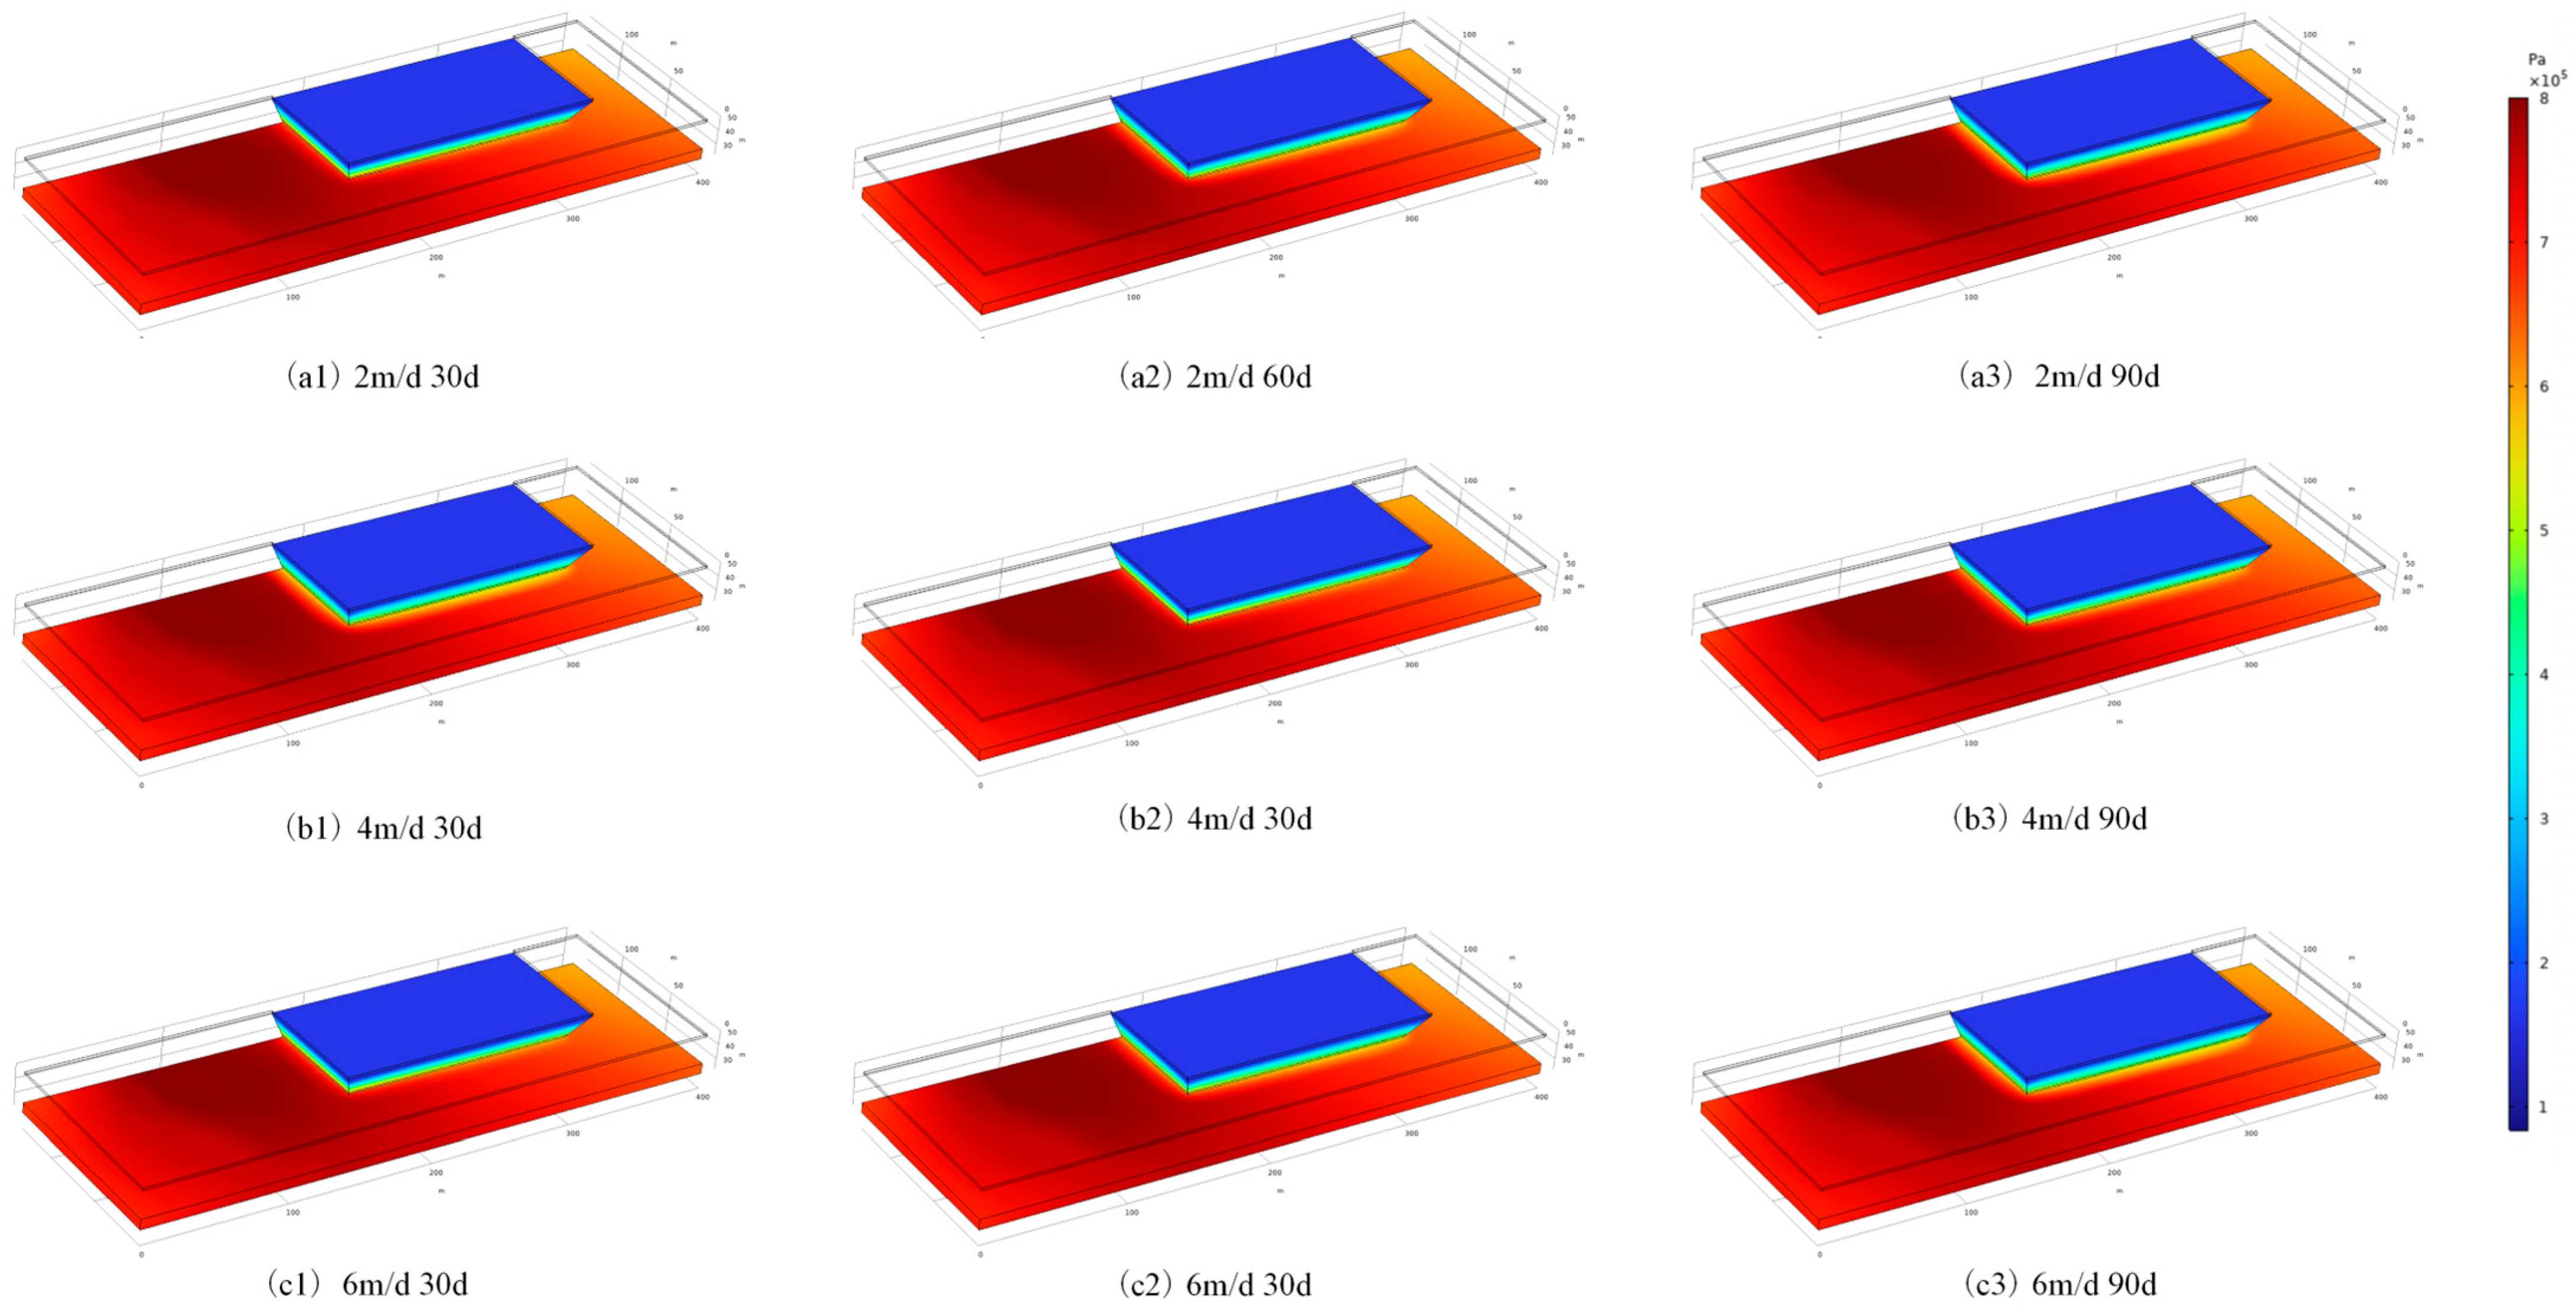
Figure 11 illustrates gas migration within the main coal seam as the protective layer working face advances at mining intensities of 2, 4, and 6 m/d. The figure presents simulated experimental results analyzing dynamic changes in gas pressure distribution across different mining intensities. The data are divided into three time intervals: 30, 60, and 90 days. Figure 11(a1–a3) reveals a significant decline in gas pressure around the goaf over time, indicating that gas pressure loss increases and the affected area expands as time progresses, assuming a constant mining distance. Figure 11(b1–b3,c1–c3) demonstrate that higher mining intensities of 4 and 6 m/d produce similar gas pressure trends but with a greater magnitude and scope of pressure reduction. This indicates that increased mining intensity enhances the unloading effect, accelerating gas migration and release. This study highlights that, as the working face advances, the coal seam experiences substantial unloading, leading to a notable decrease in gas pressure. This pressure drop creates a gradient between the coal seam and the goaf and return airway, driving gas migration and release through preferred pathways from the coal seam to these areas.
(3)
Characteristics of gas transportation in neighboring seam
Figure 12 displays gas migration in the neighboring coal seam as the protective layer working face advances at three mining intensities: 2, 4, and 6 m/d. The image clearly depicts the spread of gas pressure beneath the goaf floor. The fall in gas pressure below the goaf floor is considerably negatively associated with distance from the goaf floor; the drop in gas pressure is more apparent near the goaf’s core. This phenomena is primarily driven by the mining-induced unloading effect, which causes gas in the protected coal seam to migrate upward to the goaf, resulting in a steady drop in the gas pressure of the protected layer. Furthermore, as mining activities continue, the extent of the unloading impact increasingly widens.
The modeling findings reveal that the gas pressure in the gas collection area in the center of the shielded coal seam reduces dramatically as mining time increases. The findings also show that, when the mining intensity at the working face increases, the tendency of gas migration from the protected coal seam along the unloading area to the upper coal seam goaf diminishes. The increased mining intensity has a detrimental effect on gas migration and release, making it harder to relieve gas pressure in the protected layer. These findings have significant theoretical and practical implications for optimizing coal mine gas management systems and increasing coal mine safety production.
(4)
Analysis of gas outflow
Figure 13 illustrates the impact of different mining intensities on gas migration. Figure 13a,b indicate that adjusting mining intensity consistently influences gas migration. Specifically, higher mining intensities enhance coal seam permeability, leading to increased gas migration rates and reduced gas pressure in both the primary coal seam and adjacent layers. This suggests that mining intensity significantly regulates gas pressure distribution within the coal seam. Figure 13c presents visual data on gas outflow, derived from a systematic analysis of gas pressure changes following the advancement of the protective layer working face at mining intensities of 2, 4, and 6 m/d. The simulation data reveal that increasing mining intensity significantly boosts gas outflow. At a mining intensity of 6 m/d, the absolute gas outflow from the neighboring layer constitutes 82.43% of the total gas output. As mining intensifies, both the total gas outflow and the proportion from the surrounding stratum increase.
Coal mining accelerates the release of gas pressure within the coal body. This rapid release causes gas to desorb and flow into the goaf and working face. The rate of gas pressure decrease is directly related to mining speed; faster mining speeds result in quicker gas pressure release. Consequently, the gas pressure gradient within the coal seam intensifies, with higher pressures in deeper regions compared to the goaf and working face. This increasing pressure gradient drives gas to migrate swiftly from high-pressure to low-pressure areas, enhancing the rate and volume of gas outflow.

5. Field Analysis

5.1. Quantitative Validation Analysis of Gas Outflow Sources

In the course of employing the protective layer mining strategy, the depressurization effect leads to a substantial migration of gas into the mining airspace. As a result, real gas emissions from the working face exceed predicted values, causing gas concentration in the working face and return airflow to exceed safe limits, greatly limiting the efficient mining capacity of the upper protective layer working face [39]. Similar observations have been made during protective layer mining operations at Wangxingzhuang Mine, where pinpointing the specific sources of gas outflow has proven challenging. To address this, we used field research, carbon isotope analysis, and numerical simulations to quantify and identify the sources of gas during retreat mining of the protective layer, allowing us to deploy tailored gas management measures.
A thorough analysis identified the primary sources of gas emission at the protective seam working face in Wangxingzhuang Mine as two coal seams: the currently mined seam (23) and the adjacent seam (21). Utilizing stable carbon and hydrogen isotope techniques, we accurately and quantitatively analyzed the gas sources. Based on the principles of carbon and hydrogen isotope tracing, mixed gas samples were collected from the extraction pipe at intervals of 140 m, 180 m, 220 m, 260 m, and 300 m along the retreating open area of the working face, yielding a total of five sets of samples. The composition and carbon and hydrogen isotopes of these samples were measured, and the proportion of gas emission sources from the borehole was determined using a two-end element calculation and analysis model. Table 5 presents the isotope measurement outcomes for end-element gases from each coal seam within the mining area and at various sampling points.
The data in Table 5 show that the proportion of gas emanating from the adjoining layer stays rather consistent as the working face advances, with the greatest proportion reaching 77.88%. This is due to the fact that the seam No. 23 is originally mined as a protective layer, while the seam No. 21 is located at the bottom plate fracture zone of the seam No. 23. The mining decompression effect of the seam No. 23 causes a considerable release of gas from the 21 coal seam, making it a focus point for gas management in the airspace zone during the extraction of the 23 protective layer.

5.2. Analysis of Past Gas Outflow Data

The temporal variation in gas outflow can be charted using data from the 11053 working face within the seam No. 23, the 11051 working face within the seam No. 21 of the protective layer, and the 11011 working face within the seam No. 21—which shares similar geologic conditions with the 11051 and is unaffected by the protective layer’s mining activities at Wangxingzhuang Coal Mine—as shown in Figure 14.
The data analysis demonstrates that, during the retreat mining of the 11053 working face in protected seam 23, the stress alleviation of the surrounding rock of the bottom plate resulted in the formation of fissures and subsequent stress redistribution within the protected seam. Following stress relaxation, there was a significant desorption and release of gas from the coal seam. This gas, which flowed down the fissure channels, enhanced gas outflow from the 11053 working face while decreasing it from the 11051 working face of protected seam 21. The gas outflow from the 11053 working face of the 23 protected seam is around three times that of the 11051 working face of the 21 protected seam, implying that approximately half of the gas within the protected seam has migrated into the working face. Furthermore, the gas outflow from the 11011 working face, which has a comparable burial depth and geological circumstances as the protected 11051 working face, is almost twice that of the 11051 working face. This confirms the release of a considerable amount of gas into the shielded layer from a different angle.
Figure 13 and Figure 14 show that, when using numerical simulation techniques to assess total gas outflow, the simulated values are generally lower than the actual observed gas outflow due to the inherent limitations of the simulation methods and the simulation models’ relatively small scope. Furthermore, the simulation results demonstrate that the fraction of gas outflow from the surrounding layer in the overall outflow exceeds the threshold and is near to the measured average value, indicating that the numerical model utilized is highly reliable. Meanwhile, field data reveal that, when the working face advancement distance increases, the gas outflow from the neighboring layer and its proportion in total outflow exhibit a consistent rising trend, supporting the adjacent layer’s leading role in gas flow.
Based on the above analysis, it is evident that the primary goal of gas control operations should be to effectively control gas in the next layer. Under low mining intensity and the lack of unloading gas drainage mechanisms, possibly desorbable gas in the shielded layer will leak into the working face via interlayer mining-induced fissures. This technique not only increases gas outflow but also dramatically raises the safety concerns of gas explosions and outbursts. Unloading gas drainage methods can greatly limit the quantity of gas moving from the protected layer to the protective layer’s operating face. Furthermore, the drainage procedure can significantly lower the gas content in the protected layer.

5.3. Measures for Extracting Decompressed Gas

This study utilizes directional long boreholes arranged longitudinally in the middle strata between the mining layer and the protected layer to precisely intercept and drain the unloading gas from the adjacent layer. This measure has advantages such as the high precision of drilling construction, a short construction period, low gas control cost, and a good drainage effect [40].

5.3.1. Calculation of Extraction Mixing Volume and Negative Pressure for Directional Long Drilling Holes

Based on the statistical evaluation of ventilation volume and gas concentration during the retreat mining of the protective layer’s working face, the absolute gas outflow from the coal seam is calculated to be 3.74 m3/min. This outflow significantly increases with the progression of retreat mining, reaching 9.68 m3/min in the later stages. Assuming a 75% gas interception rate for the directional long drilling holes designed for bottom plate unloading and interception, the required extraction volume is calculated to be 4.31 m3/min. Selecting a 120 mm diameter for these directional long drilling holes, we apply the following Equation (9):
D = 0.1457 Q / V
where D is the inner diameter of the drill hole, 120 mm; Q is the mixed gas flow rate in the drill hole, m3/min; and V is the economic flow rate of gas in the gas extraction drill hole, 10 m/s.
Q = K Q c / X
where K is the gas flow surplus coefficient, after the actual extraction verification take = 1.6; Qc is the maximum flow rate of pure gas extraction, m3/min; and X is the gas concentration, %.
The calculated mixed extraction volume for a single directional long drilling hole is 6.78 m3/min. Accounting for a gas concentration of 15%, the actual pure gas extraction volume per hole is determined to be 1.02 m3/min. To achieve effective gas control at the mining face, a minimum of five such holes, each with a 120 mm diameter, must be constructed. For drill holes extending 300 m, the extraction branch line’s negative pressure must not fall below 15 KPa to maintain gas control efficacy. Given the downward inclination of the drill holes and potential water accumulation, the negative pressure should be no less than 25 KPa to ensure effective gas extraction.

5.3.2. Calculation of Bottom Plate Destructive Depth

The destructive depth of the bottom plate is influenced by factors including mining height, inclination angle, burial depth, working face length, and the compressive strength of the bottom plate’s rock layer. For the 12023 working face, which covers 170 m with a mining height of 7.0 m and an inclination angle of the coal seam of 8°, the following factors are critical:
h = 0.013 H + 6.25 ln L / 40 + 2.52 ln M / 1.48
This empirical formula is derived from statistical regression models of floor damage depth in Chinese coal mines [39], where h is the maximum destruction depth of the coal seam bottom plate (m); H is the burial depth of the coal seam (380 m); L is the length of the working face strike (170 m); and M is the mining height of the coal seam (7.0 m).
Theoretical calculations estimate the bottom plate destruction depth of seam No. 23 post-mining to be 16.91 m. With an average interlayer spacing of 19.3 m between the seams No. 23 and 21, the bottom plate’s rock layer comprises Dazhan sandstone and mudstone. Considering lithological characteristics, drilling should optimally be arranged within the more stable Dazhan sandstone layer. Furthermore, the drilling location should fall within the damage depth and fissure zone of the upper protective layer’s bottom plate. Consequently, the designed drill hole’s final location is set 3 m above the top plate of the seam No. 21. Schematic diagrams of the directional drilling equipment, construction site, and drill hole completion are presented in Figure 15.

5.4. Effect of Unloading Pressure Gas Extraction

The geological reserve of the seam No. 21 within the drilling control area of drill site 1 is 44.98 ten thousand tons, and the gas reserve is 389.09 ten thousand m3. According to the statistics of the drill site, the cumulative gas extraction volume of drill site No. 1 is 1.3540 million m3, which corresponds to the unloading gas extraction rate of 34.80%. For drill site No. 2, the geological reserve of the seam No. 21 within the control area of the drill hole is 43.38 ten thousand tons, and the gas reserve is 427.75 ten thousand m3. The cumulative gas extraction volume of drill site No. 2 is 175.28 ten thousand m3, and the unloading gas extraction rate is 40.95%. Further calculations reveal that the residual gas content inside the control region of drill site No. 1 is 5.64 m3/t, while the residual gas content within drill site No. 2 is 5.82 m3/t. Table 6 presents the data in full.
Using the Wangxingzhuang Mine as a case study, the construction cost per borehole (including equipment and labor) is approximately CNY 174,000. For a 10-borehole system (Section 5.3.1), the total initial investment amounts to CNY 1.74 million. According to Table 6, the cumulative gas drainage volume across two drilling sites reached 3.1068 million m3. Based on China’s coal mine gas utilization subsidy standard (0.3 CNY/m3), the direct revenue is estimated at CNY 932,040. Additionally, the 15% reduction in ventilation energy consumption due to lowered gas concentrations yields annual electricity savings of approximately CNY 500,000. Compared to traditional high-position drilling, the new method is less costly in terms of gas control. Although the initial investment is higher, its high extraction efficiency and long-term safety benefits significantly enhance its economic feasibility.

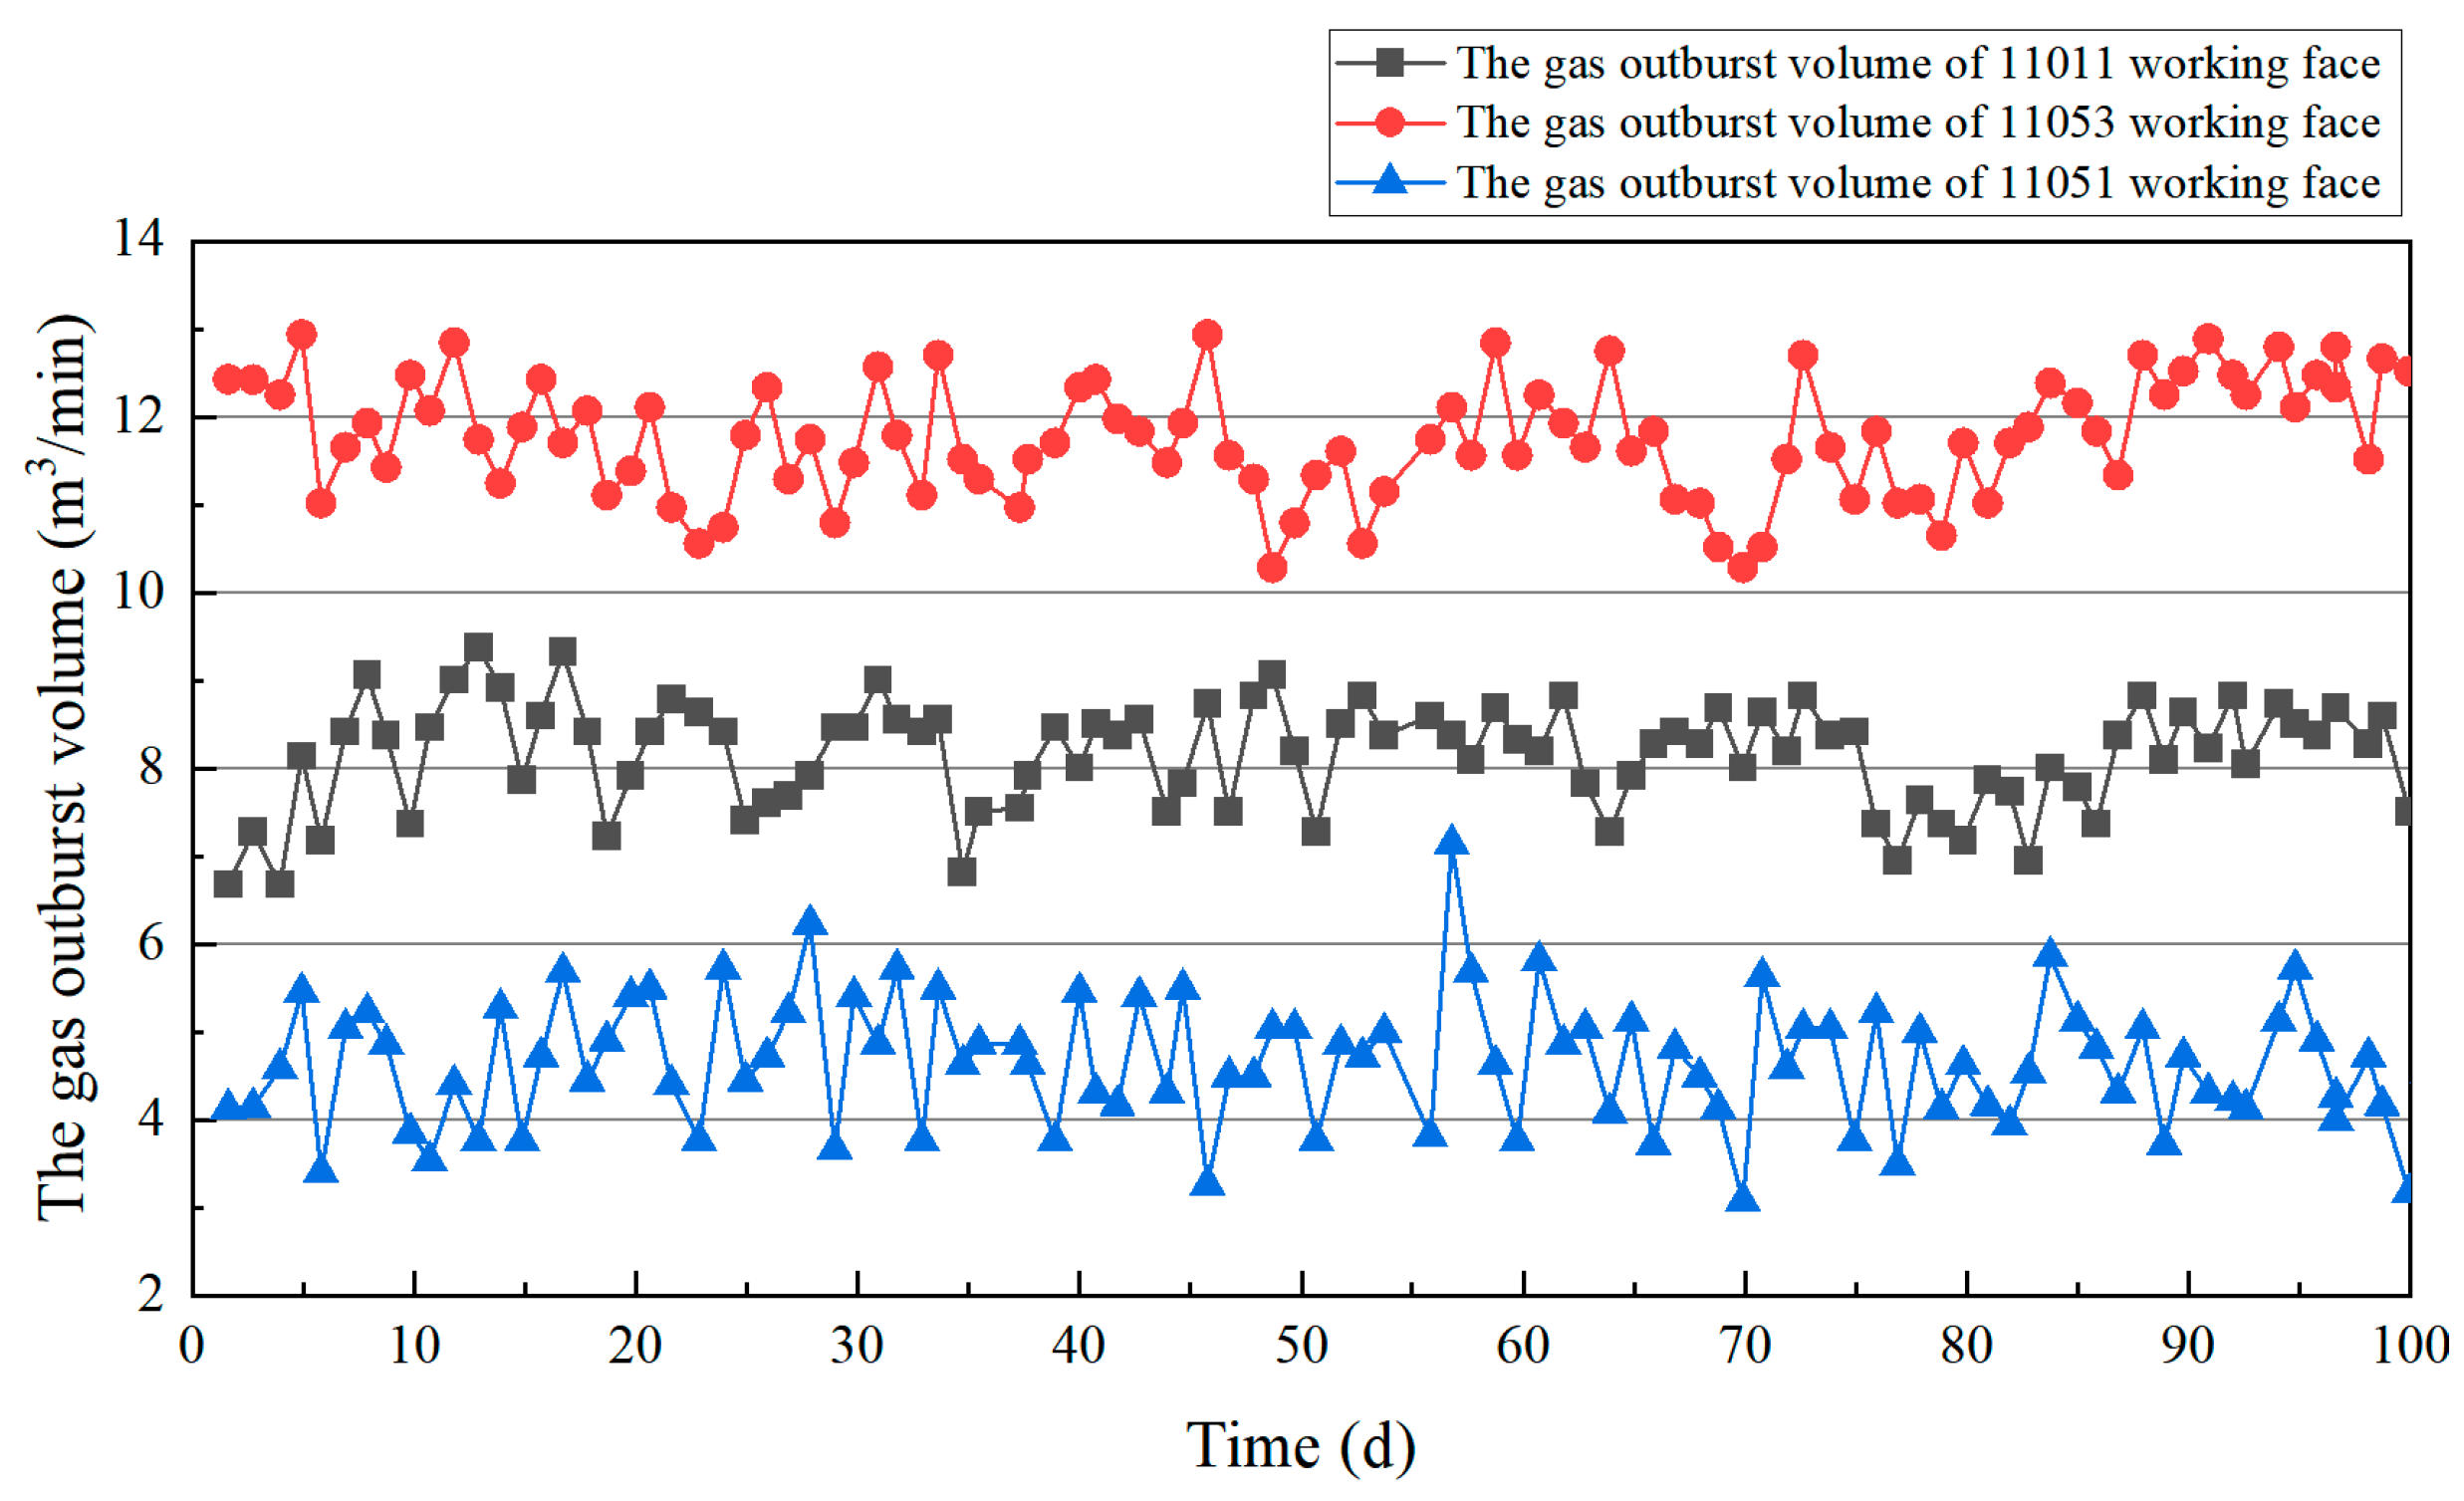
5.5. Changing Law of Gas Outflow Volume

Upon transitioning into the operational zones of the directional long drilling holes at drill sites No. 1 and No. 2, there is a notable decrease in both the wind-ejected gas volume and the methane concentration within the return air stream of the 12023 working face. More specifically, upon reaching a depth of 60 m into the first drilling site, the expelled gas volume was recorded to have plummeted to 2.01 m3/min, with the methane concentration concurrently reduced to 0.21%. After entering 100 m of drilling site No. 2, the air exhaust gas volume further decreased to 1.77 m3/min, and the methane concentration decreased to 0.18%. The data indicate a significant reduction in the volume of gas vented to the atmosphere as the mining face moves into the area serviced by drilling operations. Specifically, there is a minimum of a 61.79% reduction in exhaust gas volume and at least a 59.09% reduction in methane concentration. These reductions effectively address the issue of gas levels surpassing safety thresholds, which is often attributable to emissions from adjacent strata. The graphical representation of these gas outflow dynamics is depicted in Figure 16.

6. Conclusions

The primary reasons for the rapid gas outflow and excessive outflow volume caused by the rapid advancement of the coal seam working face are stress concentration and coal body damage due to mining, increased coal seam permeability, changes in gas pressure, the disruption of gas adsorption–desorption equilibrium, and gas accumulation and over-limit risks. These variables combine and cause abnormal increases in gas output. This paper develops a gas migration model for unloading and permeability enhancement in protective layer mining at various mining intensities, investigates the mechanism of abnormal gas outflow caused by unloading in protective layer mining, and quantitatively characterizes gas outflow to achieve precise gas control. The key findings may be summarized as follows:
(1) As the protective layer working face progresses to a position of 180 m, the vertical stress in the stress concentration area exhibits distinct changing tendencies depending on the mining intensity. When the mining intensity is 2 m/d, the maximum vertical stress in the stress concentration area is 28.30 MPa; when the mining intensity is increased to 4 m/d, the maximum value only increases by 0.83%; and when the mining intensity is increased to 6 m/d, the maximum value increases significantly by 12.89%. This finding suggests that the higher the advancing speed, the larger the vertical tension in the stress concentration area. Furthermore, on the monitoring line 5 m below the floor, when the advancement speed is 2 m/d, the stress release rate is stable at approximately 100%; but, when the mining intensity grows, so does the magnitude of the fluctuation around 100%. At 10 m below the floor, the peak value of the stress release rate drops from 100% to 98%, and, with a mining intensity of 6 m/d, the fluctuation amplitude around the peak value diminishes, showing that the downward impact from the goaf steadily reduces.
(2) Following coal seam mining, the coal and rock mass of the neighboring coal seam suffer shear and tensile damage. The damage to the lower coal and rock mass caused by mining is generally minor, but the damage and collapse of the coal and rock layers above the goaf are more severe. As mining intensity grows, so does the plastic deformation area because quick progress accelerates geostress accumulation and release. In contrast, the slower the advancing pace, the smaller the plastic deformation area, as geostress has more time to progressively release. The greatest depth of plastic damage right below the working face can be around 47.9 m. The top and bottom plates of the protected layer experience steady deformation expansion from the edges to the center, eventually stabilizing at greater than 3‰. The effective unloading angle in the striking direction of the working face is roughly determined to be 62°, while the effective unloading angle in the dip direction is 58°, with the unloading range on both sides exhibiting fundamental symmetry.
(3) As the backfill area widens, the degree of unloading of the floor rock mass rises, resulting in a lower effective stress and an expansion of the floor damage depth to the seam No. 21. Permeability grows dramatically in the plastic damage region, peaking in the center of the goaf. As the working face moves forward, the range of increased permeability in the coal and rock mass steadily widens, and the effect of improved permeability becomes more noticeable. When mining reaches 180 m, the maximum permeability of the seam No. 21 at a mining intensity of 6 m/d is 2.51 × 10⁻¹⁶ m2, which is 223 times the initial coal seam permeability. The peak value of coal seam permeability increases with increasing mining intensity.
(4) As the working face moves forward, the distribution of gas pressure near the goaf shifts downward, with the affected range steadily extending. When the working face mining intensity is increased to 4 m/d and 6 m/d, the drop in gas pressure and range marginally increase, showing that greater mining intensity has a stronger unloading impact and intensifies gas migration and release. The fall in gas pressure below the goaf floor is inversely associated with distance from the goaf floor, with a greater drop toward the center. As the working face mining intensity grows, so does the trend of gas migration along the unloading area to the upper coal seam goaf, suggesting that increased mining intensity improves gas migration and release, making it simpler to discharge gas pressure. An increase in mining intensity increases coal seam permeability and the gas migration rate and reduces gas pressure. Mining intensity adjustments have a substantial influence on gas pressure distribution. Simulations demonstrate that gas outflow rises with mining intensity. At a rate of 6 m/d, the gas outflow from the next layer accounts for 82.43%; as mining intensity increases, so does the overall outflow and fraction of the adjacent layer.
(5) A comparative analysis using a combination of on-site statistical data, carbon isotope testing, and numerical simulation methods reveals that the gas outflow and proportion from the adjacent layer increase as the advancement distance increases, conclusively indicating that the adjacent layer is the primary source of gas in the working face. The highest proportion of gas from the neighboring stratum in the goaf is 77.88%.
(6) Following the deployment of gas drainage methods utilizing directed long boreholes in the floor for interception, the drainage rates of unloaded gas reached 34.80% and 40.95%, respectively. The implementation of this measure significantly reduced gas outflow from the lower adjacent layer to the working face goaf, with the wind-discharged gas volume decreasing by at least 61.79% and the methane concentration in the working face return airflow decreasing by at least 59.09%, achieving the goal of precise gas control in multiple coal seams.
(7) Compared to existing research, this study employs multi-method validation (isotopic analysis, numerical simulation, and field statistics to conclusively identify adjacent layers as the dominant gas source. Their contribution (77.88%) exceeds the 60–70% reported by Zhou et al. [11], suggesting enhanced gas migration from adjacent layers under this mine’s geological conditions. Furthermore, the efficiency of directional drilling for pressure-relief gas drainage (34.80–40.95%) aligns with field data from Guo et al. [40] (30–45%), verifying the applicability of this technology across different mining regions.

7. Discussion

In this study, we looked in depth at the anomalous gas outflow phenomena that occurred during the protective layer mining process of the 12023 working face at Wangxingzhuang Coal Mine. We discovered mechanical evolution laws, as well as unloading and permeability enhancement processes, under various mining intensities and non-uniform gas occurrence situations, using FLAC3D-COMSOL linked simulations.
The findings of this study exhibit both significant connections and distinctions compared to prior empirical research on coal mine methane emissions. For instance, Yuan [19] proposed the pressure-relief gas drainage theory, suggesting that protective layer mining increases permeability by approximately 100–200 times. Our study reveals that, at a mining intensity of 6 m/d, the permeability of the seam No. 21 increases to 223 times its initial value, which aligns with Yuan’s theoretical range. However, we further demonstrate the direct influence of mining intensity on the magnitude of permeability enhancement. Additionally, Yang et al. [24] reported through field tests that adjacent layers may contribute 70–80% of total gas emissions after protective layer mining. This finding is highly consistent with our isotopic analysis results, where adjacent layers account for up to 77.88% of gas emissions, confirming the prevalence of adjacent layers as primary gas sources. In contrast, Wang et al. [37] simulated that rapid mining advancements (>5 m/d) might limit floor failure depth to 35–40 m, whereas our study observed a plastic failure depth of 47.9 m at 6 m/d. This discrepancy may stem from the soft rock geology and high in situ stress conditions at Wangxingzhuang Mine. Such variations highlight the impact of geological heterogeneity on pressure-relief efficacy, necessitating site-specific optimization in engineering practices.
Regarding the novel contributions of this research, it pioneers the application of the integrated FLAC3D-COMSOL simulation approach to investigate the mechanisms underlying gas emissions in protected seam mining operations. This groundbreaking work facilitates precise replication and a detailed quantitative assessment of gas migration dynamics. In addition, we adopted the stable carbon and hydrogen isotope method for gas traceability analysis, which improved the accuracy of gas source identification and provided a new technical means for gas management.
Compared to existing studies, the proposed method demonstrates significant advantages in multi-scale validation and dynamic modeling: Compared to Yuan [19]’s pressure-relief theory, this study reconstructs heterogeneous gas pressure fields through geostatistical inversion, avoiding errors caused by uniform assumptions. Compared to Zhou et al. [11]’s permeability enhancement model, this study, for the first time, correlates carbon isotope results with stress release rates, revealing the spatial alignment between pressure-relief ranges and gas source contributions. Compared to traditional borehole designs, the extraction efficiency of directional long boreholes is 20–30% higher than that of high-level boreholes, validating the effectiveness of precise interception strategies.
This study acknowledges potential uncertainties in numerical simulations, including simplified assumptions, parameter variability, and boundary condition limitations. To address these uncertainties, we adopted a multi-method validation approach that integrates numerical simulations, isotope tracing, and field measurements. This comprehensive validation framework enhances model reliability and provides a robust foundation for optimizing gas control strategies.
Future research should focus on reducing uncertainties in numerical simulations by incorporating more detailed geological data (e.g., fault distributions and coal seam irregularities). Advanced techniques, such as machine learning algorithms and real-time monitoring systems, could be integrated with numerical models to improve their predictive accuracy. Furthermore, more comprehensive sensitivity analyses, including variations in mining intensity and gas adsorption–desorption dynamics, could further enhance model robustness. These improvements will deliver more accurate representations of gas migration dynamics and support the development of adaptive gas control strategies in complex mining environments. Through these efforts, we aim to provide more scientific and efficient solutions for coal mine gas hazard prevention, thereby promoting the sustainable development of the coal mining industry. Concurrently, we will strengthen the collection and analysis of field data to validate and refine our theories and models through practical applications, further improving the precision and effectiveness of gas management.

Author Contributions

X.C. (Xuexi Chen): Conceptualization; Funding acquisition; Investigation; Methodology. X.C. (Xingyu Chen): Methodology; Software; Writing-original draft. J.H.: Methodology; Software; Supervision; Investigation. J.X.: Investigation; Supervision. J.S.: Methodology; Resources. Z.Y.: Validation. All authors have read and agreed to the published version of the manuscript.

Funding

This research was funded by the National Natural Science Foundation of China (No. 52174181), the S&T Program of Hebei (No. 22375401D), the Natural Science Foundation for Youths of Hebei Province (E2024508014), and Fundamental Research Funds for the Central Universities (No. 3142024011, 3142023065, 3142023066).

Data Availability Statement

Data will be made available upon request.

Conflicts of Interest

We declare that we have no financial and personal relationships with other people or organizations that can inappropriately influence our work, there is no professional or other personal interest of any nature or kind in any product, service, and/or company that could be construed as influencing the position presented in, or the review of, the manuscript entitled, “Mechanism and quantitative traceability of anomalous outflow of unpressurized gas from protective layer mining under tectonic action”.

References

  1. Degirmenci, T.; Aydin, M.; Cakmak, B.Y.; Yigit, B. A path to cleaner energy: The nexus of technological regulations, green technological innovation, economic globalization, and human capital. Energy 2024, 311, 133316. [Google Scholar] [CrossRef]
  2. Aydin, M.; Degirmenci, T.; Erdem, A.; Sogut, Y.; Demirtas, N. From public policy towards the green energy transition: Do economic freedom, economic globalization, environmental policy stringency, and material productivity matter? Energy 2024, 311, 133404. [Google Scholar] [CrossRef]
  3. Degirmenci, T.; Sofuoglu, E.; Aydin, M.; Adebayo, T.S. The Role of Energy Intensity, Green Energy Transition, and Environmental Policy Stringency on Environmental Sustainability in G7 Countries; Clean Technologies and Environmental Policy; Springer: Berlin/Heidelberg, Germany, 2024; pp. 1–13. [Google Scholar]
  4. Qin, B.; Shi, Z.S.; Hao, J.F.; Ye, D.L.; Liang, B.; Sun, W. Analysis of the Space–Time Synergy of Coal and Gas Co-mining. ACS Omega 2022, 7, 13737–13749. [Google Scholar] [CrossRef] [PubMed]
  5. Yi, M.H.; Wang, L.; Hao, C.M.; Liu, Q.Q.; Wang, Z.Y. Method for designing the optimal sealing depth in methane drainage boreholes to realize efficient drainage. Int. J. Coal Sci. Technol. 2021, 8, 1400–1410. [Google Scholar] [CrossRef]
  6. Zhou, A.T.; Xu, Z.Y.; Wang, K.; Wang, Y.H.; An, J.Y.; Shi, Z. Coal mine gas migration model establishment and gas extraction technology field application research. Fuel 2023, 349, 128650. [Google Scholar] [CrossRef]
  7. Xu, F.Y.; Yan, X.; Wang, F.L.; Ma, X.Y.; Yun, J.; Wang, H.N.; Xu, B.R.; Zhang, S.Y.; Mao, D.L. Development Strategy and Countermeasures of China’s CBM Industry under the Goal of “Carbon Peak and Neutrality”. J. Earth Sci. 2023, 34, 975–984. [Google Scholar] [CrossRef]
  8. Hu, L.; Feng, Z.; Zhou, D.; Wang, X. Mechanisms and field application of in-situ heat injection-enhanced gas drainage. Energy 2023, 284, 128729. [Google Scholar] [CrossRef]
  9. Wang, X.; Hao, F.; Xu, H.; Zhu, C.Q.; Jiang, T.; Jiang, Y.H. Static expansion fracturing mechanism for enhancing gas permeability in low permeability coal seams. Sci. Rep. 2024, 14, 25046. [Google Scholar] [CrossRef] [PubMed]
  10. Zhu, Q.Y.; Du, X.J.; Zhang, T.; Yu, H.M.; Liu, X.B. Investigation into the variation characteristics and influencing factors of coalbed methane gas content in deep coal seams. Sci. Rep. 2024, 14, 18813. [Google Scholar] [CrossRef]
  11. Zhou, X.H.; Li, X.L.; Bai, G.; Chai, L.; Wang, Y.M.; Xiao, M.F.; Xia, S.Y. Research method of pressure relief and permeability enhancement in low permeability coal seam: A review. AIP Adv. 2022, 12, 010702. [Google Scholar] [CrossRef]
  12. Lu, A.L.; Song, D.Z.; Li, Z.L.; He, X.Q.; Dou, L.M.; Xue, Y.R.; Yang, H.K. Numerical Simulation Study on Pressure-Relief Effect of Protective Layer Mining in Coal Seams Prone to Rockburst Hazard. Rock Mech. Rock Eng. 2024, 57, 6421–6440. [Google Scholar] [CrossRef]
  13. Xie, H.G.; Li, X.J.; Cai, J.J.; Wang, S.W.; Feng, C. Evolution of fissures and pressure discharge of gas caused by mining of the upper protective layer of a coal seam. Sci. Rep. 2023, 13, 2561. [Google Scholar] [CrossRef] [PubMed]
  14. Liu, C.; Li, M.L.; Cha, J.; Man, Z.Y. Numerical analysis of stress distribution due to upper protective layer mining and its impact on gas extraction. Phys. Fluids 2024, 36, 117129. [Google Scholar] [CrossRef]
  15. Li, L.; Wu, G.Y.; Liu, Q.A. Study on Overburden Movement and Fissure Evolution Law of Protective Layer Mining in Shallow Coal Seam. Energies 2022, 15, 1831. [Google Scholar] [CrossRef]
  16. Cheng, C.; Cheng, X.Y.; Chen, L.; Ma, X.Y. Research on Gas Control Technology in Goaf Based on the Influence of Mining Speed. Processes 2024, 12, 1528. [Google Scholar] [CrossRef]
  17. Gong, X.P.; Wu, J.J.; Li, S.G.; Cheng, X.Y.; Gao, H. Reas-onable arrangement of pressure relief gas extraction inoverburden rock under high strength mining in low gasseams. J. Min. Saf. Eng. 2020, 37, 419–428. [Google Scholar]
  18. Zhao, P.X.; Zhang, W.J.; Li, S.G.; Zhuo, R.S.; Lin, H.F.; Suo, L. Mechanism of cross-fusion in gas transportation-stor-age area in fully mechanized mining face of high gas thick coal seam under different advancing speeds. J. China Coal Soc. 2023, 48, 3405–3419. [Google Scholar]
  19. Yuan, L. Theory of pressure-relieved gas extraction and technique system of integrated coal production and gas extraction. J. China Coal Soc. 2009, 34, 1–8. [Google Scholar]
  20. Wu, Y.; Gao, R.; Yang, J. Prediction of coal and gas outburst: A method based on the BP neural network optimized by GASA. Process Saf. Environ. Prot. 2020, 133, 64–72. [Google Scholar] [CrossRef]
  21. Bi, S.H.; Shao, L.S.; Qi, Z.H.; Wang, Y.B.; Lai, W.Z. Prediction of coal mine gas emission based on hybrid machine learning model. Earth Sci. Inf. 2023, 16, 501–513. [Google Scholar] [CrossRef]
  22. Xu, G.; Hou, Y.P.; Jin, H.W.; Wang, Z.W. Study on Source Identification of Mixed Gas Emission and Law of Gas Emission Based on Isotope Method. Energies 2023, 16, 1225. [Google Scholar] [CrossRef]
  23. Lei, W.; Du, X.; Zhang, D.; Wang, J.; Yang, R.; Zheng, C.; Cao, J. Sensitivity analysis of geological mining influencing factors on the pressure relief effect of upper protective layer mining. Energy Sci. Eng. 2024, 12, 4703–4719. [Google Scholar] [CrossRef]
  24. Yang, K.; Sun, X.T.; Liu, S.; Guo, P.H.; Zhang, Z.N. Pressure relief and permeability enhancement effect and gas extraction scheme of long distance lower protective layer mining. J. China Min. Saf. Environ. Prot. 2024, 51, 1–9. [Google Scholar]
  25. Li, Y.; Wang, X.; Zhang, L. Enhancing Methane Recovery and Utilization in Coal Mining: A Pathway to Support China’s Dual Carbon Goals. Energy Policy 2023, 174, 1–12. [Google Scholar]
  26. Wang, X.; Li, Y.; Chen, G. Advanced Gas Extraction Technologies for Coal Mines: A Review of Recent Developments and Their Implications for China’s Carbon Neutrality Target. Renew. Sustain. Energy Rev. 2023, 162, 120–135. [Google Scholar]
  27. Zhang, L.; Liu, H.; Wang, X. Methane Emission Reduction in Coal Mining: Strategies and Technologies for Achieving China’s Dual Carbon Objectives. J. Clean. Prod. 2023, 378, 150–165. [Google Scholar]
  28. Lin, H.F.; Ji, P.F.; Kong, X.G.; Li, S.G.; Long, H.; Xiao, T.; Bai, L. Experimental study on the influence of gas pressure on CH4 adsorption-desorption-seepage and deformation characteristics of coal in the whole process under triaxial stress. Fuel 2023, 333, 126513. [Google Scholar] [CrossRef]
  29. Qian, M.G.; Xu, J.L. Study on the "o-shape" Circle distribution characteristics of mining-induced fractures in the overlaying strata. J. China Coal Soc. 1998, 5, 20–23. [Google Scholar]
  30. Wang, W.; Zhang, J.W.; Chen, X.j.; Liu, Y.E.; Li, H.; Wang, H.F.; Fang, Z.M. Analysis of proper position of extraction roadway on roof in high-strength gas emission workface: A case study of Zhaozhuang coal mine in southern Qinshui Basin. Energy Rep. 2021, 7, 8834–8848. [Google Scholar] [CrossRef]
  31. Yang, T.; Li, B.; Ye, Q.S. Numerical simulation research on dynamical variation of permeability of coal around roadway based on gas-solid coupling model for gassy coal. Int. J. Min. Sci. Technol. 2018, 28, 925–932. [Google Scholar] [CrossRef]
  32. Darcy, H. Les Fontaines Publiques de la Ville de Dijon; Victor Dalmont: Paris, France, 1856. [Google Scholar]
  33. Fick, A. Über Diffusion. Ann. Der Phys. 1855, 170, 59–86. [Google Scholar] [CrossRef]
  34. Cheng, Y.; Liu, Q.; Ren, T. Gas adsorption- desorption properties of coal. Coal Mech. 2021, 16, 111–150. [Google Scholar]
  35. Cui, X.; Bustin, R.M. Volumetric strain associated with methane desorption and its impact on coalbed gas production from deep coal seams. AAPG Bull. 2005, 89, 1181–1202. [Google Scholar] [CrossRef]
  36. SUN, P. Thermal-hydrological-solid coupling model of coal seam gas extraction based on pore-fracture. Min. Saf. Environ. Prot. 2024, 51, 64–73. [Google Scholar]
  37. Wang, D.K.; Tang, J.H.; Wei, J.P.; Wei, L.; Wu, J.; Yuan, M.Y.; Pang, X.F.; Guo, Y.J. A fluid-solid coupling model of coal seam gas considering gas multi-mechanism flow and a numerical simulation analysis of gas drainage. J. China Coal Soc. 2023, 48, 763–775. [Google Scholar]
  38. Wang, X.L.; Cheng, J.J. Study on fissure evolution of overlying rock in lower protective mining. Sci. Rep. 2024, 14, 19206. [Google Scholar] [CrossRef]
  39. Wang, H.F.; Cheng, Y.P.; Wu, D.M.; Liu, H.Y. Gas emission and parameter optimization of gas extraction in mining face of short distance protective seam. J. China Coal Soc. 2010, 35, 590–594. [Google Scholar]
  40. Guo, M.J.; Guo, W.B.; Zhao, G.B.; Yuan, R.F.; Wang, Y.S.; Bai, E.H. Position characteristics of horizontal-directional long boreholes in overlying strata and drainage mechanism of pressure-relief gas in longwall mining. J. China Coal Soc. 2023, 48, 3750–3765. [Google Scholar]
Figure 1. Diagram of stress release and permeability increase in protective layer mining.
Processes 13 00704 g001
Figure 2. Location map of Wangxingzhuang Coal Mine.
Processes 13 00704 g002
Figure 3. Gas pressure contour map at 12021 working face.
Processes 13 00704 g003
Figure 4. Numerical simulation flowchart.
Processes 13 00704 g004
Figure 5. Grid independent result.
Processes 13 00704 g005
Figure 6. Variation in vertical stress under different mining intensities.
Processes 13 00704 g006
Figure 7. Stress release rate of 5 m, 10 m and 20 m below the working face of the protective layer.
Processes 13 00704 g007
Figure 8. Variation in plastic zone under different mining intensities.
Processes 13 00704 g008
Figure 9. Curve of expansion deformation rate of the protected layer.
Processes 13 00704 g009
Figure 10. Variation in permeability under different mining intensities.
Processes 13 00704 g010
Figure 11. Characteristics of gas migration in the coal seam.
Processes 13 00704 g011
Figure 12. Characteristics of gas migration in adjacent layer.
Processes 13 00704 g012
Figure 13. Gas emission quantity under different mining intensities of working face.
Processes 13 00704 g013
Figure 14. The measured actual gas emission volume and the proportion of each gas source.
Processes 13 00704 g014
Figure 15. Directional drilling equipment, construction site, and completion plan of drilling.
Processes 13 00704 g015
Figure 16. Changing law of gas outflow volume.
Processes 13 00704 g016
Table 1. Basic gas parameters of 12023 working face.
Parameter CategoryMeasurement ResultParameter CategoryMeasurement Result
Gas pressure/MPa0.20~0.36Initial Gas Desorption Rate/(mL/s)10~12
Gas content/(m3/t)4.75~6.50Apparent Density/(t/m3)1.28
Porosity/%5.0True Density/(t/m3)1.42
Table 2. Basic gas parameters of 12021 working face.
Parameter CategoryMeasurement ResultParameter CategoryMeasurement Result
Gas pressure/MPa0.42~0.78Initial Gas Desorption Rate/(mL/s)10~12
Gas content/(m3/t)8.56~10.52Apparent Density/(t/m3)1.35
Coal permeability coefficient0.0145 m2/(MPa2·d)True Density/(t/m3)1.47
Type of coal destructionPorosity/%4.82
Stabilization factor of coal0.14~0.16Gas flow decay coefficient/d−10.07~0.10
Table 3. Table of formation mechanic parameters.
LithologyThickness
/m
Density/(g·cm−3)Bulk Modulus
/GPa
Shear Modulus
/GPa
Cohesion
/MPa
Tensile Strength
/MPa
Internal Friction Angle/°
Dazhan sandstone 112.52.64.52.33.02.227.0
Sandstone8.02.654.52.33.02.227.0
Medium-grained sandstone12.52.54.92.42.41.824.0
Sandy mudstone12.02.652.71.42.01.126.0
No. 23 coal seam1.71.52.80.52.01.126.0
Dazhan sandstone 117.02.64.52.33.02.227.0
Roof mudstone2.32.652.71.42.01.126.0
No. 21 coal seam7.01.52.50.52.01.126.0
Mudstone8.02.62.51.32.01.126.0
L7–8 limestone14.02.64.92.42.41.824.0
Table 4. Table of the values taken by the main simulation parameters.
ParameterValueParameterValue
True density of coal/(kg·m−3)1470Molar mass of air/(kg·mol−1)0.03
Apparent density of coal/(kg·m−3)1350Molar mass of methane/(kg·mol−1)0.016
Gas density at standard conditions/(kg·m−3)0.72Effective stress coefficient for fractures0.651
Elastic modulus of coal/gpa1.51Effective stress coefficient for pores0.078
Elastic modulus of coal matrix/gpa8.13Langmuir pressure constant/mpa6.019
Poisson’s ratio of coal0.31Dynamic viscosity of gas/(pa·s)1.08 × 10−5
Initial matrix porosity/%7.35Molar volume of gas/(m3·mol−1)0.026
Initial fracture porosity/%2.55Gas constant/(J·mol−1·k−1)906
Initial permeability/m21.125 × 10−18Temperature/k303.15
Table 5. Gas isotope determination results of each end element.
Location of Working FaceAdvance Distance/mProportion of End Elements/%
The Seam No. 23The Seam No. 21
Goaf14029.4270.58
18028.8171.19
22025.6174.39
26023.3276.68
30022.1277.88
Table 6. Residual gas content of the seam No. 21.
Drill Site NumberAverage Raw Gas Content
(m3/t)
Geological Reserves
(Ten Thousand Tons)
Cumulative Gas Extraction Volume
(Ten Thousand m3)
Cumulative Gas Extraction Volume
(Ten Thousand m3)
Residual Gas Content
(m3/t)
1#8.6544.98389.09135.405.64
2#9.8643.38427.75175.285.82
Disclaimer/Publisher’s Note: The statements, opinions and data contained in all publications are solely those of the individual author(s) and contributor(s) and not of MDPI and/or the editor(s). MDPI and/or the editor(s) disclaim responsibility for any injury to people or property resulting from any ideas, methods, instructions or products referred to in the content.

