Abstract
Lined pipes are widely used in oil and gas transportation systems due to their excellent corrosion resistance and cost-effectiveness. However, current design codes often oversimplify their mechanical behavior by treating them as single-layer systems, neglecting the complex interactions between the liner and outer pipes under temperature–pressure coupling. To address this gap, this study develops a finite element model for a Φ323.8 × (10 + 3) mm X60-825 lined pipe under elastic laying conditions. The model evaluates stress distribution, bonding strength, and liner deformation under varying operational conditions, including temperatures ranging from 20 °C to 80 °C and internal pressures from 0 MPa to 14 MPa. Key findings reveal that the liner pipe approaches its yield strength (241 MPa) under high-pressure conditions, with a maximum Tresca stress of 238.81 MPa, while the outer pipe reaches 286.51 MPa. Internal pressure significantly enhances bonding strength, increasing it from an initial 0.85 MPa to 11.86 MPa at 14 MPa, thereby reducing the risk of delamination. Simplified single-layer models, which ignore the liner’s pressure-bearing effect, underestimate stress interactions, resulting in a 16.63% error in outer pipe stress under extreme conditions. These results underscore the limitations of simplified models and highlight the importance of considering multi-field coupling effects in pipeline design. This study provides critical insights for optimizing laying radii and ensuring the long-term integrity of lined pipe systems. Future work should focus on experimental validation and microstructural analysis to further refine the design guidelines.
1. Introduction
Lined pipes have become indispensable in the oil and gas industry, particularly in highly corrosive environments, due to their superior corrosion resistance and economic benefits [1,2]. Despite their widespread use, the mechanical behavior of lined pipes under operational conditions remains inadequately addressed. Current design codes, such as B31.4 and B31.8, simplify stress analysis by treating lined pipes as single-layer systems, ignoring the mechanical contributions of the liner pipe [3,4,5]. This simplification overlooks critical factors such as material property mismatches, thermal expansion differences, and multi-field coupling effects, which can significantly impact the pipeline’s integrity. Recent advancements in stress analysis techniques, including multi-physics modeling and high-fidelity finite element analysis (FEA), have emphasized the importance of considering the interactions between the liner and outer pipes [6,7]. However, limited studies have focused on the combined stress behaviors of lined pipes during elastic laying and operation.
At present, the combined stress calculation method of single-layer pipeline at the operation stage has been described in detail in the pipeline stress analysis standard and design codes B31.4 and B31.8 to guide the design and installation of single-layer pipes. In addition, the National Standard of China GB 50251-2015 [8] Code for the design of gas transmission pipeline engineering stipulates the formula for calculating the radius of curvature for the elastic laying of a monolayer pipe system as follows:
where R is the radius of the elastic laying of the pipeline; D is the outer diameter of the pipe; α is the deflection angle of the pipeline. At the same time, it is stipulated that the radius of curvature of the elastic laying pipe system should not only meet the strength requirements of its material but also not be less than 1000 times the outer diameter of the pipe.
Up to now, the mechanical behavior of lined pipe systems under various loading conditions has been extensively studied in recent years. Gavriilidis et al. [9] and Yuan et al. [10,11,12] investigated the buckling behavior of lined pipes under bending and external pressure, highlighting the significant role of internal pressure in enhancing liner stability and reducing the risk of delamination. Their findings are consistent with the stress distribution and bonding strength results obtained in this study, further validating the importance of considering internal pressure effects in pipeline design. In addition, Qu et al. [6] employed cohesive zone models to analyze the reliability of sandwich pipes, providing valuable insights into interfacial behavior modeling. Their methodological approach informed the simulation of contact interactions between the liner and outer pipes in the present study, particularly in addressing the complexities of multi-layer pipe systems. Furthermore, Gu et al. [13] conducted experimental and numerical studies on liner collapse in lined composite pipes, emphasizing the influence of manufacturing processes and residual stresses on the mechanical performance of lined pipe systems. Their research contributed to the development of the initial stress conditions model used in this study, ensuring a more accurate representation of the stress state in lined pipes after manufacturing.
The above publications are mainly related to the installation condition of non-pressure or low-pressure (less than 3 MPa) lined pipes and mainly focus on the installation phase. Regarding the bending behaviors of lined pipes at the operation stage, especially after elastic laying, during the increase in operating temperature and pressure, their mechanical response has received much less attention. Figure 1 shows the finite element simulation and experimental photos of the buckling process of the lined pipe structure. Due to the thin wall structure of the lining, the diameter-to-thickness ratio of the inner pipe is obviously larger than that of the outer pipe.
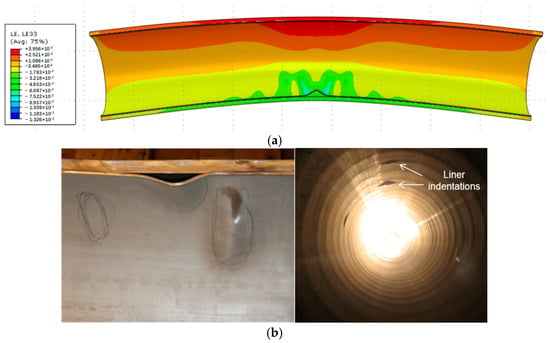
Figure 1.
Simulation and experimental results of liner collapse in bending process of lined pipe [14]. (a) Finite element simulation results of bending lined pipe, (b) Bending test results of lined pipe.
In the process of installation, the elastic laying method is used to preset the bending radius of pipes. Under the coupling action of high temperature (80 °C~120 °C) and high pressure (6~16 MPa) [15], due to the different material properties, there is an obvious difference in the stress state between the liner pipe and the outer pipe, which determines whether the deformation of the liner pipe will be caused by the coupling action of temperature and pressure, such as liner pipe delamination, wrinkling, or the reverse yield phenomenon [16]. At present, it has not been seen that any scholars have carried out systematic research work on this problem. Therefore, determining the stress state of the lined pipe under the elastic laying bending condition, especially under the operating condition, is of great significance to the installation design and stress analysis of the lined pipe.
This study aims to fill this research gap by developing a comprehensive finite element model to analyze the mechanical response of lined pipes under elastic laying conditions. The model considers the interaction between the outer pipe and liner under varying temperature and pressure conditions, providing a detailed evaluation of stress distribution and bonding strength. The results demonstrate that the liner pipe’s stress levels approach its yield strength under high-pressure conditions, while the internal pressure significantly enhances the bonding strength between the liner and outer pipes. These findings underscore the importance of considering multi-field coupling effects in the design and installation of lined pipe systems.
2. Numerical Modeling
2.1. Contact Modeling
In order to better understand the interaction behavior between the outer pipe and the liner pipe under the action of temperature and internal pressure load under the elastic laying state, it is necessary to know the manufacturing process of the lined pipe, because this introduces changes to the mechanical properties of the two constituents and leaves behind residual stresses as well as the interference contact stress [17]. The typical hydraulic expansion process of the lined pipe is shown in Figure 2.

Figure 2.
Lined pipe manufacturing process.
As can be seen from Figure 1, the forming process of the lined pipe mainly includes the following four steps.
- (a)
- Assembling process. The stainless steel liner and the carbon steel outer pipe are assembled together on the same axis, and the outer diameter of the liner pipe is slightly smaller than the inner diameter of the outer pipe, which ensures a reasonable initial gap before forming.
- (b)
- Loading process. The inner wall of the liner pipe is loaded with hydraulic pressure to make the liner pipe expand radially, eliminate the gap between the two pipes, and make the outer wall of the liner pipe fit with the inner wall of the outer pipe.
- (c)
- Steady loading. When the hydraulic loading reaches the design value, the liner pipe has entered the plastic expansion, the outer pipe is still in the stage of elastic expansion, and the pressure is maintained to make the liner pipe and the outer pipe fully fit.
- (d)
- Finished forming. After unloading the pressure, both the outer pipe and the liner shrink elastically. Due to the residual plastic deformation in the liner, the outer pipe will grip the liner so that an initial tightness is formed between the outer pipe and the liner after hydraulic forming.
Through the understanding of the manufacturing process of lined pipe, it can be known that after the forming process, there is an initial prestress field of stress in the circumferential direction of the liner pipe and outer pipe. Regarding the initial stress conditions of the liner and outer pipes, as shown in Figure 3, the existence of these prestresses may affect the mechanical behavior of lined pipes and need to be subsequently considered in the FE model.
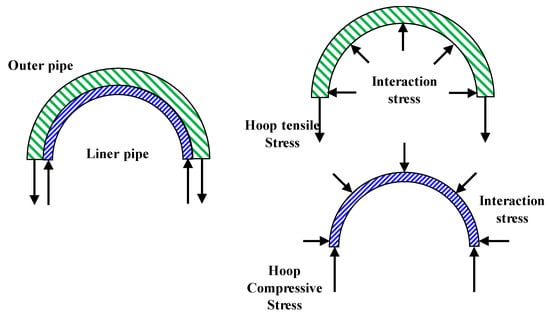
Figure 3.
The initial stress conditions of the lined pipe after manufacturing.
Therefore, the initial stress state of the outer and liner pipes should be considered in the finite element analysis. According to the method of measuring tightness by the extrapolation in API-5LD, and in combination with the tightness parameters provided by the lined pipe manufacturer in this study, the bonding strength in this analysis is taken as 0.85 MPa. The method of interference fit is selected, and the initial interference amount is applied between the outer and liner pipes to simulate initial tightness between the two pipes [18,19]. After calculation, the relationship between the initial interference and bonding strength is basically linear. When the interference is taken as 0.04 mm, the calculated compactness is just 0.85 MPa. In order to more truly reflect the friction behavior between the outer pipe and the liner pipe, the isotropic Coulomb friction model with μ = 0.3 is used to simulate the tangent behavior of the interface.
2.2. Elastic Laying Model
Elastic laying is the installation of deliberate elastic bending in a predetermined position, and its main purpose is to enable the pipe to trigger thermal buckling at a determined position [20]. Figure 4 presents a typical configuration of an elastic laying pipeline.
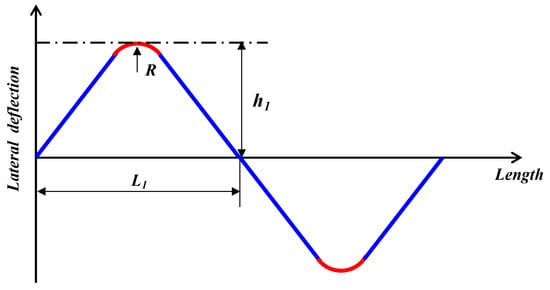
Figure 4.
Typical configuration of elastic laying pipelines.
As shown in Figure 4, the elastic laying radius is R, the half laying wavelength is L1, and the offset from the route center line to intersection point of bending radius is h1. The blue lines represent the straight pipe section, and the red lines represent the elastic bending section. Research shows that the laying radius of the bending section will affect the initial probability of the pipeline buckling design. From the above Equation (1), we can know that the calculation method of the elastic laying radius of the single-layer pipeline. In order to study the applicability of this method to the lined composite pipeline, we choose the same minimum elastic laying radius R = 1000 D to investigate the mechanical response of the lined pipe system.
Therefore, the traditional three-point bending model is selected to analyze the mechanical response of the lined pipe under temperature and pressure load under the premise of elastic laying. However, through the calculation and verification of the traditional three-point bending model, it is found that because of the structural characteristics of the lined pipe system, it can be regarded as a composite structure composed of the coaxial assembly of the outer pipe and the liner pipe. In the process of pipe stress analysis, local stress singularities easily occur in the loading position and constraint position of the composite mechanism, which affects the accuracy of the calculation results [21,22].
In order to avoid this kind of stress singularity, we optimize the traditional three-point bending model and modify the loading mode of curvature. After many attempts and comparisons, we choose to use the rigid surface with a fixed radius of curvature to load the lined pipe. The schematic diagram of the optimized finite element mechanical model is shown in Figure 5.

Figure 5.
Mechanical model of uniform bending for elastic laying of lined pipe.
As shown in Figure 5, A and B are the support surfaces of the model, and the radius of the rigid loading surface is R = 1000 D. Because of the axisymmetric property of the finite element model, half of the research length L is taken for analysis. In order to ensure that the lined pipe between the A and B support surfaces is in a state of pure bending as far as possible, the research length of the pipe is increased by LH, and the support surfaces A and B are installed at the midpoint of the LH, respectively.
The relationship between the radius of curvature R and the deflection dt can be calculated by Equation (2), with a given research length L. By studying the geometric relationship between research length and deflection, the radius of curvature of the rigid surface can be determined.
where R is the radius of curvature, dt is deflection, and L is half of the study length.
By using the curvature loading model of a rigid surface, not only can the bending radius of the lined pipe be controlled accurately and uniformly, but also the problem of inaccurate calculation caused by sudden stress change can be avoided, which occurs easily in the traditional centralized loading method. In this study, the outer pipe material of the lined pipe is X60 and the liner material is N08825. The material mechanical parameters of the outer and liner pipes are shown in Table 1.

Table 1.
The material mechanical parameters of the lined pipe.
In this paper, the research length L of the lined pipe is 12 m, the auxiliary calculation length of the LH section is 0.8 m, and the radius of the rigid loading surface is known as R = 1000 D. According to Equation (2), the deflection dt can be calculated and obtained as 222.43 mm. On the basis of Figure 5, because the pipe bending problem is a typical axisymmetric problem, the bending model of lined pipe can be symmetrically simplified, and the 1/4 axisymmetric mechanical model of lined pipe is established and meshed, as shown in Figure 6.

Figure 6.
Finite element mesh model of elastic laying of lined pipe.
In Figure 6, symmetrical constraints are imposed on the axisymmetric end face of the model, while coupling the degrees of freedom of the outer pipe and liner pipe on the symmetrical plane. The SOLID185 8-node element is used for both the outer pipe and the liner pipe in the lined pipe model. Three groups of contact relationships need to be set in the finite element model. The first group is the contact between the outer pipe and liner pipe. The contact setting method is as follows: The inner wall of the outer pipe is the target surface, the outer wall of the liner pipe is the contact surface, and the contact unit types are the target 170 element and contact 174 element, respectively. As described in Section 2.1, the initial interference amount of 0.04 mm is added between the outer pipe and the liner pipe to simulate the tightness produced in the pipe manufacturing process, which adds an axial friction coefficient μ = 0.3 to the contact surface. The second group is the contact between the rigid loading surface and the outer wall of the outer pipe, and the third group is the contact setting between the rigid supporting surface and the outer wall of the outer pipe. The contact setting methods of these two groups are similar, taking the outer wall of the outer pipe as the target surface, the side of the rigid surface near the outer pipe is the contact surface, and the type of contact element is the same as that of the first group.
Because the above three groups of contact problems involve highly nonlinear static problems, in order to improve the accuracy of calculation, the hard contact model is considered. After many attempts, the combination of the augmented Lagrangian method and penalty function method is adopted to solve the complex contact and friction problems of the lined pipe. The combined method has good convergence in solving the complex contact and friction problems of lined pipes.
Due to the large temperature difference in the process of the installation and operation of the pipeline, the influence of temperature change on the material parameters of the lined pipe cannot be ignored. Therefore, the elastic modulus and thermal expansion coefficient of the outer and liner pipes at different temperatures are summarized as follows. The parameters are shown in Table 2.

Table 2.
Thermal expansion coefficient and elastic modulus data of lined pipe.
In order to clearly compare the mechanical response of the lined pipe system under different operating conditions in the elastic laying state, we summarize five typical conditions of the lined composite pipeline in the operation stage and give the corresponding temperature and pressure under different operating conditions. These five working conditions completely represent the different states of the pipeline in the operation stage. The specific parameters are shown in Table 3.

Table 3.
Five typical operation conditions of lined composite pipeline.
According to the finite element method in Figure 6 and the operation condition parameters given in Table 3, we have analyzed and studied the mechanical response of the elastically laid lined composite pipeline under the coupling action of temperature and pressure. The stress distribution of the outer pipe and liner pipe under different operation conditions is compared, and the evaluation model of contact bonding strength between the outer pipe and liner pipe is established. The calculation results are classified and discussed as follows.
3. Results and Discussion
3.1. Stress Analysis
3.1.1. Grid Independence Verification
Under working condition 1, when the bending curvature of the lined pipe R = 1000 D, the maximum Tresca stress at the largest point of bending displacement and deformation is selected to verify the grid independence. The calculation results are shown in Figure 7. It can be seen that when the number of grids in the circumference direction and wall thickness direction in Figure 6 is guaranteed, the mesh size in the axial direction is only adjusted, and the number of grids reaches more than 43 × 104, the calculation result of the maximum Tresca stress is relatively stable around 124 MPa, indicating that the calculation result at this time presents obvious grid-independent characteristics. Under the premise of comprehensively considering the number of grids and calculation accuracy, and balancing the calculation cost, the size of the axial elements is defined in the finite element analysis process, which is 20 mm, and the total number of units in the model is 432,000.
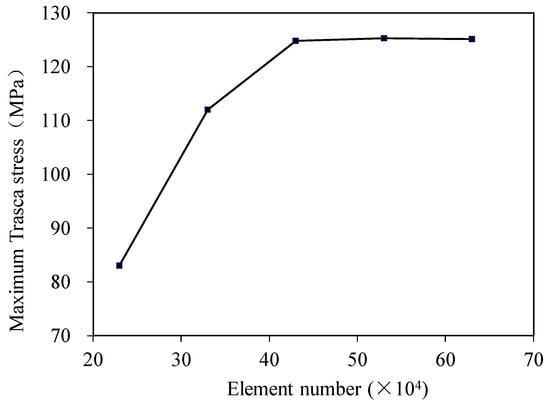
Figure 7.
Grid independence verification.
3.1.2. Variation in Temperature
In order to study the effect of temperature on the stress distribution of the lined composite pipe, we compare the calculation results under conditions 1 and 2 in Table 3. The parameter corresponding to condition 1 is the installation condition. At this time, the composite pipe system has not yet begun to be pressurized, so it is considered that the inner pressure is zero and the ambient temperature is 20 °C. Meanwhile, condition 2 corresponds to the operation condition after the shutdown and pressure relief. At this time, the temperature of the pipeline is still at a high level, but the pressure in the pipe has dropped to zero. Under the premise of elastic laying, there is only the effect of temperature on the stress of the lined composite pipe in these two conditions; therefore, using the finite element model in the above Figure 6, the symmetry of the composite pipe structure is taken into account. The stress distribution results of the outer pipe and liner pipe under these two working conditions are calculated, respectively, as shown in the following Figure 8.
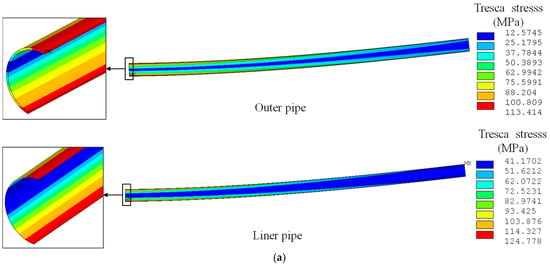
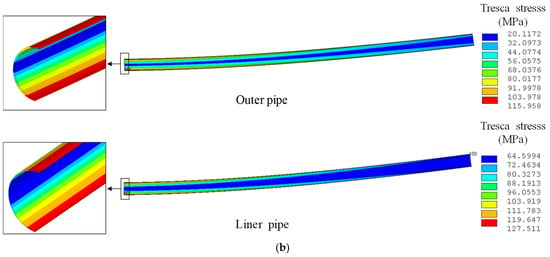
Figure 8.
Influence of temperature on stress distribution of lined composite pipe. (a) Condition 1: installation condition of lined pipe (20 °C, 0 MPa). (b) Condition 2: stop operation and relieve pressure of lined pipe (80 °C, 0 MPa).
From the calculation results in Figure 8, it can be seen that both the outer pipe and liner pipe show the typical bending stress distribution characteristics of single-layer pipes under the two working conditions. The stress level of the upper compression side and the bottom tension side of the pipe is obviously higher than that of the middle neutral layer, and the overall stress level of the liner pipe is slightly higher than that of the outer pipe. From the point of view of the axial direction of the pipe stress, the stress value of the pipes at the axisymmetric plane with maximum deflection in the bending model is the largest, and the stress value decreases gradually with the increase in the axial distance. In addition, it is also obvious that the circumferential width of the neutral layer of the liner is slightly wider than that of the outer pipe.
Compared with conditions 1 and 2 in Figure 8, only the operating temperature of the pipeline change, and the overall stress level of the outer pipe and liner pipe increases slightly. When the temperature increases from 20 °C to 80 °C, the minimum and maximum Tresca stress values of the outer pipe increase from 12.57 MPa and 113.41 MPa to 20.11 MPa and 115.96 MPa, respectively, and the minimum and maximum Tresca stress values of the liner increase from 41.17 MPa and 124.78 MPa to 64.59 MPa and 127.51 MPa, respectively. Thus, it can be seen that the increase in pipeline operating temperature (60 °C) has a limited influence on pipe stress.
3.1.3. Variation in Pressure
In order to analyze the influence of the change in internal pressure on the stress distribution of the lined pipe, the stress calculation results of the outer and liner pipes under operation conditions 3, 4, and 5 in Table 3 are compared below.
The temperature under the three operating conditions is 80 °C, but the internal pressure is different; the three different internal pressures represent the three different states of the pipeline during operation. The calculation results of the stress distribution of the outer pipe and liner pipe under the three operation conditions are shown in Figure 9.
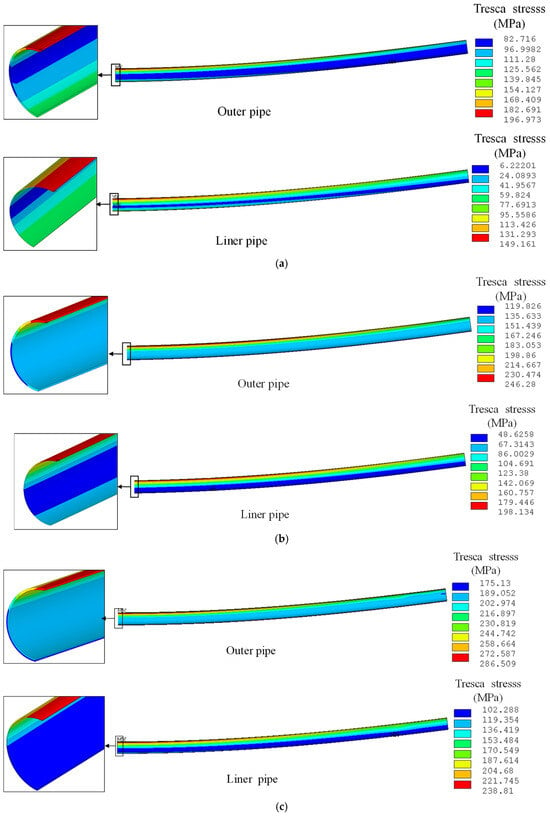
Figure 9.
Influence of pressure on stress distribution of lined composite pipe. (a) Condition 3: low-pressure operation of lined pipe (80 °C, 6 MPa). (b) Condition 4: mid-pressure operation of lined pipe (80 °C, 10 Mpa). (c) Condition 5: design condition of lined pipe (80 °C, 14 Mpa).
It can be seen from Figure 9 that the stress distribution of the lined composite pipe with internal pressure is obviously different from the conditions without internal pressure (Figure 8). Under the premise of internal pressure, the stress distribution of the outer pipe and the liner pipe shows that the stress value of the upper compression side is obviously higher than that of the lower tension side, and the stress level of the outer pipe is much higher than that of the liner pipe. With the increase in internal pressure, the stress level of the outer pipe and liner pipe increases obviously, and the position of low stress in the outer pipe and liner pipe gradually moves to the lower tension side.
Compared with conditions 3, 4, and 5 in Figure 9, only the internal pressure of the pipeline changes, and the overall Tresca stress level of the outer pipe and liner increases obviously when it increases from 6 Mpa to 14 Mpa. The maximum Tresca stress of the outer pipe increases from 196.97 Mpa to 286.51 Mpa, and the maximum Tresca stress of the liner increases from 149.16 Mpa to 238.81 Mpa. Thus, it can be seen that the increase in pipeline internal pressure has a great influence on the stress of the pipe. From the calculation results of condition 5 in Figure 9c, it can be seen that the maximum stress of the outer pipe is far from exceeding the minimum yield strength of its material, but for the liner pipe, the maximum stress has reached 238.81 Mpa, which is close to its yield strength of 241 Mpa. If the operating pressure or temperature of the pipeline increases again, then the liner will enter plastic deformation. Although the liner pipe will not be delaminated or wrinkled when the internal pressure exists, when the pipeline pressure drops, the outer pipe and the liner pipe will spring back simultaneously because the residual plastic deformation in the liner pipe cannot return to the initial state [16]. The elastic recovery of the outer pipe will force the liner to reverse yield, and in serious cases, it will lead to internal buckle and collapse of the liner pipe, which brings a serious threat to the safe operation of the pipeline.
3.1.4. The Outer Pipe Model Error Analysis
In the existing pipeline elastic laying design method, the stress analysis of the lined pipe is carried out by considering only the pressure-bearing effect of the outer pipe. In order to study the error of this method, the difference between the pressure-bearing effect of only outer pipe and that of the lined pipe with the outer and liner pipe together under the same working condition is analyzed.
Therefore, using the same analysis method, the elastic laying finite element model of only the outer pipe is established, the research object in Figure 6 is changed from the lined pipe to the outer pipe only, and other boundary conditions remain unchanged. Similarly, under the five operation conditions listed in Table 3, the finite element stress analysis of the outer pipe model is carried out, and the maximum Tresca stress calculation results of the pipe are compared and analyzed, as shown in Table 4.

Table 4.
Comparison of maximum Tresca stress errors between lined pipe model and outer pipe model.
It can be seen from Table 4 that under conditions 1 and 2, the error of the maximum stress of the outer pipe between the lined pipe model and the outer pipe model is small. Under the condition of internal pressure, when the internal pressure of the pipeline is less than 10 Mpa, the error of the maximum Tresca stress in the two models is less than 4.10%. Under condition 5, when the internal pressure is 14 Mpa, the error of the maximum Tresca stress value of the outer pipe in the two models reaches 16.63%. The large error in condition 5 (16.63%) is primarily due to the liner pipe’s significant contribution to the overall stress distribution under high internal pressures (14 Mpa). At such pressures, the liner pipe actively participates in bearing the load, reducing the stress on the outer pipe. This effect is further amplified by the liner pipe’s lower elastic modulus (196 Gpa) and Poisson’s ratio (0.3), which allow it to deform more under pressure and redistribute the stress between the liner and outer pipes. These factors are not captured in the outer pipe only model, leading to a significant underestimation of the outer pipe’s stress levels. The lined pipe model, which considers the interaction between the liner and outer pipes, provides a more accurate representation of the stress distribution under high-pressure conditions. In order to more intuitively compare the stress errors of the two calculation models, the parameters in the table are drawn as in Figure 10 below.
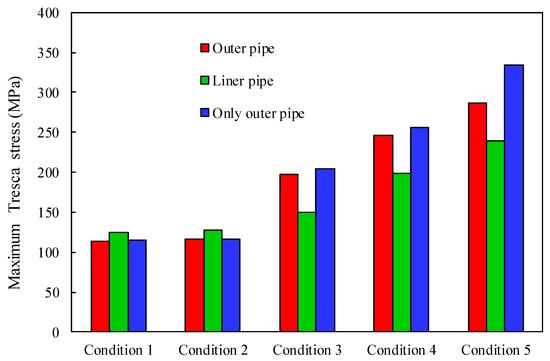
Figure 10.
Maximum Tresca stress comparison between lined pipe model and outer pipe model.
Combined with Figure 10 and Table 3, it can be seen that under the condition of no internal pressure (conditions 1 and 2), the maximum Tresca stress of the outer pipe of the two models is almost equal when only the bending load caused by the elastic laying and the temperature load act together. The maximum Tresca stress value of the liner pipe is slightly higher than that of the outer pipe. Under the condition of internal pressure (conditions 3, 4, and 5), with the increase in internal pressure, the error of the maximum Tresca stress of the outer pipe in the two models increases gradually. It can be seen that due to the pressure-bearing effect of the liner pipe, the maximum stress of the outer pipe in the lined pipe model is obviously lower than that of the outer pipe model, and the stress level of the outer pipe in the two models is much higher than that of the liner pipe. With the increase in the internal pressure, the stress level error of the outer pipe in the two models begins to increase; this fully shows that the pressure-bearing effect of the liner pipe in the lined pipe model is very significant with the increase in the internal pressure. If the elastic laying parameter design of the lined pipe system is guided only from the stress level of the outer pipe, then the stress calculation result of the lined pipe model is conservative because the pressure-bearing effect of the liner pipe is taken into account.
At the same time, the stress level of the liner pipe should be paid attention to. It can be seen from Table 1 that the yield strength of the liner pipe is obviously lower than that of the outer pipe. If the stress of the liner pipe exceeds its yield strength during the operation stage, after the pipeline pressure drops, then due to the elastic recovery of the outer pipe, it will lead to the reverse yield of the liner [16].
3.2. Tightness Analysis
In order to analyze the change in the contact pressure between the outer pipe and liner pipe under the five conditions in Table 3, the model for evaluating the bonding strength of the lined pipe is established, and the change in bonding strength of the lined pipe under different working conditions is studied. We extract the tightness parameters of the interface between the liner and the outer pipe in the model in Figure 6. In order to make a more intuitive comparative study of the change in tightness, we specify the axial path of the compact parameter analysis, as shown in Figure 11.
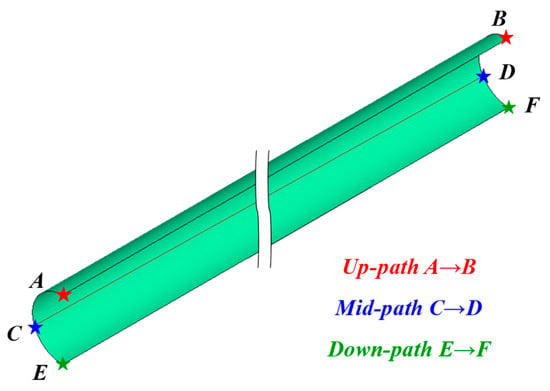
Figure 11.
Definition of three paths for axial direction tightness of lined pipe.
As shown in Figure 11, where points A, C, and E are the three points on the cross-section with the largest deflection in Figure 6, the AB line on the bending compression side of the lined pipe is defined as the Up path, the neutral CD line of the lined pipe is taken as the Mid path, and the EF line of the bending tension side of the lined pipe is taken as the Down path.
According to the different operation conditions in Table 3, the tightness in the range of 0 m and 10 m in the axial direction is analyzed. The cloud diagram of the compactness distribution of the lined pipe is calculated, and the variation curve of the compactness along the axial Up, Mid, and Down paths is shown in Figure 12.
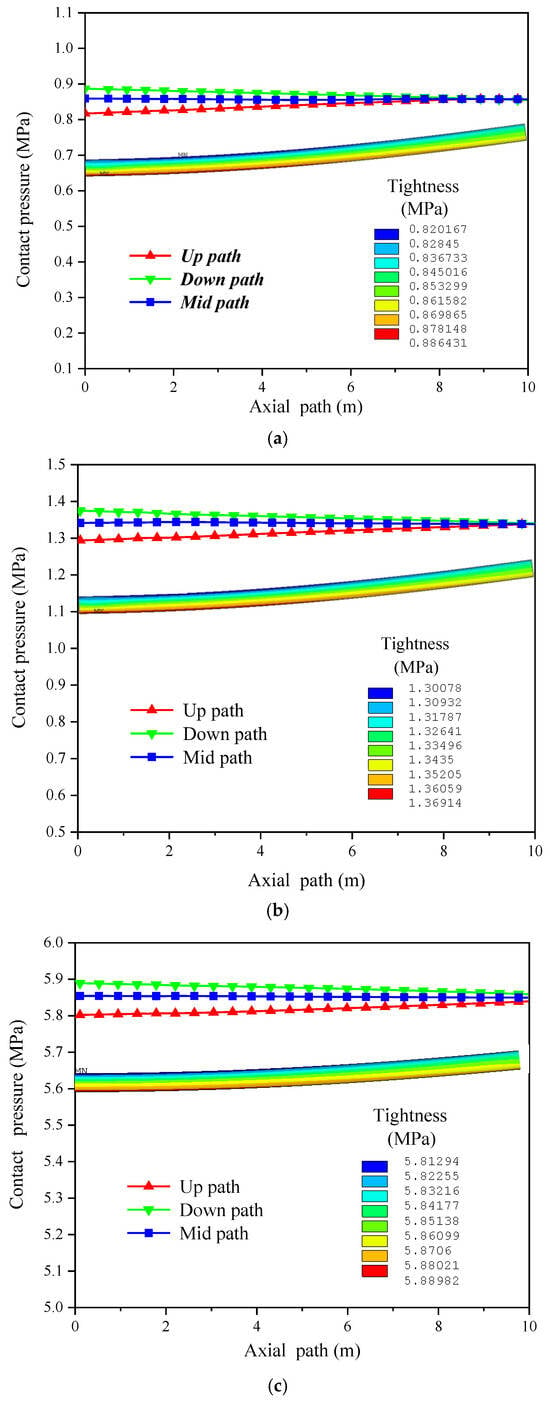
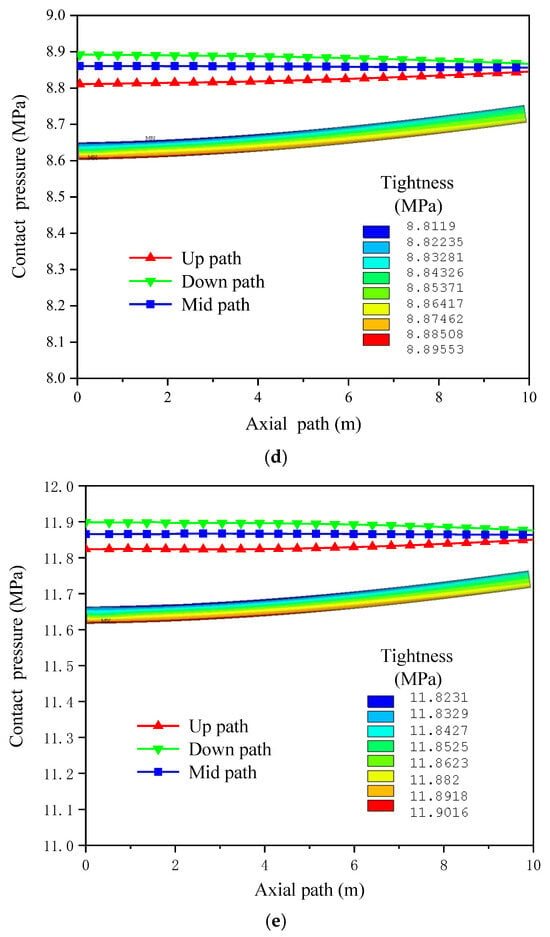
Figure 12.
Lined pipe tightness of Up, Mid, and Down paths under different operation conditions. (a) Condition 1: installation condition. (b) Condition 2: stop operation and relieve pressure. (c) Condition 3: low-pressure operation. (d) Condition 4: mid-pressure operation. (e) Condition 5: design condition.
It can be seen from Figure 12 that under the five operation conditions, the axial distribution of the tightness of the lined pipe is relatively uniform, and at the axisymmetric plane of the lined pipe model, there is only a slight difference between the compactness of the Up path and the Down path. The tightness of the Down path is the highest, followed by the Mid path, and the Up path is the lowest. The distribution of the tightness of the neutral layer along the axial path is relatively stable.
Compared with conditions 1 and 2 in Figure 12, when the temperature increases from 20 °C to 80 °C, the average tightness (Mid path) of the lined pipe increases from 0.86 MPa to 1.34 MPa. It can be seen that increasing the temperature can slightly increase the tightness of the lined pipe without internal pressure.
Compared with conditions 1, 2, and 3 in Figure 12, we can see that when the internal pressure increases from 6 MPa to 14 MPa, the average tightness of the three paths increases from 5.85 MPa to 11.86 MPa, which shows that the internal pressure is the key parameter affecting the tightness of the lined pipe. Therefore, under the premise of internal pressure, the liner is in close contact with the outer pipe, that is, delamination and separation will not occur under these conditions.
According to the structural characteristics of the lined pipe, the different operation states of the lined pipe under the condition of elastic laying are comprehensively evaluated by using the two indexes of stress level and tightness parameters. This method can fully meet the requirements of the stress analysis and quality evaluation of lined composite pipelines.
4. Conclusions
This study provides a detailed analysis of the mechanical behavior of lined pipes under elastic laying conditions, focusing on the stress distribution and bonding strength between the liner and outer pipes under temperature–pressure coupling. The key findings are as follows:
- (1)
- Liner stress and yield strength: Under high-pressure conditions (14 MPa), the liner pipe’s stress levels approach its yield strength (241 MPa), indicating a potential risk of plastic deformation. This highlights the need for the careful design of laying radii to prevent liner failure under extreme operational conditions.
- (2)
- Bonding strength and internal pressure: Internal pressure significantly enhances the bonding strength between the liner and outer pipes, reducing the risk of delamination. The tightness between the two pipes increases with pressure, ensuring a stable interface under operational loads.
- (3)
- Limitations of simplified models: Simplified single-layer models, which ignore the liner’s mechanical contribution, underestimate the stress interactions between the liner and outer pipes. This can lead to design errors, particularly under high-pressure conditions, where the liner’s pressure-bearing effect becomes significant.
- (4)
- Design implications: This study emphasizes the importance of considering multi-field coupling effects in the design and installation of lined pipe systems. Designers should account for both the liner and outer pipe stresses under extreme conditions to ensure the pipeline’s long-term integrity.
- (5)
- Although this study based on numerical modeling provides a solid foundation for designing experimental setups, the results can guide the selection of test parameters, such as temperature, pressure, and bending radius, to ensure that the experiments are representative of real-world operational conditions.
Future research should focus on the experimental validation of the numerical model and explore the microstructural changes of pipe materials under operational conditions. These efforts will further refine the design guidelines and enhance the reliability of lined pipe systems in oil and gas transportation.
Author Contributions
Methodology, J.L. (Junyan Liu), J.P. and Y.D.; Software, T.G.; Validation, T.G., J.P. and Y.D.; Formal analysis, J.L. (Ju Liu); Investigation, J.L. (Ju Liu) and Y.D.; Data curation, W.Z.; Writing—original draft, J.L. (Junyan Liu); Writing—review & editing, W.Z.; Funding acquisition, Y.D. All authors have read and agreed to the published version of the manuscript.
Funding
The authors are grateful to the support from National Natural Science Foundation of China (No. 52274006).
Data Availability Statement
The original contributions presented in this study are included in the article. Further inquiries can be directed to the corresponding author.
Conflicts of Interest
Authors Junyan Liu, Wei Zhang, Ju Liu and Jianxin Peng were employed by the R&D Center for Ultra Deep Complex Reservior Exploration and Development, China National Petroleum Corporation (CNPC). The remaining authors declare that the research was conducted in the absence of any commercial or financial relationships that could be construed as a potential conflict of interest.
References
- Li, L.; Yu, T.; Xia, J.; Gao, Y.; Han, B.; Gao, Z. Failure analysis of L415/316L composite pipe welded joint. Eng. Fail. Anal. 2024, 158, 107981. [Google Scholar] [CrossRef]
- Gu, T.; Zhang, Q.; Lian, Z.; Yu, H.; Chen, J. Research and application of equivalent pipe model in stress analysis of lined pipe systems. Int. J. Press. Vessel. Pip. 2021, 192, 104418. [Google Scholar] [CrossRef]
- Ding, X.-D.; Wang, S.-Q.; Liu, W.-C.; Ye, X.-H. A comparative study on the post-buckling behavior of reinforced thermoplastic pipes (RTPs) under external pressure considering progressive failure. China Ocean Eng. 2024, 38, 233–246. [Google Scholar] [CrossRef]
- Yuan, L.; Li, Z.; Luo, Q.; Wang, C. Experimental and theoretical studies on the lateral collapse of mechanically lined pipes. Mar. Struct. 2023, 90, 103404. [Google Scholar] [CrossRef]
- Yuan, L.; Wang, C.; Luo, Q.; Chen, N. Collapse pressure prediction of mechanically lined pipes using FEM and machine learning techniques. Ocean Eng. 2023, 268, 113418. [Google Scholar] [CrossRef]
- Qu, Y.; Chen, N.-Z.; Yuan, L. Cohesive zone model based reliability analysis for a sandwich pipe. Ocean Eng. 2023, 270, 113550. [Google Scholar] [CrossRef]
- Yuan, L.; Zhou, J.; Yu, Z.; Xu, W. Numerical investigation of buckling behavior of dented lined pipe under bending. Int. J. Press. Vessel. Pip. 2023, 205, 104997. [Google Scholar] [CrossRef]
- GB 50251-2015; Code for Design of Gas Transmission Pipeline Engineering. Beijing China Planning Publishing House: Beijing, China, 2015.
- Gavriilidis, I.; Stamou, A.G.; Palagas, C.; Dourdounis, E.; Voudouris, N.; Tazedakis, A.; Karamanos, S.A. Heat treatment effects on collapse of JCO-E steel pipes under external pressure: Experiments and numerical predictions. Mar. Struct. 2024, 93, 103536. [Google Scholar] [CrossRef]
- Yuan, L.; Kyriakides, S. Liner buckling during reeling of lined pipe. Int. J. Solids Struct. 2020, 185–186, 1–13. [Google Scholar] [CrossRef]
- Yuan, L.; Kyriakides, S. Liner wrinkling and collapse of girth-welded bi-material pipe under bending. Appl. Ocean Res. 2015, 50, 209–216. [Google Scholar] [CrossRef]
- Yuan, L.; Kyriakides, S. Hydraulic expansion of lined pipe for offshore pipeline applications. Appl. Ocean Res. 2021, 108, 102523. [Google Scholar] [CrossRef]
- Gu, T.; Lian, Z.; Dou, Y.; Wu, Z.; Li, G. Simulation and experimental study on liner collapse of lined composite pipe. Int. J. Press. Vessel. Pip. 2024, 207, 105106. [Google Scholar] [CrossRef]
- Hilberink, A. Mechanical Behaviour of Lined Pipe; Delft University of Technology: Delft, The Netherlands, 2011. [Google Scholar]
- Wang, F.-C.; Li, W.; Han, L.-H. Interaction behavior between outer pipe and liner within offshore lined pipeline under axial compression. Ocean Eng. 2019, 175, 103–112. [Google Scholar] [CrossRef]
- Wang, X.; Li, P.; Wang, R. Study on hydro-forming technology of manufacturing bimetallic CRA-lined pipe. Int. J. Mach. Tools Manuf. 2005, 45, 373–378. [Google Scholar] [CrossRef]
- Focke, E.S.; Gresnigt, A.M.; Hilberink, A. Local Buckling of Tight Fit Liner Pipe. J. Press. Vessel Technol. 2011, 133, 011207. [Google Scholar] [CrossRef]
- Zheng, M.; Gao, H.; Teng, H.; Hu, J.; Tian, Z.; Zhao, Y. A Simplified Approach for the Hydro-Forming Process of Bi-Metallic Composite Pipe. Arch. Metall. Mater. 2017, 62, 879–883. [Google Scholar] [CrossRef][Green Version]
- Kalaki, A.; Eskandarzade, M.; Barghani, S.; Mohammadpour, M. Experimental and numerical evaluation of influencing parameters on the manufacturing of lined pipes. Int. J. Press. Vessel. Pip. 2019, 169, 71–76. [Google Scholar] [CrossRef]
- Guo, X.; Sun, W.; Becker, A.; Morris, A.; Pavier, M.; Flewitt, P.; Tierney, M.; Wales, C. Thermal and stress analyses of a novel coated steam dual pipe system for use in advanced ultra-supercritical power plant. Int. J. Press. Vessel. Pip. 2019, 176, 103933. [Google Scholar] [CrossRef]
- Balakrishnan, S.; Veerappan, A.R.; Shanmugam, S. B2 stress index for structurally distorted pipe bends under in-plane opening bending moment. Int. J. Press. Vessel. Pip. 2019, 176, 103957. [Google Scholar] [CrossRef]
- Phan, H.C.; Le, T.-T.; Bui, N.D.; Duong, H.T.; Pham, T.D. An empirical model for bending capacity of defected pipe combined with axial load. Int. J. Press. Vessel. Pip. 2021, 191, 104368. [Google Scholar] [CrossRef]
Disclaimer/Publisher’s Note: The statements, opinions and data contained in all publications are solely those of the individual author(s) and contributor(s) and not of MDPI and/or the editor(s). MDPI and/or the editor(s) disclaim responsibility for any injury to people or property resulting from any ideas, methods, instructions or products referred to in the content. |
© 2025 by the authors. Licensee MDPI, Basel, Switzerland. This article is an open access article distributed under the terms and conditions of the Creative Commons Attribution (CC BY) license (https://creativecommons.org/licenses/by/4.0/).