Article

High-Accuracy Simulation of Polymer Flooding Based on Weighted Essentially Non-Oscillatory (WENO) Scheme

1
CNOOC Energy Development Corporation Engineering Technology Branch Company, Tianjin 300452, China
2
Hubei Key Laboratory of Oil and Gas Drilling and Production Engineering, Yangtze University, Wuhan 430100, China
3
School of Petroleum Engineering, Yangtze University, Wuhan 430100, China
4
Western Research Institute, Yangtze University, Karamay 834000, China
*
Authors to whom correspondence should be addressed.
Processes 2025, 13(3), 671; https://doi.org/10.3390/pr13030671
Submission received: 9 February 2025 / Revised: 25 February 2025 / Accepted: 25 February 2025 / Published: 27 February 2025
(This article belongs to the Section Materials Processes)

Abstract

:
This paper develops a numerical simulation method for polymer-flooding reservoirs using the high-order Weighted Essentially Non-Oscillatory (WENO) scheme. The research begins by leveraging the WENO method to obtain high-order approximations of the saturation and polymer concentration functions and formulates a sequential solution strategy for the hyperbolic mass conservation equations of the water phase and polymer component in these reservoirs. Three numerical tests compare the WENO scheme with the traditional first-order upwind difference method. The results show that the WENO scheme has higher computational accuracy, especially in predicting fronts, which improves the prediction of water cut and polymer production concentration. Under the same accuracy, the WENO method requires fewer grids and has much higher computational efficiency. A sensitivity analysis of the polymer solution viscosity parameters verifies that the WENO method can accurately simulate reservoir production behavior, providing an efficient and accurate reservoir simulation alternative.

1. Introduction

In the context of the continuously growing global energy demand, oil, as a crucial strategic energy source and the research, development, and application of its efficient extraction technologies have always been at the core of the petroleum industry [1,2]. Among numerous enhanced oil recovery technologies, polymer-flooding technology, with its unique advantages, has been widely applied and deeply studied over the past few decades [3,4]. Its basic principle is to inject polymer solutions into the reservoir. By taking advantage of the viscosity-increasing effect of polymer molecules, the viscosity of the injected water is enhanced. In the complex pore structures of the reservoir, the originally low-viscosity injected water is prone to the fingering phenomena, that is, the water advances in a finger-like shape in the oil layer, resulting in low oil displacement efficiency [5]. However, after the injection of the polymer solution, the viscosity of the injected water increases, the oil–water mobility ratio is improved, the injected water can advance more evenly, the swept volume expands, and thus the crude oil recovery rate is increased. For example, in many actual oilfield applications, polymer-flooding technology has successfully increased the crude oil recovery rate by 10–20% [6]. This remarkable achievement has made it an important technical option for major oilfields to increase production.
Accurately simulating the polymer-flooding process enables the pre-enactment of different extraction schemes before actual production and the analysis of the impacts of various factors such as different geological conditions and injection parameters on the polymer-flooding effect [7]. Muhammad et al. [8] used three different reservoir simulators to simulate surfactant–polymer flooding using two-phase and three-phase microemulsion phase behavior models to determine and compare their results. This is conducive to optimizing the extraction scheme. For instance, by reasonably adjusting parameters such as the injection concentration, injection rate, and injection timing of the polymer, the crude oil recovery rate of polymer flooding can be maximized.
Traditional low-order numerical methods, such as first-order finite difference or finite volume methods, may introduce numerical dispersion, leading to a blurred calculated concentration front [9]. Urrea-Quintero et al. [10] used different numerical methods to solve and analyze various nonlinear models describing diffusion–deformation in hydrogels caused by non-reactive solvent absorption and gave a reasonable prediction of the diffusion–deformation process. Numerical oscillations can cause the instability of the calculation results, especially in high-gradient regions (such as the concentration front) [11]. Therefore, establishing a polymer numerical simulation method that can capture detailed features with high accuracy and good stability is of great significance for accurately describing the polymer-flooding process and improving the efficiency of oilfield development.
To address these issues, a series of high-order numerical methods have emerged [12,13]. The Weighted Essentially Non-Oscillatory (WENO) scheme is one of them. It was initially developed to solve discontinuous problems such as shock waves in computational fluid dynamics and is an advanced high-precision numerical calculation method. Du et al. [14] improved the simple WENO limiter of the Runge–Kutta discontinuous Galerkin (RKDG) method for solving two-dimensional hyperbolic equations on unstructured grids. The improved simple WENO limiter reduces the computational cost and improves efficiency. Its core idea is to perform a weighted average of the numerical solutions of different templates and automatically select the templates in the smooth regions, so as to accurately capture the detailed information of the flow field without generating non-physical oscillations. When dealing with discontinuous and complex flow problems, the WENO scheme demonstrates advantages that are difficult to match by traditional methods [15,16]. For example, when simulating the shock-tube problem with strong discontinuities, the WENO scheme can clearly capture the position and intensity of the shock waves, while traditional methods will exhibit obvious oscillations and distortions. Yee et al. [17] designed an efficient fifth-order finite difference multi-resolution WENO scheme, which can obtain the optimal high-order accuracy in the smooth region and basically maintain no oscillation. In the polymer-flooding simulation, the WENO scheme can more accurately describe the seepage characteristics of the polymer solution in the reservoir pores, including the diffusion, convection of the solution, and its interactions with the crude oil.
The Discontinuous Galerkin (DG) method is also an important high-order numerical method. It is based on the weak form of the finite element method but allows for discontinuities at the boundaries between elements [18]. This characteristic gives the DG method unique advantages in handling complex geometric shapes and discontinuous problems [19]. When solving hyperbolic partial differential equations, the DG method can flexibly handle discontinuous solutions and obtain high-precision numerical solutions through high-order polynomial approximation. However, the computational cost of the DG method is relatively high, especially when dealing with large-scale problems, and the demand for computational resources is significant. When applying the DG method in a polymer-flooding simulation, although it can handle complex reservoir boundaries and seepage discontinuities well, the challenges in computational efficiency limit its wider application.
The Essentially Non-Oscillatory (ENO) scheme is also a high-order numerical method for handling discontinuous problems. The ENO scheme avoids numerical oscillations by adaptively selecting the templates in the smooth regions, thus being able to accurately capture the discontinuities and complex structures in the flow field [20,21,22]. Compared with traditional methods, the ENO scheme has a significant improvement in accuracy and the ability to capture discontinuities. However, during the calculation process of the ENO scheme, the selection of templates is relatively complex, and the computational efficiency is relatively low. With in-depth research, the WENO scheme has been improved based on the ENO scheme. By introducing the idea of weighted averaging, the selection of templates becomes more flexible and efficient, overcoming the low-computational-efficiency problem of the ENO scheme to a certain extent.
Currently, the application research of the WENO scheme in the petroleum engineering field is still in the development stage. Although some scholars have attempted to apply it to reservoir numerical simulation, in the specific field of polymer flooding, relevant research is still relatively scarce [23]. Garcia et al. [24] used the essentially weighted non-oscillatory scheme to discretize the modified Buckley–Leverett equation and coupled it with the third-order Runge–Kutta method and the fourth-order central finite difference method to investigate the time evolution of oil–water and water–oil conversion scenarios under two different initial conditions. Liu et al. [25] established a high-precision numerical simulation model of two-phase flow in a deep-sea mining gas lift pump, which was used to predict the flow field at the outlet of the gas lift pump during a deep-sea mining transshipment operation. Therefore, it is necessary to conduct in-depth research on the polymer-flooding simulation method based on the WENO scheme, combine the advantages of high-order numerical methods, obtain a high-resolution water-flooding front, and thus provide more accurate dynamic prediction results of polymer-flooded reservoirs. The Interwell numerical simulation (INSIM) [26,27] is a physics-based data-driven method that has gradually gained popularity in recent years and is used for reservoir simulation and history matching. Compared with traditional fine-scale reservoir numerical simulation methods, when applied to actual blocks, it has the advantage of being more efficient and effective. Therefore, in the future, we intend to transplant this work into the INSIM framework. When the INSIM framework conducts simulations of an entire 2D or 3D reservoir, it first calculates the global pressure distribution to obtain the total flux between each pair of nodes. Then, it calculates the convection-dominated variables (such as saturation and polymer concentration distributions) on the one-dimensional connection elements between each pair of nodes. Thus, this work will focus on how to use the WENO method to carry out high-precision polymer-flooding simulations in a one-dimensional channel with a known total oil–water flux.

2. Methodology

2.1. Polymer-Flooding Model

Assume that the changes in the viscosity and relative permeability of the oil phase during the polymer solution flooding process are small and can be regarded as constant. Then the water cut is mainly affected by the concentration of the polymer solution. In addition, the water cut is also related to the water saturation. The polymer solution changes the oil–water mobility ratio by increasing the viscosity [28,29], and a cubic polynomial is used for viscosity modification:
μ w = μ w i 1 + r C p + s C p 2 + t C p 3
where μwi and μw are the viscosities of the polymer solution before and after adding the polymer, respectively; Cp is the polymer concentration; and r, s, and t are the equation parameters measured through experiments. Describe the ratio of oil–water relative permeability, and then substitute it into the fractional flow equation to obtain the water cut. The ratio of oil–water relative permeability is usually expressed as a function of water saturation and is used to describe the flow behavior of multiphase fluids in porous media. When conducting flow simulation research in oilfield sites, the required fluid relative permeability data are obtained through displacement experiments on the cores of that oilfield. Usually, we use the experimental data to fit the commonly adopted functional forms to obtain the corresponding function parameter values. When conducting flow simulation research in oilfield sites, the required fluid relative permeability data are obtained through displacement experiments on the cores of that oilfield. Common models include empirical models based on simplified assumptions and the Corey model. Assume that the ratio of oil–water relative permeability changes linearly with water saturation, and the simplified form based on Archie’s formula can be expressed as:
k r o k r w = a b S w
where a and b are undetermined constant parameters that need to be obtained by fitting experimental data; and Sw is the water saturation.
Considering the influence of residual oil saturation and irreducible water saturation, the modified exponential function model can more accurately describe the influence of water saturation on the ratio of oil–water relative permeability. In this modified model, it is assumed that the relative permeabilities of the oil phase and the water phase change exponentially with water saturation, but this change only takes effect within the effective saturation range (that is, between the irreducible water saturation and the residual oil saturation). The modified model can be expressed as:
k r o k r w = 1 S w S o r / 1 S o r S w c 2 S w S w c / 1 S o r S w c 2
where Swc is the irreducible water saturation and Sor is the residual oil saturation.
Ignoring the effects of capillary force and gravity, regarding the polymer solution as the water phase, it is equivalent to the two-phase flow of oil and water at this time. Substituting the modified viscosity equation and relative permeability, the fractional flow equation can be expressed as:
f w ( S w , C p ) = k r w S w μ w C p k r w S w μ w C p + k r o S w μ o = k r w S w k r o S w k r w S w k r o S w + μ w C p μ o
Consider the polymer flooding as the two-phase flow of oil and water in a one-dimensional direction. The flow governing equations for polymer flooding can be written as:
S w t + Q A ϕ f w x = 0
S w C p t + Q A ϕ f w C p x = 0
where Q is the total flux and A is the flow area, ϕ is the porosity.
This study is actually aimed at providing a calculation method for the distribution of water saturation and polymer concentration on one-dimensional connection elements within the INSIM framework. In this case, it is assumed that x = 0 is the upstream of this one-dimensional channel. The initial and boundary conditions of Equations (5) and (6) are generally as follows:
S w ( t = 0 ) = D ,   S w ( x = 0 ) = E ,
C p ( t = 0 ) = F ,   C p ( x = 0 ) = G .
where D and F are the initial distributions of water saturation and polymer concentration at the moment t = 0 , and E and G are the boundary conditions of water saturation and polymer concentration at the upstream end, respectively.

2.2. WENO Calculation of Governing Equations

First, fix the polymer concentration at time n. Then, the water cut can actually be regarded as a function of water saturation: f w S w , C p ( n ) . For Equation (5), use the finite volume method to integrate within [xi−Δx/2, xix/2], and we can achieve:
x i Δ x / 2 x i + Δ x / 2 S w t d x = Q A ϕ x i Δ x / 2 x i + Δ x / 2 f w x d x
Then, Equation (9) can be rewritten as:
t x i Δ x / 2 x i + Δ x / 2 S w d x Δ x i = Q A ϕ Δ x i f w x i + Δ x / 2 f w x i Δ x / 2
where Swi represents the water saturation in unit i. It can be understood that Swi is the average value in the integration domain [xi−Δx/2, xix/2], that is S w i 1 Δ x x i Δ x / 2 x i + Δ x / 2 S w ( x , t ) d x . Q f w represents the numerical flux of the polymer solution (i.e., water phase).
Equation (6) represents the exact solution of the governing equation of the water phase. However, the exact values of the water saturation Sw(xi−1/2, t) and Sw(xi+1/2, t) at the boundaries of xi are difficult to obtain, and it is necessary to perform high-order reconstruction on the numerical fluxes f at the boundaries.
In the WENO method, we need to find a polynomial function p(x) such that the polynomial function satisfies f(xi,t) = p(xi) and has r-order accuracy. It can be expressed as:
f ( x i , t ) + o ( Δ x r ) = 1 Δ x i x i Δ x / 2 x i + Δ x / 2 p ( x ) d x
As long as the specific form of the polynomial function p(x) is known, the approximate value of the water saturation at the boundary can be obtained under the condition of sufficient accuracy, that is:
f i + 1 / 2 = p x i + 1 / 2
To obtain the polynomial function p(x), it is necessary to establish a template S(i) with r − 1 grids near node i. Assume that there are m grids on the left side of node i and n grids on the right side, then S(i) can be expressed as:
S ( i ) = I i m , , I i , , I i + n ,   m + n = r 1
Under the condition that the function values on the template S(i) are known (given by the initial conditions at t = 0), using the Lagrange interpolation method to represent the polynomial function p(x), the numerical flux at the boundary can be expressed as:
f ¯ i + 1 / 2 = p ( x i + 1 / 2 ) = k = 1 m + n + 1 l i k ( x i + 1 / 2 ) f ¯ i k
where the polynomial coefficient li+k can be expressed as:
l i k ( x ) = k = 1 , k i m + n + 1 ( x x k ) k = 1 , k i m + n + 1 ( x i x k ) , k = i m , , i , , i + n
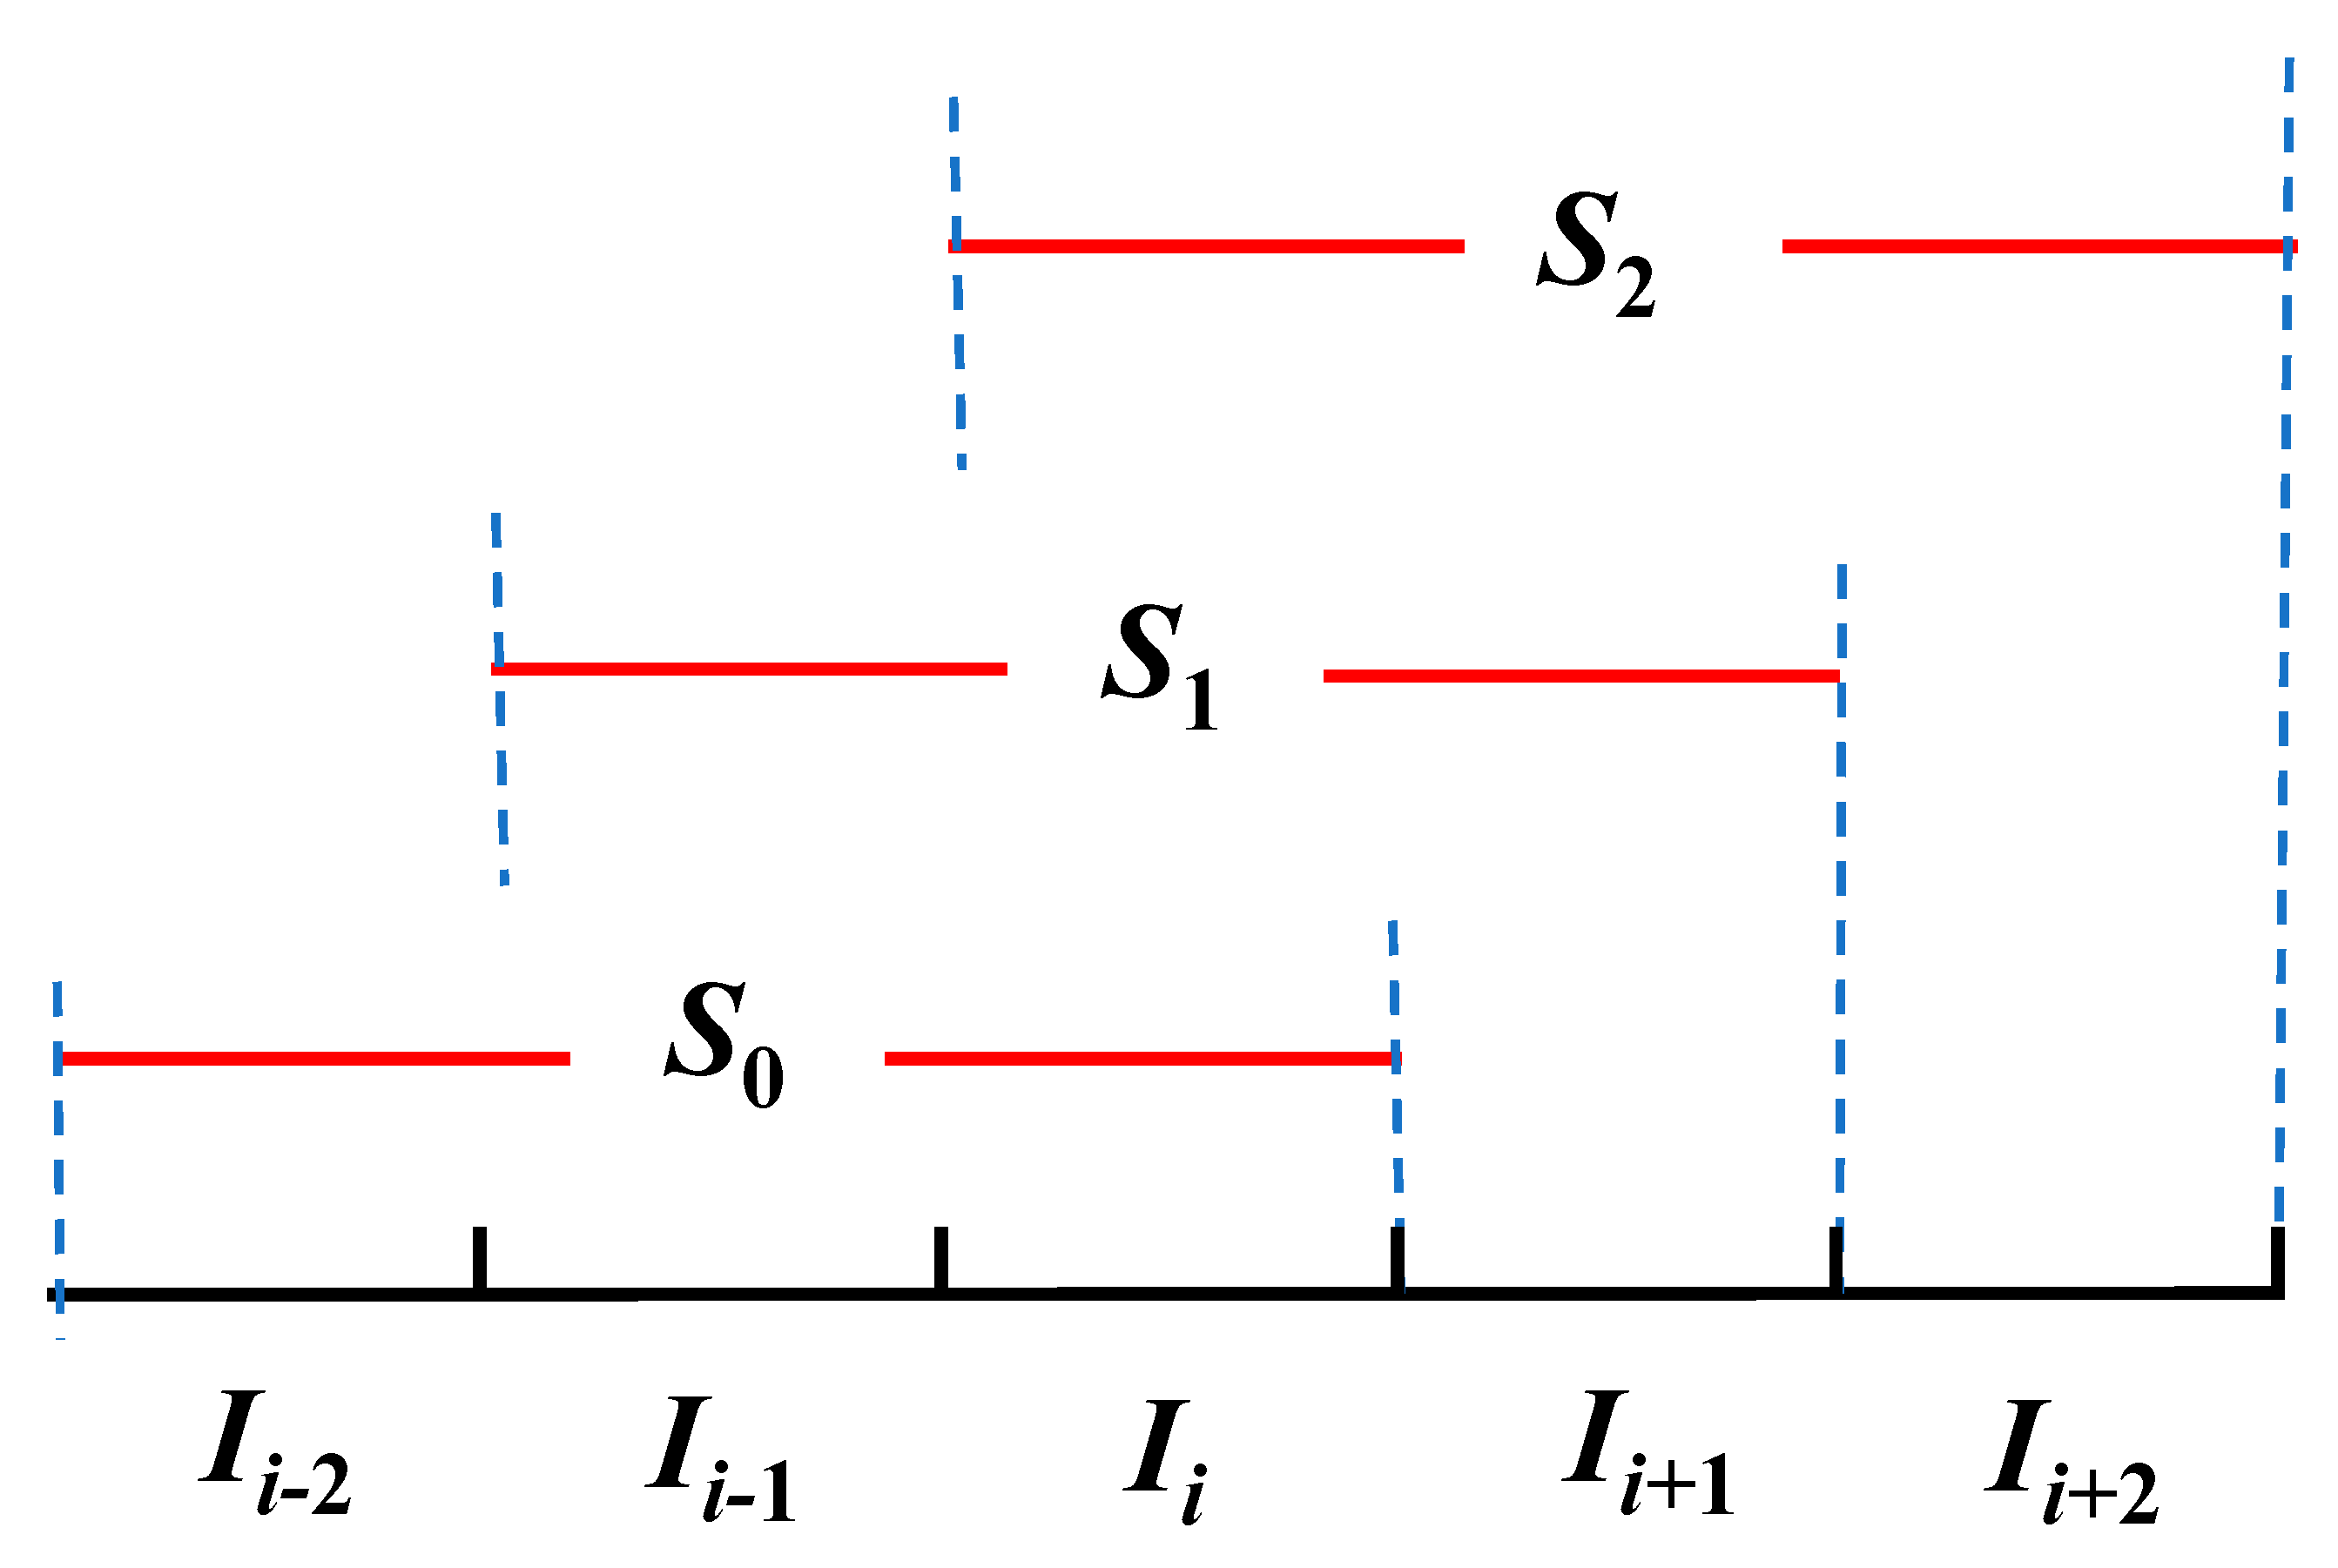
The present invention adopts the fifth-order WENO format to solve the hyperbolic partial differential equation. Therefore, three numerical flux units need to be selected in the template S(x) to solve the polynomial function p(x), as shown in Figure 1. In addition, to eliminate the numerical oscillations caused by the discontinuous elements included in the fixed template, the WENO format uses the convex combination of multiple templates Si to solve the problem of discontinuous elements. In the present invention, a WENO discrete format is established by combining three templates S0, S1, and S2, as shown in Figure 2.
Under the condition of a single template S1 = {Ii−1, Ii, Ii+1}, combining Equations (12) and (13), the expression of the polynomial function p(x) can be solved as:
p ( x ) = ( f ¯ i 1 24 δ 2 f ¯ i ) + f ¯ i + 1 f ¯ i 1 2 Δ x ( x x i ) + δ 2 f ¯ i 2 Δ x 2 ( x x i ) 2
where δ 2 f ¯ i = f ¯ i 1 2 f ¯ i + f ¯ i + 1 .
After knowing the polynomial p(x), according to Equation (14), the reconstructed form can be obtained, which is expressed as:
f ¯ i + 1 / 2 ( S 1 ) = p ( x i + 1 / 2 ) = ( f ¯ i 1 24 δ 2 f ¯ i ) + f ¯ i + 1 f ¯ i 1 2 Δ x ( x x i ) + δ 2 f ¯ i 2 Δ x 2 ( x x i ) 2 x = x i + Δ x 2 = 1 6 f ¯ i 1 + 5 6 f ¯ i + 1 3 f ¯ i + 1
Similarly, the reconstructed numerical fluxes in templates S0 and S2 can be solved.
f ¯ i + 1 / 2 S 0 = 1 3 f ¯ i 2 7 6 f ¯ i 1 + 11 6 f ¯ i ,   f ¯ i + 1 / 2 ( S 2 ) = 1 3 f ¯ i + 5 6 f ¯ i + 1 1 6 f ¯ i + 2
When the union of these three templates contains five node values, a fifth-order approximation format for f ¯ i + 1 / 2 can be obtained. This fifth-order approximation format can be expressed as a linear combination of f ¯ i + 1 / 2 S 0 , f ¯ i + 1 / 2 S 1 , and f ¯ i + 1 / 2 S 2 :
f ¯ i + 1 / 2 = y 1 f ¯ i + 1 / 2 S 0 y 2 f ¯ i + 1 / 2 S 1 + y 3 f ¯ i + 1 / 2 S 2
where y 1 = 1 / 3 , y 2 = 7 / 6 , y 3 = 11 / 6 .
The WENO method needs to establish a convex combination of all templates Si, and the form is as follows:
f ¯ i + 1 / 2 = r = 0 2 ω r f ¯ i + 1 / 2 ( S r )
To ensure stability and consistency, the weight ωr must satisfy the following conditions:
ω r 0 , r = 0 2 ω r = 1
When all templates Sr are in the smooth region, that is, any unit Sr(i) in the template is not a discontinuous unit, at this time, let ωr = yr, and we can achieve:
f ¯ i + 1 / 2 = y 0 f ¯ i + 1 / 2 ( S 0 ) + y 1 f ¯ i + 1 / 2 ( S 1 ) + y 2 f ¯ i + 1 / 2 ( S 2 )
When the template Sr is in the discontinuous region, in order to reduce numerical oscillations, the template weight ωr should be set small enough to reduce the impact of discontinuous values on the calculation.
Under discontinuous conditions, Jiang and Shu [30] gave the calculation form of ωr through a large number of experiments:
ω r = ω ¯ k i = 0 n ω ¯ i ,   ω ¯ k = y k ( ε + β k ) 2
In Equation (23), the coefficient ε is introduced to prevent the denominator from being 0. In the present invention, ε = 10−6.
In the WENO method, the smoothness of each template is measured by the smooth factor βk. The present invention directly adopts the calculation form given by Jiang and Shu [30] as:
β k = Δ x i x i 1 / 2 x i + 1 / 2 p ( x ) 2 d x + Δ x i 3 x i 1 / 2 x i + 1 / 2 p ( x ) 2 d x
Based on the WENO scheme, high-order approximation of the water saturation function and the polymer concentration function can be obtained, resulting in:
S ¯ w , i + 1 / 2 = r = 0 2 ω r S ¯ w , i + 1 / 2 S r
C ¯ p , i + 1 / 2 = r = 0 2 ω r C ¯ p , i + 1 / 2 S r
After using the WENO method to calculate the water saturation at time n + 1, fix the polymer concentration at time n. That is,
S ¯ w , i n + 1 S ¯ w , i n Δ t = Q A ϕ Δ x i f w S ¯ w , i + 1 / 2 n , C ¯ p , i + 1 / 2 n f w S ¯ w , i 1 / 2 n , C ¯ p , i 1 / 2 n
By substituting Equations (25) and (26) into Equation (27), Equation (28) is obtained. With Equation (28), the water saturation value S ¯ w , i n + 1 at the (n + 1)-th time step can be calculated via Equation (29).
S ¯ w , i n + 1 S ¯ w , i n Δ t = Q A ϕ Δ x i f w r = 0 2 ω r S ¯ w , i + 1 / 2 S r , n , r = 0 2 ω r C ¯ p , i + 1 / 2 S r , n f w r = 0 2 ω r S ¯ w , i 1 / 2 S r , n , r = 0 2 ω r C ¯ p , i 1 / 2 S r , n
S ¯ w , i n + 1 = S ¯ w , i n Q Δ t A ϕ Δ x i f w r = 0 2 ω r S ¯ w , i + 1 / 2 S r , n , r = 0 2 ω r C ¯ p , i + 1 / 2 S r , n f w r = 0 2 ω r S ¯ w , i 1 / 2 S r , n , r = 0 2 ω r C ¯ p , i 1 / 2 S r , n
Based on S ¯ w , i n + 1 , the discretization of the mass conservation equation for the polymer component is given by Equation (30). Thus, according to Equation (30), the polymer concentration C ¯ p , i n + 1 at the (n + 1)-th time step can be calculated via Equation (31).
S ¯ w , i n + 1 C ¯ p , i n + 1 S ¯ w , i n C ¯ p , i n t = Q A ϕ f w r = 0 2 ω r S ¯ w , i + 1 / 2 S r , n , r = 0 2 ω r C ¯ p , i + 1 / 2 S r , n r = 0 2 ω r C ¯ p , i + 1 / 2 S r , n Δ x i + Q A ϕ f w r = 0 2 ω r S ¯ w , i 1 / 2 S r , n , r = 0 2 ω r C ¯ p , i 1 / 2 S r , n r = 0 2 ω r C ¯ p , i 1 / 2 S r , n Δ x i
C ¯ p , i n + 1 = S ¯ w , i n C ¯ p , i n S ¯ w , i n + 1 Q Δ t S ¯ w , i n + 1 A ϕ f w r = 0 2 ω r S ¯ w , i + 1 / 2 S r , n , r = 0 2 ω r C ¯ p , i + 1 / 2 S r , n r = 0 2 ω r C ¯ p , i + 1 / 2 S r , n Δ x i + Q Δ t S ¯ w , i n + 1 A ϕ f w r = 0 2 ω r S ¯ w , i 1 / 2 S r , n , r = 0 2 ω r C ¯ p , i 1 / 2 S r , n r = 0 2 ω r C ¯ p , i 1 / 2 S r , n Δ x i
Next, based on this sequential solution scheme, the distributions of water saturation and polymer concentration at subsequent time steps are solved.

3. Numerical Examples

In this section, we will present three numerical examples to evaluate the computational performance of the method proposed in this paper. Specifically, Example 1 is designed to demonstrate that the method in this work has higher computational accuracy compared to the classical upwind FDM and DG methods. Subsequently, we will vary the parameters related to the fluid viscosity to examine the robustness, computational efficiency, and convergence order of our method. Finally, in Example 3, we investigate the impact of viscosity parameters of different types of polymer solutions on the effectiveness of polymer flooding. For the convenience of analyzing the influence of viscosity parameters, in this example, we simply select the polymer–solution viscosity parameters with r = s = t . However, the corresponding results do not affect the computational robustness of this method under different viscosity-parameter conditions.

3.1. Example 1

In this example, the commonly used relative permeability ratio formula shown in Equation (3) is selected. Let the initial viscosity of the water phase in Equation (1) be 1 cp, and r = s = t = 1 . The viscosity of the oil phase is 5 cp. Other physical property parameters are presented in Table 1. The initial and boundary conditions are set in Equation (32). Those values are all derived from the actual physical property parameters that frequently appear in a large number of reservoir blocks that we have dealt with.
S w ( t = 0 ) = S w c = 0.15 ,   S w ( x = 0 ) = 1 S o r = 0.85 , C p ( t = 0 ) = 0 ,   C p ( x = 0 ) = 0.6
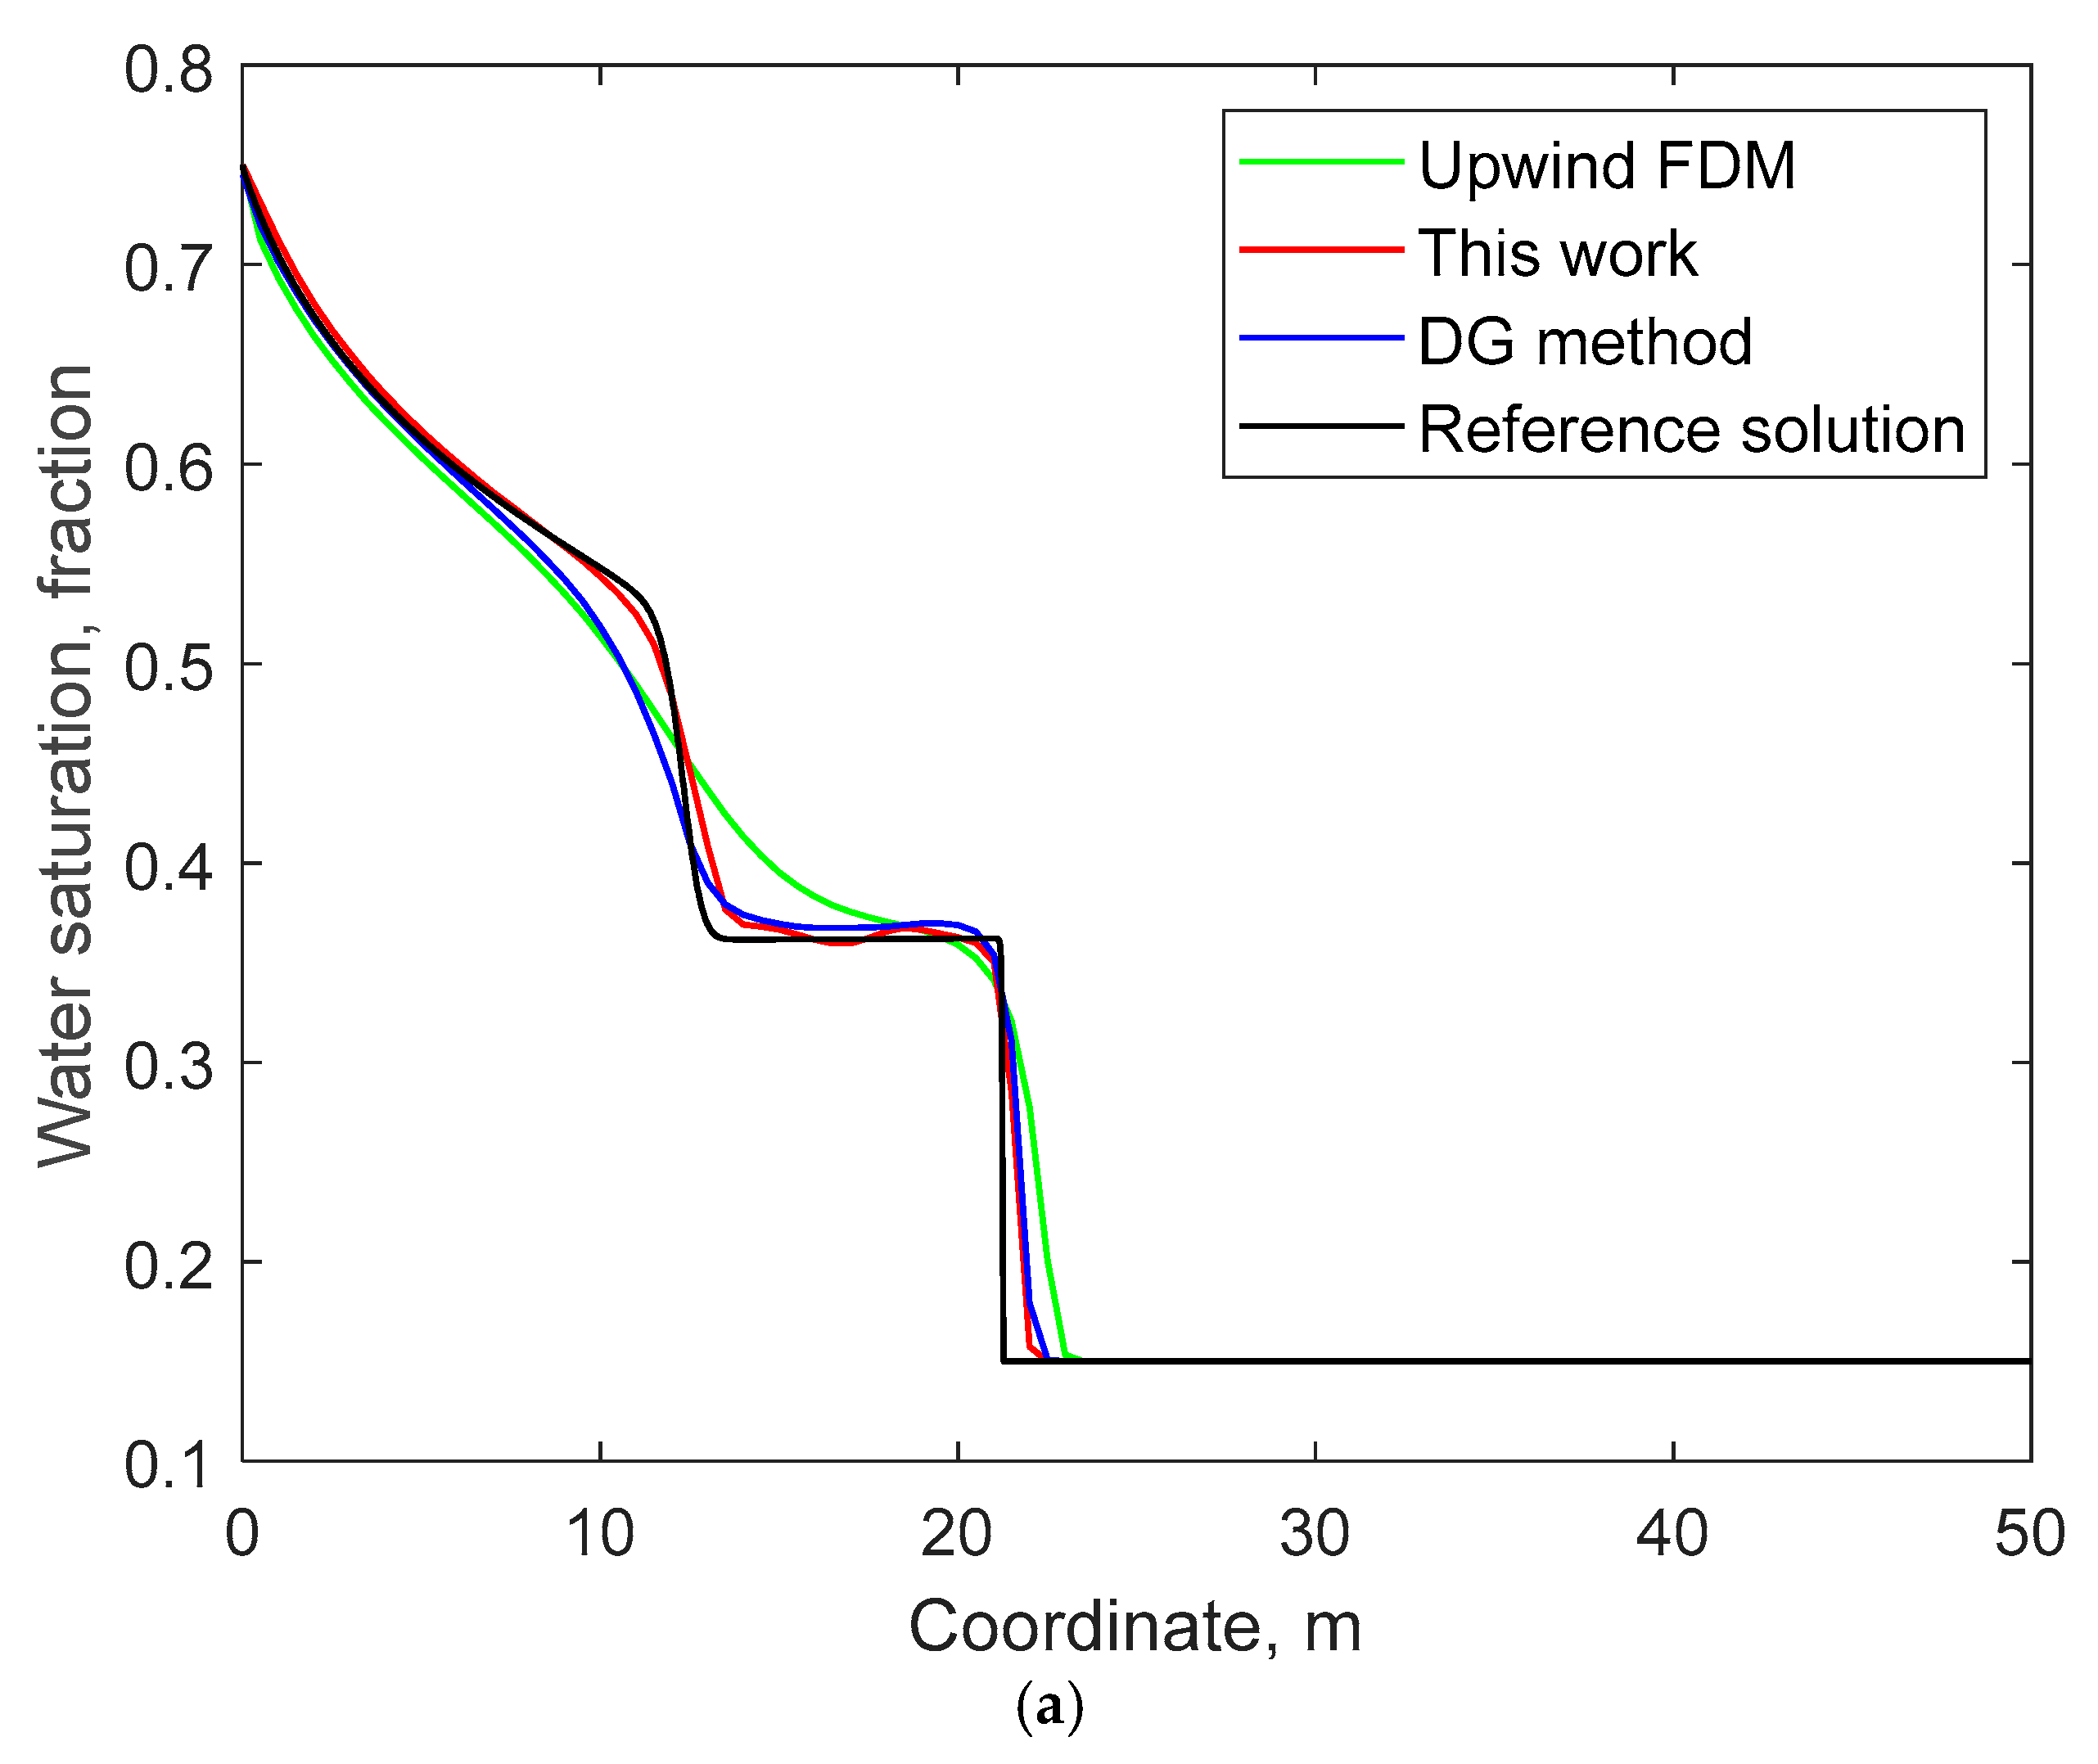
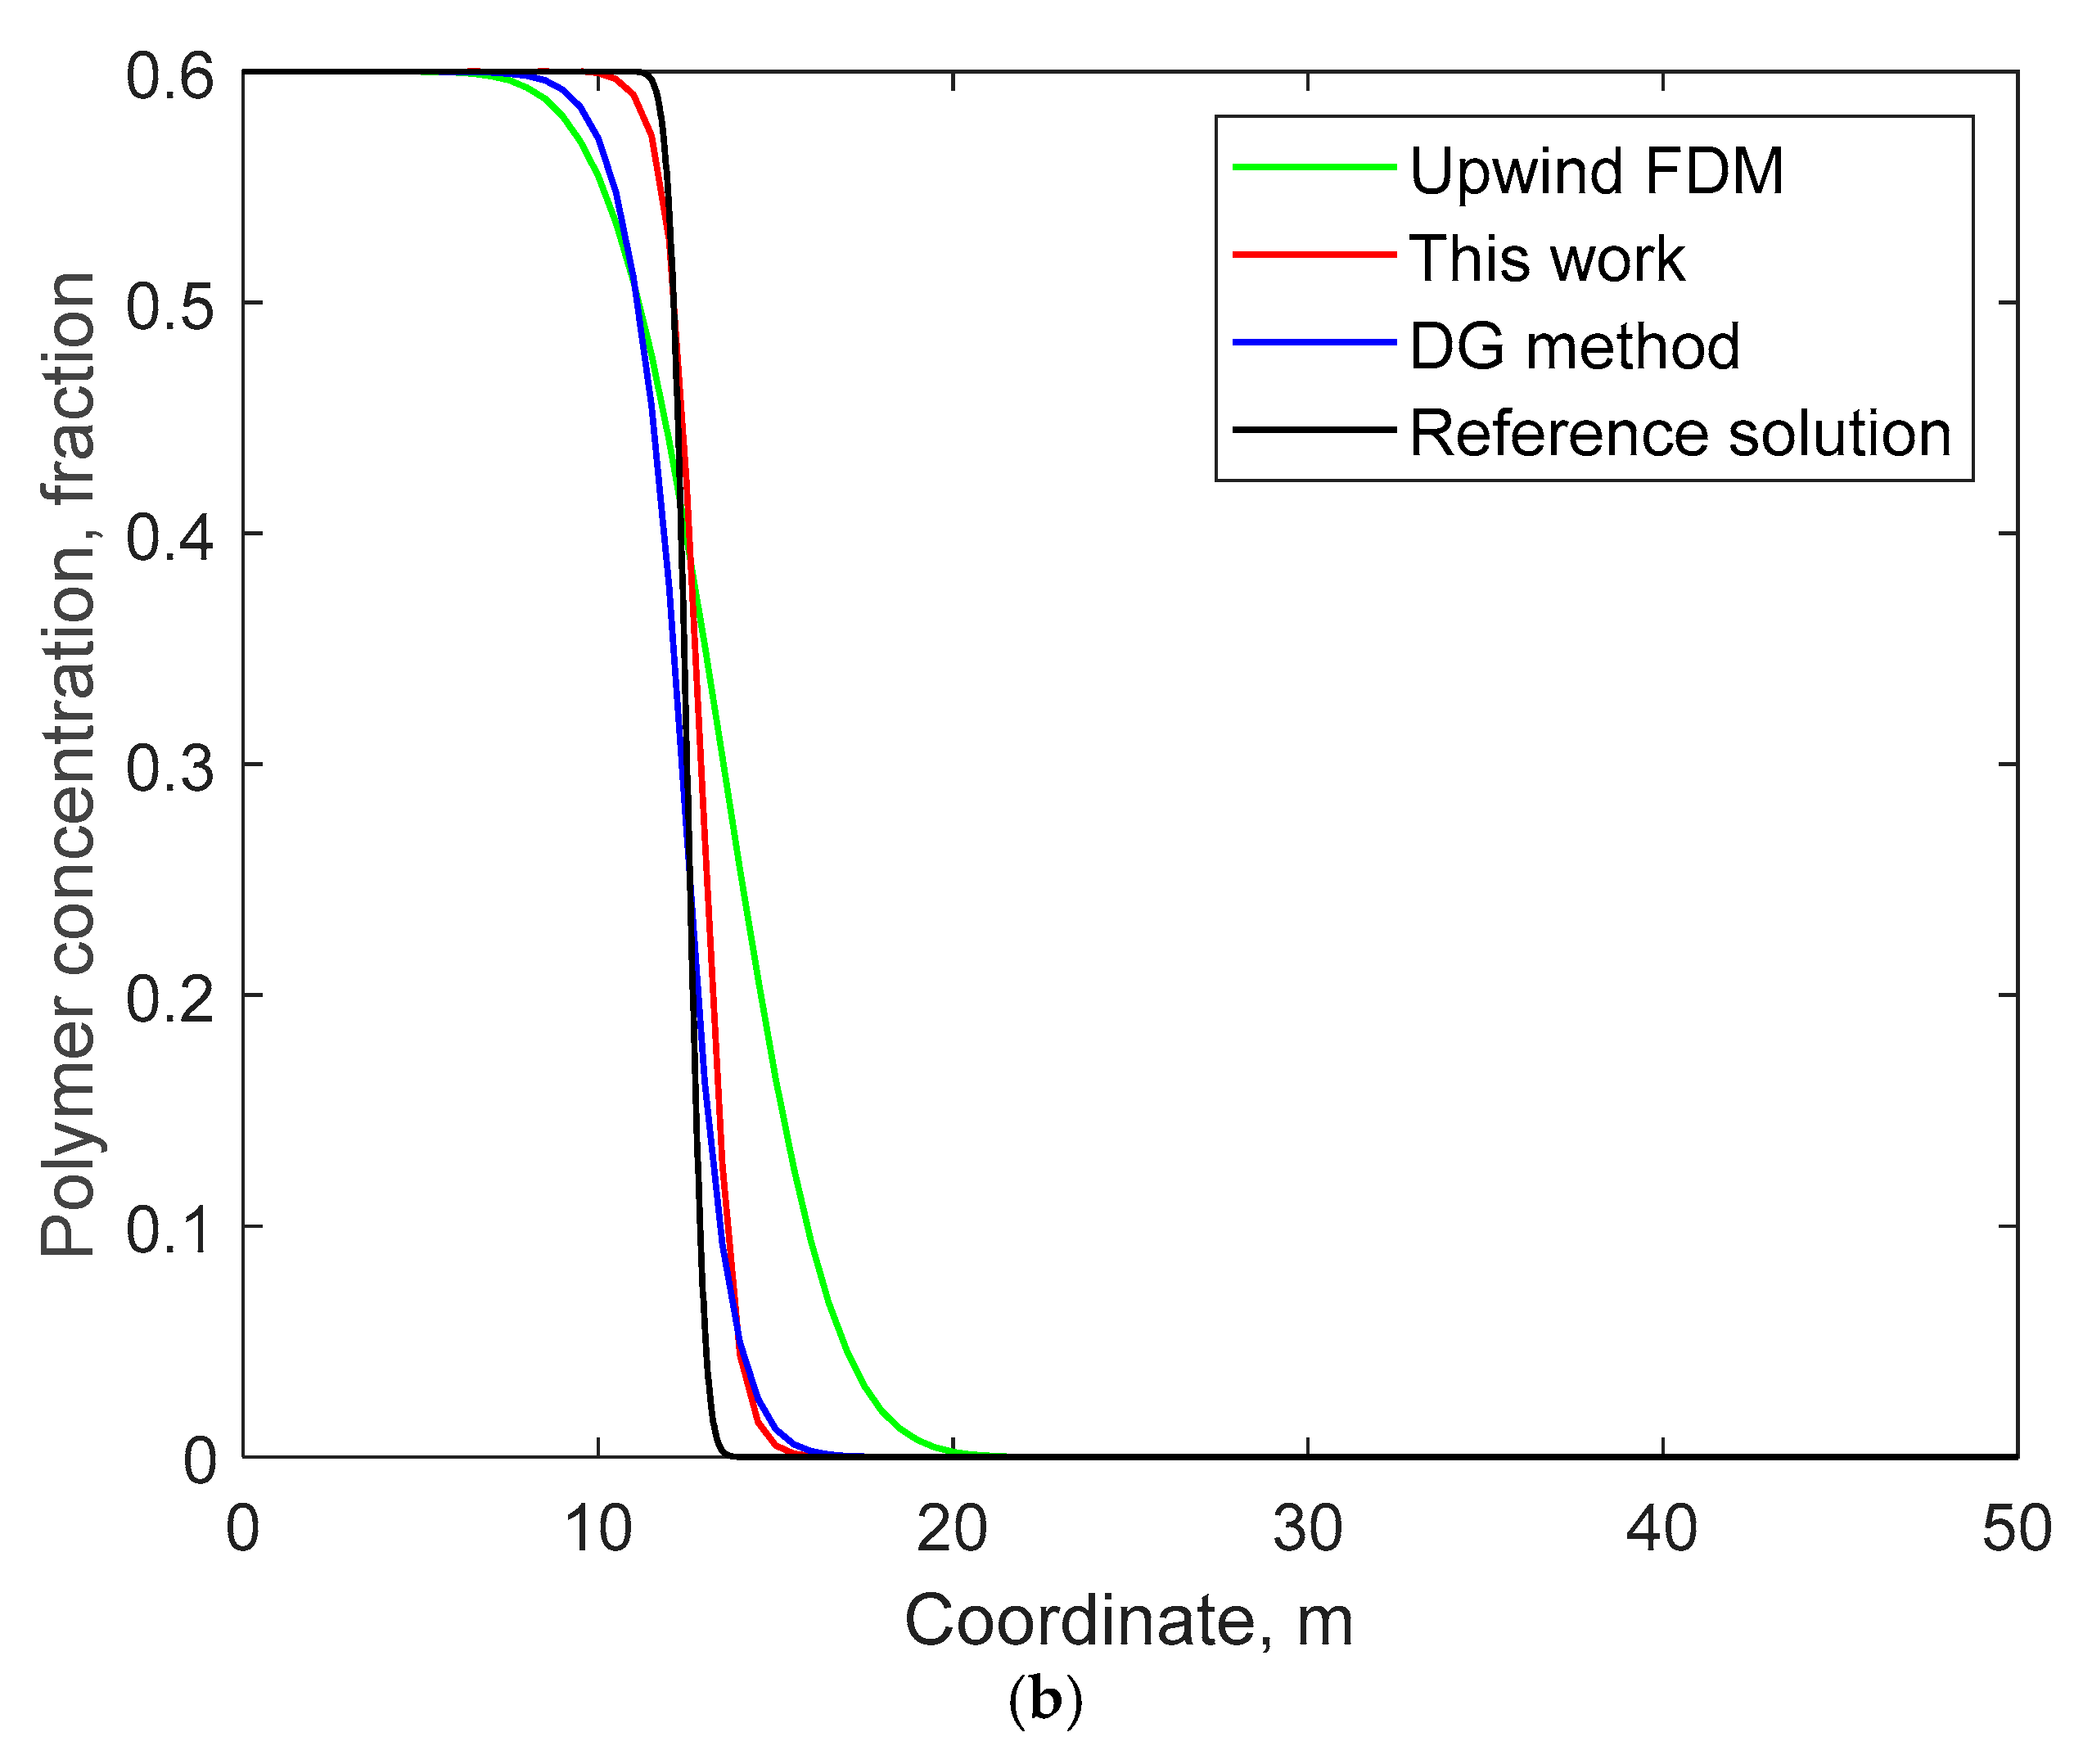
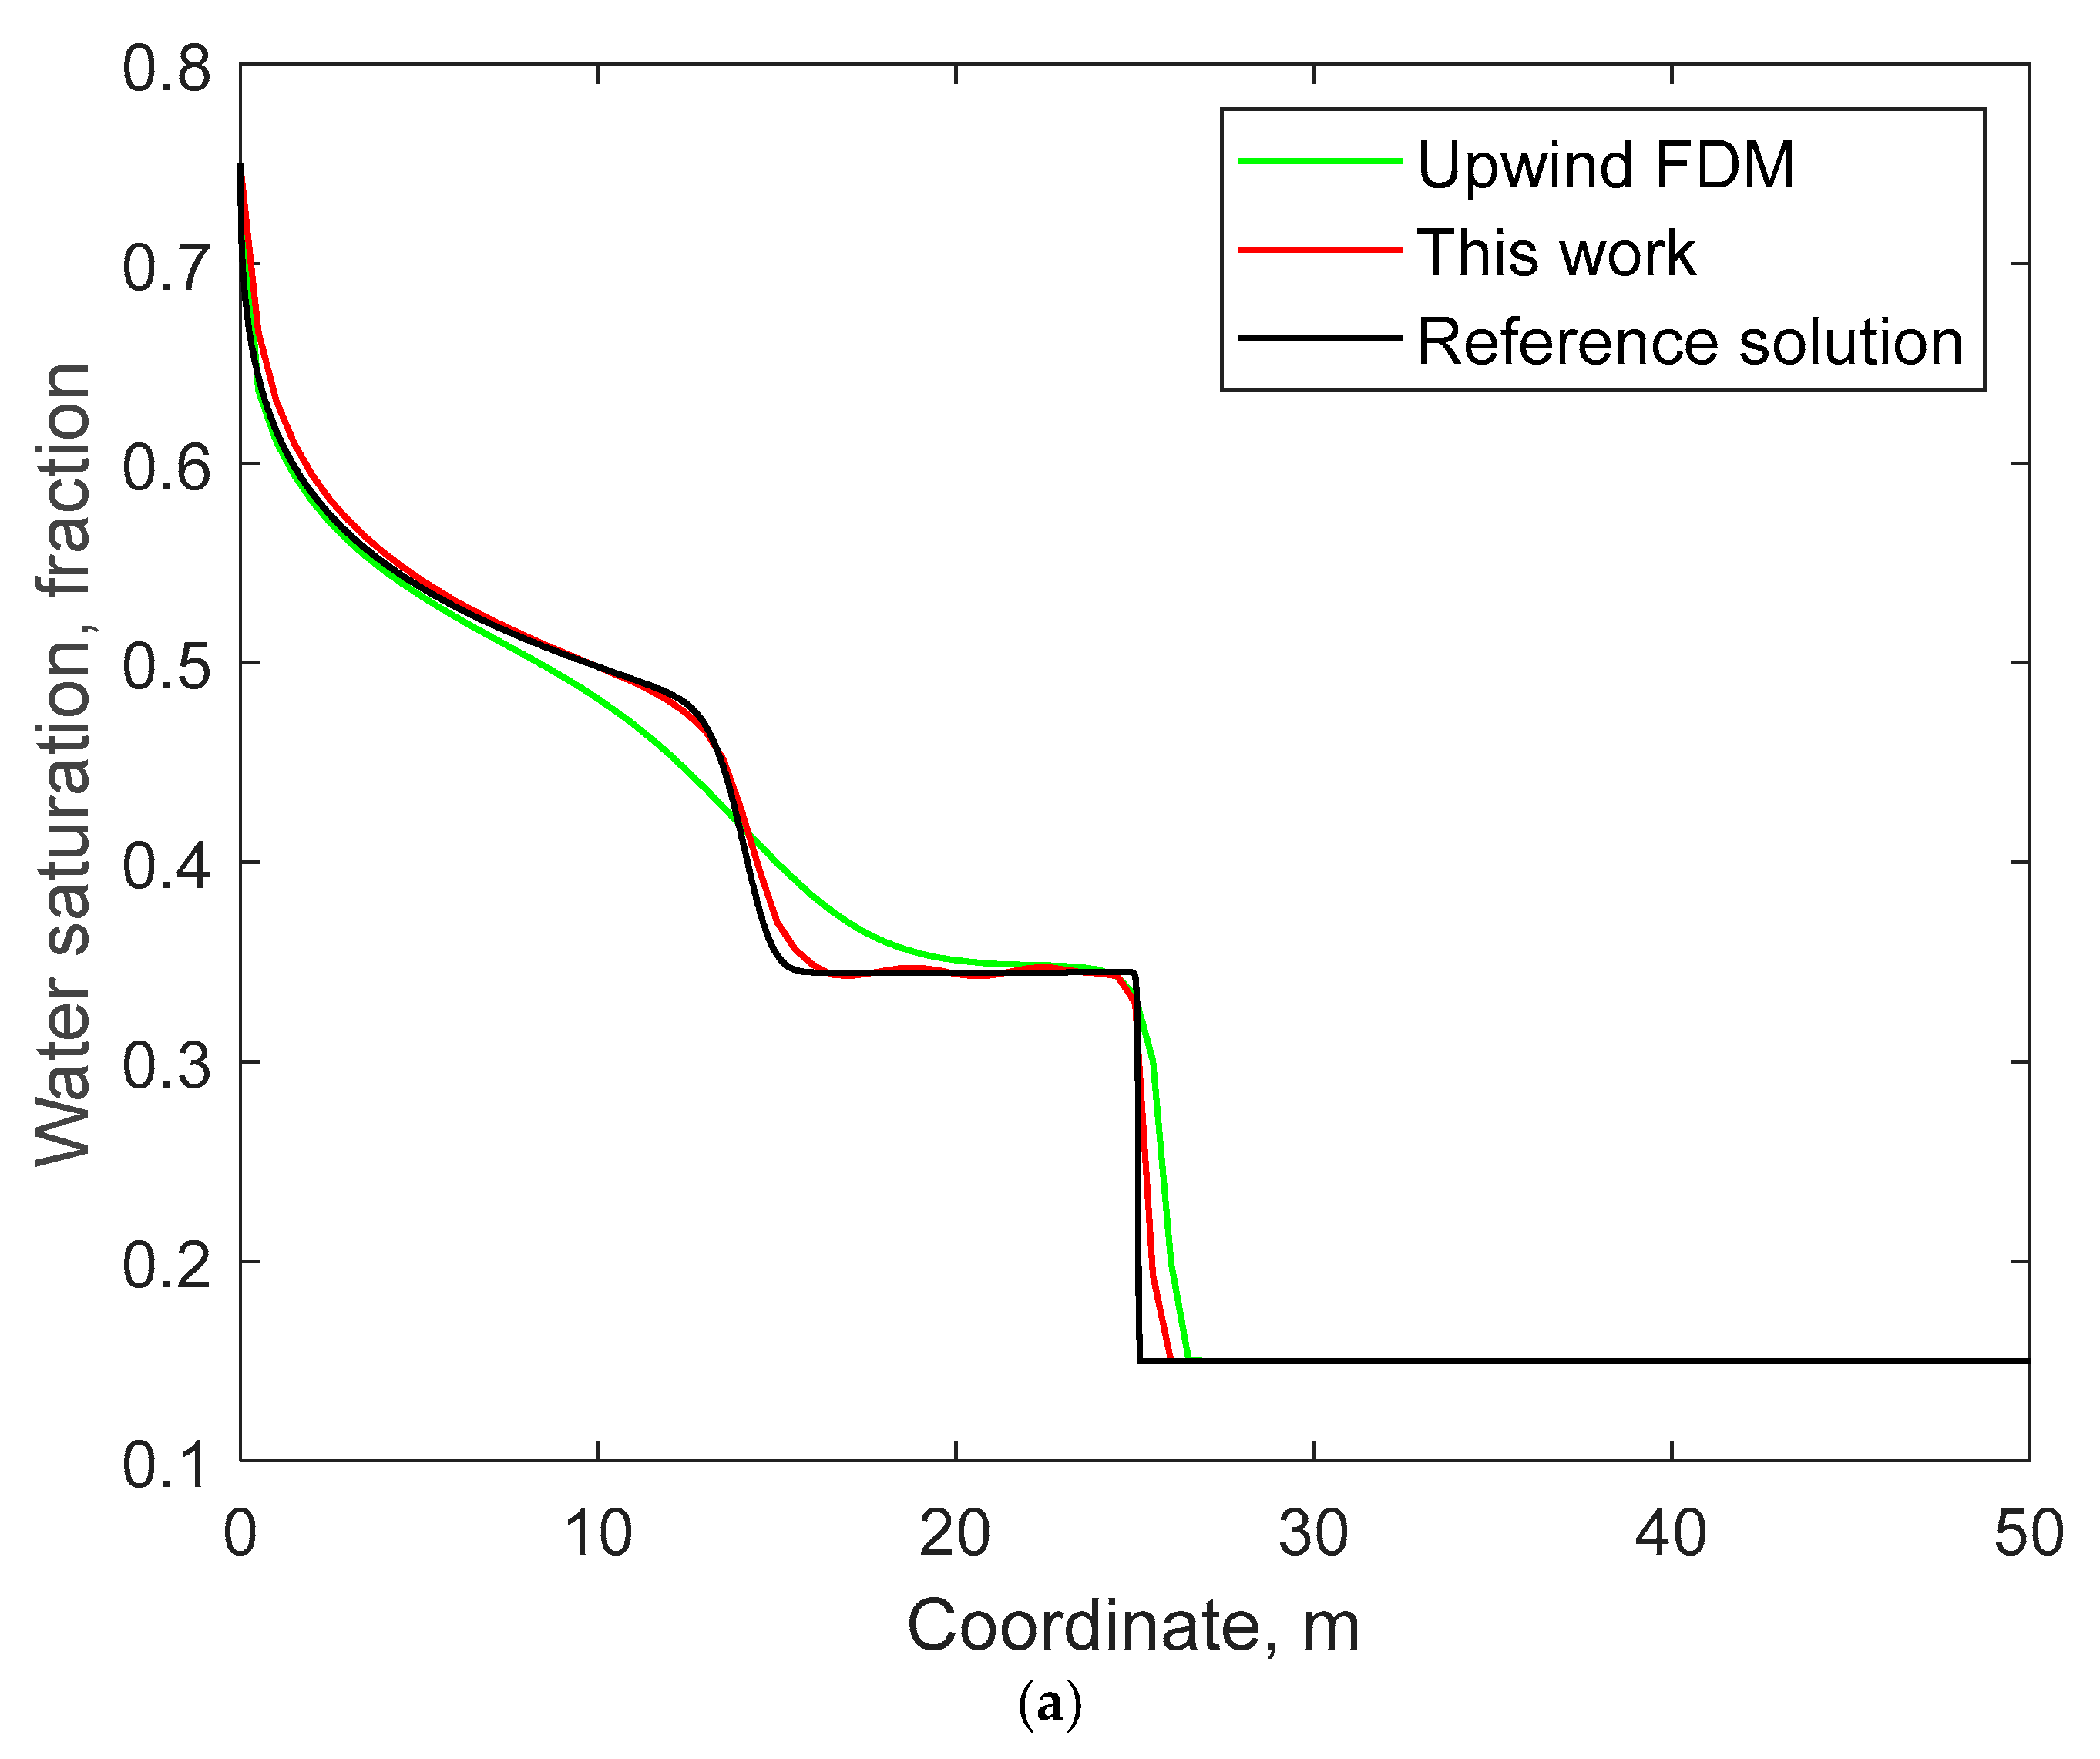
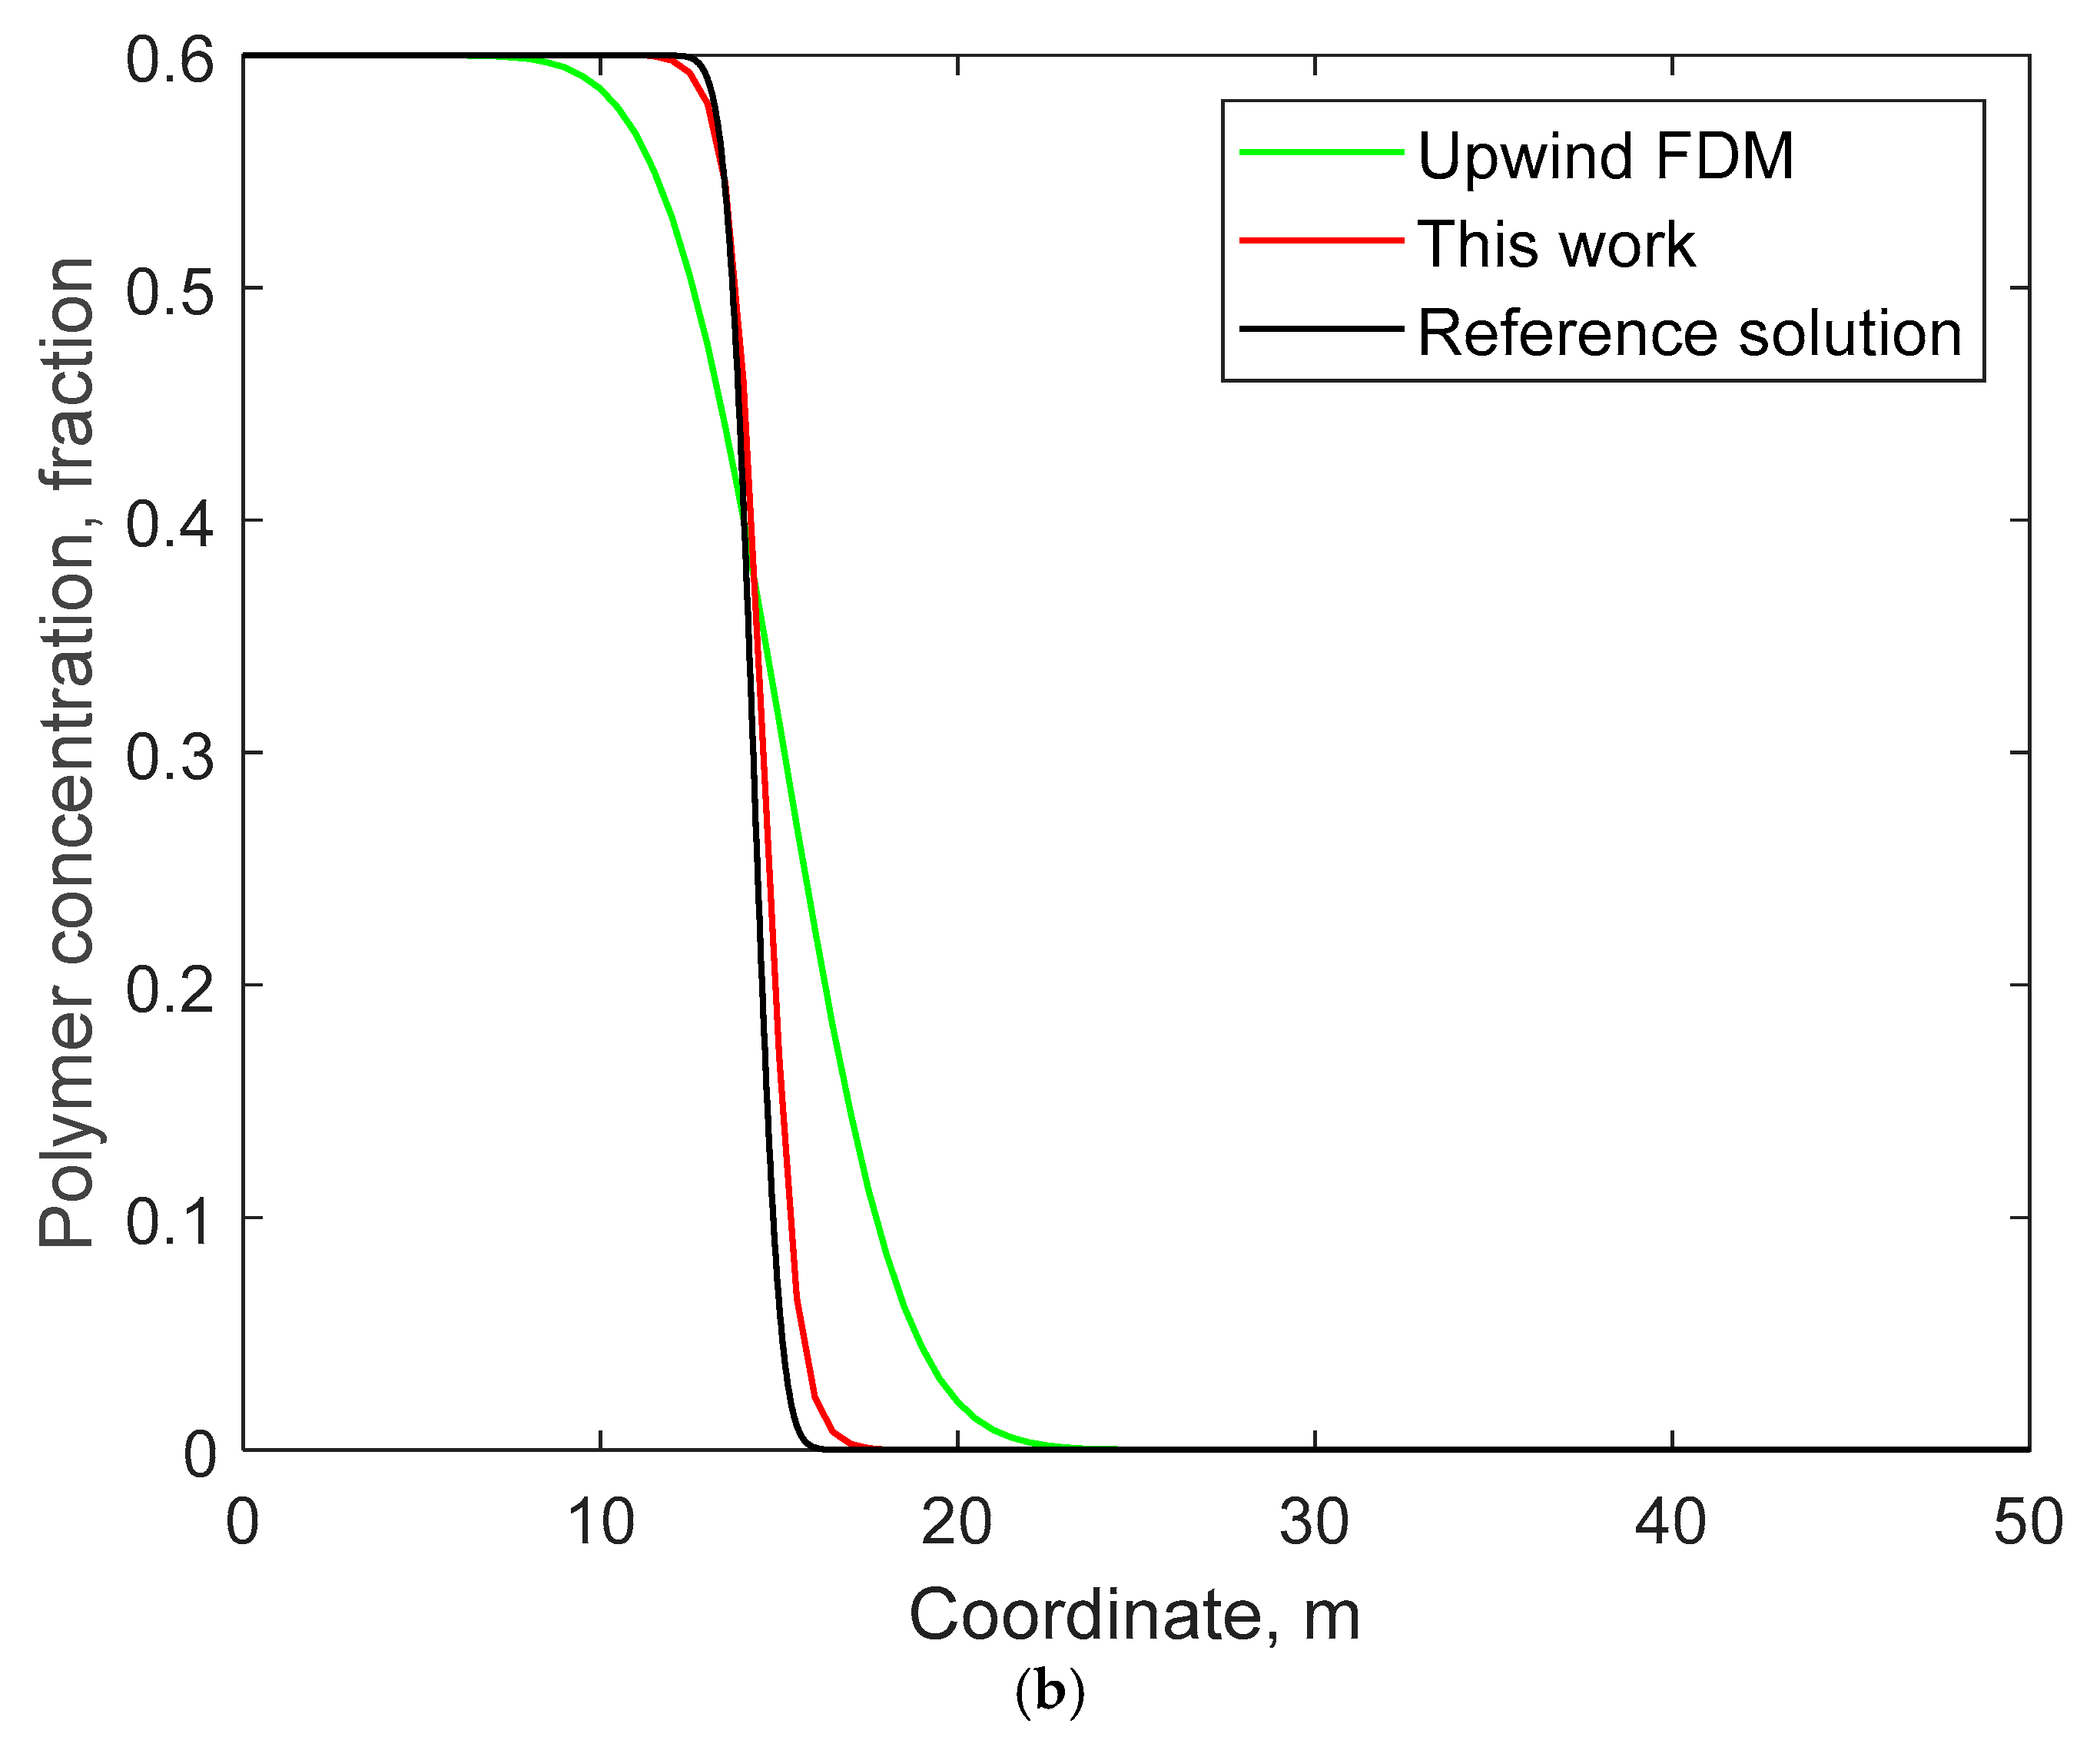
The dynamic changes over 80 days were simulated using the WENO method proposed in this paper, the upwind finite difference method (FDM) commonly used in commercial simulators and the Discontinuous Galerkin (DG) method, respectively. The solution of the upwind FDM based on high-density grids (comprising a total of 4000 grids, where the grid size is merely 0.0125 m) and small time steps (0.0002 days) was taken as the reference solution. Figure 3 compares the water saturation distribution and polymer concentration distribution on the 10th day calculated by different methods. It can be clearly observed that, under the condition of the same grid number, the results calculated by the method proposed in this paper are remarkably closer to the reference solution compared with those of the DG method. Moreover, the results of the DG method are superior to those of the upwind FDM.
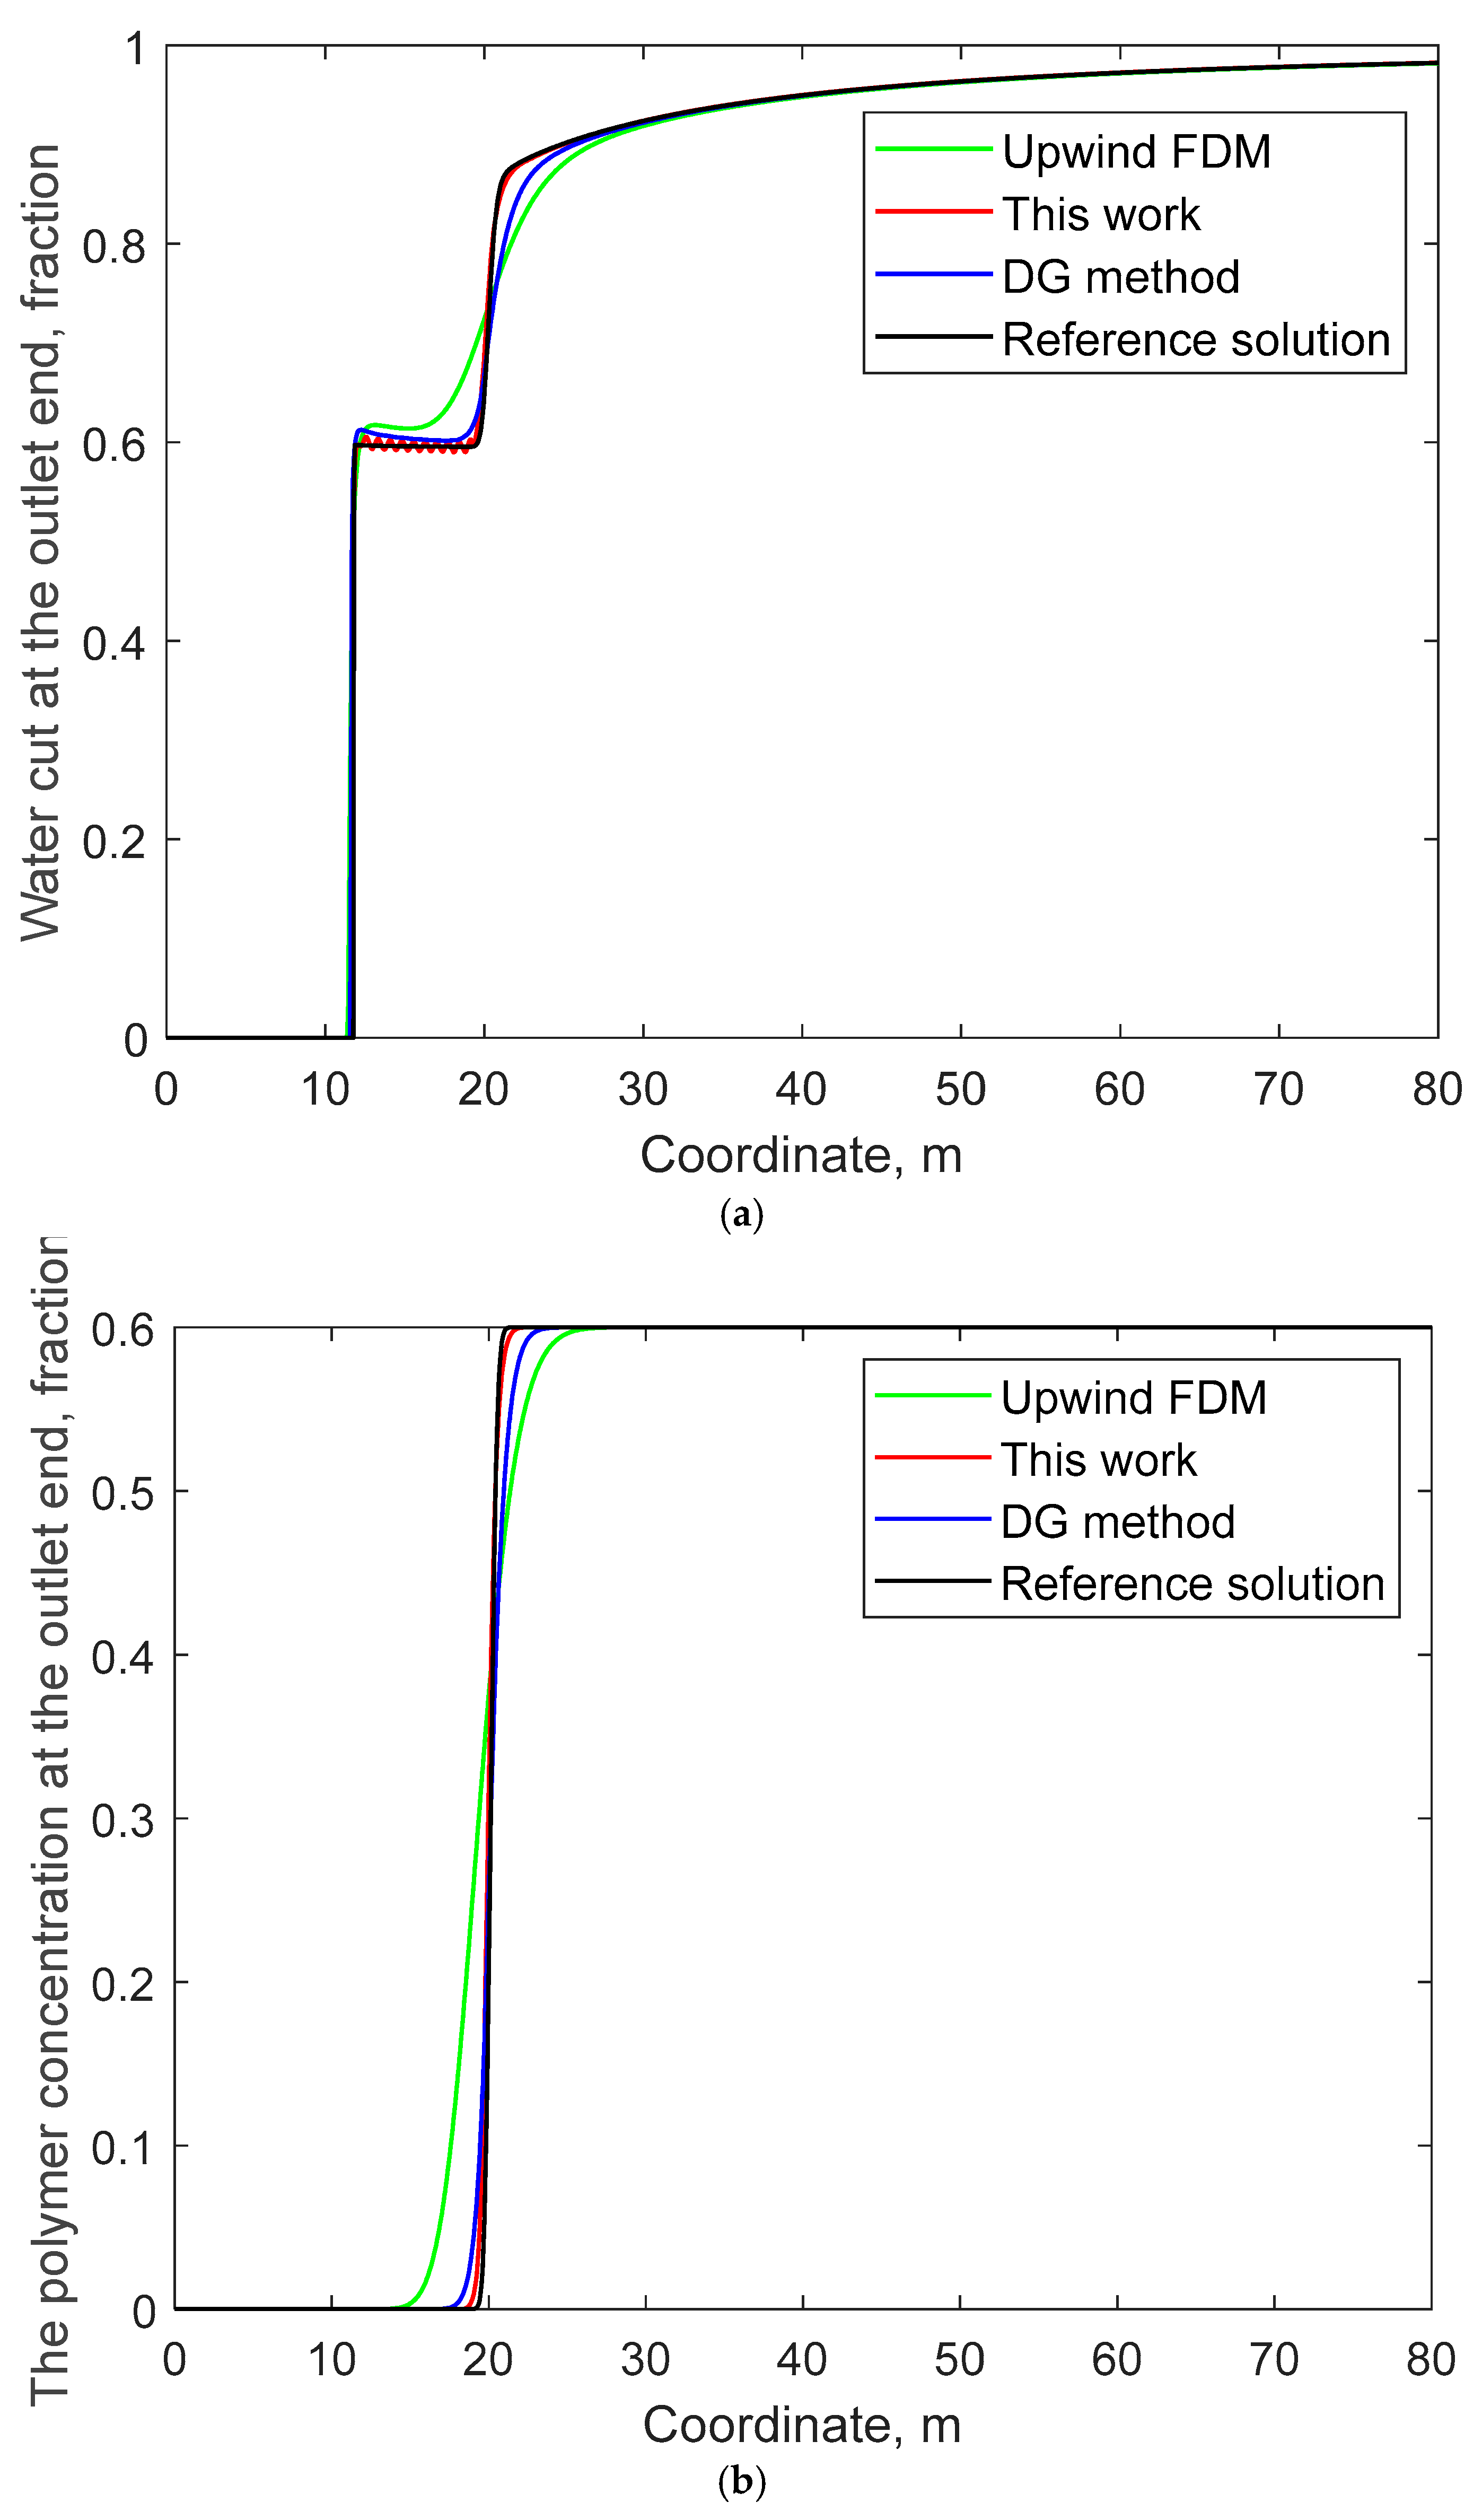
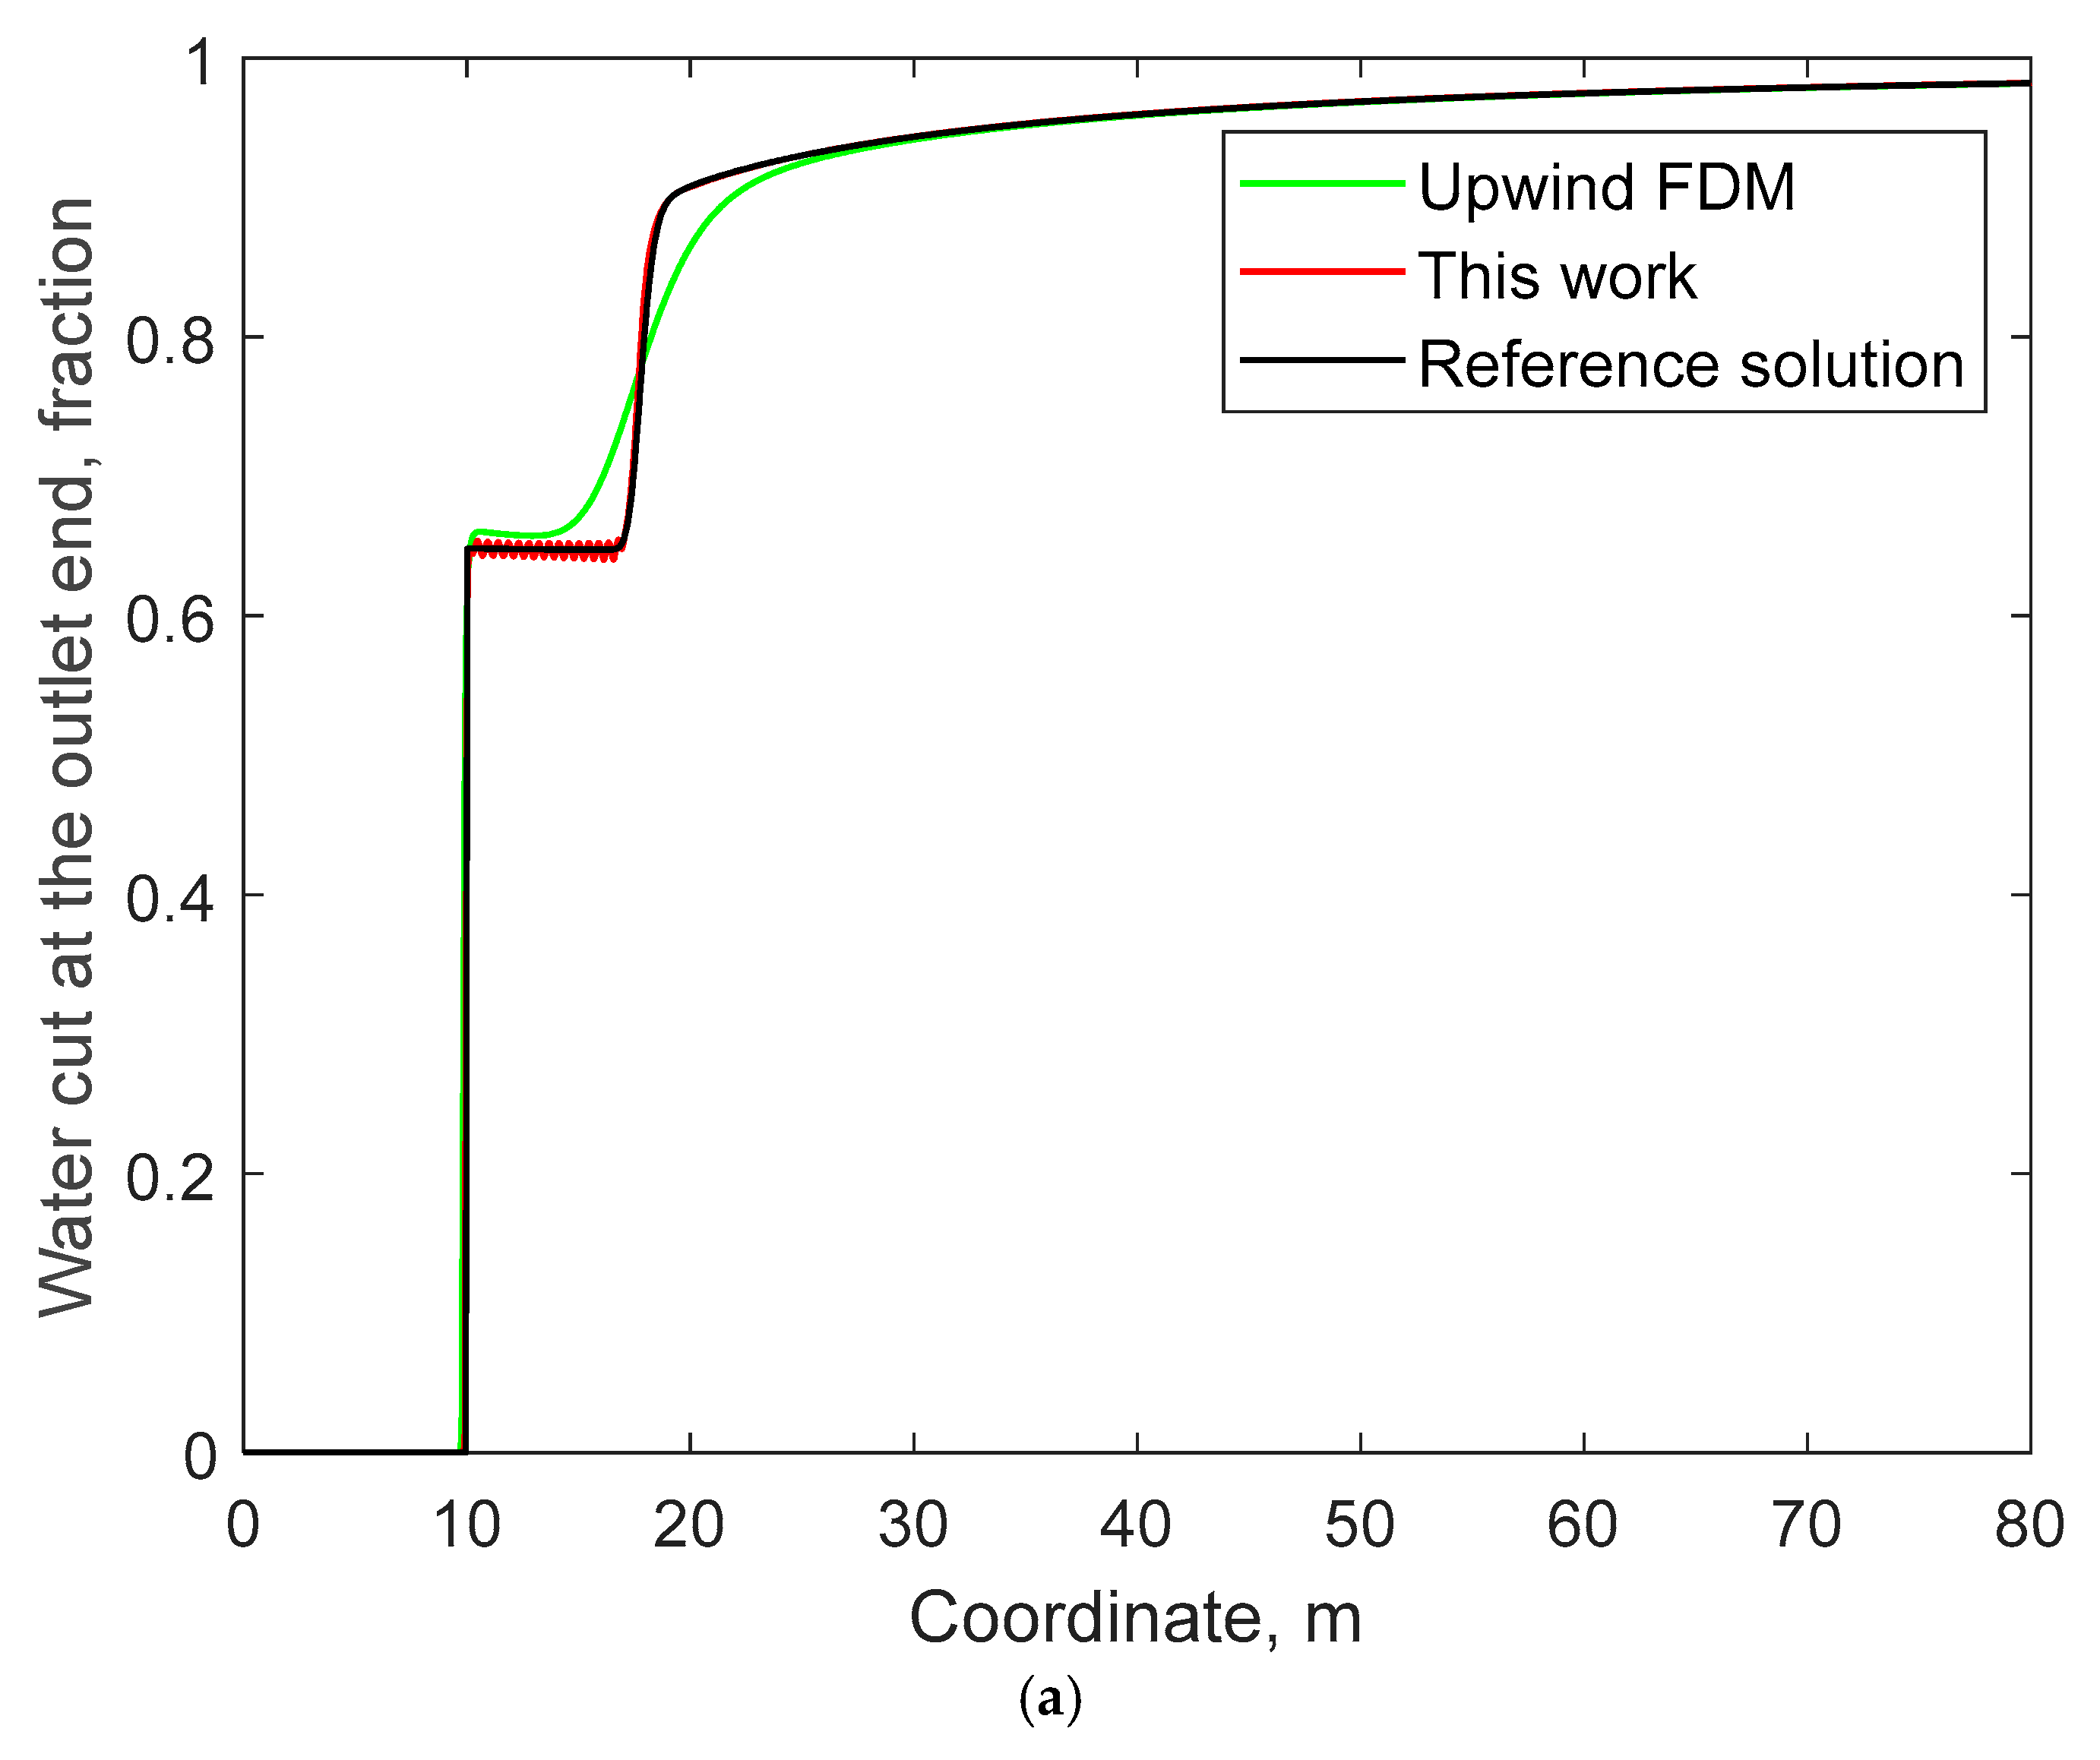
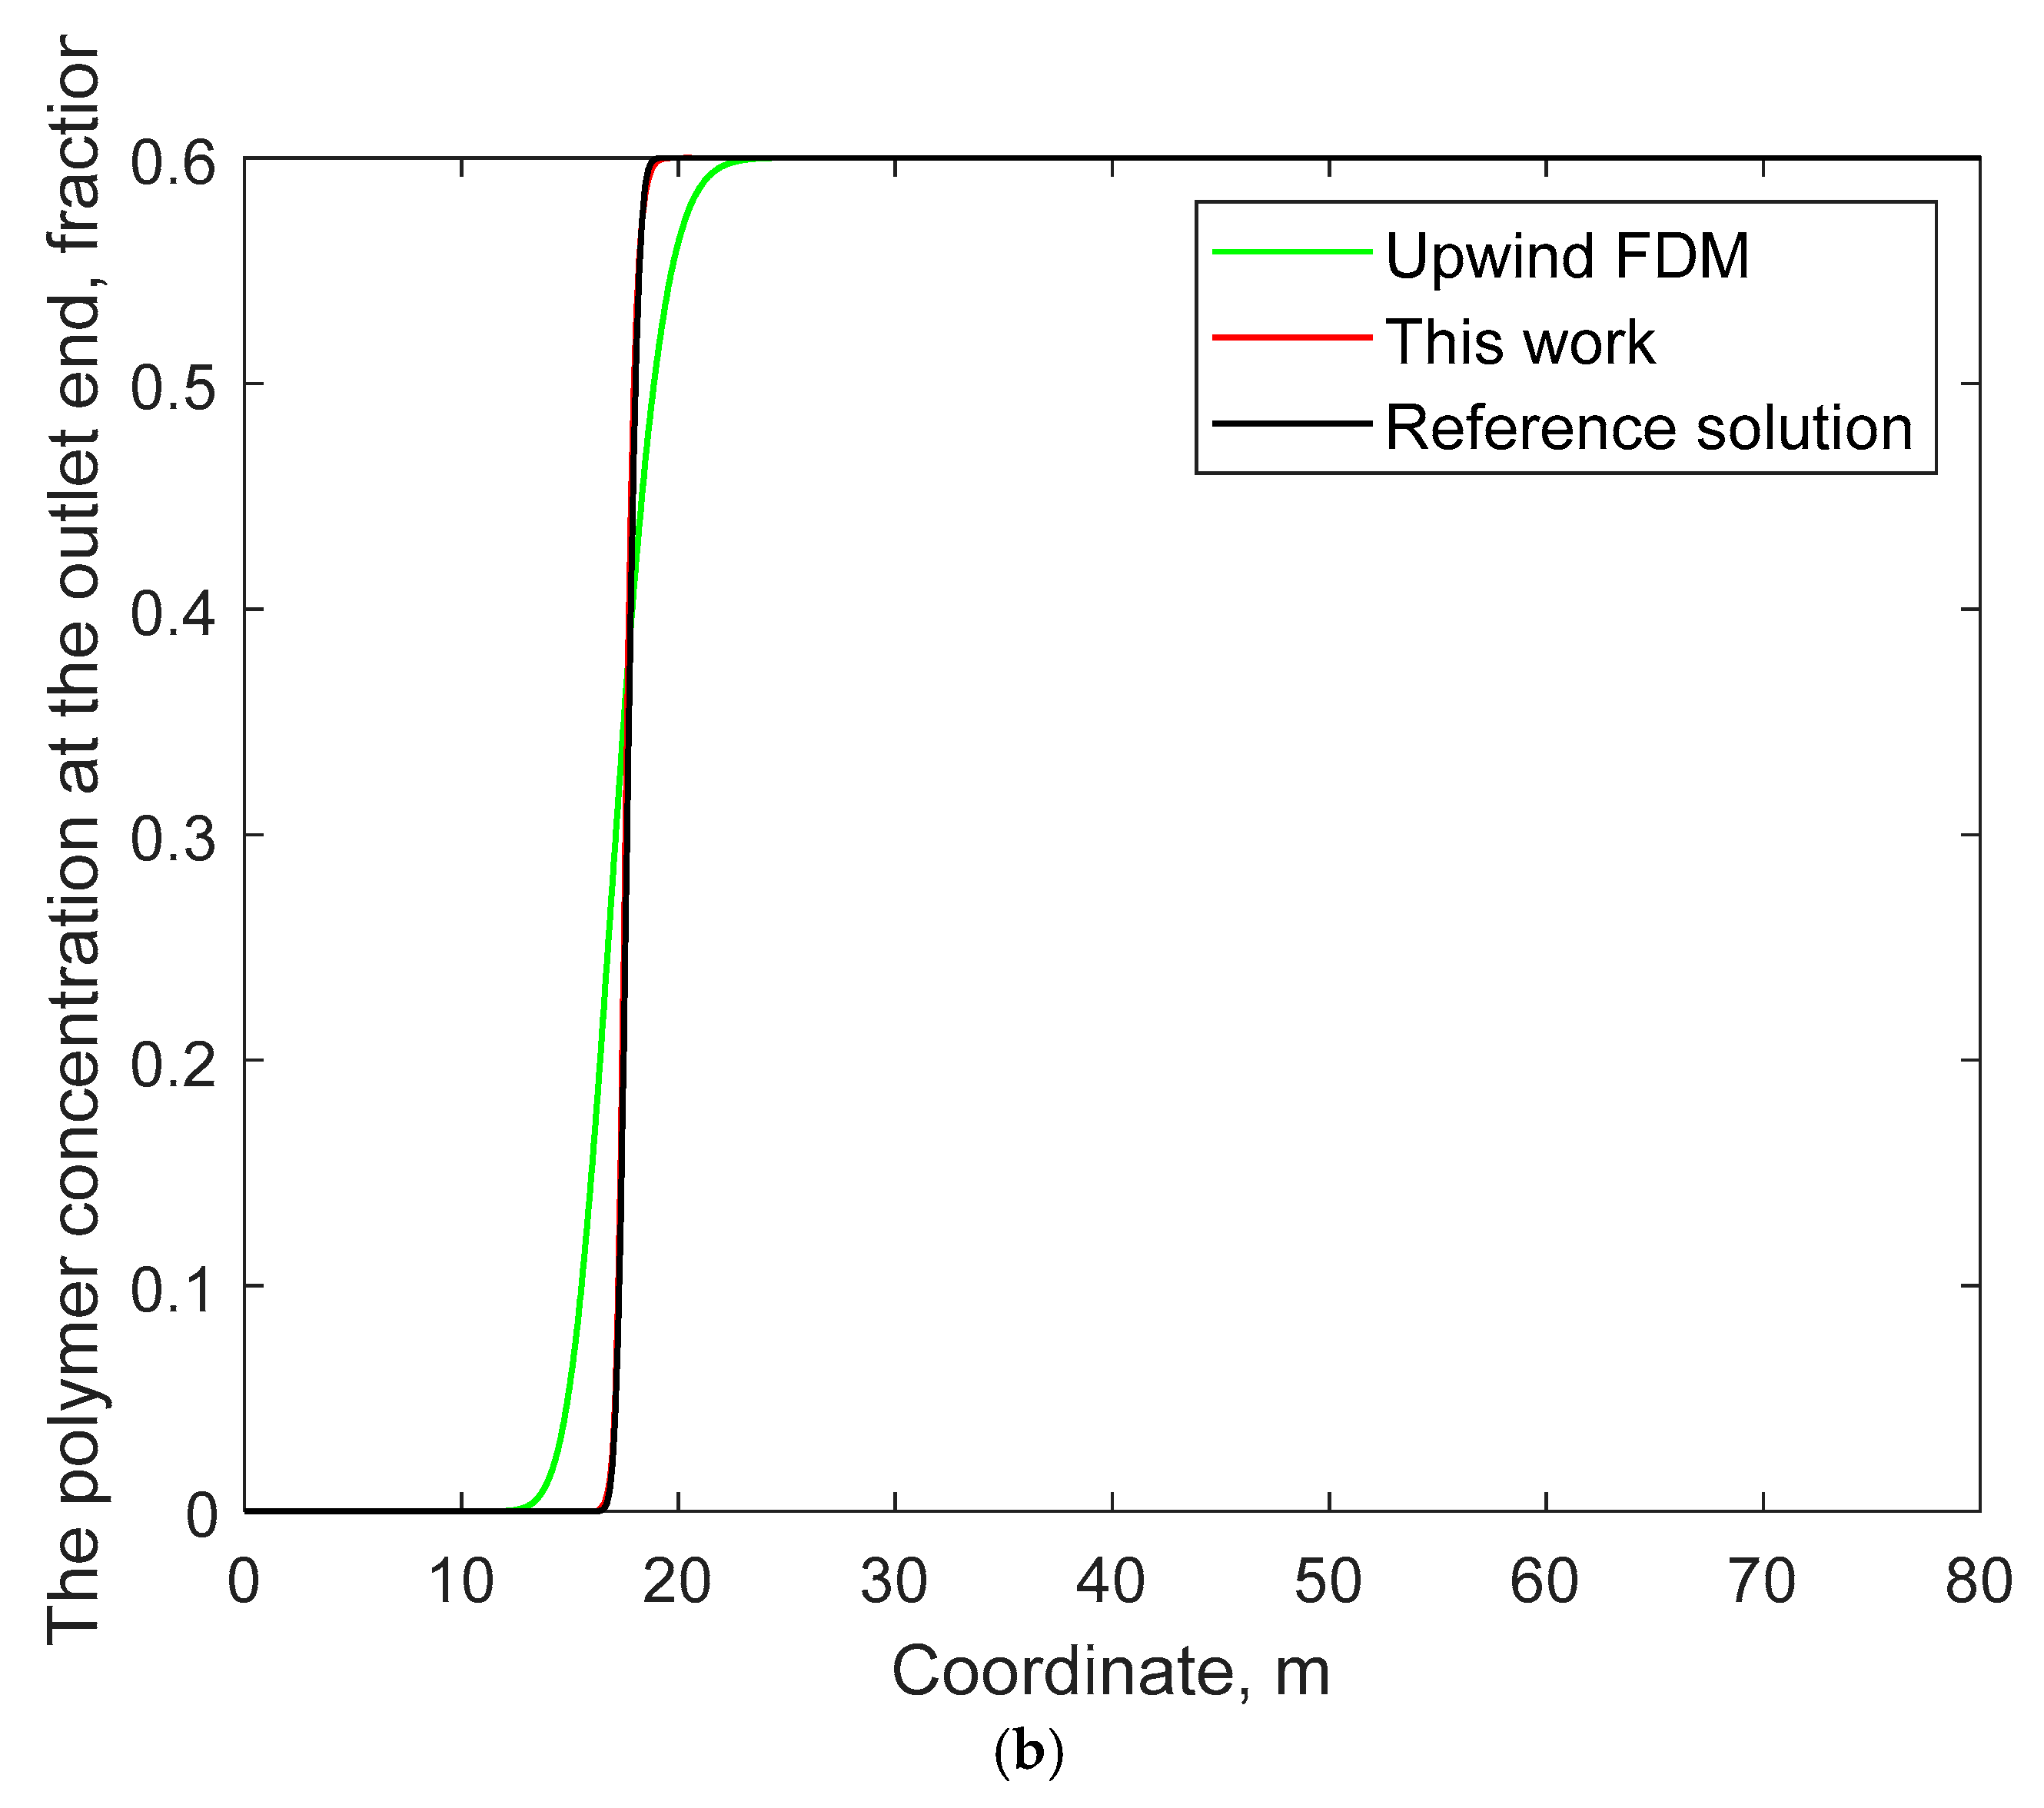
Figure 4 compares the curves of water cut and polymer concentration over time at the outlet end (i.e., at x = 50 m) of the one-dimensional channel within 80 days, which are the water cut and polymer production concentration of production wells that are widely concerned in polymer-flooded reservoirs. It can also be seen from the figure that the calculation accuracy of the method in this paper is much higher than that of the currently commonly used upwind FDM and that of the DG method. Table 2 presents a comparison of the predicted times of water breakthrough and polymer breakthrough at the outlet end by the upwind FDM, the method proposed in this work, and the DG method, along with the reference solutions. Here, we define that when the water-cut rate and polymer concentration at the outlet end exceed 10−4, it indicates the occurrence of water breakthrough and polymer breakthrough at the outlet end. As can be seen from Table 2, although the differences in the predicted water-breakthrough times among the three methods and the reference solution are not overly large, the results obtained by the method in this work are still the most optimal. For the predicted time of polymer breakthrough at the outlet end, the relative error of the prediction by the method in this work is merely 3.3%. The relative error of the prediction by the DG method is 11.59%, which is more than three times that of this work. The relative error of the prediction by the upwind FDM is 29.41%, nearly 10 times that of this work. This clearly shows that the prediction accuracy of the polymer-breakthrough time by the method in this work is significantly higher than that of the upwind FDM and the DG method. Moreover, the polymer-breakthrough time predicted by the upwind FDM, which is commonly used in current simulators, can almost mislead the judgment of on-site engineers. The results of these comparative analyses demonstrate the significance of developing the polymer-flooded reservoir simulation method based on the WENO method in this work.

3.2. Example 2

In this example, we modified the power of the relative permeability ratio from 2 to 3, which is the oil–water relative permeability ratio shown in Equation (29). Additionally, we set the initial viscosity of the aqueous phase in Equation (1) to 0.6 cp and r = s = t = 2 . The viscosity of the oil phase was set to 10 cp to test the adaptability of the method in this work to different relative permeabilities and viscosities. The computational domain, other physical property parameters, and the initial and boundary conditions are the same as those in Example 1.
Figure 5 compares the water saturation and polymer concentration distributions on the fifth day calculated by the method in this work and the upwind FDM, along with the reference solution. Figure 6 compares the curves of water cut and polymer concentration over time at the outlet end within 80 days. From these two figures, it can still be observed that the WENO method in this work can achieve significantly higher computational accuracy compared to the upwind FDM. Moreover, the solution of the upwind FDM exhibits obvious numerical dissipation at the discontinuous or very steep water-flood front and polymer-flooding front.
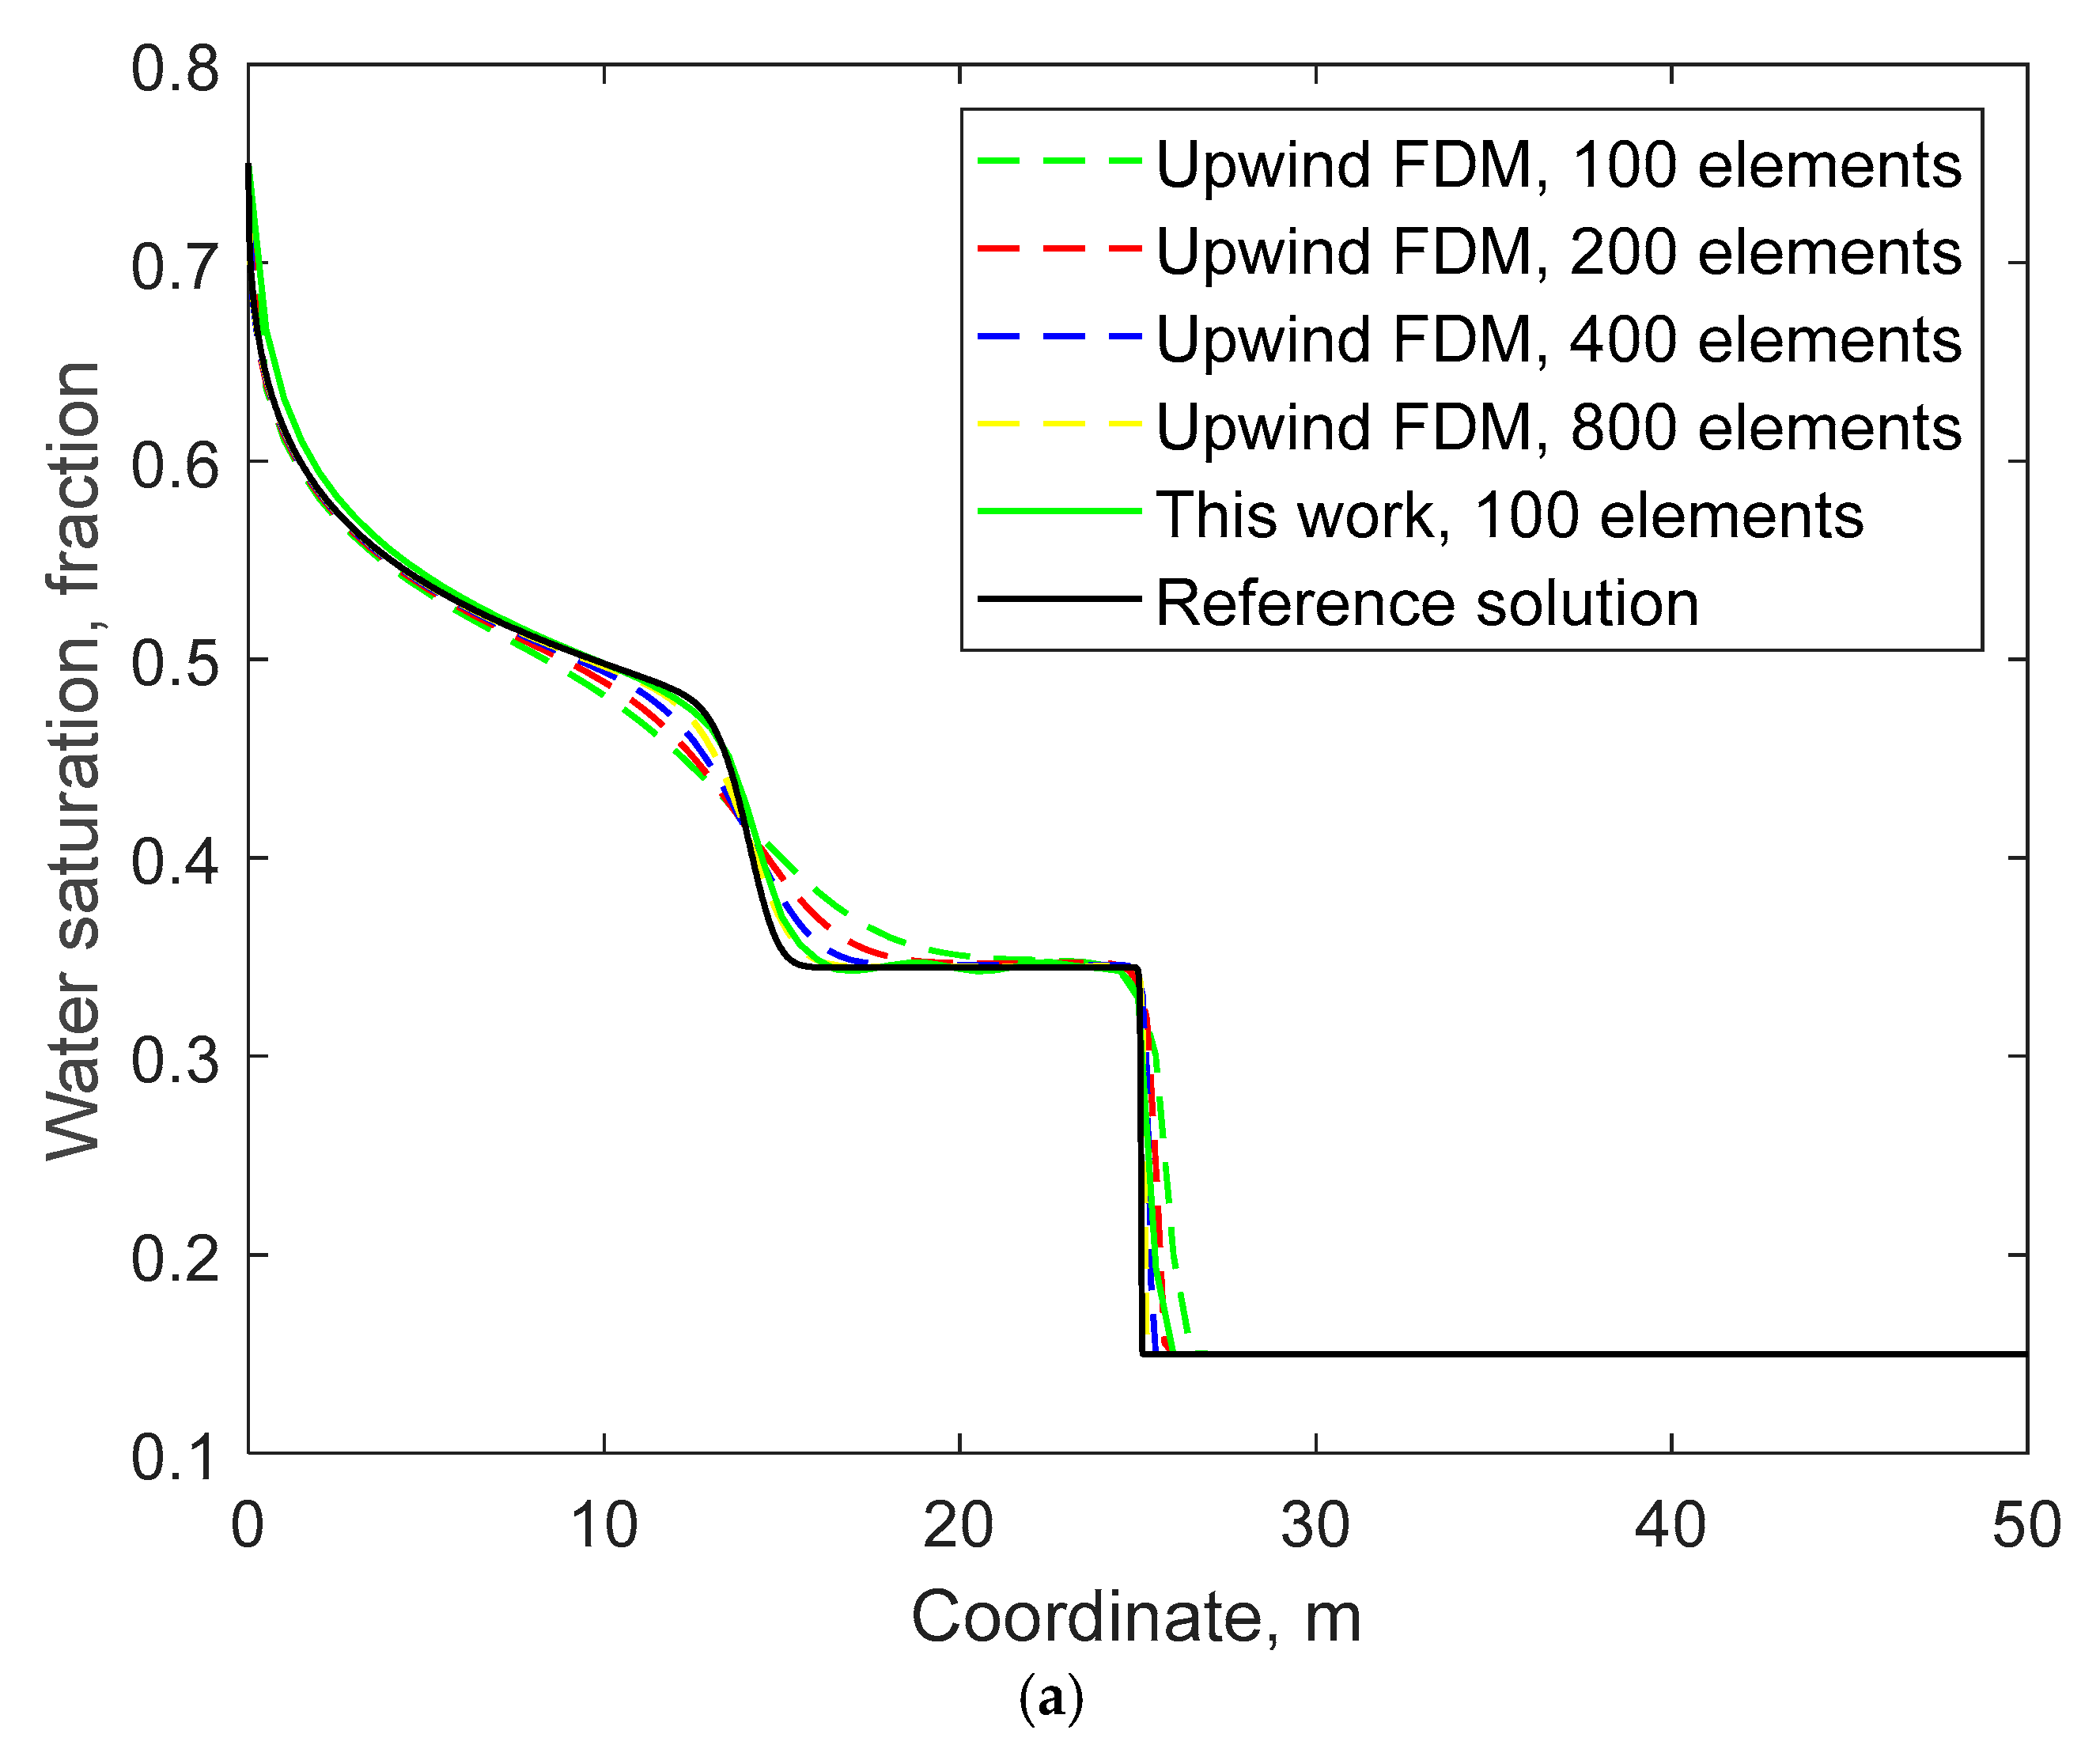
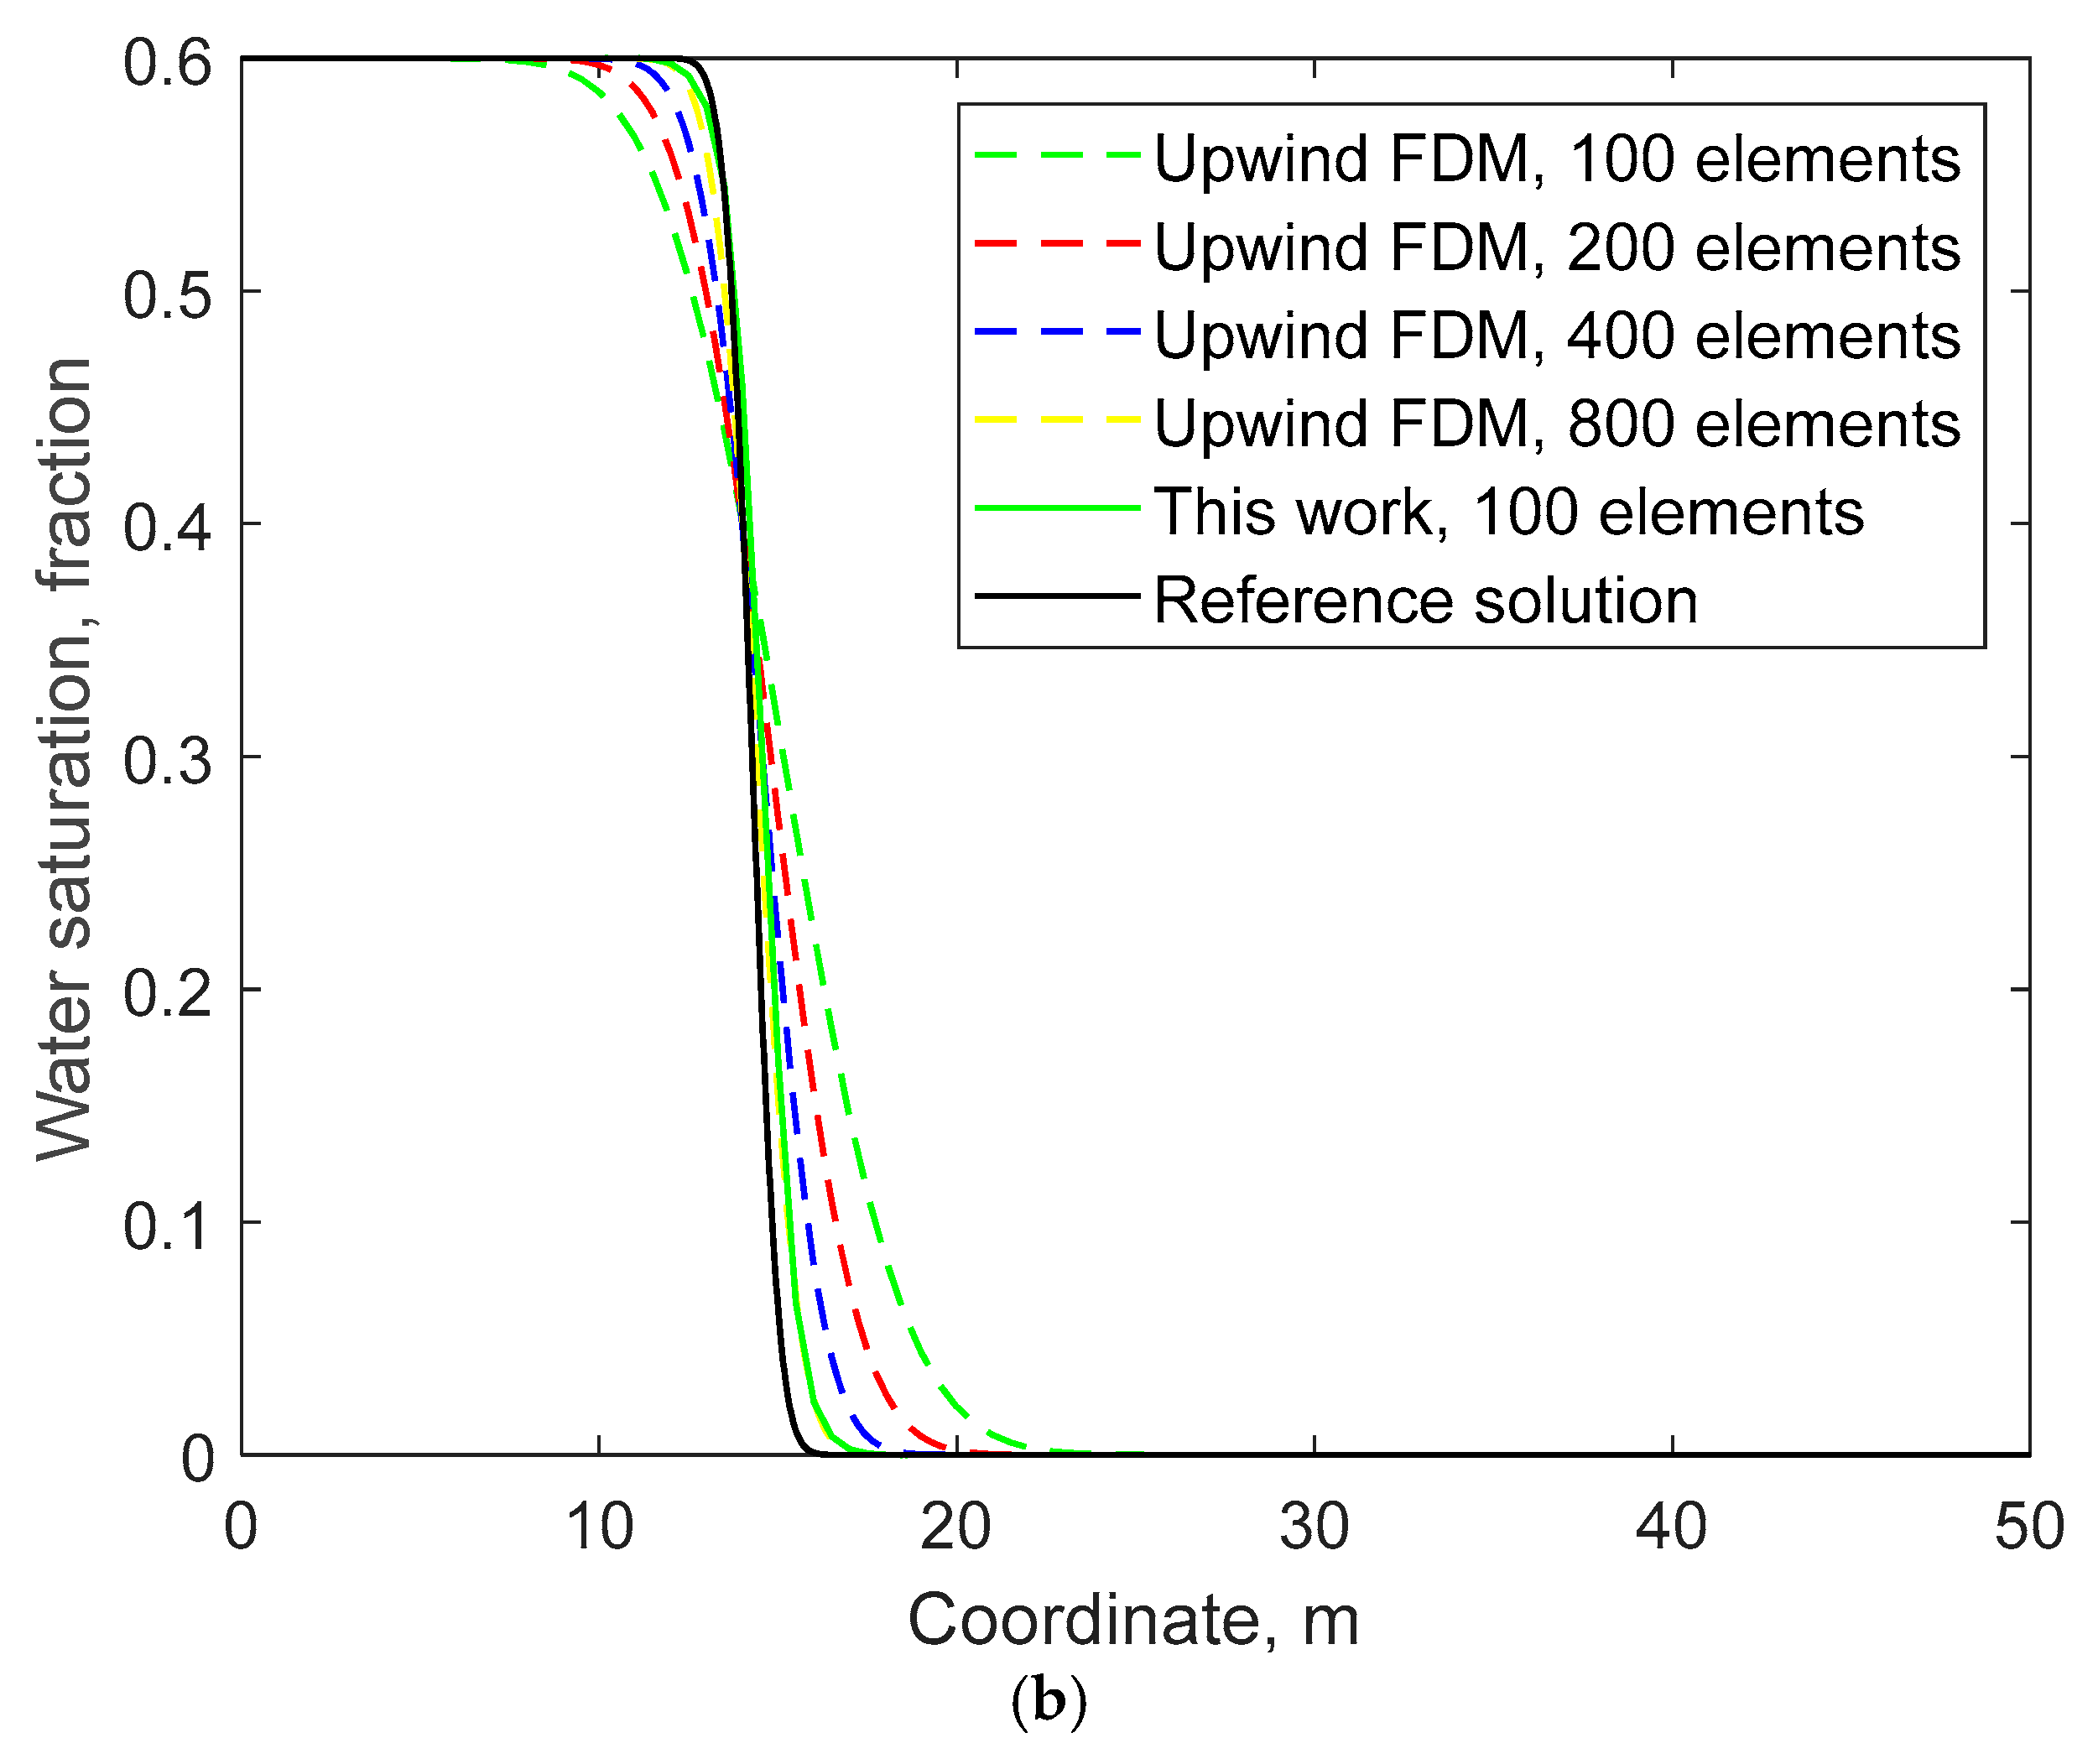
In addition, we further set the number of grids to 200, 400, and 800, respectively, and carried out calculations using the upwind FDM. Figure 7 compares the solutions of the upwind FDM with grid numbers 100, 200, 400, and 800, the WENO solution with 100 grids, and the reference solution. Table 3 compares the L2 errors of water saturation and polymer concentration of the corresponding solutions, and Table 4 compares the CPU time consumed by the corresponding methods for simulating 80-day flooding.
It can be seen that the upwind FDM can only achieve L2 errors similar to those of the WENO solution with 100 grids (i.e., similar accuracy) when the number of grids used reaches 800. However, at this time, the CPU time spent by the upwind FDM is already six times that of the WENO method, and this multiple will further increase as the simulated flooding time increases. In terms of accuracy, the accuracy of the upwind FDM solutions with 200 and 400 grids is far inferior to that of the WENO method in this work, and the consumed CPU time is even higher. Figure 8 compares the L2 errors of the water saturation and polymer concentration distributions of the WENO method proposed in this paper versus the grid size. It can be observed that in the double-logarithmic coordinate system, the convergence order of the WENO method is very close to 5, indicating excellent convergence. This also verifies the fifth-order accuracy with respect to the grid size that the method in this paper should theoretically possess as pointed out in Section 2.2.
These results fully demonstrate that at a similar accuracy level, the WENO method requires far fewer grids compared to the traditional method. Consequently, its computational efficiency is several times higher than that of the traditional method.

3.3. Example 3

The previous two examples have verified that the WENO method proposed in this work can achieve significantly higher computational accuracy than the traditional upwind FDM with a smaller number of grids. This is highly beneficial for conducting a reliable analysis of the influence of relevant physical parameters of polymer flooding on the polymer-flooding effect.
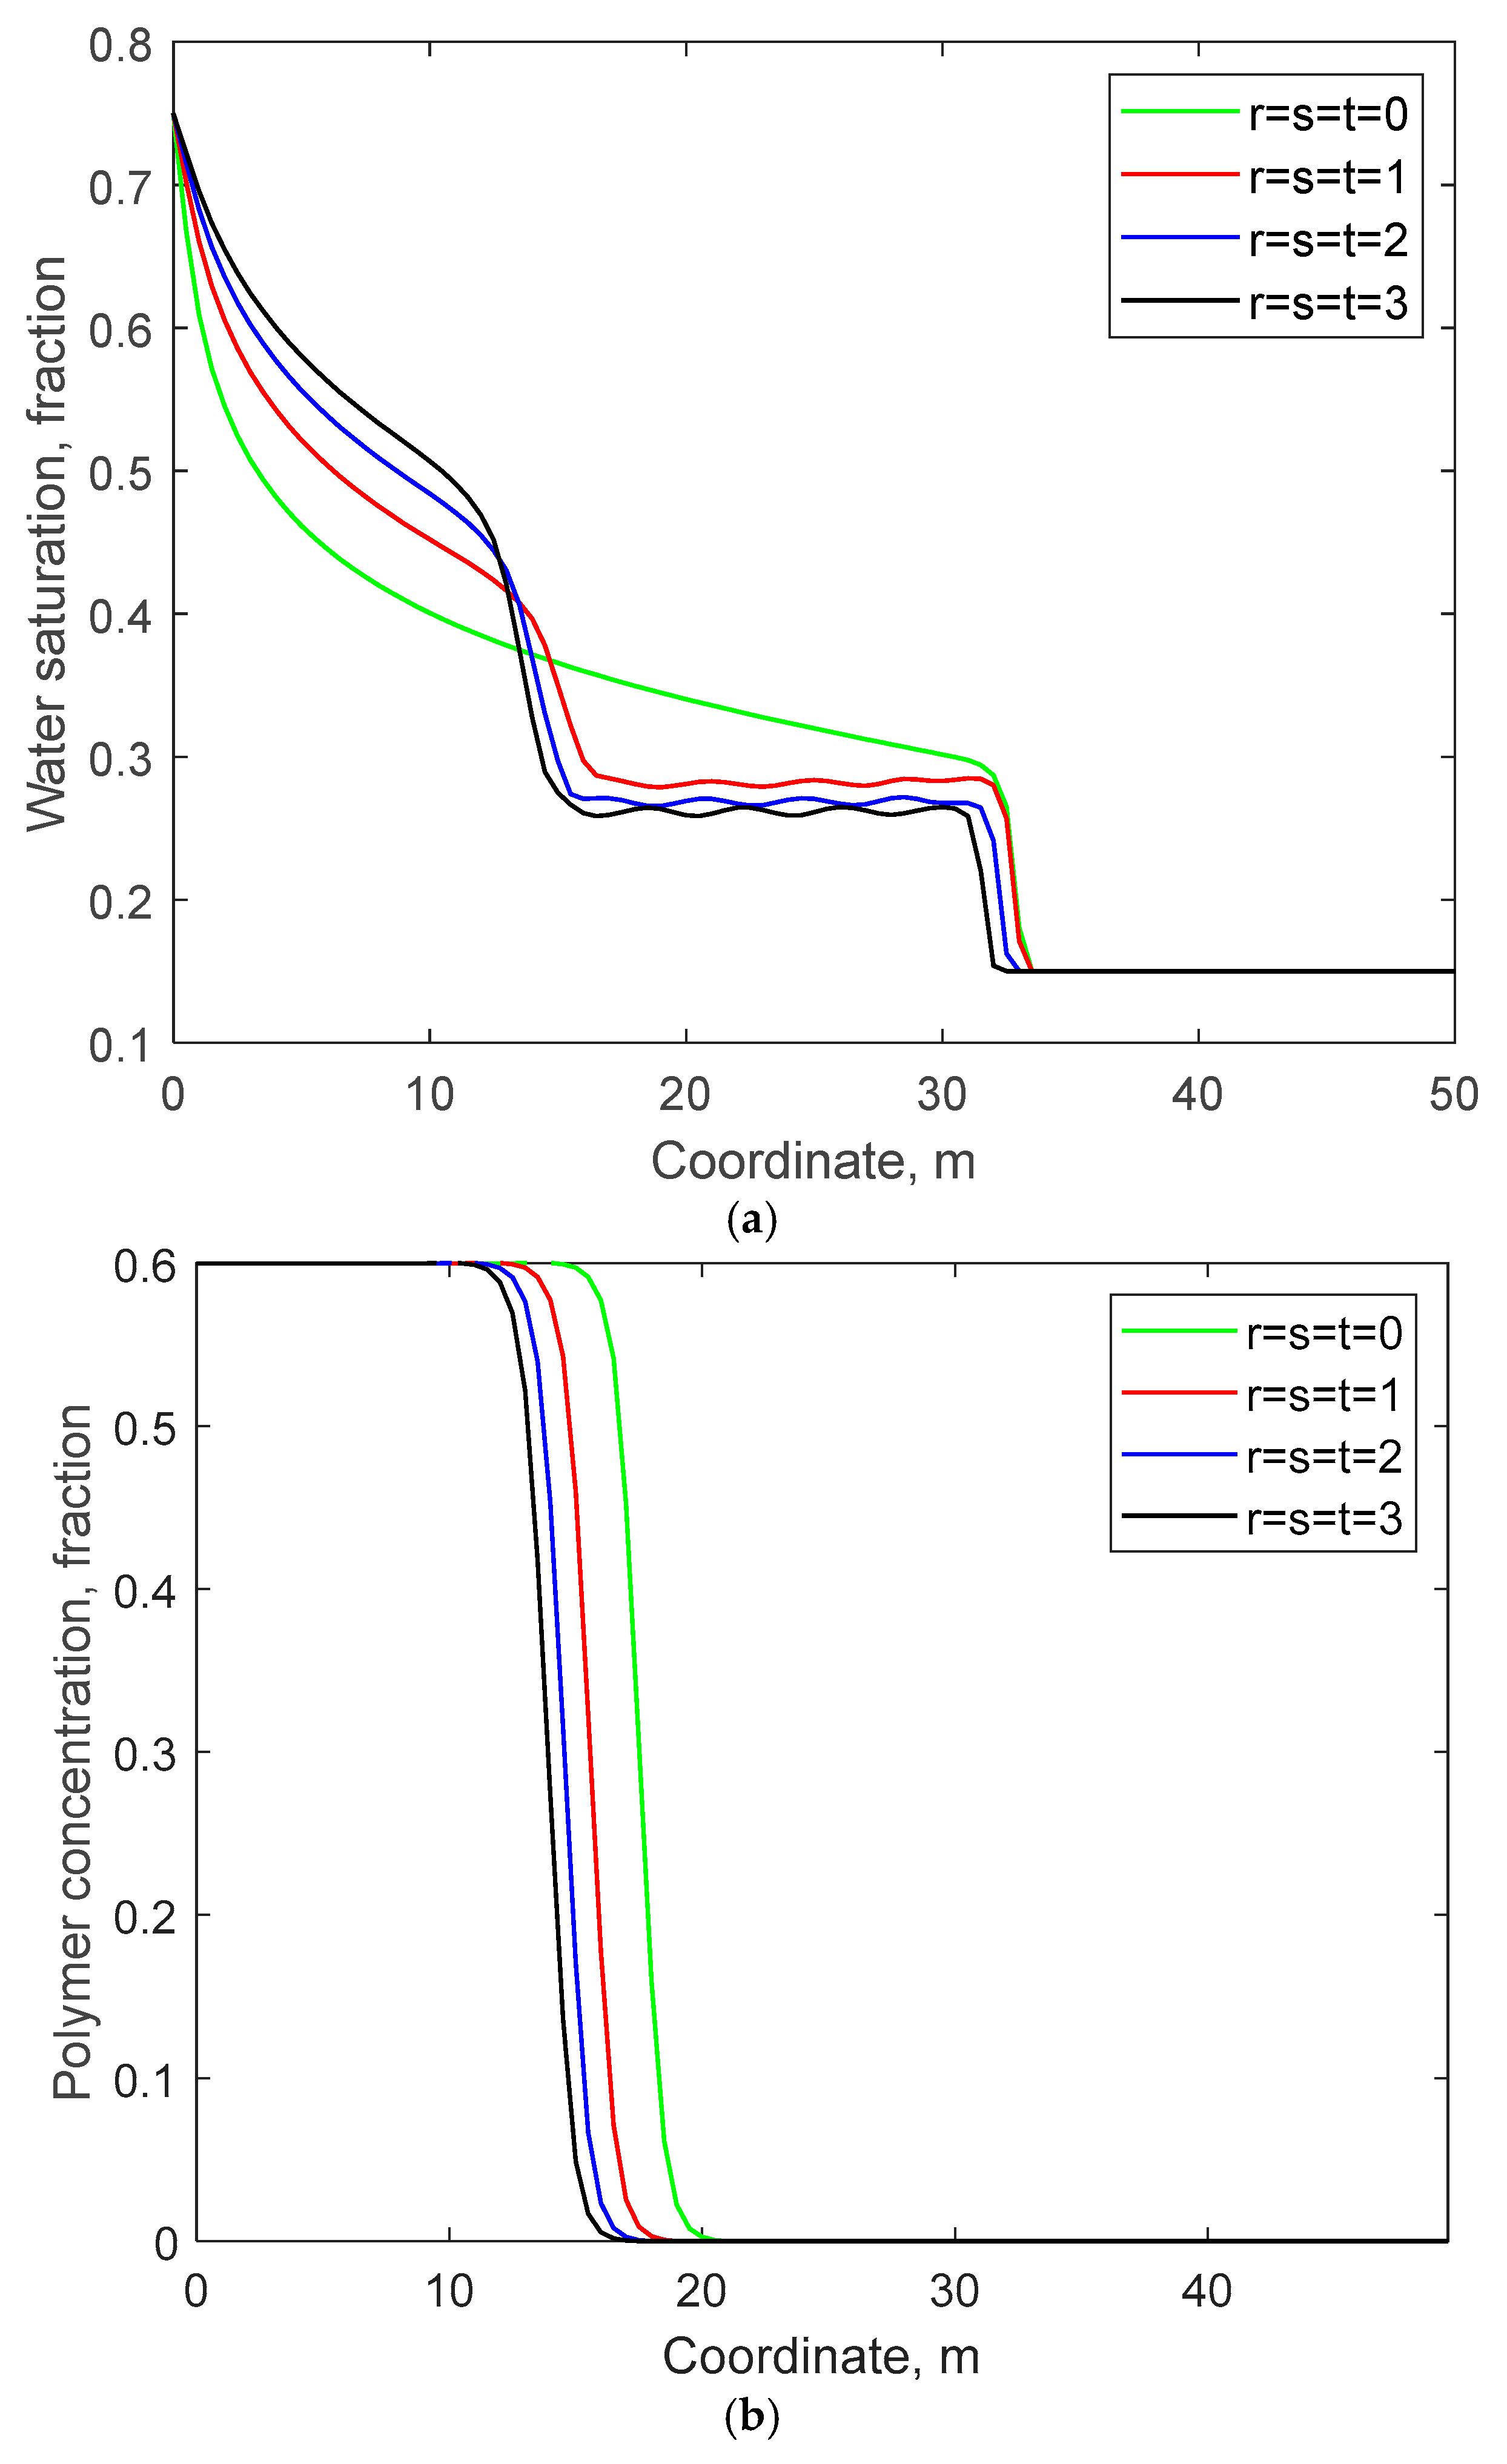
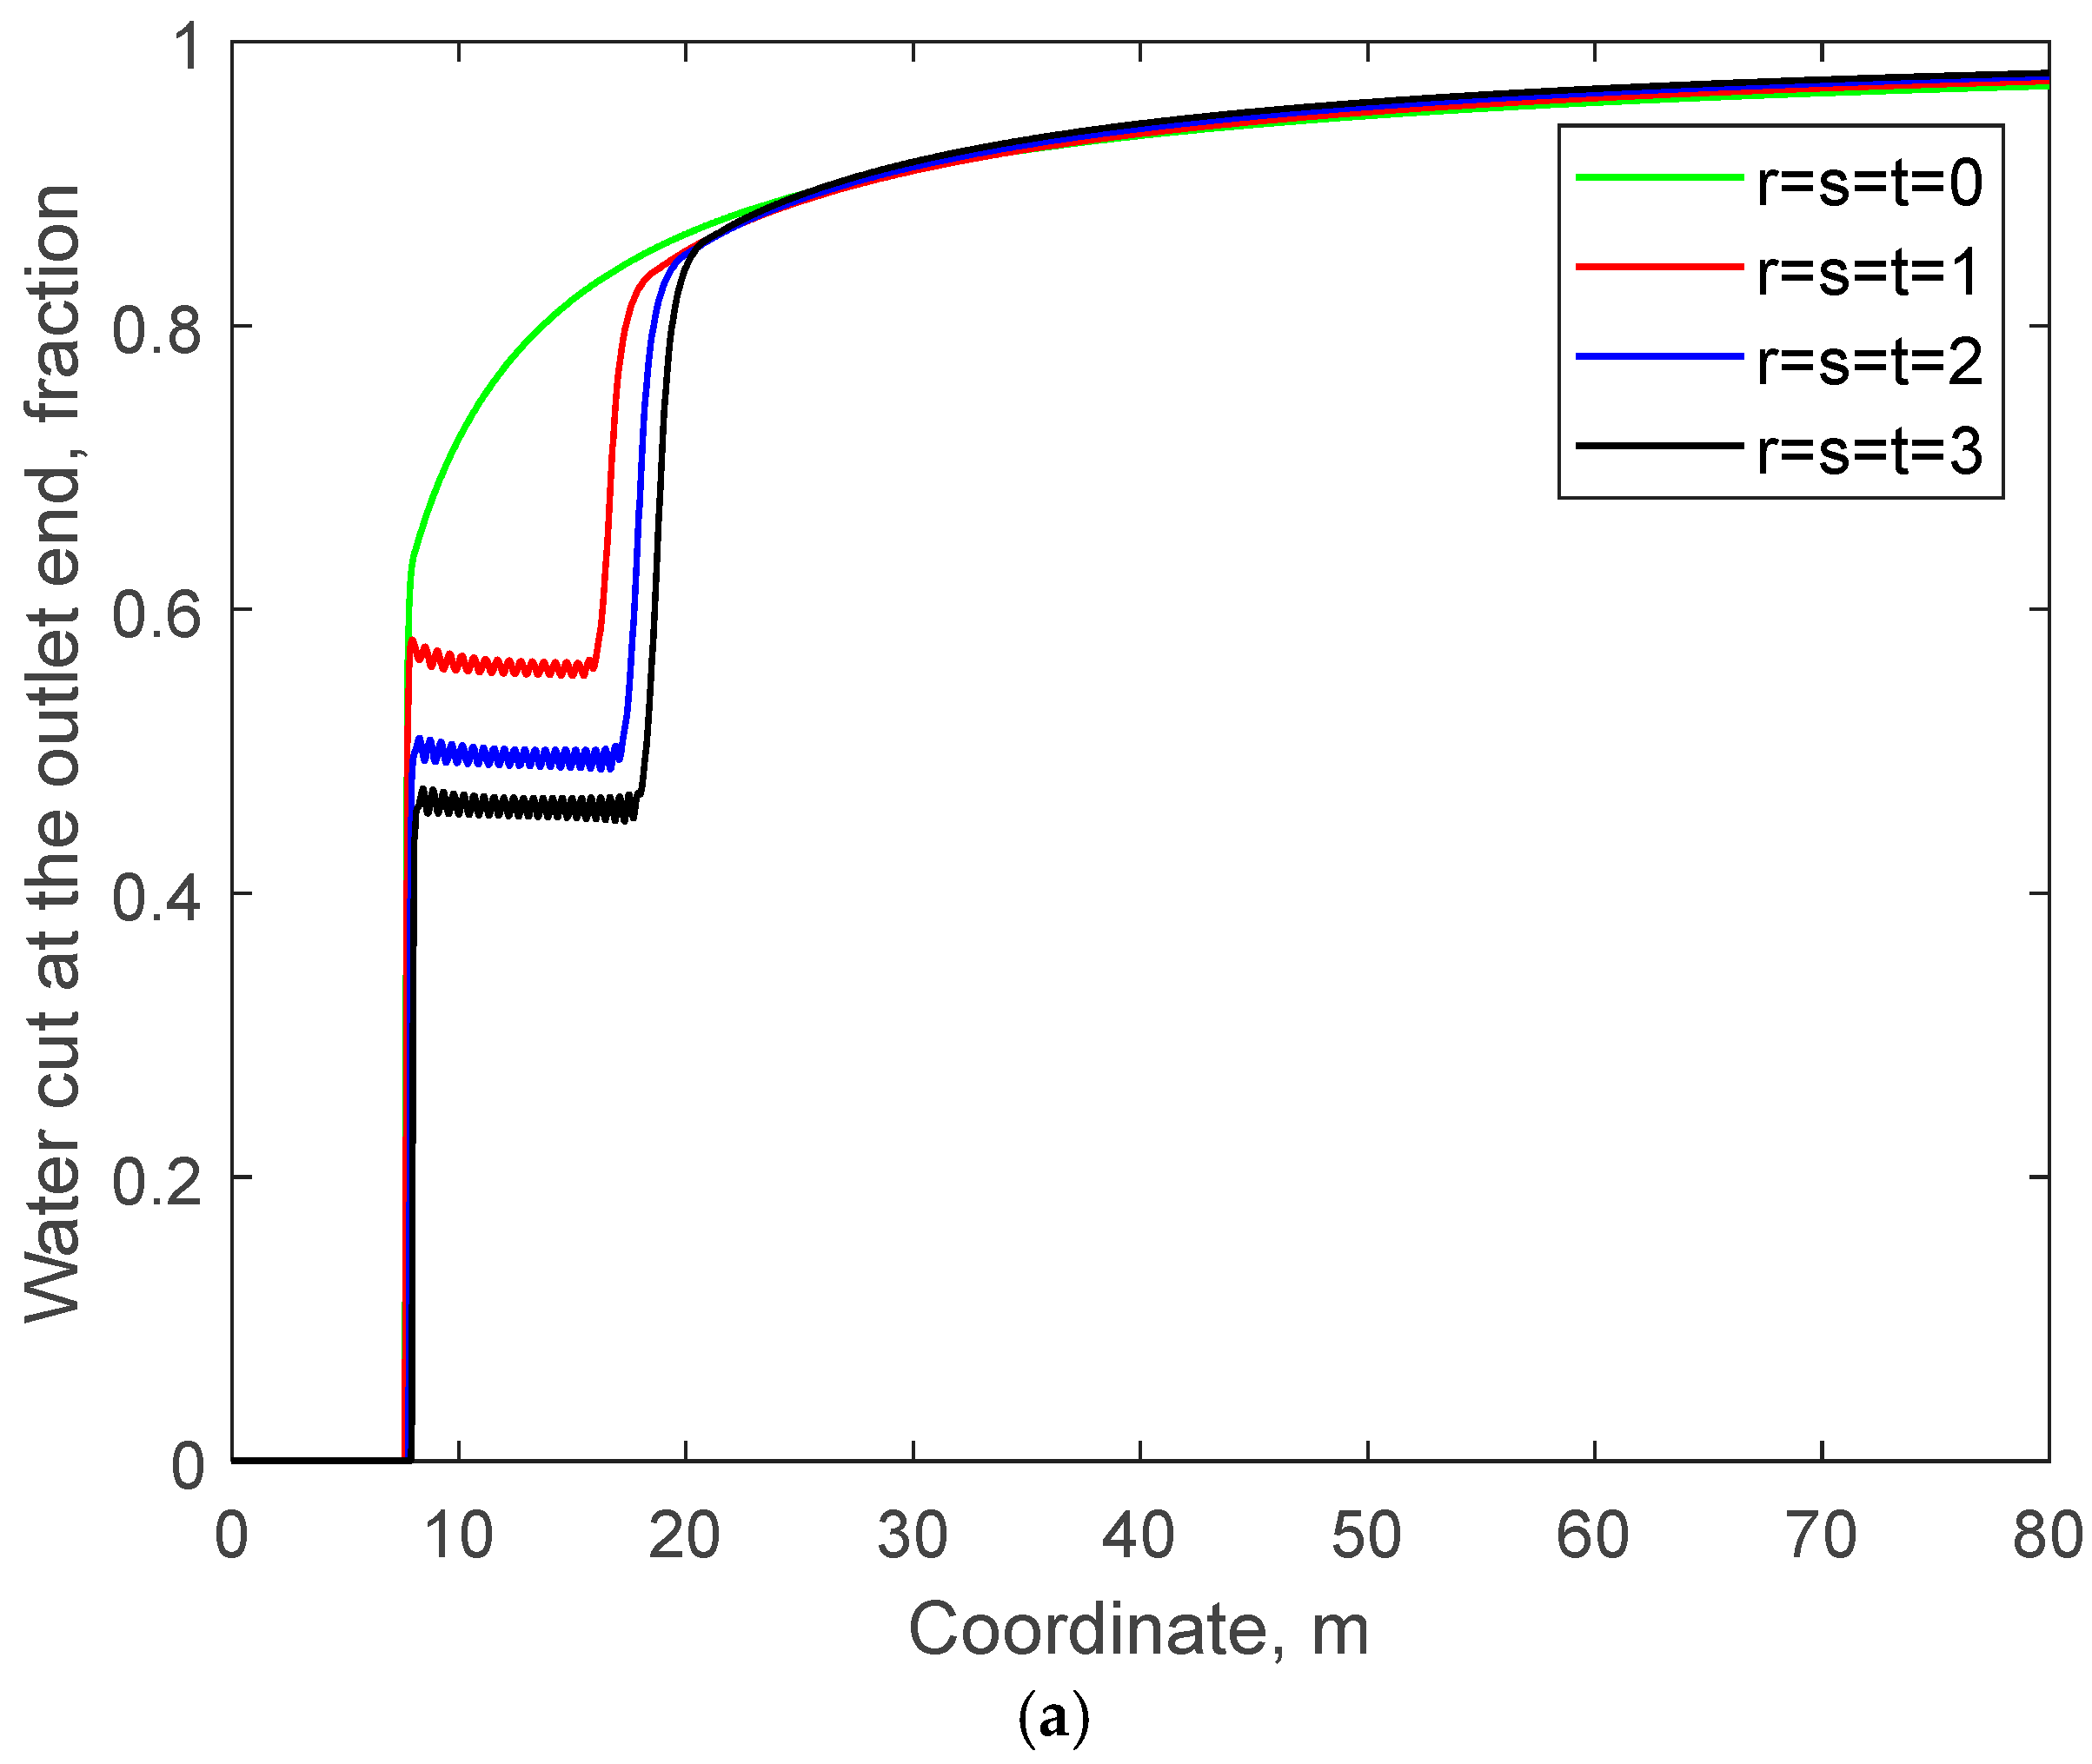
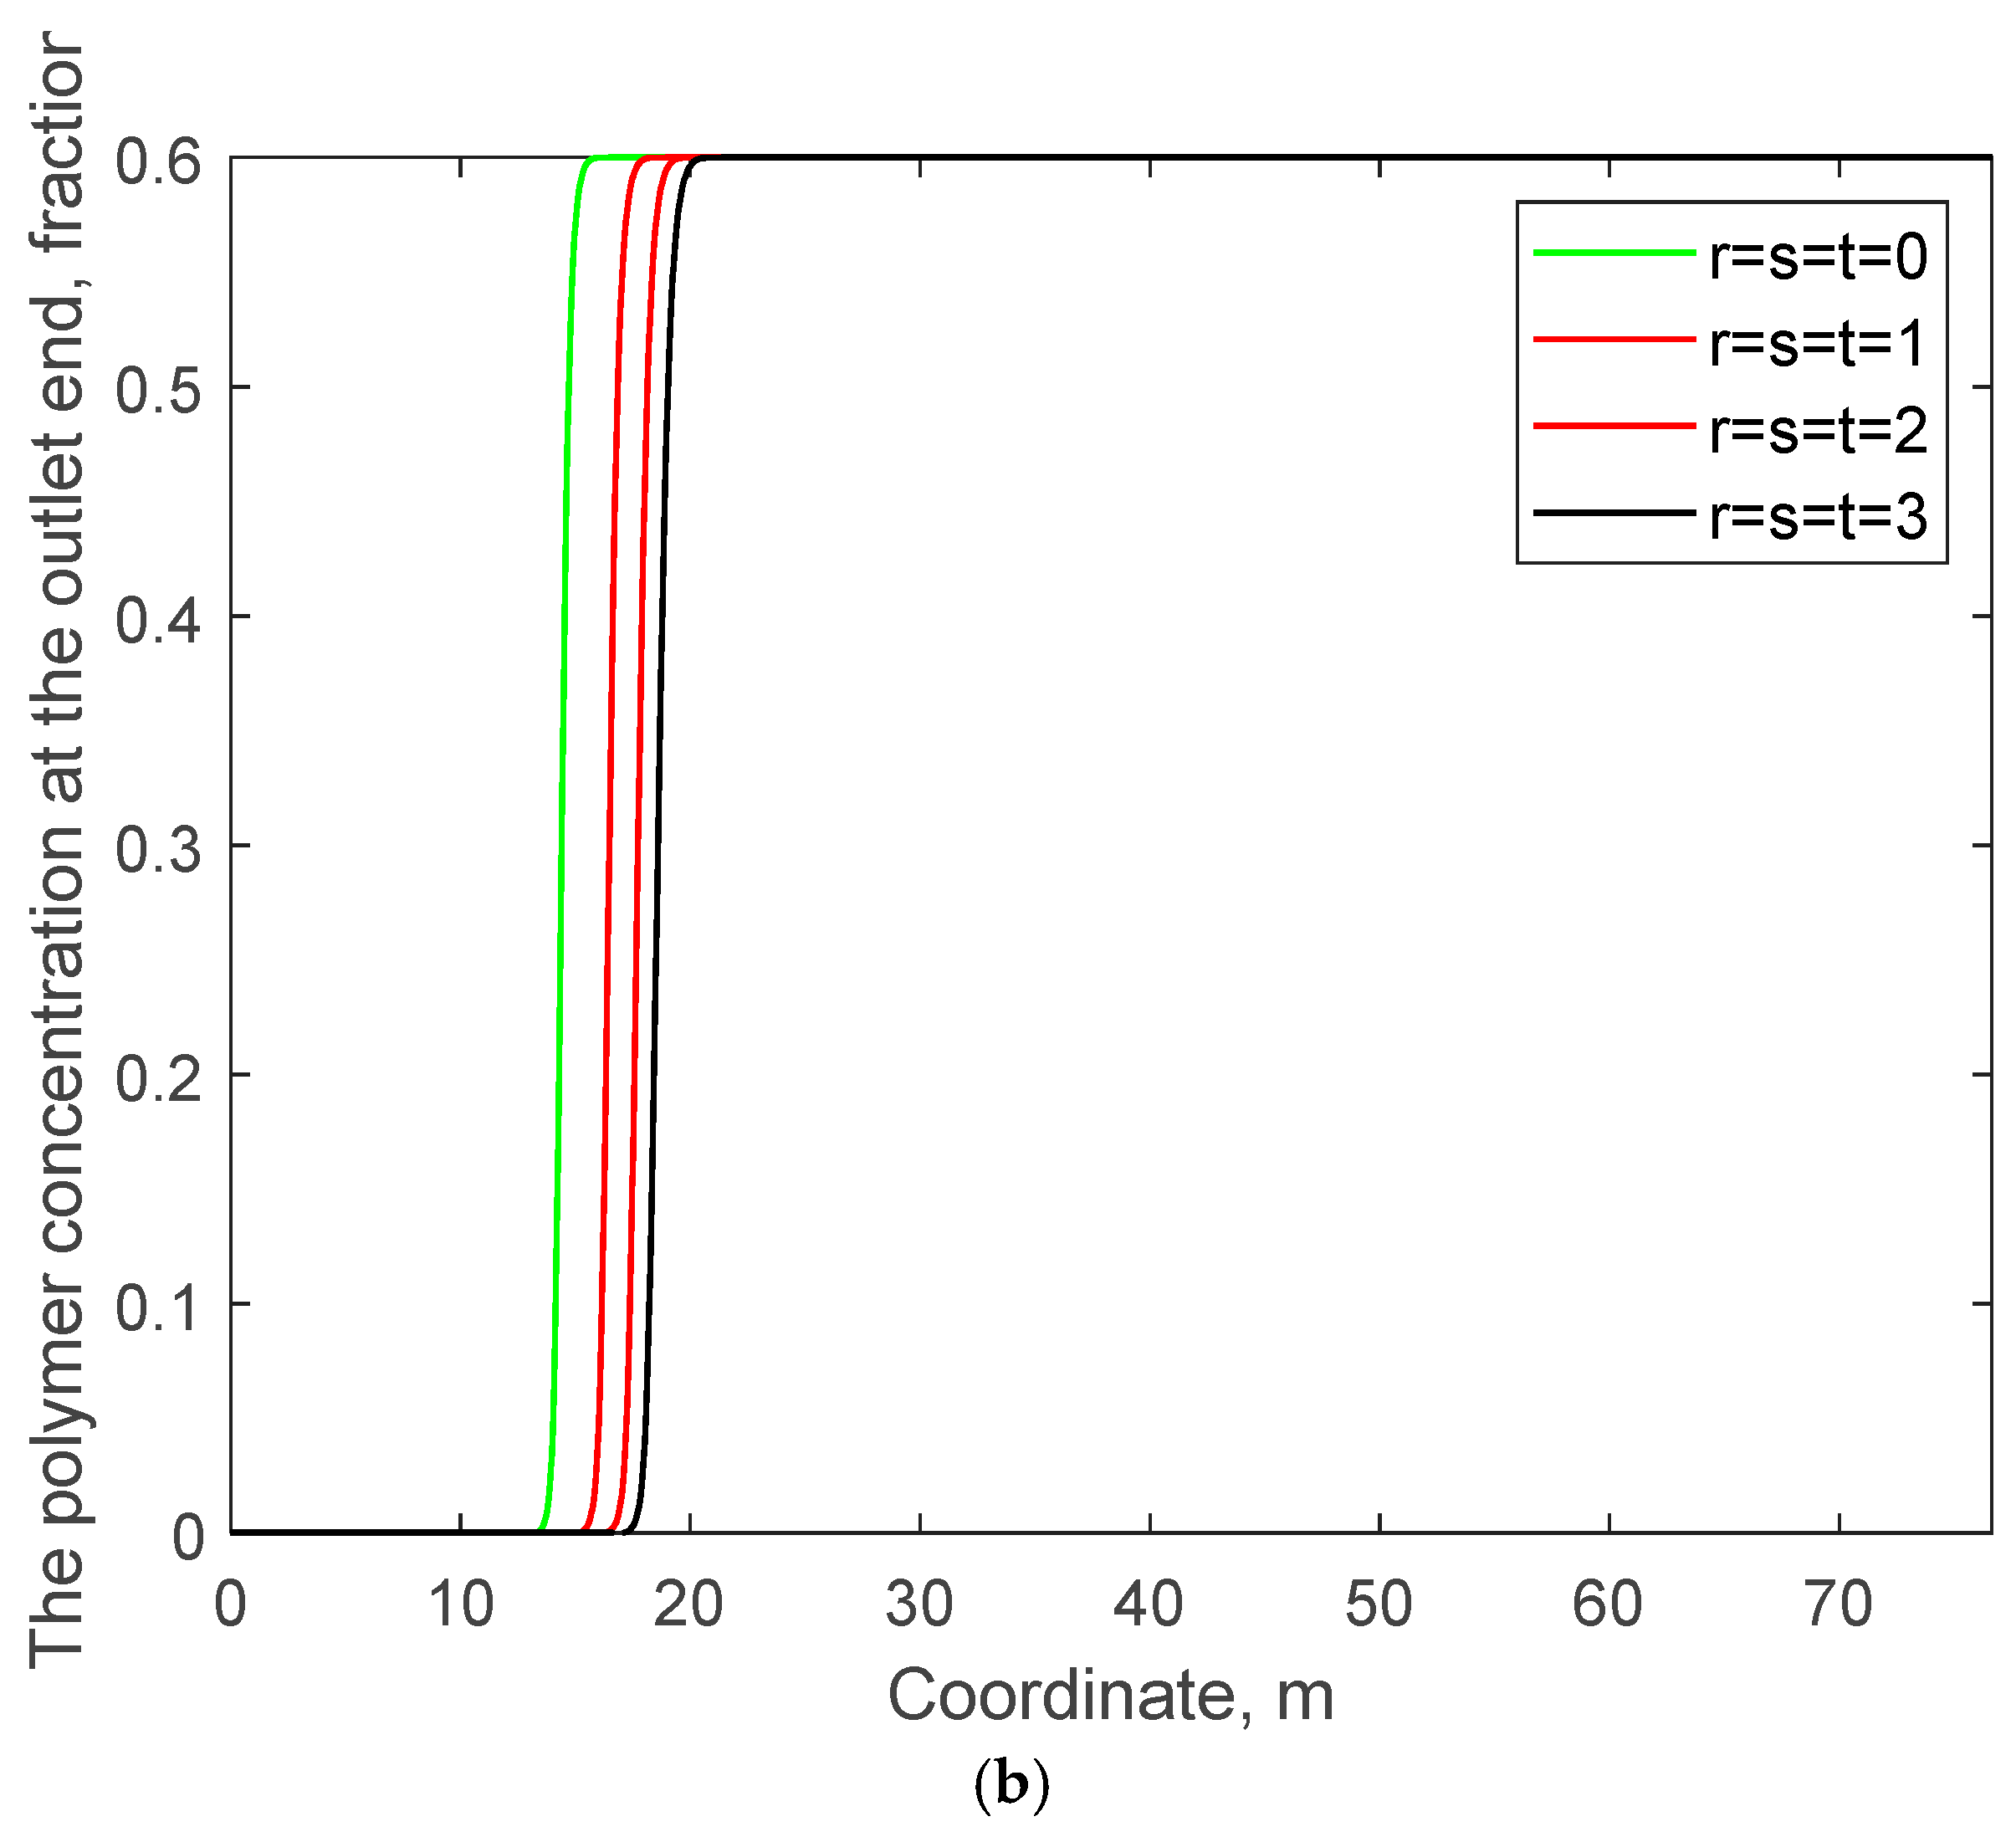
Therefore, in this example, we adopt the oil–water relative permeability ratio from Example 1 and the oil–water viscosity data from Example 2 and set r = s = t = 0, r = s = t = 1, r = s = t = 2, and r = s = t = 3, respectively. Other physical property parameters and initial boundary conditions are the same as those in Example 1 to examine the influence of different polymer–solution viscosity parameters on the polymer-flooding effect.
Figure 9 compares the water saturation and polymer concentration distributions on the fifth day calculated by the method in this work for different values of r, s, and t. Figure 10 compares the curves of water cut and polymer concentration over time at the outlet end for different values of r, s, and t. It is known that larger values of r, s, and t indicate that the viscosity of the polymer solution is more likely to increase, which can better adjust the fingering of the injected water.
Consequently, it can be observed that when r, s, and t are smaller, the distribution of the injected water in Figure 9a tends to be more towards the right. The polymer in the injected water will also be displaced forward more rapidly along with the overall right-ward distribution of the injected water. In Figure 10, the water cut and polymer production concentration at the outlet end will also rise more rapidly.

4. Conclusions

This paper presents a numerical simulation method for polymer-flooded reservoirs based on the high-order Weighted Essentially Non-Oscillatory (WENO) scheme. After a comprehensive review of the whole paper, the following main conclusions are drawn:
(1)
The WENO method is employed to achieve high-order estimations of the saturation function and the polymer concentration function. Moreover, a sequential solution scheme for the hyperbolic mass conservation equation of the aqueous phase and the mass conservation equation of the polymer component in polymer-flooded reservoirs is derived.
(2)
Three numerical test cases are implemented by comparing the results obtained from the WENO scheme in this work and those from the traditional first-order upwind difference method commonly used in current commercial simulators. It is found that the computational accuracy of the WENO results is far higher than that of the traditional method, especially in the prediction of the water-flood front and the polymer concentration front. This can significantly improve the prediction accuracy of the water cut and polymer production concentration in production wells.
(3)
The results of the numerical test cases also show that, with the same level of accuracy, the number of grids required by the WENO method is far less than that required by the traditional method. Correspondingly, its computational efficiency is over multiple times that of the traditional method.
(4)
A sensitivity analysis of the parameters related to the viscosity of the polymer solution was conducted. The results indicate that the WENO method presented in this paper can accurately simulate the production performance of polymer-flooded reservoirs.
(5)
Integrating the high-precision simulation method for polymer flooding in one-dimensional channels in this paper into the INSIM model to conduct simulations of full three-dimensional reservoir blocks and comparing and validating the simulation results with experimental data to modify the model equations for polymer flooding are valuable future works.

Author Contributions

J.W.: Software, Validation, Writing—original draft, Writing—review and editing. Z.Z.: Software, Validation, Writing—original draft, Writing—review and editing. X.Z.: Software, Validation, Writing—original draft. X.R.: Conceptualization, Data curation, Investigation, Methodology, Project administration, Resources, Software, Supervision, Validation, Visualization, Writing—original draft, Writing—review and editing. All authors have read and agreed to the published version of the manuscript.

Funding

The work was supported from the Open Fund of Hubei Key Laboratory of Oil and Gas Drilling and Production Engineering (Yangtze University), with the grant number YQZC202402.

Data Availability Statement

The data that support the findings of this study are available from the corresponding author upon reasonable request.

Conflicts of Interest

Authors Jun Wei, and Zhijun Zhang were employed by the CNOOC Energy Development Corporation Engineering Technology Branch Company. The remaining authors declare that the research was conducted in the absence of any commercial or financial relationships that could be construed as a potential conflict of interest. The CNOOC Energy Development Corporation Engineering Technology Branch Company had no role in the design of the study; in the collection, analyses, or interpretation of data; in the writing of the manuscript, or in the decision to publish the results.

References

  1. Soeder, D.J. The successful development of gas and oil resources from shales in North America. J. Pet. Sci. Eng. 2018, 163, 399–420. [Google Scholar] [CrossRef]
  2. Seyyedattar, M.; Zendehboudi, S.; Butt, S. Technical and non-technical challenges of development of offshore petroleum reservoirs: Characterization and production. Nat. Resour. Res. 2020, 29, 2147–2189. [Google Scholar] [CrossRef]
  3. Seright, R.S.; Wang, D. Polymer flooding: Current status and future directions. Pet. Sci. 2023, 20, 910–921. [Google Scholar] [CrossRef]
  4. Hassan, A.M.; Al-Shalabi, E.W.; Alameri, W.; Kamal, M.S.; Patil, S.; Hussain, S.M.S. Manifestations of surfactant-polymer flooding for successful field applications in carbonates under harsh conditions: A comprehensive review. J. Pet. Sci. Eng. 2023, 220, 111243. [Google Scholar] [CrossRef]
  5. Pogaku, R.; Mohd Fuat, N.H.; Sakar, S.; Cha, Z.W.; Musa, N.; Awang Tajudin, D.N.A.; Morris, L.O. Polymer flooding and its combinations with other chemical injection methods in enhanced oil recovery. Polym. Bull. 2018, 75, 1753–1774. [Google Scholar] [CrossRef]
  6. Saboorian-Jooybari, H.; Dejam, M.; Chen, Z. Heavy oil polymer flooding from laboratory core floods to pilot tests and field applications: Half-century studies. J. Pet. Sci. Eng. 2016, 142, 85–100. [Google Scholar] [CrossRef]
  7. Ibiam, E.; Geiger, S.; Demyanov, V.; Arnold, D. Optimization of polymer flooding in a heterogeneous reservoir considering geological and history matching uncertainties. SPE Reserv. Eval. Eng. 2021, 24, 19–36. [Google Scholar] [CrossRef]
  8. Alhotan, M.M.; Batista Fernandes, B.R.; Delshad, M.; Sepehrnoori, K. A Systemic Comparison of Physical Models for Simulating Surfactant–Polymer Flooding. Energies 2023, 16, 5702. [Google Scholar] [CrossRef]
  9. Ferrari, S.; Rossi, R.; Di Bernardino, A. A review of laboratory and numerical techniques to simulate turbulent flows. Energies 2022, 15, 7580. [Google Scholar] [CrossRef]
  10. Urrea-Quintero, J.H.; Marino, M.; Wick, T.; Nackenhorst, U. A comparative analysis of transient finite-strain coupled diffusion-deformation theories for hydrogels. Arch. Comput. Methods Eng. 2024, 31, 3767–3800. [Google Scholar] [CrossRef]
  11. Zhang, Z.; Li, Z.; Wu, Y. Advection–Diffusion lattice Boltzmann method with and without dynamical filter. Front. Phys. 2022, 10, 875628. [Google Scholar] [CrossRef]
  12. Alves, M.A.; Oliveira, P.J.; Pinho, F.T. Numerical methods for viscoelastic fluid flows. Annu. Rev. Fluid Mech. 2021, 53, 509–541. [Google Scholar] [CrossRef]
  13. Battiston, F.; Amico, E.; Barrat, A.; Bianconi, G.; Ferraz de Arruda, G.; Franceschiello, B.; Iacopini, I.; Kéfi, S.; Latora, V.; Moreno, Y.; et al. The physics of higher-order interactions in complex systems. Nat. Phys. 2021, 17, 1093–1098. [Google Scholar] [CrossRef]
  14. Du, J.; Shu, C.W.; Zhong, X. An improved simple WENO limiter for discontinuous Galerkin methods solving hyperbolic systems on unstructured meshes. J. Comput. Phys. 2022, 467, 111424. [Google Scholar] [CrossRef]
  15. Wang, Z.; Zhu, J.; Tian, L.; Yang, Y.; Zhao, N. An efficient fifth-order finite difference multi-resolution WENO scheme for inviscid and viscous flow problems. Comput. Fluids 2021, 230, 105138. [Google Scholar] [CrossRef]
  16. Rao, X. The First Application of Quantum Computing Algorithm in Streamline-Based Simulation of Water-Flooding Reservoirs. In Proceedings of the Abu Dhabi International Petroleum Exhibition and Conference, Abu Dhabi, United Arab Emirates, 4–7 November 2024; SPE: Richardson, TX, USA, 2024; p. D011S003R006. [Google Scholar]
  17. Yee, H.C.; Sweby, P.K.; Sjögreen, B.; Kotov, D.V. A nonlinear approach in the quantification of numerical uncertainty by high-order methods for compressible turbulence with shocks. Fluids 2024, 9, 250. [Google Scholar] [CrossRef]
  18. Lin, G.; Liu, J.; Sadre-Marandi, F. A comparative study on the weak Galerkin, discontinuous Galerkin, and mixed finite element methods. J. Comput. Appl. Math. 2015, 273, 346–362. [Google Scholar] [CrossRef]
  19. Ali, I.; Saleem, M.T.; Din, A.U. Special functions and its application in solving two dimensional hyperbolic partial differential equation of telegraph type. Symmetry 2023, 15, 847. [Google Scholar] [CrossRef]
  20. Shen, H. A class of ENO schemes with adaptive order for solving hyperbolic conservation laws. Comput. Fluids 2023, 266, 106050. [Google Scholar] [CrossRef]
  21. Ye, C.C.; Wan, Z.H.; Sun, D.J. An alternative formulation of targeted ENO scheme for hyperbolic conservation laws. Comput. Fluids 2022, 238, 105368. [Google Scholar] [CrossRef]
  22. Rao, X.; He, X.; Kwak, H.; Hoteit, H. A Hybrid Method Combining Mimetic Finite Difference and Discontinuous Galerkin for Two-Phase Reservoir Flow Problems. Int. J. Numer. Methods Fluids 2024. [Google Scholar] [CrossRef]
  23. Luna, P.; Hidalgo, A. Numerical approach of a coupled pressure-saturation model describing oil-water flow in porous media. Commun. Appl. Math. Comput. 2023, 5, 946–964. [Google Scholar] [CrossRef]
  24. Garcia, R.D.O.; Silveira, G.P. Numerical Solutions of the Classical and Modified Buckley-Leverett Equations Applied to Two-Phase Fluid Flow. Open J. Fluid Dyn. 2024, 14, 184–204. [Google Scholar] [CrossRef]
  25. Liu, Y.; Yao, C. Development of an efficient numerical model for two-phase flows in air-lift pumps and its application to deep-sea mining. Ocean Eng. 2023, 281, 114897. [Google Scholar] [CrossRef]
  26. Zhao, H.; Kang, Z.; Zhang, X.; Sun, H.; Cao, L.; Reynolds, A.C. INSIM: A data-driven model for history matching and prediction for waterflooding monitoring and management with a field application. In Proceedings of the SPE Reservoir Simulation Conference, Houston, TX, USA, 23–25 February 2015; SPE: Richardson, TX, USA, 2015; p. D021S007R004. [Google Scholar]
  27. Zhao, H.; Rao, X.; Liu, D.; Xu, Y.; Zhan, W.; Peng, X. A flownet-based method for history matching and production prediction of shale or tight reservoirs with fracturing treatment. SPE J. 2022, 27, 2793–2819. [Google Scholar] [CrossRef]
  28. Zhong, H.; Liu, H.; Cui, T.; Chen, Z.; Shen, L.; Yang, B.; He, R.; Guo, X. Numerical simulations of polymer flooding process in porous media on distributed-memory parallel computers. J. Comput. Phys. 2020, 400, 108995. [Google Scholar] [CrossRef]
  29. Firozjaii, A.M.; Saghafi, H.R. Review on chemical enhanced oil recovery using polymer flooding: Fundamentals, experimental and numerical simulation. Petroleum 2020, 6, 115–122. [Google Scholar] [CrossRef]
  30. Jiang, G.S.; Shu, C.W. Efficient implementation of weighted ENO schemes. J. Comput. Phys. 1996, 126, 202–228. [Google Scholar] [CrossRef]
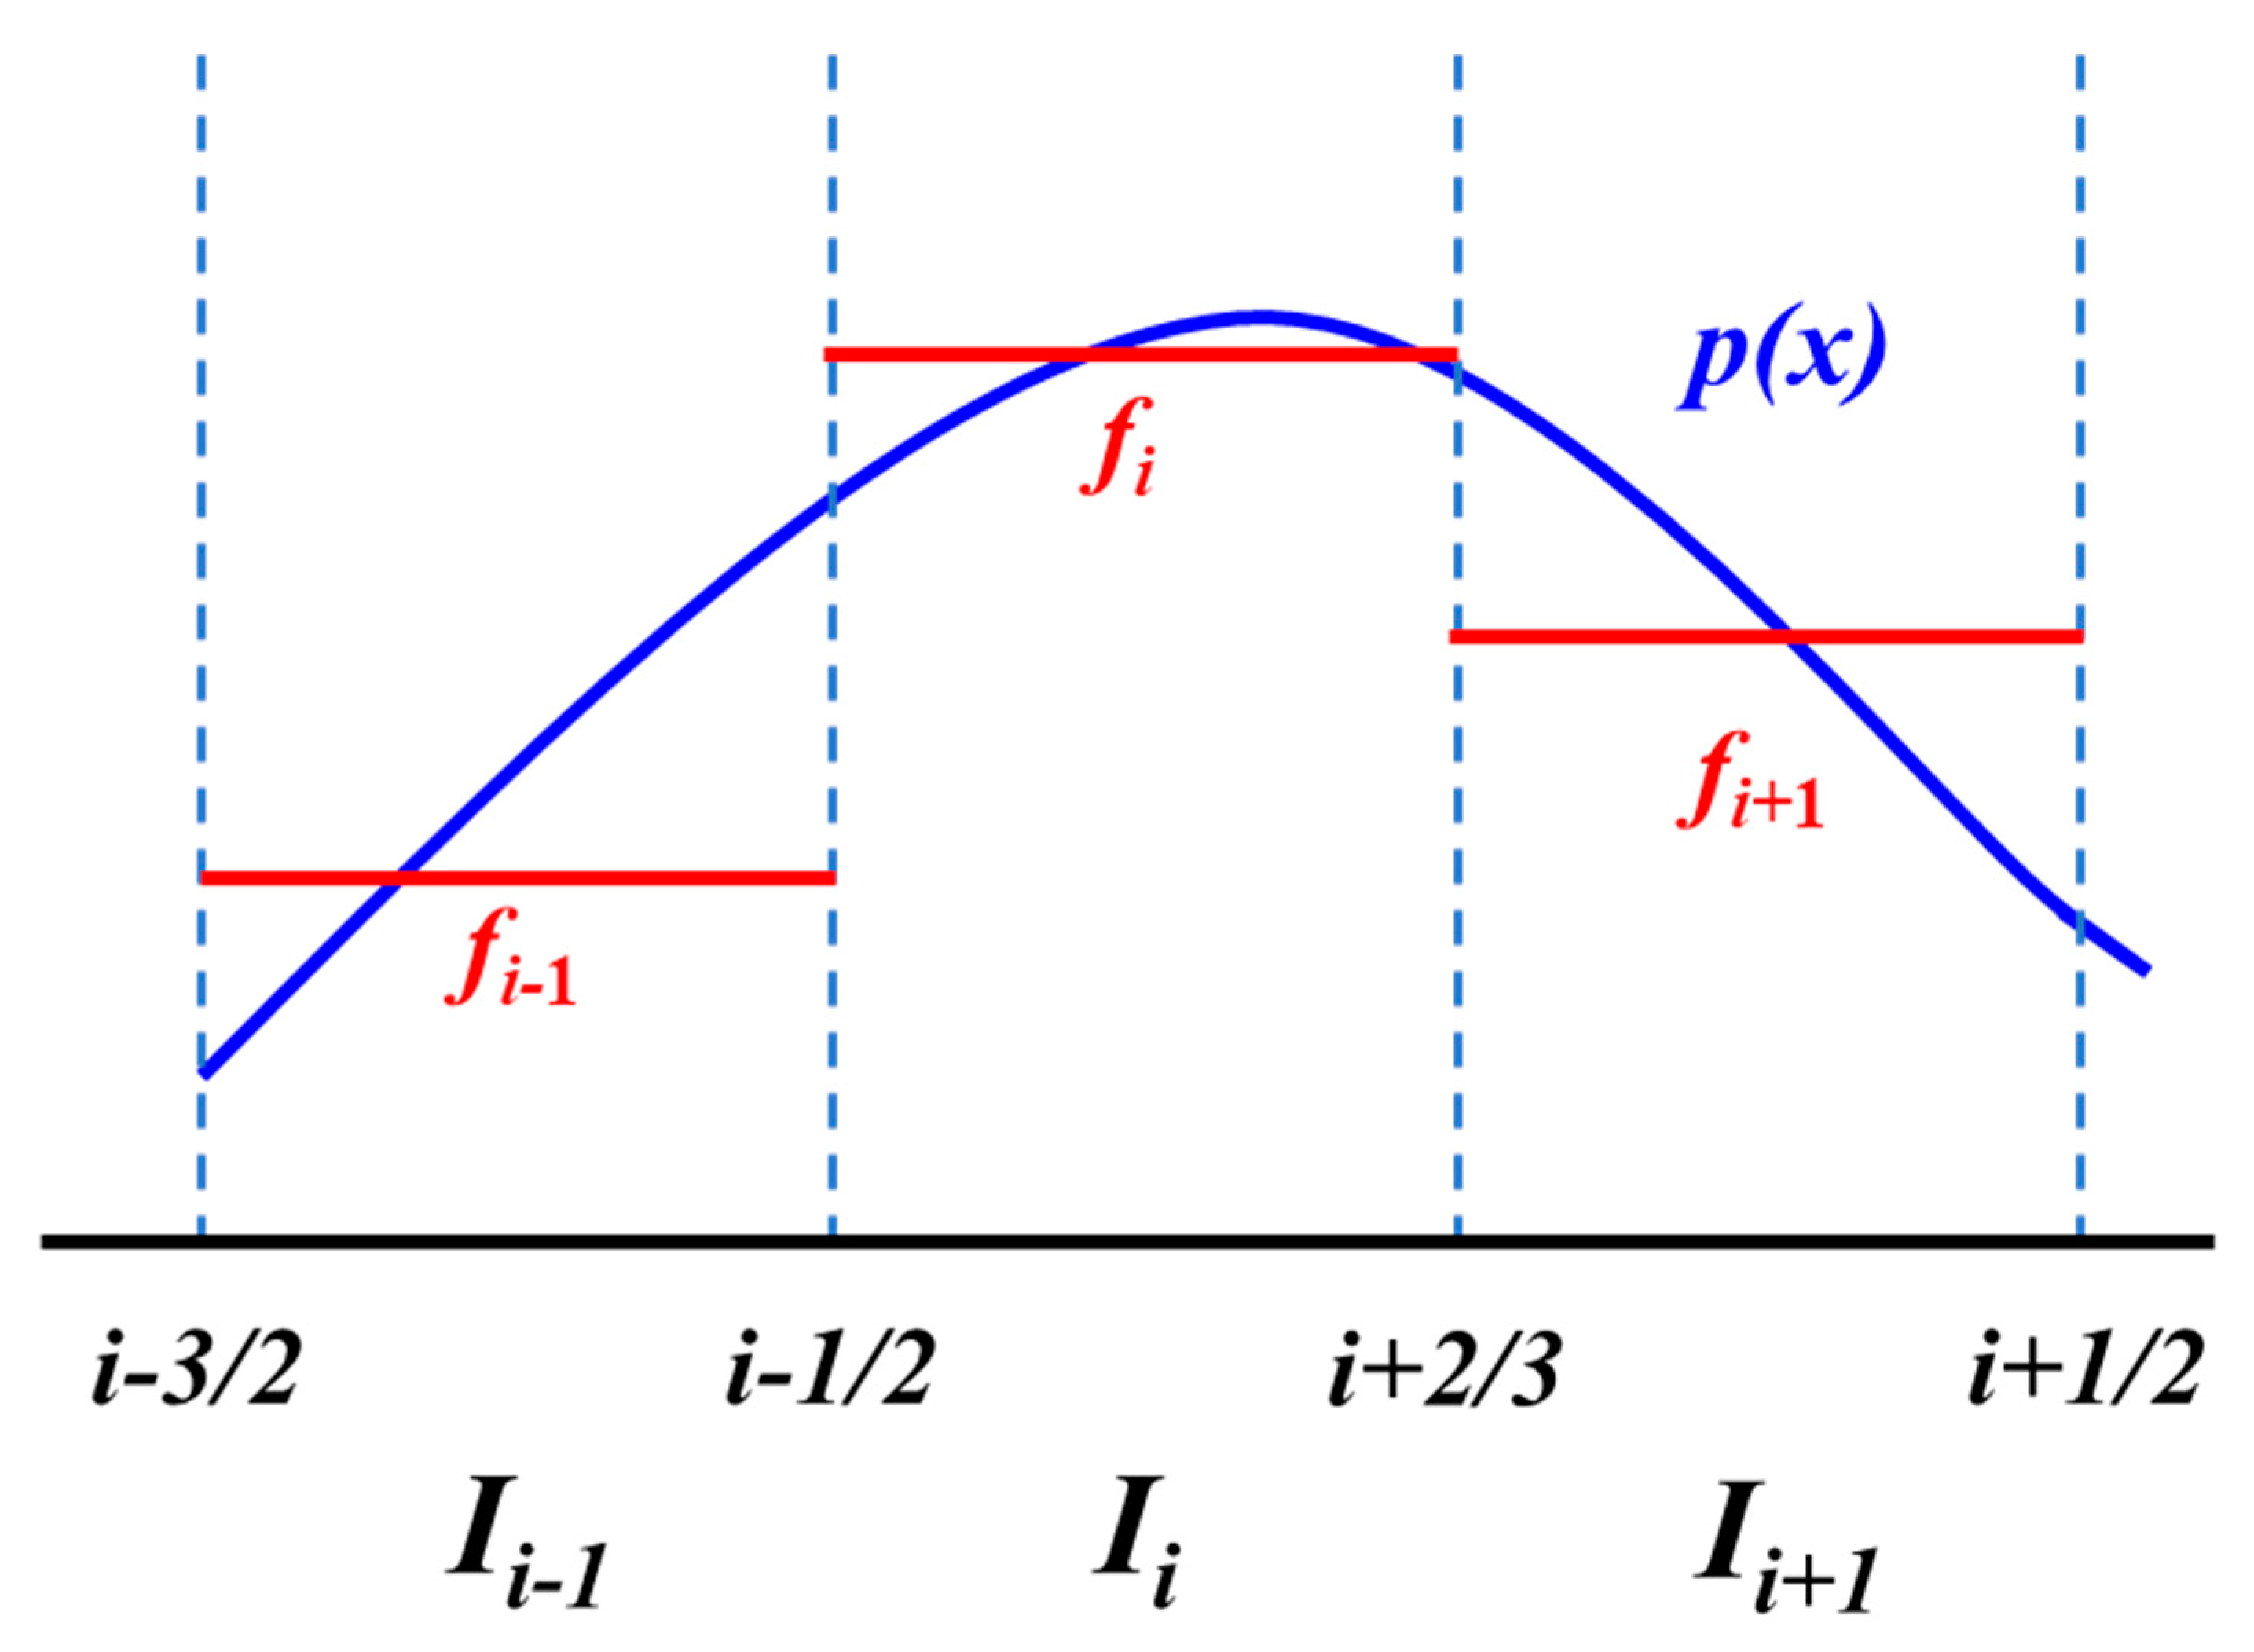
Figure 1. A sketch of the polynomial function p(x) on a template.
Processes 13 00671 g001
Figure 2. The illustration of multiple templates.
Processes 13 00671 g002
Figure 3. Comparisons of water saturation and polymer concentration profiles after 10 days along the 1D channel in Example 1: (a) water saturation; (b) polymer concentration.
Processes 13 00671 g003aProcesses 13 00671 g003b
Figure 4. Comparisons of water cut and polymer concentration at the outlet end versus time in Example 1: (a) water cut at the outlet end; (b) polymer concentration at the outlet end.
Processes 13 00671 g004
Figure 5. Comparisons of water saturation and polymer concentration profiles after 10 days along the 1D channel in Example 2: (a) water saturation; (b) polymer concentration.
Processes 13 00671 g005aProcesses 13 00671 g005b
Figure 6. Comparisons of water cut and polymer concentration at the outlet end versus time in Example 2: (a) water cut at the outlet end; (b) polymer concentration at the outlet end.
Processes 13 00671 g006aProcesses 13 00671 g006b
Figure 7. Comparison between the solutions of the upwind FDM with different numbers of grids and the solution of the WENO method with 100 grids: (a) water saturation; (b) polymer concentration.
Processes 13 00671 g007aProcesses 13 00671 g007b
Figure 8. L2 errors versus grid size for water saturation and polymer concentration distributions.
Processes 13 00671 g008
Figure 9. Water saturation and polymer concentration distributions on the 5th day calculated by the method in this work for different values of r, s, and t: (a) water saturation; (b) polymer concentration.
Processes 13 00671 g009
Figure 10. Water cut and polymer concentration at the outlet end versus time for different values of r, s, and t: (a) water cut at the outlet end; (b) polymer concentration at the outlet end.
Processes 13 00671 g010aProcesses 13 00671 g010b
Table 1. Some physical property parameters used in Example 1.
ParameterValue
Simulation duration, day10
One-dimensional channel length, m50
Grid length, m0.5
Time step size, day0.001
Channel flow rate, m3/day30
Channel cross-sectional area, m2100
Table 2. Comparison of computational efficiency of different methods.
Upwind FDMThis WorkDG MethodReference Solution
Water11.318 days11.600 days11.556 days11.7832 days
polymer13.450 days18.427 days16.846 days19.055 days
Table 3. L2 errors of water saturation and polymer concentration calculated by different methods.
MethodsThis Work, 100 ElementsUpwind FDM, 100 ElementsUpwind FDM, 200 ElementsUpwind FDM, 400 ElementsUpwind FDM, 800 Elements
L2 error, Sw 0.007270.021010.017240.013840.01061
L2 error, Cp0.025120.062510.047580.034270.02220
Table 4. The CPU time consumed by the different methods for simulating 80-day flooding.
MethodsThis Work, 100 ElementsUpwind FDM, 100 ElementsUpwind FDM, 200 ElementsUpwind FDM, 400 ElementsUpwind FDM, 800 Elements
CPU time, second5.68303.89067.156217.312536.8281
Disclaimer/Publisher’s Note: The statements, opinions and data contained in all publications are solely those of the individual author(s) and contributor(s) and not of MDPI and/or the editor(s). MDPI and/or the editor(s) disclaim responsibility for any injury to people or property resulting from any ideas, methods, instructions or products referred to in the content.