
Analysis and Optimization of Thermal Storage Performance of Thermocline Storage Tank with Different Water Distribution Structures

 ,
,
Abstract
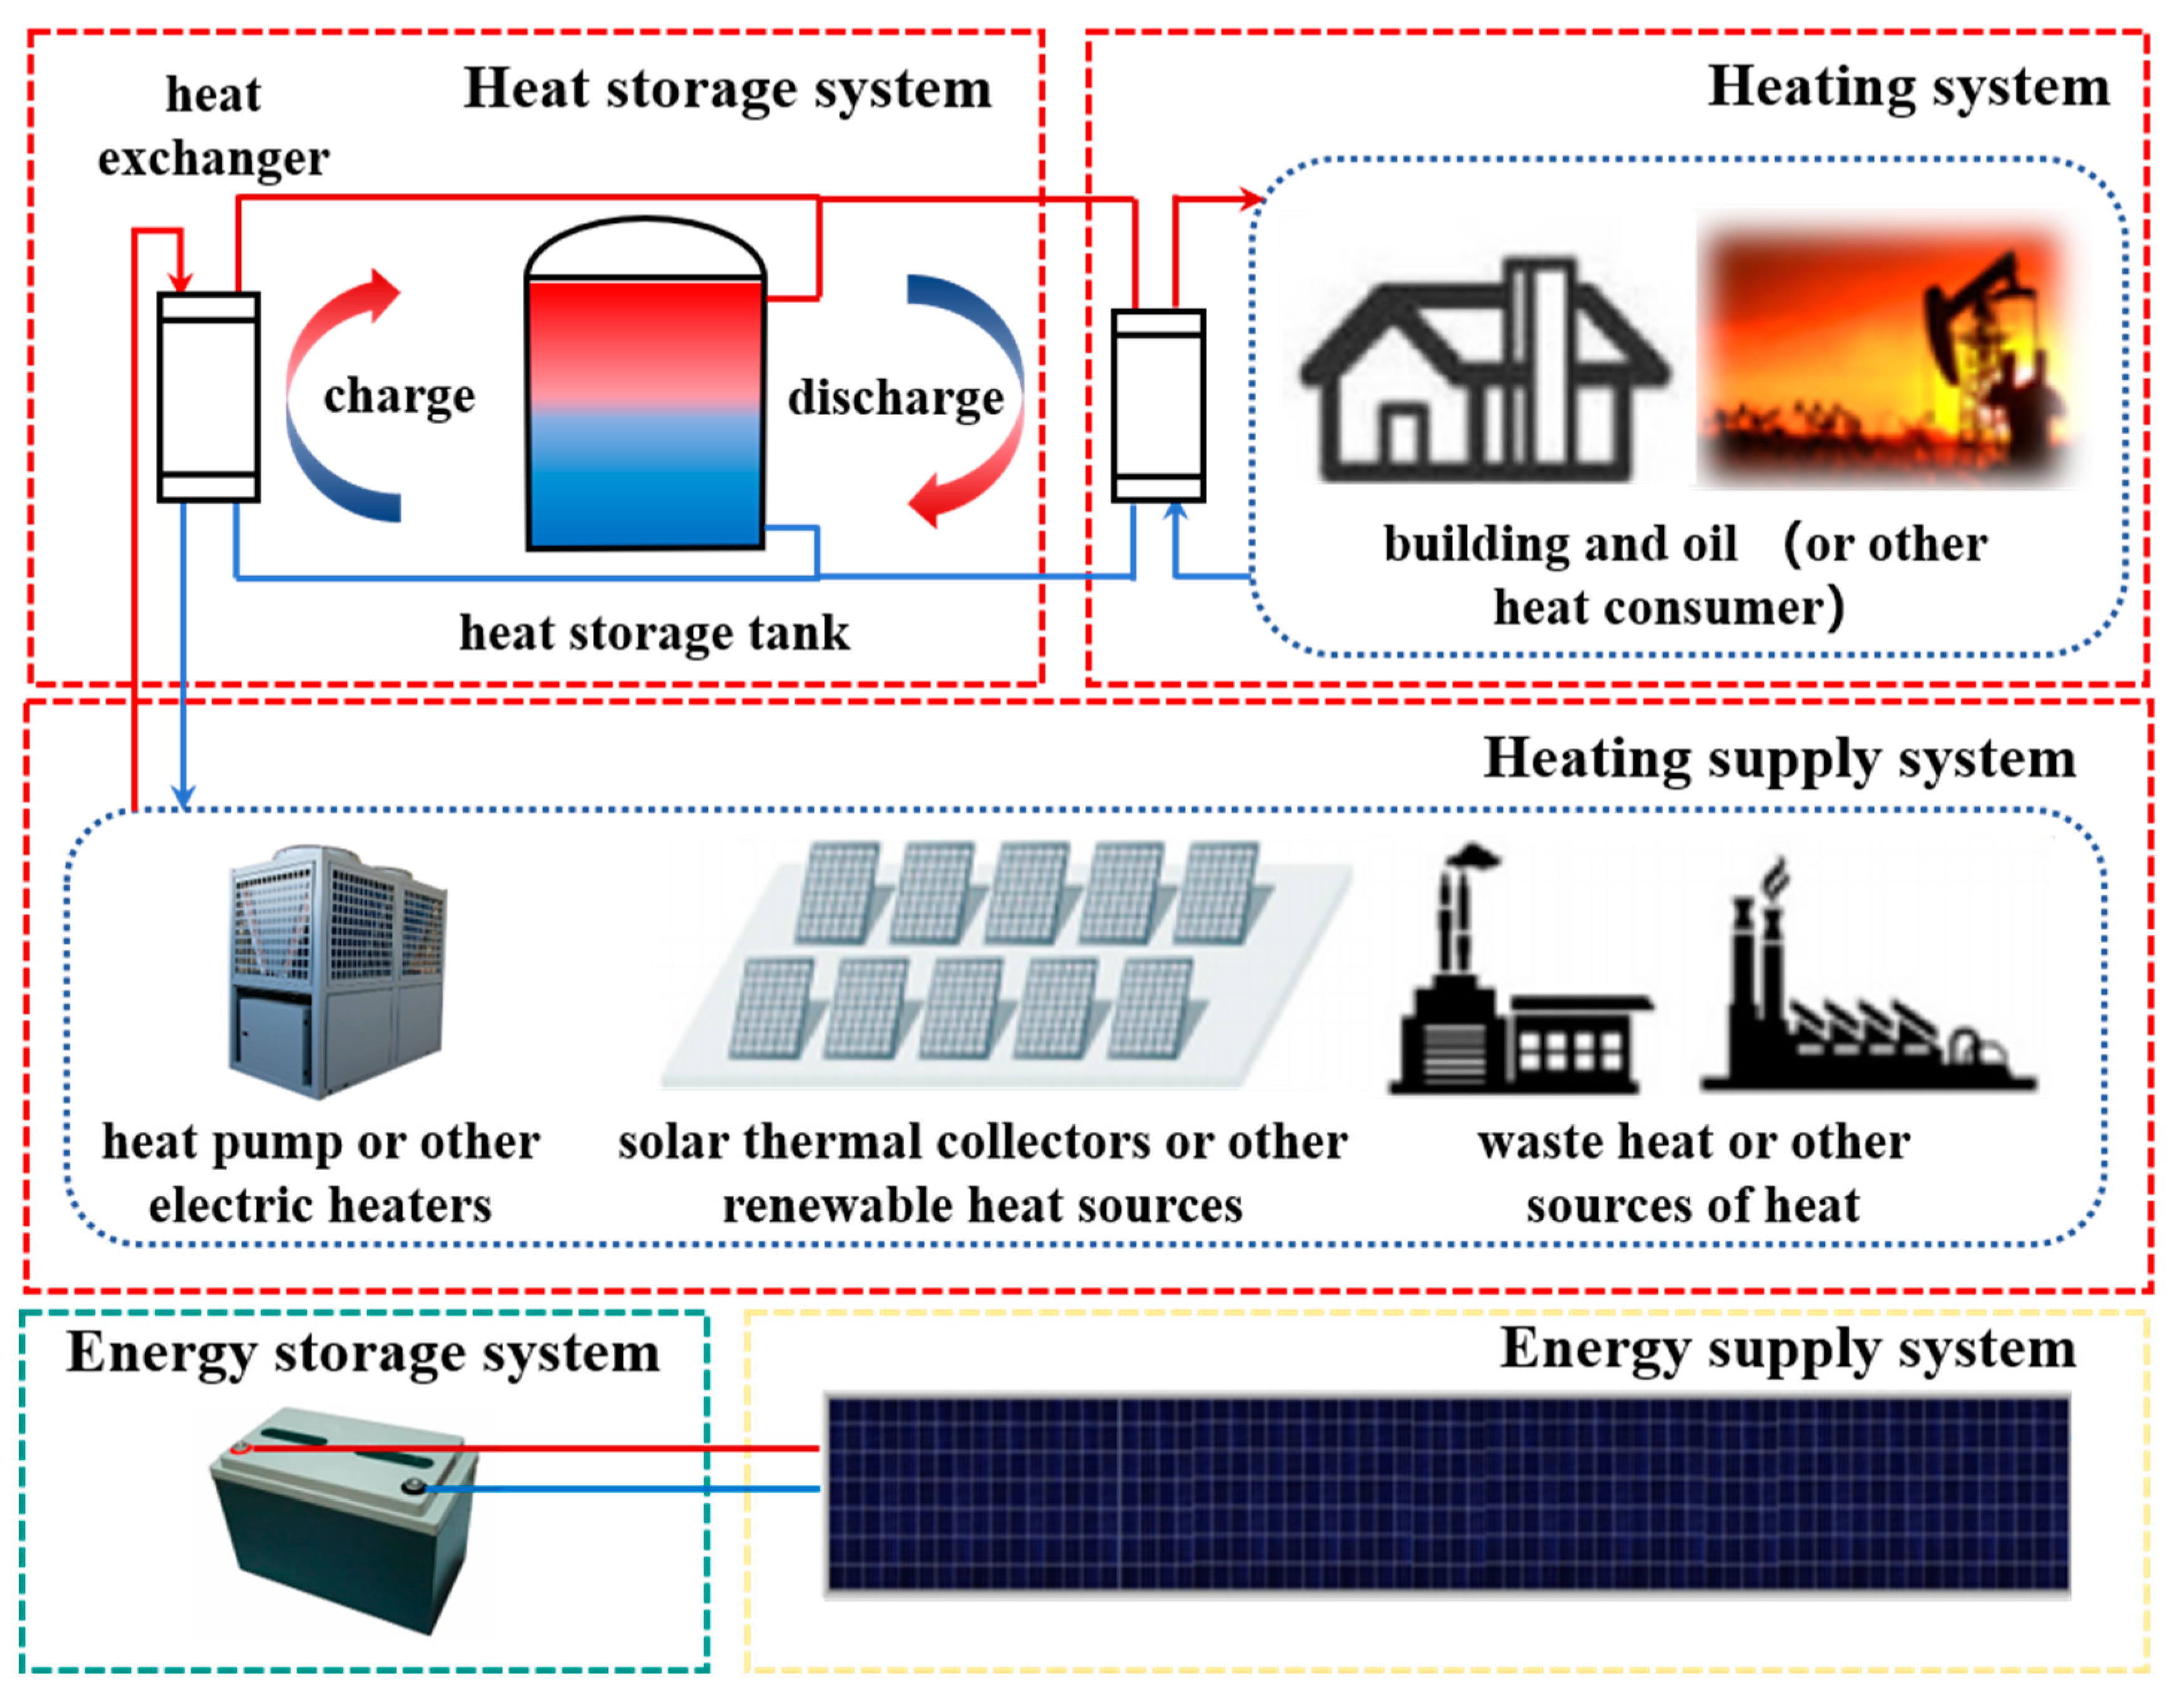
1. Introduction
2. Numerical Modelling
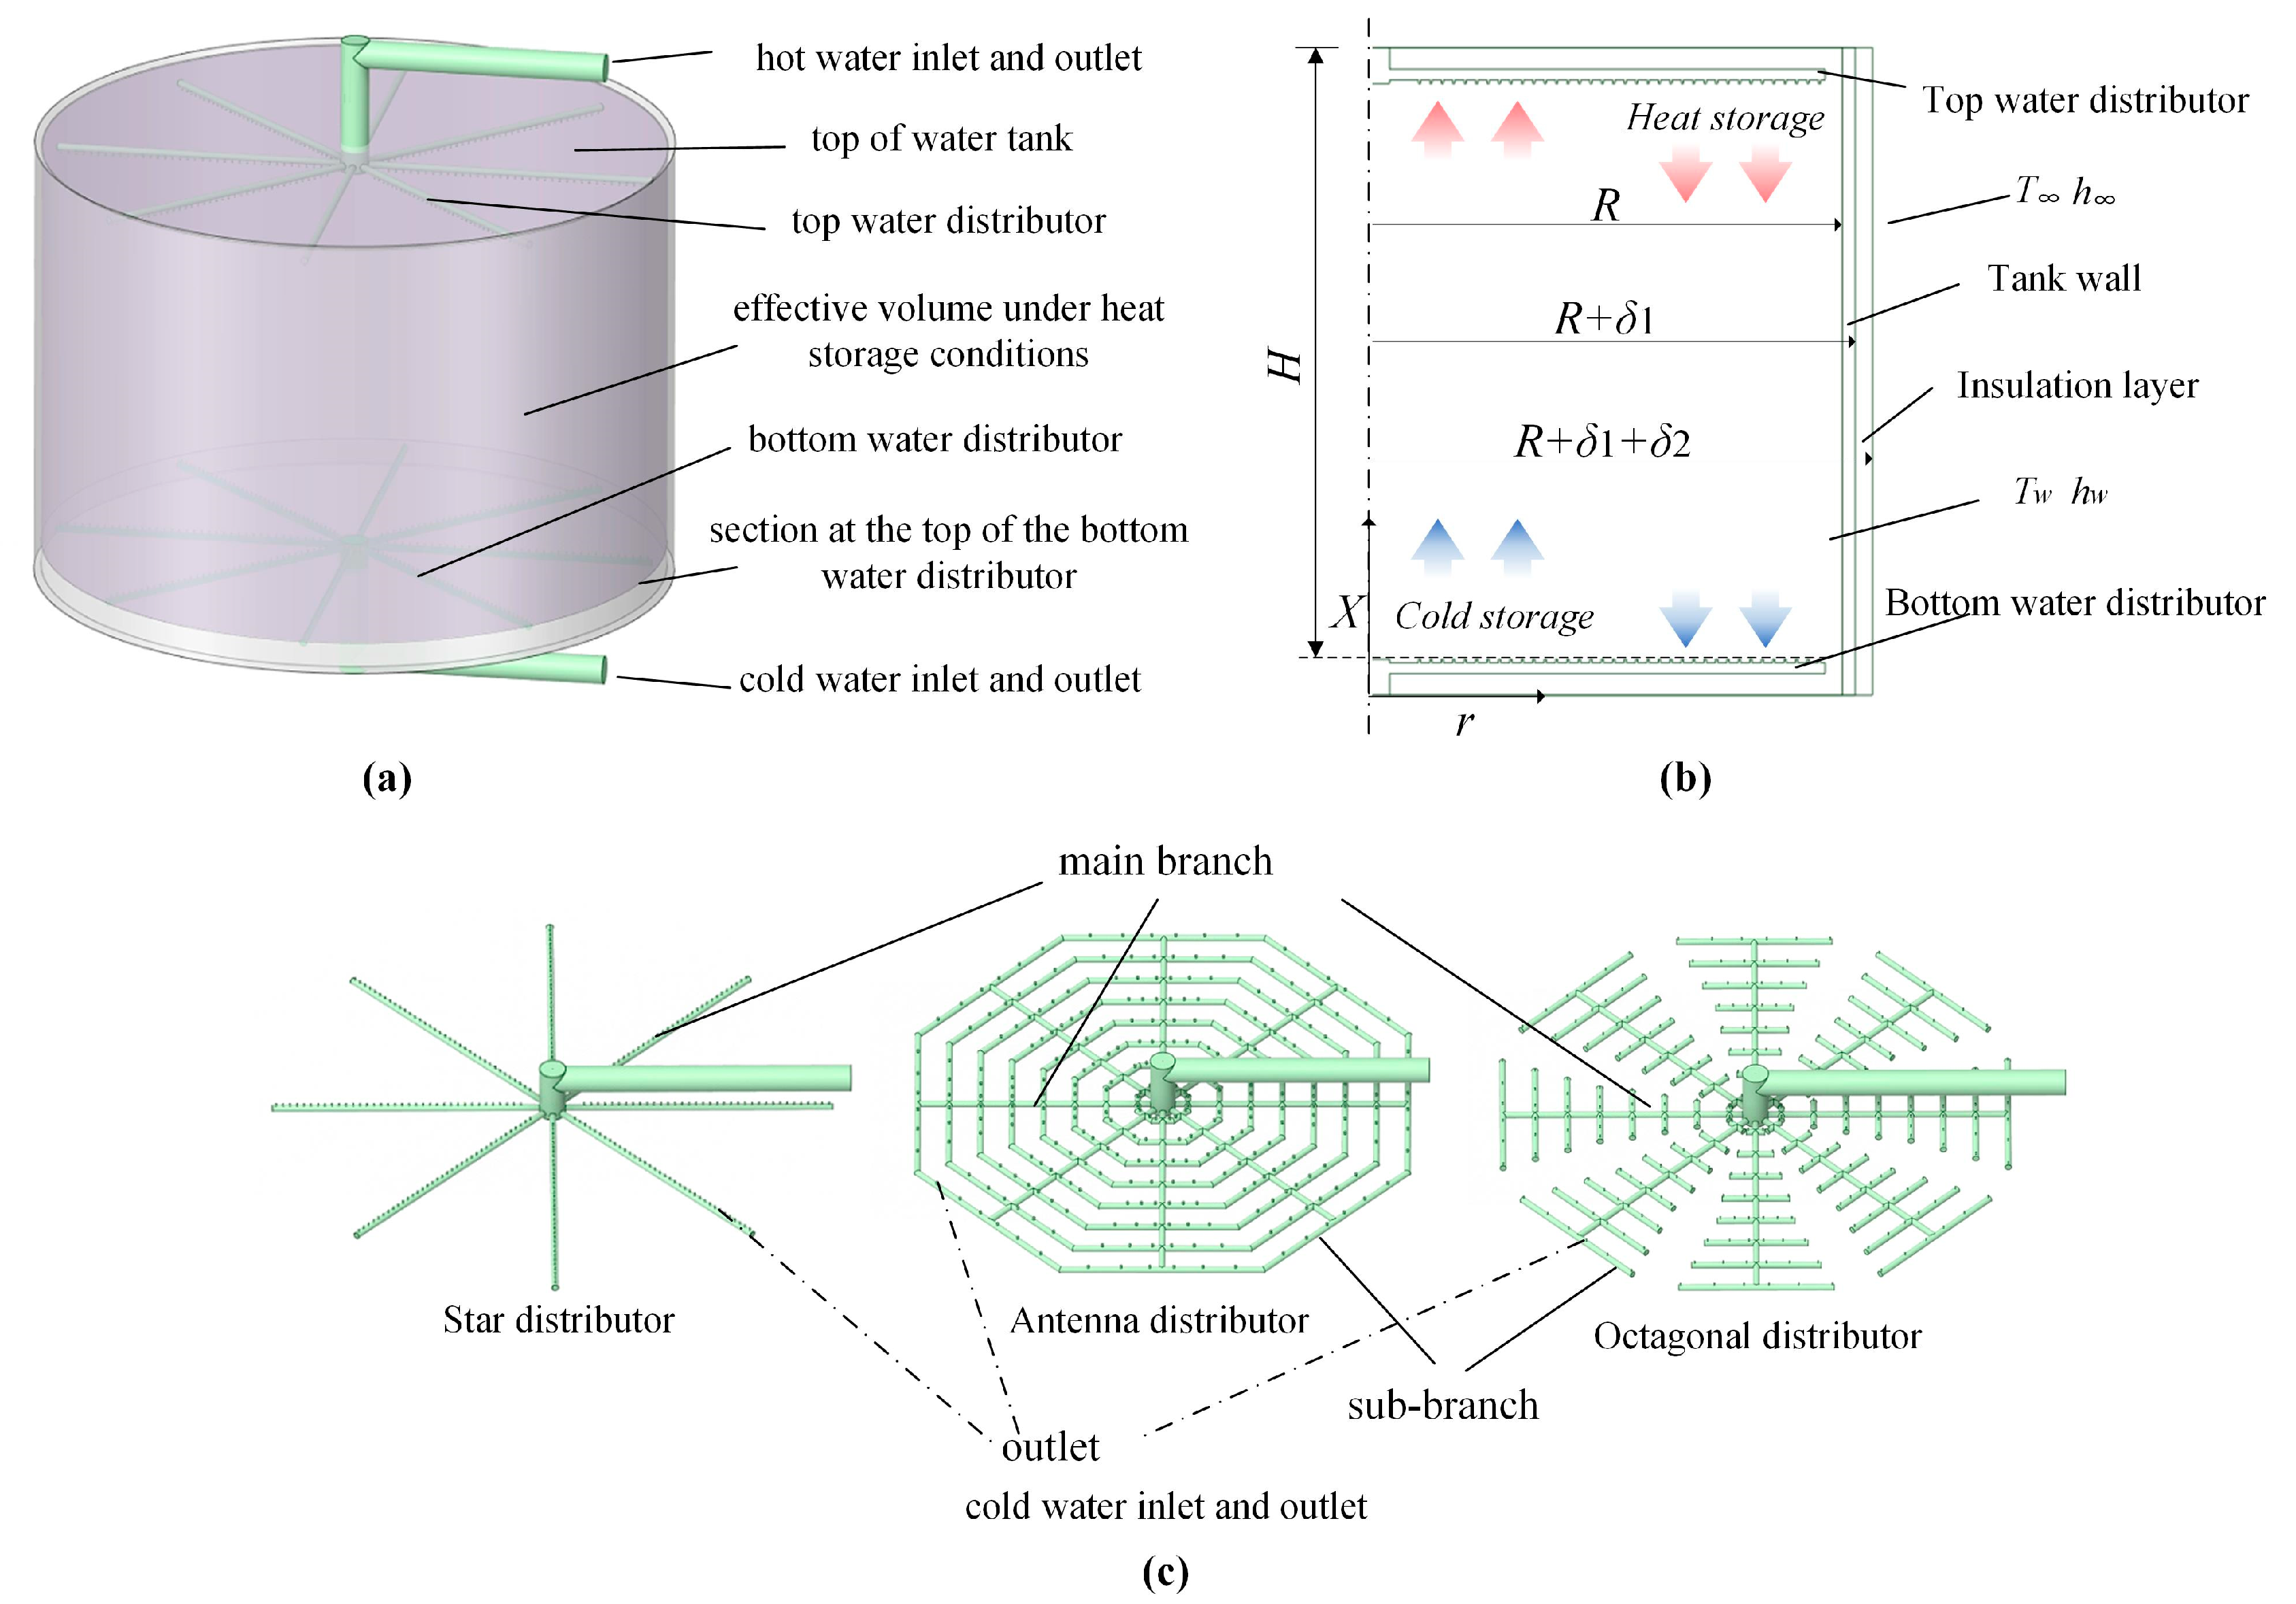
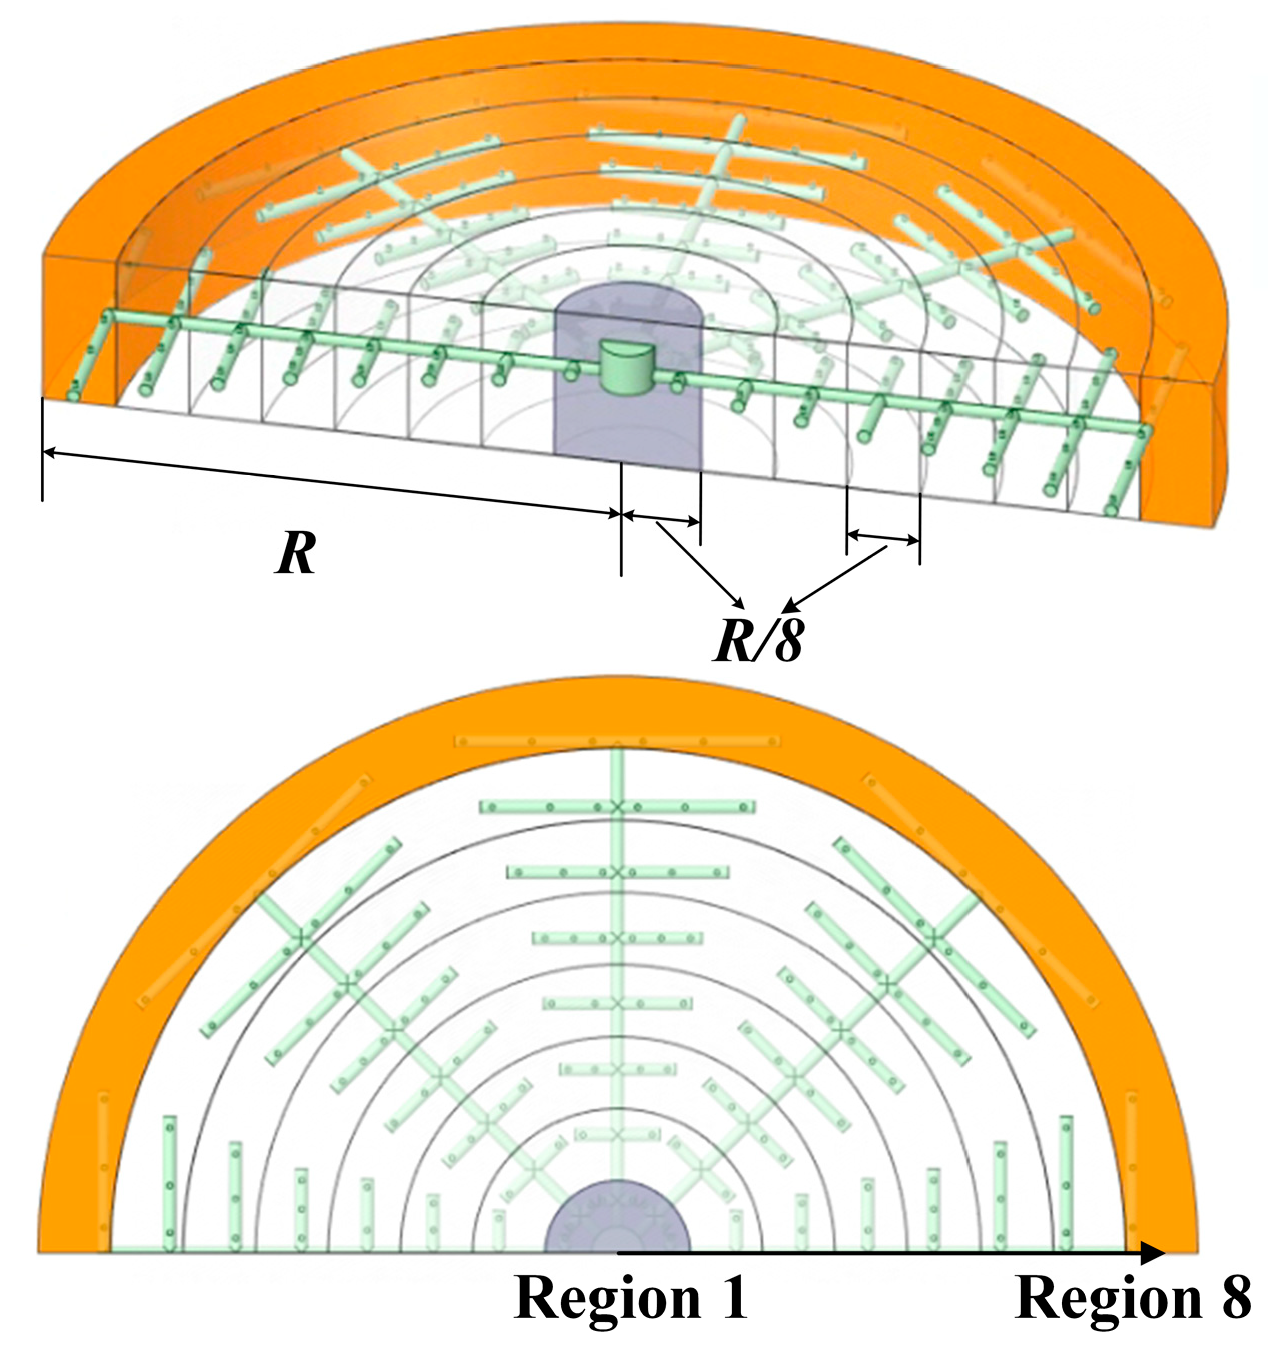
2.1. Geometry Description
2.2. Governing Equations
2.3. Parameter Dimensionless
2.4. Energy Storage Efficiency
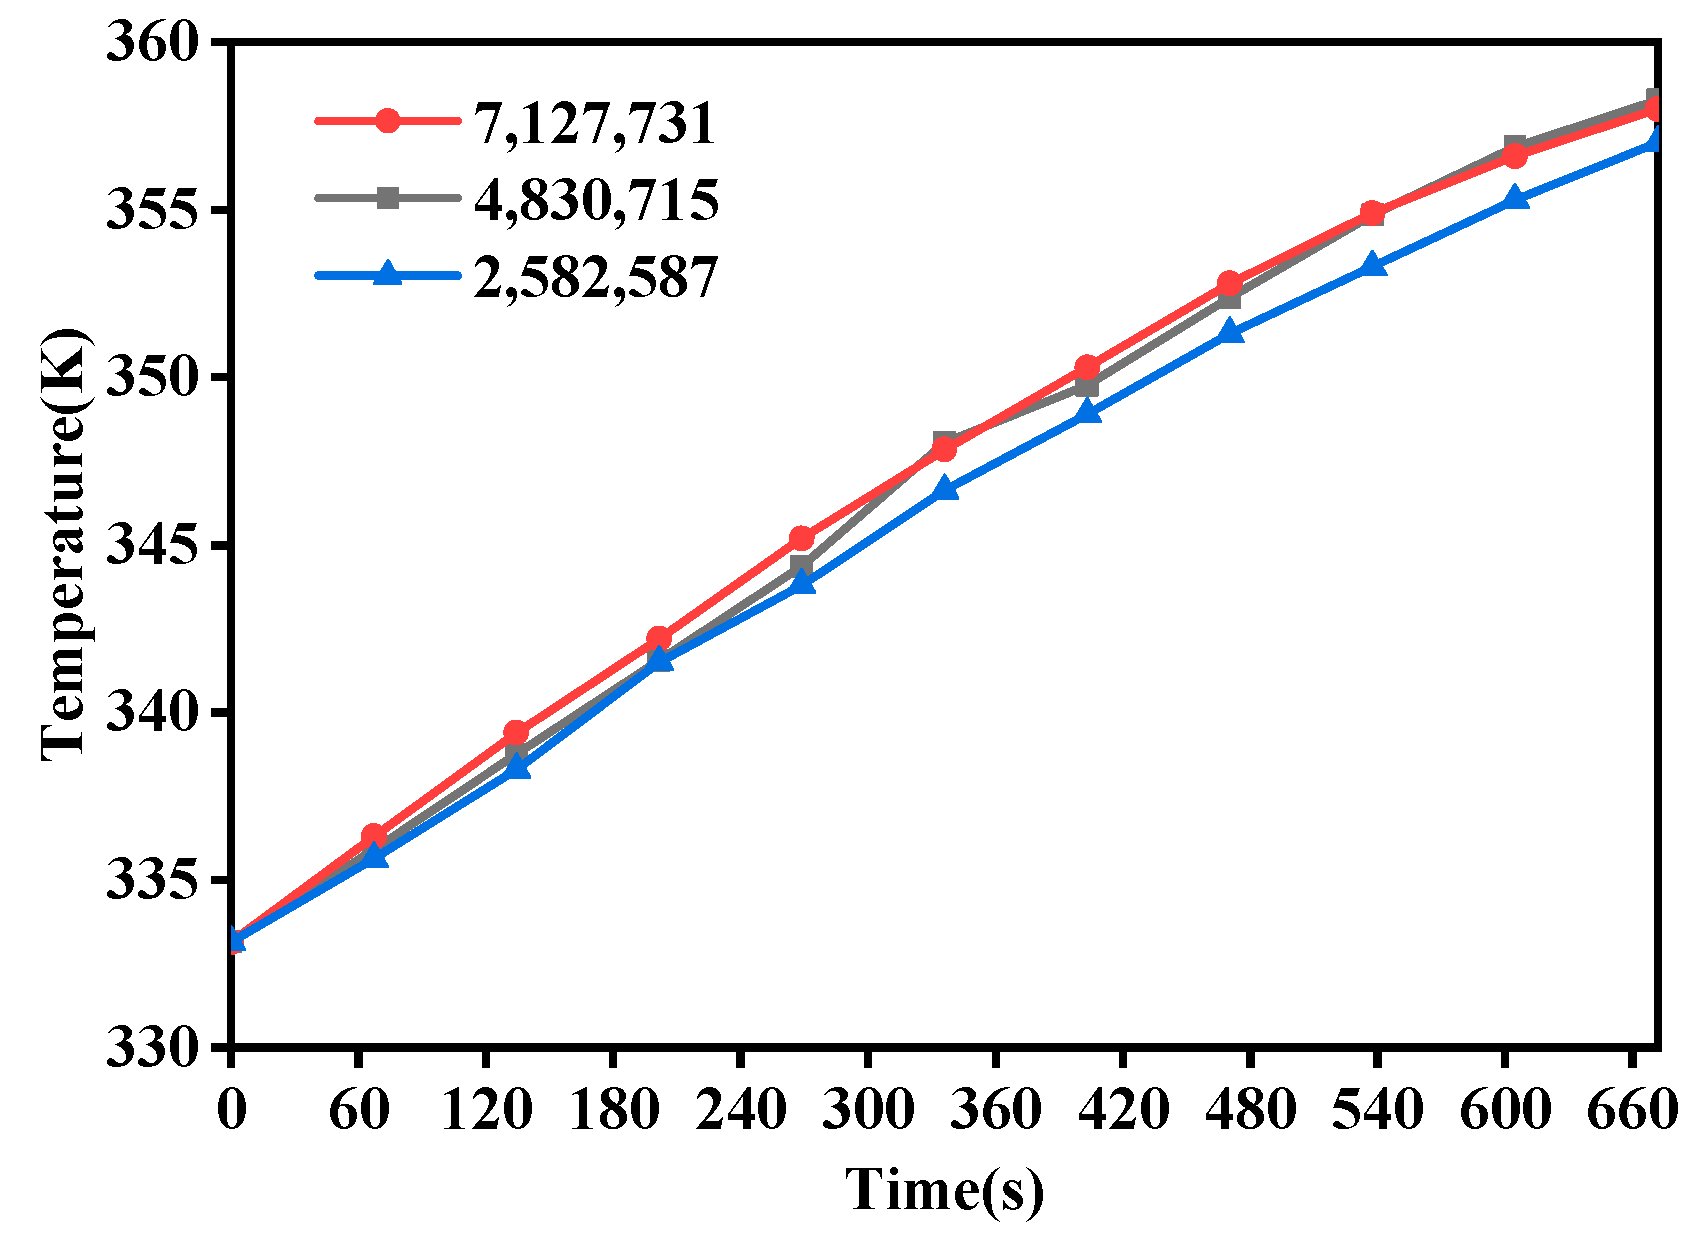
2.5. Grid Independence Analysis
3. Calculation Results and Discussion
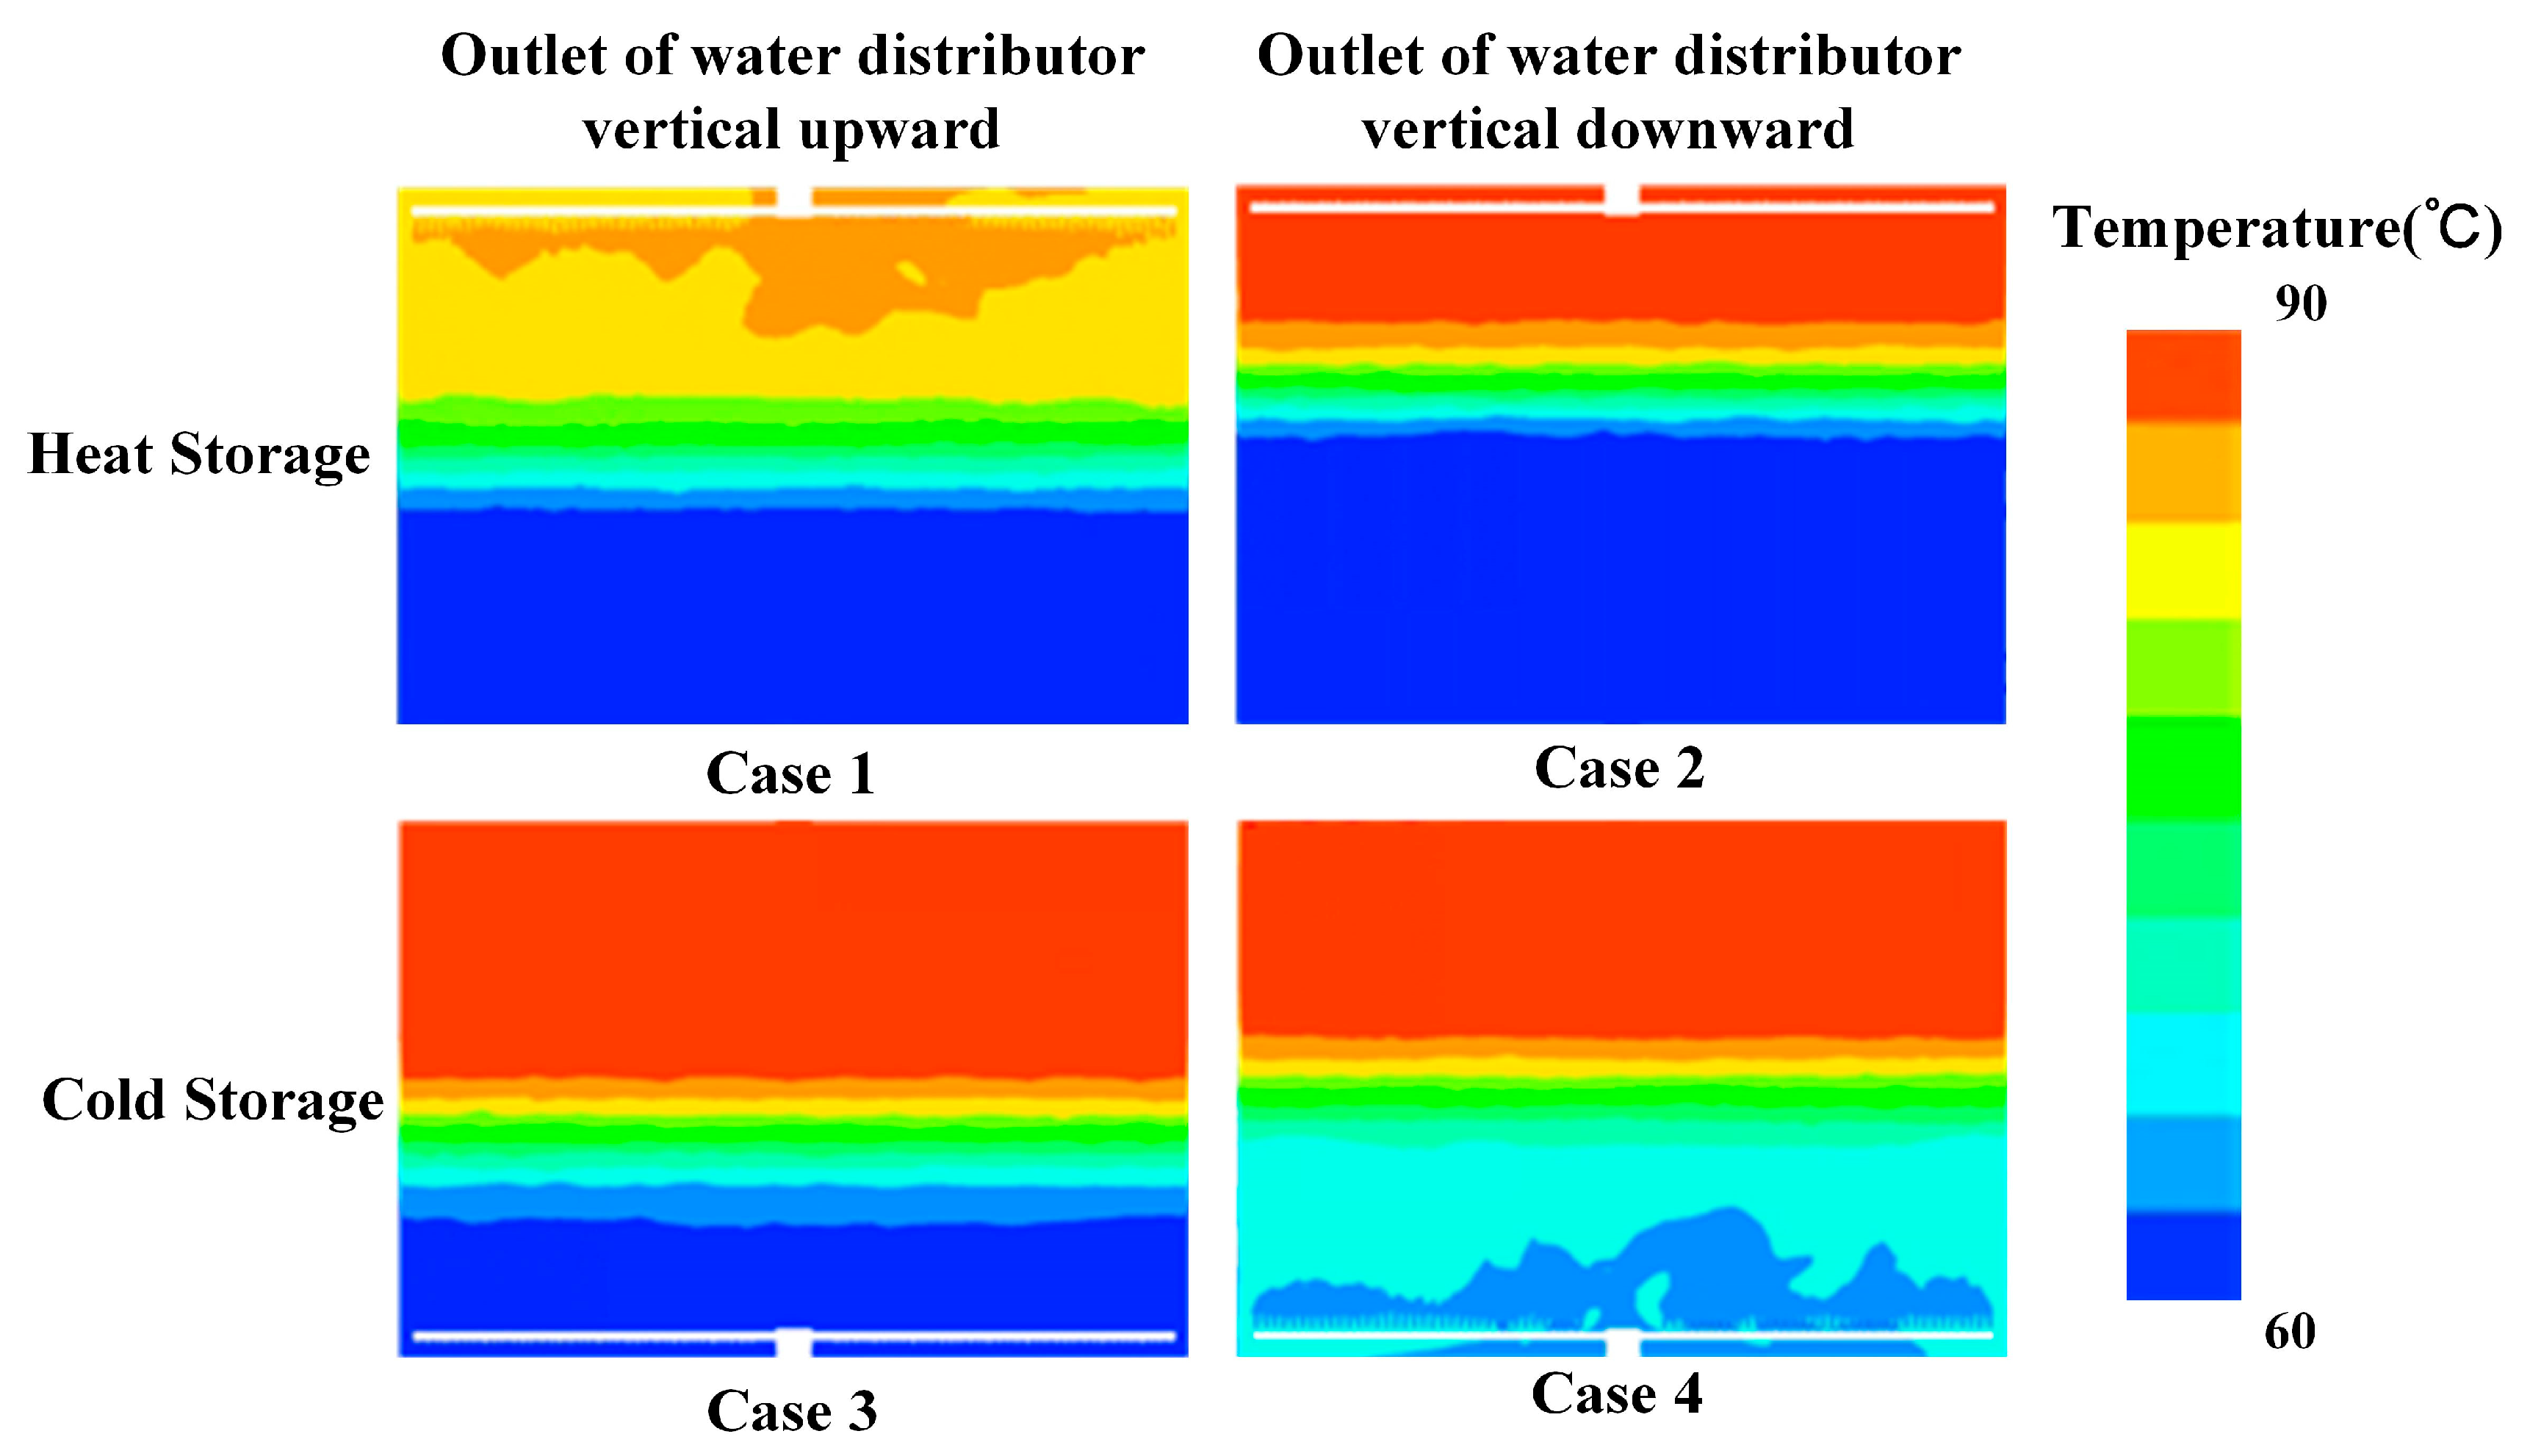
3.1. Influence of the Direction of Installation of the Water Distributor on the Effectiveness of Heat Storage
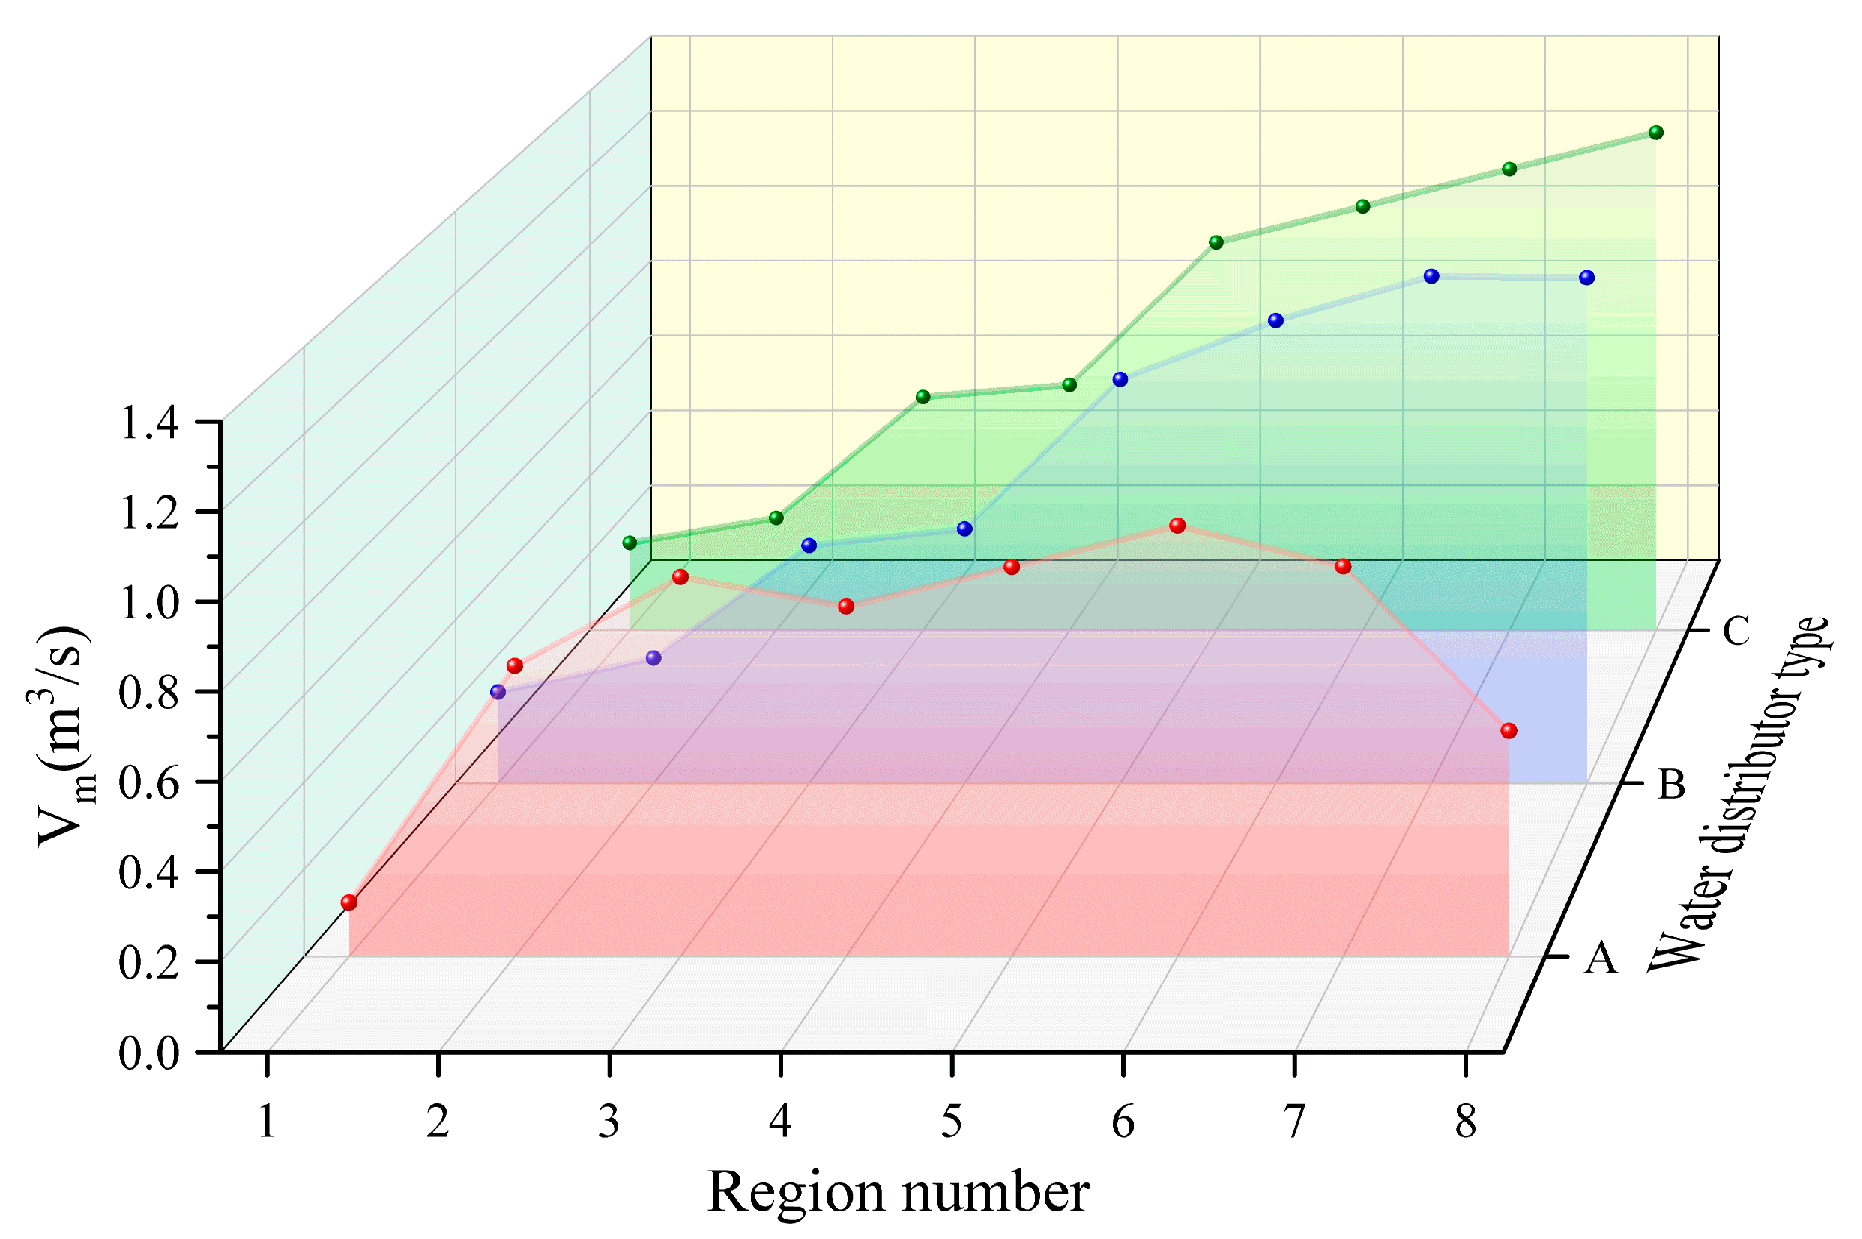
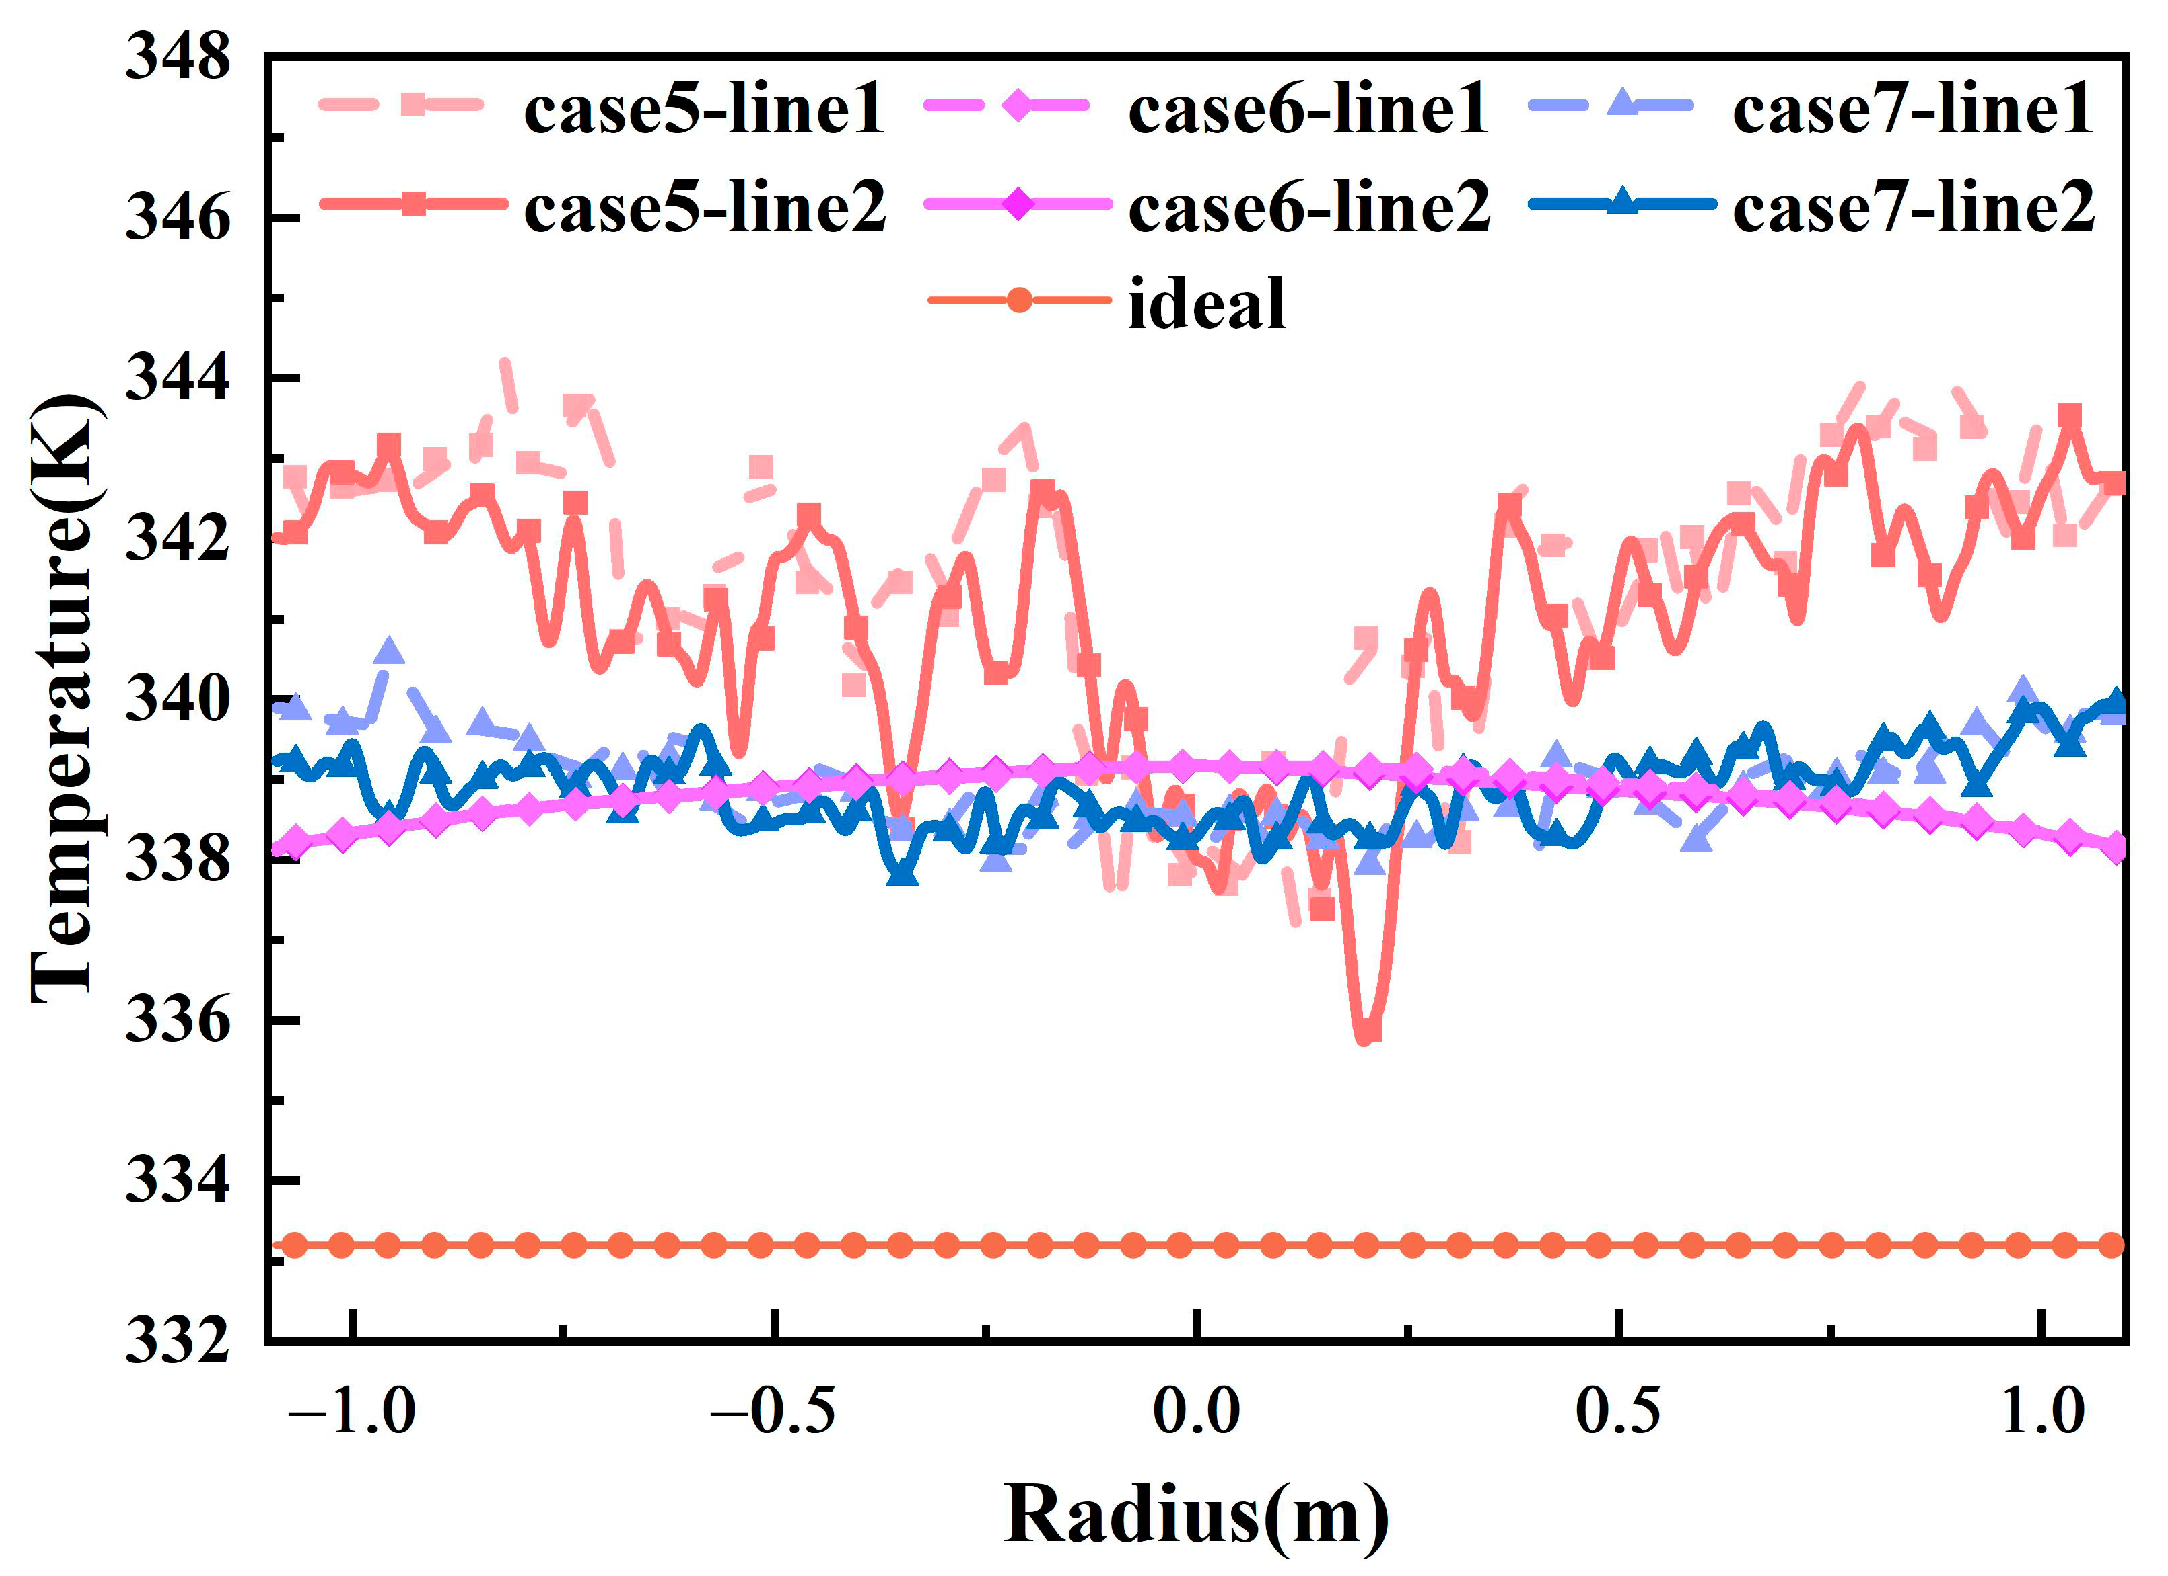
3.2. Influence of Water Distributor Construction on the Effectiveness of Heat Storage
4. Conclusions
- (1)
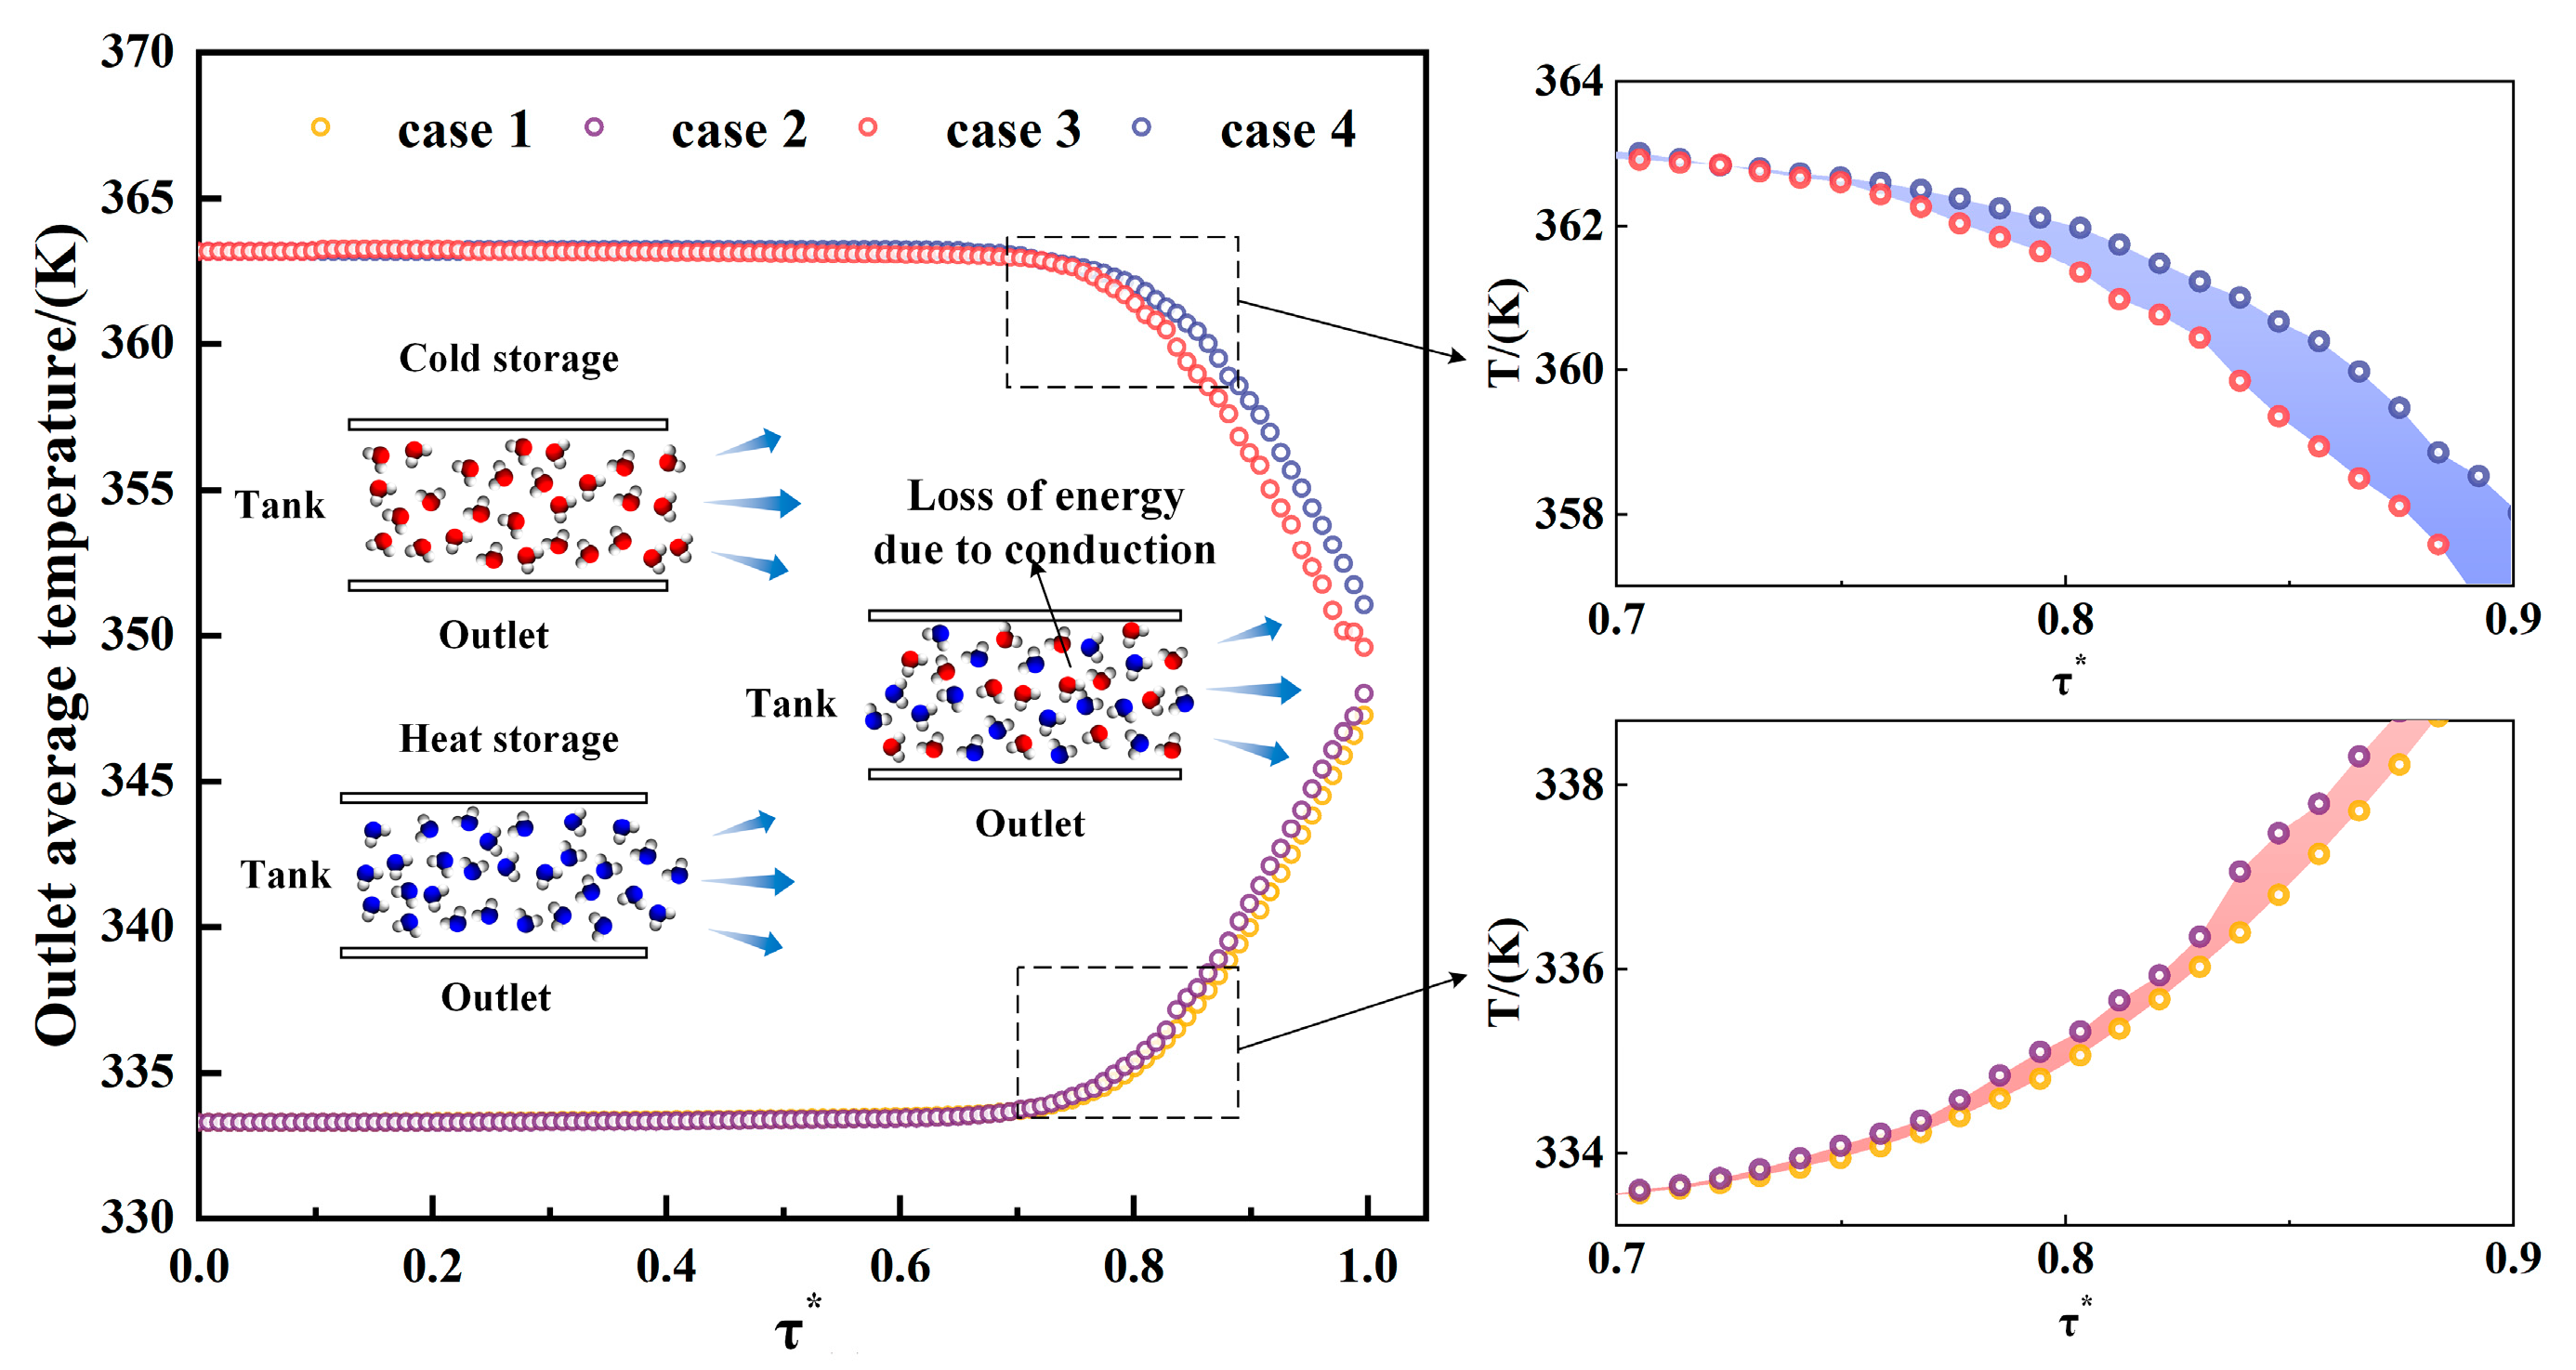
- The fluid injected from the outlet of the water distributor exhibits inertia as it enters the tank, and when the outlet direction aligns with the movement direction of the naturally stratified fluid, it promotes the formation of the thermocline and enhances stratification. Thus, in the tank, the upper water distributor should be installed with the outlet facing upwards, and the lower water distributor should be installed with the outlet facing downwards.
- (2)
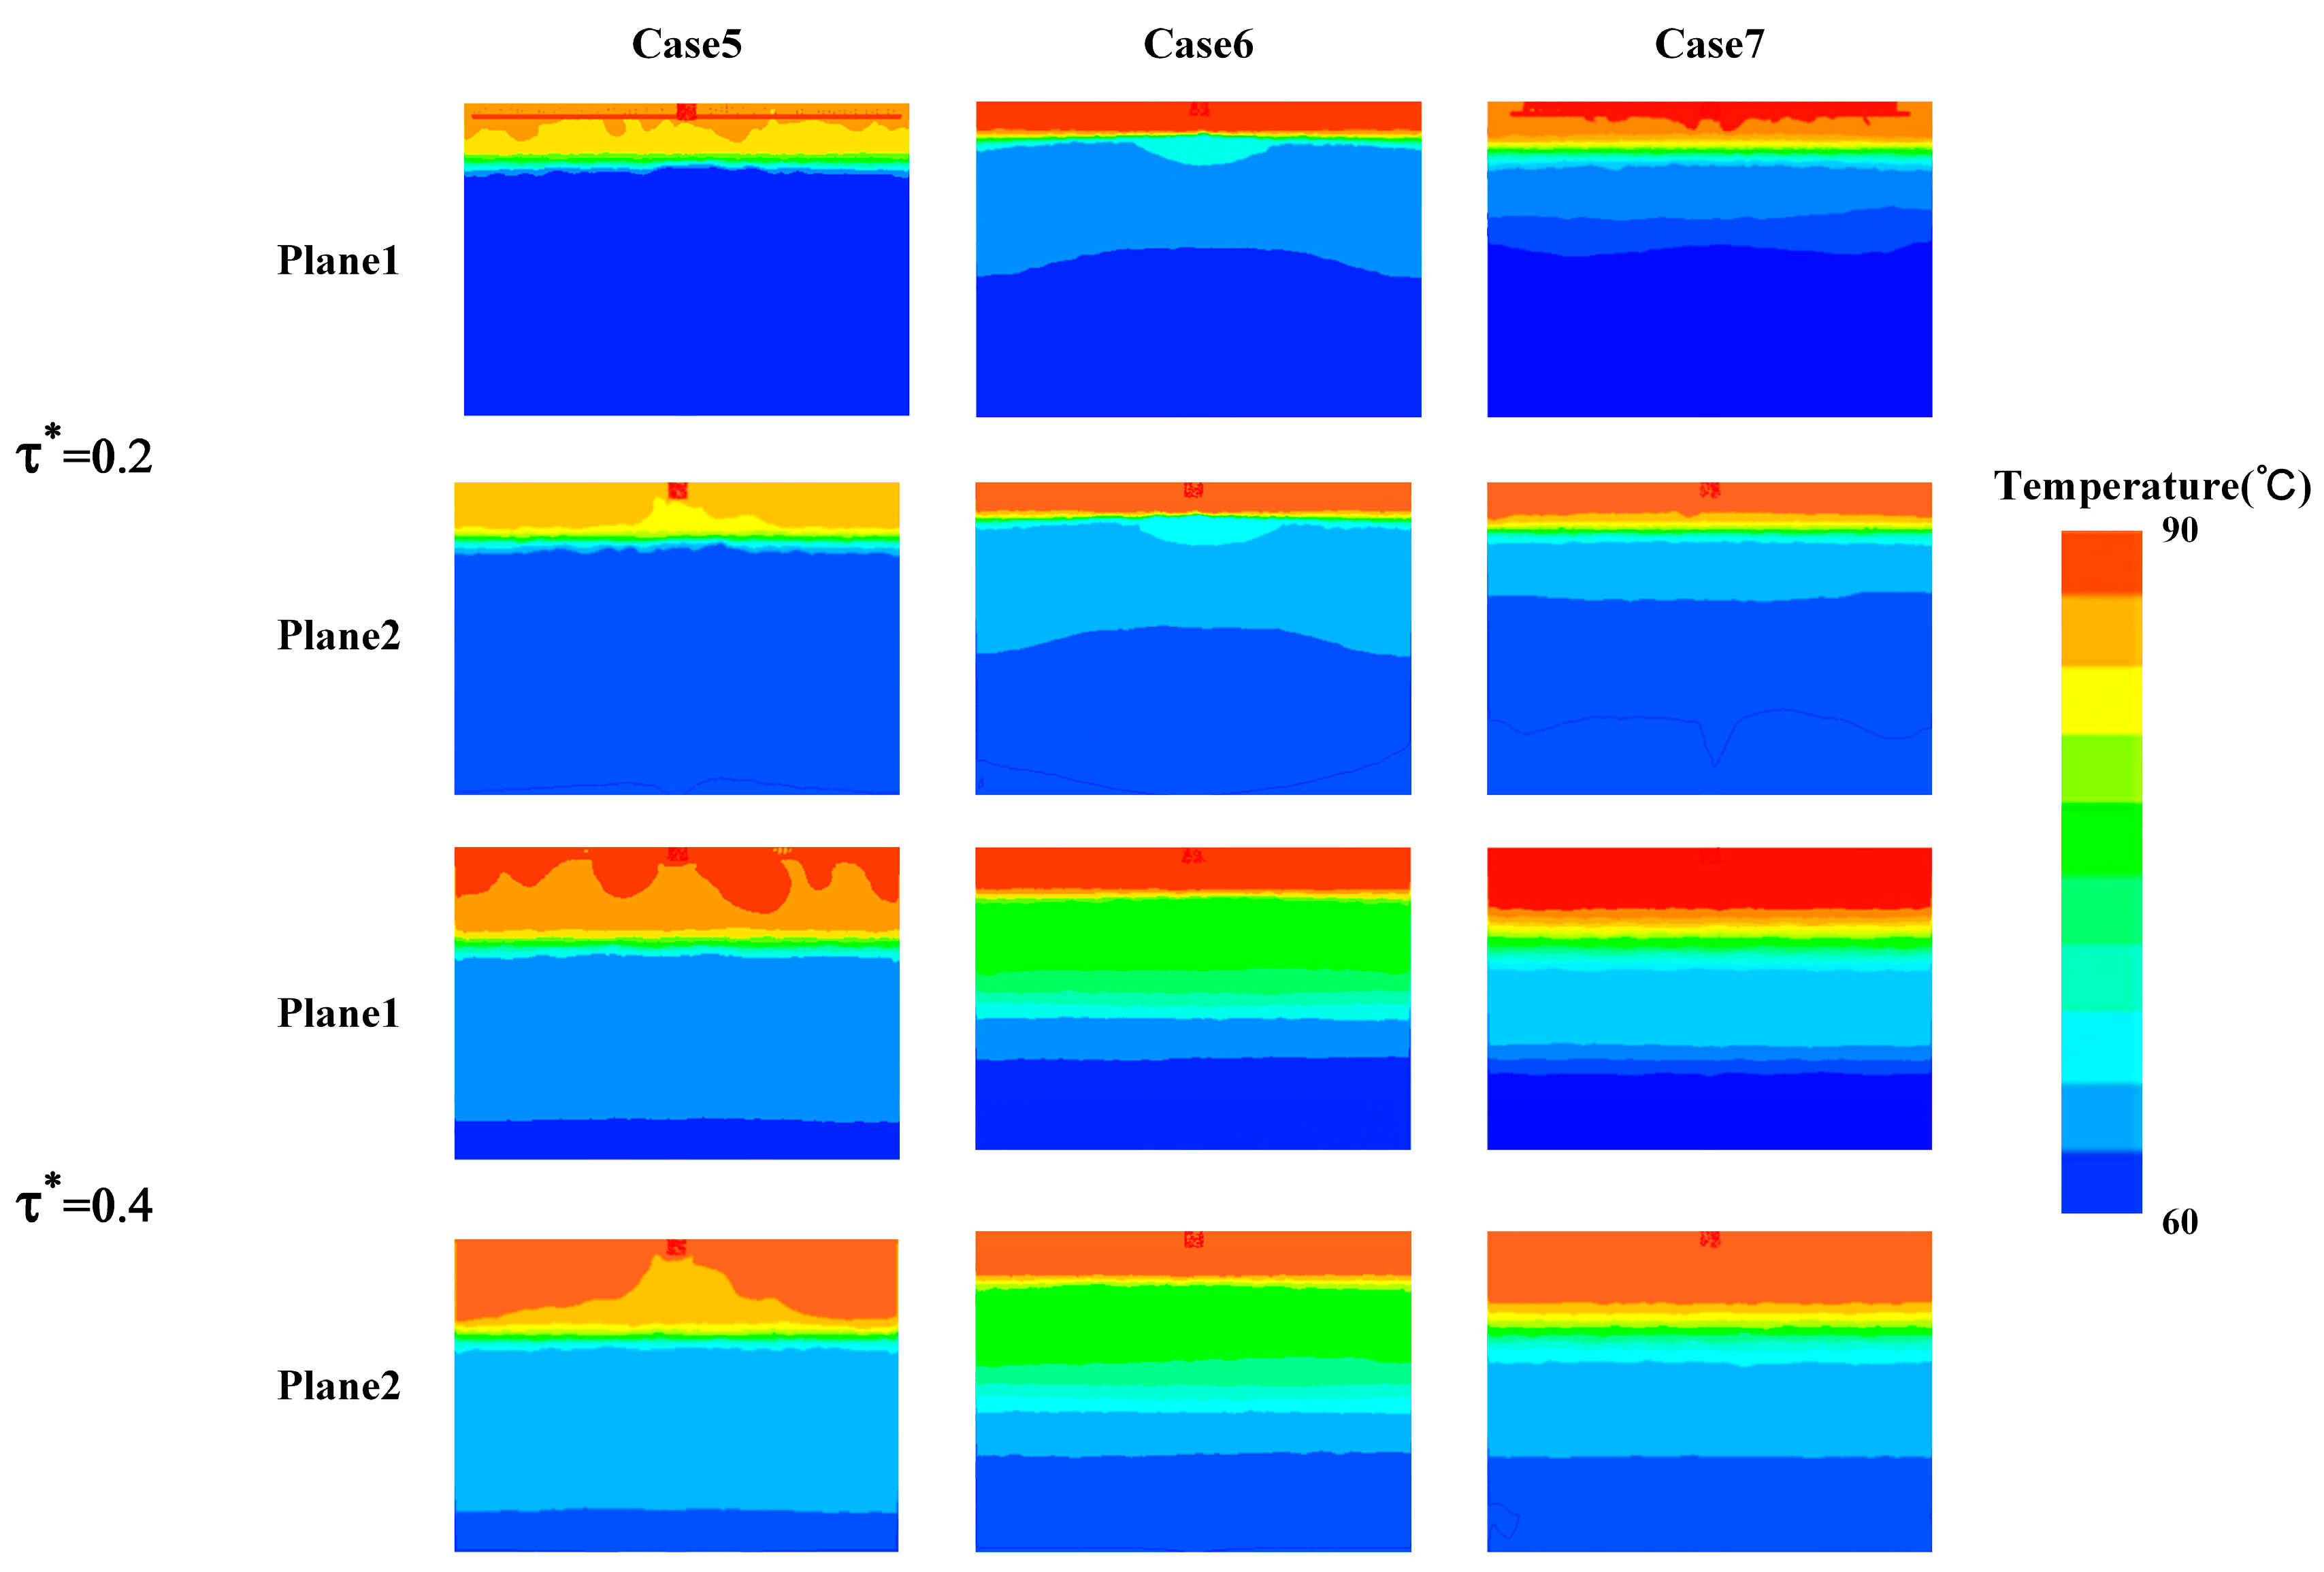
- The energy storage process is divided into three stages based on changes in thermal storage efficiency. In the initial stage, the use of antenna-type and octagonal water distributors enhances the temperature uniformity of the axial surface, reduces the thickness of the thermocline, and improves the degree of stratification. At this stage, the final energy storage efficiency is primarily influenced by the energy losses resulting from the mixing of hot and cold water.
- (3)
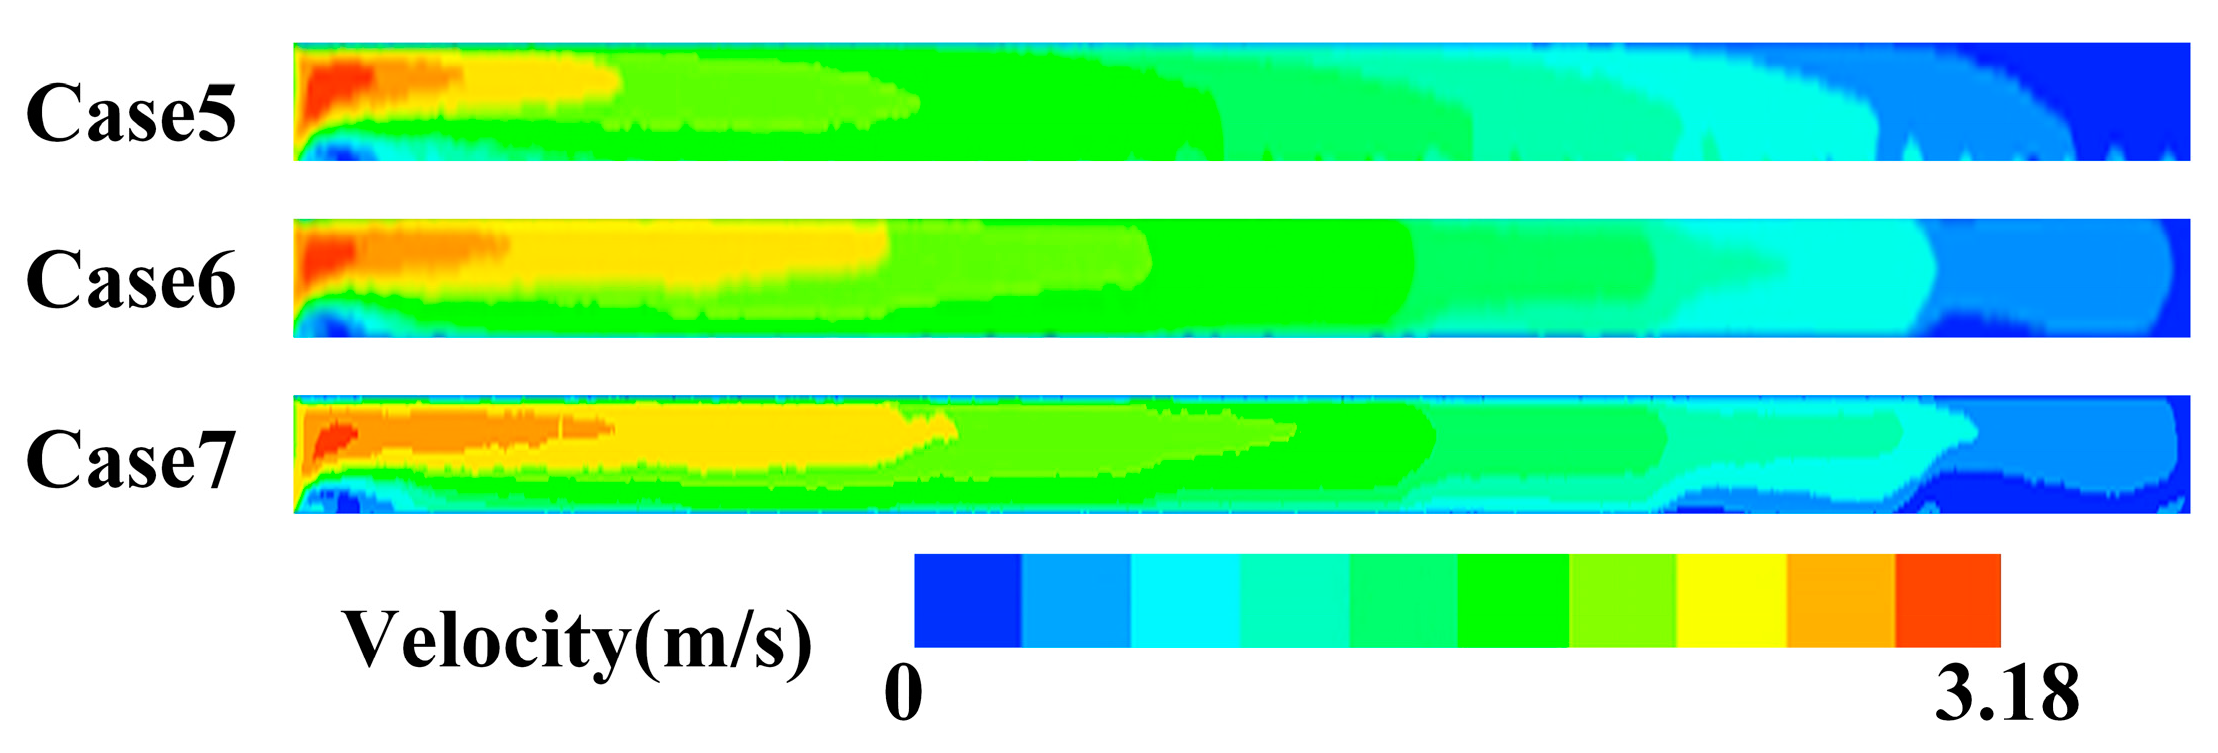
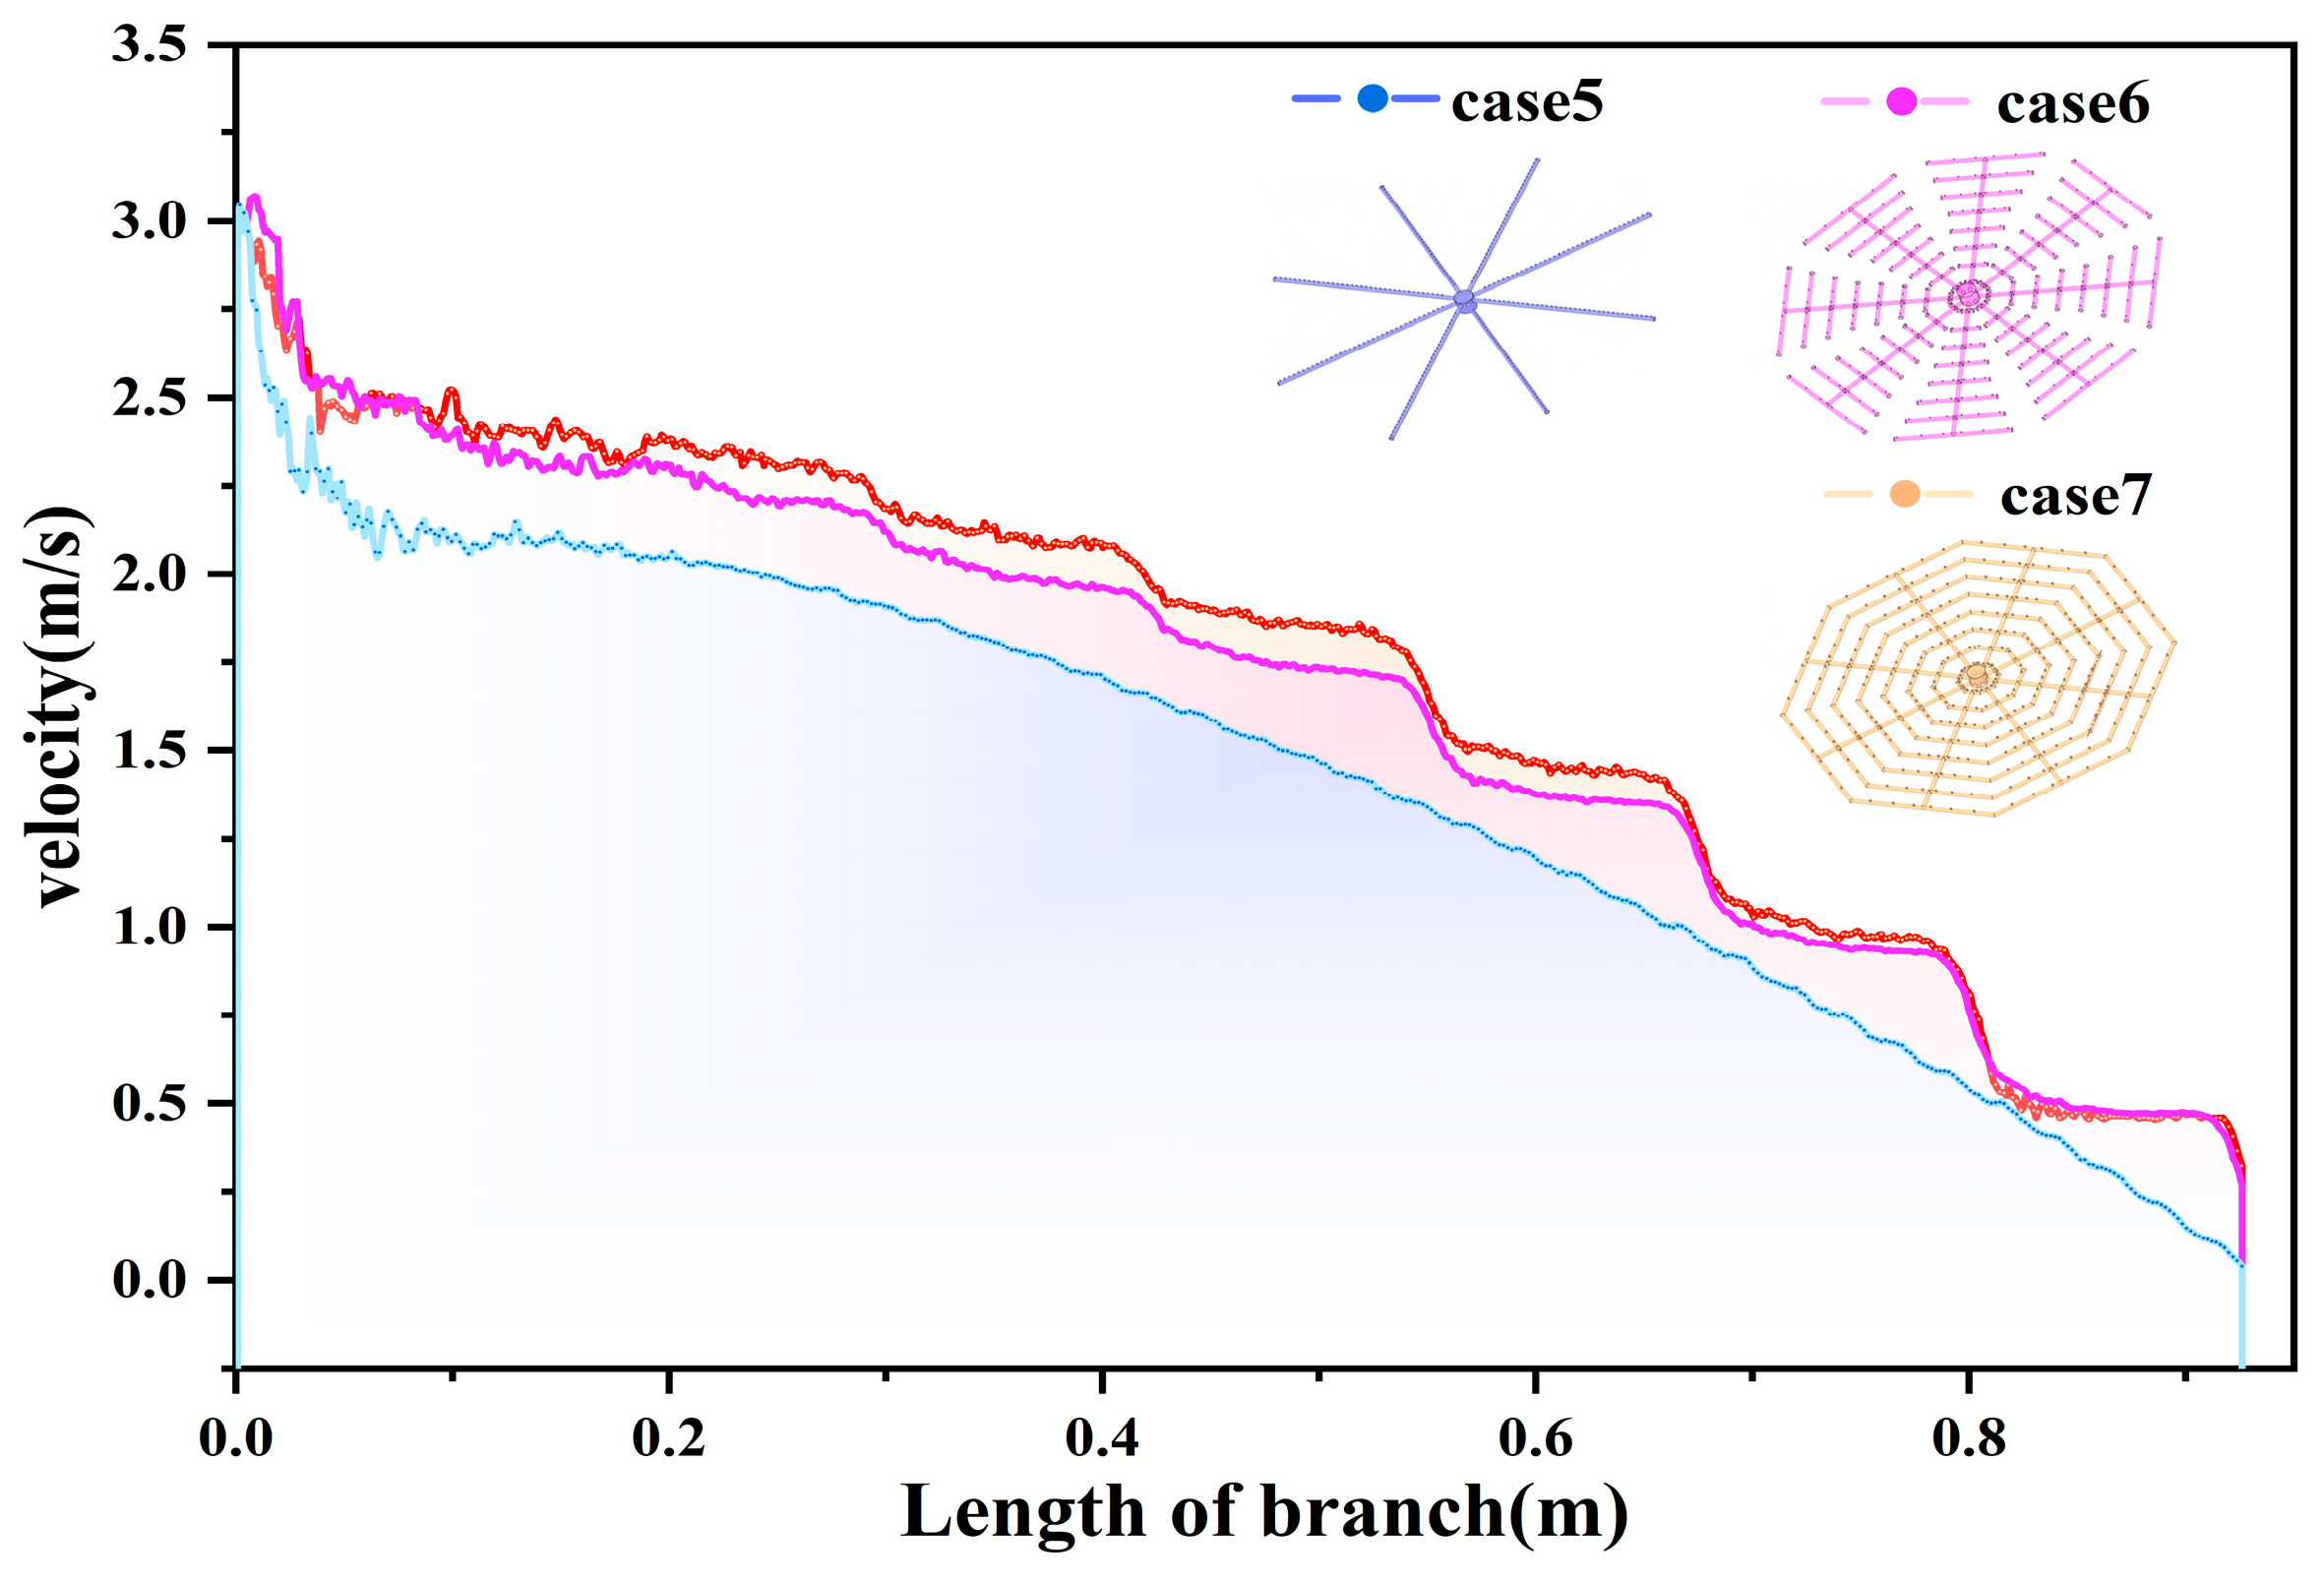
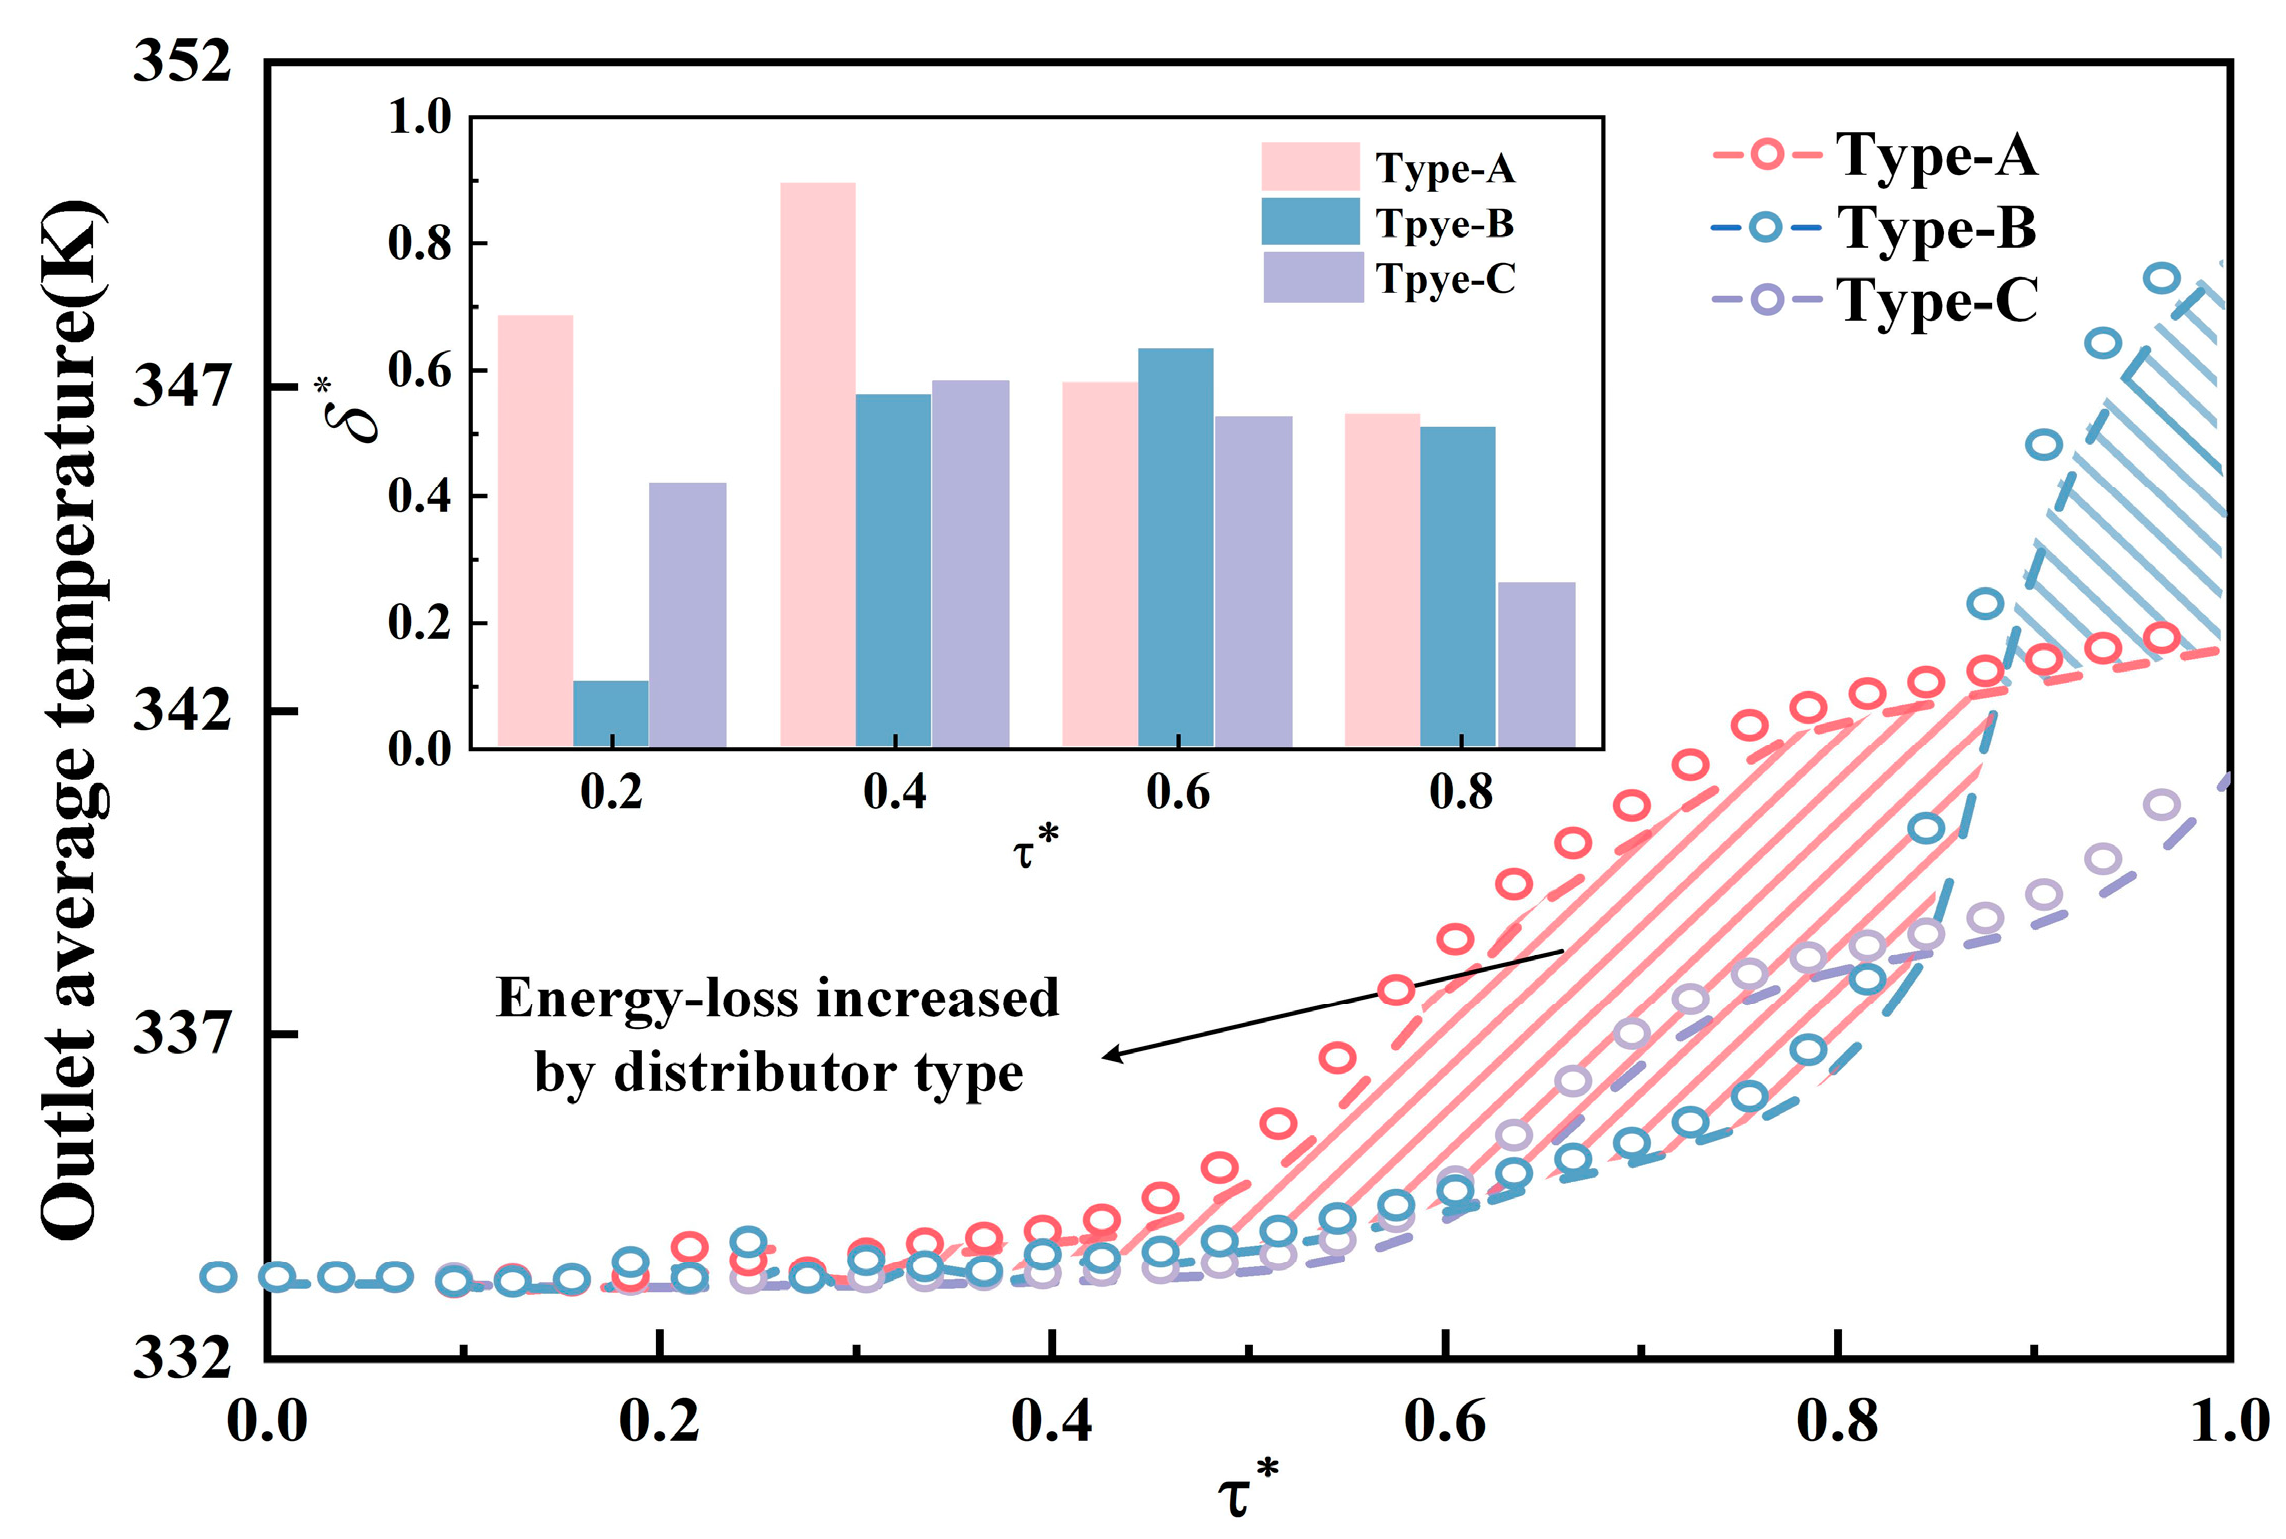
- In the development stage, the lower boundary of the thermocline reaches the exit position, leading to the exclusion of part of the hot water and a decrease in energy storage efficiency. Among the three structures, the designed octagonal water distribution exhibits the smallest energy loss and results in a 6.4% improvement compared to the star-type water distribution.
- (4)
- When the star-type water distributor is installed in the storage tank, the resulting difference in flow distribution will lead to an 8.3% reduction in thermal storage efficiency compared to the ideal process.
Author Contributions
Funding
Data Availability Statement
Conflicts of Interest
References
- Hoang, A.T.; Nguyen, X.P. Integrating renewable sources into energy system for smart city as a sagacious strategy towards clean and sustainable process. J. Clean. Prod. 2021, 305, 127161. [Google Scholar] [CrossRef]
- Seferlis, P.; Varbanov, P.S.; Papadopoulos, A.I.; Chin, H.H.; Klemeš, J.J. Sustainable design, integration, and operation for energy high-performance process systems. Energy 2021, 224, 120158. [Google Scholar] [CrossRef]
- Chang, C.; Xu, X.; Guo, X.; Rasakhodzhaev, B.; Zhao, M.; Yuan, G.J. Experimental and numerical study of ice storage and melting process of external melting ice coil. J. Energy Storage 2024, 77, 109961. [Google Scholar] [CrossRef]
- Yang, S.; Nie, Z.; Wu, S.; Li, Z.; Wang, B.; Wu, W.; Chen, Z. A critical review of reservoir simulation applications in key thermal recovery processes: Lessons, opportunities, and challenges. Energy 2021, 35, 7387–7405. [Google Scholar] [CrossRef]
- Wang, Y.; Han, X.; Li, J.; Liu, R.; Wang, Q.; Huang, C.; Wang, X.; Zhang, L.; Lin, R. Review on oil displacement technologies of enhanced oil recovery: State-of-the-art and outlook. Energy Fuels 2023, 37, 2539–2568. [Google Scholar] [CrossRef]
- Mollah, M.B.; Zhao, J.; Niyato, D.; Lam, K.Y.; Zhang, X.; Ghias, A.M.; Koh, L.H.; Yang, L. Blockchain for future smart grid: A comprehensive survey. IEEE Internet Things J. 2020, 8, 18–43. [Google Scholar] [CrossRef]
- Hossein Motlagh, N.; Mohammadrezaei, M.; Hunt, J.; Zakeri, B. Internet of Things (IoT) and the energy sector. Energies 2020, 13, 494. [Google Scholar] [CrossRef]
- Njoku, H.; Ekechukwu, O.; Onyegegbu, S.O. Analysis of stratified thermal storage systems: An overview. Heat Mass Transf. 2014, 50, 1017–1030. [Google Scholar] [CrossRef]
- Jebamalai, J.M.; Marlein, K.; Laverge, J. Influence of centralized and distributed thermal energy storage on district heating network design. Energy 2020, 202, 117689. [Google Scholar] [CrossRef]
- Lou, W.; Xie, B.; Aubril, J.; Fan, Y.; Luo, L.; Arrivé, A. Optimized flow distributor for stabilized thermal stratification in a single-medium thermocline storage tank: A numerical and experimental study. Energy 2023, 263, 125709. [Google Scholar] [CrossRef]
- Xie, B.; Baudin, N.; Soto, J.; Fan, Y.; Luo, L. Wall impact on efficiency of packed-bed thermocline thermal energy storage system. Energy 2022, 247, 123503. [Google Scholar] [CrossRef]
- Gajbhiye, P.; Salunkhe, N.; Kedare, S.; Bose, M. Experimental investigation of single media thermocline storage with eccentrically mounted vertical porous flow distributor. Sol. Energy 2018, 162, 28–35. [Google Scholar] [CrossRef]
- König-Haagen, A.; Höhlein, S.; Brüggemann, D. Detailed exergetic analysis of a packed bed thermal energy storage unit in combination with an Organic Rankine Cycle. Appl. Therm. Eng. 2020, 165, 114583. [Google Scholar] [CrossRef]
- Yang, Z.; Chen, H.; Wang, L.; Sheng, Y.; Wang, Y. Comparative study of the influences of different water tank shapes on thermal energy storage capacity and thermal stratification. Renew. Energy 2016, 85, 31–44. [Google Scholar] [CrossRef]
- Chen, J.; Xu, H.; Wang, Z.; Han, S. Thermal Performance Study of a Water Tank for a Solar System with a Fresnel Lens. J. Sol. Energy Eng. 2018, 140, 051005. [Google Scholar] [CrossRef]
- Li, G. Sensible heat thermal storage energy and exergy performance evaluations. Renew. Sustain. Energy Rev. 2016, 53, 897–923. [Google Scholar] [CrossRef]
- Ievers, S.; Lin, W. Numerical simulation of three-dimensional flow dynamics in a hot water storage tank. Appl. Energy 2009, 86, 2604–2614. [Google Scholar] [CrossRef]
- Khurana, H.; Tiwari, S.; Majumdar, R.; Saha, S.K. Comparative evaluation of circular truncated-cone and paraboloid shapes for thermal energy storage tank based on thermal stratification performance. J. Energy Storage 2021, 34, 102191. [Google Scholar] [CrossRef]
- Wang, Z.; Zhang, H.; Dou, B.; Huang, H.; Wu, W.; Wang, Z. Experimental and numerical research of thermal stratification with a novel inlet in a dynamic hot water storage tank. Renew. Energy 2017, 111, 353–371. [Google Scholar] [CrossRef]
- Dragsted, J.; Furbo, S.; Dannemand, M.; Bava, F. Thermal stratification built up in hot water tank with different inlet stratifiers. Sol. Energy 2017, 147, 414–425. [Google Scholar] [CrossRef]
- Rahman, A.; Smith, A.D.; Fumo, N. Performance modeling and parametric study of a stratified water thermal storage tank. Appl. Therm. Eng. 2016, 100, 668–679. [Google Scholar] [CrossRef]
- Yaïci, W.; Ghorab, M.; Entchev, E.; Hayden, S. Three-dimensional unsteady CFD simulations of a thermal storage tank performance for optimum design. Appl. Therm. Eng. 2013, 60, 152–163. [Google Scholar] [CrossRef]
- Nelson, J.; Balakrishnan, A.; Murthy, S.S. Experiments on stratified chilled-water tanks: Expériences menées avec des reservoirs d’accumulation d’eau glacée à stratification. Int. J. Refrig. 1999, 22, 216–234. [Google Scholar] [CrossRef]
- Shaikh, W.; Wadegaonkar, A.; Kedare, S.; Bose, M. Numerical simulation of single media thermocline based storage system. Sol. Energy 2018, 174, 207–217. [Google Scholar] [CrossRef]
- Advaith, S.; Parida, D.R.; Aswathi, K.T.; Dani, N.; Chetia, U.K.; Chattopadhyay, K.; Basu, S. Experimental investigation on single-medium stratified thermal energy storage system. Renew. Energy 2021, 164, 146–155. [Google Scholar] [CrossRef]
- Xu, X.; Chang, C.; Dong, J.; Guo, X.; He, M.; Yu, Q. Analysis and optimization of thermal storage performance of single tank thermocline layer with built-in insulation board. J. Energy Storage 2024, 97, 112712. [Google Scholar] [CrossRef]
- Gao, L.; Lu, H.; Sun, B.; Che, D.; Dong, L. Numerical and experimental investigation on thermal stratification characteristics affected by the baffle plate in thermal storage tank. J. Energy Storage 2021, 34, 102117. [Google Scholar] [CrossRef]
- Karim, M. Experimental investigation of a stratified chilled-water thermal storage system. Appl. Therm. Eng. 2011, 31, 1853–1860. [Google Scholar] [CrossRef]
- Hosseinnia, S.M.; Akbari, H.; Sorin, M. Numerical analysis of thermocline evolution during charging phase in a stratified thermal energy storage tank. J. Energy Storage 2021, 40, 102682. [Google Scholar] [CrossRef]
- Chung, J.D.; Cho, S.H.; Tae, C.S.; Yoo, H. The effect of diffuser configuration on thermal stratification in a rectangular storage tank. Renew. Energy 2008, 33, 2236–2245. [Google Scholar] [CrossRef]
- Tang, J.; OuYang, Z.; Shi, Y. Diffuser design and experimental research of a large-scale chilled water storage system. Energy Sources Part A Recovery Util. Environ. Eff. 2021, 43, 1456–1467. [Google Scholar] [CrossRef]


| Parameter | Value |
|---|---|
| H/(mm) | 1500 |
| R/(mm) | 1100 |
| /(mm) | 10 |
| /(mm) | 30 |
| /W/(m·K) | 16.2 |
| /W/(m·K) | 0.05 |
| Tw/(°C) | 75 |
| T∞/(°C) | 23 |
| hw/W/(m·K) | 200 |
| h∞/W/(m·K) | 8 |
| Model Parameter | Setting |
|---|---|
| Pressure–velocity coupling scheme | PISO |
| Pressure discretization Momentum discretization | Second order upwind |
| Energy discretization | |
| Turbulent kinetic energy discretization | |
| Turbulent Dissipation discretization |
Disclaimer/Publisher’s Note: The statements, opinions and data contained in all publications are solely those of the individual author(s) and contributor(s) and not of MDPI and/or the editor(s). MDPI and/or the editor(s) disclaim responsibility for any injury to people or property resulting from any ideas, methods, instructions or products referred to in the content. |
© 2025 by the authors. Licensee MDPI, Basel, Switzerland. This article is an open access article distributed under the terms and conditions of the Creative Commons Attribution (CC BY) license (https://creativecommons.org/licenses/by/4.0/).
Share and Cite
Wang, X.; Duan, L.; Gao, G.; Zheng, W.; Sun, D.; Li, J.; Fu, J.; Lin, R. Analysis and Optimization of Thermal Storage Performance of Thermocline Storage Tank with Different Water Distribution Structures. Processes 2025, 13, 629. https://doi.org/10.3390/pr13030629
Wang X, Duan L, Gao G, Zheng W, Sun D, Li J, Fu J, Lin R. Analysis and Optimization of Thermal Storage Performance of Thermocline Storage Tank with Different Water Distribution Structures. Processes. 2025; 13(3):629. https://doi.org/10.3390/pr13030629
Chicago/Turabian StyleWang, Xinwei, Longbin Duan, Genying Gao, Weibo Zheng, Dong Sun, Jinyu Li, Jing Fu, and Riyi Lin. 2025. "Analysis and Optimization of Thermal Storage Performance of Thermocline Storage Tank with Different Water Distribution Structures" Processes 13, no. 3: 629. https://doi.org/10.3390/pr13030629
APA StyleWang, X., Duan, L., Gao, G., Zheng, W., Sun, D., Li, J., Fu, J., & Lin, R. (2025). Analysis and Optimization of Thermal Storage Performance of Thermocline Storage Tank with Different Water Distribution Structures. Processes, 13(3), 629. https://doi.org/10.3390/pr13030629