Article

Evaluation of Semi-Continuous Anaerobic Fermentation of Alperujo by Methanogenesis Inhibition

by
Elena Jiménez-Páez
1,2,
Antonio Serrano
1,2,
Rafael Hueso
3,
Fernando G. Fermoso
4,* and
Juan Cubero-Cardoso
1,2
1
Institute of Water Research, University of Granada, c/Ramón y Cajal, 4, 18071 Granada, Spain
2
Department of Microbiology, University of Granada, 18071 Granada, Spain
3
Estación Experimental del Zaidín, Spanish National Research Council (CSIC), Calle San Miguel, 101, 18100 Armilla, Spain
4
Instituto de la Grasa, Spanish National Research Council (CSIC), Ctra. de Utrera, km. 1, 41013 Seville, Spain
*
Author to whom correspondence should be addressed.
Processes 2025, 13(3), 600; https://doi.org/10.3390/pr13030600
Submission received: 31 January 2025 / Revised: 14 February 2025 / Accepted: 18 February 2025 / Published: 20 February 2025

Abstract

:
Two methanogenesis inhibition strategies for enhancing volatile fatty acid (VFA) production through the anaerobic fermentation of alperujo, a byproduct of olive oil production, were evaluated. Methanogenesis inhibition was implemented via two different approaches, one by pH adjustment to 5.0 and another one by chemical inhibition using 2-bromoethanesulfonate (BES) at pH 7. The VFA accumulation at the end of the experiment was 67% higher under the BES condition than under the pH 5 condition. Interestingly, the VFA profiles were similar under both conditions, with acetic acid as the dominant product, followed by propionic and butyric acids. The results demonstrated a 25% increase in alperujo solubilization under the BES condition, compared to under the pH 5 condition. This latest finding, together with the similar VFA profiles on both strategies, suggests that the hydrolysis step in alperujo solubilization was impacted by the pH difference. These findings highlight the effectiveness of chemical inhibition in enhancing solubilization, hydrolysis, and VFA accumulation during anaerobic fermentation of alperujo and, most importantly, the negative effect of pH 5 on the solubilization step.

1. Introduction

The olive oil production industry is growing worldwide, achieving 2.5 million tons in the 2023/2024 season [1]. This production is primarily concentrated in the Mediterranean basin, accounting for 90% of the total. Within the Mediterranean region, Spain is a significant contributor, responsible for 30% of the overall production [1]. During the olive oil production process, a by-product known as alperujo is generated in the two-phase olive oil extraction system. Alperujo consists primarily of olive stones and pulp, having a composition of approximately 70–75% moisture and 35% lignocellulosic compounds [2]. Different management methods are currently under consideration for alperujo, among which anaerobic digestion is a feasible option to obtain renewable carbon materials, such as biogas or a digestate [3].
The anaerobic digestion of alperujo operates most efficiently under mesophilic conditions and within a pH range of 6.5–7.5. This process generates an average energy output from methane production comparable to the energy yield achieved through its direct combustion [4]. In fact, the biodegradability of alperujo under these operational conditions has been reported by different previous studies, with values between 60–90% [4]. Currently, the prices of biogas from industrial waste ranges from USD 0.11 to USD 0.50 per cubic meter of methane [5]. As an alternative, volatile fatty acids (VFAs), which are intermediate metabolites produced during the fermentative stage of anaerobic digestion, have gained significant scientific and economic interest. VFAs, short-chain carboxylic acids with 2 to 5 carbon atoms, are valuable for producing bioplastics, high-added-value chemicals, and biofuels [6]. Among them, acetic acid is the most produced carboxylic acid, priced at USD 890 per ton, followed by propionic and butyric acids at USD 2200 per ton and USD 2550 per ton, respectively [7].
Several strategies have been proposed to transform anaerobic digestion processes from methane production to fermentative processes to produce VFA. Examples of these strategies are the thermal modification of the inoculum [8], acid or alkali pH operation [9], hyperthermophilic operation [10], or low hydraulic retention time (HRT) operation [11], among others. Actually, there is not much research on the production and accumulation of VFAs from alperujo. The research up to date is mainly focused on the operation at different pHs. Furthermore, all these studies have been conducted on batch reactor configuration, yielding relatively low VFA production values [9,12,13,14]. Under alkaline conditions, the highest VFA concentrations are achieved, with acetic acid being the predominant product, in combination with the highest percentage of solubilization at around 50% [9]. In contrast, acidic conditions result in lower overall VFA concentrations as a consequence of a lower solubilization (20%) but yield a more diverse profile, with acetic, propionic, and butyric acids present in similar proportions [9,12]. Additionally, these studies focused on monitoring phenolic compounds, due to their antimicrobial activity and their increased concentration under acidic conditions [9,12,13,14]. However, according to these same authors, under neutral pH conditions and in a complete anaerobic digestion metabolic pathway, the microorganisms were able to solubilize up to around 80% of the alperujo [9,12]. These findings suggest that although operating reactors at extreme pH ranges might allow the inhibition of methanogenesis, it also affects the capacity of the bacteria to solubilize alperujo, with respect to neutral pH. In fact, certain hydrolytic bacteria are sensitive to pH [15]. This sensitivity can result in reduced hydrolysis efficiency at an operational pH out of their optimal range, particularly when processing complex organic materials, such as alperujo.
The aim of this work was to compare the solubilization, as well as the production and accumulation of volatile fatty acids (VFAs), in semi-continuous reactors under two methanogenesis inhibition strategies: (1) at pH 5.0 and (2) using the chemical inhibitor archaea 2-bromoethanesulfonate (BES) at pH 7. Both strategies were applied to monitor the total soluble compounds, volatile fatty acids, and total and individual phenolic compounds as possible inhibitors of alperujo.

2. Materials and Methods

2.1. Feedstock and Anaerobic Inoculum Characterization

Alperujo was obtained from the “Oleícola El Tejar Ntra. Sra. de Araceli” pomace plant, located in Marchena (Seville), Spain. The main physico-chemical characteristics of the alperujo were as follows: pH = 4.4 ± 0.1; volatile solids/total solids (VS/TS) = 93.9 ± 0.2%; moisture = 71 ± 0.5%; soluble chemical oxygen demand (sCOD) = 86,409 ± 1528 mg O2/L; sCOD/ total chemical oxygen demand (tCOD) ratio = 24%; and phenolic compounds = 24,744 ± 351 mg gallic acid eq./kg.
The anaerobic inoculum used in the experimentation was obtained from an industrial anaerobic reactor of the wastewater treatment plant “COPERO” located in Seville, Spain. The main anaerobic inoculum characteristics were as follows: pH = 7.0 ± 0.1; VS = 22,607 ± 196 mg VS/kg; and sCOD = 443 ± 7 mg O2/L.

2.2. Anaerobic Fermentation Experimental Procedure

Duplicate glass reactors (Pobel, Spain) operating under a semi-continuous regime had a working volume of 1.6 L, and each one was inoculated with 10 g VS/L of fresh inoculum. The reactors were operated under mesophilic conditions (35–37 °C), applying a hydraulic retention time (HRT) of 14 days during four HRT repetitions, i.e., 57 days of operation time. This short HRT was selected to favor VFA accumulation [16]. An organic loading rate (OLR) of 3 g VS of alperujo/(L·d) was set and maintained throughout the whole experimentation time. Methanogenesis inhibition was created on the first day through manual pH adjustment to pH 5 in duplicate reactors, while other duplicate reactors underwent chemical inhibition at pH 7. Chemical inhibition was added to the reactors at a rate of 0.5 g of 2-bromoethanesulfonate (BES) per gram of volatile solids of inoculum. The initial pH adjustment for each reactor was manually controlled using 2N NaOH and 2N HCl. In reactors maintained at pH 7 under the addition of the BES condition, sodium bicarbonate (1 g) was supplemented when the pH dropped below 7.0. Methane, carbon dioxide, and hydrogen production were collected in biogas bags.

2.3. Chemical Analysis

The characterizations of alperujo, anaerobic inoculum, and samples obtained from the reactors were determined per duplicate following the analytical test. Total solids (TSs), volatile solids (VSs), and total and soluble chemical oxygen demand (sCOD) were measured in the samples according to the APHA Standard Methods [17].
Each analysis was carried out at least in duplicate. The standard deviation of each mean value was considered to evaluate the measurement errors.

2.3.1. VFA Quantification by Gas Chromatograph Analysis

To measure the concentration of VFAs (acetic acid (C2), propionic acid (C3), iso-butyric acid (i-C4), butyric acid (n-C4), iso-valeric (i-C5) acid, and valeric acid (n-C5)) in the samples, these were centrifuged and microfiltered with 0.45 µm nylon microfilters. The sample was prepared by adding an internal standard of 1500 mg/L ethylbutyric acid to phosphoric acid (30% v/v). VFAs were determined in duplicate, injecting 0.5 µL of each sample in a gas chromatograph equipped with a Shimadzu GC-2025 (Shimadzu Corporation, Kyoto, Japan). A Stabilwax-DA capillary column (RESTEK Corporation, Bellefonte, PA, USA) of 0.25 mm i.d. × 30 m and a flame ionization detector (FID) were used. The oven temperature gradually increased from 100 to 170 °C at 5 °C/min. The carrier gas (nitrogen, hydrogen, and air) flowed at 40 mL/min at 504 kPa, with individual flow rates of 30 mL/min for nitrogen, 40 mL/min for hydrogen, and 400 mL/min for air. The FID detector temperature was set to 250 °C. Identification and quantification were performed using commercial standards by comparing retention times with the reference compound.

2.3.2. Total and Soluble Phenolic Compounds

Samples were previously centrifuged and microfiltered with 0.22 µm nylon microfilter. The total soluble phenolic compounds were determined using the Folin–Ciocalteu method [18]. For each sample, Na2CO3 (0.7 M) and Folin–Ciocalteu (0.2 M) were added. After 15 min, the absorbances of the samples were recorded at 655 nm in a Bio-Rad iMark model microplate reader (Hercules, CA, USA). Finally, a calibration curve with a known gallic acid concentration was developed, and the results were expressed as milligrams of gallic acid equivalents per kilogram or per liter. The phenolic compound profile was analyzed in a Hewlett-Packard 1100 series high-performance liquid chromatography (HPLC) (Agilent, Barcelona, Spain) equipment coupled with a diode array detector and an Agilent 1100 automatic injector (20 µL). The chromatographic column was a Teknokroma Tracer Extrasil OSD2, with a 5 µm particle size and a 25 × 0.46 mm internal diameter (Teknokroma, Barcelona, Spain). The mobile phases were Milli-Q (Merck Millipore, Darmstadt, Germany) water with an adjusted pH with 0.01% trifluoroacetic acid (A) and HPLC-grade acetonitrile (B). A 55 min gradient elution method was used: 0–30 min of 5% B, 30–45 min of 25% B, 45–47 min of 50% B, and 47–50 min of 0% B, held until the run was completed. Identification and quantification were performed using commercial standards by comparing retention times with the reference compound and recording UV spectra between 200 and 360 nm [19]. Results were expressed as milligrams of each phenolic compound per liter.

2.3.3. Biogas Quantification and Composition

Biogas produced during the hydraulic retention time (HRT) of the reactors was collected in gas bags. The volume of accumulated biogas was subsequently quantified using a Ritter gasometer. Biogas concentrations in the headspace samples were taken and stored using a vacuum tube. A 500 µL gaseous sample was manually injected into an HP 8860 gas chromatograph unit (Agilent, Shanghai, China) following a method modified from Araujo et al. [20]. The equipment was equipped with a TCD detector (Agilent, Shanghai, China) and two columns, an HP-PLOT/Q (Agilent, USA), 30 m × 0.53 mm i.d. × 40 μm film thickness, and an HP-MOLESIEVE molecular sieve (Agilent, USA), 30 m × 0.53 mm i.d. × 50 μm film thickness. The initial temperature was held at 35 °C for 3 min, followed by a ramp to 65 °C with a ramp of 10 °C/min, resulting in a total run time of 6 min. The carrier gas was N2 at a flow rate of 10 mL/min. The injector was operated in split mode (split ratio 2:1) and at 200 °C, with a pressure of 17.14 psi. The TCD detector was maintained at 250 °C, with N2 as the reference gas, at a flow rate of 25 mL/min. Compound identification and quantification were performed, with retention time and peak areas of the sample being compared to those of increasing amounts of pure gases. The gas chromatograph analyses were carried out at the Instrumental Technical Services of the Estación Experimental del Zaidín (SIC-EEZ), CSIC, Granada, Spain.

2.4. Soluble Organic Matter Yield and Acidogenesis Ratio

To evaluate the fermentation process, the soluble organic matter yield (mg COD/g VS) and acidogenesis rate ratio were calculated using Equations (1) and (2).
Soluble organic matter yield = ( s C O D ) e f f l u e n t V S e f f l u e n t
Acidogenesis rate % = s C O D V F A   e f f l u e n t ( s C O D ) e f f l u e n t × 100
where [sCOD] effluent = sCOD concentration represents the value of the reactor effluent (g O2/L); [VS] effluent = volatile solids concentration stands for the effluent at the reactor (g VS/L); and [sCODVFA] = VFA concentration is calculated as the COD (g O2/L).

2.5. Statistical Analysis

The results are expressed as mean values with their corresponding standard deviations from duplicate reactors working as biological replicates. A one-way analysis of variance (ANOVA) was conducted to evaluate statistical differences, followed by Tukey’s multiple range test for sCOD and VFAs, while the Kruskal–Wallis test was used for total phenolic compounds in pairwise comparisons. All statistical analyses were performed using SigmaPlot 15.0 (Systat Software Inc., San Jose, CA, USA), with a significance threshold set at p < 0.05.

3. Results and Discussion

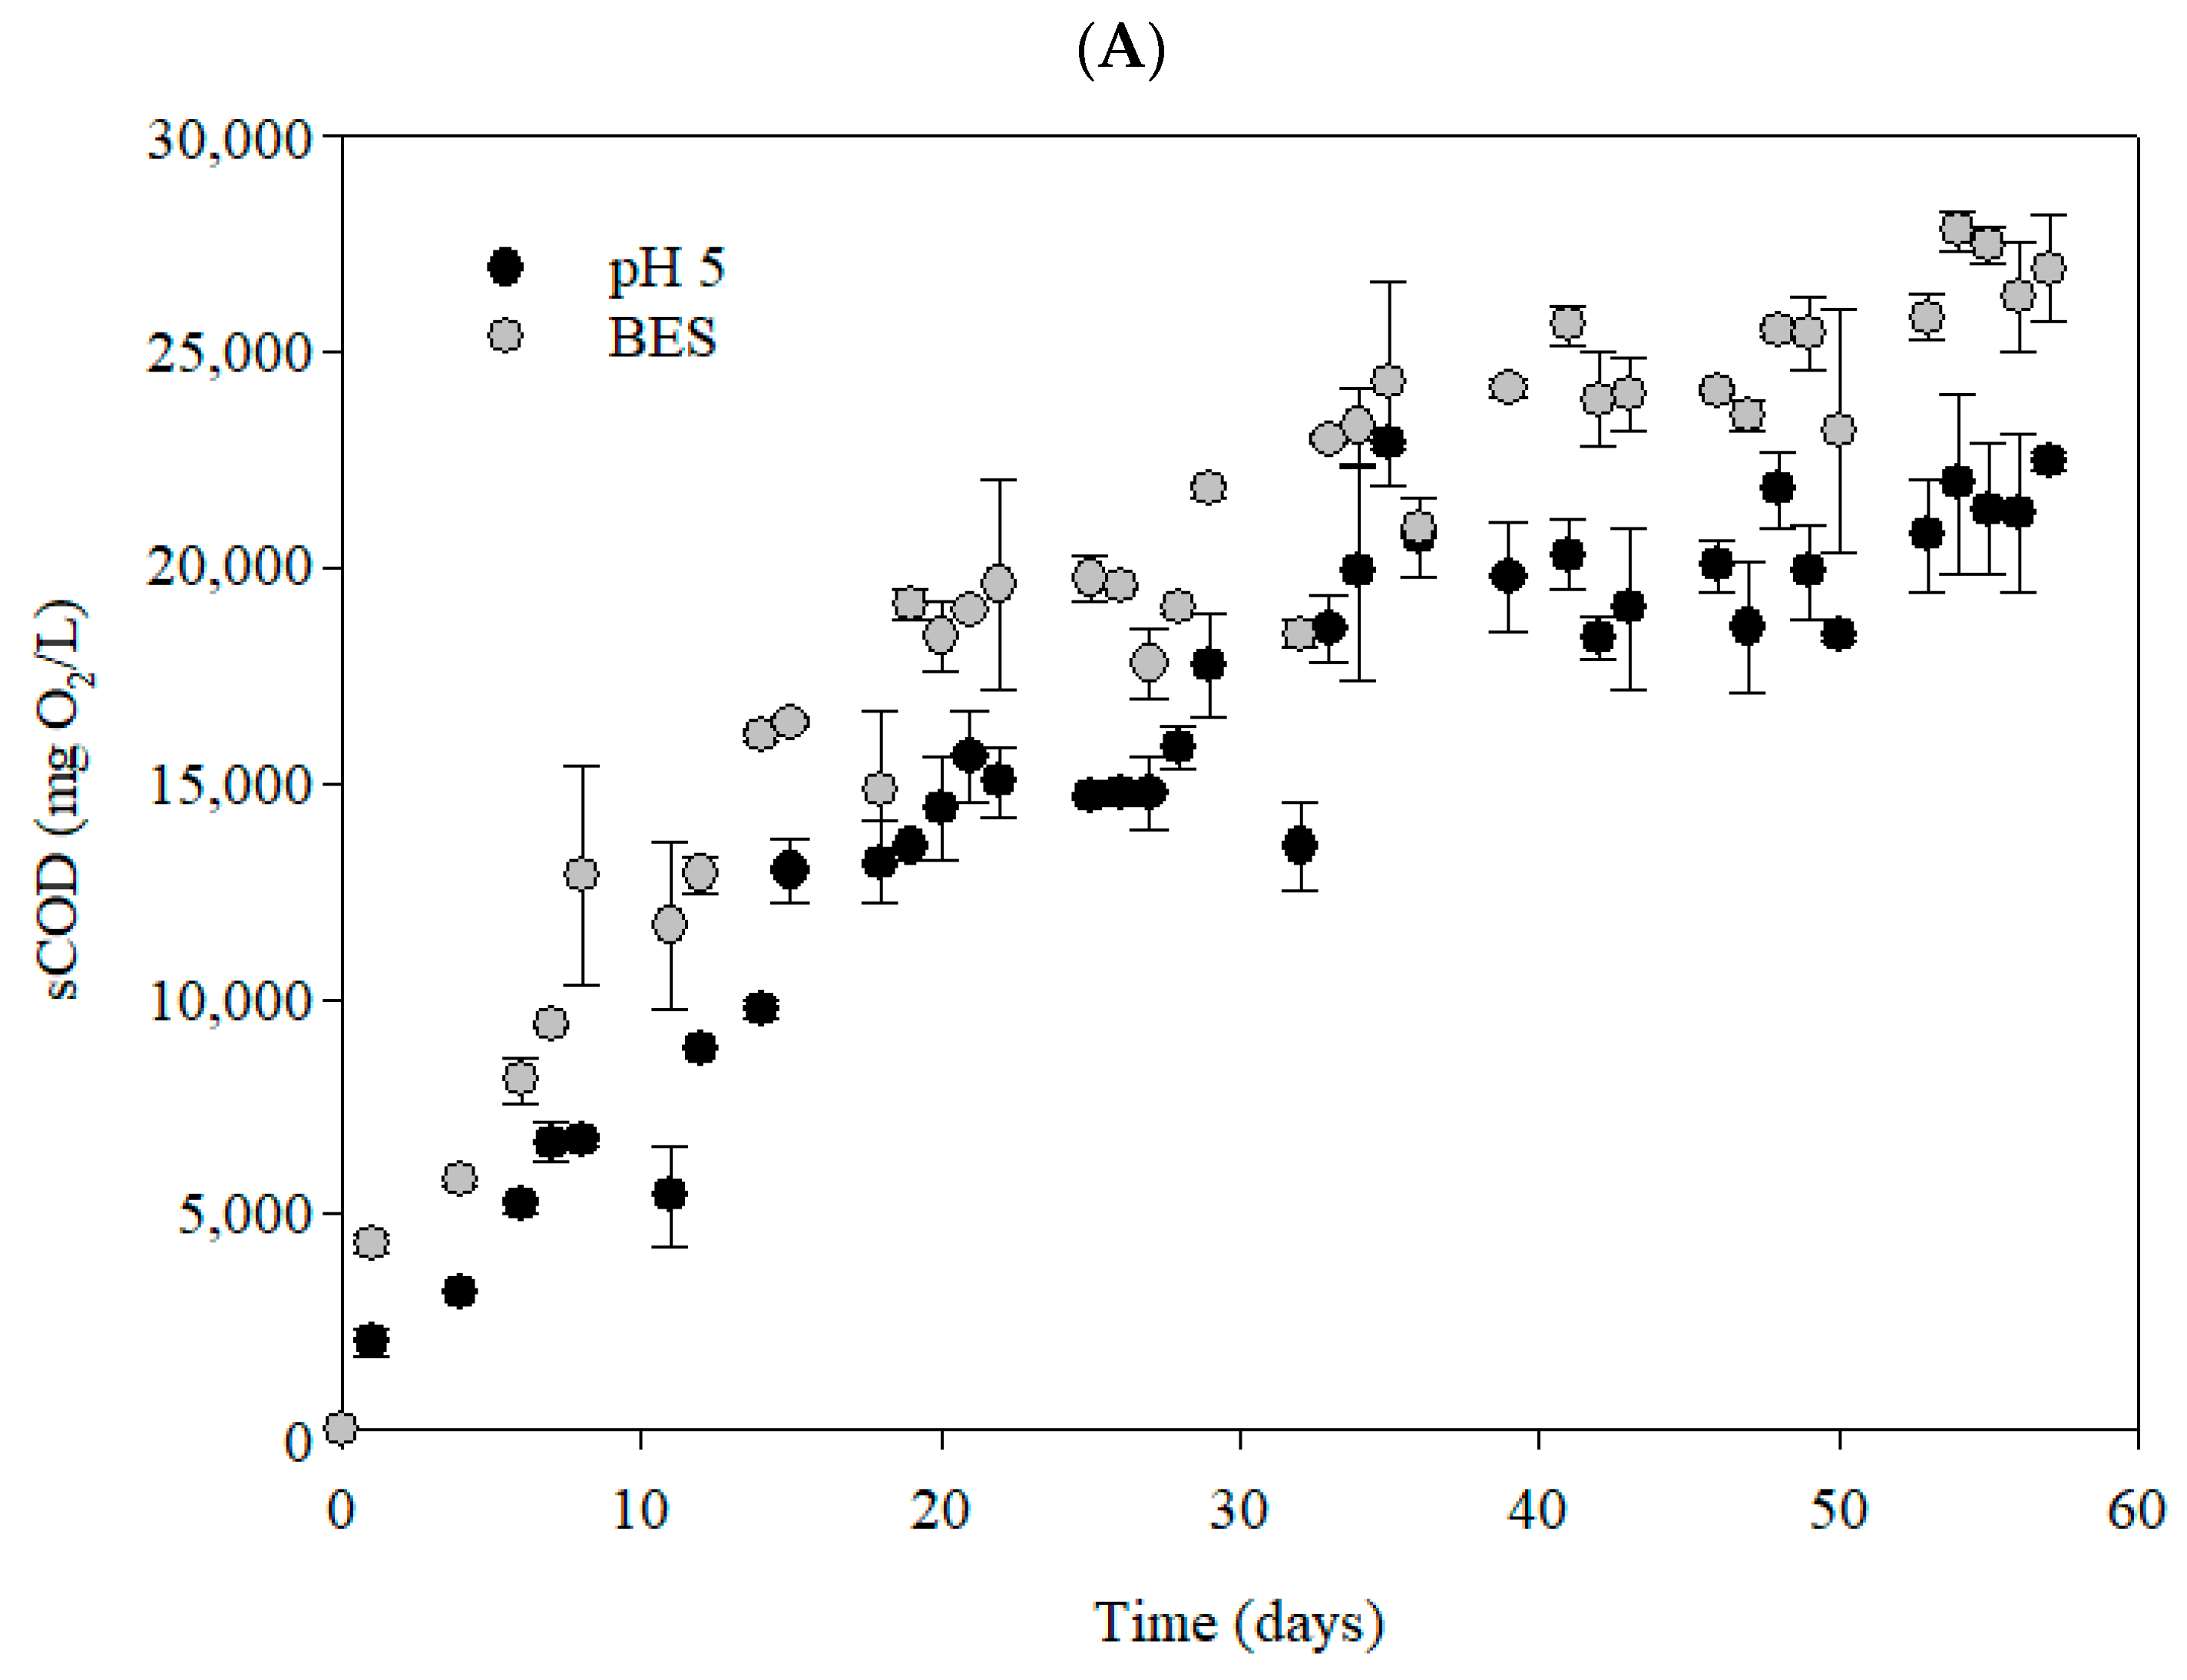
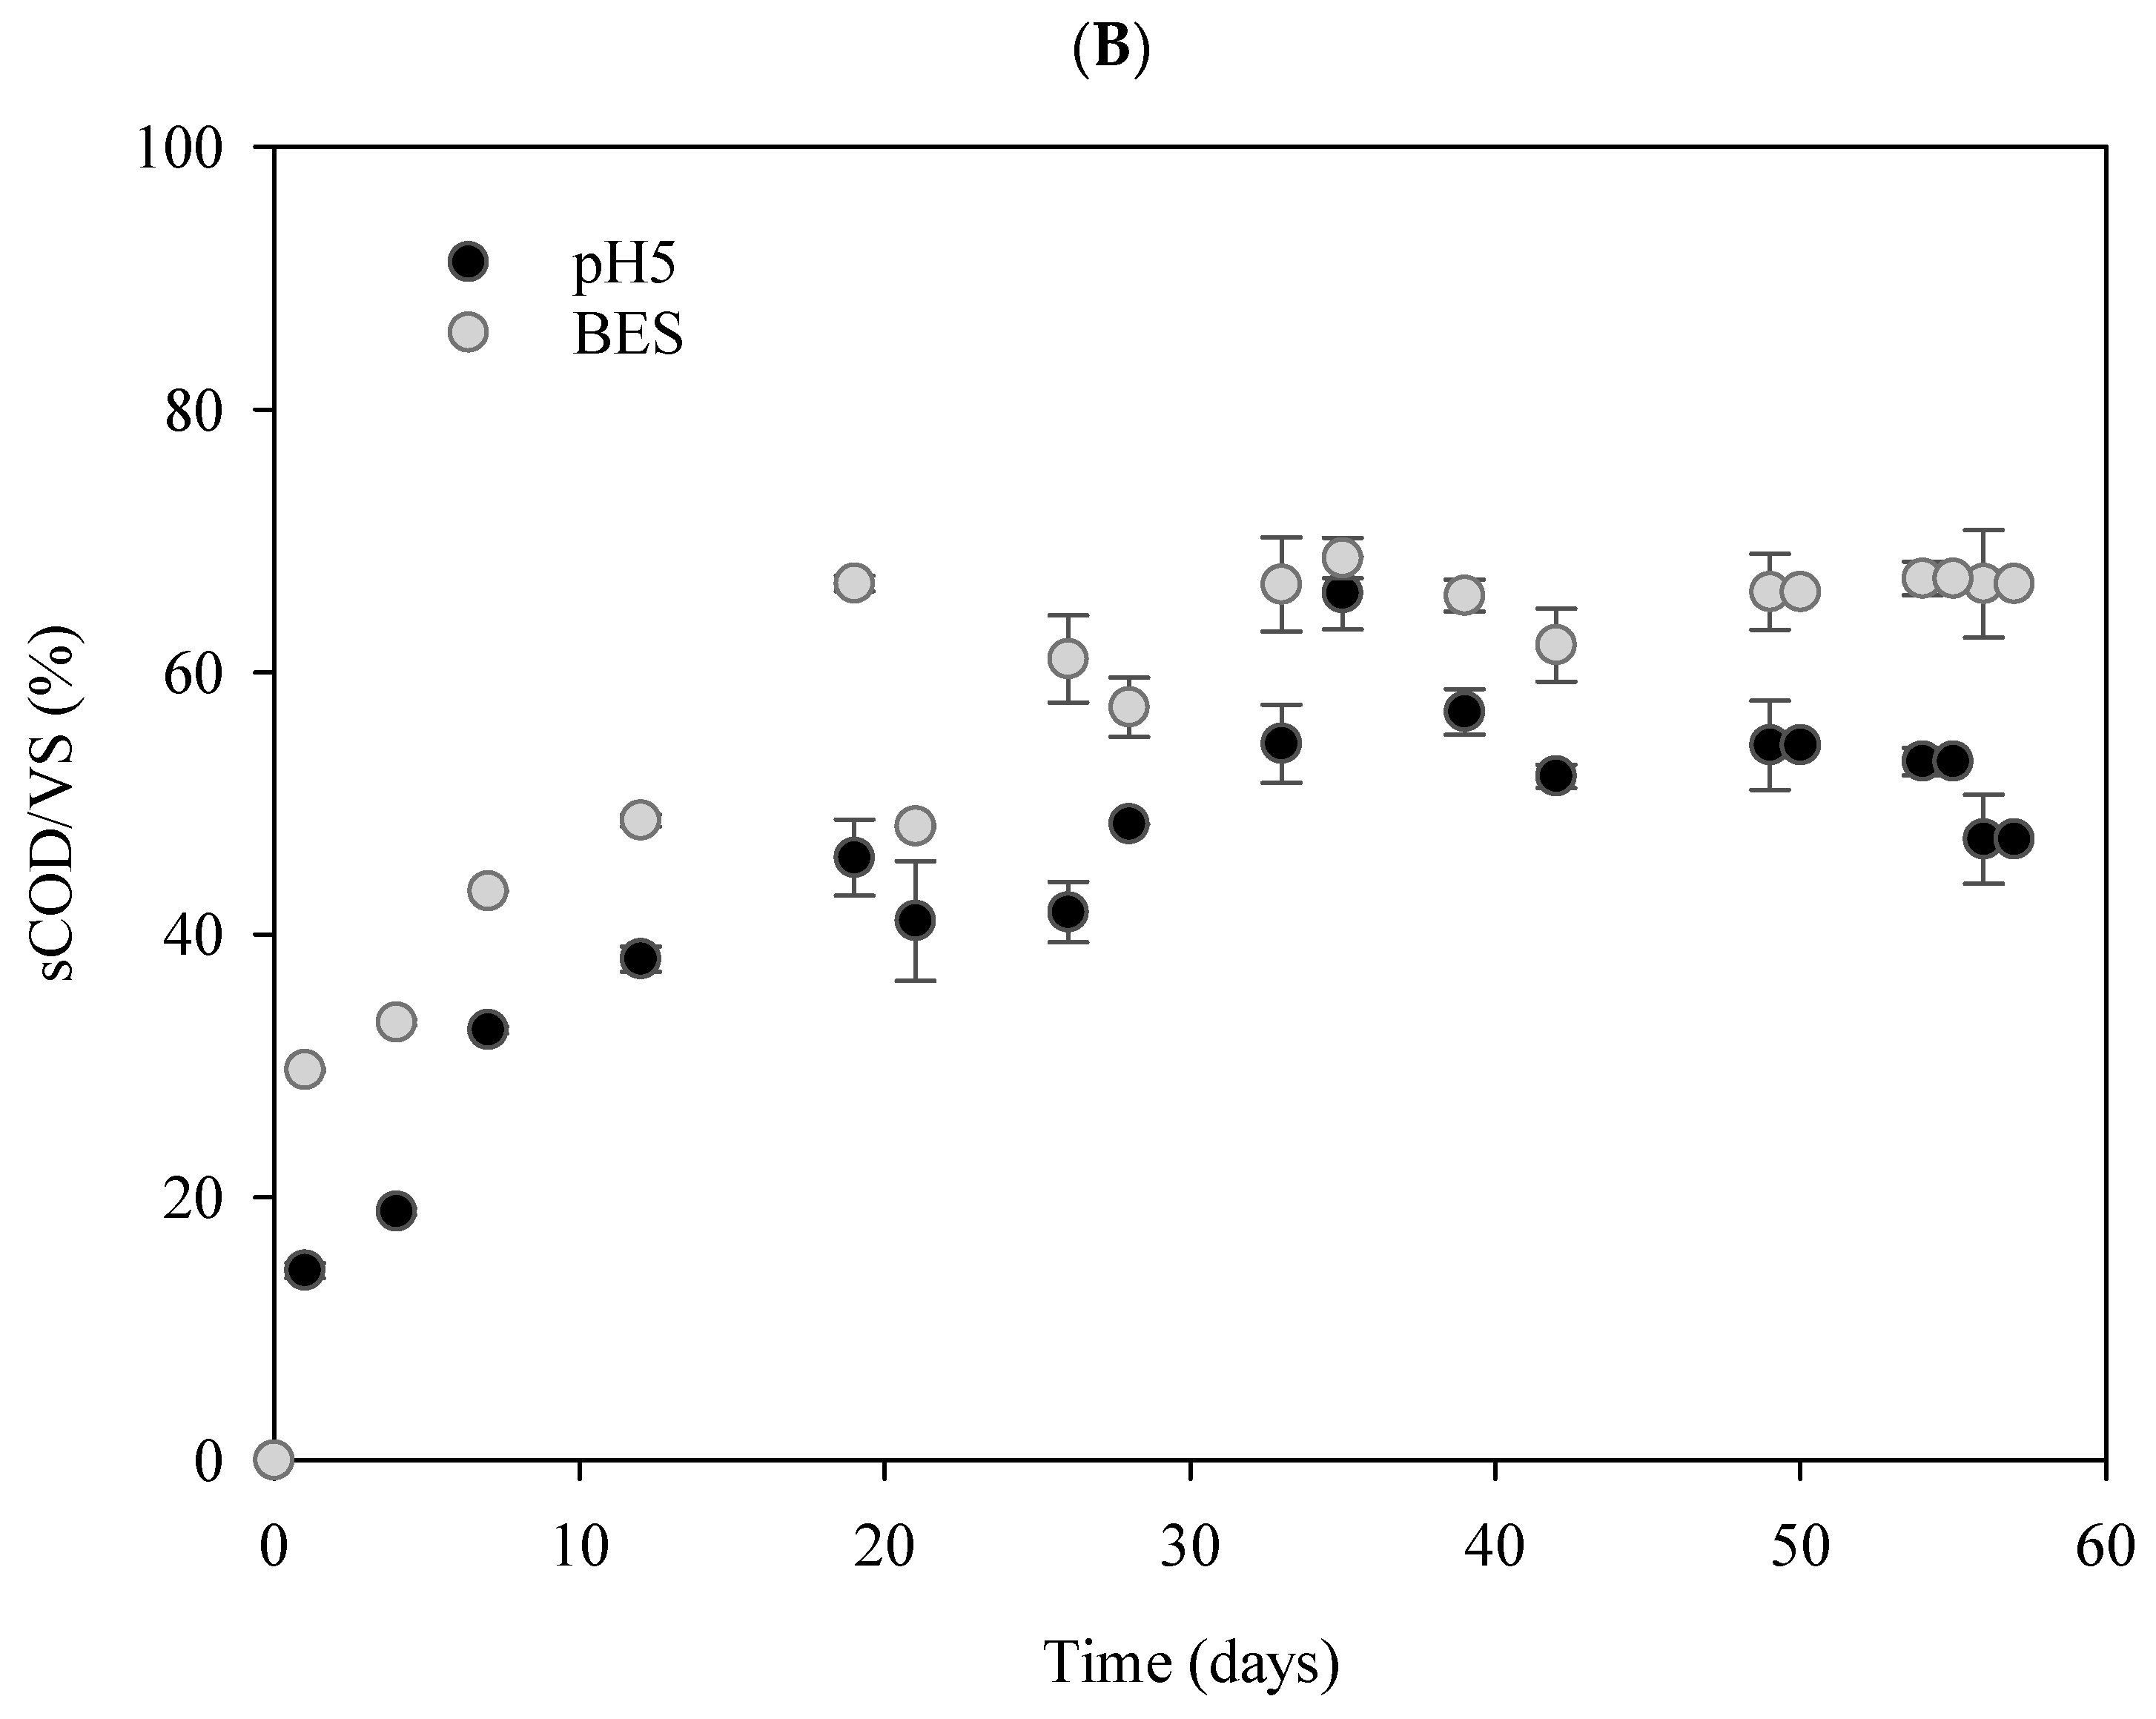
3.1. Soluble Compounds Accumulation Under Anaerobic Fermentation

During the first two HRTs (up to day 29), soluble chemical oxygen demand (sCOD) increased under both the pH 5 and BES conditions. Under the pH 5 condition, sCOD increased from 2034 ± 340 mg O2/L to 15,828 ± 508 mg O2/L, while under the BES condition, it increased from 4328 ± 216 mg O2/L to 19,062 ± 88 mg O2/L (Figure 1). Steady-state conditions were reached from the third HRT repetition onwards (from day 29 to 57), with average values of 20,510 ± 1400 mg O2/L and 25,465 ± 1600 mg O2/L under pH 5 and BES, respectively (Figure 1). The nearly 25% increase in soluble compounds observed under the BES condition (p-value < 0.001), compared to that under the pH 5 condition, may be attributed to the pH-dependent activity of hydrolytic bacteria. Specifically, the activity of certain hydrolytic bacterial populations may be limited at pH 5, while a greater diversity and potentially higher activity of these populations may be observed at a neutral pH [15,21].
The accumulation of organic matter in the reactor, evidenced by the increase in soluble organic matter (Figure 1A,B), stabilized from day 28 onwards. An increase in the percentage of sCOD/VS was observed up to this time, reaching final values of 54 ± 7% and 63 ± 6% under pH 5 and BES conditions, respectively (Figure 1B). Consistent with these findings, acidic pH can affect the enzymatic and metabolic activities of microorganisms, which may affect the availability of the soluble substrate and thus the hydrolytic step [14,22].
The composition of the biogas, including methane (CH4), carbon dioxide (CO2), and hydrogen (H2), is presented in Table 1. In the reactor under the pH 5 condition, a high percentage of methane was observed during the first HRT, with a value of 51.35 ± 4.77% (Table 1), while carbon dioxide was more dominant during the second and third HRTs. The observed CH4 percentage was substantially lower than the range of 50–70% typically achieved in complete anaerobic digestion processes [23,24]. Notably, a minimal percentage of hydrogen was detected in the biogas during the second HRT, coinciding with higher carbon dioxide composition. This composition indicated that, despite the use of pH 5 or BES conditions, the methanogenesis activity was not totally inhibited. In the reactor operated under the BES condition, methane composition was lower across all HRTs, while carbon dioxide was more predominant. Hydrogen was not detected, likely due to the unfavorable condition at pH 7. Optimal conditions for effective hydrogen production typically involve a pH of 5.5 and a temperature of 37 °C [25].

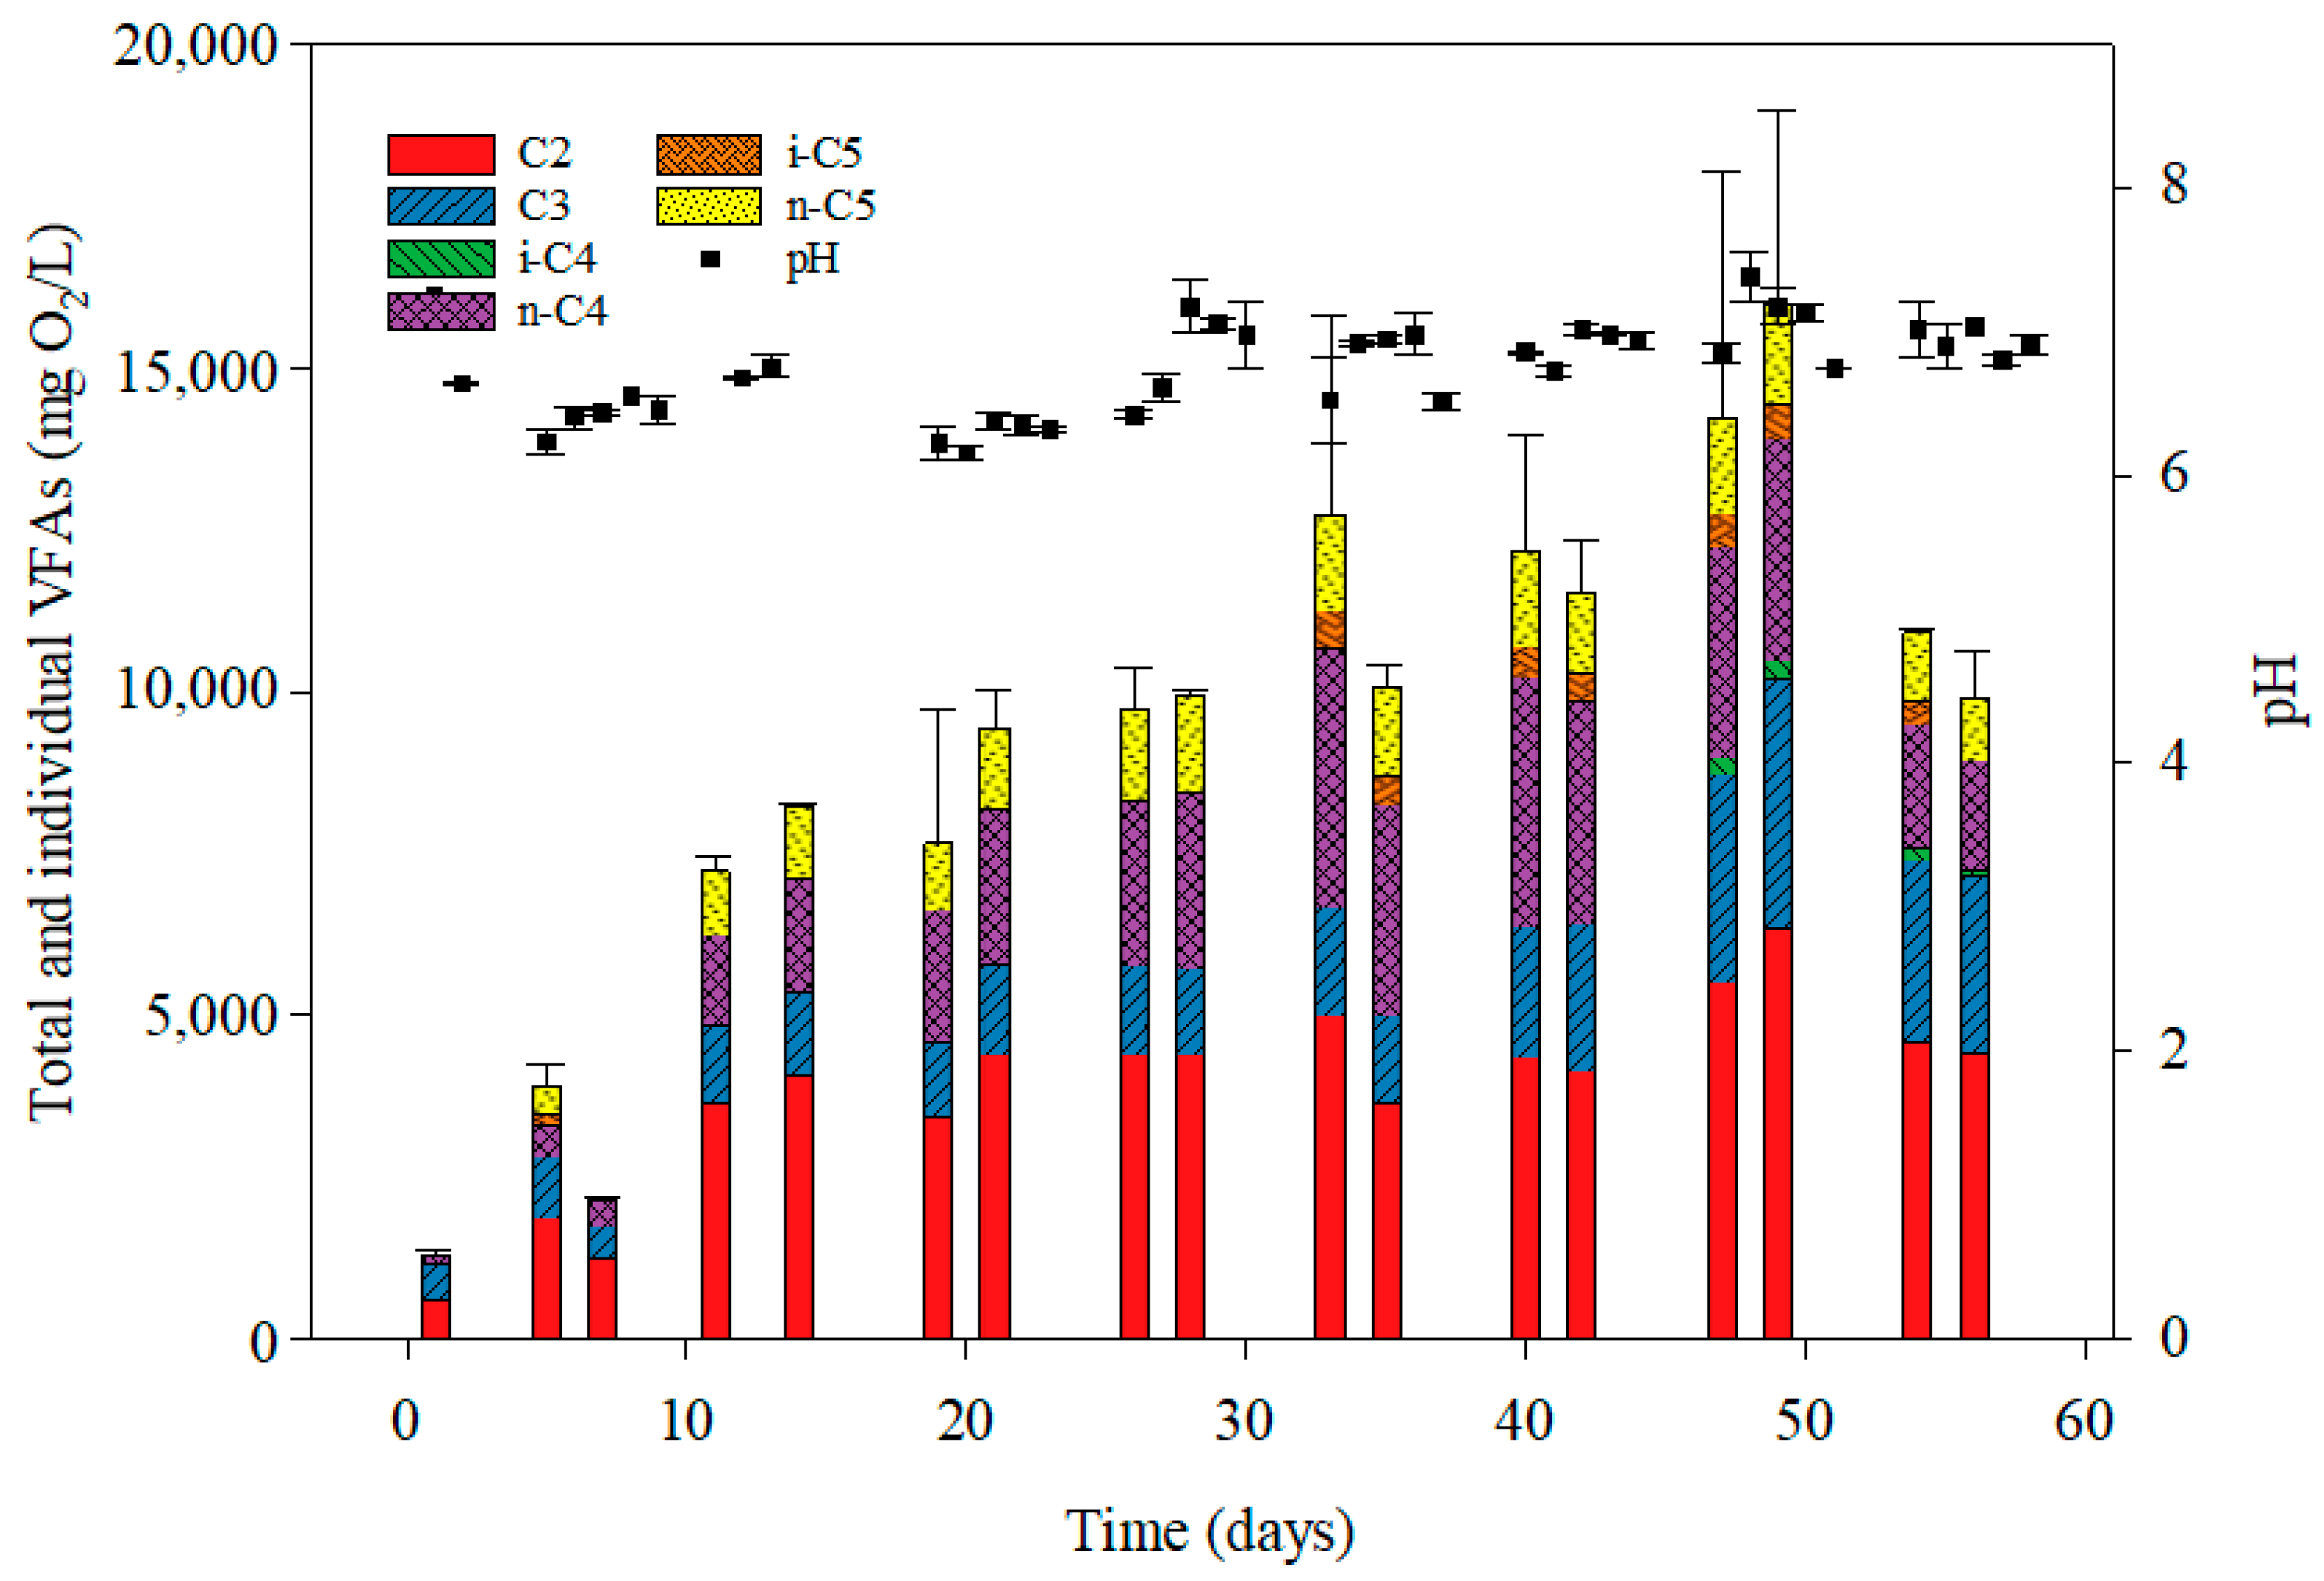
3.2. Volatile Fatty Acid Accumulation Under Anaerobic Fermentation

Figure 2 and Figure 3 show the pH measurements and the individual VFAs throughout the whole experimental time. Under the pH 5 condition, pH adjustments were not required throughout the operational time. On the contrary, under pH 7 conditions, sodium bicarbonate was periodically added, as its pH dropped to 6.3. This decrease could be due to the acidification of the system by VFA accumulation (Figure 2 and Figure 3).
VFA concentration under the pH 5 condition increased steadily during the first HRT repetition (up to day 14). Subsequently, after a period of stabilization, the VFA concentration was observed from day 14 to day 57, with the average concentration remaining above 6000 mg/L (Figure 2), corresponding to 33 ± 2% of the acidogenesis rate at steady-state days (from 30 to 57 days). Comparing these results with the BES condition, steady-state conditions were observed slightly later than under the pH 5 condition, concretely on day 21, accounting for total VFAs exceeding 10,000 mg O2/L, 67% higher than under the pH 5 condition (Figure 3). The ratio of acidogenesis (VFAs/sCOD) under the BES condition was 43 ± 3% on steady-state days (from 30 to 57 days), increasing to 10% more than the results obtained under the pH 5 condition (p-value < 0.02). The increase in the percentage of acidogenesis was in agreement with the results obtained by Lu et al. [26], in which the acidogenesis rate was higher at pH 7 than at pH 5.
The difference between pH 5 and BES conditions in VFA accumulation and transformation could be related to the dissociation of VFAs. Under the pH 5 condition, it was reported that approximately 60% of the total volatile fatty acids were dissociated, with a pKa around 4.7–4.8. The concentration of undissociated organic acids can influence fermentation, as these forms exhibit a stronger inhibitory effect, compared to their ionized counterparts. Due to their neutral charge, undissociated acids can penetrate bacterial cells, where they dissociate internally, releasing H+ ions and disrupting the transmembrane pH gradient [27,28]. For these reasons, under the pH 5 condition, the accumulation of VFAs may have resulted in an inhibition of the fermentation stage [29]. In contrast, at neutral pH, the percentage of undissociated acids was <1% and did not disrupt the transmembrane pH gradient [30]. Previous studies suggested that slightly acidic to neutral pH (5.5–7.0) facilitated the best VFA yield during acidogenic fermentation [31]. Strazzera et al. [32] investigated the impact of pH on VFA production from various household food waste substrates in batch reactors, finding that pH 7 enhanced VFA accumulation (8–13 g/L) for protein-rich, starch-rich, fiber-rich, and sugar-rich substrates, while hydrolysis limitations restricted VFA production from cellulose-rich and lipid-rich wastes. Previous studies on the anaerobic fermentation of food waste reported higher VFA concentrations under neutral and alkaline pH conditions [33,34]. One of them, under a semi-continuous regime, achieved VFA levels of 9.8–11.5 g/L, with a feed concentration of 5 g/L and an HRT of 3.5 days [33]. All of these studies reported difficulty in VFA accumulation at an acidic pH compared to neutral or alkaline pH, due to the dissociation of the ions.
The VFA profile showed in steady-state condition (from day 29 to 57) that acetic acid was the predominant acid under both conditions evaluated, with average concentrations of 3014 ± 187 mg O2/L (45% on a COD basis) and 4378 ± 351 mg O2/L (39% on a COD basis) under pH 5 and BES conditions, respectively. The other most relevant VFAs were propionic acid and butyric acid, whose distributions varied according to the operational condition. Under the pH 5 condition, the second most predominant acid was butyric acid, with a value of 1643 ± 320 mg O2/L (25% on a COD basis), while under the BES condition, the second most dominant acid was propionic acid, reaching a value of 2347 ± 958 mg O2/L (21% on a COD basis). The profile concentration under the pH 5 condition diverged from the research of fed-batch fermentation of alperujo at pH 5, wherein propionic acid emerged as the dominant acid, contributing 63% to the overall acid production [9]. These results suggest that propionic and butyric acid fermentation pathways are not solely regulated by pH but rather depend on other factors, such as HRT [35]. Also, the observed product distribution, including the coexistence of both pathways at pH 5 with different dominances, indicates a significant influence of redox potential on the metabolic activity [36]. Additionally, under the BES condition, the profile was more complex than that observed under the pH 5 condition. This was evidenced by the emergence of iso-butyric and iso-valeric acids after 33 days, with concentrations of 202 ± 94 mg O2/L (2% on a COD basis) and 453 ± 75 mg O2/L (4% on a COD basis), respectively.

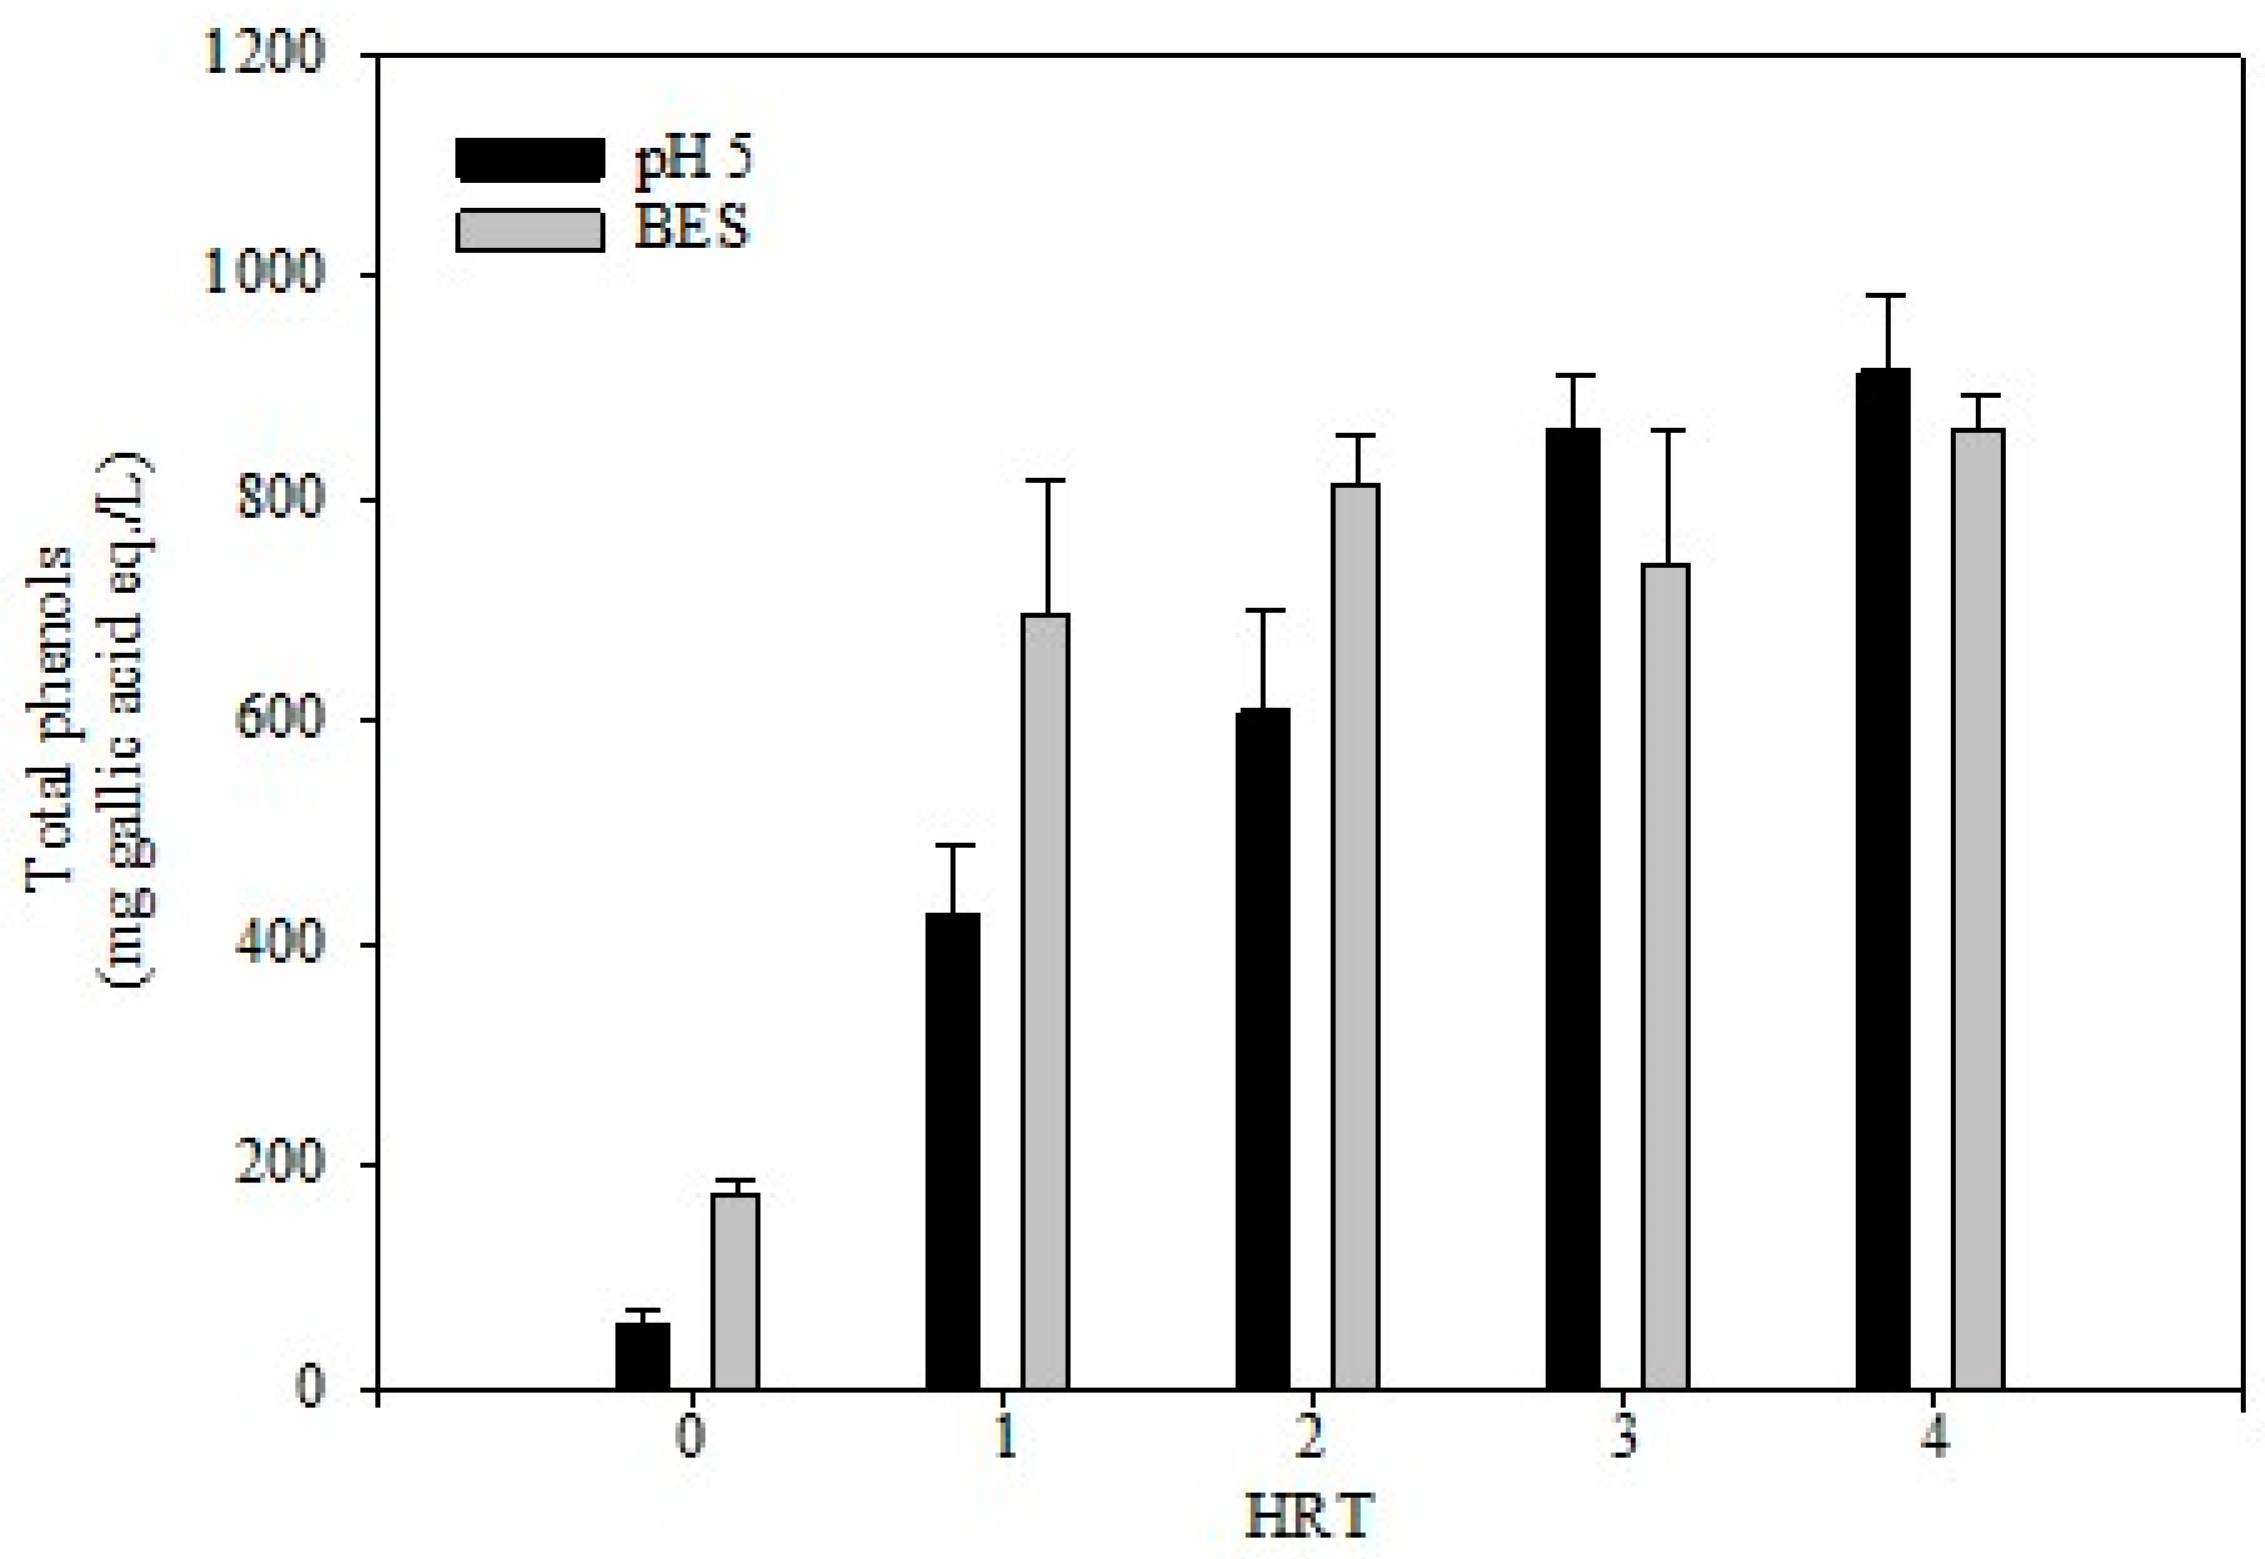
3.3. Phenolic Compounds Accumulation Under Anaerobic Fermentation

Phenolic compounds are solubilized from alperujo during the hydrolysis and degradation steps of the organic matrix. Monitoring these phenolic compounds is crucial, as they possess inherent antibacterial properties that can potentially inhibit bacterial activity in anaerobic fermentation processes [37]. For this reason, total phenolic compounds and individual phenolic compounds were analyzed in fermentation processes (Figure 4, Table 2). The total phenolic compounds concentration, expressed in mg gallic acid equivalents per liter, increased over the operational time similarly under both assessed conditions. Under the pH 5 condition, the mean concentration was enhanced from 62 ± 9 mg gallic acid eq./L to 915 ± 66 mg gallic acid eq./L during the operational time. Under the BES condition, concentrations increased from 178 ± 10 mg gallic acid eq./L to 864 ± 31 mg gallic acid/L. These values did not exhibit a significant variance between the conditions, as indicated by a p-value of 0.896. Despite these increases, more than 80% of total phenolic compounds fed, provided by alperujo, were removed at the end of the operation time. Notably, the total phenolic compound concentrations observed in this study consistently remained below the inhibitory threshold for anaerobic digestion processes, which is typically around 2000 mg/L [38].
The Table 2 presents the concentrations of individual phenolic compounds (mg/L) measured under pH 5 and BES conditions at the end of each HRT repetition. The primary compounds present in alperujo and released during the anaerobic digestion process included 3,4-dihydroxyphenylglycol, hydroxytyrosol, and tyrosol [39].The concentration of 3,4-dihydroxyphenylglycol consistently increased throughout the operational time, with higher levels observed under the BES condition, reaching 168.78 ± 27.40 mg/L. Hydroxytyrosol and tyrosol showed an increasing trend at pH 5, while under the BES condition, there was practically no accumulation, maintaining concentrations below 40 mg/L (Table 2). A study on alperujo revealed that due to its high phenol content and variability, it has high antimicrobial effects. However, this antimicrobial activity comes mainly from the high concentrations of hydroxytyrosol. [40].
Protocatechuic acid, 4-dihydroxycinnamic acid, and 4-methylcatechol were analyzed, as they are derived from lignocellulosic material, mainly form lignin, and act as indicators of solubilization during the anaerobic digestion process [41,42]. Protocatechuic acid concentrations increased under both pH conditions, reaching approximately 50 mg/L (Table 2). The 4-dihydroxycinnamic acid showed an increase under the pH 5 condition but remained at low concentrations under the BES condition. Conversely, 4-methylcatechol exhibited low concentrations under the pH 5 condition but higher concentrations under the BES condition. These results suggest that under pH 5 conditions, phenolic compounds in alperujo and the lignocellulosic material accumulate more concentration than under the BES condition, with these phenolic compounds being degraded and transformed into VFAs.

4. Conclusions

The anaerobic fermentation of alperujo was evaluated under semi-continuous conditions using two methanogenesis inhibition strategies. Under the pH 5 condition, solubilization was limited; this might be caused by the inhibitory effect of undissociated volatile fatty acids (VFAs), which penetrate the cell and disrupt the transmembrane pH gradient. In contrast, solubilization was more efficient under the BES condition (pH 7), with a 25% increase compared to under the pH 5 condition, resulting in a higher VFA concentration (exceeding 10,000 mg O2/L, 67% higher than under the pH 5 condition). The profiles of both conditions evaluated were very similar, in which the main acid was acetic acid, followed by butyric acid under the pH 5 condition and propionic acid under the BES condition. Phenolic compound monitoring indicated concentrations below inhibitory thresholds under both conditions, with a slightly greater degradation observed under the BES condition. These findings suggest that bacterial inhibition at an acidic pH has a crucial impact on the solubilization of organic matter, affecting the hydrolytic and, subsequently, the acidogenic stages of anaerobic fermentation. Consequently, the chemical inhibition strategy that facilitates the solubilization of alperujo may be extended to other complex agro-industrial by-products to enhance VFA production.

Author Contributions

E.J.-P.: conceptualization, methodology, investigation, formal analysis, and writing—original draft preparation; J.C.-C.: conceptualization, methodology, investigation, formal analysis, and writing—original draft preparation; A.S.: conceptualization, supervision, methodology, funding acquisition, and writing—reviewing and editing; R.H.: methodology and writing—reviewing and editing; F.G.F.: funding acquisition and writing—reviewing and editing. All authors have read and agreed to the published version of the manuscript.

Funding

This work was funded by the Consejería de Transformación Económica, Industria, Conocimiento y Universidades (Junta de Andalucía—EMERGIA20_00114). Juan Cubero Cardoso received funding from the JDC2022-050255-I grant, which is financed by MCIU/AEI/10.13039/501100011033 and the European Union’s “NextGenerationEU”/PRTR program.

Data Availability Statement

The original contributions presented in the study are included in the article; further inquiries can be directed to the corresponding authors.

Conflicts of Interest

The authors declare no conflicts of interest.

References

  1. Statista. Olive Oil Production in Selected Countries Worldwide from 2020/2021 in 2023/2024. 2024. Available online: https://es.statista.com/estadisticas/1292021/produccion-de-aceite-de-oliva-en-paises-seleccionados/ (accessed on 21 January 2025).
  2. Fernández-Rodríguez, M.J.; de la Lama-Calvente, D.; Jiménez-Rodríguez, A.; Pino-Mejías, R.; Borja, R.; Rincón, B. Impact of soft hydrothermal pre-treatments on the olive mill solid waste characteristics and its subsequent anaerobic digestion. Biomass Convers. Biorefin. 2022, 12, 2107–2120. [Google Scholar] [CrossRef]
  3. Messineo, A.; Maniscalco, M.P.; Volpe, R. Biomethane recovery from olive mill residues through anaerobic digestion: A review of the state of the art technology. Sci. Total Environ. 2020, 703, 135508. [Google Scholar] [CrossRef] [PubMed]
  4. Serrano, A.; Villa-Gomez, D.; Fermoso, F.G.; Alonso-Fariñas, B.J.B. Bioproducts; Biorefining, Is anaerobic digestion a feasible alternative to the combustion of olive mill solid waste in terms of energy production? A critical review. Biofuels Bioprod. Biorefin. 2021, 15, 150–162. [Google Scholar] [CrossRef]
  5. European Biogas Association. Biogas Cost Reductions to Boost Sustainable Transport. 2025. Available online: https://www.europeanbiogas.eu/irena-publication-biogas-cost-reductions-boost-sustainable-transport/ (accessed on 29 January 2025).
  6. Annamalai, N.; Elayaraja, S.; Oleskowicz-Popiel, P.; Sivakumar, N.; Bahry, S.A. Volatile fatty acids production during anaerobic digestion of lignocellulosic biomass. In Recent Developments in Bioenergy Research; Elsevier: Amsterdam, The Netherlands, 2020; pp. 237–251. [Google Scholar]
  7. Chen, C.; Zhang, X.; Liu, C.; Wu, Y.; Zheng, G.; Chen, Y. Advances in downstream processes and applications of biological carboxylic acids derived from organic wastes. Bioresour. Technol. 2022, 346, 126609. [Google Scholar] [CrossRef]
  8. Caroca, E.; Serrano, A.; Borja, R.; Jiménez, A.; Carvajal, A.; Braga, A.F.M.; Rodriguez-Gutierrez, G.; Fermoso, F.G. Influence of phenols and furans released during thermal pretreatment of olive mill solid waste on its anaerobic digestion. Waste Manag. 2021, 120, 202–208. [Google Scholar] [CrossRef]
  9. Jiménez-Páez, E.; Serrano, A.; Purswani, J.; Correa-Galeote, D.; Cubero-Cardoso, J.; Fermoso, F.G. Impact on the microbial population during biological volatile fatty acid production from olive mill solid waste. Environ. Technol. Innov. 2023, 32, 103409. [Google Scholar] [CrossRef]
  10. Qiu, Y.; Gu, X.; Johnson, Z.; Bohutskyi, P.; Chen, S. Improving dairy manure hydrolysis and acidification through microbial community restructuring by adaptation to hyperthermophilic conditions. J. Clean. Prod. 2024, 473, 143487. [Google Scholar] [CrossRef]
  11. Menzel, T.; Neubauer, P.; Junne, S. Plug-flow hydrolysis with lignocellulosic residues: Effect of hydraulic retention time and thin-sludge recirculation. Biotechnol. Biofuels Bioprod. 2023, 16, 111. [Google Scholar] [CrossRef]
  12. Cabrera, F.; Serrano, A.; Torres, Á.; Rodriguez-Gutierrez, G.; Jeison, D.; Fermoso, F.G. The accumulation of volatile fatty acids and phenols through a pH-controlled fermentation of olive mill solid waste. Sci. Total Environ. 2019, 657, 1501–1507. [Google Scholar] [CrossRef]
  13. Cubero-Cardoso, J.; Llamas, M.; Trujillo-Reyes, Á.; Fernández-Prior, Á.; Rodríguez-Gutiérrez, G. Assessing the potential of olive mill solid waste as feedstock for methane and volatile fatty acids production via anaerobic bioprocesses. New Biotechnol. 2024, 84, 77–84. [Google Scholar] [CrossRef]
  14. da Fonseca, Y.A.; de Camargos, A.B.; Gomes, G.S.M.; Fregulia, P.; Silva, S.Q.; Gurgel, L.V.A.; Baêta, B.E.L. Enhancing Biobased Volatile Fatty Acids Production from Olive Mill Solid Waste by Optimization of pH and Substrate to Inoculum Ratio. Processes 2023, 11, 338. [Google Scholar] [CrossRef]
  15. Amin, F.R.; Khalid, H.; El-Mashad, H.M.; Chen, C.; Liu, G.; Zhang, R. Functions of bacteria and archaea participating in the bioconversion of organic waste for methane production. Sci. Total Environ. 2021, 763, 143007. [Google Scholar] [CrossRef] [PubMed]
  16. Battista, F.; Strazzera, G.; Valentino, F.; Gottardo, M.; Villano, M.; Matos, M.; Silva, F.; Reis, M.A.M.; Mata-Alvarez, J.; Astals, S.; et al. New insights in food waste, sewage sludge and green waste anaerobic fermentation for short-chain volatile fatty acids production: A review. J. Environ. Chem. Eng. 2022, 10, 108319. [Google Scholar] [CrossRef]
  17. Baird, R.B.; Rice, E.W.; Eaton, A.D. (Eds.) Standard Methods for the Examination of Water and Wastewaters; American Public Health Association: Washington, DC, USA; American Water Works Association: Washington, DC, USA, 2017. [Google Scholar]
  18. Singleton, V.L.; Rossi, J.A. Colorimetry of total phenolics with phosphomolybdic-phosphotungstic acid reagents. Am. J. Enol. Vitic. 1965, 16, 144–158. [Google Scholar] [CrossRef]
  19. Fernández-Prior, Á.; Cardoso, J.C.; Bermúdez-Oria, A.; Reyes, Á.T.; Fernández-Bolaños, J.; Rodríguez-Gutiérrez, G.J.A. Application of a Cold-Pressing Treatment to Improve Virgin Olive Oil Production and the Antioxidant Phenolic Profile of Its by-Products. Antioxidants 2023, 12, 1162. [Google Scholar] [CrossRef]
  20. Araujo, M.N.; Vargas, S.R.; Soares, L.A.; Trindade, L.F.; Fuess, L.T.; Adorno, M.A.T. Rapid method for determination of biogas composition by gas chromatography coupled to a thermal conductivity detector (GC-TCD). Int. J. Environ. Anal. Chem. 2024, 104, 8690–8707. [Google Scholar] [CrossRef]
  21. Menzel, T.; Neubauer, P.; Junne, S. Role of Microbial Hydrolysis in Anaerobic Digestion. Energies 2020, 13, 5555. [Google Scholar] [CrossRef]
  22. Dahiya, S.; Sarkar, O.; Swamy, Y.V.; Mohan, S.V. Acidogenic fermentation of food waste for volatile fatty acid production with co-generation of biohydrogen. Bioresour. Technol. 2015, 182, 103–113. [Google Scholar] [CrossRef]
  23. Nair, V.V.; Dhar, H.; Kumar, S.; Thalla, A.K.; Mukherjee, S.; Wong, J.W.C. Artificial neural network based modeling to evaluate methane yield from biogas in a laboratory-scale anaerobic bioreactor. Bioresour. Technol. 2016, 217, 90–99. [Google Scholar] [CrossRef]
  24. Zhou, J.; Zhang, R.; Liu, F.; Yong, X.; Wu, X.; Zheng, T.; Jiang, M.; Jia, H. Biogas production and microbial community shift through neutral pH control during the anaerobic digestion of pig manure. Bioresour. Technol. 2016, 217, 44–49. [Google Scholar] [CrossRef]
  25. Goren, A.Y.; Dincer, I.; Khalvati, A. A comparative evaluation of dark fermentative bioreactor configurations for enhanced hydrogen production. Environ. Sci. Pollut. Res. 2025, 32, 2182–2209. [Google Scholar] [CrossRef] [PubMed]
  26. Lu, Y.; Zhang, Q.; Wang, X.; Zhou, X.; Zhu, J. Effect of pH on volatile fatty acid production from anaerobic digestion of potato peel waste. Bioresour. Technol. 2020, 316, 123851. [Google Scholar] [CrossRef]
  27. Sukphun, P.; Sittijunda, S.; Reungsang, A. Volatile Fatty Acid Production from Organic Waste with the Emphasis on Membrane-Based Recovery. Fermentation 2021, 7, 159. [Google Scholar] [CrossRef]
  28. Kelbert, M.; Machado, T.O.; Araújo, P.H.H.; Sayer, C.; de Oliveira, D.; Maziero, P.; Simons, K.E.; Carciofi, B.A.M. Perspectives on biotechnological production of butyric acid from lignocellulosic biomass. Renew. Sustain. Energy Rev. 2024, 202, 114717. [Google Scholar] [CrossRef]
  29. Sun, J.; Zhang, L.; Loh, K.-C. Review and perspectives of enhanced volatile fatty acids production from acidogenic fermentation of lignocellulosic biomass wastes. Bioresour. Bioprocess. 2021, 8, 68. [Google Scholar] [CrossRef]
  30. Holtzapple, M.T.; Wu, H.; Weimer, P.J.; Dalke, R.; Granda, C.B.; Mai, J.; Urgun-Demirtas, M. Microbial communities for valorizing biomass using the carboxylate platform to produce volatile fatty acids: A review. Bioresour. Technol. 2022, 344, 126253. [Google Scholar] [CrossRef]
  31. Agnihotri, S.; Yin, D.-M.; Mahboubi, A.; Sapmaz, T.; Varjani, S.; Qiao, W.; Koseoglu-Imer, D.Y.; Taherzadeh, M.J. A Glimpse of the World of Volatile Fatty Acids Production and Application: A review. Bioengineered 2022, 13, 1249–1275. [Google Scholar] [CrossRef]
  32. Strazzera, G.; Battista, F.; Andreolli, M.; Menini, M.; Bolzonella, D.; Lampis, S. Influence of different household Food Wastes Fractions on Volatile Fatty Acids production by anaerobic fermentation. Bioresour. Technol. 2021, 335, 125289. [Google Scholar] [CrossRef]
  33. Cheah, Y.-K.; Vidal-Antich, C.; Dosta, J.; Mata-Álvarez, J. Volatile fatty acid production from mesophilic acidogenic fermentation of organic fraction of municipal solid waste and food waste under acidic and alkaline pH. Environ. Sci. Pollut. Res. 2019, 26, 35509–35522. [Google Scholar] [CrossRef]
  34. Jiang, J.; Zhang, Y.; Li, K.; Wang, Q.; Gong, C.; Li, M. Volatile fatty acids production from food waste: Effects of pH, temperature, and organic loading rate. Bioresour. Technol. 2013, 143, 525–530. [Google Scholar] [CrossRef]
  35. Llamas, M.; Greses, S.; Tomás-Pejó, E.; González-Fernández, C. Carboxylic acids production via anaerobic fermentation: Microbial communities’ responses to stepwise and direct hydraulic retention time decrease. Bioresour. Technol. 2022, 344, 126282. [Google Scholar] [CrossRef] [PubMed]
  36. Rahimieh, A.; Nosrati, M. A review on biochemistry, microbiology and thermodynamic aspects of propionate: The key intermediate in the anaerobic digestion and wastewater treatment. Desalin. Water Treat. 2024, 317, 100191. [Google Scholar] [CrossRef]
  37. Lenzuni, M.; Converti, A.; Casazza, A.A. From laboratory- to industrial-scale plants: Future of anaerobic digestion of olive mill solid wastes. Bioresour. Technol. 2024, 394, 130317. [Google Scholar] [CrossRef]
  38. Calabrò, P.S.; Fòlino, A.; Tamburino, V.; Zappia, G.; Zema, D.A. Increasing the tolerance to polyphenols of the anaerobic digestion of olive wastewater through microbial adaptation. Biosyst. Eng. 2018, 172, 19–28. [Google Scholar] [CrossRef]
  39. Najla, T.; Habibi, M.; Ammar, M.H.; Abazza, L.; Mhamdi, R. Olive Fruit by-Products: From Waste Streams into a Promising Source of Value-Added Products. In Mediterranean Fruits Bio-Wastes: Chemistry, Functionality and Technological Applications; Ramadan, M.F., Farag, M.A., Eds.; Springer International Publishing: Cham, Switzerland, 2022; pp. 47–66. [Google Scholar]
  40. Caballero-Guerrero, B.; Garrido-Fernández, A.; Fermoso, F.G.; Rodríguez-Gutierrez, G.; Fernández-Prior, M.Á.; Reinhard, C.; Nyström, L.; Benítez-Cabello, A.; Arroyo-López, F.N. Antimicrobial effects of treated olive mill waste on foodborne pathogens. LWT 2022, 164, 113628. [Google Scholar] [CrossRef]
  41. Guo, Y.; Weber, W.J.; Yao, D.; Caixeta, L.; Zimmerman, N.P.; Thompson, J.; Block, E.; Rehberger, T.G.; Crooker, B.A.; Chen, C. Forming 4-Methylcatechol as the Dominant Bioavailable Metabolite of Intraruminal Rutin Inhibits p-Cresol Production in Dairy Cows. Metabolites 2022, 12, 16. [Google Scholar] [CrossRef]
  42. Soares, T.F.; Alves, R.C.; Oliveira, M.B.P.P. From Olive Oil Production to By-Products: Emergent Technologies to Extract Bioactive Compounds. Food Rev. Int. 2024, 40, 3342–3369. [Google Scholar] [CrossRef]
Figure 1. (A) Accumulation soluble compound (sCOD) values measured in milligrams of oxygen per liter over the reactor operation time under pH 5 and BES conditions. (B) Representation of the percentage of soluble organic matter in the reactor organic matter throughout the experimental time under pH 5 and BES conditions.
Processes 13 00600 g001aProcesses 13 00600 g001b
Figure 2. Variation of the individual VFA and pH values along operation time under the pH 5 condition (bars represent standard deviation).
Processes 13 00600 g002
Figure 3. Variation of the individual VFA and pH values along the operation under the BES condition (bars represent standard deviation).
Processes 13 00600 g003
Figure 4. Variation of the total phenolic compound concentrations with their standard deviations at the end of each hydraulic retention time (HRT) (bars represent standard deviation).
Processes 13 00600 g004
Table 1. Biogas compositions with their standard deviation at the end of each hydraulic retention time (HRT) repetition.
Time (Days)HRT
Repetitions
CH4 (%)CO2 (%)H2 (%)mL Biogas/gVS
pH 50–131-HRT51.35 ± 4.7748.65 ± 4.77n.d.15.48 ± 17.29
14–282-HRT11.93 ±5.8987.12 ± 4.541.00 ± 1.0015.79 ± 6.80
29–423-HRT27.37 ± 7.4472.63 ± 7.44n.d.9.28 ± 10.12
43–574-HRT32.79 ± 15.0167.21 ± 5.01n.d.2.88 ± 2.56
BES0–131-HRT8.69 ± 2.7891.31 ± 2.78n.d.19.69 ± 15.84
14–282-HRT22.10 ± 9.1077.89 ± 9.09n.d.25.44 ± 22.38
29–423-HRT29.59 ± 0.8870.40 ± 0.88n.d.34.19 ± 14.92
43–574-HRT13.34 ± 1.7386.66 ± 1.73n.d.23.47 ± 1.07
n.d.: not detected.
Table 2. Individual phenolic compound concentrations with their standard deviations at the end of four repetitions of hydraulic retention time (HRT).
pH 5BES
Time (Days)1-HRT2-HRT3-HRT4-HRT1-HRT2-HRT3-HRT4-HRT
0–13 Days14–28 Days29–42 Days43–57 Days0–13 Days14–28 Days29–42 Days43–57 Days
3,4-dihydroxyphenylglycol (mg/L)7.46 ± 1.337.53 ± 1.8783.46 ± 10.3468.04 ± 21.694.57 ± 1.0917.50 ± 11.4122.33 ± 1.44168.78 ± 27.40
Hydroxytyrosol (mg/L)56.37 ± 23.3746.70 ± 24.1472.47 ± 11.49116.25 ± 11.50n.d.n.d.30.39 ± 1.1025.80 ± 1.77
Tyrosol (mg/L)15.37 ± 7.1937.57 ± 6.4256.80 ± 16.1138.68 ± 27.56n.d.n.d.17.83 ± 1.0030.92 ± 27.40
Protocatechuic acid (mg/L)11.53 ± 9.4648.88 ± 17.3954.92 ± 50.2425.81 ± 18.788.67 ± 1.0018.83 ± 7.0440.93 ± 7.2852.66 ± 2.10
3,4-dihydroxycinnamic acid (mg/L)4.80 ± 0.1420.32 ± 20.2638.51 ± 37.1554.30 ± 9.03n.d.5.59 ± 0.607.34 ± 0.486.87 ± 0.64
4-Metylcatehol (mg/L)8.71 ± 1.007.93 ± 0.699.03 ± 1.007.02 ± 1.1180.82 ± 7.34108.64 ± 18.3956.44 ± 27.4532.68 ± 17.55
n.d.: not detected.
Disclaimer/Publisher’s Note: The statements, opinions and data contained in all publications are solely those of the individual author(s) and contributor(s) and not of MDPI and/or the editor(s). MDPI and/or the editor(s) disclaim responsibility for any injury to people or property resulting from any ideas, methods, instructions or products referred to in the content.

