Abstract
Studying particle discharge rates in fluidized bed technology is important for optimizing continuous processes and improving product quality. This study investigates particle discharge, specifically the mass outflow rate, from a pilot-scale fluidized bed by means of experimental methods and mathematical modeling. The modeling uses various algebraic equations to predict the mass outflow rate and the time evolution of bed mass. Experiments in which these quantities were measured were conducted under different conditions, including varying mass inflow rates and process modes such as continuous and semi-batch. The results indicate that the mass outflow rate can be effectively modeled using existing equations from the literature, as well as a newly introduced equation, providing a comprehensive understanding of the holdup and discharge behavior of the fluidized bed. The newly introduced equation seems to perform better under transient conditions, being most appropriate for automatic control.
1. Introduction
Fluidized bed technology is widely used across various industrial sectors such as the chemical, pharmaceutical, and food industries [1]. It operates by suspending solid particles in an upward flow of gas or liquid, allowing the particles to exhibit fluid-like behavior [2]. Fluidization creates a dynamic environment in which particles are constantly moving, colliding, and interacting with each other and the fluid, influenced by factors such as particle size, shape, density, and the velocity of the fluidizing medium. Fluidized bed technology is used in coating processes [3], granulation [4], and agglomeration processes [5]. Its advantages include enhanced mass transfer, uniform temperature distribution, and improved process efficiency, making it a critical component in achieving high product quality across various sectors [6,7].
In industrial applications like pre-reduction furnaces for iron ore processing, controlling particle discharge from the fluidized bed is crucial for optimizing reaction times and maintaining bed stability [8]. Bubbling fluidized-bed reactors in these furnaces use overflow outlets to release finer particles, allowing coarser particles to stay longer and complete their reactions. Because particle size tends to decrease with increasing bed height, precise discharge control is essential for maintaining a stable particle size distribution. Accurate prediction of discharge dynamics impacts the bed mass, residence time, and key operational factors like gas pressure.
Outlet conditions, which are possibly classifying, are at least equally important for spray-fluidized bed granulation processes that are operated with recycle [9]. Because the outflow influences the holdup and the average residence time, it plays a crucial role in drying [10] or spray-coating [11] processes. Such processes are often conducted in continuously operated horizontal fluidized beds, which can be designed with the goal of keeping the spread of the residence time distribution of the particles low. The flow of particles in such equipment, including the outflow and the transition between compartments, can be simulated by means of the computational fluid dynamics (CFD) of either the Euler–Euler or Euler–Lagrange type [12,13,14,15]. However, CFD is computationally expensive and does not alleviate the necessity of simple algebraic outflow equations that can be solved even for fast processes in real time for automatic control purposes. In order to obtain particle residence time, correlations of holdup (bed mass) are derived in [16], though correlations for the outflow rate would serve the purpose better. In [17], a comprehensive population balance model for segmented horizontal fluidized beds is proposed, but the parametrization of inter-compartmental as well as outlet particle flow conditions is kept open in it, underlying the need for reliable correlations to this purpose. Similarly, the authors of [18] refrain from defining the outflow from a continuously operated cylindrical fluidized bed by equations, instead using measured values when comparing experimental results with their newly introduced discrete (Monte Carlo) model for continuous spray-fluidized bed agglomeration.
Determining particle discharge in fluidized beds is inherently complex due to the range of factors that influence it, such as bed geometry, particle properties, fluid velocity, and discharge design. Thus, the few researchers who have investigated this topic until now have developed different approaches. For example, particle tracking velocimetry was used by Meyer et al. [19]. They conducted experiments in a batch, using a pseudo-two-dimensional fluidized bed and high-speed cameras to capture particle movements. Image analysis software then tracked particle motion to analyze exchange rates between the chambers. The study offers key insights into particle dynamics. However, its two-dimensional setup confines observation to only a portion of the fluidized bed’s natural three-dimensional movement, potentially missing interactions across the bed’s full structure.
Building on methods to track particle flow, Vollmari and Kruggel-Emden [20] investigated the average particle velocity in a continuously operated dual-chamber fluidized bed using a radio frequency identification (RFID) system. Ultra-high frequency antennas were strategically placed at the inlet, outlet, and connection between the chambers. Particles were equipped with RFID tags, allowing the researchers to monitor the particles’ passage across these locations. This setup allowed for measuring residence times within each chamber and calculating the average particle velocity. However, this approach has limitations: the detection of the radio frequency identification system is restricted to a specific radius around each antenna and is sensitive to interference from metallic components, requiring precise positioning. Additionally, fine-tuning the radio frequency identification system and manufacturing tagged particles is time-consuming, which can complicate studies that demand rapid data collection or large sample sizes.
With a similar aim of understanding particle exchange dynamics, Lau et al. [21] conducted a study focused on the unsteady particle exchange in a horizontal, two-compartment batch fluidized bed, which distinguishes it from many other studies that primarily examine steady-state conditions. To capture particle exchange patterns, the researchers used a CFD multiphase model based on the Euler–Euler approach, validated through experiments with varying slot heights and bed masses. Using image analysis, they tracked the mass fractions of black and white particles in each compartment over time, assessing how changes in slot height and bed mass influenced the exchange behavior. Although the study provides a detailed look at unsteady exchange mechanisms, it relies heavily on CFD modeling rather than experiments alone. Additionally, the batch configuration restricts the findings to conditions that differ from continuous flow, where particle exchange may respond to external mass-flow rates.
While some studies have employed experimental tracking techniques and simulations to understand particle dynamics in fluidized beds, an alternative approach leverages algebraic equations to determine particle discharge. A widely used model, initially developed by Jones and Davidson [22], estimates the particle discharge rate as a function of the square root of the pressure drop between compartments, treating particles as fluid-like entities based on principles similar to Bernoulli’s equation. In their study on urea production, Bertin et al. [23,24] integrated this equation into a mathematical model for multi-chamber fluidized bed systems, applying the equation as originally formulated. In contrast, Burgschweiger and Tsotsas [25] adapted the Jones and Davidson [22] equation to a continuous fluidized bed-drying process, incorporating additional factors specific to their setup. Both studies used these algebraic equations in continuous systems. Recently, Fu et al. [26] applied a combined theoretical and machine-learning approach to predict the mass flow rates in a gas–solid separation fluidized bed. They modified the conventional discharge formula by incorporating a bed expansion ratio and an artificial neural network, demonstrating the potential of integrating data-driven methods with traditional algebraic models for dynamic particle discharge.
While the Jones and Davidson [22] equation has been effectively applied in continuous, steady-state systems, its performance in dynamic settings—where conditions undergo a transition between unsteady and steady states—remains unexplored. Although Burgschweiger and Tsotsas [25] extended their model to dynamic conditions, their focus was on fluidized bed-drying processes, which differ from the particle discharge scenarios considered here. Additionally, previous studies have primarily examined particle discharge in lab-scale fluidized beds, limiting insights into large-scale applications.
In this study, particle discharge from a pilot-scale fluidized bed is investigated through experiments that contain transitions between unsteady and steady conditions, using experimental methods alongside mathematical modeling. This study focuses on the mass outflow rate—a practical and consistent measure of particle discharge—which enables straightforward comparisons across different conditions. The performance of the Jones and Davidson equation, its modified version by Burgschweiger and Tsotsas, and a newly developed algebraic equation are examined. The mass outflow rate is first determined experimentally across a range of conditions. Subsequently, each algebraic equation is applied to model this dynamic behavior, and its performance is evaluated against experimental data to assess its accuracy.
This paper is structured as follows: Section 2 details the material, experimental setup, and plan. Section 3 presents the derivation of the model and introduces the algebraic equations. Section 4 discusses the experimental results, presents the modeling outcomes for each algebraic equation, and undertakes a performance comparison. Section 5 provides a summary of findings.
2. Methods and Materials
2.1. Material
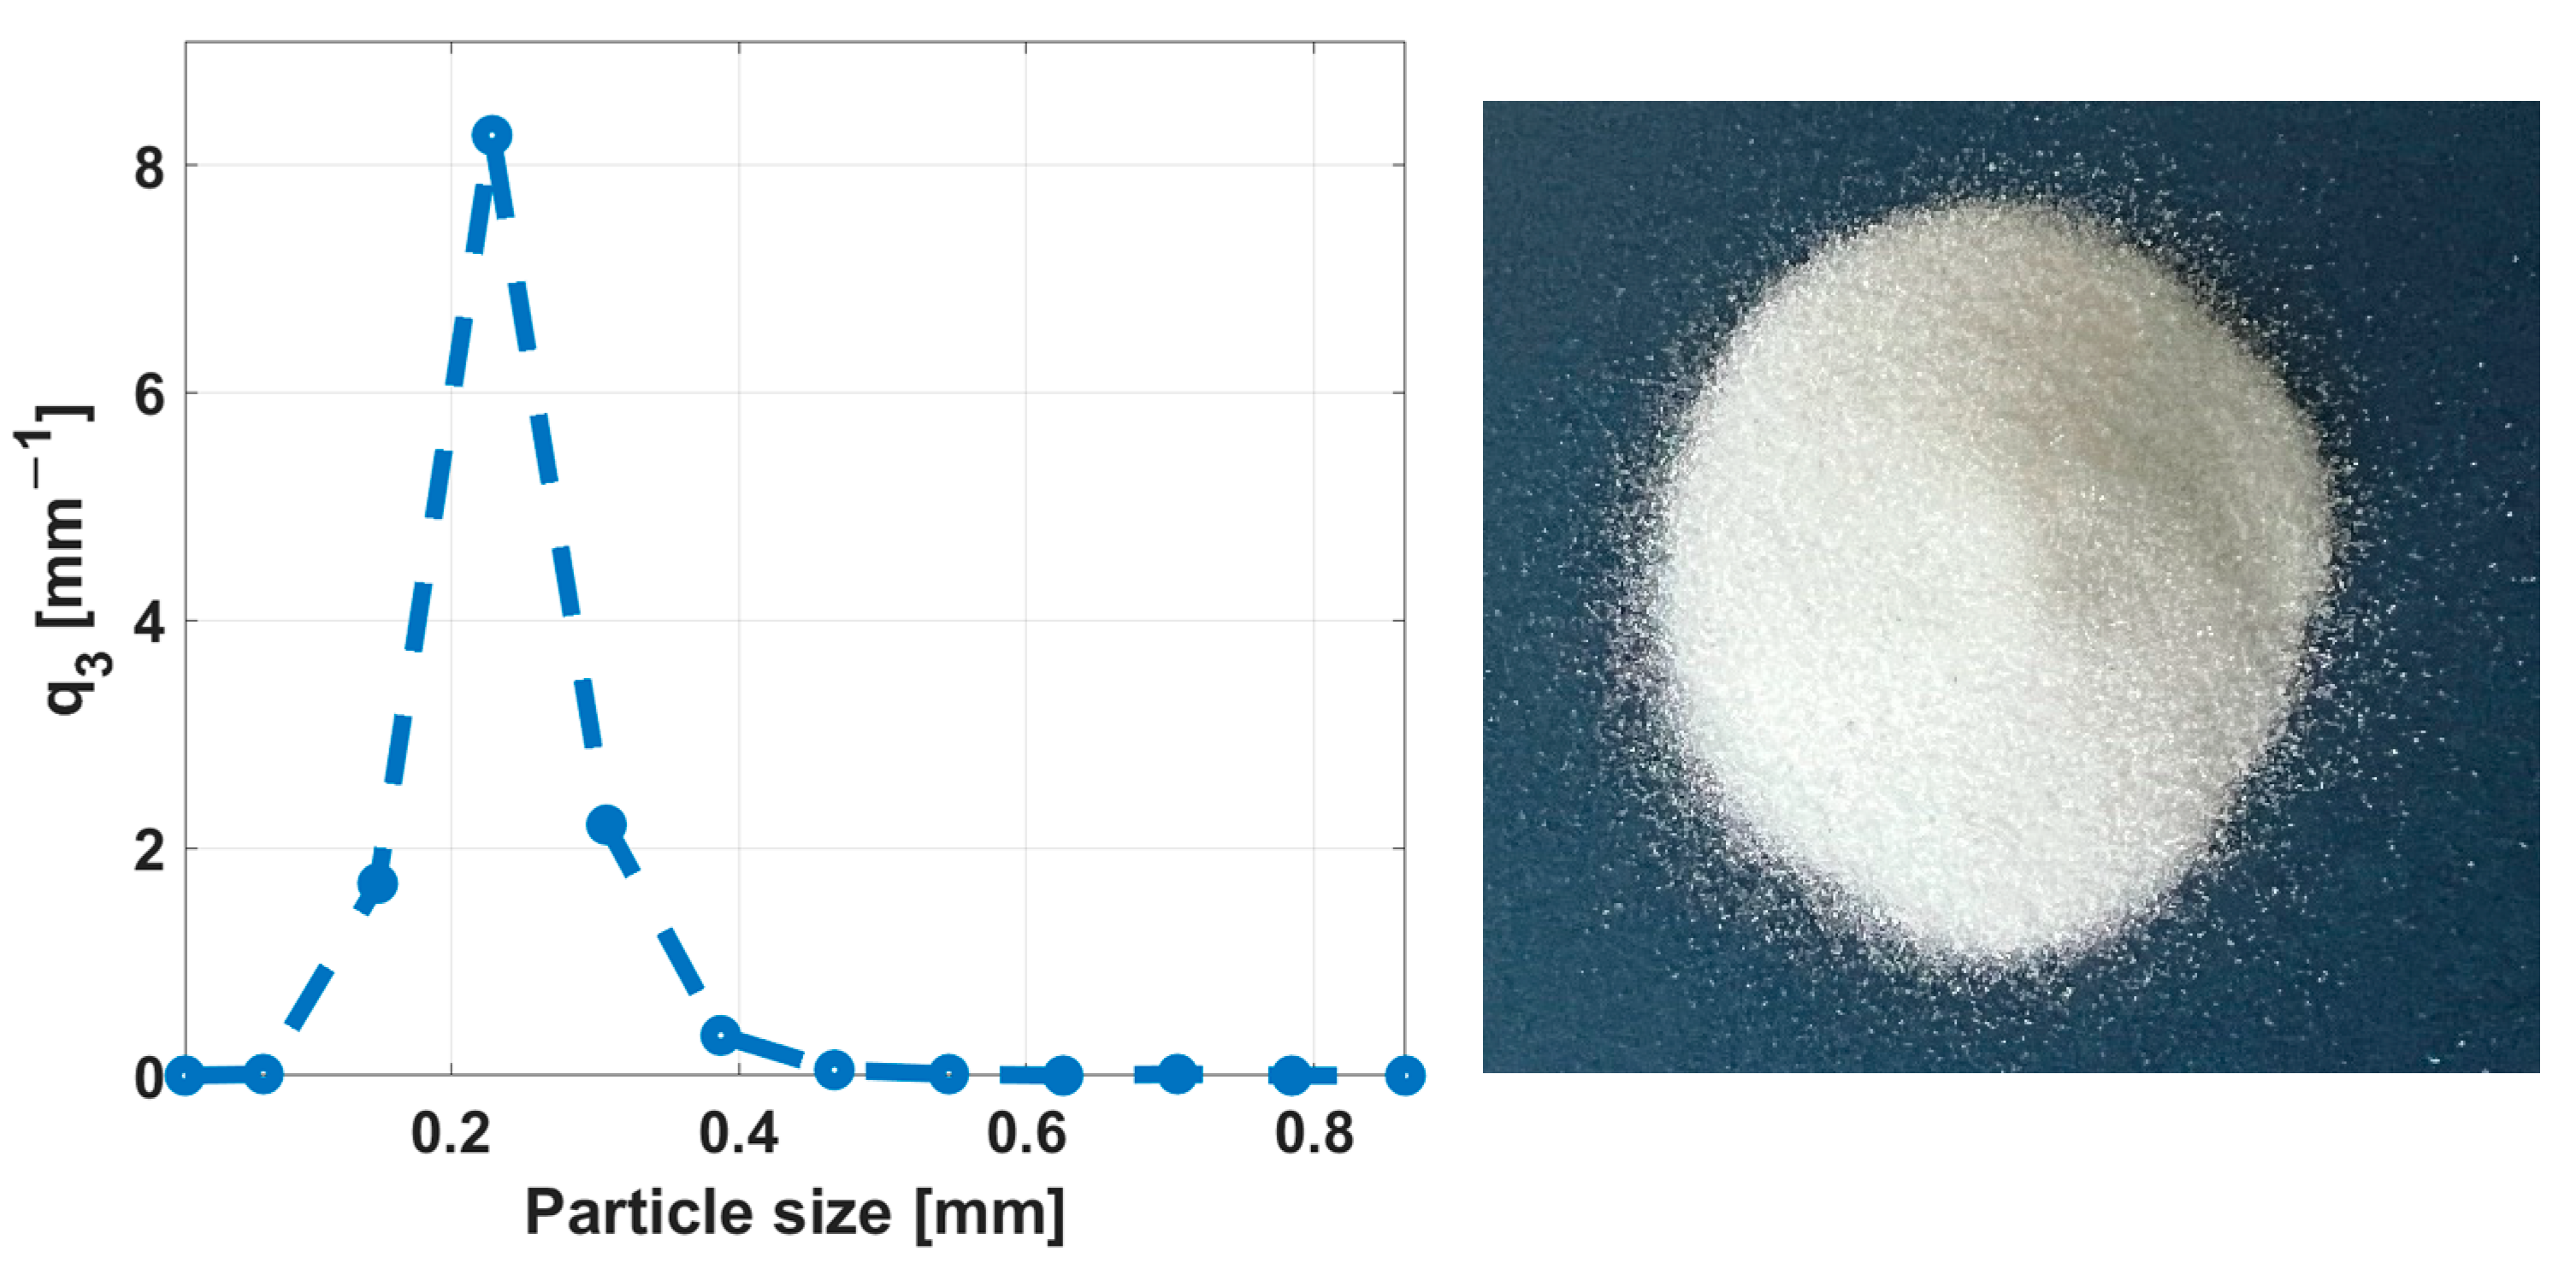
Glass beads, a commonly used nonporous substance, were utilized as the feeding material for this study. These glass beads were supplied by Sigmund Lindner GmbH, Warmensteinach, Germany [27]. The particles had a mean sphericity of 0.80, a relatively narrow diameter distribution ranging between 100 and 400 μm, and a density of 2500 kg/m3. Figure 1 presents the particle size distribution of the glass beads, measured using a Camsizer (Retsch Technologies GmbH, Haan, Germany). The mean particle diameter was determined to be 226 μm based on the obtained particle size distribution. The particles are assumed to be perfectly spherical; hence, the minimum fluidization porosity () for spherical particles typically falls within the range of 0.39–0.41 [28,29]. Therefore, for this study, a value of was chosen as a reasonable approximation for the glass bead bed.

Figure 1.
Particle size distribution and an image of the glass beads.
2.2. Experimental Setup
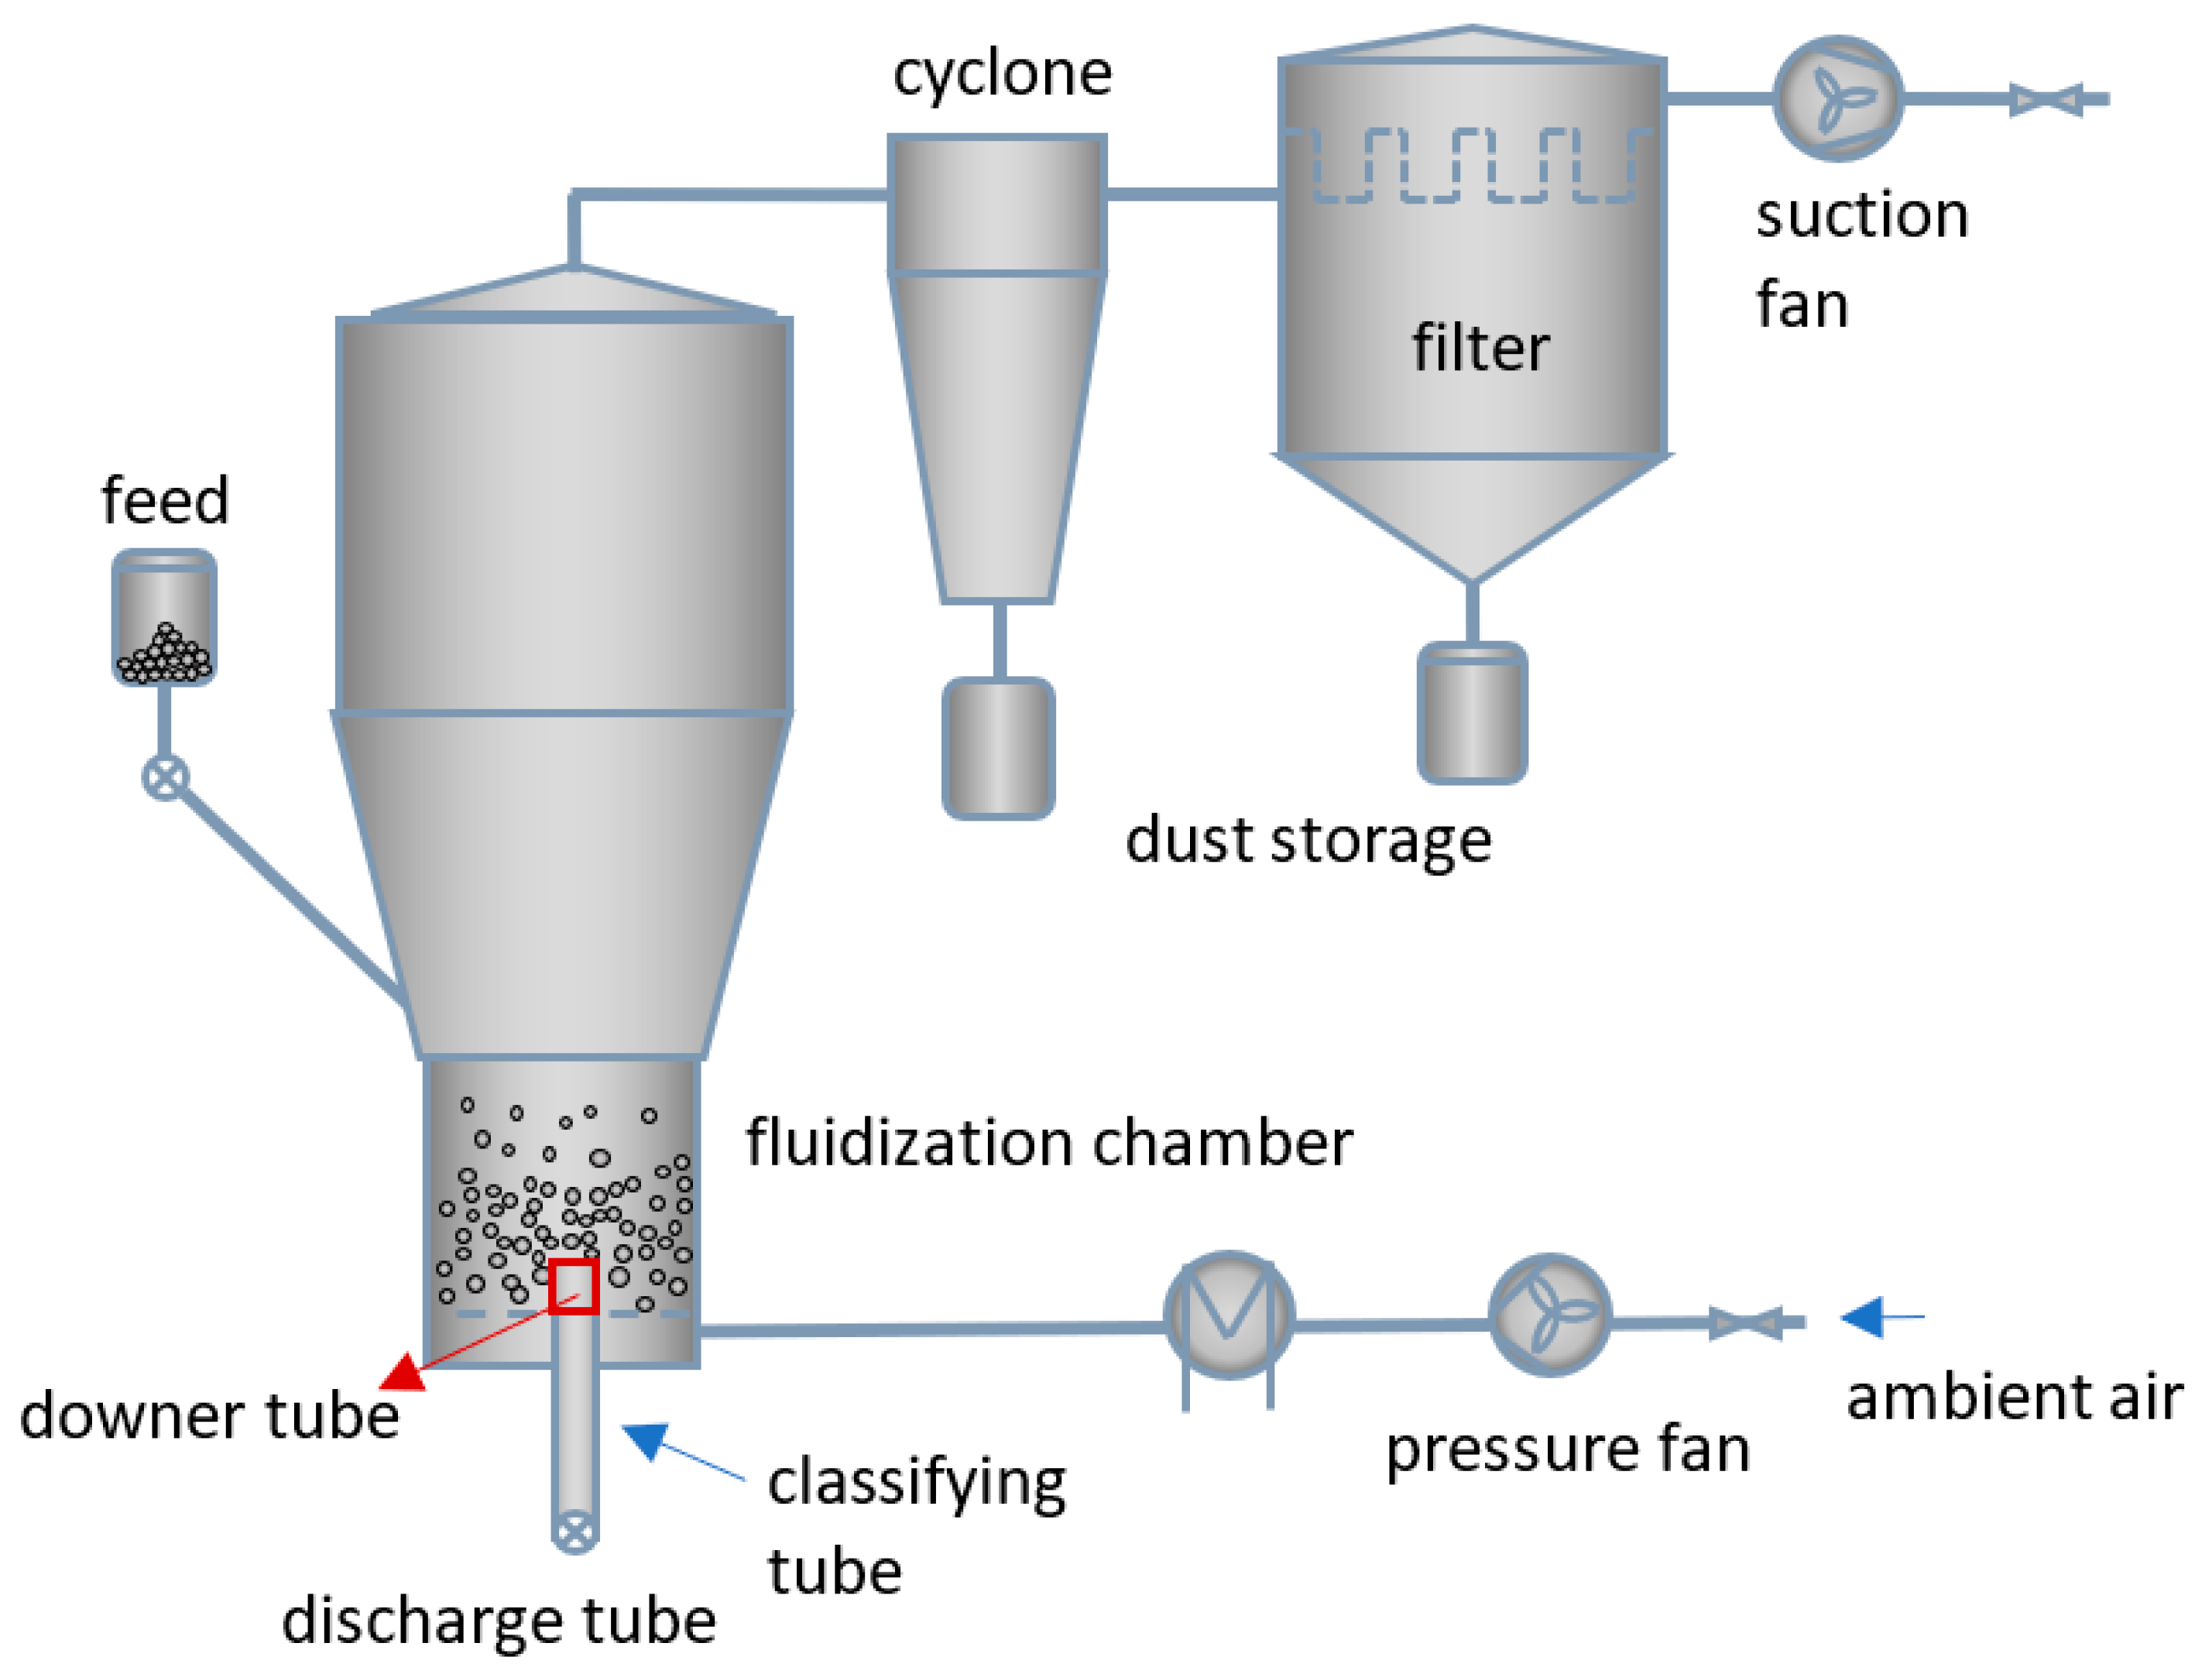
Experiments were carried out in a pilot-scale fluidized bed plant (Pergande Group, Südliches Anhalt, Germany), as shown in Figure 2. The plant features a cylindrical fluidized bed with an internal diameter of 300 mm and a sintered metal distributor plate with a pore size of around 100 µm. Two fans (Elektror airsystems GmbH, Ostfildern, Germany, model: HRD65FU-100/7,5) are used to regulate the mass flow rate and pressure inside the plant. The particles are fluidized with ambient air drawn from the environment. The exhaust air exits the chamber through a relaxation zone that helps prevent particle escape. It then passes through a cyclone and filter system, which together remove dust from the air stream.
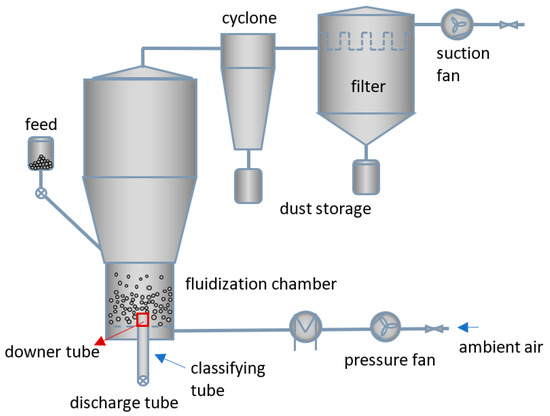
Figure 2.
Scheme of the pilot-scale fluidized bed plant.
Particles are fed from the top of the fluidized bed, and material discharge occurs from the bed’s base through a central classifying tube (inner diameter: 44 mm; length: 720 mm) with its upper end flush with the upper end of the air distributor plate. This tube is denoted as the classifying tube because it can be operated with classifying air, though this option was not used in the present work. Additionally, a downer tube is installed above the gas distributor plate right on the classifying tube, as shown in Figure 2. For this study, downer tubes with two heights, 70 mm and 110 mm, were used. Both tubes had an inner diameter of 20 mm. Parameters such as temperature of the bed and gas mass flow rate were measured and recorded by a process control system (PCS, Siemens AG, München, Germany, model: WinCC).
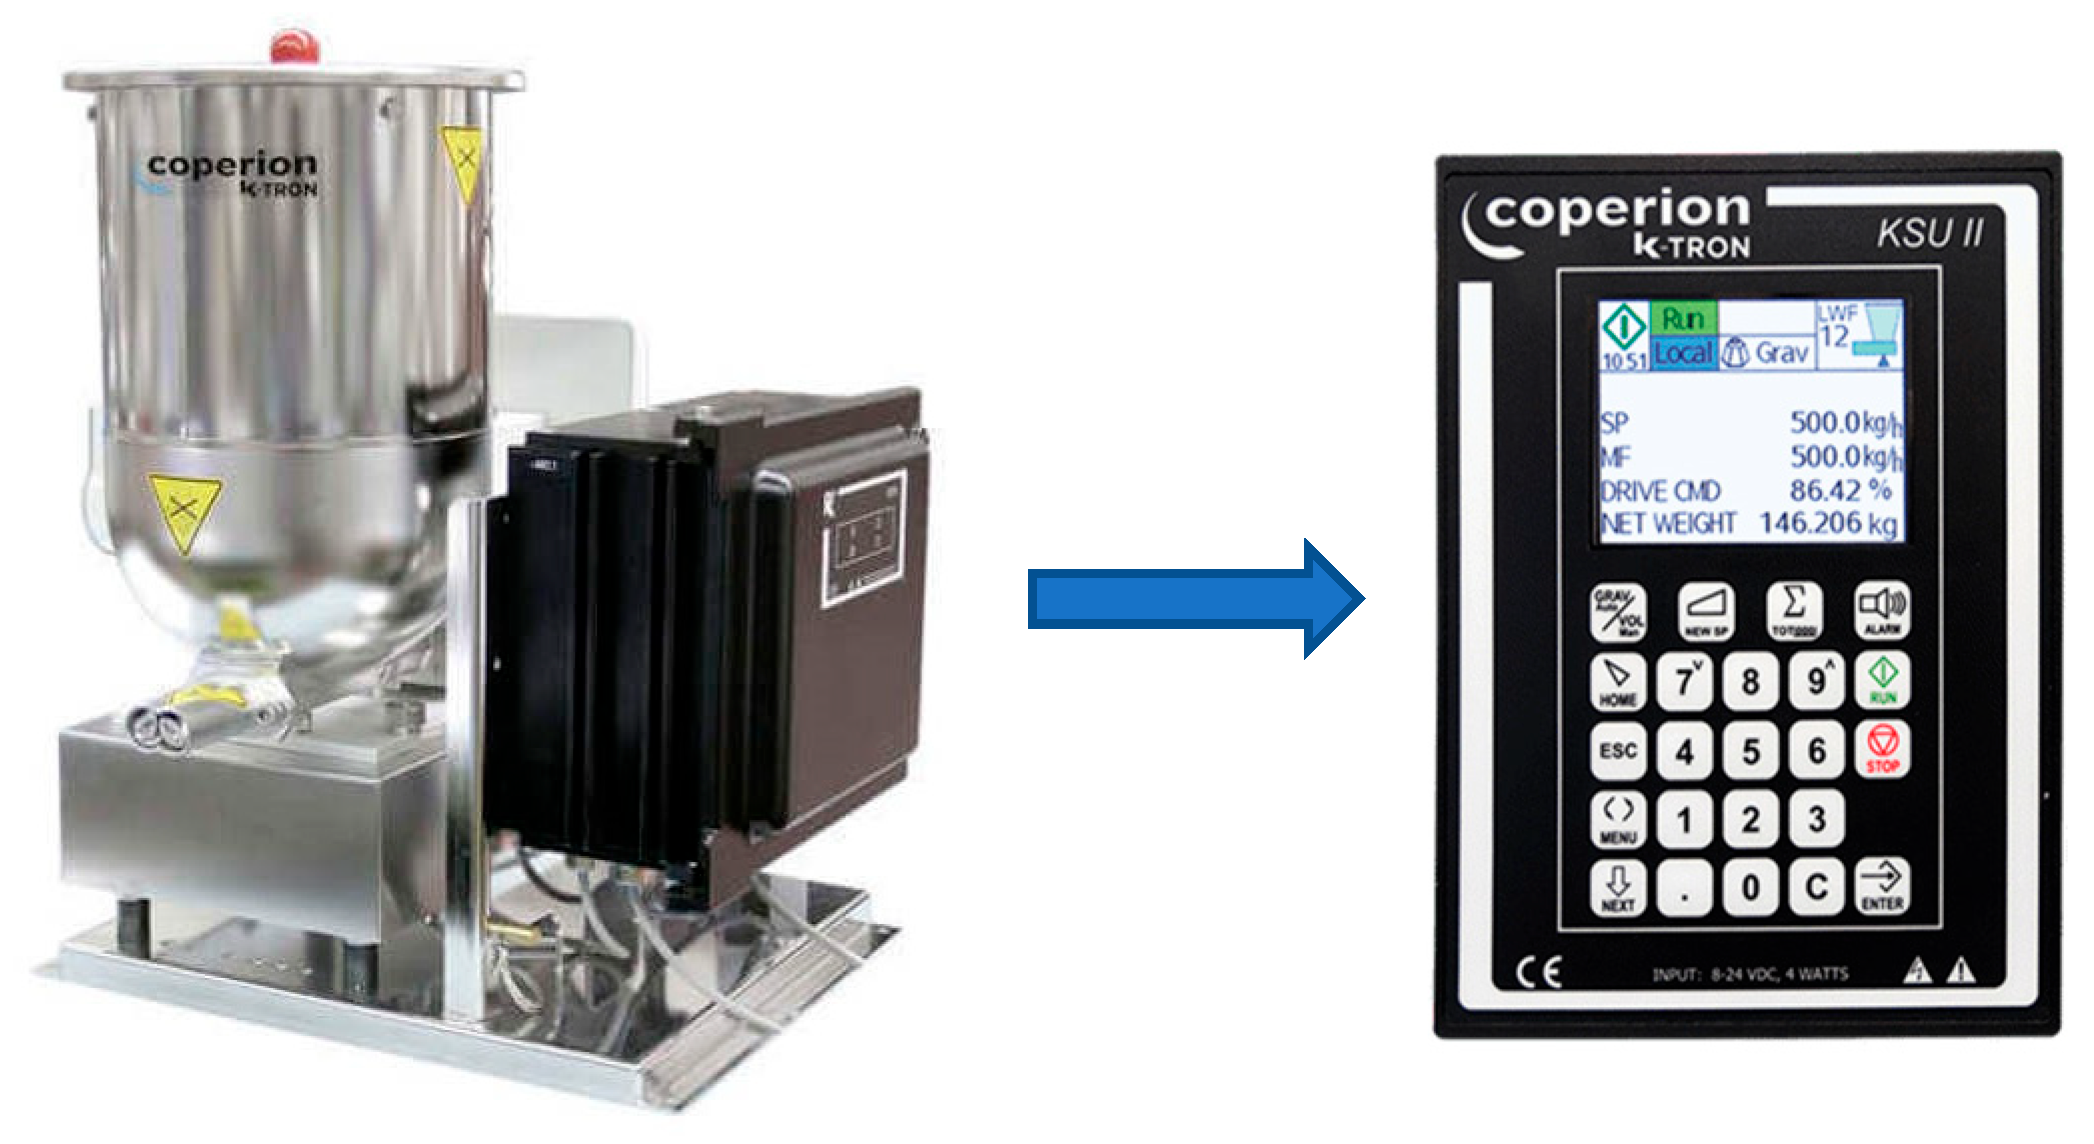
A gravimetric twin-screw feeder with an integrated control module, as shown in Figure 3, was used to supply material to the bed with a consistent mass flow rate [30]. The feeder began operation after the hopper is filled with glass beads and the desired inflow rate was set. The hopper has a maximum capacity of 20 kg. Finally, a precision balance (Sartorius AG, Göttingen, Germany), was used in the experiment to weigh material as needed [31].

Figure 3.
Gravimetric twin-screw feeder.
2.3. Experimental Plan
The experiments were conducted to evaluate the effects of different conditions on the mass outflow rate , which is the rate at which particles exit the system, and the bed mass , which represents the total mass of particles within the fluidized bed. Five experimental cases were carried out, as shown in Table 1. Initial bed mass and particle mass inflow rates were intentionally set to specific values at the start of each experiment.

Table 1.
Experimental parameters.
In Cases 1 through 4, continuous experiments were performed with zero initial bed mass, = 0. For these cases, was maintained at a steady rate throughout each experiment. This approach created a transitional state: During the starting period of each experiment, the fluidized bed gradually filled, resulting in an unsteady state. Then, the bed approached a stable mass discharge rate as the system underwent a transition to a steady state. In this way, each continuous experiment captured both unsteady and steady conditions. Case 4 introduced a change in the downer tube height,, increasing it to 110 mm (from the standard 70 mm) while keeping the inflow rate similar to Case 3, allowing for the assessment of downer tube height’s impact on bed dynamics. In Case 5, a semi-batch process was used, where the bed was initially filled with a set mass ( = 6.21 kg), and no particle inflow rate was applied. This setup led to an unsteady process, as was measured while the bed emptied over time.
For all cases, the fluidizing air mass flow rate, , was maintained at around 288 kg/h, which corresponds to the atmospheric pressure, and an ambient temperature of 25 °C, which corresponds to to a superficial gas velocity of 0.975 m/s in the fluidized bed (around 20 times the minimal fluidization velocity of used glass particles, cf. Section 3.4). The bed mass was weighed at the end of each experiment. Continuous experiments were run until a steady state was reached, defined as the point at which was within ±5% of . The process time varied for each case, as the time required to reach a steady state depended on factors such as feed flow rate or downer tube height. To ensure experimental accuracy, process parameters—including fluidizing air and mass inflow—were started and stopped simultaneously across all cases. This synchronization minimized the variability in measured values.
For each experiment, and were measured. in the time interval to was determined via the following equation:
The mass that left the bed from to is measured directly by collecting the discharged particles in a box that is empty at and is filled until , with subsequent weighing and immediate replacement by another sample weighing box.
Bypassing the fluidized bed, i.e., connecting the twin screw feeder directly to the sample weighing box ensured that could be determined in the same way as . With both those quantities known in the course of time , could be obtained from the following equation:
After these experiments were completed, the next step involved developing a mathematical model to simulate and understand the observed behaviors of the mass outflow rate and bed mass under different conditions.
3. Mathematical Modeling
3.1. Mass Balance Equation
In this section, a mathematical model is developed to predict the and observed in the pilot-scale fluidized bed plant. This model aims to describe how the bed mass changes over time based on the inflow and outflow of particles. Figure 4 provides a schematic representation of the fluidized bed system, where represents the mass inflow rate of the particles entering the bed from the top, and denotes the mass outflow rate at the outlet. Moreover, Figure 4 illustrates (indicated by the bottom red dotted line), which represents the expanded bed height, and (indicated by the top red dotted line), which accounts for pulsation effects in the system. The detailed explanation of and will be discussed later in this section.
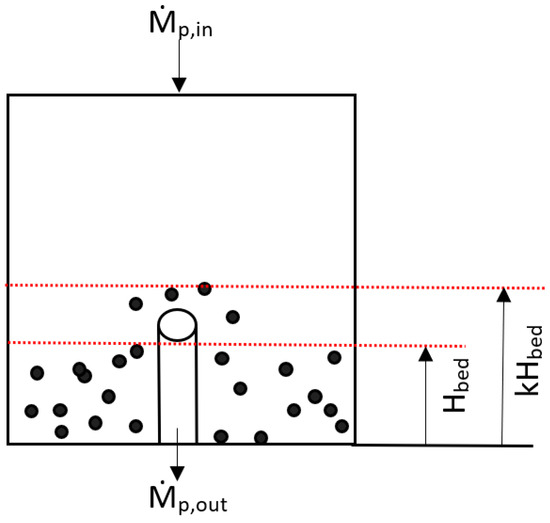
Figure 4.
Schematic of solids outlet from the fluidized bed.
To develop the model, a mass balance is applied to the fluidized bed system as shown in Equation (3), which describes the rate of change of over time due to the inflow and outflow of particles:
In this setup, is considered constant, as the feed flow rate remains steady throughout the process. In contrast, is evaluated based on algebraic equations that account for the conditions within the fluidized bed. It should be noted that Equation (3) is the differential form of Equation (2).
3.2. Mass Outflow Rate Equations
To make Equation (3) predictive, the particle discharge rate ust be known. To determine , three outflow equations are applied, starting with the equation from Jones and Davidson [22]. This approach assumes fluid-like behavior within the bed, leading to the following relationship:
where,
- is the discharge coefficient with a value of 0.5, as given by the authors [22];
- is the cross-sectional area of the downer tube;
- is the bed density;
- is the gravitational acceleration;
- is the expanded fluidized bed height;
- is the downer tube height.
Building on this approach, Burgschweiger and Tsotsas [25] introduced additional factors to account for more complex dynamics within the fluidized bed. Their model was applied to a system very similar to the one studied here, featuring a tube installed inside the fluidized bed. This similarity strengthens the applicability of their approach to the current study.
In their model, Burgschweiger and Tsotsas [25] added an inflow parameter, ⍺, and a pulsation factor, as well as a condition indicating that is zero when the effective bed height () is less than or equal to the downer tube height, . This condition reflects the fact that, under such circumstances, the bed particles do not reach the height necessary for discharge through the tube outlet. This approach is represented by the following equation:
As illustrated Figure 4, the pulsation factor is particularly important in this model, as it allows for particle outflow even when the average expanded bed height () is somewhat lower than the height of the downer tube (). Because the amplitude of bed pulsations diminishes toward minimum fluidization, the study proposed a simplified relationship to calculate :
where,
- is the Reynolds number at superficial gas velocity ;
- is the Reynolds number at minimum fluidization;
- is an empirically derived pulsation factor exponent, based on experimental measurements.
The inflow parameter and the pulsation factor exponent are determined through a fitting process based on experimental measurements across all cases. These parameters are fitted to the equation, which is then compared to the experimentally measured . The process involves setting initial values for and , running the model, and evaluating the predicted against the experimental data. The final values of and are selected based on the best overall agreement across all cases, ensuring optimal model performance. In [25], Burgschweiger and Tsotsas determined the two parameters of their model to be α = 0.0316 and m = 0.261.
In addition to the outflow equations from the literature, an original equation is developed in this study to further refine the calculation of . Inspired by the equation of Burgschweiger and Tsotsas [25], this new approach introduces an exponential term that incorporates the bed height and downer tube height. The equation is given by:
In total, three algebraic equations, including this extended equation, will be applied to model and . In the results and discussion section, the equations from Jones and Davidson will be referred to as J&D, those from Burgschweiger and Tsotsas as B&T, and the newly introduced equation as the extended equation. These equations are used to investigate how each one performs in capturing the fluidized bed dynamics observed experimentally.
3.3. Determination of Bed Height and Fluidization Parameters
After defining the outflow equations, it is essential to determine as it directly impacts the mass outflow rate calculations. The bed height is calculated as follows:
where
- is the cross-sectional area of the fluidized bed;
- is particle density;
- is bed porosity.
Bed porosity, is calculated using the equation of Richardson and Zaki [32]:
where
- is the Reynolds number at the elutriation point;
- is an exponent.
The exponent, , is determined according to Martin [33]:
The Reynolds numbers are defined with the particle diameter and calculated as follows:
- Reynolds number at superficial gas velocity, , characterizes the general flow conditions in the bed:where is the kinematic viscosity of the gas, while the superficial gas velocity is obtained as:where is the gas density.
- Reynolds number at minimum fluidization,, indicates the point at which fluidization begins, according to Martin [33]:where the Archimedes number, , is defined as:
- The Reynolds number at the elutriation point, corresponds to the gas velocity needed to carry particles out of the bed. This is obtained for heterogeneous fluidization after Reh [34]:
3.4. Fluidized Bed Parameters and Model Implementation
The operating conditions, gas properties, and geometrical parameters of the pilot-scale fluidized bed system, which are constant across all cases and essential for determining the fluidization conditions, are summarized in Table 2. In particular, the gas properties include gas density () and kinematic viscosity (), both determined at an ambient temperature of 25 °C and 1 atm. The operating conditions refer to the mass flow rate of gas (), the particle diameter (), and gravitational acceleration (). is specified according to the experimental conditions used in this study. Additionally, the geometrical parameter considered is the cross-sectional area of the fluidized bed ().
Table 2.
Parameters for fluidized bed modeling.
To determine , it is necessary to account for the area occupied by the downer tube, which is installed at the center of the bed. The fluidized bed has an inner diameter of 300 mm, corresponding to a certain cross-sectional area. However, the downer tube, which has an outlet diameter of 20 mm, is designed with a larger 50 mm diameter at its base for installation purposes. This larger base enables the secure positioning of the tube at the center of the bed. The actual fluidization area is calculated by subtracting the cross-sectional area of the 50 mm diameter section of the downer tube from the total area of the 300 mm diameter fluidized bed. Hence, is determined to be 0.0687 m2. is determined based on the 20 mm outlet diameter of the downer tube.
With these parameters established, all the quantities that characterize the fluidization state can be calculated with the values shown in Table 3. This table presents the key fluidization parameters along with the corresponding equations used for their calculation. After determining using Equation (13), the minimum fluidization velocity is derived from Equation (11) using the known values of and .
Table 3.
Summary of key parameters that characterize the fluidized bed.
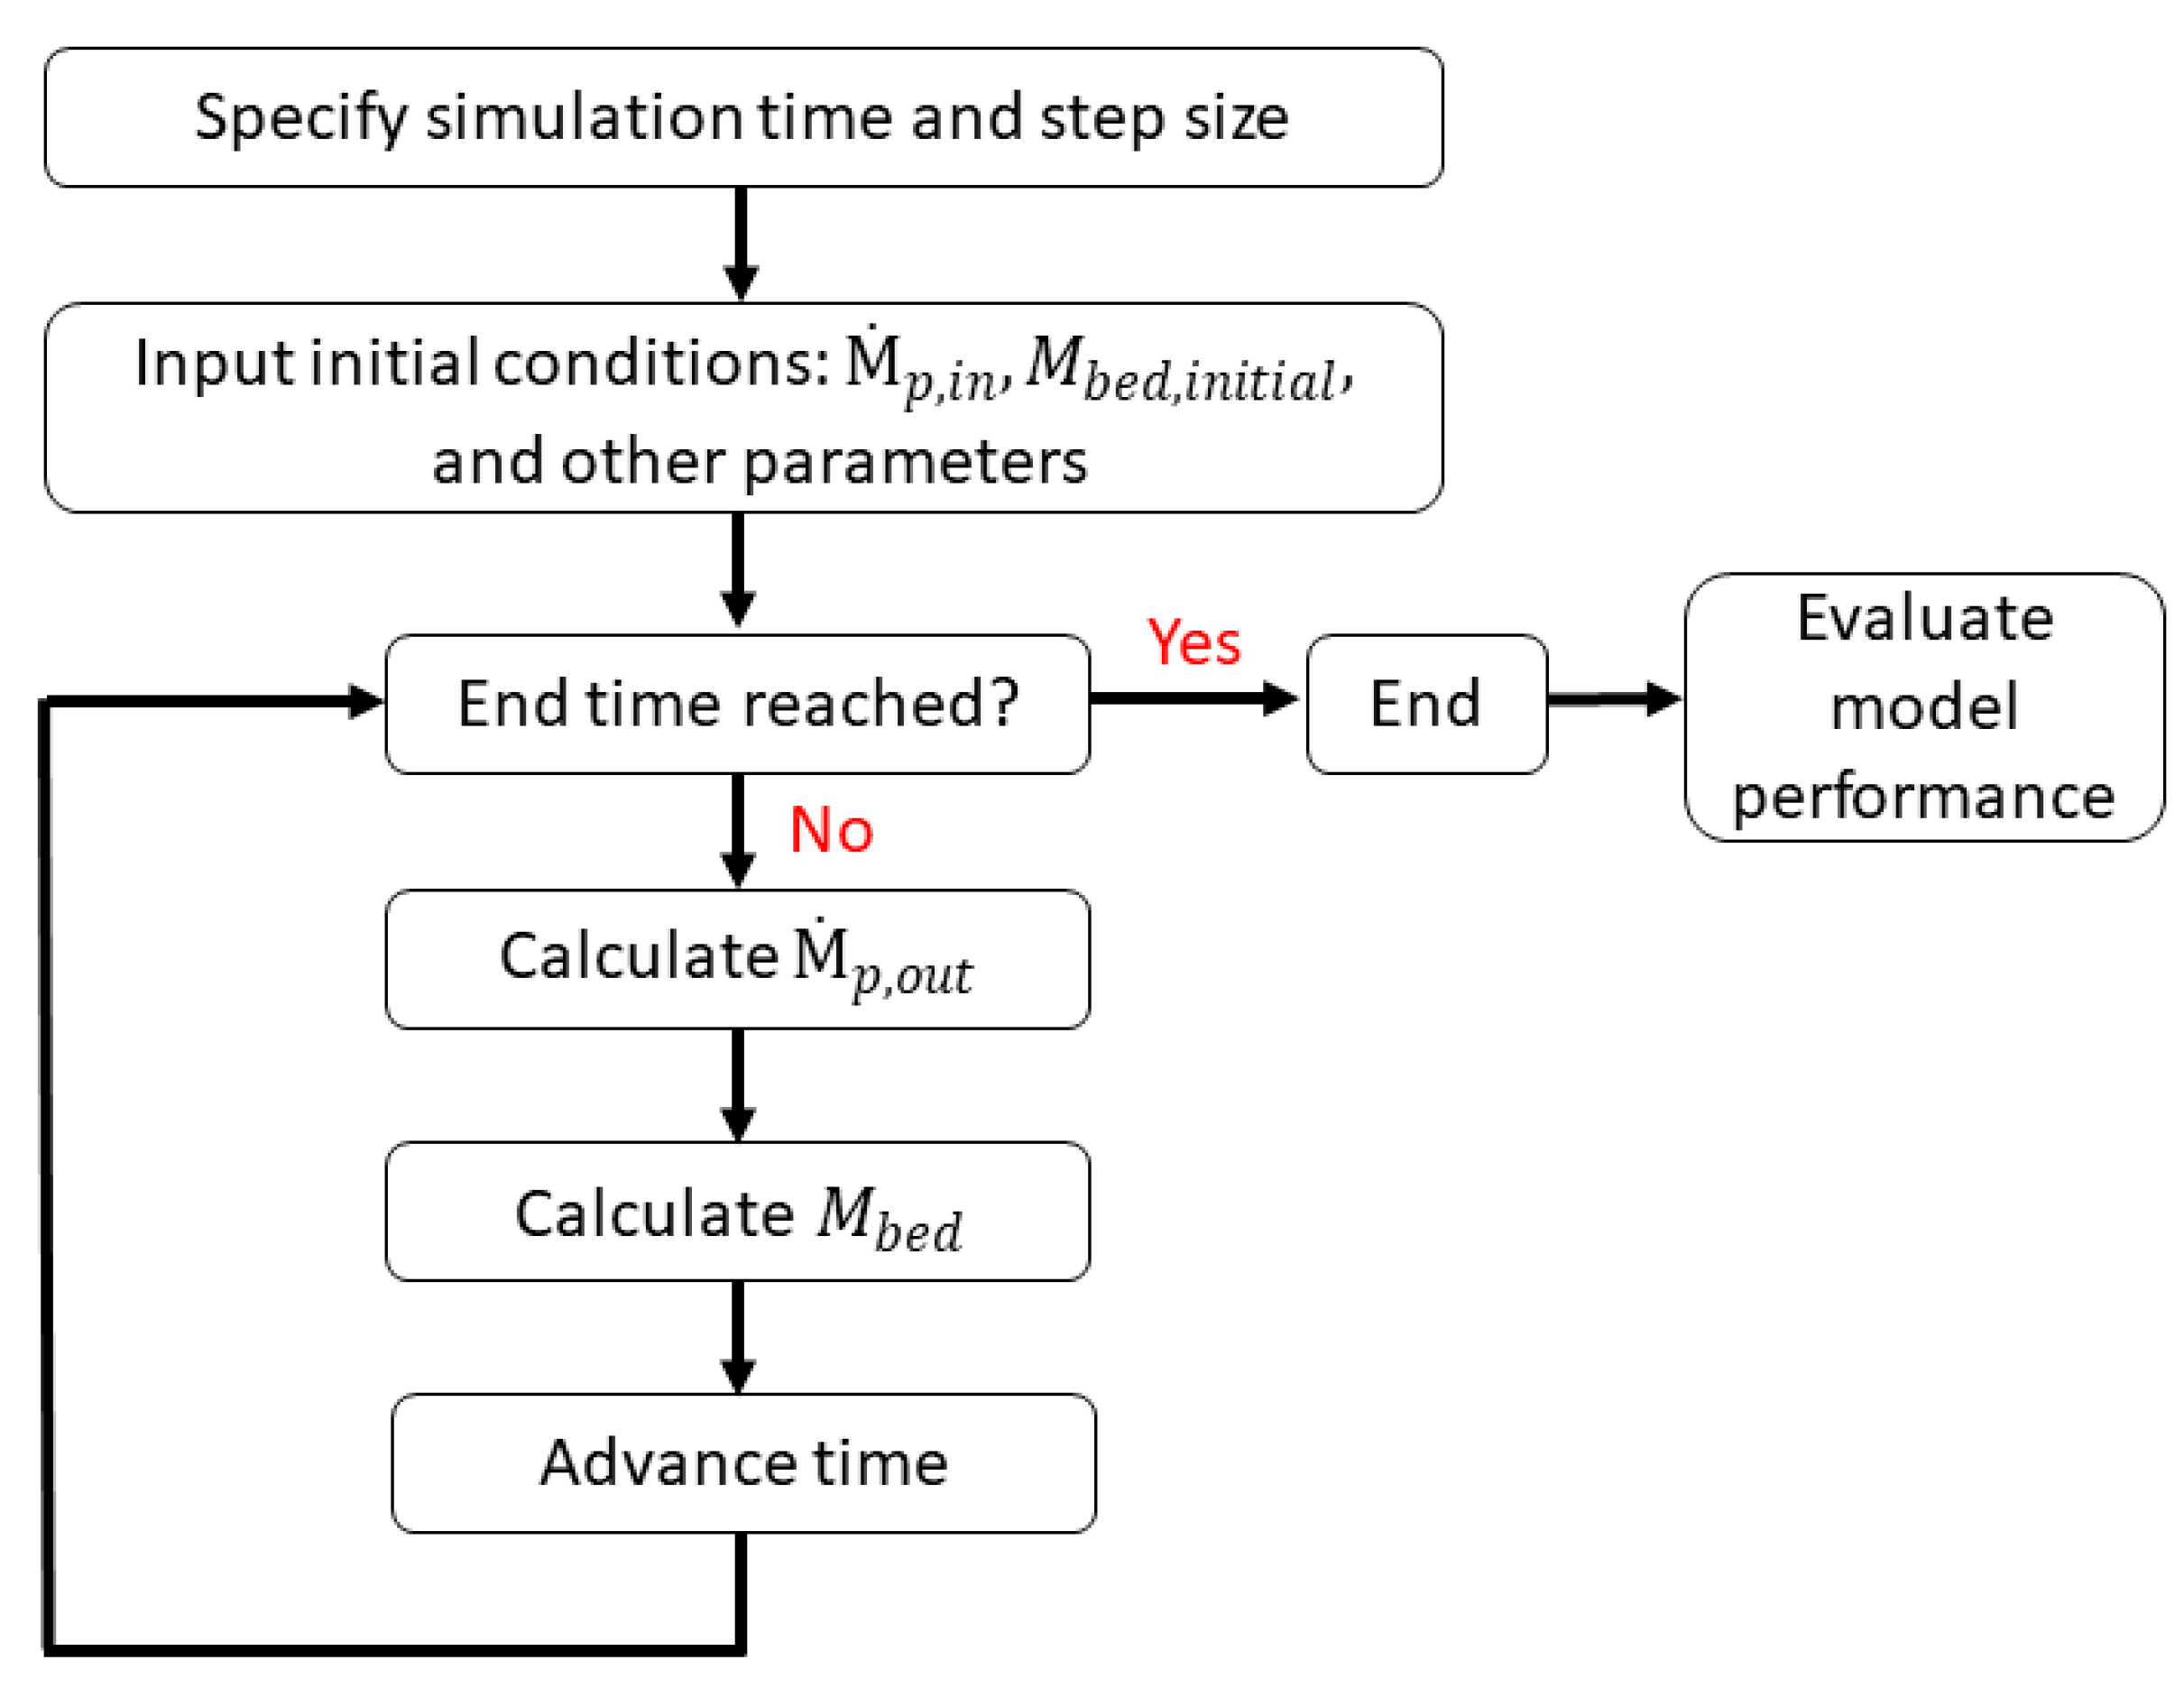
After determining the fluidized bed parameters, the model is now ready to run. This involves solving the mass balance equation using three different algebraic outflow equations and evaluating their performance against the experimental data. The objective is to determine how well each equation predicts and . Figure 5 provides a schematic representation of the simulation process, illustrating the sequence of calculations. The model is implemented in MATLAB R2022a, utilizing the ODE15 solver. For each case, the simulation time is set according to the corresponding experimental duration, ensuring a direct comparison with the measured values. Additionally, the step size is fixed at 1 s. At the start of the simulation, the initial conditions are specified, including and . The material properties, fluidization parameters, and operating conditions, as summarized in Table 2 and Table 3, are also input into the model. Because each algebraic equation has different parameters, these must be assigned accordingly before running the simulation. For example, when using the J&D equation, the is set. In contrast, for the B&T and the extended equation, the parameters and are assigned. Once the simulation begins, is computed according to the selected algebraic equation. With the determined , the mass balance equation is used to update at each time step. This process continues incrementally, advancing time step by time step until the end time is reached. Finally, the model’s performance is assessed by calculating the R2 value, which quantifies how well the simulated values match the experimental data.

Figure 5.
Schematic flow diagram of the mathematical modeling.
4. Results and Discussion
4.1. Experimental Results
In this section, the experimental findings are examined, focusing on the behavior of and over time. These experimental insights establish a foundation for understanding the dynamics of the fluidized bed system and provide a basis for evaluating the predictive accuracy of the mathematical model developed in the previous section.
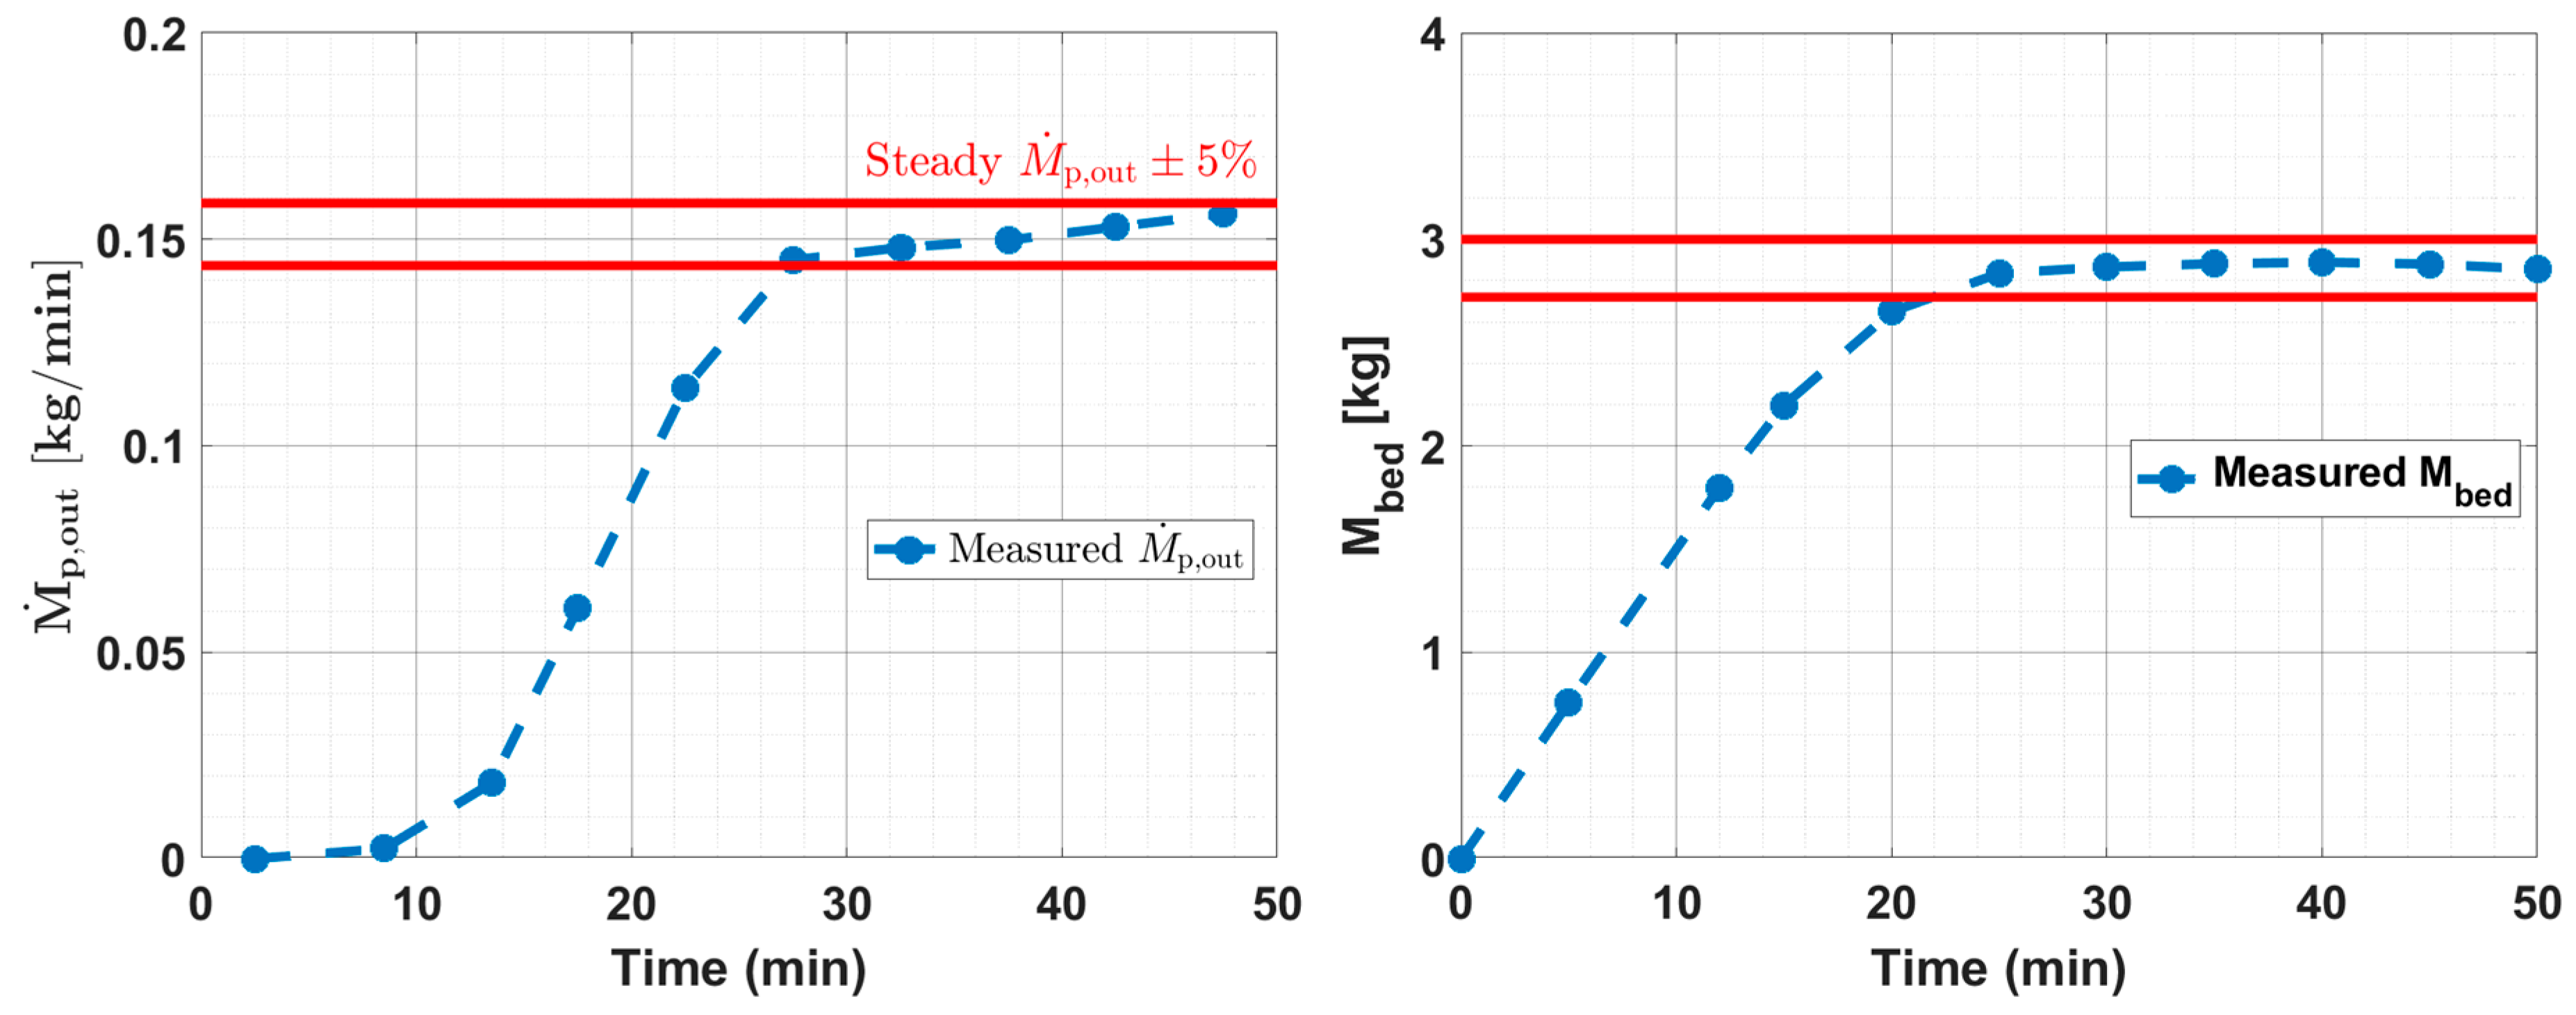
The behavior of and is analyzed in detail for Case 1, as shown in Figure 6, with a total process time of 50 min. Discrete points in time, ti, which correspond to the abscissa values in the right-hand side plot, are the times at which the outlet sample box was replaced and its content weighed: see Section 2.3. This was performed every 5 min for all continuous experiments, with the exception of the second reading in Case 1, which was recorded after 12 min (instead of after 10 min). This is the reason behind the slight inconsistency observed in Figure 6 where the intervals are not perfectly uniform. Each value represents the average particle-mass flow rate at the outlet of the bed over the considered time interval (Equation (2)) and is plotted at its midpoint. In contrast, the bed mass values are obtained from Equation (3) and plotted at the end of each time interval. With an initial bed mass of zero and a constant feed rate, could be calculated precisely for each interval based on the cumulative feed and the measured mass outflow.
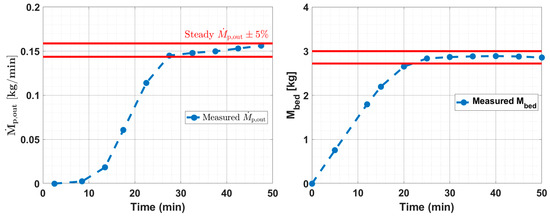
Figure 6.
Time evolution of measured (left) and (right) in Case 1.
An observed trend is that initially, remains zero until approximately 10 min, during which time increases linearly. After 10 min, the mass outflow begins to increase and continues to do so until about 30 min. During this period, continues to rise but with a slower, nonlinear progression. At 30 min, reaches a steady state, meeting the ±5% tolerance condition, as shown by the red lines in Figure 6, indicating discharge stability. Meanwhile, stabilizes at around 3 kg, reaching a steady state after approximately 25 min—slightly before reaches its steady state. This observation suggests that reaches stability first, followed closely by , indicating an interdependent relationship between the two variables.
Table 4 presents the final measured outflow rate and bed mass, along with the incrementally calculated bed mass. At the final steady-state point, closely matches the inflow rate provided in Table 1, indirectly confirming the accuracy and consistency of the experimental setup. Additionally, the measured final is independently compared to the incrementally calculated values to ensure accuracy. As shown in Table 4, the differences between the incrementally calculated bed masses and the final measured values are minimal, indicating good agreement and validating the reliability of the experimental setup and measurements.
Table 4.
Final measured outflow rate and bed mass and the incrementally calculated bed mess.
To avoid repetition of similar plots, the key details of the other continuous cases are summarized in Table 5. Like Case 1, Cases 2, 3, and 4 exhibit similar trends in the behaviors of and , with differences primarily in process times and the time required for each variable to reach a steady state. The differences in process times across Cases 2, 3, and 4 are primarily due to adjustments in the inflow rates and changes in the downer tube height. These factors influence the time required for and to reach steady state. Generally, as increases from Case 1 to Case 3, the total process time decreases slightly, reflecting the shorter time needed to reach steady state for both and . Case 4, however, shows a longer process time due to the increased downer tube height (110 mm instead of 70 mm), which extends the time required to reach the steady state. In all cases, the bed mass stabilizes first, followed by , consistent with the observations in Case 1.
Table 5.
Steady-state times for continuous cases.
Unlike the continuous cases, Case 5 is a semi-batch experiment and operates as a non-steady process. This setup differs fundamentally, as there is no constant inflow to balance the outflow, resulting in distinct dynamics. Therefore, Case 5 will be discussed separately in a subsequent section.
In summary, the experimental results from continuous trials provide insights into the behavior of and in the pilot-scale fluidized bed system. Initially, remains zero while increases linearly. As begins to rise, continues to increase, but in a nonlinear manner until both eventually stabilize. The following section will explore how mathematical modeling with different approaches reflects these observed behaviors.
4.2. Mathematical Modeling Results
After the experiments were conducted, the next step was to run the mathematical model with each of the three algebraic equations—J&D, B&T, and the extended equation—to evaluate their performances in predicting the and dynamics. Each equation aimed to capture the experimentally observed fluidized bed dynamics, with R2 values used to assess the accuracy of predictions.
Figure 7 presents Case 2 as an example, showing the time evolution of and by comparing the experimentally measured values with model predictions for each equation. Modeling with the J&D equation required the addition of a condition of zero outflow at to handle the initial period of the process; without this condition, the model, which does not inherently consider bed height limitations, could not function properly. With this adjustment in place, the equation was applied using = 0.5 (the value originally suggested in [22]), but the results still showed poor alignment with the experimental data. This approach yielded moderate R2 values of 0.526 for and 0.386 for , indicating a need for further refinement. Similarly, the B&T equation with the original parameters from [25] (inflow parameter α = 0.0316 and pulsation factor exponent m = 0.261) showed limited accuracy, with R2 = 0.233 for and a negative R2 for , demonstrating the need for adjustments in both cases.
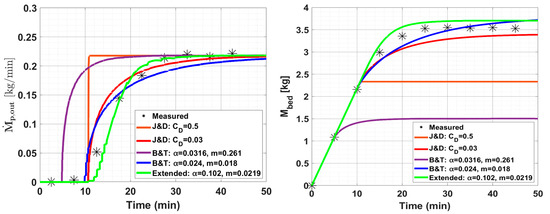
Figure 7.
Time evolution of measured and modeled and for Case 2.
To improve the model accuracy, the coefficients were adjusted to minimize the error between the experimentally measured values and the modeled predictions. For the J&D equation, the discharge coefficient was adjusted to 0.03, as shown in Figure 7, in which the updated J&D predictions show improved alignment with the measured values.
For B&T, the parameters were refined to α = 0.024 and m = 0.018, resulting in a significantly better fit. The extended equation was applied with fitted parameters α = 0.102 and m = 0.0219, yielding high R2 values and close alignment with the experimental trends. When updated, both the J&D and the B&T equations showed considerable improvement in matching the experimental data. For example, the J&D equation with the updated coefficient achieved R2 values of 0.973 for and 0.946 for , while the B&T equation with optimized parameters yielded R2 values of 0.988 for and 0.946 for (see Table 7). The extended equation also performed very well, achieving an R2 of 0.987 for and 0.971 for . These results indicate that all three equations captured the fluidized bed dynamics effectively in Case 2, with B&T showing the highest R2 for and the extended equation achieving the highest R2 for , demonstrating the suitability of these approaches for this case.
The pulsation factor , which was determined using Equation (6), remained constant at 1.06 for B&T and at 1.07 for the extended model. This constancy is attributed to the stable mass flow rate of the fluidizing air, which maintained a consistent bed porosity across all cases. As a result, it had minimal impact, causing the B&T equation to perform similarly to the J&D equation, as evidenced by their comparable R2 values. However, when the fluidizing air flow rate varies, the pulsation factor could have a more significant effect, potentially influencing the model’s performance and predictive accuracy.
The experimental results revealed specific periods in the fluidized bed dynamics that the modeling aimed to capture: an initial period in which remains zero while increases linearly, followed by a second period in which rises and grows nonlinearly, and finally a period in which both variables stabilize. To closely examine how each equation performs in representing these periods, Case 2 was analyzed in detail. To this purpose, the three periods were coarsely assigned to the time intervals of 0–10 min, 10–30 min, and 30–45 min, respectively, and R2 values were calculated for each time interval for both and , as presented in Table 6.
Table 6.
Period-specific R2 values for Case 2.
- Initial period (0–10 min): In the initial phase, both the J&D equation with its condition and the B&T and extended equations with their conditions captured the zero-outflow behavior effectively. The R2 values for both and are 0.999, confirming that the models accurately represent this period.
- Transition period (10–30 min): In the transition period, where starts to increase and changes more dynamically, the equations showed differences in accuracy. The J&D and B&T equations saw drops in R2, with values of 0.840 and 0.927 for and 0.756 and 0.792 for , respectively, indicating some limitations in capturing these dynamics. In contrast, the extended equation achieved higher R2 values of 0.940 for and 0.863 for , suggesting that its exponential term provides better responsiveness to the changing conditions of this period.
- Steady-state period (30–45 min): In the final steady-state period, in which the conditions stabilize, all equations led to improved accuracy. The B&T achieved the highest R2 value for at 0.982, while the extended equation performed best for with an R2 of 0.998. The J&D also performed well, with R2 values of 0.951 for and 0.990 for , showing satisfactory alignment with the experimental data. This suggests that while all models are suitable for steady-state conditions, the extended model has a slight edge in predicting .
In summary, the performance of each equation varied across the different periods of fluidized bed dynamics. The J&D and B&T equations showed strong alignment with the experimental data at steady-state conditions, indicating their suitability for processes in which stability is the main focus. The extended equation also performed well during such periods, similar to the other equations, but showed better accuracy during the transition period, making it useful for capturing dynamics in processes with transitional behavior.
To ensure consistent comparison, all the cases were evaluated using the updated coefficients for the J&D and B&T equations, along with the extended equation. Table 7 provides a summary of the R2 values for each case, highlighting the relative performances of each equation across the different experimental scenarios. In addition to the R2 values, Table 7 also includes the final model-predicted values of and for each case. While these values are not directly analyzed in the discussion, they serve as a reference for comparison with the measured experimental values in Table 4, providing additional insight into the numerical performances of the models. However, the analysis and conclusions in this study are based solely on the R2 values.
Table 7.
Model-predicted final values and R2 for and across all cases.
To evaluate the effect of the varying , Cases 1 through 3 were analyzed, in which increased incrementally while the downer tube height remained constant at 70 mm. Experimentally, the increase in led to a corresponding rise in and a slight reduction in the total process time, as the higher inflow rates shortened the time required for both and to reach steady state.
Across the equations, the performances remained generally consistent, though some differences emerged as increased. For , the performances of the J&D and B&T equations decreased slightly from Case 1 to Case 3. This is likely because the increase in shortened the overall process time and reduced the transition period’s duration. At higher inflow rates, rose more quickly, reaching steady state sooner. The rapid increase in under these conditions was better captured by the extended equation, whose performance improved as the inflow rate increased. In contrast, the J&D and B&T equations were less responsive to this accelerated behavior, leading to a slight decline in accuracy as the inflow rates increased.
The J&D and B&T equations displayed consistently good performance for across all three cases, with high R2 values. However, for Case 1, in which was lower, the extended model’s R2 for was notably lower (0.802), suggesting some sensitivity to lower inflow rates in capturing . This suggests that the mathematical models perform best within a certain range of inflow rates. In this study, Case 1’s inflow rate might fall outside this optimal range for the extended model with the current fitted parameters (α and m). Because the parameters were optimized across all cases, they naturally favored higher inflow rates, at which the model performed best. Notably, the extended model could be made to perform much better at lower inflow rates if the parameters were specifically adjusted for that condition.
Increasing the tube height from 70 mm in Case 3 to 110 mm in Case 4 introduced notable changes in the experimental behaviors of both and . Experimentally, this height increase delayed the approach to steady state, with both and requiring a longer time to reach stable values. Additionally, the larger tube height in Case 4 resulted in a greater final bed mass, which increased from 3.8 kg in Case 3 to 5.8 kg.
In terms of predictive accuracy, the extended equation performed well for both and , achieving very high R2 values (0.999 for and 0.991 for ). Although the R2 value for indicates strong model performance for both Cases 3 and 4, the R2 value for decreased slightly from 0.995 to 0.991. This minor variation is likely due to measurement uncertainties in the experimental data. Because the model was fitted to experimental observations, small inconsistencies in data collection or transient flow behavior could contribute to slight fluctuations in R2.
For the J&D and B&T equations, the R2 values in Case 4 indicate a decline in accuracy, particularly for , with a value of 0.905 for J&D. Although the R2 values for these models still indicate reasonable alignment, they reflect a limited ability to capture the full extent of the bed-mass increase associated with the tube height change. The lower R2 values for further indicate that these models are less adaptable to changes in fluidized bed geometry as compared to the extended model.
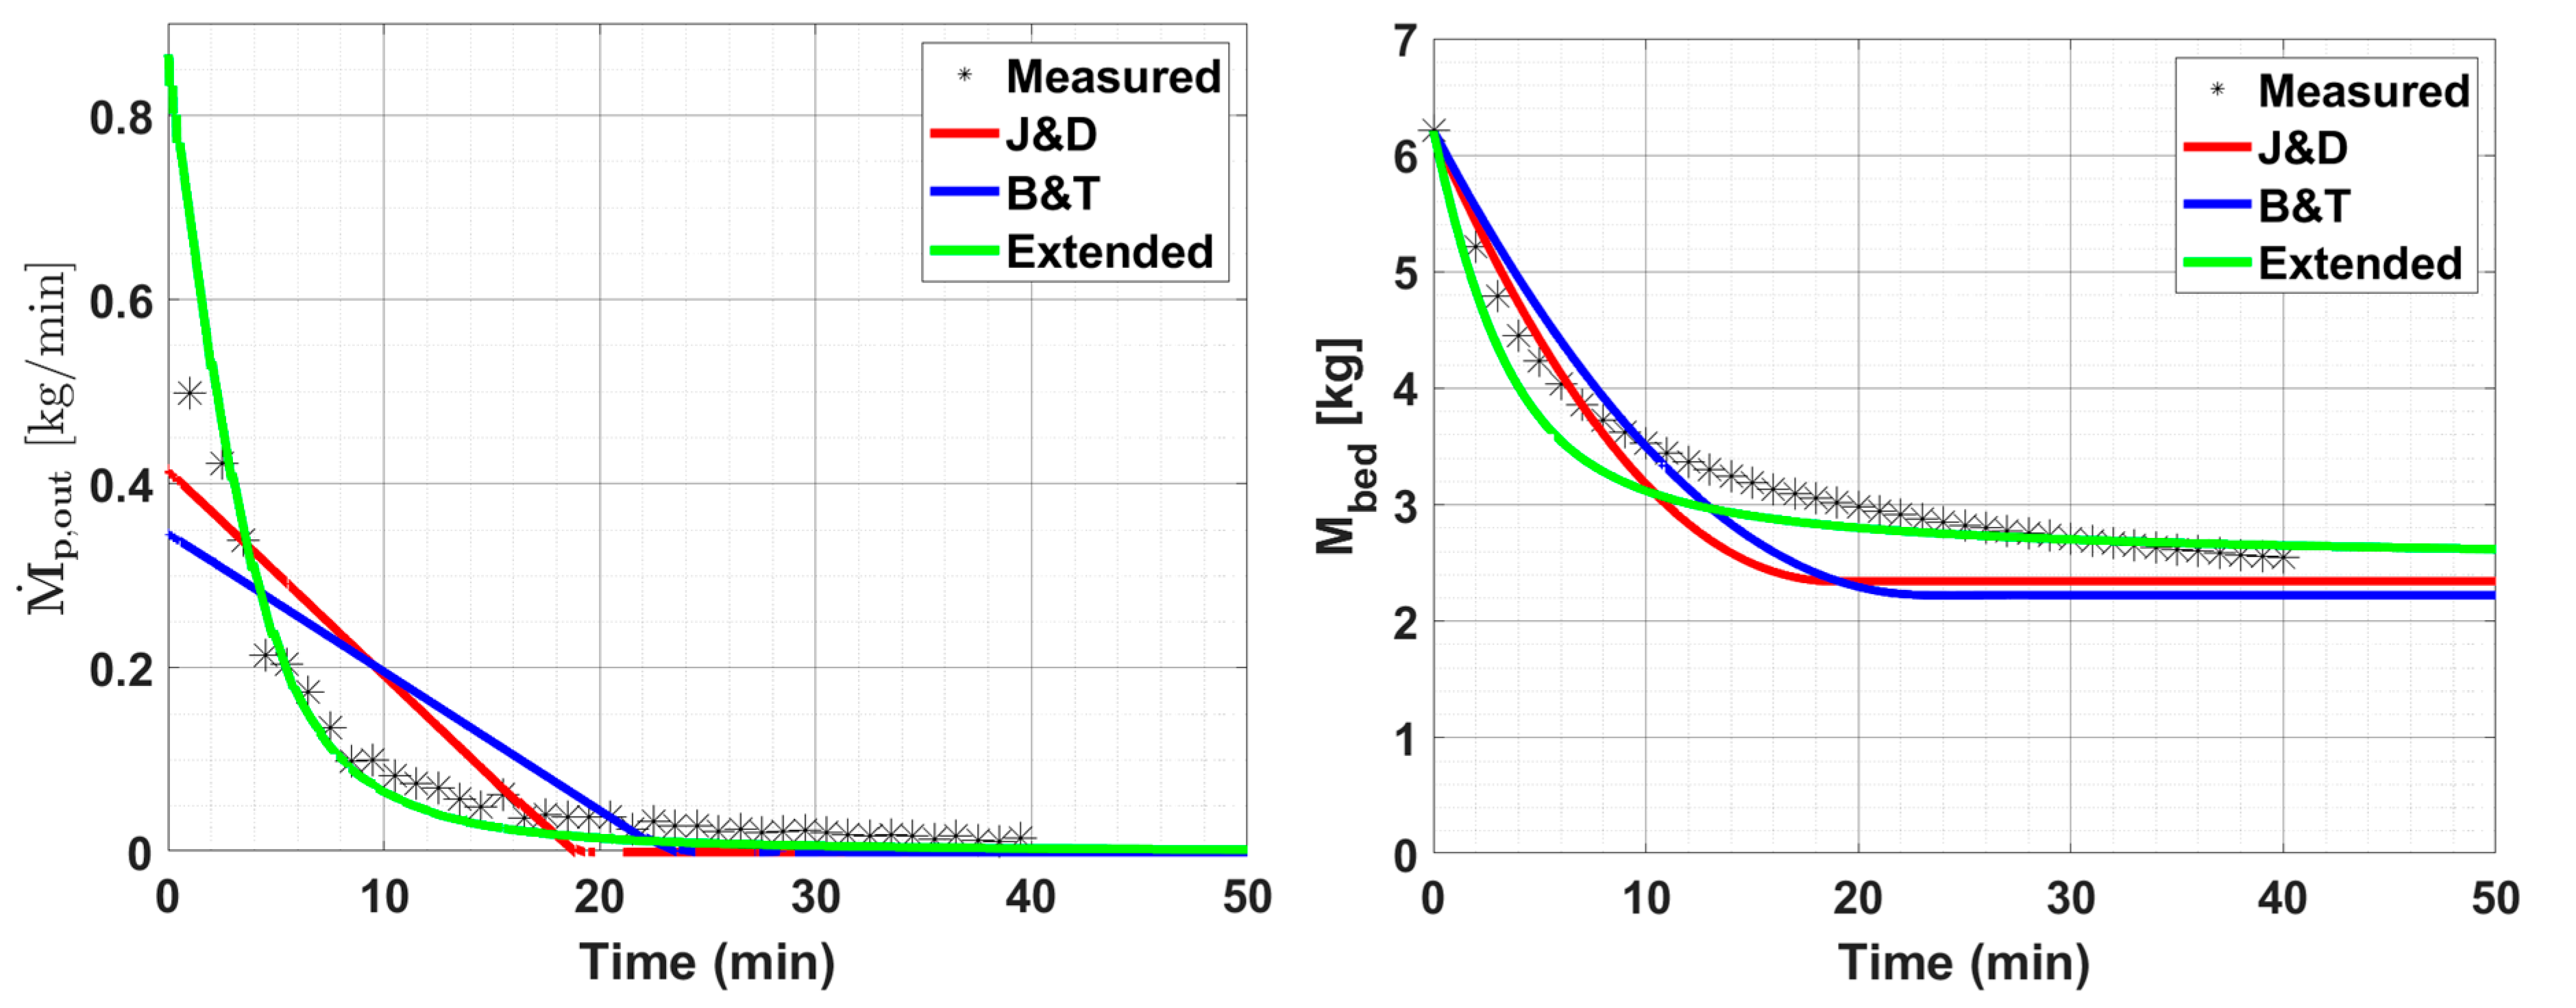
In Case 5, a semi-batch process was conducted, differing from the other cases as there is no continuous mass inflow ( = 0), as presented in Figure 8. This setup corresponds to a pure discharge process in which the particles are initially loaded into the fluidized bed, and gradually decreases over time. To capture the dynamic nature of this process, was measured at 1-min intervals, starting from the second minute. Note that the first measurement was delayed and taken at the second minute, after which measurements continued at 1-min intervals. The higher frequency of measurement is reflected in Figure 8 by the numerous data points (asterisks) showing a detailed, time-resolved profile of and over time.
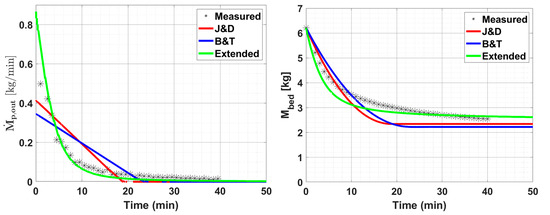
Figure 8.
Measured and modeled and for Case 5.
Experimentally, both and exhibited distinct behavior in the semi-batch setup as compared to the continuous cases. From Figure 8, it is evident that decreased rapidly during the initial period, dropping from an initial value of approximately 6.21 kg to 3 kg within the first 20 min, effectively emptying half the bed mass. Correspondingly, also decreased steeply during this period. After 20 min, the behavior of both variables shifted. The rate of change in slowed down considerably, with only a small decrease of about 0.5 kg from 20 to 40 min. As a result, became very small, approaching nearly zero flow rate. While remained unsteady for the entire duration of the process, achieved a near-steady state from 20 min onward, maintaining a minimal outflow rate.
When evaluating the performance of each algebraic outflow equation, significant differences become apparent. Both the J&D and B&T equations struggled to capture the dynamics of the semi-batch experiment. The J&D equation, for instance, failed to replicate the sharp initial decline in observed experimentally. Instead, it produced a more linear decrease, which diverged from the measured data, particularly in the first 15–20 min. In this model, reached zero after around 20 min—earlier than observed experimentally, where the approach to zero was more gradual. Regarding , the J&D equation also underperformed, showing little to no further change after approximately 15 min, failing to capture the slower but continuous decrease in bed mass seen in the experimental data. These issues are reflected in the low R2 values of 0.696 for and 0.750 for , indicating that the J&D equation does not align well with this case. The B&T equation exhibited similar limitations, generating an overly linear decline. Here, reached zero after around 22 min but still failed to capture the full pattern of decrease. In regard to , the B&T model showed no significant change after about 20 min, diverging from the experimental data. The R2 values for the B&T equation—0.657 for and 0.690 for —confirm its limited accuracy in modeling the semi-batch dynamics.
In contrast, the extended equation performed considerably better in capturing the behavior of the semi-batch process. Figure 8 shows that the extended equation closely followed the initial rapid decline in and then accurately tracked the gradual reduction over time, resulting in a high R2 value of 0.900 for . For , the extended equation also showed a marked improvement over the other two equations, providing a closer fit to the measured values. It captured the rapid decrease in during the initial period and reflected the slower decline as the process progressed, yielding an R2 value of 0.900. This performance, significantly higher than that of the J&D and B&T equations, is due to the exponential term in the extended equation, which enables it to better capture the rapid changes observed in the semi-batch process.
In their study on unsteady particle exchange in a two-compartment fluidized bed, Lau et al. [21] observed that the bed mass decreased exponentially, similar to the trend seen in the present semi-batch emptying process. They derived a model based on the assumption of first-order exchange kinetics, resulting in an exponential function to describe particle exchange dynamics. However, this model is not directly applicable to our study due to its assumptions. Nonetheless, the presence of exponential terms in both models highlights a common approach to capturing dynamic behaviors in fluidized bed systems.
5. Conclusions
In this study, the particle discharge rate from a pilot-scale fluidized bed was investigated both experimentally and mathematically through algebraic equations. Five cases were examined, including four continuous experiments and one semi-batch experiment. The mass outflow rate and bed mass were modeled using equations previously proposed by Jones and Davidson [22] (J&D) and Burgschweiger and Tsotsas [25] (B&T), as well as an extended equation developed in this work.
The continuous experiments exhibited both unsteady and steady-state behaviors. Initially, the mass outflow rate was zero, leading to a linear increase in bed mass. Upon commencement of the outlet flow, the mass outflow rate increased until reaching a period close to steady state, during which the bed mass also increased but at a slower rate, eventually stabilizing. Generally, the algebraic equations demonstrated good performance in capturing the continuous experiment dynamics. The differences in the performances of the equations became evident during the transitional period. Both the J&D and B&T equations showed satisfactory performances, but the extended equation performed better, particularly in predicting the mass outflow rate. During the steady-state period, all equations performed well.
Moreover, the performance of the equations varied when the mass inflow rate and downer tube height changed in the continuous experiments. Experimentally, higher mass inflow rates resulted in faster transitions and reduced process times to reach steady-state conditions. In contrast, increased downer tube heights prolonged the process, delaying steady-state attainment. The extended model performed well, particularly when the tube height changed, but exhibited some sensitivity to lower mass inflow rates, suggesting that adjustments to inflow parameters may be necessary to enhance accuracy under these conditions. In contrast, the J&D and B&T models displayed good performance when the mass inflow rate changed and satisfactory performance when the tube height varied, reflecting their general reliability but limited adaptability to certain dynamic shifts.
In the semi-batch experiment, an unsteady process was observed, characterized by an initial rapid decrease in bed mass and mass outflow rate, followed by stabilization with no further outflow. The extended equation demonstrated superior performance as compared to the others, accurately capturing the sharp declines in both the mass outflow rate and bed mass. The exponential term in the equation was identified as the key factor behind this improved accuracy. Therefore, the extended equation proved to be more effective in modeling unsteady processes than the other equations.
This study demonstrates that algebraic equations can effectively model particle discharge from fluidized beds. However, further research might help to refine these models across a broader range of fluidized bed behaviors and operating conditions, including different fluidization rates, particle sizes, operational modes, and extreme mass inflow rates (both very low and very high). Investigating the performance of algebraic equations under these diverse conditions could lead to significant improvements in predictive accuracy, enabling more efficient and optimized fluidized bed operations across various industrial applications. Accurate modeling of mass balance and outflow dynamics is essential for optimizing fluidized bed reactors, separation processes, and gas–solid flow control in industries such as mining, chemical processing, and energy production. By improving predictive capabilities, these models can contribute to better real-time monitoring, automatic process adjustments, and enhanced system stability. Ultimately, this will lead to greater efficiency and reduced operational costs in industrial applications.
Author Contributions
Experimental work, A.A. with the supervision of T.H.; software, A.A. and K.C.; validation, E.T.; formal analysis, A.A. and E.T.; writing and original draft preparation, A.A.; review and editing, E.T.; project administration, E.T. All authors have read and agreed to the published version of the manuscript.
Funding
This work was funded by the Deutsche Forschunggemeinschaft (DFG, German Research Foundation), project 504524147 in SPP2364, and the research initiative “SmartProSys: Intelligent Process Systems for the Sustainable Production of Chemicals,” funded by the Ministry for Science, Energy, and Climate Protection, and the Environment of the State of Saxony-Anhalt.
Data Availability Statement
The datasets presented in this article are not readily available because the data are part of an ongoing study.
Acknowledgments
We thank Wenjing Ma for her contributions to this project as a student research assistant (HiWi).
Conflicts of Interest
The authors declare no conflicts of interest.
Nomenclature
| A | cross-sectional area, m2 |
| Ar | Archimedes number, - |
| discharge coefficient, - | |
| d | diameter, m |
| acceleration of gravity, m/s2 | |
| height, m | |
| M | mass, kg |
| m | exponent, - |
| Ṁ | mass flow rate, kg/s |
| Re | Reynolds number, - |
| time, s | |
| velocity, m/s | |
| Greek letters | |
| ⍺ | inflow parameter |
| ε | porosity |
| κ | pulsation factor |
| ν | kinematic viscosity, m2/s |
| ρ | density, kg/m3 |
| Subscripts | |
| 0 | superficial |
| bed | fluidized bed |
| elu | elutriation |
| gas | |
| in | inlet |
| mf | minimal fluidization |
| out | outlet |
| p | particle |
| st | steady |
| tube | downer tube |
References
- Rhodes, M.J.; Seville, J.P.K. Introduction to Particle Technology; John Wiley & Sons: Hoboken, NJ, USA, 2024. [Google Scholar]
- Horio, M. Overview of fluidization science and fluidized bed technologies in Fluidized-Bed Technologies for Near-Zero Emission Combustion and Gasification; Woodhead Publishing: Cambridge, UK, 2013; pp. 3–41. [Google Scholar]
- Teunou, E.; Poncelet, D. Batch and continuous fluid bed coating: Review and state of the art. J. Food Eng. 2002, 53, 325–340. [Google Scholar] [CrossRef]
- Lim, D.; Letona, A.; Lee, M.; Lim, D.; Han, N.; Chung, D. Fluidized-bed granulation of probiotics-encapsulated spray-dried milk powder:Effects of a fluidizing aid, moisture-activation and dehydration. Foods 2021, 10, 1600. [Google Scholar] [CrossRef]
- Gu, C.; Zhao, H.; Xu, B.; Yang, J.; Zhang, J.; Du, M.; Liu, Y.; Tikhankin, D.; Yuan, Z. CFD-DEM simulation of distribution and agglomeration characteristics of bendable chain-like biomass particles in a fluidized bed reactor. Fuel 2023, 340, 127570. [Google Scholar] [CrossRef]
- Mujumdar, A.S. Handbook of Industrial Drying, 3rd ed.; CRC, Taylor & Francis: Boca Raton, FL, USA, 2007. [Google Scholar]
- Razzak, S.A. Characteristics and diverse applications of (gas)-liquid-solid circulating fluidized beds: A comprehensive review. Powder Technol. 2024, 435, 119359. [Google Scholar] [CrossRef]
- Won, Y.S.; Youn, P.S.; Kim, D.; Joo, J.B.; Choi, J.-H.; Ryu, H.-J. Bed pressure drop of a bubbling fluidized-bed with overflow solid discharge. Adv. Powder Technol. 2019, 30, 1165–1173. [Google Scholar] [CrossRef]
- Radichkov, R.; Müller, T.; Kienle, A.; Heinrich, S.; Peglow, M.; Mörl, L. A numerical bifurcation analysis of continuous fluidized bed spray granulation with external product classification. Chem. Eng. Process.—Process Intensif. 2006, 45, 826–837. [Google Scholar] [CrossRef]
- Khanali, M.; Rafiee, S.; Jafari, A.; Banisharif, A. Study of residence time distribution of rough rice in a plug flow fluid bed dryer. Int. J. Adv. Sci. 2012, 48, 103–114. [Google Scholar]
- Bachmann, P.; Chen, K.; Bück, A.; Tsotsas, E. Prediction of particle size and layer-thickness distributions in a continuous horizontal fluidized-bed coating process. Particuology 2020, 50, 1–12. [Google Scholar] [CrossRef]
- Chen, K.; Bachmann, P.; Bück, A.; Jacob, M.; Tsotsas, E. CFD simulation of particle residence time distribution in industrial scale horizontal fluidized bed. Powder Technol. 2019, 345, 129–139. [Google Scholar] [CrossRef]
- Diez, E.; Kieckhefen, P.; Meyer, K.; Bück, A.; Tsotsas, E. Heinrich, Particle dynamics in a multistaged fluidized bed: Particle transport behavior on micro-scale by disrete particle modelling. Adv. Powder Technol. 2019, 30, 2014–2031. [Google Scholar] [CrossRef]
- Zhu, X.; Dong, P.; Tu, Q.; Zhu, Z.; Yang, W.; Wang, H. Investigation of gas-solids flow characteristics in a pressurised circulating fluidised bed by experiment and simulation. Powder Technol. 2020, 366, 420–433. [Google Scholar] [CrossRef]
- Tu, Q.; Wang, H.; Ocone, R. Application of three-dimensional full-loop CFD simulation in circulating fluidized bed combustion reactors—A review. Powder Technol. 2022, 399, 117181. [Google Scholar] [CrossRef]
- Bachmann, P.; Bück, A.; Tsotsas, E. Experimental investigation and correlation of the Bodenstein number in horizontal fluidized beds with internal baffles. Powder Technol. 2017, 308, 378–387. [Google Scholar] [CrossRef]
- Mielke, L.; Bück, A.; Tsotsas, E. Multi-stage and multi-compartment model for dynamic simulation of horizontal fluidized bed granulator. Dry. Technol. 2021, 39, 203–218. [Google Scholar] [CrossRef]
- Du, J.; Strenzke, G.; Bück, A.; Tsotsas, E. Monte Carlo modeling of spray agglomeration in a cylindrical fluidized bed: From batch-wise to continuous processes. Powder Technol. 2022, 396, 113–126. [Google Scholar] [CrossRef]
- Meyer, K.; Bück, A.; Tsotsas, E. Determination of particle exchange rates at over-flow weirs in horizontal fluidised beds by particle tracking velocimetry. Particuology 2017, 32, 1–9. [Google Scholar] [CrossRef]
- Vollmari, K.; Kruggel-Emden, H. Numerical and experimental analysis of particle residence times in a continuously operated dual-chamber fluidized bed. Powder Technol. 2018, 338, 625–637. [Google Scholar] [CrossRef]
- Lau, P.; Arlt, C.-R.; Potthoff, M.; Kind, M. Particle exchange in horizontal two-compartment fluidized beds: CFD simulation and experimental validation. Adv. Powder Technol. 2017, 28, 543–552. [Google Scholar] [CrossRef]
- Jones, D.R.M.; Davidson, J.F. The flow of particles from a fluidised bed through an orifice. Rheol. Acta 1965, 4, 180–192. [Google Scholar] [CrossRef]
- Bertin, D.E.; Cotabarren, I.M.; Bucala, V.; Pin, J. Analysis of the product granulometry, temperature and mass flow of an industrial multichamber fluidized bed urea granulator. Powder Technol. 2011, 206, 122–131. [Google Scholar] [CrossRef]
- Bertin, D.E.; Cotabarren, I.; Pin, J.; Bucala, V. Granule size distribution for a multi-chamber fluidized-bed melt granulator: Modeling and validation using process measurement data. Chem. Eng. Sci. 2013, 104, 319–329. [Google Scholar] [CrossRef]
- Burgschweiger, J.; Tsotsas, E. Experimental investigation and modelling of continuous fluidized bed drying under steady-state and dynamic conditions. Chem. Eng. Sci. 2002, 57, 5021–5038. [Google Scholar] [CrossRef]
- Fu, Y.; Wang, S.; Xu, X.; Zhao, Y.; Dong, L.; Chen, Z. Particle flow characteristics in a gas-solid separation fluidized bed based on machine learning. Fuel 2022, 314, 123039. [Google Scholar] [CrossRef]
- Sigmund Linder GmbH. Product Data Sheet. Available online: https://www.sili.eu/wp-content/uploads/2023/04/SiLibeads_Solid_2025.pdf (accessed on 9 February 2025).
- Liu, B.; Zhang, X.; Wang, L.; Hong, H. Fluidization of non-spherical particles: Sphericity, Zingg factor, and other fluidization parameters. Particuology 2008, 6, 125–129. [Google Scholar] [CrossRef]
- Grace, J.R. Essentials of Fluidization Technology; John Wiley & Sons: Hoboken, NJ, USA, 2020. [Google Scholar]
- Coperion. Twin Screw Feeders—Process Equipment. Available online: https://www.coperion.com/en/products-services/process-equipment/feeders/twin-screw-feeders (accessed on 9 February 2025).
- Sartorius. Laboratory Balances. Available online: https://www.sartorius.com/en/products/weighing/laboratory-balances#id-934518 (accessed on 9 February 2025).
- Richardson, J.F.; Zaki, W.N. The sedimentation of a suspension of uniform spheres under conditions of viscous flow. Chem. Eng. Sci. 1954, 3, 65–73. [Google Scholar] [CrossRef]
- Martin, H. Wärme- und Stoffübertragung in der Wirbelschicht. Chem. Ing. Tech. 1980, 52, 199–209. [Google Scholar] [CrossRef]
- Reh, L. Verbrennung in der Wirbelschicht. Chem. Ing. Tech. 1968, 40, 509–515. [Google Scholar] [CrossRef]


Disclaimer/Publisher’s Note: The statements, opinions and data contained in all publications are solely those of the individual author(s) and contributor(s) and not of MDPI and/or the editor(s). MDPI and/or the editor(s) disclaim responsibility for any injury to people or property resulting from any ideas, methods, instructions or products referred to in the content. |
© 2025 by the authors. Licensee MDPI, Basel, Switzerland. This article is an open access article distributed under the terms and conditions of the Creative Commons Attribution (CC BY) license (https://creativecommons.org/licenses/by/4.0/).