Abstract
This study proposes a framework for anomaly detection in industrial machines with a focus on robust multiclass classification using acoustic data. Many state-of-the-art methods only have binary classification capabilities for each machine, and suffer from poor scalability and noise robustness. In this context, we propose the use of Smoothed Pseudo Wigner–Ville Distribution-based Mel-Frequency Cepstral Coefficients (SPWVD-MFCCs) in the framework which are specifically tailored for noisy environments. SPWVD-MFCCs, with better time–frequency resolution and perceptual audio features, improve the accuracy of detecting anomalies in a more generalized way under variable signal-to-noise ratio (SNR) conditions. This framework integrates a CNN-LSTM model that efficiently and accurately analyzes spectral and temporal information separately for anomaly detection. Meanwhile, the dimensionality reduction strategy ensures good computational efficiency without losing critical information. On the MIMII dataset involving multiple machine types and noise levels, it has shown robustness and scalability. Key findings include significant improvements in classification accuracy and F1-scores, particularly in low-SNR scenarios, showcasing its adaptability to real-world industrial environments. This study represents the first application of SPWVD-MFCCs in industrial diagnostics and provides a noise-robust and scalable method for the detection of anomalies and fault classification, which is bound to improve operational safety and efficiency within complex industrial scenarios.
1. Introduction
Anomaly detection in industrial machinery is critical for ensuring operational reliability, safety, and efficiency. Traditional binary classification methods have been widely studied and deployed, effectively distinguishing normal and abnormal states of specific machines [1,2,3].
Recent advances have introduced various innovative approaches to enhance acoustic anomaly detection. For instance, Müller et al. proposed using image classification pretrained models (e.g., ResNet) for feature extraction in acoustic anomaly detection, achieving notable improvements over traditional methods [4]. Hojjati et al. developed a self-supervised framework that learns representations from unlabeled data through audio-specific data augmentations [5]. Ota and Unoki proposed an anomaly detection framework that integrates five timbral metrics and two short-term features tailored to capture machine-specific sound dynamics [6]. Chinnasamy et al. introduced a lightweight CNN–LSTM model for industrial fault diagnosis, optimized for Artificial Intelligence of Things (AIoT) platforms [7]. Chandrakala et al. introduced a CLSTM-AE model leveraging Spectro-temporal fusion with Mel-Spectro-tempograms to improve anomaly detection [8].
However, despite these advancements, most methods remain constrained by their focus on a single machine type or fault mode, necessitating a dedicated classifier for each scenario. This approach inherently increases system complexity, maintenance costs, and limits scalability in addressing diverse industrial use cases.
To overcome these challenges, some studies have begun exploring multiclass classification frameworks for anomaly detection in industrial machinery. Multiclass systems not only distinguish between normal and abnormal states but also classify machine types and their operational states within a unified framework. Several recent studies [9,10,11] proposed multiclass models leveraging spectrogram-based (including Mel-spectrogram and MFCC) feature extraction techniques to represent acoustic signals for fault classification. However, these methods are still heavily reliant on a time–frequency analysis technique, namely Short-Time Fourier Transform (STFT). While these features have proven effective for capturing auditory patterns, they exhibit limited robustness to noise [12] which is a critical limitation in noisy industrial environments where high-intensity background noise often obscures fault signatures.
In this study, we introduce Smoothed Pseudo Wigner–Ville Distribution-based Mel-Frequency Cepstral Coefficients (SPWVD-MFCCs) into industrial acoustic anomaly detection for the first time. Existing methods, such as STFT-based Mel-Frequency Cepstral Coefficients (MFCCs) and Mel-spectrogram, often suffer from poor noise robustness and limited time–frequency resolution, making them less effective in complex industrial environments. Originally proposed by Peng et al. [12] for robust urban sound classification, the SPWVD-MFCC provides a higher time–frequency resolution than existing methods, enabling a more precise representation of non-stationary signals. This property is particularly critical in industrial environments, where background noise is often unpredictable and high intensity. The enhanced spectral resolution of SPWVD allows for better feature discrimination, while the MFCC preserves perceptually meaningful auditory features, ensuring accurate anomaly detection even under low signal-to-noise ratio (SNR) conditions. By leveraging these advantages, this proposed anomaly detection framework significantly improves classification performance and generalizability in real-world industrial settings. Table 1 compares the commonly used features with SPWVD-MFCC in multiple key fields.

Table 1.
Comparison of feature extraction methods.
This study represents the first application of SPWVD-MFCCs in industrial audio anomaly detection, specifically addressing multiclass classification challenges. Its contributions are summarized as follows:
- Innovative Use of SPWVD-MFCCs for Anomaly Detection: This study introduces the SPWVD-MFCC as a feature extraction method for industrial fault detection, leveraging its high-resolution time–frequency characteristics to effectively represent non-stationary signals.
- Development of a Multiclass Classification Framework: Unlike most previous studies focusing solely on binary classification, we present a scalable multiclass system capable of identifying both machine types and operational states. This approach addresses real-world industrial challenges comprehensively, simplifying the deployment and management of anomaly detection systems.
- Robustness in Noisy Environments: The combination of SPWVD’s high-resolution analysis and the MFCC’s perceptually meaningful auditory features ensures reliable performance under varying SNR conditions. This robustness is critical for ensuring consistent and accurate anomaly detection in noisy industrial settings.
The rest of this paper is organized as follows. Section 2 introduces the proposed SPWVD-MFCC feature extraction method, detailing its mathematical formulation and advantages over traditional approaches. Section 3 presents the CNN-LSTM-based multiclass classification framework, explaining the architecture and preprocessing techniques. Section 4 describes the experimental setup, including dataset details, data preprocessing, and model configurations. Section 5 discusses the experimental results, comparing the proposed framework with baseline methods and evaluating its noise robustness. Finally, Section 6 concludes the paper, summarizing key findings and potential directions for future research.
2. SPWVD-MFCC in Anomaly Detection
The performance of classification models in industrial anomaly detection heavily depends on the extraction of meaningful spectral features from sound signals. Spectral features encapsulate the frequency and temporal characteristics of the audio signals, enabling classifiers to distinguish between machine types and detect anomalies effectively.
This study is the first to extend the application of the recently introduced SPWVD-MFCC [12]—originally designed for robust urban sound classification in noisy environments—to the domain of industrial machinery fault detection. The SPWVD-MFCC has been demonstrated to yield superior sound signal representations under complex conditions compared to the widely used MFCC [12]. This method synergistically integrates SPWVD with the MFCC through a series of transformations. Specifically, the SPWVD is first processed through a Mel filter bank to generate the Mel SPWVD. Subsequently, a logarithmic transformation is applied to produce the log-Mel SPWVD. Finally, the Discrete Cosine Transform (DCT) is performed to derive the SPWVD-MFCCs. The detailed mathematical formulation is as follows:
where and are Hamming windows applied in frequency and time domains, respectively, is a Mel filter bank that maps the -th frequency bin to the -th Mel frequency, is the total number of frequency bins, is the total number of Mel filter banks, is the window index, and is the SPWVD-MFCC index.
The SPWVD-MFCC combines the advantages of SPWVD’s high time–frequency resolution with the MFCC’s ability to extract perceptually meaningful features, making it crucial for effectively representing sound signals. The enhanced time–frequency resolution enables the SPWVD-MFCC to precisely identify subtle and transient anomalies within non-stationary audio signals, which often indicate potential machinery faults. By replacing the STFT used in traditional MFCCs with SPWVD, this method overcomes the fixed resolution limitations of STFT. This adaptability allows SPWVD-MFCCs to capture the complex and dynamic characteristics of industrial machinery sounds, ensuring that even the smallest deviations or irregularities in sound patterns, which are the critical indicators of anomalies, are accurately represented and detected.
3. The Proposed Framework for Multiclass Classification
This study proposes a novel framework for multiclass industrial machine anomaly detection using sound data. The framework utilizes a CNN-LSTM model combined with SPWVD-MFCC features to efficiently detect anomalies across various machine types, eliminating the need to design and train separate models for each machine. Notably, the framework is optimized for low-SNR environments, demonstrating robust noise resistance suitable for complex industrial settings and significantly enhancing its practical deployment value.
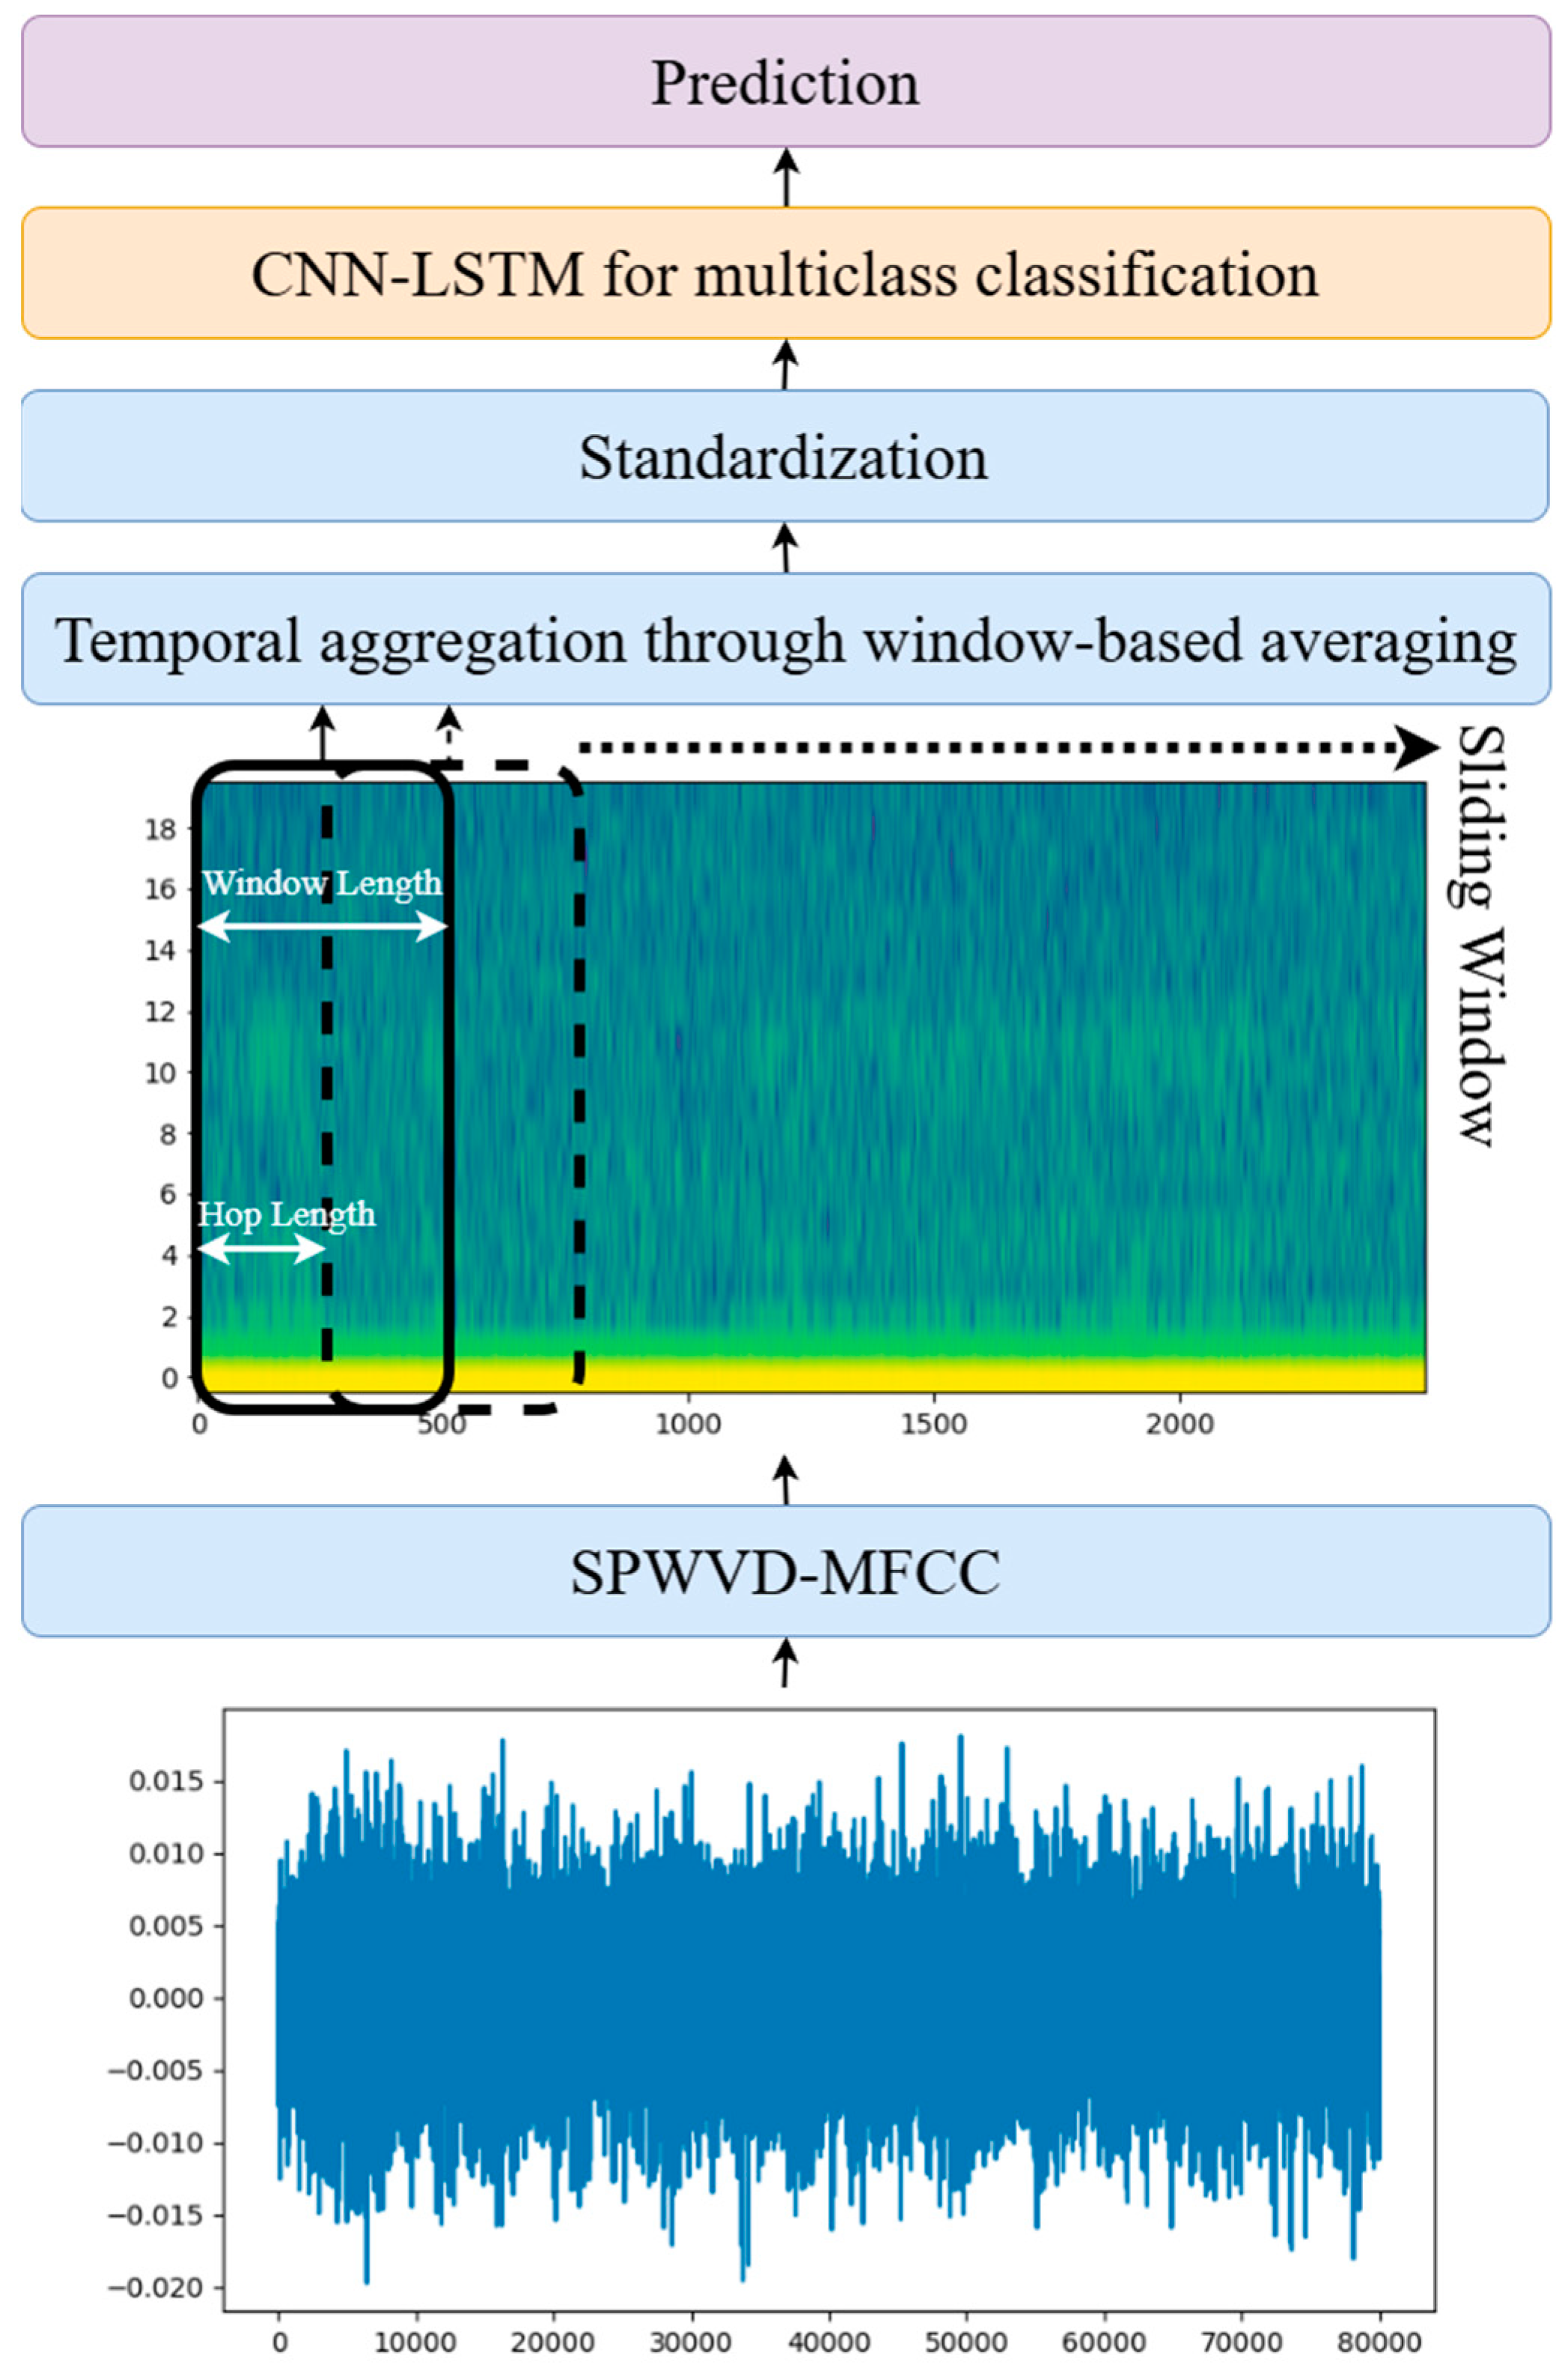
Figure 1 illustrates the framework’s workflow. The input consists of 10 s audio recordings with an 8 kHz sampling rate. These recordings are processed through a feature extraction module to generate SPWVD-MFCC features. The features are calculated with a hop length of 32, resulting in a feature matrix with a shape of (20, 2500), representing 20 coefficients at each timestep with 2500 timesteps for each audio segment. Next, the data undergo dimensionality reduction along the time axis using a sliding window approach. Averaging within each window reduces the feature matrix’s dimensionality. By adjusting the window length and hop size, various reduced-dimensional representations can be obtained. In the proposed workflow, a window length of 200 and a hop size of 100 were used, reducing the timesteps from 2500 to 24. This method effectively reduces feature dimensions while retaining critical frequency and temporal information, eliminating redundant data and providing a streamlined input for the classifier.
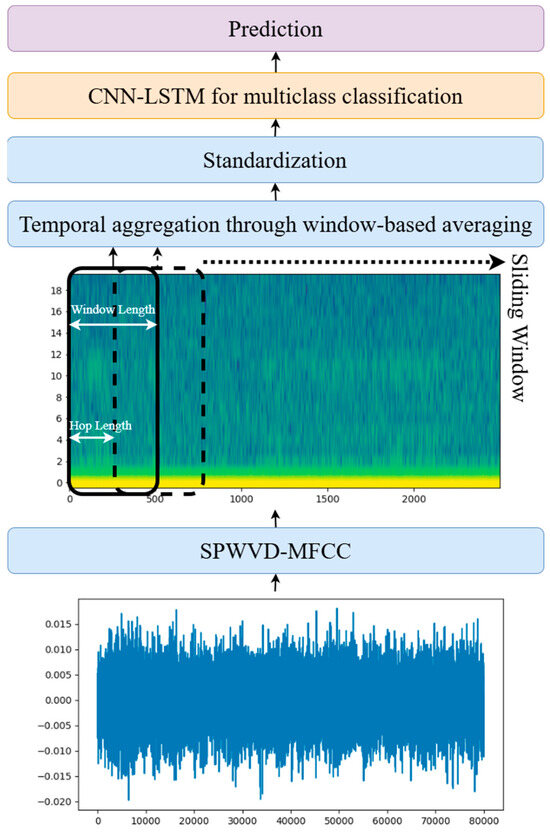
Figure 1.
Overview of the proposed workflow.
The reduced SPWVD-MFCC features, now with a shape of (20, 24), are fed into the CNN-LSTM model for final classification. The CNN-LSTM architecture combines the strengths of convolutional and recurrent networks to extract both spatial and temporal information efficiently. This idea has been utilized in many urban sound classification systems, such as the one proposed in study [13]. Specifically, the CNN layers analyze local spatial features within the frequency domain for each timestep, while the LSTM layers capture long-term temporal dependencies using their gated mechanisms. This combination is particularly well suited for tasks such as anomaly detection and machine type classification based on temporal signal variations. The implemented CNN-LSTM model is designed to accept inputs with the shape of (1, 20, 24), where the dimensions represent the number of channels, coefficients, and timesteps, respectively. Table 2 details the model architecture which includes the following components:
Table 2.
Details of the CNN-LSTM.
- Four CNN modules: Each module consists of a convolutional layer, batch normalization, an activation function, and a dropout layer. The convolutional layers extract local spatial features, batch normalization accelerates training and stabilizes the model, and dropout prevents overfitting.
- Two LSTM layers: These layers model temporal dependencies across timesteps, capturing sequential relationships. A dropout layer is added between the LSTM layers to enhance generalization and reduce overfitting risk.
- A fully connected layer: This layer combines all extracted features and generates the final predictions.
This architecture effectively integrates spatial features in the frequency domain with long-term temporal dependencies, enabling accurate classification of machine types and anomaly detection. Moreover, the flexible sliding window-based dimensionality reduction ensures adaptability to varying input feature resolutions, maintaining robust performance across different scenarios. Unlike traditional binary classification approaches that require separate models for different machine types, the proposed framework enables a unified anomaly detection model that simultaneously classifies multiple machine types and operational states. This significantly simplifies system deployment and reduces maintenance costs. Furthermore, by jointly learning anomaly patterns across diverse machines, the model enhances generalization to unseen data, making it well suited for complex industrial environments. Since the framework leverages SPWVD-MFCCs for feature extraction and a CNN-LSTM for classification, adding new machine types or fault modes requires only minor model fine-tuning rather than complete retraining, thereby improving scalability and long-term applicability. This approach simplifies the development of multimachine anomaly detection systems and significantly improves their feasibility and efficiency for real-world industrial applications.
4. Experiments
The tests conducted in this study use audio samples from the Malfunctioning Industrial Machine Investigation and Inspection (MIMII) dataset [14]. The data preprocessing steps, including dataset split, oversampling for data balancing, and feature windowing for classification, are applied on the MIMII dataset. This section introduces detailed information for experimental setup.
4.1. MIMII Dataset
The MIMII dataset comprises four types of machines sampled at 16 kHz, with each type containing four individual machines labeled as ID 00, 02, 04, and 06. To simulate real-world factory environments, factory noise was added to the dataset, resulting in three levels of SNR: 6 dB, 0 dB, and −6 dB. A lower SNR indicates that higher-power noise has been added, making the classification task increasingly challenging.
Table 3 provides a breakdown of the number of normal and abnormal audio samples for each machine, with each audio sample having a duration of 10 s. The total number of samples across different machine types reveals a significant imbalance in the dataset, particularly between normal and abnormal samples. The pump exhibits the most pronounced imbalance, with the number of normal samples being eight times that of abnormal samples. Similarly, the valve data is also highly unbalanced, with the ratio of normal to abnormal samples nearing 8:1. In addition to the imbalance within individual machine types, there is also a discrepancy in the total number of samples across machine types. The fan has the highest number of samples, totaling 5550, while the other machine types each have approximately 4100 samples. This uneven distribution further underscores the challenges associated with training models on this dataset.
Table 3.
MIMII dataset.
4.2. Data Preparation
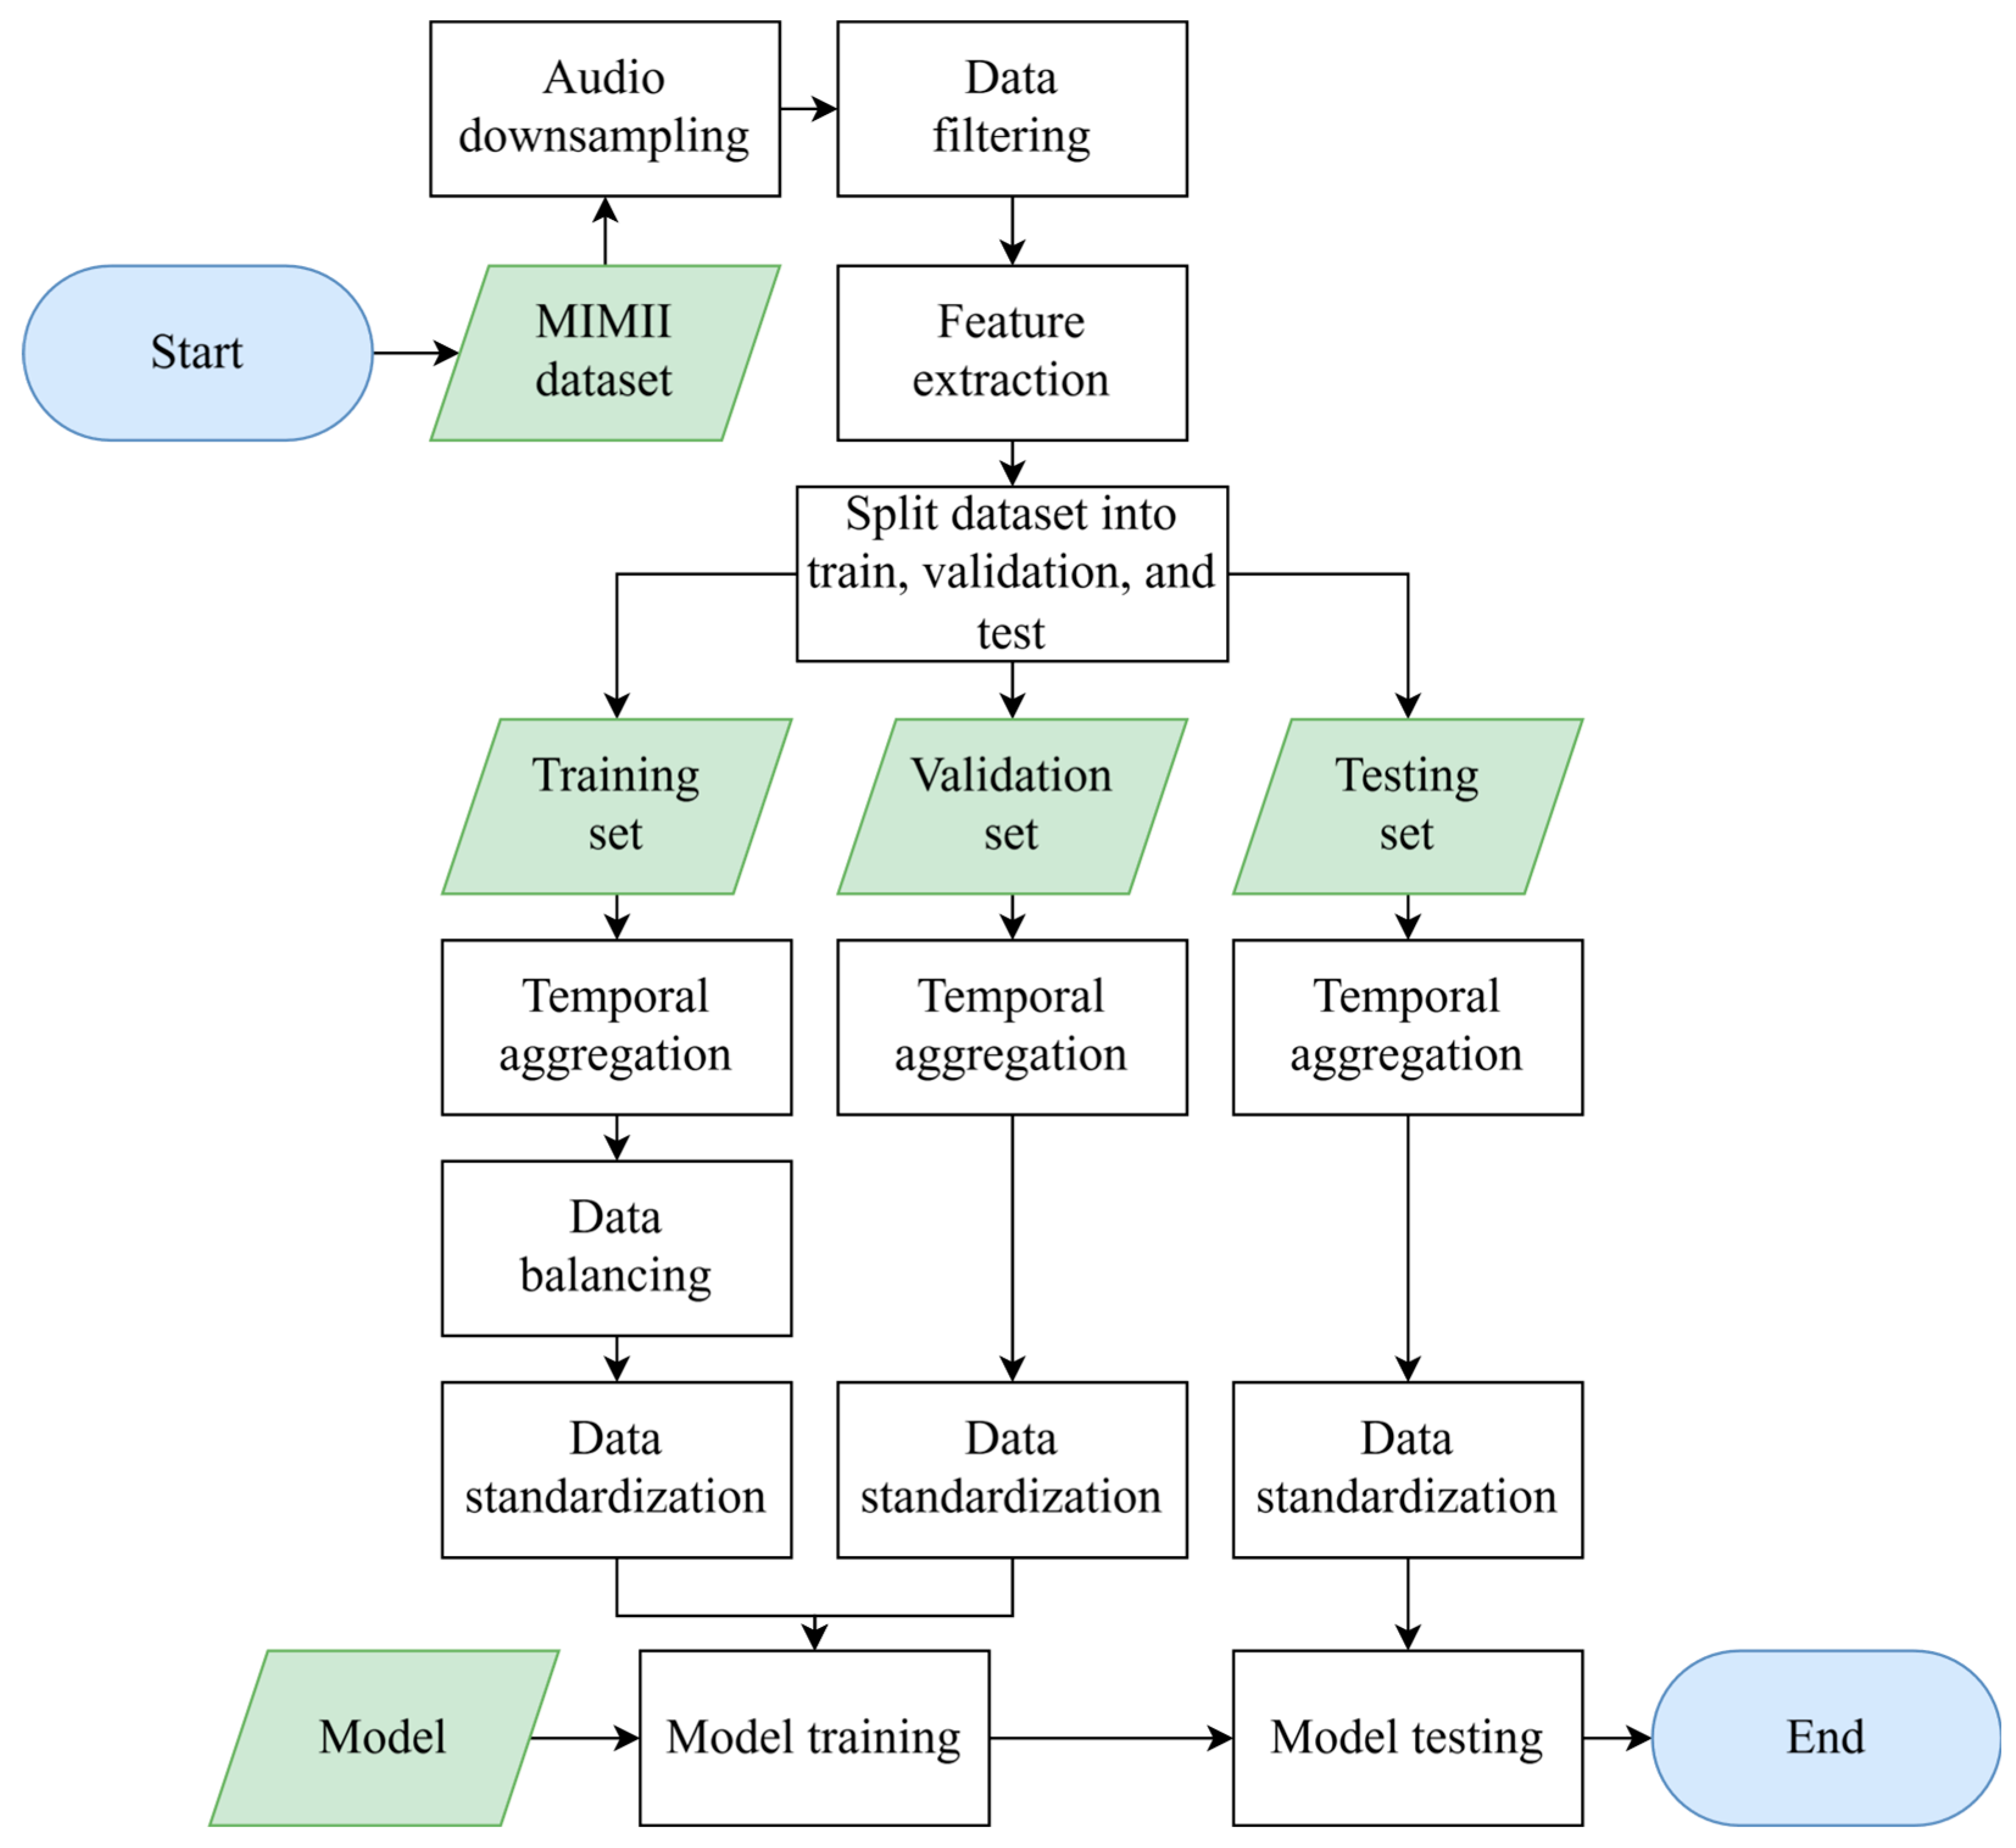
In this study, we undertook a series of data preparation steps, as illustrated in Figure 2. First, the original audio data were downsampled from 16 kHz to 8 kHz to reduce computational costs. Then, we addressed the issue of class imbalance. Since each machine type had fewer abnormal samples than normal samples, we randomly selected an equal number of normal samples to match the abnormal ones for each machine, then merged them to form a new dataset. This ensured that each machine had the same number of normal and abnormal samples, effectively mitigating class bias. Consequently, we obtained four types of machines, each with normal and abnormal states, resulting in a total of eight categories of data.
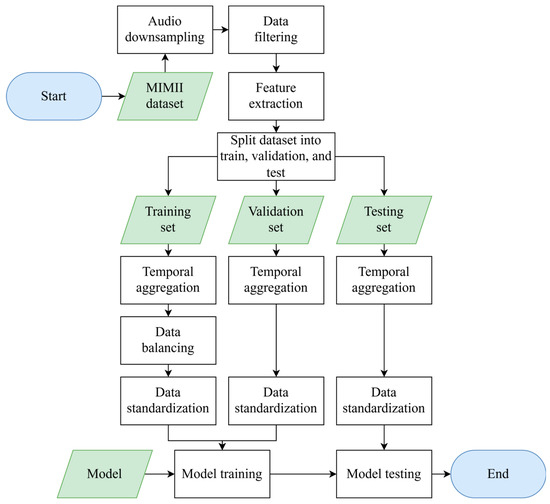
Figure 2.
Workflow for data preparation.
Next, we adopted a feature extraction approach based on SPWVD-MFCCs. Specifically, for the 8 kHz audio data, we employed a hop length of 32 samples and 512 frequency bins to construct the SPWVD-MFCC features with 20 coefficients at each timestep. Each audio sample was 10 s long, leading to a SPWVD-MFCC feature matrix of size (20, 2500), where 20 represents the number of feature coefficients and 2500 denotes the number of timesteps. To simplify the input for the subsequent classification model, we used only static features, excluding the delta and delta–delta coefficients.
To evaluate the model’s performance in both familiar and noisier environments, two types of experiments were conducted. For the first type, we trained and tested the model on datasets with the same SNR, aiming to assess classification accuracy under normal conditions. Here, the dataset for a specific SNR was split into training, validation, and testing sets at a ratio of 6:2:2. For the second type, we trained on the high-SNR dataset and tested on the low-SNR dataset to examine the model’s noise robustness. The high-SNR dataset was partitioned at a ratio of 7.5:2.5 for training and validation, while the entire low-SNR dataset was used for testing. Good performance under these circumstances would demonstrate strong anti-noise capability and greater potential for real-world applications.
Then, we applied a sliding window approach to aggregate data along the time axis, reducing the number of timesteps to achieve dimensionality reduction and sequence length control. In the proposed framework, the window size and hop length were set to 200 and 100, respectively. By averaging data within each window along the time axis, the timesteps were reduced from 2500 to 24. Additionally, we compared this configuration with other window and hop combinations, including (100, 50), (500, 250), (1000, 500), (1500, 1000), and a single window length of 2500. These configurations reduced the timesteps to 48, 9, 4, 2, and 1, respectively. It is important to note that having only 1 or 2 timesteps limits the effectiveness of LSTM models for processing temporal sequences. As such, these reduced representations were not used for testing the CNN-LSTM model but instead were evaluated with alternative classification models, whose details are discussed in the following section.
As a comparison for averaging within windows, we also employed Principal Component Analysis (PCA) for dimensionality reduction. A separate PCA model was built for each coefficient, extracting one principal component per window. We selected PCA as a comparison method primarily due to its widespread application and strong theoretical foundation in high-dimensional data dimensionality reduction. PCA, an unsupervised learning technique, effectively captures the directions of maximum variance in the data, providing an optimal linear representation. This comparison helps us evaluate the performance differences between time-axis averaging and PCA across various classification models, offering valuable insights for selecting the most suitable dimensionality reduction approach.
Although balancing the number of normal and abnormal samples within each machine type partially addressed class imbalance, significant differences remained in the total data volume across machine types. For instance, the Fan category contained substantially more data than other types. To further mitigate class imbalance and enhance the model’s performance, we applied the Synthetic Minority Oversampling Technique (SMOTE) to the training set. This method ensured that all classes were matched to the largest class in terms of data volume, which not only improved the model’s ability to learn from minority class samples but also enhanced the robustness of the overall classifier.
Finally, the standardization step using Z-Score transformation further improved the model’s training and prediction performance. This comprehensive sequence of data preparation and preprocessing steps significantly enhanced the consistency and representativeness of the extracted features, laying a solid foundation for effective model training and evaluation.
4.3. Models for Comparison
Given this study’s focus on multiclass classification, we only considered the models based on supervised learning. Statistical models have been heavily used in the past anomaly detection tasks. Among the statistical supervised learning algorithms, Support Vector Machine (SVM) and Random Forest (RF) were selected for performance comparison in this study:
- Support Vector Machine (SVM): The SVM is one of the fundamental machine learning algorithms that has turned out to be effective in fault detection, classification, and regression problems [15]. They work by finding the optimal hyperplane or the set of hyperplanes which maximizes the margin between classes in the feature space. This margin-based approach not only aids in attaining robust performance but also reduces overfitting to a greater degree, especially on smaller or moderately sized datasets. Though originally designated for binary classification, their work can be extended to multiclass problems by means of strategies such as one-vs-all. A single binary classifier would thereby be trained per class; thus, in general, the total number of classifiers increases with the number of classes. In this approach, multiple fault types may be detected within a single SVM framework but at the cost of a greater computational overload as the number of classes increases.
- Random Forest (RF): The RF is a widely utilized supervised learning algorithm known for its robustness and versatility in classification tasks, including multiclass classification [16]. RF operates as an ensemble learning method by constructing a multitude of decision trees during training and outputting the class that is the mode of the classes of the individual trees. This ensemble approach effectively addresses the overfitting problem commonly observed in decision trees, leading to improved generalization performance. Each tree in the forest is built using a random subset of the training data and a random selection of features, which introduces diversity among the trees. This diversity enhances the algorithm’s ability to handle complex, non-linear decision boundaries and reduces sensitivity to noise in the data. Compared to the SVM, RFs are computationally less expensive in training multiclass models, as they do not require one-vs-all strategies or kernel transformations. However, the size and complexity of the model can increase with the number of trees, potentially impacting inference time. Nevertheless, the trade-off often results in high accuracy and robustness, making RF a popular choice for multiclass classification tasks.
Table 4 lists the hyperparameter values for the SVM and RF models used in this study. These parameters replicate the configurations from previous research [10], which achieved excellent results, providing a foundation to demonstrate the advantages of the new features. To investigate the impact of timesteps on statistical models, each model group in this study processes features from a single timestep (20-dimensional data). For instance, if the input consists of 24 timesteps, 24 separate model groups are trained, each handling one timestep. The predicted probabilities from all groups are then averaged, and the class with the highest probability is selected as the final prediction. By splitting the data this way, the dimensionality burden on each individual model is reduced, thereby simplifying model complexity. However, this approach requires training and evaluating multiple model groups for each timestep, resulting in additional computational overhead.
Table 4.
Hyperparameter values for selected machine learning algorithms.
4.4. Evaluation Metrics
In this study, we employ both accuracy and F1-score metrics to evaluate fault detection approaches. Accuracy is a commonly used classification metric that measures the overall rate of correct classifications across all samples. It is expressed as
where the following applies:
- TP (True Positives) count the instances correctly classified as positive;
- TN (True Negatives) count the instances correctly classified as negative;
- FP (False Positives) count the instances that are actually negative but were incorrectly classified as positive;
- FN (False Negatives) count the instances that are actually positive but were incorrectly classified as negative.
Although accuracy is straightforward and widely used, it becomes less informative in cases where the test set is imbalanced (i.e., the positive and negative classes are not roughly equal in size). Under such circumstances, even a model that trivially predicts the majority class can yield high accuracy yet fail to detect minority-class instances effectively. Therefore, it is crucial to consider additional metrics that account for performance in both classes. To address this limitation, we also evaluate our models using the F1-score, which provides a single measure balancing Precision and Recall. These metrics are defined as follows:
- Precision indicates the proportion of positive predictions that are actually positive, and it is defined by
- Recall reflects the model’s ability to identify all actual positives, and it is defined by
- F1-score is computed as the harmonic mean of Precision and Recall:
By incorporating both Precision and Recall into a single figure of merit, the F1-score ensures that the model’s capability to identify positive instances (Recall) and its accuracy in labeling them (Precision) are both accounted for. In imbalanced scenarios, the F1-score offers a more robust depiction of the model’s predictive power compared to accuracy alone.
In summary, relying solely on accuracy can mask a model’s inability to identify critical minority-class instances. By contrast, combining accuracy with the F1-score provides a more comprehensive understanding of the model’s overall performance, ensuring that both prevalent and rare classes are properly represented in the evaluation process.
5. Results and Discussion
In this section, experimental results are presented and analyzed using supervised approaches for multiclass classification to detect not only abnormalities but also the types of machines. Three experiments were conducted in this study to evaluate the model’s performance in both familiar and noisier environments.
- Test the Feature Performance: We examine the performance of the new SPWVD-MFCC features for anomaly detection in industrial machines using sound. For comparison, we replicated the multiclass classification systems proposed by Gantert et al. [10], which utilized the SVM and Light Gradient Boosting Machine (LGBM) to classify multiple spectral features, including MFCC, Spectral Centroid, Spectral Bandwidth, Spectral Roll-off, and Zero Crossing Rate.
- Test on Framework Performance: This experiment aims to validate the performance of the proposed classification framework, which employs a CNN-LSTM model to classify temporally aggregated SPWVD-MFCC features across 24 timesteps.
- Test on Framework Robustness: This experiment focuses on the robustness of the proposed classification framework. Here, the model is trained on a higher-SNR dataset and tested on a lower-SNR dataset, simulating real-world environments where noise levels vary significantly.
These experiments collectively provide a comprehensive evaluation of the proposed methods under different conditions, highlighting their effectiveness and adaptability in real-world scenarios. The experiments were run on a lab workstation with Intel(R) Core(TM) i7-11700 CPU @ 2.50 GHz, NVIDIA T400 GPU with 4 GB of memory, and 48 GB of RAM.
5.1. Performance of SPWVD-MFCCs in Anomaly Detection
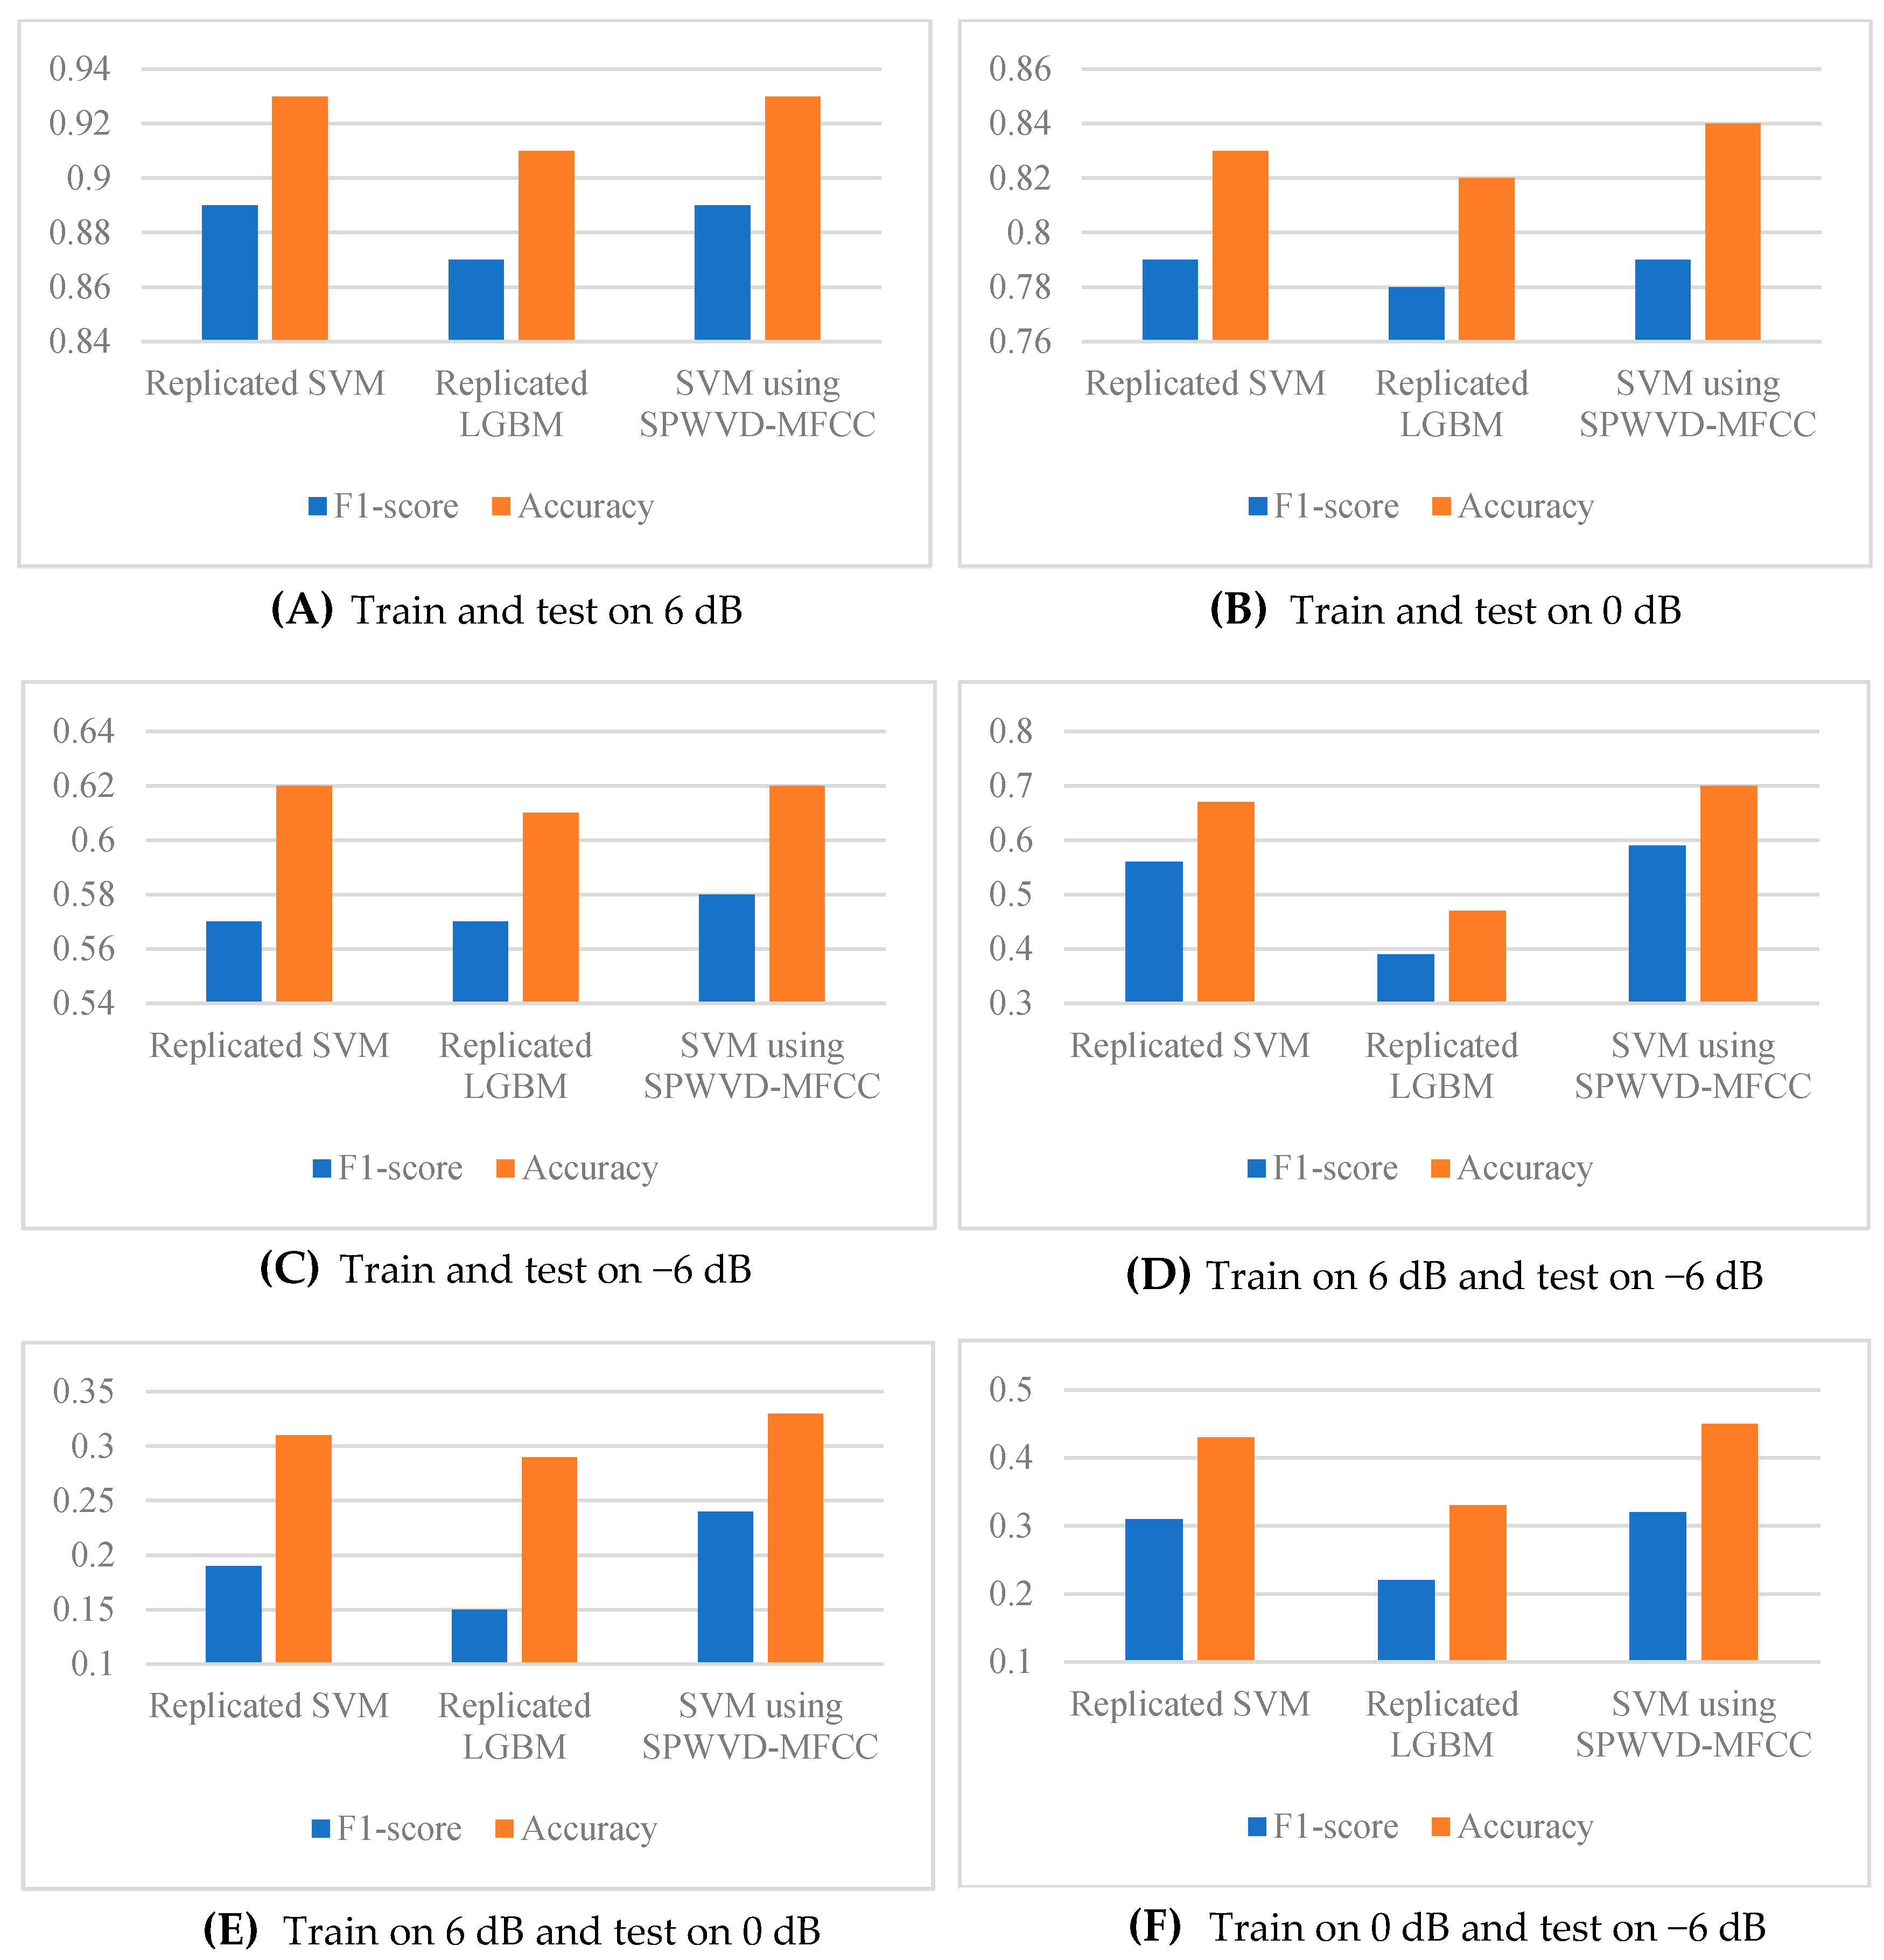
We first explored the performance of the SPWVD-MFCC feature in industrial machine anomaly detection. This experiment replicated the method described in study [10], including both the features and classifiers (SVM and LGBM), to compare the results obtained by using SPWVD-MFCC features with the SVM. The results are shown in Figure 3.
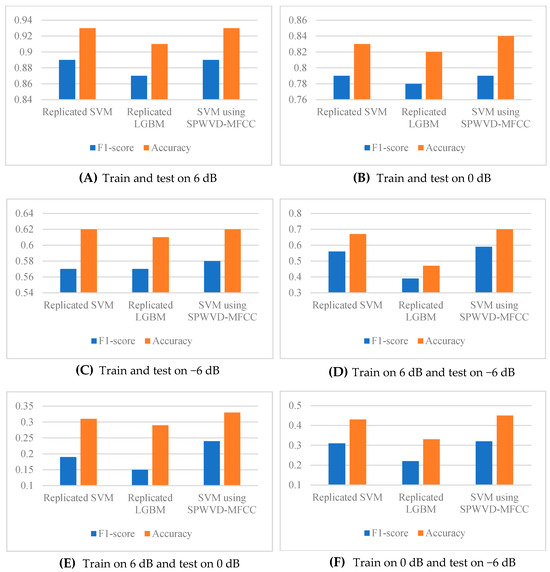
Figure 3.
Test the SPWVD-MFCC feature performance by comparing it with the duplicated systems.
First, we compared the classification performance under conditions where training and testing were conducted with the same SNR (Figure 3A–C, representing 6 dB, 0 dB, and −6 dB, respectively). The results indicate that the SVM using SPWVD-MFCCs achieved a comparable classification performance to the reproduced SVM method. Notably, there was a slight improvement of approximately 1% in accuracy at 0 dB and F1-score at −6 dB. This suggests that the SPWVD-MFCC has a comparable ability to express features for industrial machine anomaly detection as traditional MFCC and other STFT-based spectral features and even outperforms them in certain scenarios.
Then, to evaluate the noise robustness of the features, we trained the models on high-SNR datasets (e.g., 6 dB or 0 dB) and tested them on low-SNR datasets (e.g., 0 dB or −6 dB); therefore, analyzing the feature performance in complex environments. As shown in Figure 3D–F:
- When trained on the 6 dB dataset, SPWVD-MFCCs significantly outperformed the reproduced method during testing at 0 dB and −6 dB (with a maximum improvement of 5%, observed in the −6 dB test).
- When trained on the 0 dB dataset and tested on the −6 dB dataset, SPWVD-MFCCs also demonstrated a superior F1-score and accuracy.
Therefore, the experiment indicates that the SPWVD-MFCC not only exhibits a classification performance comparable to traditional MFCCs and spectral features under consistent SNR conditions but also demonstrates remarkable robustness in noisy environments, which is critical in complex industrial settings. This highlights the SPWVD-MFCC as a highly promising feature extraction method for industrial machine anomaly detection, paving the way for improved anomaly detection in challenging noise conditions.
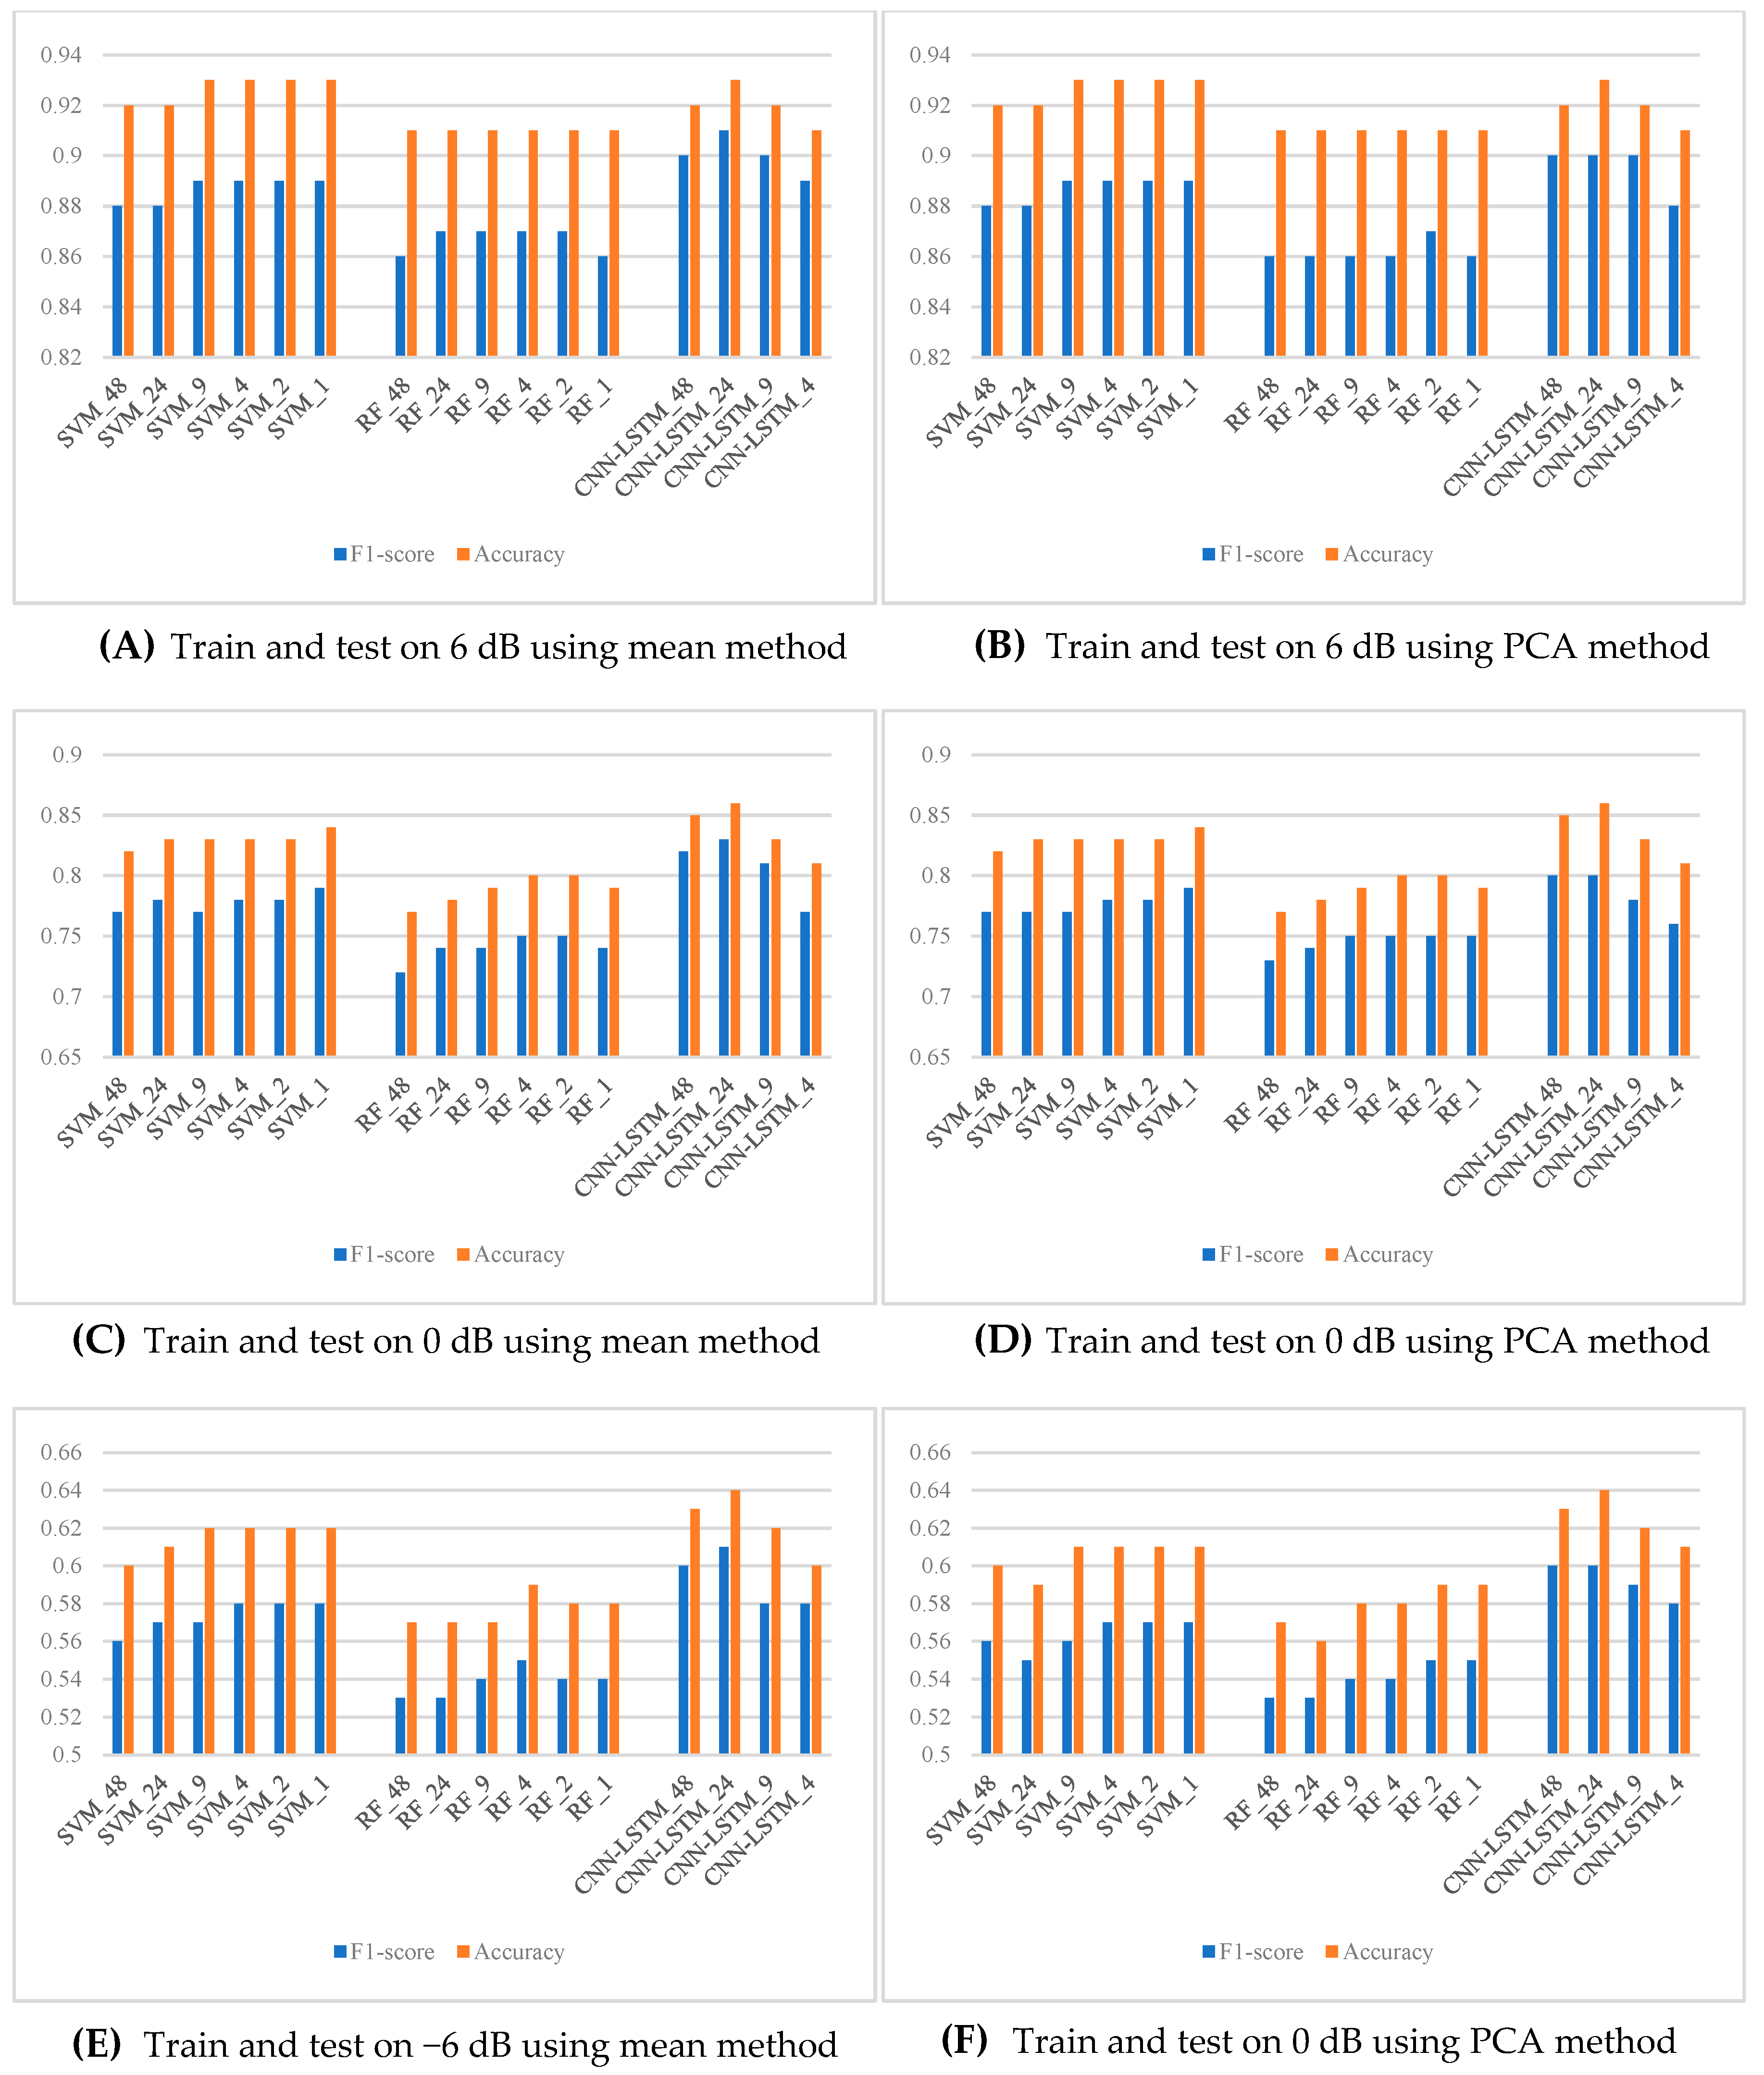
5.2. Performance of the Proposed Framework
In the second experiment, we validated the effectiveness of the suggested framework using SPWVD-MFCCs for the multiclass industrial machine anomaly detection task. This experiment explores various combinations in window length, temporal aggregation methods, and classifiers. The proposed framework uses a combination: window length of 500 samples with a step size of 250 samples, which yielded a new feature with the length of 24; temporal aggregation method: mean; classifier: CNN-LSTM. In this experiment, window lengths are chosen as 100, 500, 1000, 1500, and 2500, while the step size is half of the window length. This creates new feature sets with 48, 24, 9, 4, 2, and 1 timesteps, respectively. Temporal aggregation methods considered in this experiment are mean and PCA, while the classifiers include SVM, RF, and CNN-LSTM.
Figure 4 presents the results of this experiment. By comparing bar lengths in each subfigure, it is easy to notice that the aggregated SPWVD-MFCC with 24 timesteps has always outperformed the other configurations. This is in terms of either F1-score, accuracy, or both. For CNN-LSTM, increasing or decreasing the number of timesteps resulted in a performance drop. This might be because increasing timesteps means that more sequential information has to be handled by the LSTM model, which may cause information overload or inconsistent learning, thus affecting the effectiveness of training. On the other hand, fewer timesteps may lead to an insufficiency of sequential information, preventing the LSTM from effectively modeling long-term dependencies. Hence, SPWVD-MFCC features with 24 timesteps would obtain the best balance between information retention and temporal pattern learning, thus providing the optimum classification performance.
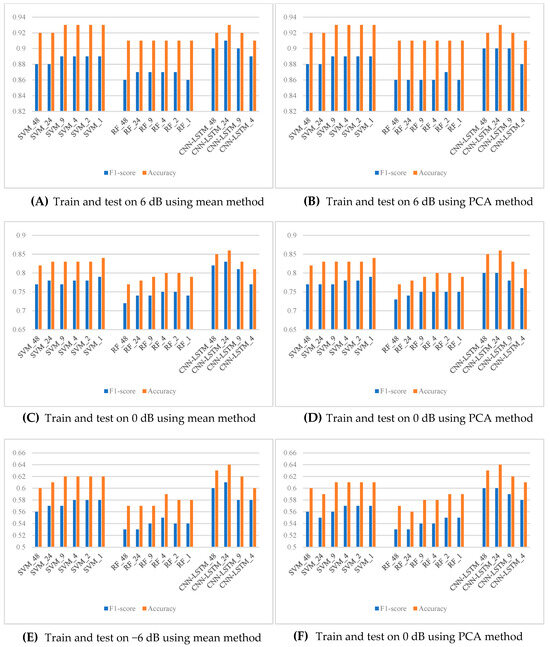
Figure 4.
Test on the performance of the proposed framework.
Moreover, the SVM and RF tend to degrade in performance with an increased number of timesteps. This may be because the information in each timestep becomes sparser as the number of timesteps increases. Since each timestep is processed by an independent model and the final classification is made through a voting mechanism, the reduced feature information per model limits the accuracy of classification, hence lowering the voting accuracy.
It can be observed from the comparison of the left and right subfigures in the same row of Figure 4 that the results obtained using the mean and PCA methods are nearly identical. It means that when the training and testing are performed on datasets of the same SNR for a given window length and classifier, the choice of the temporal aggregation method will not significantly influence performance. This could be because the SPWVD-MFCC has already extracted features effectively, and the mean aggregation method can smooth the data efficiently. Although PCA can reduce feature dimensions and remove some redundant information, its additional effect seems limited. Therefore, in this experiment, both methods are enough to retain useful information and do not affect the classification performance significantly.
In summary, this experiment demonstrates that the proposed framework using SPWVD-MFCCs, with a window length of 200 samples, a hop length of 100 samples, and CNN-LSTM as the classifier, provides effective performance for multiclass industrial machine anomaly detection tasks, regardless of using mean or PCA in the temporal aggregation.
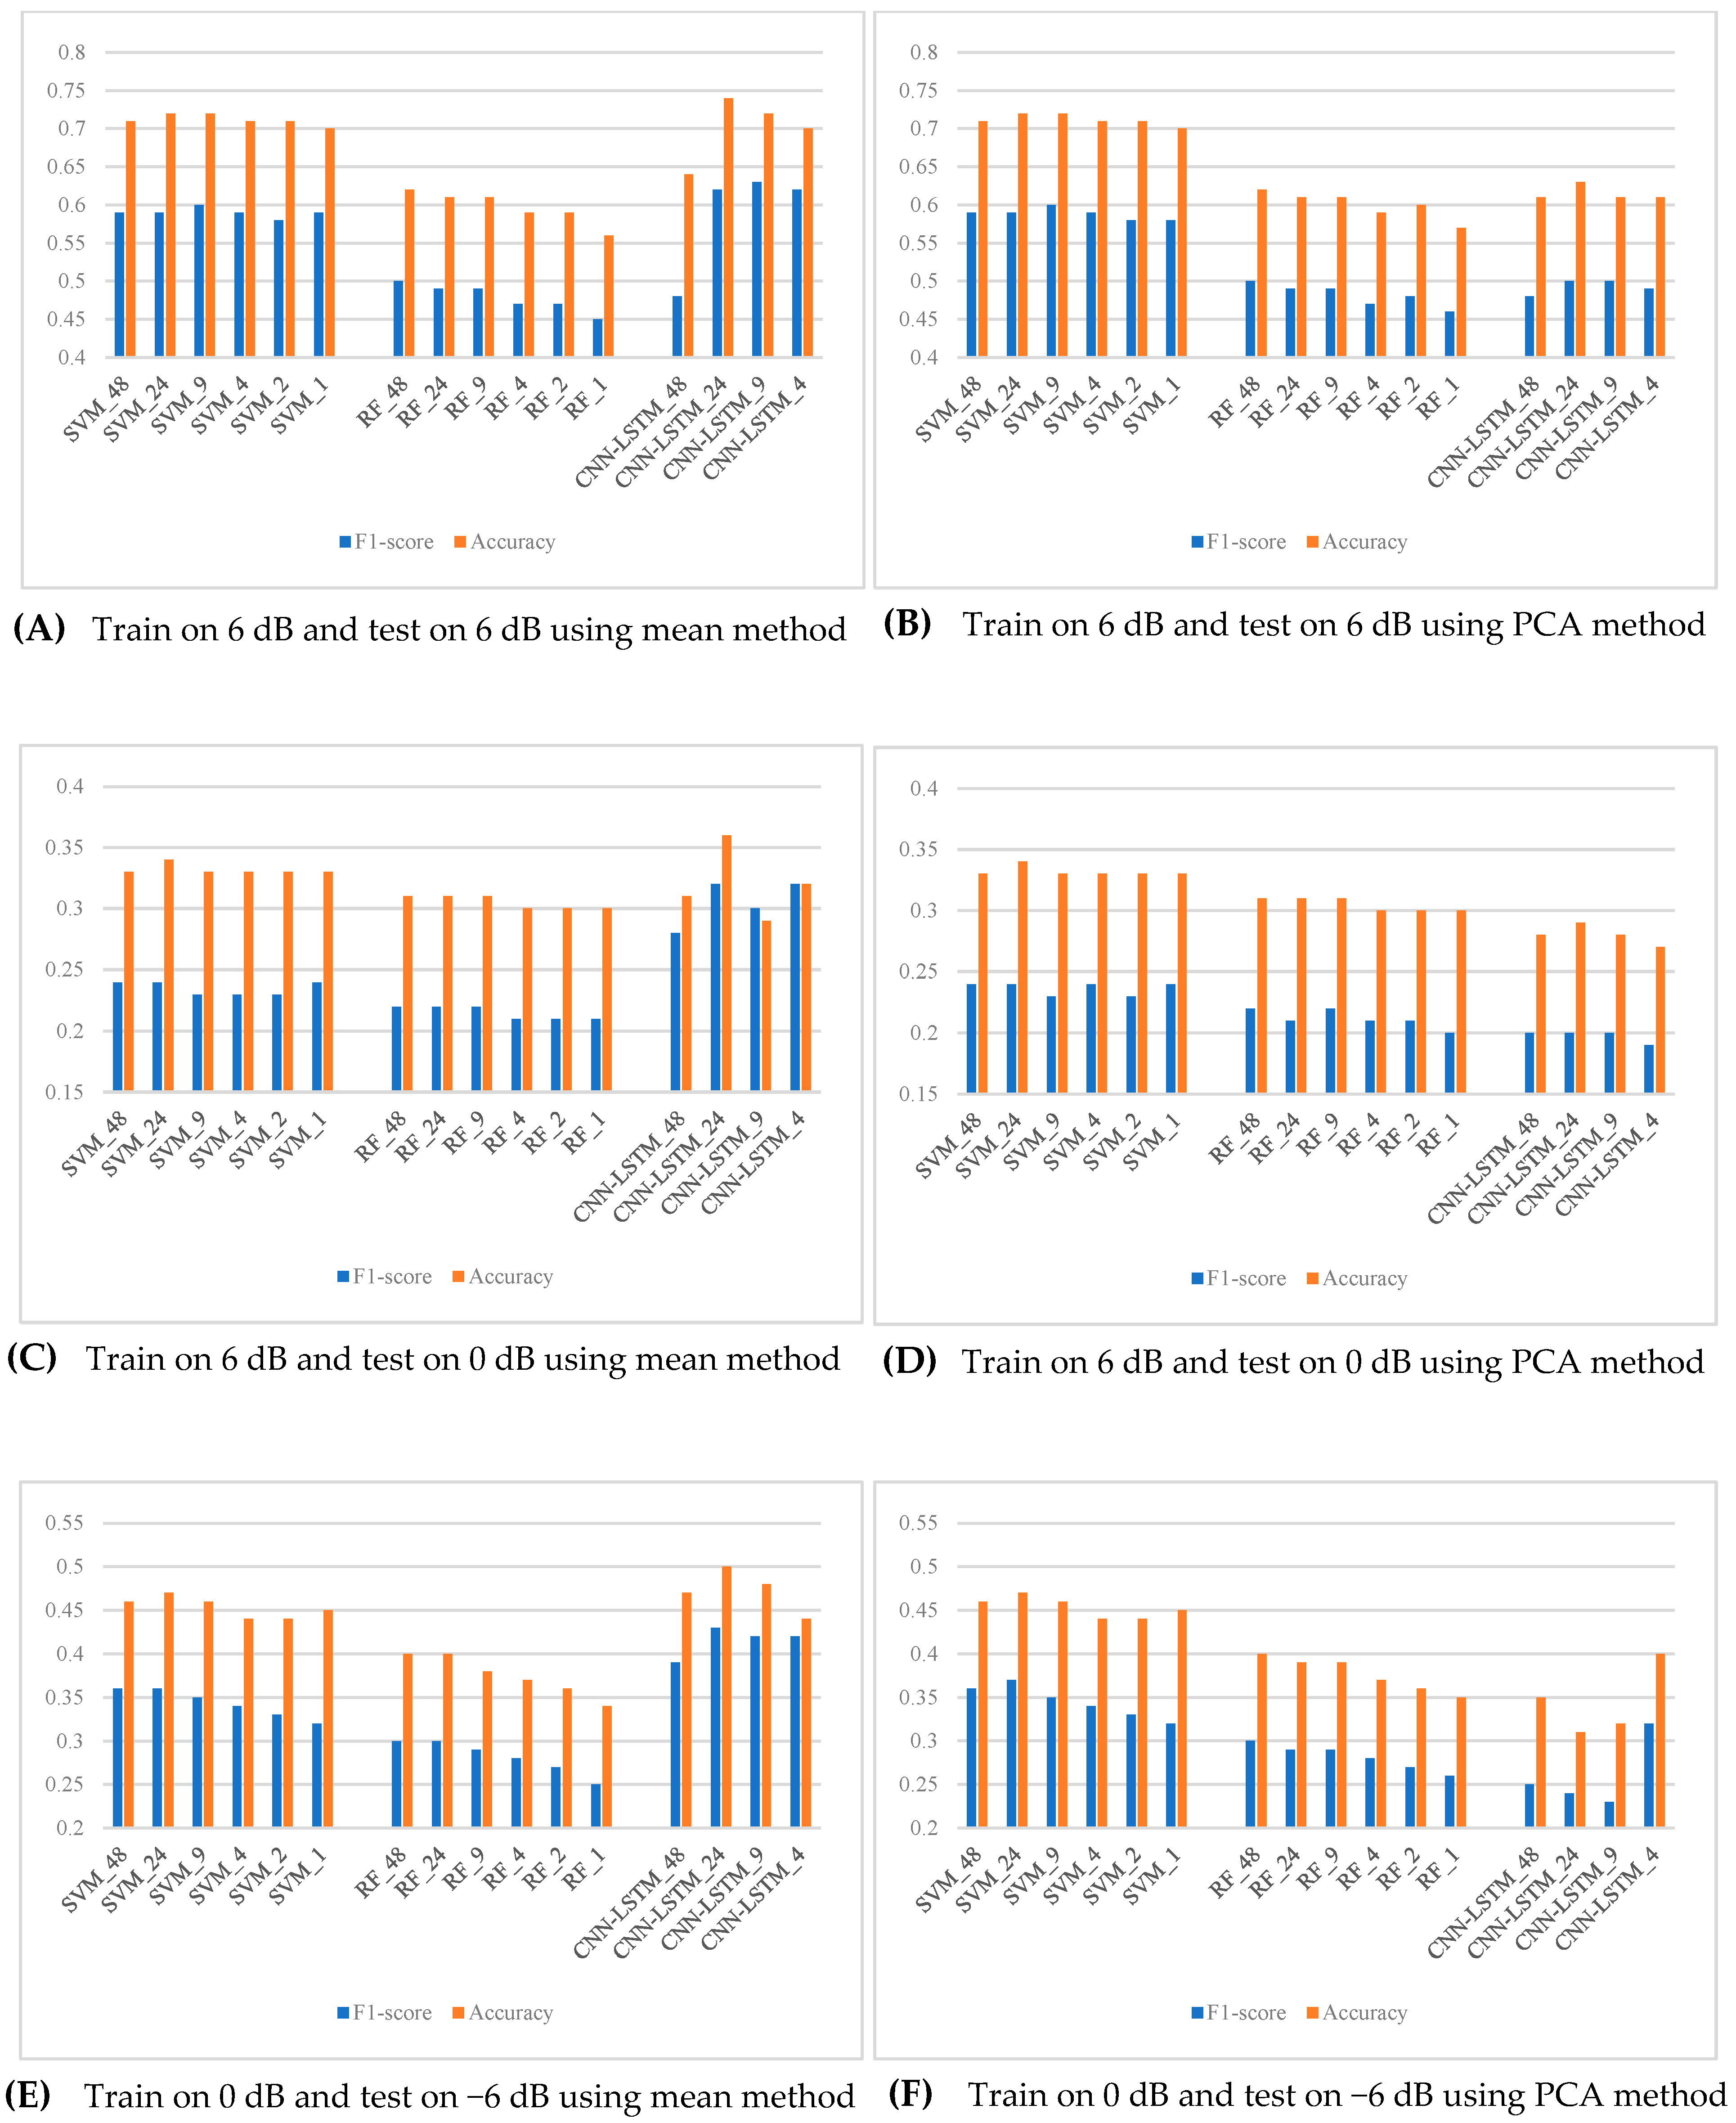
5.3. Robustness of the Proposed Framework
The final experiment investigates the proposed framework’s robustness to noise. Unlike the previous experiment, in which training and testing were consistently made on datasets of the same SNR, this experiment trained models using high-SNR datasets (e.g., 6 dB or 0 dB) and tested them by using low-SNR datasets (e.g., 0 dB or −6 dB). This would ensure that the classification performance of the framework holds well for noisier and more complex environments. As in the previous experiment, this work also examined multiple combinations of components for their performance in low-SNR conditions.
The results, shown in Figure 5, highlight several key findings. First, the proposed framework, the CNN-LSTM model with 24 temporal steps of SPWVD-MFCC features aggregated by the mean method, consistently achieved the highest performance, showing excellent robustness within a noisy environment. Furthermore, it is noted that for the CNN-LSTM model, the performance was considerably lower when using PCA aggregation compared to when the aggregation is carried out by the mean method. This is because the mean method effectively suppresses noise by averaging out fluctuations within each window, resulting in smoother and more stable input features that capture global trends more effectively. In contrast, although PCA reduces dimensionality, it might inadvertently discard critical temporal correlations and local details that adversely impact the performance of CNN-LSTM.
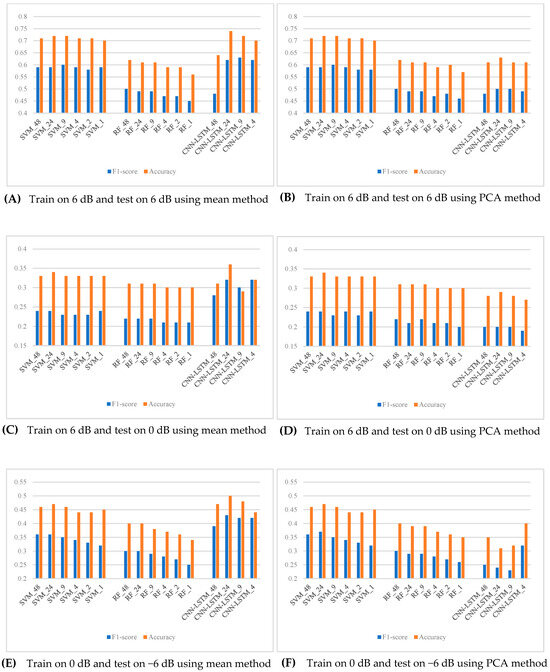
Figure 5.
Test of the robustness of the proposed framework.
On the other hand, for the SVM and RF models, their performances are not sensitive to the choice of temporal aggregation methods. This stability could be explained by the fact that those models rely on the timestep voting strategy, which renders them less sensitive to variations in temporal feature aggregation. Contrary to the results of the preceding experiment, higher numbers of time steps did not negatively influence the classification result. On the contrary, F1-scores and accuracy showed slight improvements in some cases. This may be because additional temporal steps allow the model to leverage more data for analysis—a critical advantage in complex scenarios.
In summary, the proposed multiclass detection framework for industrial machine anomaly sounds demonstrates exceptional noise robustness. Leveraging a CNN-LSTM classifier combined with SPWVD-MFCC features aggregated using the mean method over 24 temporal steps, the framework consistently achieves significantly higher F1-scores and accuracy in noisy environments. This underscores its strong potential for application in complex and noise-intensive scenarios. Combined with the findings from Experiment 2, there is sufficient evidence to confidently assert that the proposed framework is the optimal solution for this task.
6. Limitations and Future Work
While the proposed framework demonstrates a strong performance in industrial anomaly detection, there are several limitations that should be addressed in future research. By addressing these limitations, the proposed framework can be further refined to achieve greater adaptability, efficiency, and robustness in large-scale industrial anomaly detection systems.
6.1. Sensitivity to Hyperparameters
The model’s performance is influenced by various hyperparameters, including the number of CNN layers, LSTM hidden units, and feature extraction parameters. While we conducted sensitivity analyses to determine optimal values, these hyperparameters may require retuning for different industrial setups. Future work could explore automated hyperparameter optimization techniques, such as Bayesian optimization or evolutionary algorithms, to enhance adaptability across diverse datasets.
6.2. Computational Cost and Real-Time Deployment
While the CNN-LSTM model achieves high accuracy, it also introduces greater computational complexity compared to traditional classifiers like the SVM or Random Forest. This can be a challenge for real-time industrial monitoring, especially on edge computing devices with limited processing power. To enhance efficiency, future optimizations could focus on reducing computational overhead through model compression techniques such as knowledge distillation or quantization. Additionally, adopting lightweight architecture, such as streamlined CNN models, may improve performance in real-time applications. Hardware acceleration, utilizing GPUs or FPGAs, could further enhance inference speed, making deployment more feasible in industrial environments.
6.3. Generalization and Data Diversity
This current study primarily evaluates the framework using the MIMII dataset, which includes four machine types under different noise conditions. However, real-world industrial environments present greater complexity, with diverse machine sounds, environmental variations, and unseen anomalies. To enhance generalizability, future research should validate the model on additional datasets, such as ToyADMOS or other publicly available industrial sound datasets. Deploying and testing the model in real-world industrial settings would provide valuable insights into its robustness under varying operational conditions. Furthermore, implementing domain adaptation techniques could improve model transferability, ensuring effective performance across different machine types and acoustic environments.
7. Conclusions
This study proposes a new framework for industrial anomaly detection using SPWVD-MFCCs with a CNN-LSTM model. This method overcomes some major lacunae in the existing techniques related to poor scalability, limited noise robustness, and restriction to binary classification. Extensive experimentation with the MIMII dataset demonstrates that the proposed framework is superior for multiclass classification tasks and sustains high accuracy and F1-scores across a wide variation of signal-to-noise ratios.
The key results are that the SPWVD-MFCC presents a robust feature representation that boosts anomaly detection, especially in a low-SNR environment. By integrating CNN-LSTM, both spatial and temporal features of industrial acoustic signals are effectively extracted for fault classification on different machine types compared to the SVM and RF. Furthermore, the dimensionality reduction strategy guarantees computational efficiency by preserving critical information, thus making the framework scalable for real-world industrial applications.
By improving both classification accuracy and noise resilience, this research presents a significant advancement in industrial diagnostics. With the robustness and scalability of the proposed method, there is great potential for practical deployment in noisy, complex factory environments where the detection of real-time anomalies has important implications for the maintenance of operational efficiency and safety. Real-time implementation on edge devices could be explored along with further optimizations to deploy them across diverse industrial settings.
Author Contributions
Conceptualization, B.P., D.L., K.I.-K.W. and W.H.A.; methodology, B.P. and D.L.; software, B.P. and D.L.; validation, B.P. and D.L.; formal analysis, B.P. and D.L.; investigation, B.P. and D.L.; resources, B.P., D.L., K.I.-K.W. and W.H.A.; data curation, B.P. and D.L.; writing—original draft preparation, B.P. and D.L.; writing—review and editing, B.P., D.L., K.I.-K.W. and W.H.A.; visualization, B.P.; supervision, K.I.-K.W. and W.H.A.; project administration, B.P.; funding acquisition, B.P. and D.L. All authors have read and agreed to the published version of the manuscript.
Funding
This study was funded by the China Scholarship Council (Grant number: 202208250025).
Data Availability Statement
The original contributions presented in this study are included in the article. Further inquiries can be directed to the corresponding author.
Conflicts of Interest
The authors declare no conflicts of interest.
Abbreviations
The following abbreviations are used in this manuscript:
| FNs | False Negatives |
| FPs | False Positives |
| LGBM | Light Gradient Boosting Machine |
| MFCCs | Mel-Frequency Cepstral Coefficients |
| MIMII | Malfunctioning Industrial Machine Investigation and Inspection |
| PCA | Principal Component Analysis |
| RF | Random Forest |
| SMOTE | Synthetic Minority Oversampling Technique |
| SNR | Signal-to-noise ratio |
| SPWVD | Smoothed Pseudo Wigner-Ville Distribution |
| SPWVD-MFCC | SPWVD-based MFCC |
| STFT | Short-Time Fourier Transform |
| SVM | Support Vector Machine |
| TNs | True Negatives |
| TPs | True Positives |
References
- Ciaburro, G. Machine Fault Detection Methods Based on Machine Learning Algorithms: A Review. MBE 2022, 19, 11453–11490. [Google Scholar] [CrossRef] [PubMed]
- Lu, Q.; Cheng, J.; Guo, D.; Su, M.; Wu, X.; Ru, T. Binary Classification Model Based on Machine Learning Algorithm for the Short-Circuit Detection in Power System. In Proceedings of the 2019 2nd International Conference on Algorithms, Computing and Artificial Intelligence, Sanya, China, 20–22 December 2019; Association for Computing Machinery: New York, NY, USA, 2020; pp. 271–275. [Google Scholar]
- Amal Krishna, T.S.; Hari Kumar, R. Fault Detection and Classification for DC Microgrid Using Binary Classification Models. In Proceedings of the 2023 International Conference on Control, Communication and Computing (ICCC), Thiruvananthapuram, India, 19–21 May 2023; pp. 1–6. [Google Scholar]
- Müller, R.; Ritz, F.; Illium, S.; Linnhoff-Popien, C. Acoustic Anomaly Detection for Machine Sounds Based on Image Transfer Learning. In Proceedings of the 13th International Conference on Agents and Artificial Intelligence, Online, 4–6 February 2021; pp. 49–56. [Google Scholar]
- Hojjati, H.; Armanfard, N. Self-Supervised Acoustic Anomaly Detection Via Contrastive Learning. In Proceedings of the ICASSP 2022—2022 IEEE International Conference on Acoustics, Speech and Signal Processing (ICASSP), Singapore, 22–27 May 2022; pp. 3253–3257. [Google Scholar]
- Ota, Y.; Unoki, M. Anomalous Sound Detection for Industrial Machines Using Acoustical Features Related to Timbral Metrics. IEEE Access 2023, 11, 70884–70897. [Google Scholar] [CrossRef]
- Chinnasamy, M.D.; Sumbwanyambe, M.; Hlalele, T.S. Acoustic Anomaly Detection of Machinery Using Autoencoder Based Deep Learning. In Proceedings of the 2024 32nd Southern African Universities Power Engineering Conference (SAUPEC), Stellenbosch, South Africa, 24–25 January 2024; pp. 1–6. [Google Scholar]
- Chandrakala, S.; Pidikiti, A.; Sai Mahathi, P.V.N. Spectro Temporal Fusion with CLSTM-Autoencoder Based Approach for Anomalous Sound Detection. Neural Process Lett. 2024, 56, 39. [Google Scholar] [CrossRef]
- Zabin, M.; Choi, H.-J.; Kabir, M.K.; Kabir, A.N.B.; Uddin, J. Machine Fault Diagnosis: Experiments with Different Attention Mechanisms Using a Lightweight SqueezeNet Architecture. Electronics 2024, 13, 3112. [Google Scholar] [CrossRef]
- Gantert, L.; Zeffiro, T.; Sammarco, M.; Campista, M.E.M. Multiclass Classification of Faulty Industrial Machinery Using Sound Samples. Eng. Appl. Artif. Intell. 2024, 136, 108943. [Google Scholar] [CrossRef]
- Zou, F.; Li, X.; Li, Y.; Sang, S.; Jiang, M.; Zhang, H. GOL-SFSTS Based Few-Shot Learning Mechanical Anomaly Detection Using Multi-Channel Audio Signal. Knowl.-Based Syst. 2024, 284, 111204. [Google Scholar] [CrossRef]
- Peng, B.; Wang, K.I.-K.; Abdulla, W.H. Robust Classification of Urban Sounds in Noisy Environments: A Novel Approach Using SPWVD-MFCC and Dual-Stream Classifier. Acoust. Aust. 2025; accepted. [Google Scholar]
- Peng, B.; Abdulla, W.H.; Wang, K.I.-K. Urban Noise Monitoring Using Edge Computing with CNN-LSTM on Jetson Nano. In Proceedings of the 2023 Asia Pacific Signal and Information Processing Association Annual Summit and Conference (APSIPA ASC), Taipei, Taiwan, 31 October–3 November 2023; pp. 2244–2250. [Google Scholar]
- Purohit, H.; Tanabe, R.; Ichige, K.; Endo, T.; Nikaido, Y.; Suefusa, K.; Kawaguchi, Y. MIMII Dataset: Sound Dataset for Malfunctioning Industrial Machine Investigation and Inspection 2019. In Proceedings of the Detection and Classification of Acoustic Scenes and Events 2019, New York, NY, USA, 25–26 October 2019. [Google Scholar]
- de Souza, D.L.; Granzotto, M.H.; de Almeida, G.M.; Oliveira-Lopes, L.C. Fault Detection and Diagnosis Using Support Vector Machines—A SVC and SVR Comparison. J. Saf. Eng. 2014, 3, 18–29. [Google Scholar] [CrossRef]
- Zhou, X.; Ding, P.L.K.; Li, B. Improving Robustness of Random Forest Under Label Noise. In Proceedings of the 2019 IEEE Winter Conference on Applications of Computer Vision (WACV), Waikoloa Village, HI, USA, 7–11 January 2019; pp. 950–958. [Google Scholar]
Disclaimer/Publisher’s Note: The statements, opinions and data contained in all publications are solely those of the individual author(s) and contributor(s) and not of MDPI and/or the editor(s). MDPI and/or the editor(s) disclaim responsibility for any injury to people or property resulting from any ideas, methods, instructions or products referred to in the content. |
© 2025 by the authors. Licensee MDPI, Basel, Switzerland. This article is an open access article distributed under the terms and conditions of the Creative Commons Attribution (CC BY) license (https://creativecommons.org/licenses/by/4.0/).