Article

Three-Dimensional Computational Fluid Dynamics-Based Improvements in Radial Turbine Design for Enhanced Thermal Energy Utilization: A Case Study in Ha’il Cement Company

by
Fuhaid Alshammari
1,2,*,
Ahmed S. Alshammari
2,3 and
Ahmed Alzamil
2,3
1
Mechanical Engineering Department, Engineering College, University of Ha’il, Ha’il 2440, Saudi Arabia
2
Scientific and Engineering Research Center, University of Ha’il, Ha’il 2440, Saudi Arabia
3
Electrical Engineering Department, Engineering College, University of Ha’il, Ha’il 2440, Saudi Arabia
*
Author to whom correspondence should be addressed.
Processes 2025, 13(2), 500; https://doi.org/10.3390/pr13020500
Submission received: 7 January 2025 / Revised: 27 January 2025 / Accepted: 10 February 2025 / Published: 11 February 2025

Abstract

:
Organic Rankine cycles (ORCs) are increasingly employed in power plants to recover waste energy and reduce environmental impacts. The radial turbine, a critical ORC component, experiences flow losses influenced by design parameters such as the rotor blade and stator vane numbers. Traditional empirical correlations developed for air often lack accuracy for ORCs due to differences in fluid properties and flow dynamics. This study uses advanced CFD models to evaluate and refine these correlations for ORC applications. For the ORC, waste heat from the Ha’il Cement Company in Saudi Arabia is used as the heat source. The CFD model was validated with experimental data and showed strong agreement, with a maximum deviation of 5.12% in mass flow rate and 3.97% in turbine outlet temperature. The results show that reducing vane numbers from 17 to 11 increased turbine power, efficiency, and thermal efficiency by 34.8%, 4.17%, and 35.16%, respectively. However, further reduction caused performance deterioration due to high Mach numbers and flow recirculation. Increasing the rotor blade number to 20 improved performance, but numbers beyond 20 caused declines. Among empirical correlations, Rohlik’s correlation with 20 blades achieved optimal outputs of 13.54 kW turbine power, 75% turbine efficiency, and 6.98% thermal efficiency. Further optimization yielded an ORC configuration with 11 vanes and 20 blades, achieving superior performance: 16 kW turbine power, 77% turbine efficiency, and 9% thermal efficiency.

1. Introduction

Waste heat from power plants contributes significantly to harmful exhaust emissions [1]. These emissions include pollutants such as nitrogen oxides (NOx), particulate matter (PM), carbon monoxide (CO), and hydrocarbons, which pose serious environmental and health concerns [2]. Efforts to mitigate diesel engine emissions include stricter standards, cleaner fuel technologies, advanced exhaust treatment systems, and waste heat recovery. Efforts to mitigate diesel engine emissions include stricter standards, cleaner fuel technologies, advanced exhaust treatment systems, and waste heat recovery [3,4] such as organic Rankine cycles (ORCs) [5]. The latter have garnered significant attention in recent research and engineering endeavours due to their relative simplicity and adaptability to various heat source conditions [6].
ORCs capture waste heat from internal combustion engines and convert it into useful power [7]. The ORC utilizes organic working fluids with lower boiling points, rather than water, allowing efficient energy extraction at relatively low temperatures [8]. By integrating the ORC system, waste heat, which is a by-product of the combustion process, can be transformed into electricity, subsequently enhancing overall engine efficiency [4], and reducing environmental impact [9]. A typical ORC consists of four main components, in order of importance: a turbine, an evaporator, a condenser, and a pump. The evaporator and condenser are utilized to vaporize and condense the working fluid before and after the turbine, respectively. The pump is implemented to raise the pressure of the working fluid from the condenser pressure to the boiler pressure. The turbine is incorporated to deliver power by converting the thermal energy coming from the evaporator to mechanical energy.
Among the common types of turbines, the radial inflow turbine is commonly incorporated in small- and medium-scale ORCs, due to its suitability for low-to-medium flow rates and the variable operating conditions that are typical in ORC applications [10,11]. Radial turbines consist of a volute, stator vanes, and rotor blades. The volute is a stationary, spiral-shaped casing that collects and directs the fluid towards the stator vanes. The stator vanes are fixed blades arranged in a ring before the rotor blades. Their primary function is to ensure that the fluid enters the rotor blades at an optimal angle for efficient energy extraction. The rotor blades are mounted on a rotating disc, and are responsible for extracting energy from the fluid flow. As the fluid passes over the rotor blades, its pressure and velocity drop, and the rotor blades convert this energy into mechanical work, causing the rotor to spin. The spinning rotor is connected to a shaft, and the mechanical energy can be used to drive a generator or perform other mechanical work.
These turbines operate at high pressure ratios with organic working fluids, introducing unique challenges such as intricate flow dynamics, elevated Mach numbers, and pronounced heat transfer effects [12]. Conventional design approaches, which often rely on empirical correlations or one-dimensional models, are insufficient to accurately capture the complex interplay between fluid mechanics, thermal processes, and geometric factors. In contrast, numerical techniques, particularly three-dimensional Computational Fluid Dynamics (3D CFD), provide a comprehensive framework to address these limitations. Three-dimensional CFD simulations deliver detailed insights into the flow fields within the turbine, enabling precise predictions of critical performance metrics, including isentropic efficiency, turbine power output, and flow losses [13]. Additionally, these simulations facilitate the analysis of essential design parameters, such as rotor blade and stator vane configurations, across a range of operating conditions. By incorporating the thermos-physical characteristics of wet organic fluids and the impacts of reheat cycles, 3D CFD models enable a more accurate and effective optimization process. This advanced modelling supports the development of low-carbon technologies for waste heat recovery, contributing to sustainable energy solutions.
The design of radial inflow turbines has been extensively studied in engine ORC applications, as shown in Table 1. Despite the considerable importance of rotor blades and stator vanes, the determination of the optimal numbers is seldom explored in scholarly research. In fact, several studies treat these numbers as design input parameters, requiring designers to possess substantial empirical expertise to ascertain the optimal number. Ariga et al. [14] tested the flow pattern within the rotor using only eight blades. The results showed that the rotor suffered from considerable flow separation in the pressure side, due to excessive blade loading. Denton [15] recommended employing a blade number of 12 to prevent flow stagnation along the pressure surface. Watanabe and Ando [16] concluded, through their experiments, that a blade number exceeding 16 is preferable for achieving optimal efficiency. Chen et al. [17] concluded that the efficiency of the radial turbine decreased by 2% when decreasing the blade number from 12 to 10. It is worth mentioning that the aforementioned studies utilized air as the working fluid.
In organic Rankine cycle (ORC) applications, non-flammable fluids with minimal global warming and ozone depletion potential are highly desirable. The choice of working fluid significantly impacts system performance and overall size. High-density fluids, such as organic fluids, enable smaller system components due to their lower volumetric flow rates. This study selects NOVEC 649 as the working fluid for several reasons. According to the manufacturer [18], NOVEC 649 is non-flammable, as it lacks a closed-cup flash point and non-volatile residue, and it is environmentally sustainable, featuring zero ozone depletion potential, an ultra-low global warming potential (~1 over 100 years), and a short atmospheric lifetime (0.014 years). Additionally, as demonstrated in a prior study [19], NOVEC 649 minimizes back pressure at the evaporator outlet and operates turbines at lower speeds, allowing the use of cost-effective electrical generators. This fluid also leads to a more compact, efficient system with improved heat recovery capabilities [19]. For detailed fluid properties, and for further insights into the critical role of fluid selection on system performance and size, consult the authors’ previous work [20].
Several correlations have been established, albeit with limitations, to approximate the optimal numbers of blades and vanes in air-operated turbines. Jamieson [21], Glassman [22], Whitfield and Baines [23], and Rohlik [24] developed different correlations for estimating the optimum number of rotor blades. Simpson et al. [25] developed a correlation model for obtaining the number of stator vanes. In fact, the numbers of blades and vanes vary substantially from one model to another, which significantly influences the accuracy of the results. Hence, it is imperative to conduct a direct comparison among the various models and assess their impact on turbine performance and flow losses. However, to the best of the authors’ knowledge, this is an area in which little available literature exists. Furthermore, the previously mentioned models were devised for turbines operating under the assumption of ideal gas properties in air, either fully perfect or semi-perfect. In the context of ORCs, organic fluids which are significantly denser than air are employed, further complicating the precision of the outcomes. This research addresses these deficiencies by constructing a 3D CFD radial turbine model that operates with NOVEC 649, an intricately structured and dense organic fluid. The study underscores the influence of different correlation models on the performance and flow attributes of the ORC system, with particular attention given to the radial turbine component. It is worth mentioning that experimental validation plays a vital role in ensuring the accuracy and dependability of computational models. It serves as a critical reference point for evaluating simulation outcomes and builds trust in their practical applicability, bridging the gap between theoretical predictions and practical implementation. Therefore, the proposed model is validated against experimental data from the literature.
Table 1. Selection of radial inflow turbine design models for ORC.
Ref.Research ApproachRotor ApproachStator Approach
[26]1DGlassmanSimpson
[27]1D, 3DGlassmanSimpson
[28]1DGlassmanSimpson
[29]1D, 3DGlassmanSimpson
[30]1DGlassmanSimpson
[31]1D, 3DGlassmanSimpson
[32]1D, 3DGlassman-
[33]1D, 3DGlassman-
[34]1D, 3DJamiesonSimpson
[35]1DGlassman, Whitfield and Baines-
[36]1D, 3DGlassman12 vanes (input)
[37]1D, 3DWhitfield and Baines-
[38]1D, 3DGlassman17 vanes (input)
[39]3Dvaries (9, 15, 19, 27)12 vanes (input)
[40]1DGlassman-
[41]1D9 blades (input)5 vanes (input)
[42]1DRohlikSimpson
[43]1D, 3DGlassman19 vanes (input)
[44]1D, 3D16 blades (input)22 vanes (input)
[45]1D11 blades (input) Z r + 3
[46]1DRohlikSimpson

2. System Description and Modelling

This section presents the developed system, and the different models developed to estimate the optimum number of rotor blades and stator vanes for small-to-medium-scale ORCs. The simulation of the engine-ORC was performed using MATLAB R2023a.

2.1. Description of Engine ORC

Figure 1 illustrates a typical ORC system linked to an internal combustion engine. Within this configuration, the elevated-temperature exhaust gases function as the primary heat source, transferring thermal energy to NOVEC 649, housed within the evaporator. Upon vaporization, the working fluid proceeds through a turbine, undergoing expansion and thereby generating mechanical power utilized for various applications, such as driving a generator. Subsequent to turbine operation, the low-pressure vapour undergoes condensation within a condenser, releasing heat into a cooling medium and reverting the working fluid to a liquid state. The cycle concludes with a pump, responsible for pressurizing the liquid working fluid, thus initiating the cycle anew.
Table 2 presents the characteristics of the diesel engine, which is a heavy-duty diesel engine from the Cement Company in Ha’il city, Saudi Arabia. The engine is used as a backup for producing required energy. Table 3 presents a summary of the main equations of the ORC modelling. Details of the modelling can be seen in Alshammari et al. [47].

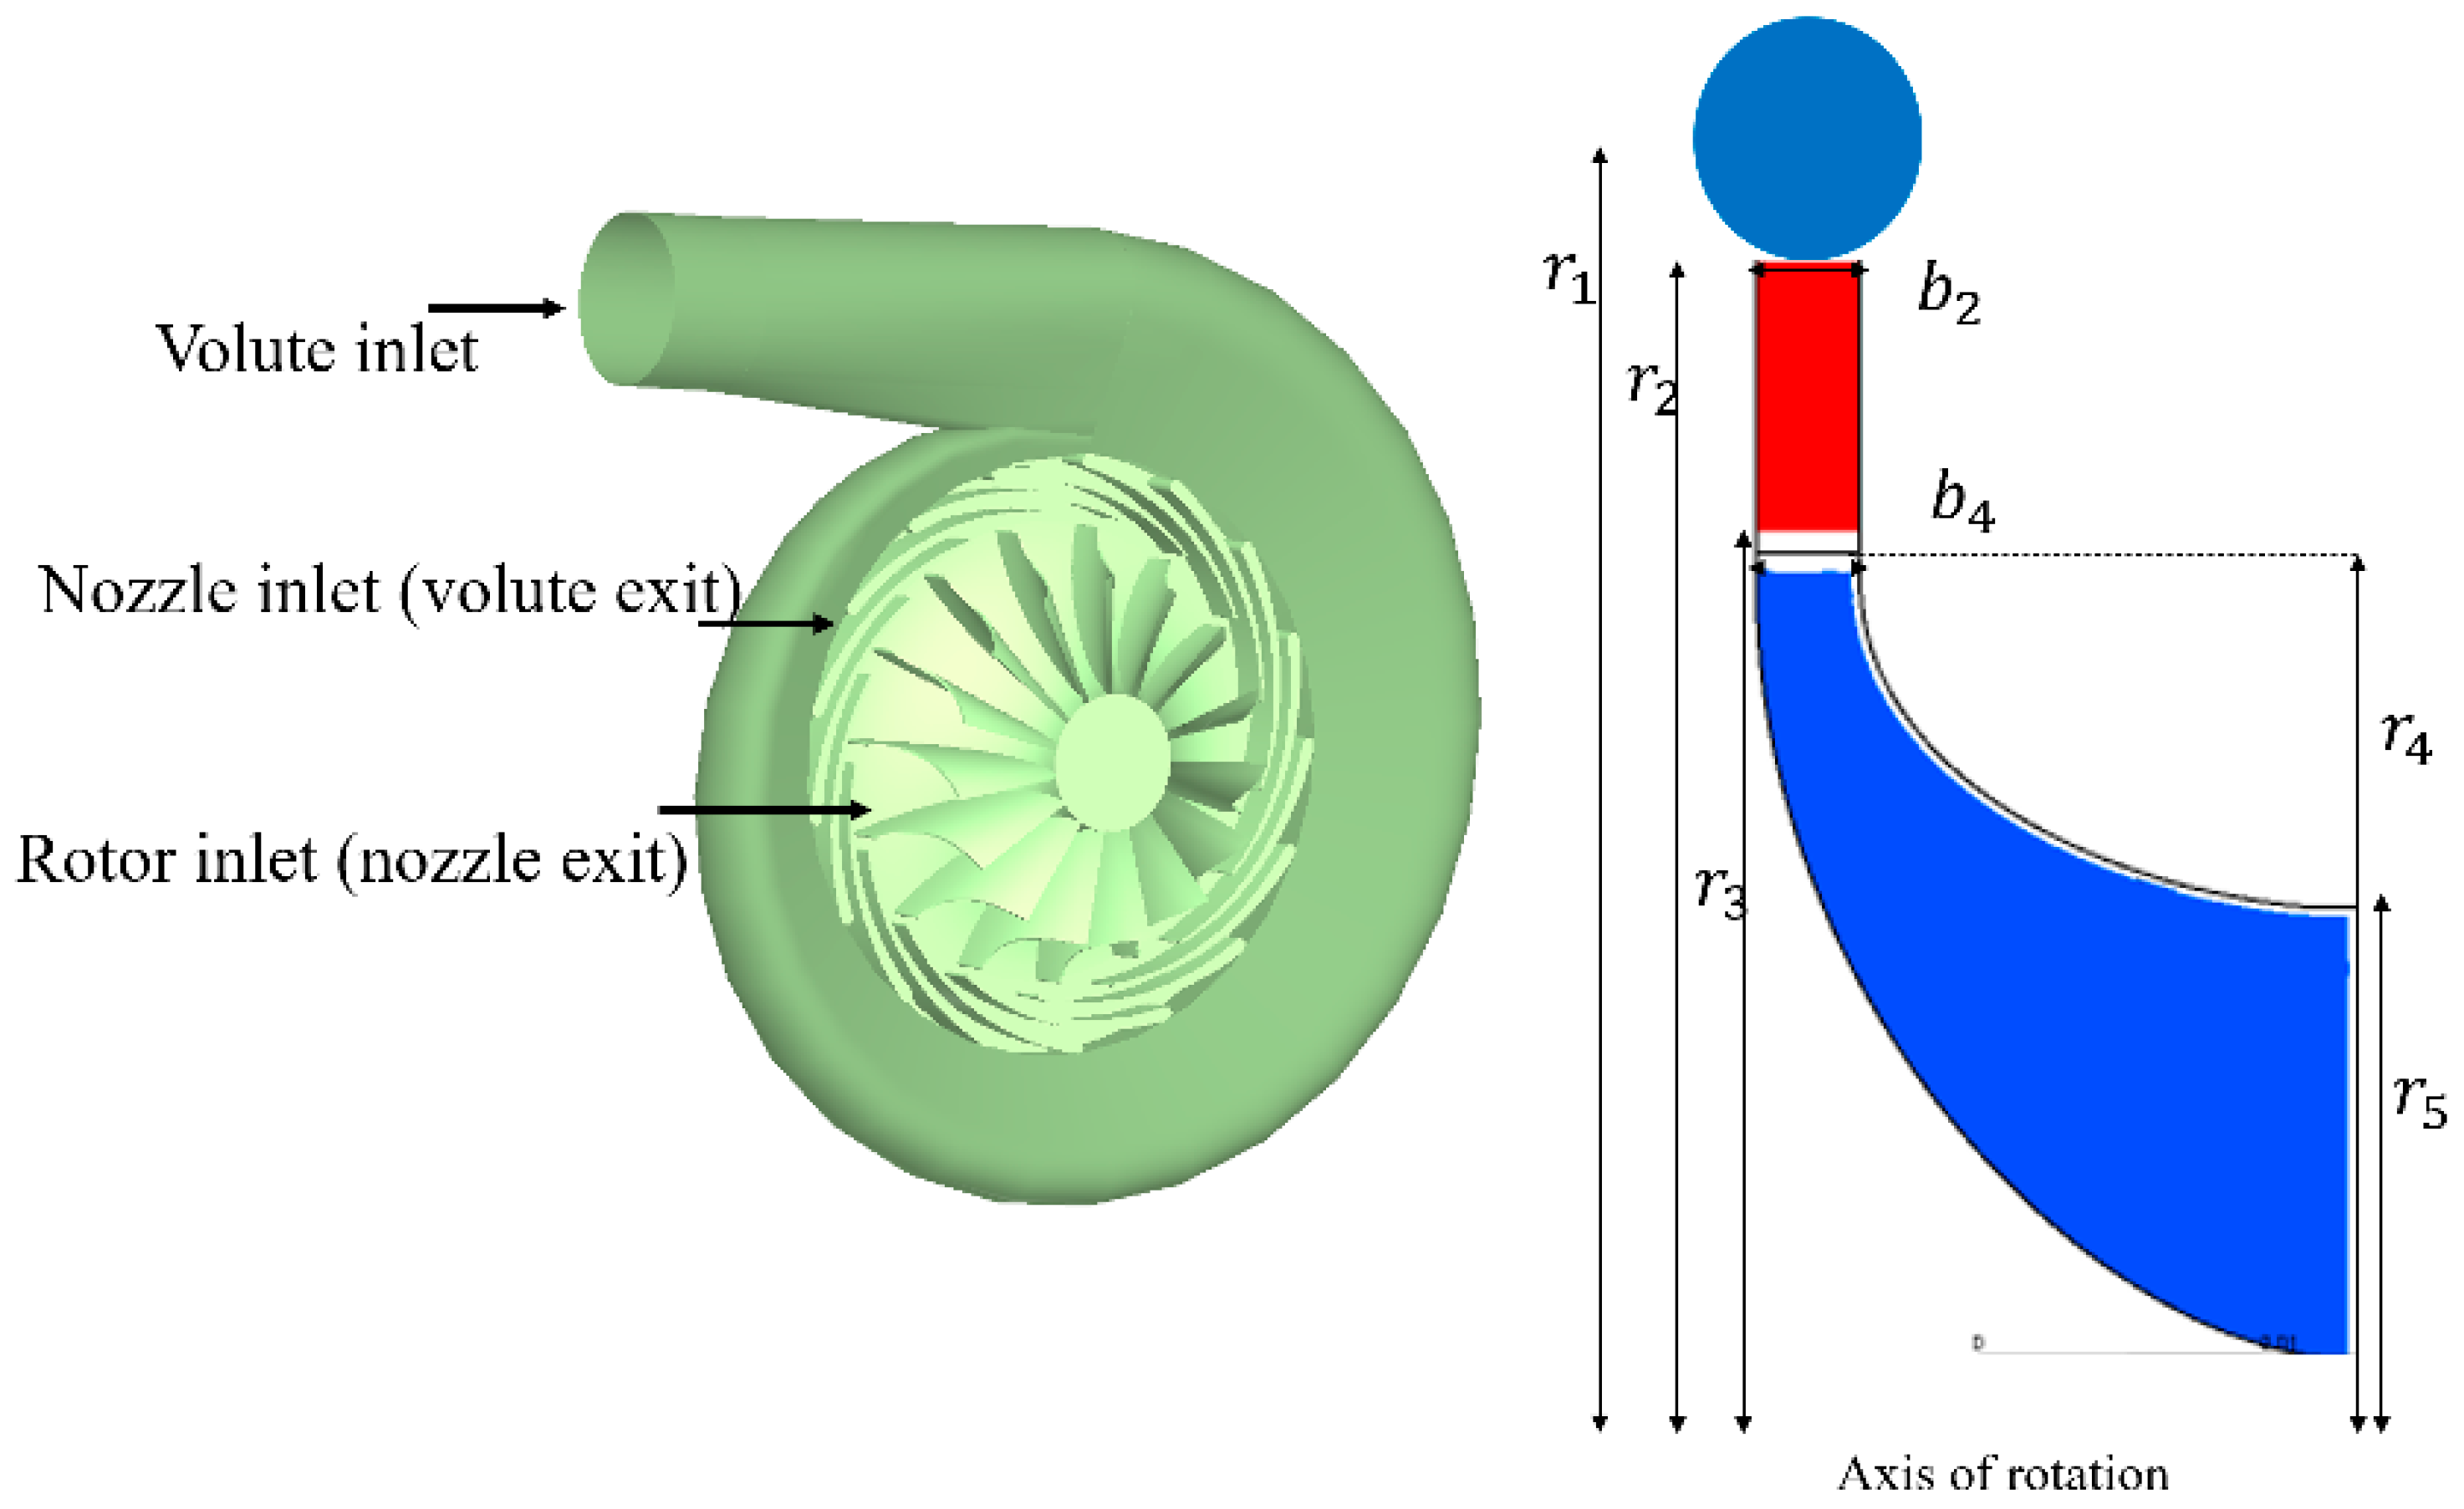
2.2. Description of Radial Turbine Stage

The aim of this study is to evaluate the effects of rotor blades and stator vanes on the turbine performance and flow environment within the stage. The design methodology, which has been developed and validated in previous studies of one of the authors [26], is utilized to design a single-stage radial inflow turbine. As mentioned earlier, the radial turbine stage consists of three main components, as depicted in Figure 2. The figure also shows a meridional view of the radial turbine, showing the main geometrical parameters. Table 4 displays the primary equations utilized in the comprehensive modelling of the turbine, as outlined in the authors’ previous study [26].
Table 5 illustrates the operational parameters of the radial inflow turbine, which were furnished by an industrial collaborator based on the operational requisites of the internal combustion engine, as delineated in Table 2 [47]. Utilizing the design methodology outlined in Table 4 and expounded upon in [26], a single-stage radial inflow turbine was devised, taking into account the specified operational parameters outlined in Table 5. Subsequently, the primary outcomes of the developed turbine were obtained, as documented in Table 6. The turbine was subsequently imported into ANSYS CFX to investigate the ramifications of varying the quantity of stator vanes and rotor blades, in accordance with the correlation models presented in subsequent sections.

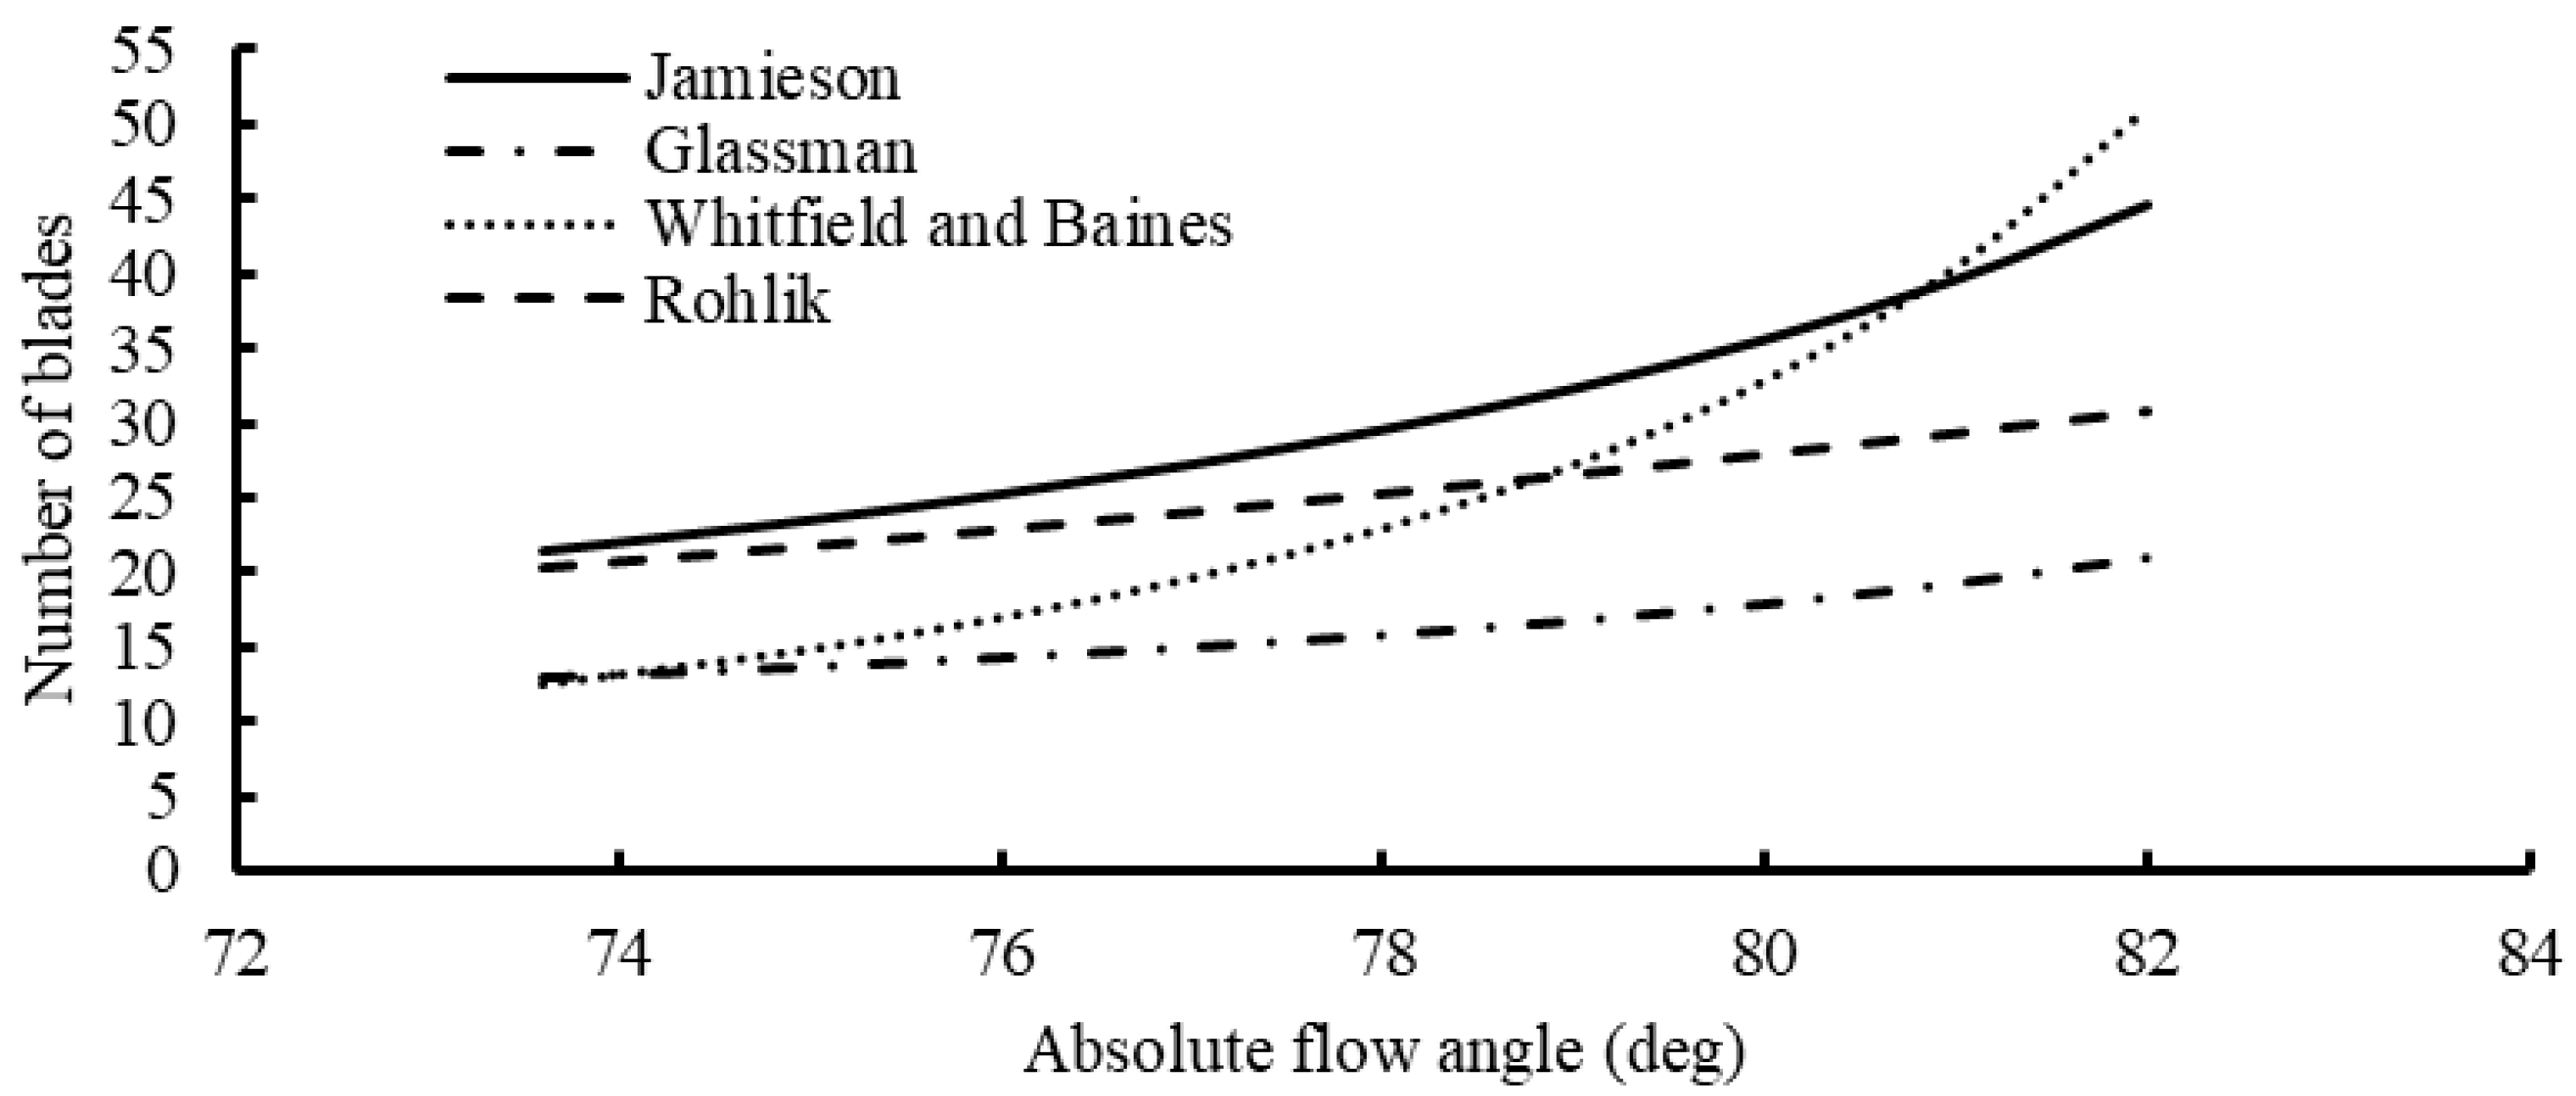
2.2.1. Description of Correlation Models of Rotor Blades

The determination of the blade number in radial turbines holds significant importance, due to its direct influence on the turbine’s performance, efficiency, and flow characteristics. Properly selecting the blade number allows for optimizing the turbine’s performance to achieve the desired operating conditions. The blade number also influences the flow dynamics within the turbine, including flow velocity, pressure distribution, and boundary layer effects. Understanding these dynamics is crucial for designing turbines that minimize losses and maximize energy extraction. Moreover, improper blade number selection may lead to flow instabilities, such as flow separation or stall, which can reduce the turbine’s performance and reliability. However, excessive blade numbers result in increased blade surface area, and, consequently, higher frictional losses [15]. Furthermore, a significant quantity of blades suggests a turbine with a greater mass, resulting in heightened inertia. On the other hand, it is essential to have a minimum number of blades to prevent flow reversal.
Different correlations are available in the literature regarding the estimation of the blade number. Equation (13) expresses a correlation developed by Jamieson [21] to obtain the minimum number of rotor blades. α 4 is the absolute flow angle at the rotor inlet, and can be calculated using the developed design methodology [26].
Z r = 2 π t a n α 4
α 4 is the absolute flow angle at the rotor inlet. Another correlation developed by Glassman [22] is widely used in ideal gas turbines. Glassman [22] noted that adopting Jamieson’s correlation [21] would lead to an excessive blade number at elevated flow angles. To address this, a reduction factor was incorporated into Jamieson’s equation, as shown in Equation (14).
Z r = π 30 ( 110 α 4 ) t a n α 4
Whitfield and Baines [23] concurred with Glassman regarding the issue with Jamieson’s correlation, acknowledging that a significant number of blades could lead to excessive blockage at the rotor exit. Consequently, they introduced a correlation to determine the blade number under the conditions of minimum Mach number, as shown in Equation (15).
Z r = 0.63 π 2   c o s 2 α 4
Last but not least, Rohlik [24] derived an empirical equation for the optimal blade number based on a graphical correlation established by Jamieson, as expressed in Equation (16).
Z r = 12 + 0.03 α 4 57 2

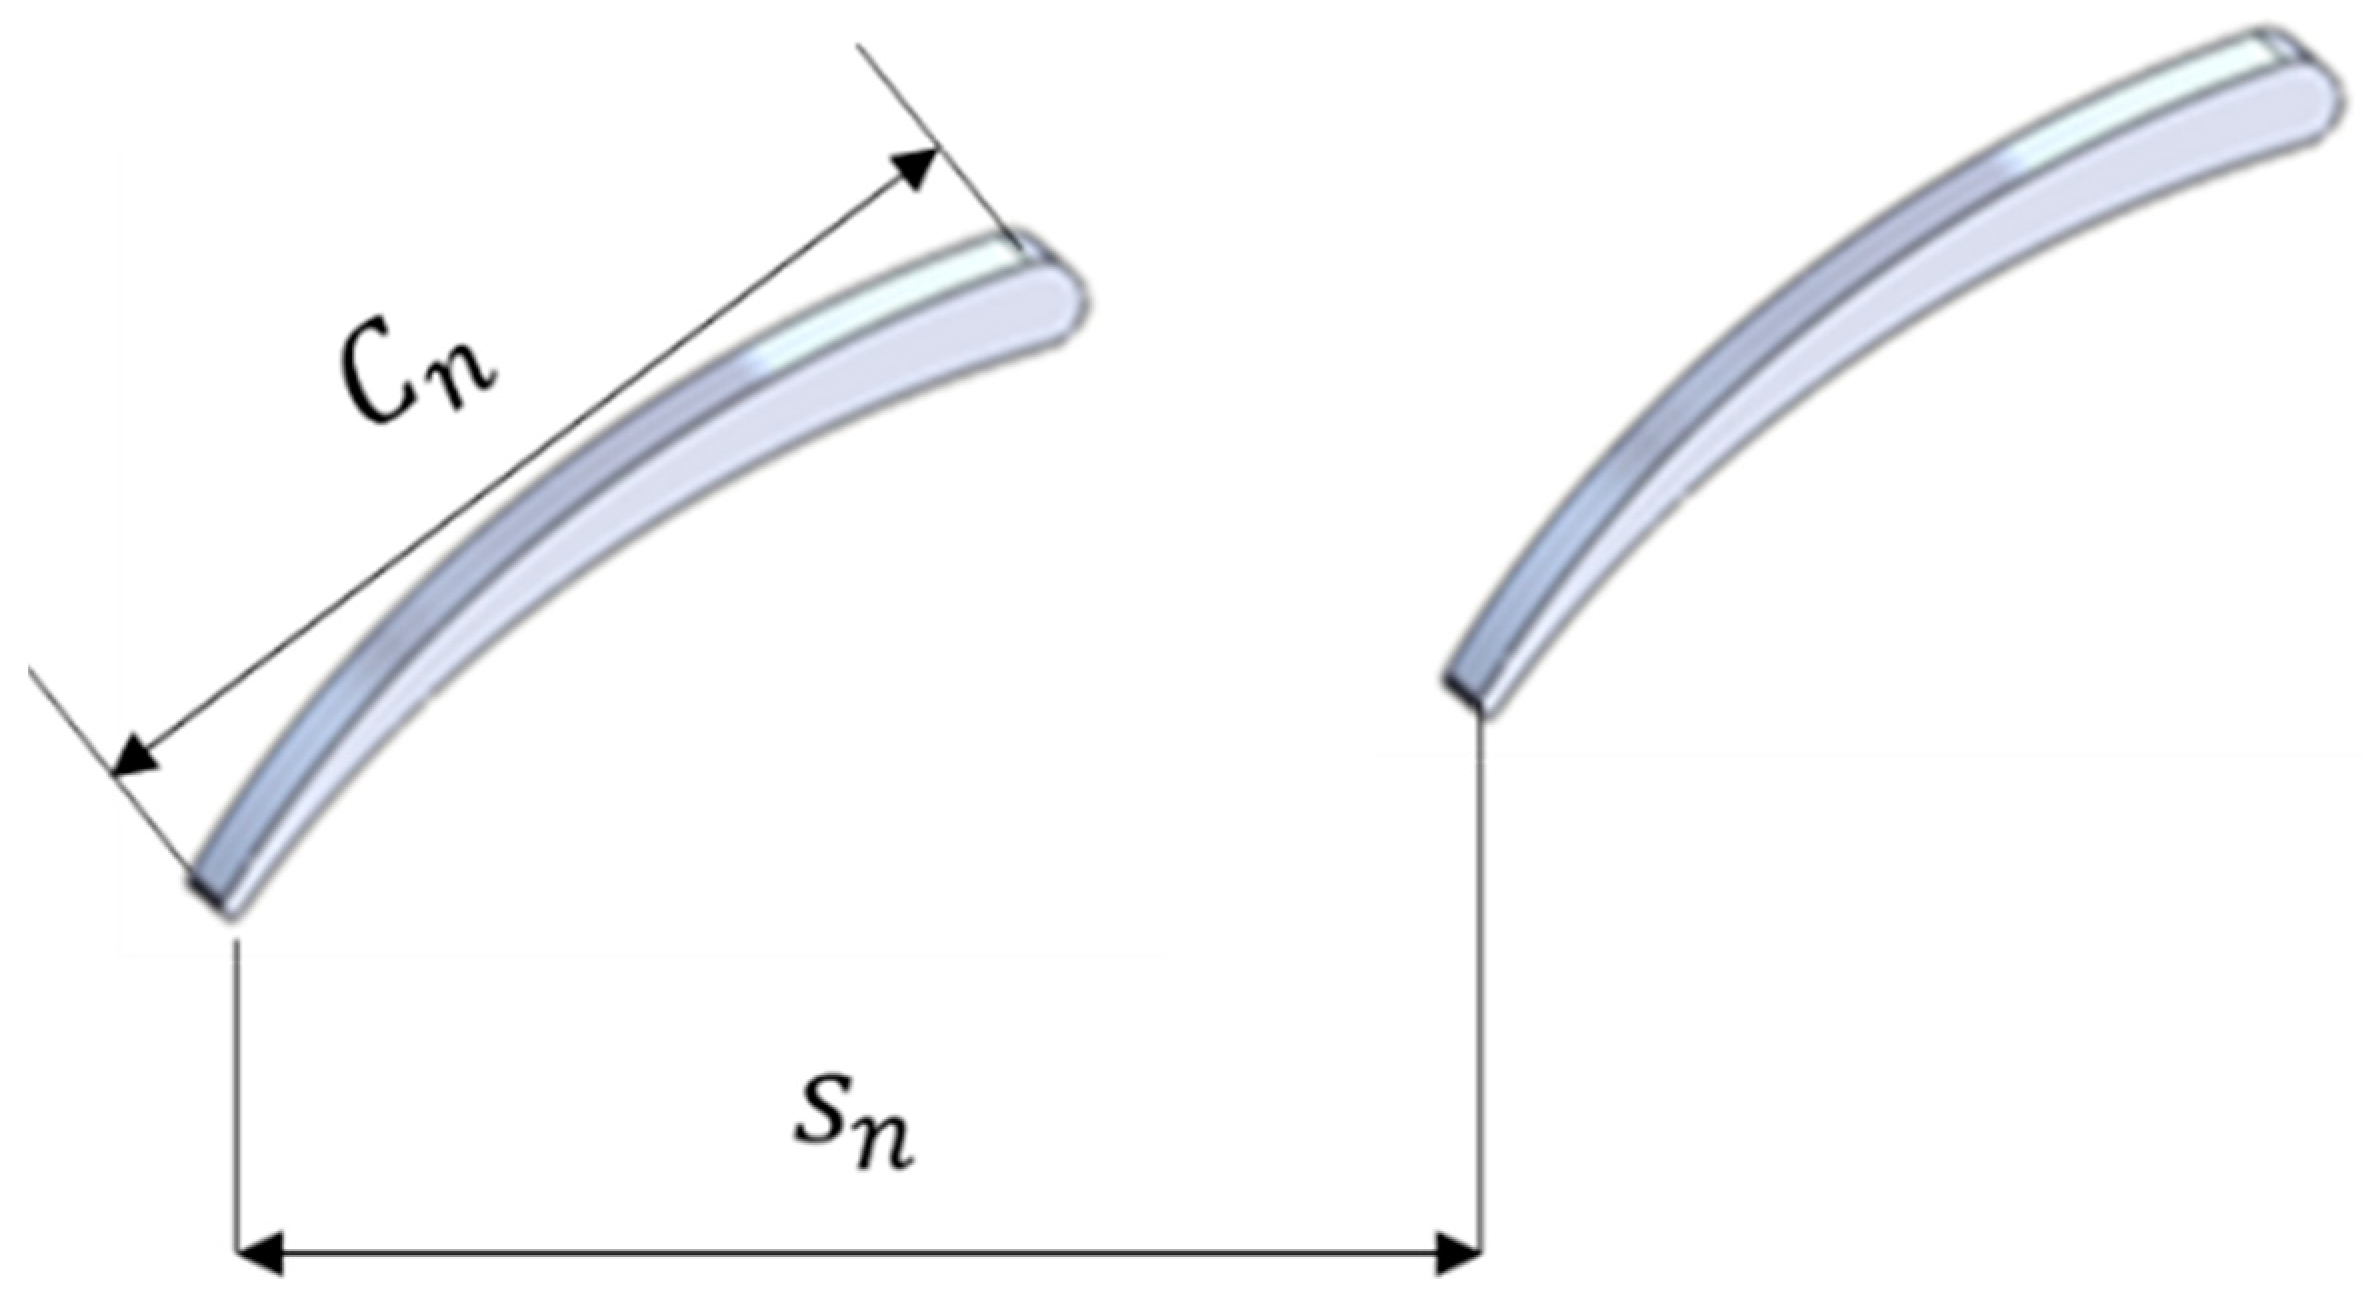
2.2.2. Description of Correlation Model of Stator Vanes

As mentioned earlier, the main objective of the nozzle vanes is to direct the flow at the right incidence angle to the rotor blades. However, correlations to find the nozzle number are very limited. Simpson et al. [25] developed a correlation model to obtain the optimum vane number, as shown in Equation (17). s n is the vane pitch, and is expressed in Equation (18), where σ is the solidity. C n is the chord length of the nozzle vane, and can be obtained using Equation (19). Figure 3 depicts the main geometrical parameters of the nozzle vane that are utilized to obtain the nozzle number.
Z n = 2 π r 3 s n
s n = C n σ
C n = r 2 2 + r 3 2 r 2 2 + r 3 2 2 r 2 2 + r 3 2 c o s ( α 2 + α 3 2 ) 2
Alternative designs establish a relationship between the number of nozzle vanes and the number of rotor blades, as delineated in Equations (20) and (21) [48,49,50].
Z n = Z r + 2
Z n = Z r + 3

2.2.3. Flow Losses in Radial Turbine

Both the stator and rotor suffer from significant losses that can include various sources of energy dissipation. The stator loss is obtained directly by ANSYS. It refers to the losses associated with the stator, such as frictional losses, secondary flow losses, and profile losses, occurring within the stator vanes.
In the rotor, a variety of mechanisms contribute to losses, as shown in Figure 4, collectively affecting the overall efficiency. Frictional losses occur as the flowing fluid interacts with the turbine blades, resulting in energy dissipation. Additional energy losses stem from secondary flow phenomena such as boundary layer separation and vortex formation. Efficiency is further reduced by fluid leakage clearances. Moreover, windage losses occur due to fluid leakage between the rear face of the rotor disc and the stationary back plate of the turbine. Furthermore, profile losses occur due to deviations from the ideal flow path within the turbine, such as flow separation or non-uniform flow distribution, leading to inefficient energy conversion. Each loss experienced by the rotor has been calculated as a portion of the energy dissipation, which is represented by the entropy generation concerning the overall change in the entropy of the rotor.

3. Numerical Simulation

The numerical simulation was conducted using ANSYS CFX 17.0. The primary aim of the numerical simulation is to precisely model and analyze intricate physical phenomena, such as the fluid flow behaviour within the turbine stage, particularly when altering the number of blades and vanes. Moreover, the numerical simulation allows for predicting the performance of the turbine under different operating conditions. Therefore, a steady-state simulation for the developed radial inflow turbine using ANSYS CFX was performed. The 3D model incorporates RefProp 8.0 [51] to account for the thermodynamic properties of the working fluid i.e., NOVEC 649.

3.1. Establishment of 3D Shape

The main geometrical parameters of the rotor blades and stator vanes were obtained from the mean-line model developed by the authors of [26], as outlined in Table 6. The 3D shapes were then generated in BladeGen 17.0, Figure 5, which is a software tool within the ANSYS suite that is specifically designed for the rapid design and generation of 3D blade profiles. It is noteworthy that the default blade profile is utilized without undergoing optimization.

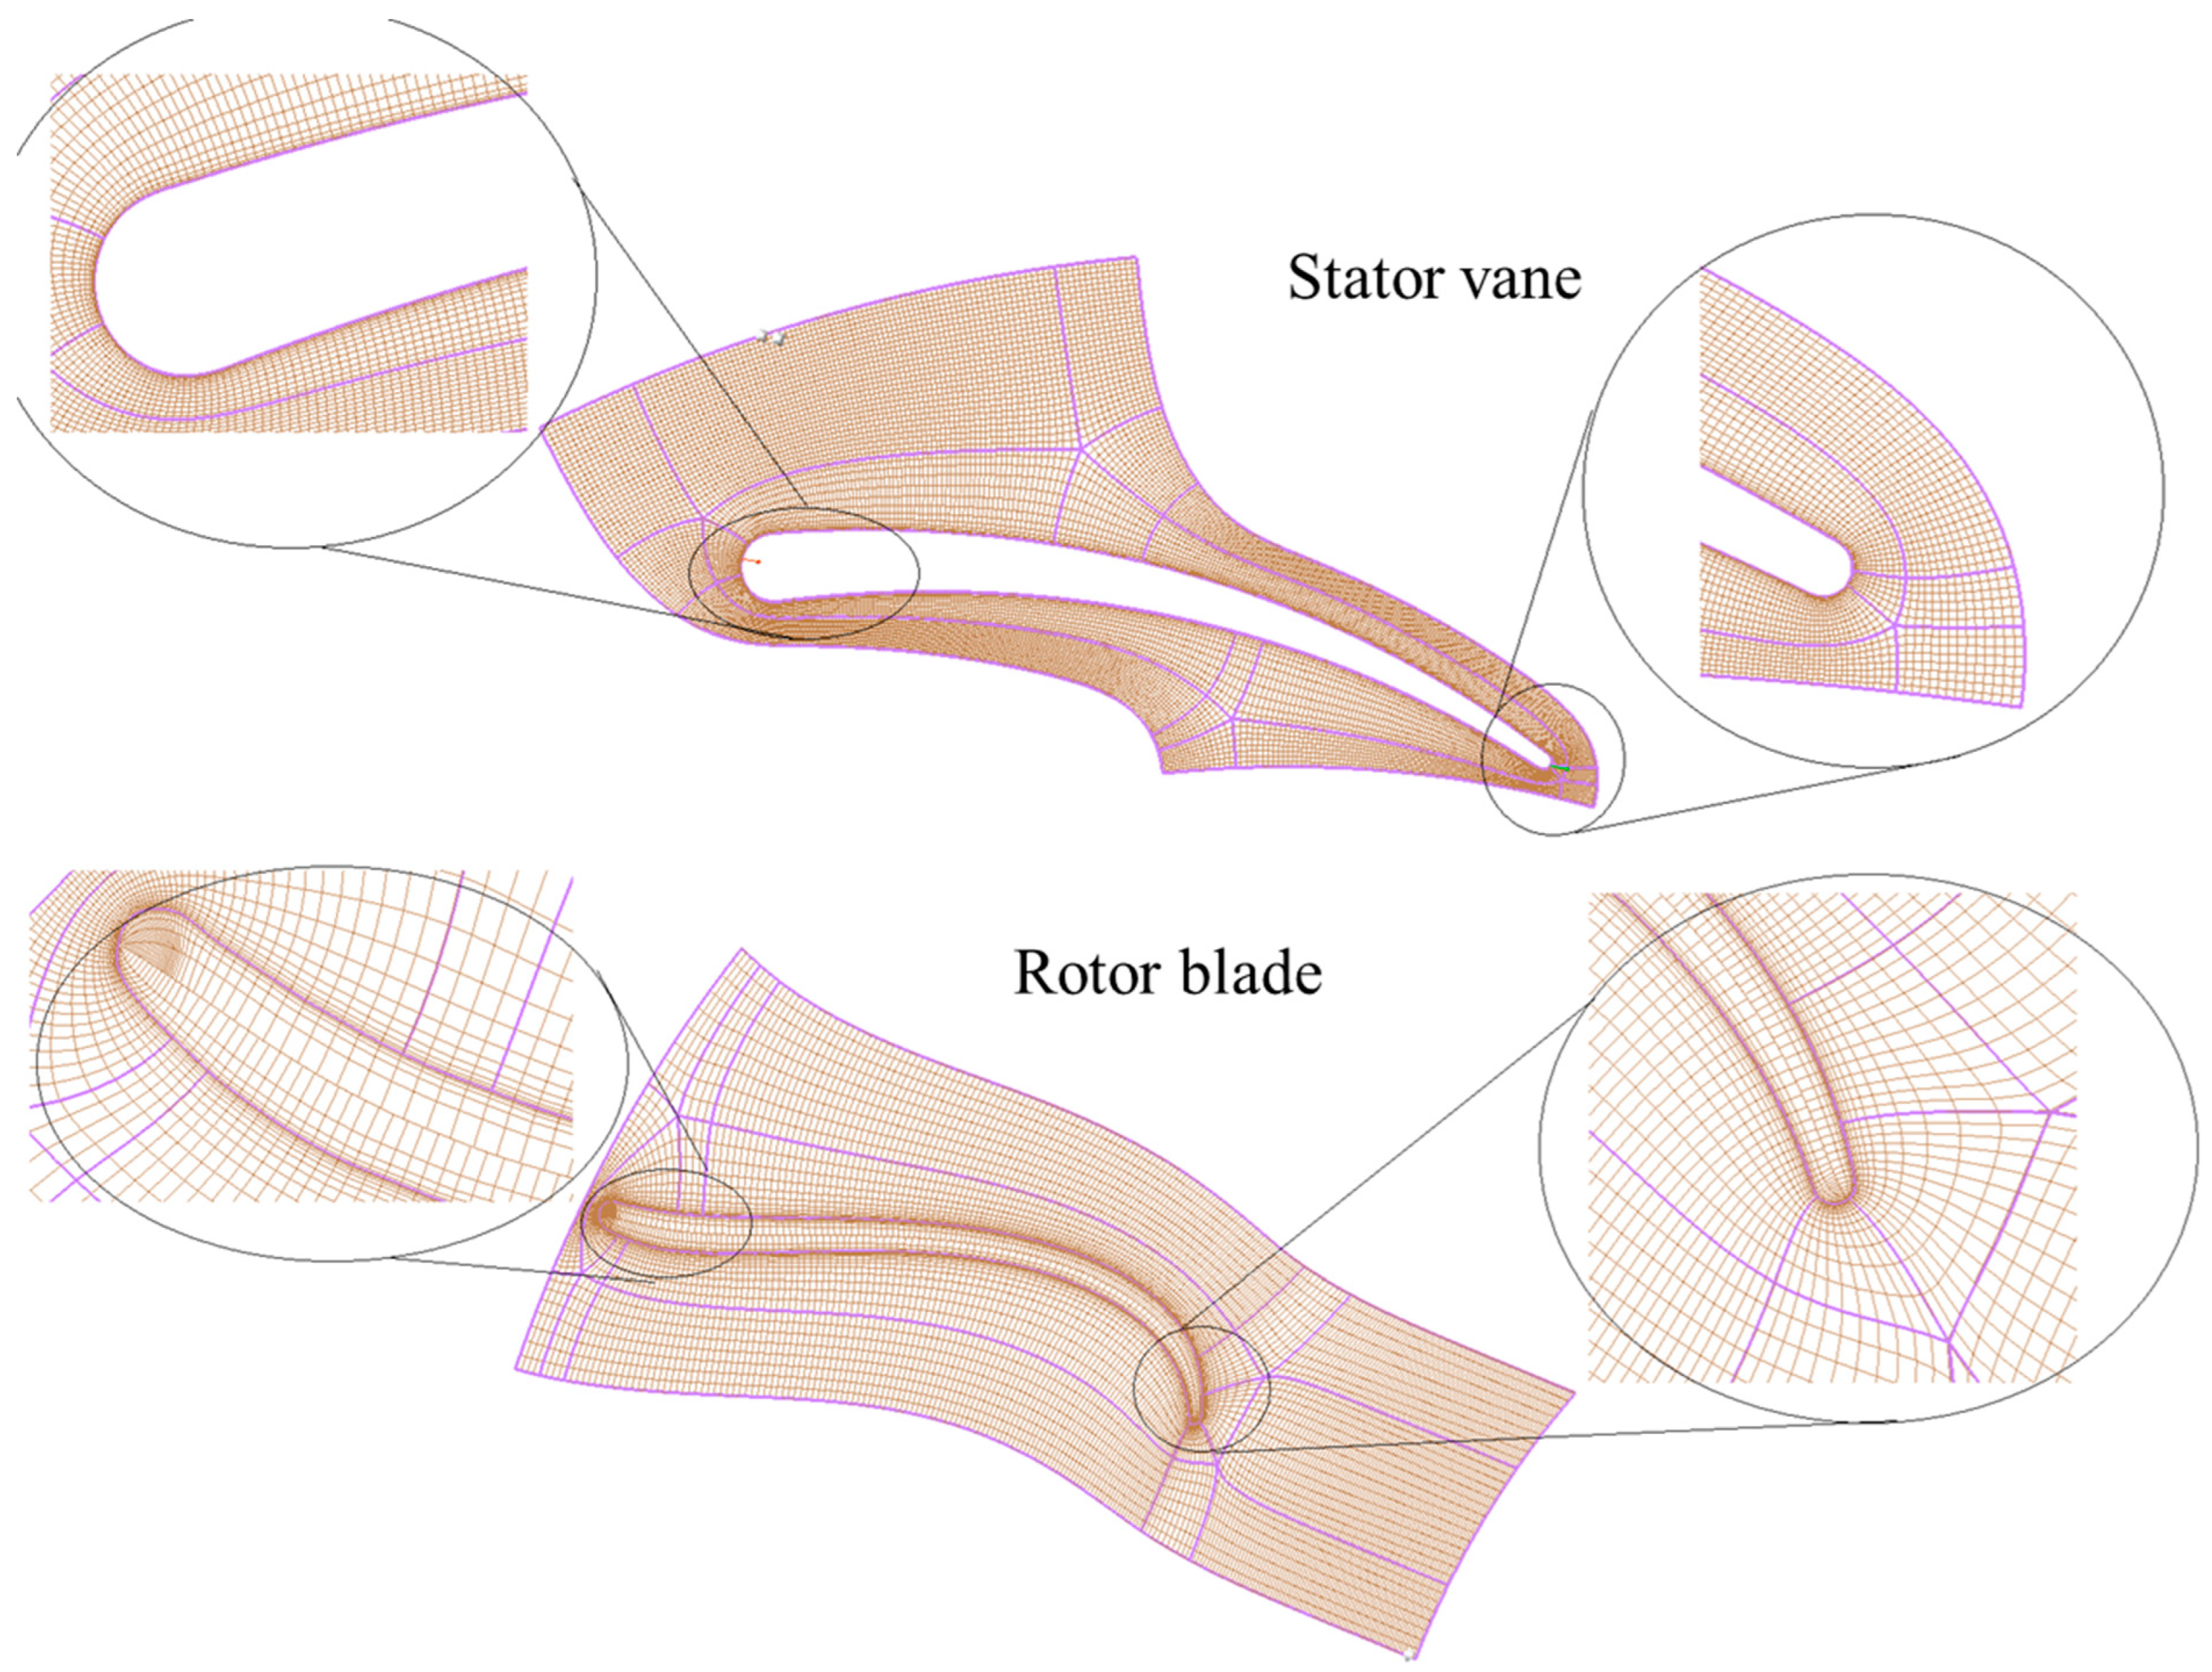
3.2. Governing Equations, Turbulence Model and Grid Generation, and Boundary Conditions

The Navier–Stokes equations are utilized to calculate the velocity, pressure, and temperature of a moving fluid. These equations govern the conservation of mass, momentum, and energy, as depicted in Equations (22), (23), and (24), respectively. Additionally, the Reynolds-averaged Navier–Stokes (RANS) equations are employed to incorporate turbulence within the flow. By solving these equations, the time-averaged characteristics of the flow are determined, eliminating the necessity to resolve turbulent fluctuations [52].
ρ t + x j ρ · u j = 0
t ρ · u i + x j ρ · u j · u i = p x i + τ i j x j + ρ f i
t ρ · h + x j ρ · u j · h = P t + u j P x j + τ i j u i x j q j x j + W e x t + q H
Choosing the right turbulence model is crucial for assessing eddy formation and flow separation. In this study, the turbulence model developed by Menter [53], called the shear stress transport (SST) model, is utilized, since it is less complex and less computationally expensive. The SST model utilizes the k-ω model to effectively represent the near-wall region with precision, and transitions to the k-ϵ model in the free stream to mitigate the sensitivity of the k-ω model to free-stream turbulence effects.
The solid components were meshed using ANSYS TurboGrid. An automatic topology was chosen, allowing ANSYS TurboGrid to determine the appropriate topology for the blade passage. Figure 6 depicts the sensitivity analysis of the passage with different elements at PR = 6.9 and 15 blades. Figure 6 also depicts grid resolutions of CPU time, turbine isentropic efficiency, and exit temperature with different numbers of elements. To balance result accuracy, grid independence, and computational time, the mesh with 1 × 10 6 elements was selected for the analysis, as depicted in Figure 7. Mesh analysis was rerun each time the number of vanes or blades was changed.
The operating conditions presented in Table 5 were used as the boundary conditions in the CFD analysis. The inlet pressure, inlet temperature, rotational speed, and exit pressure were utilized. While mass flow rate could potentially serve as an alternative boundary condition at the inlet, it is noted that employing inlet pressure offers superior numerical stability and convergence rates [54]. Incorporating the impact of heat transfer, the simulation incorporated the total energy model, which accounts for the transport of enthalpy and incorporates flow kinetic energy [52]. Smooth walls with a no-slip boundary condition were employed to model all solid surfaces.
Choosing an appropriate turbulence model is essential for accurately analyzing eddy formation and flow separation [55]. In this study, the k−ω SST model is utilized, as it effectively combines the strengths of two turbulence models. It uses the k−ω formulation near walls to provide precise resolution of boundary layer phenomena, and transitions to the k−ϵ model in free-stream regions to mitigate the sensitivity of the k−ω model to free-stream turbulence effects. This hybrid approach ensures a more reliable and accurate representation of the flow characteristics.

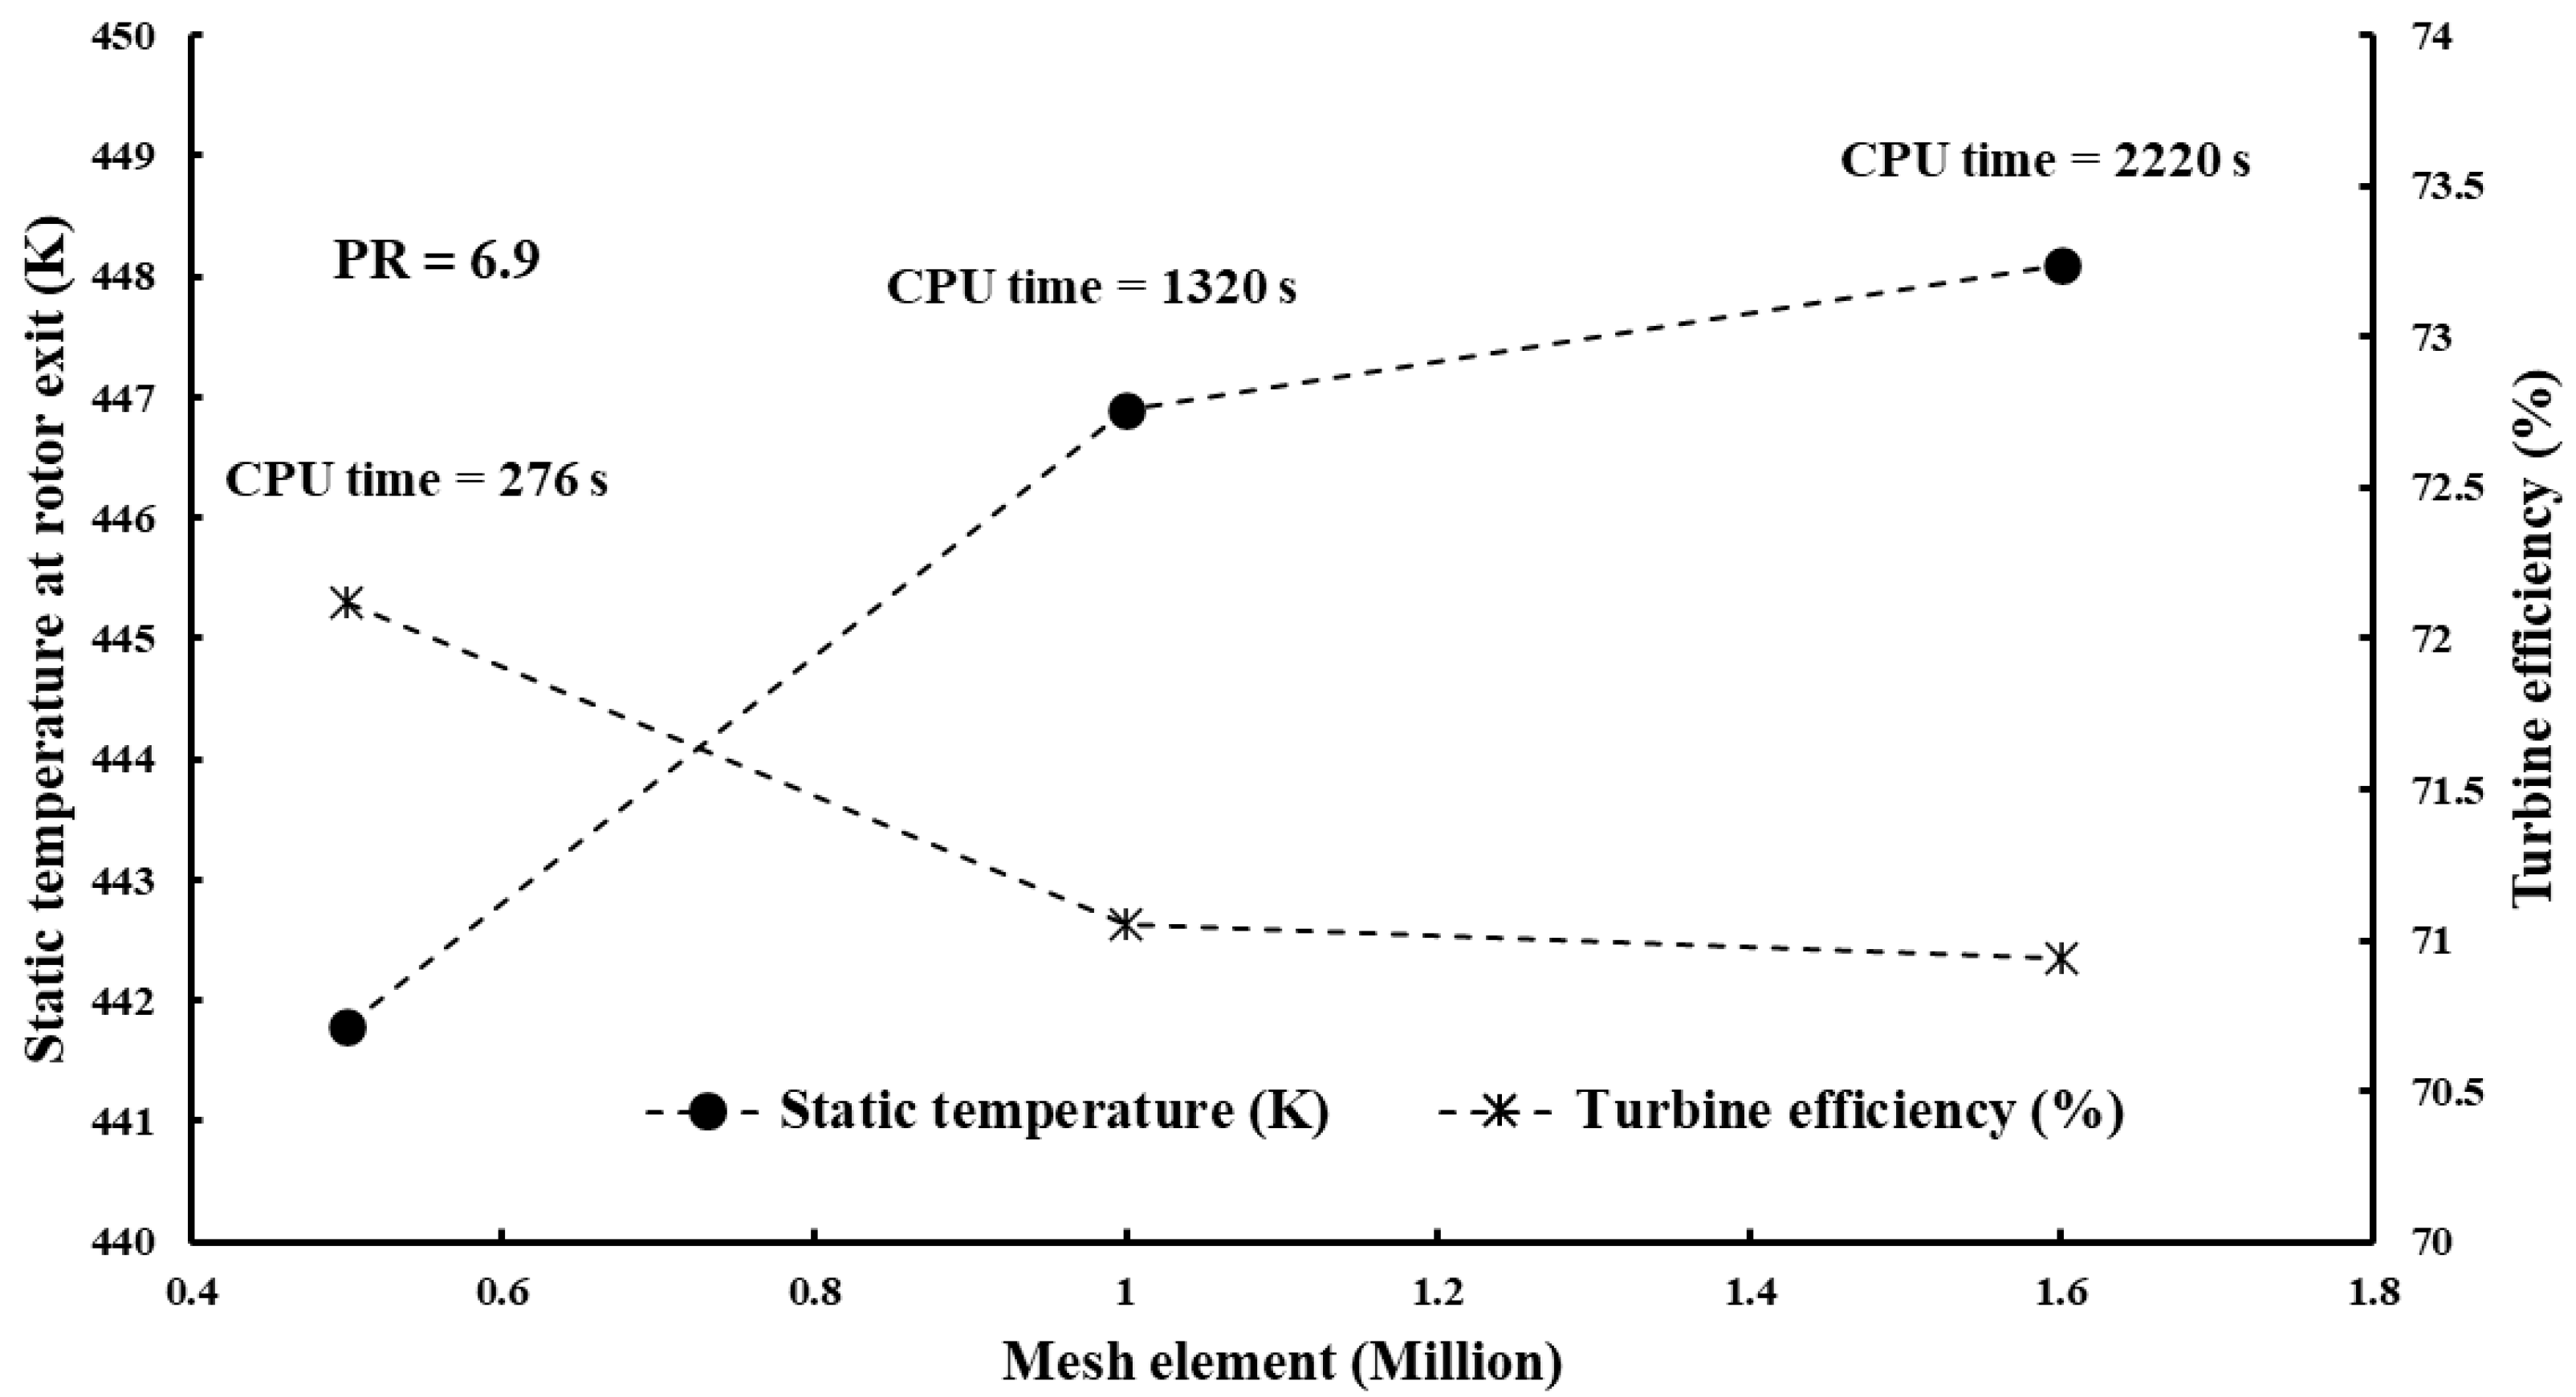
3.3. Validation of Numerical Model

The numerical model was validated with experimental results to ensure its accuracy, reliability, and predictive capability. In fact, CFD simulations involve simplifications and assumptions to make the simulations computationally feasible. Validation against experimental data allows for the assessment of the validity of these assumptions and the level of simplification employed in the model. It helps to ensure that the model adequately captures the relevant physics and behaviour of the system under study. Therefore, the numerical results were validated against experimental ones published by the authors of [47]. The authors of [47] developed an ORC system operating with a single-stage radial inflow turbine, to be utilized as a waste heat recovery system in heavy-duty diesel engines. The number of stator vanes and rotor blades in the reference study were 17 and 15, respectively. The operating conditions of the experimental study were imported into the numerical model, and the results are presented in Table 7. It is worth mentioning that the turbine geometrical parameters of the test study [47] are identical to the ones incorporated in this study. As depicted in Table 7, the computational analyses exhibit favourable alignment with those derived from experimental investigations, underscoring the reliability of the established numerical framework. A maximum disparity of 5.12% between the findings of the two studies is observed in the mass flow rate.

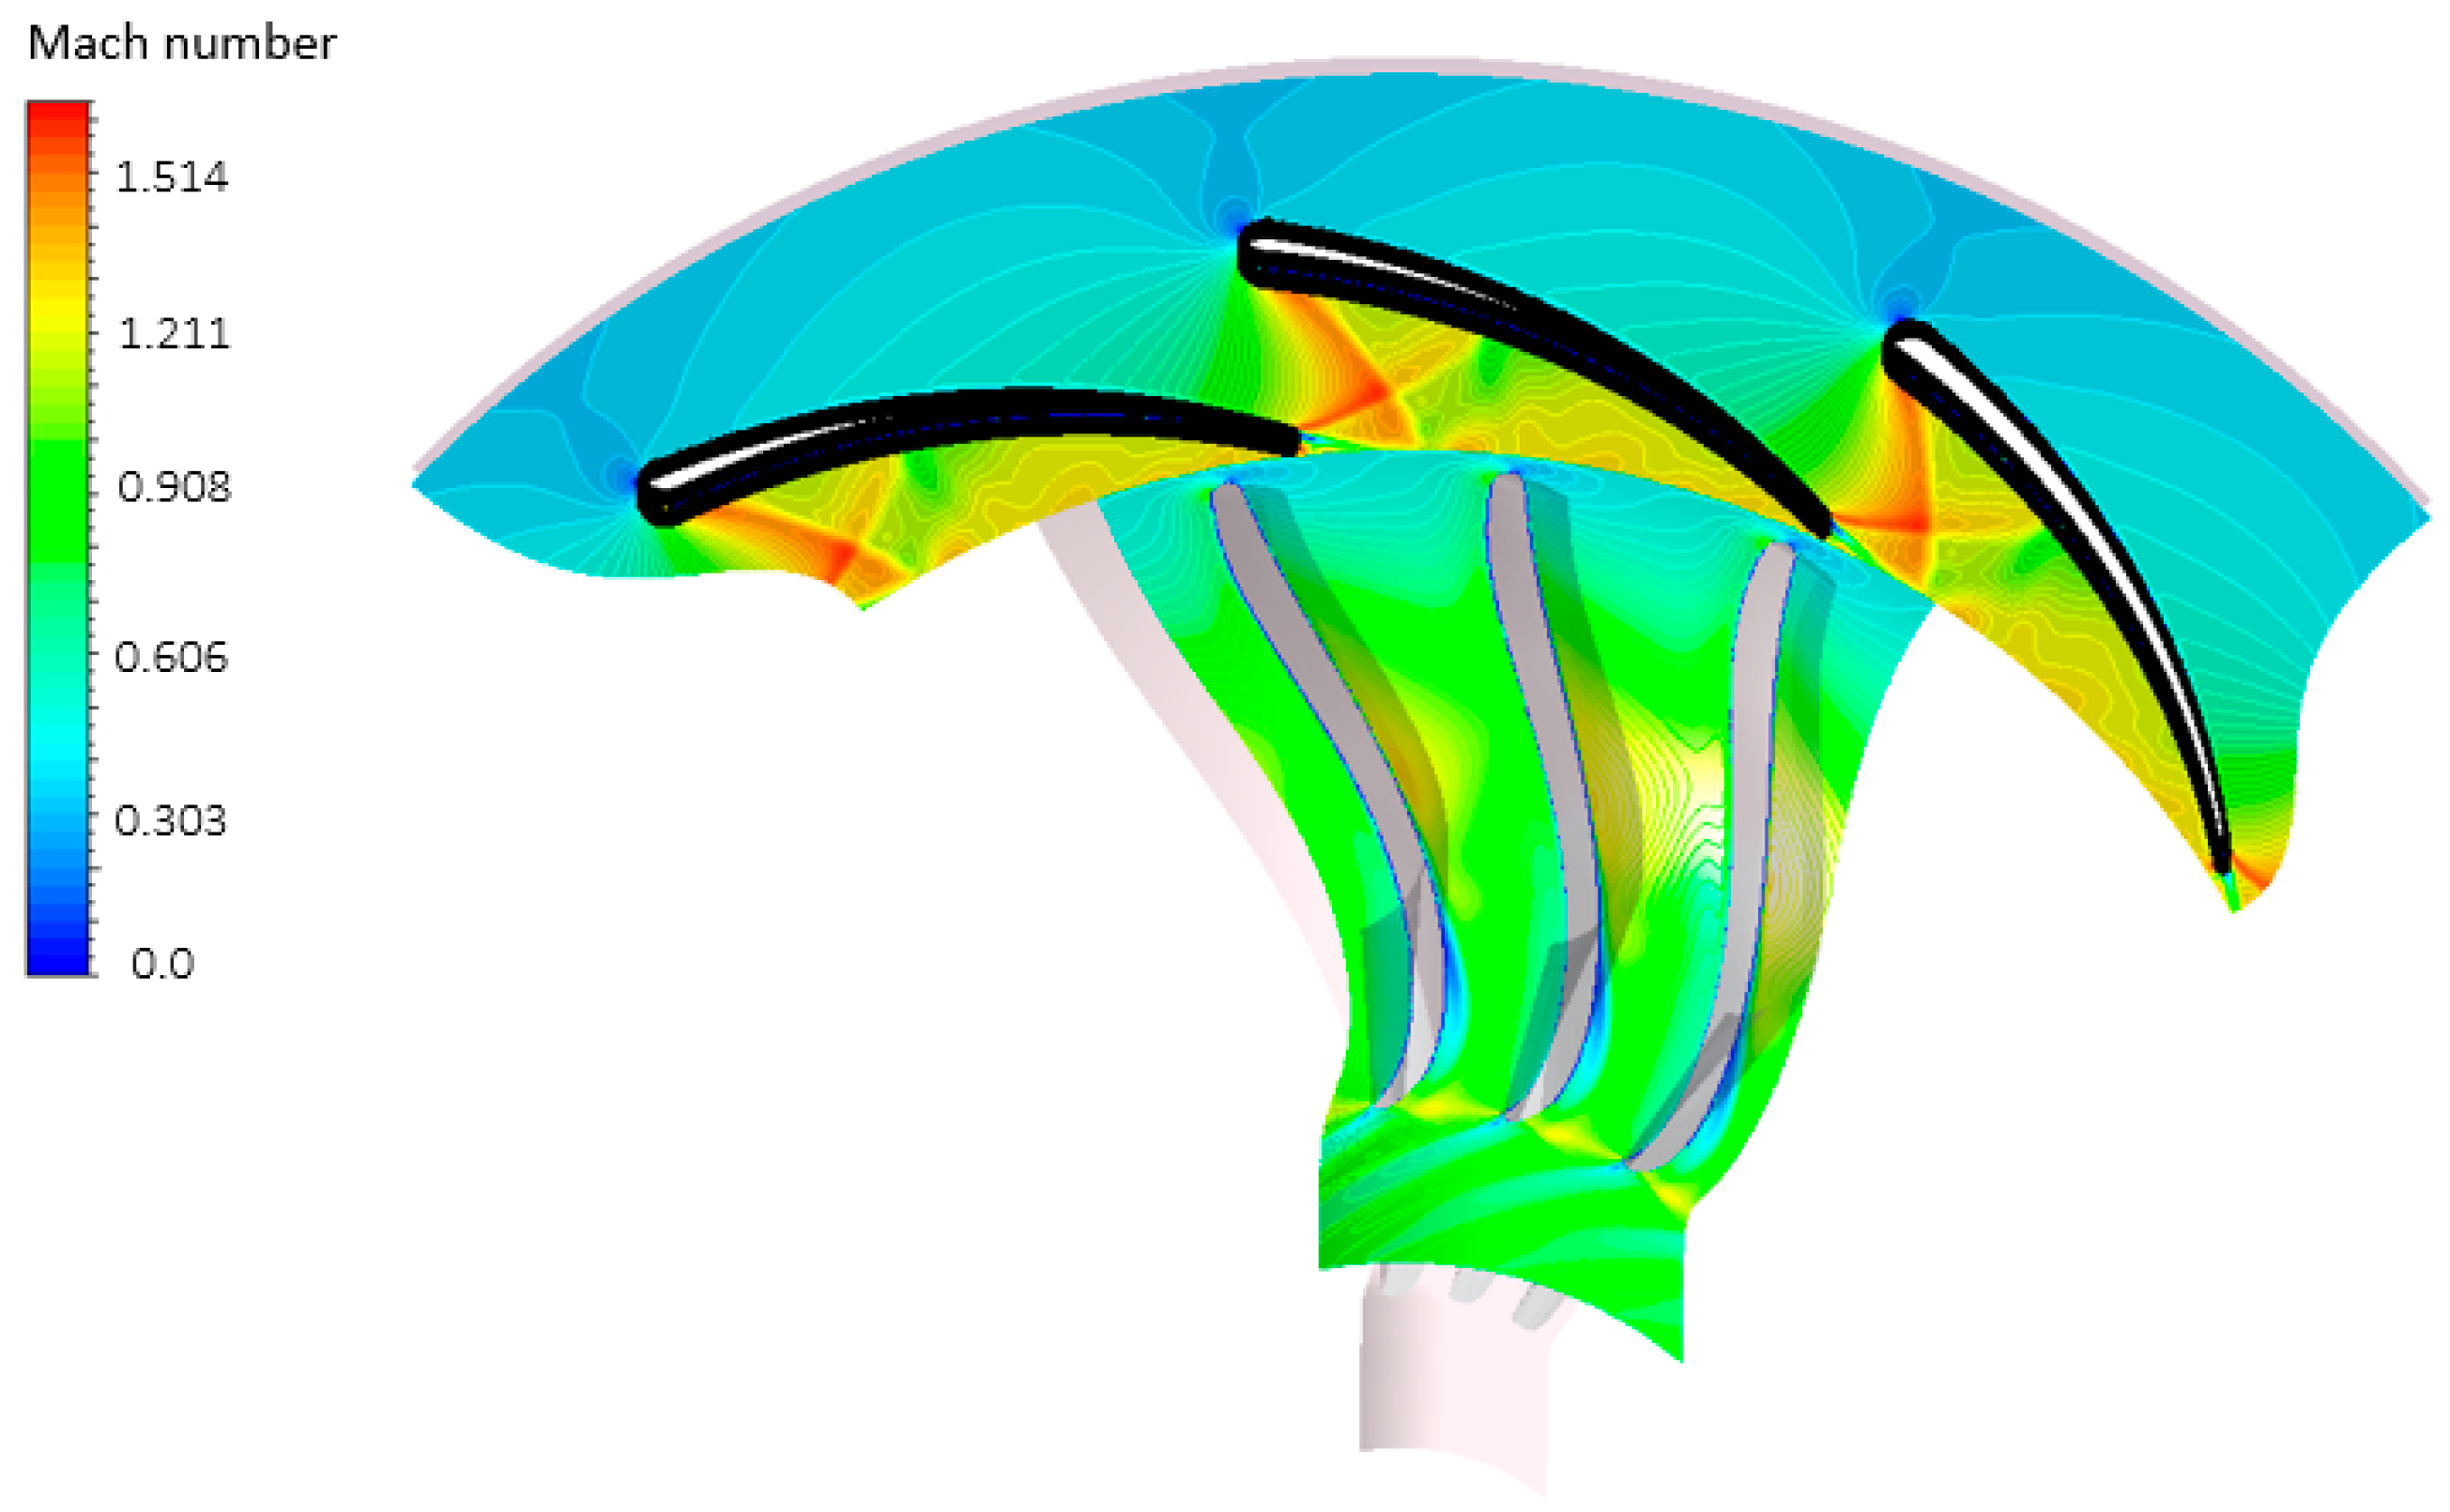
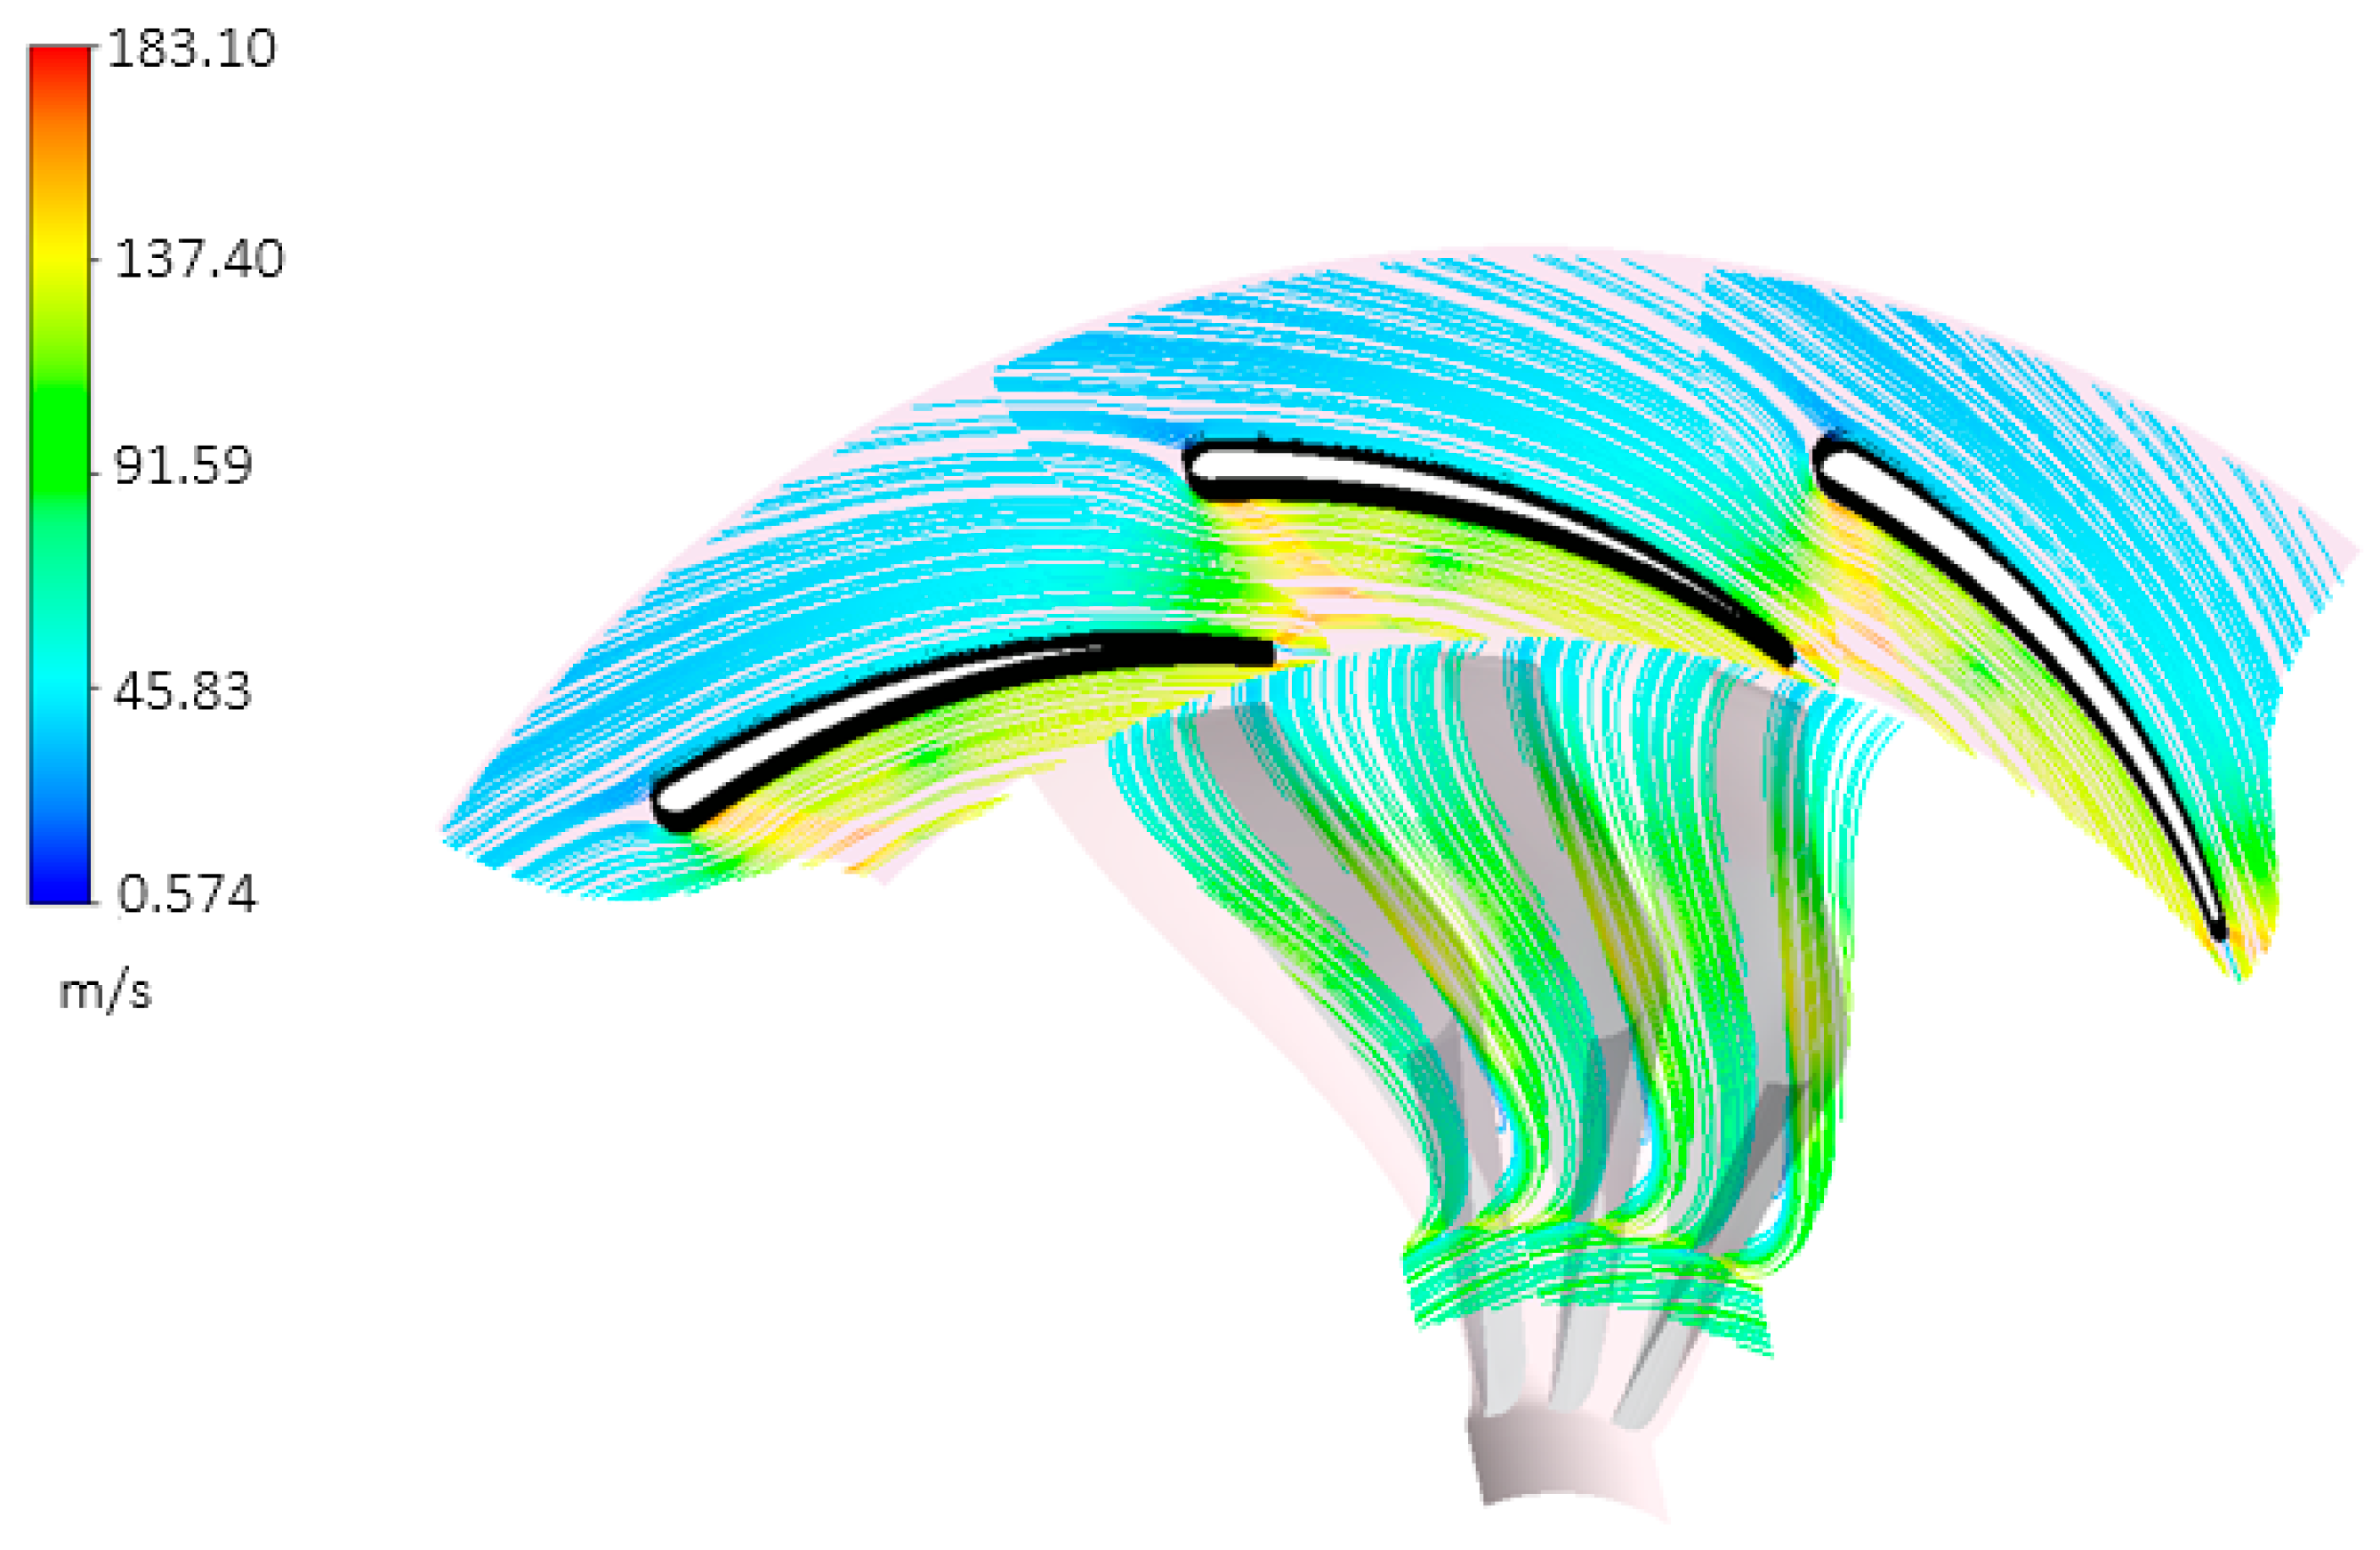
4. Results and Discussion

Utilizing the previously discussed correlations and employing the turbine parameters delineated in Table 5, Table 8 presents the diverse blade and vane configurations. Notably, an additional correlation, denoted as the “design point”, is introduced. This is because setting the blade and vane numbers at an early stage of a project is a common practice, often based on initial design requirements, constraints, and performance expectations. These numbers serve as starting points for further analysis, optimization, and refinement as the project progresses. As evidenced in Table 8, the blade number exhibits considerable variance across different correlations. The Jamieson correlation [21] yields the highest blade number, at 22, followed by Rohlik [24], with 20 blades, while the Whitfield and Baines correlation [23] yields the lowest, at 12 blades.
Figure 8 illustrates the blade number across various flow angles, with Jamieson [21] consistently presenting the highest blade number throughout the entire range. The Whitfield and Baines correlation [23] initiates with a lower blade number at low flow angles, progressively increasing significantly at higher flow angles. Regarding vane number, the Simpson correlation recommends 19 vanes for the turbine, while the remaining correlations are contingent upon the number of rotor blades.
It is important to note that the range of investigated blade and vane numbers in this study extends beyond the assessed correlations. The blade number ranges from 12 to 23, increasing by one blade incrementally. Similarly, the vane number ranges from 9 to 20, with an increment of one vane.

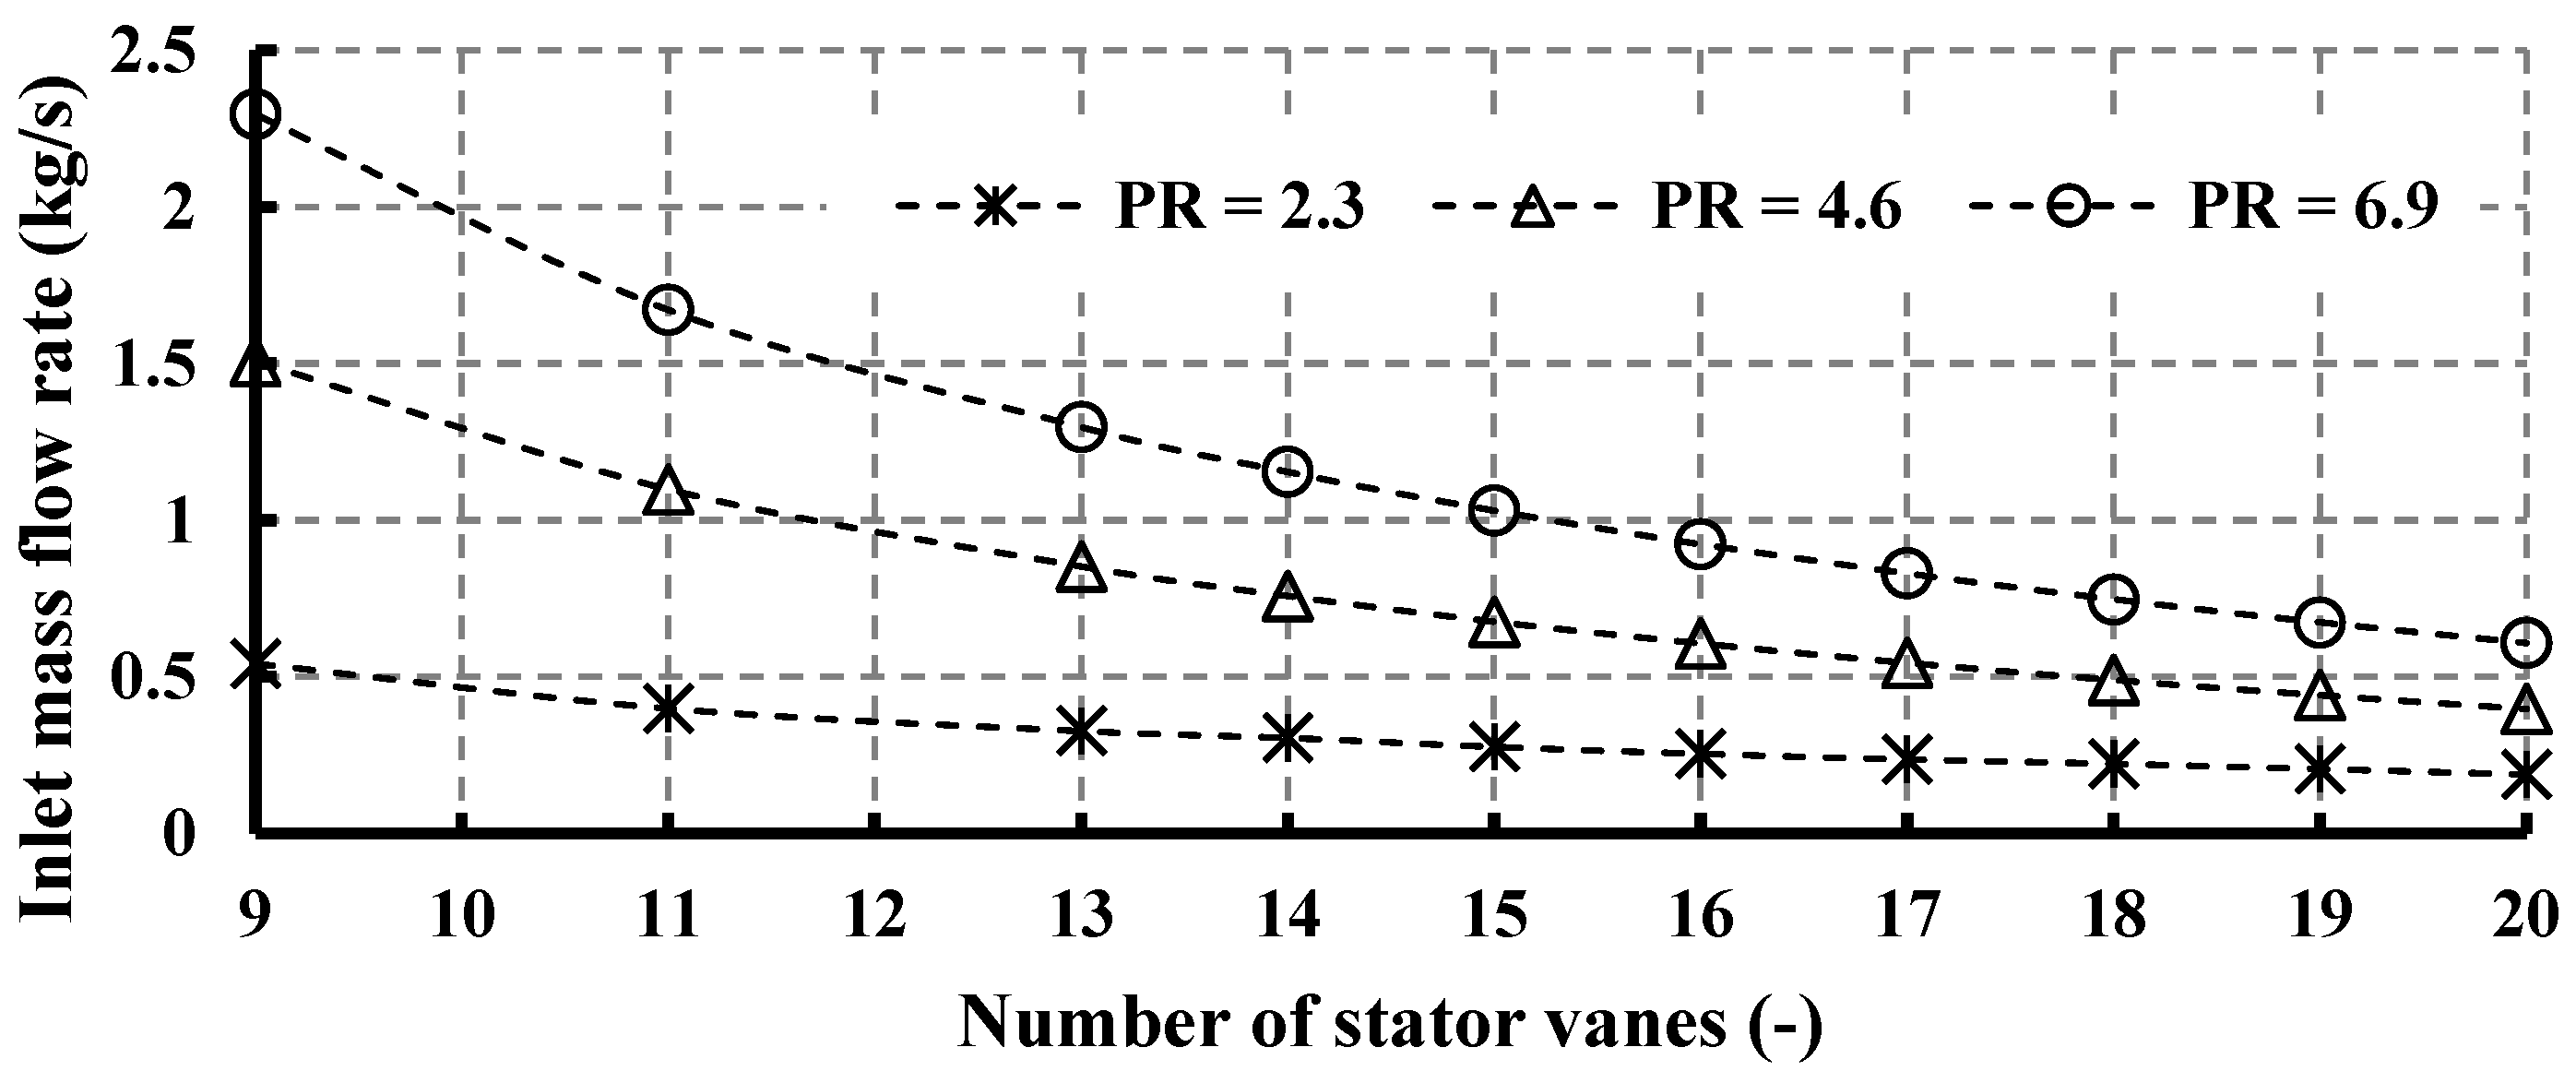
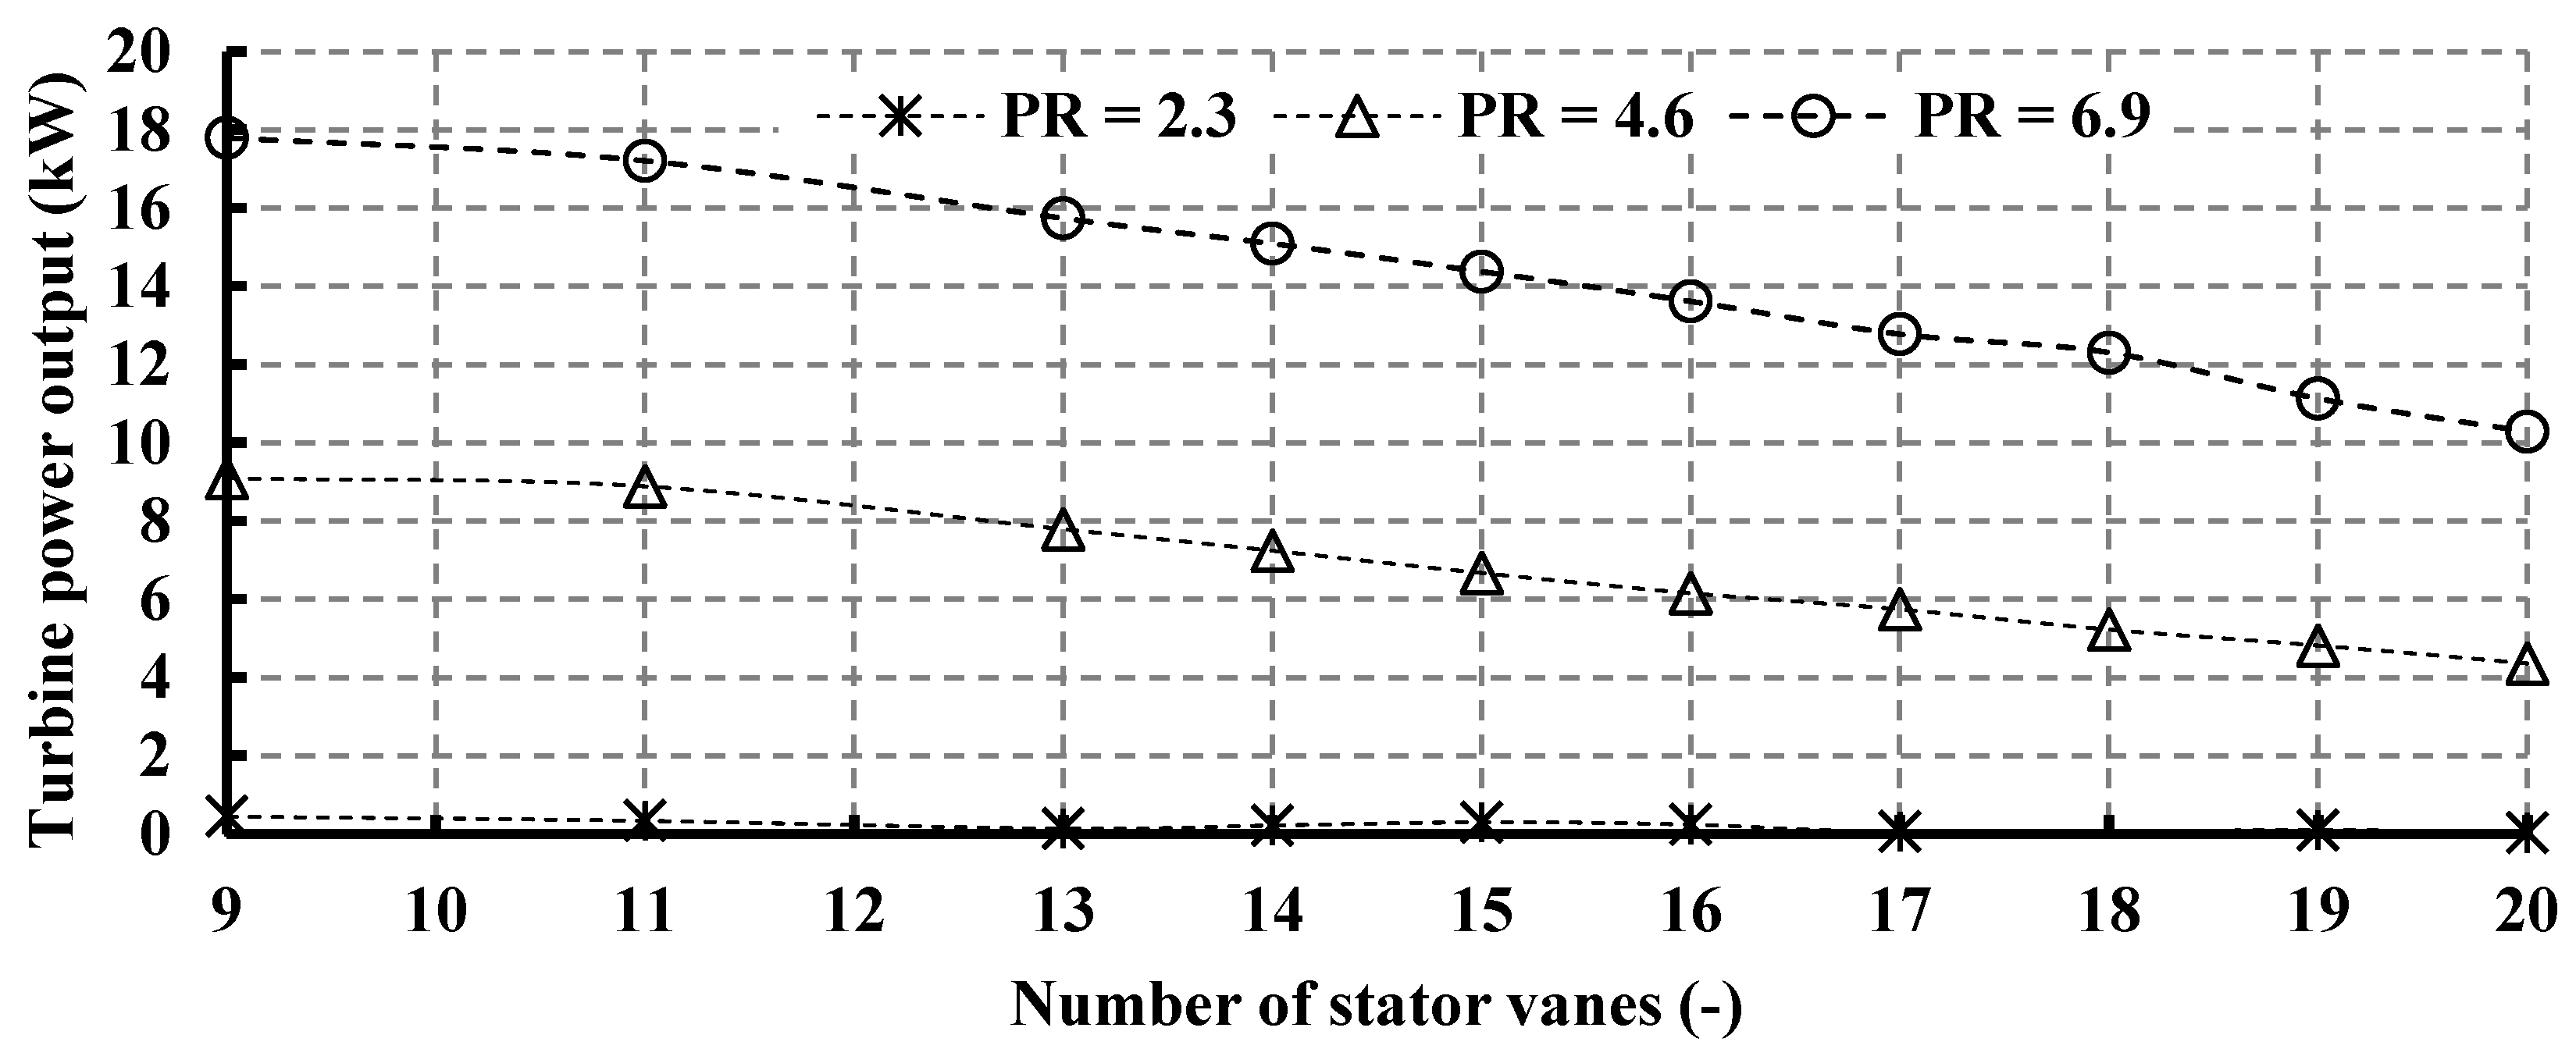
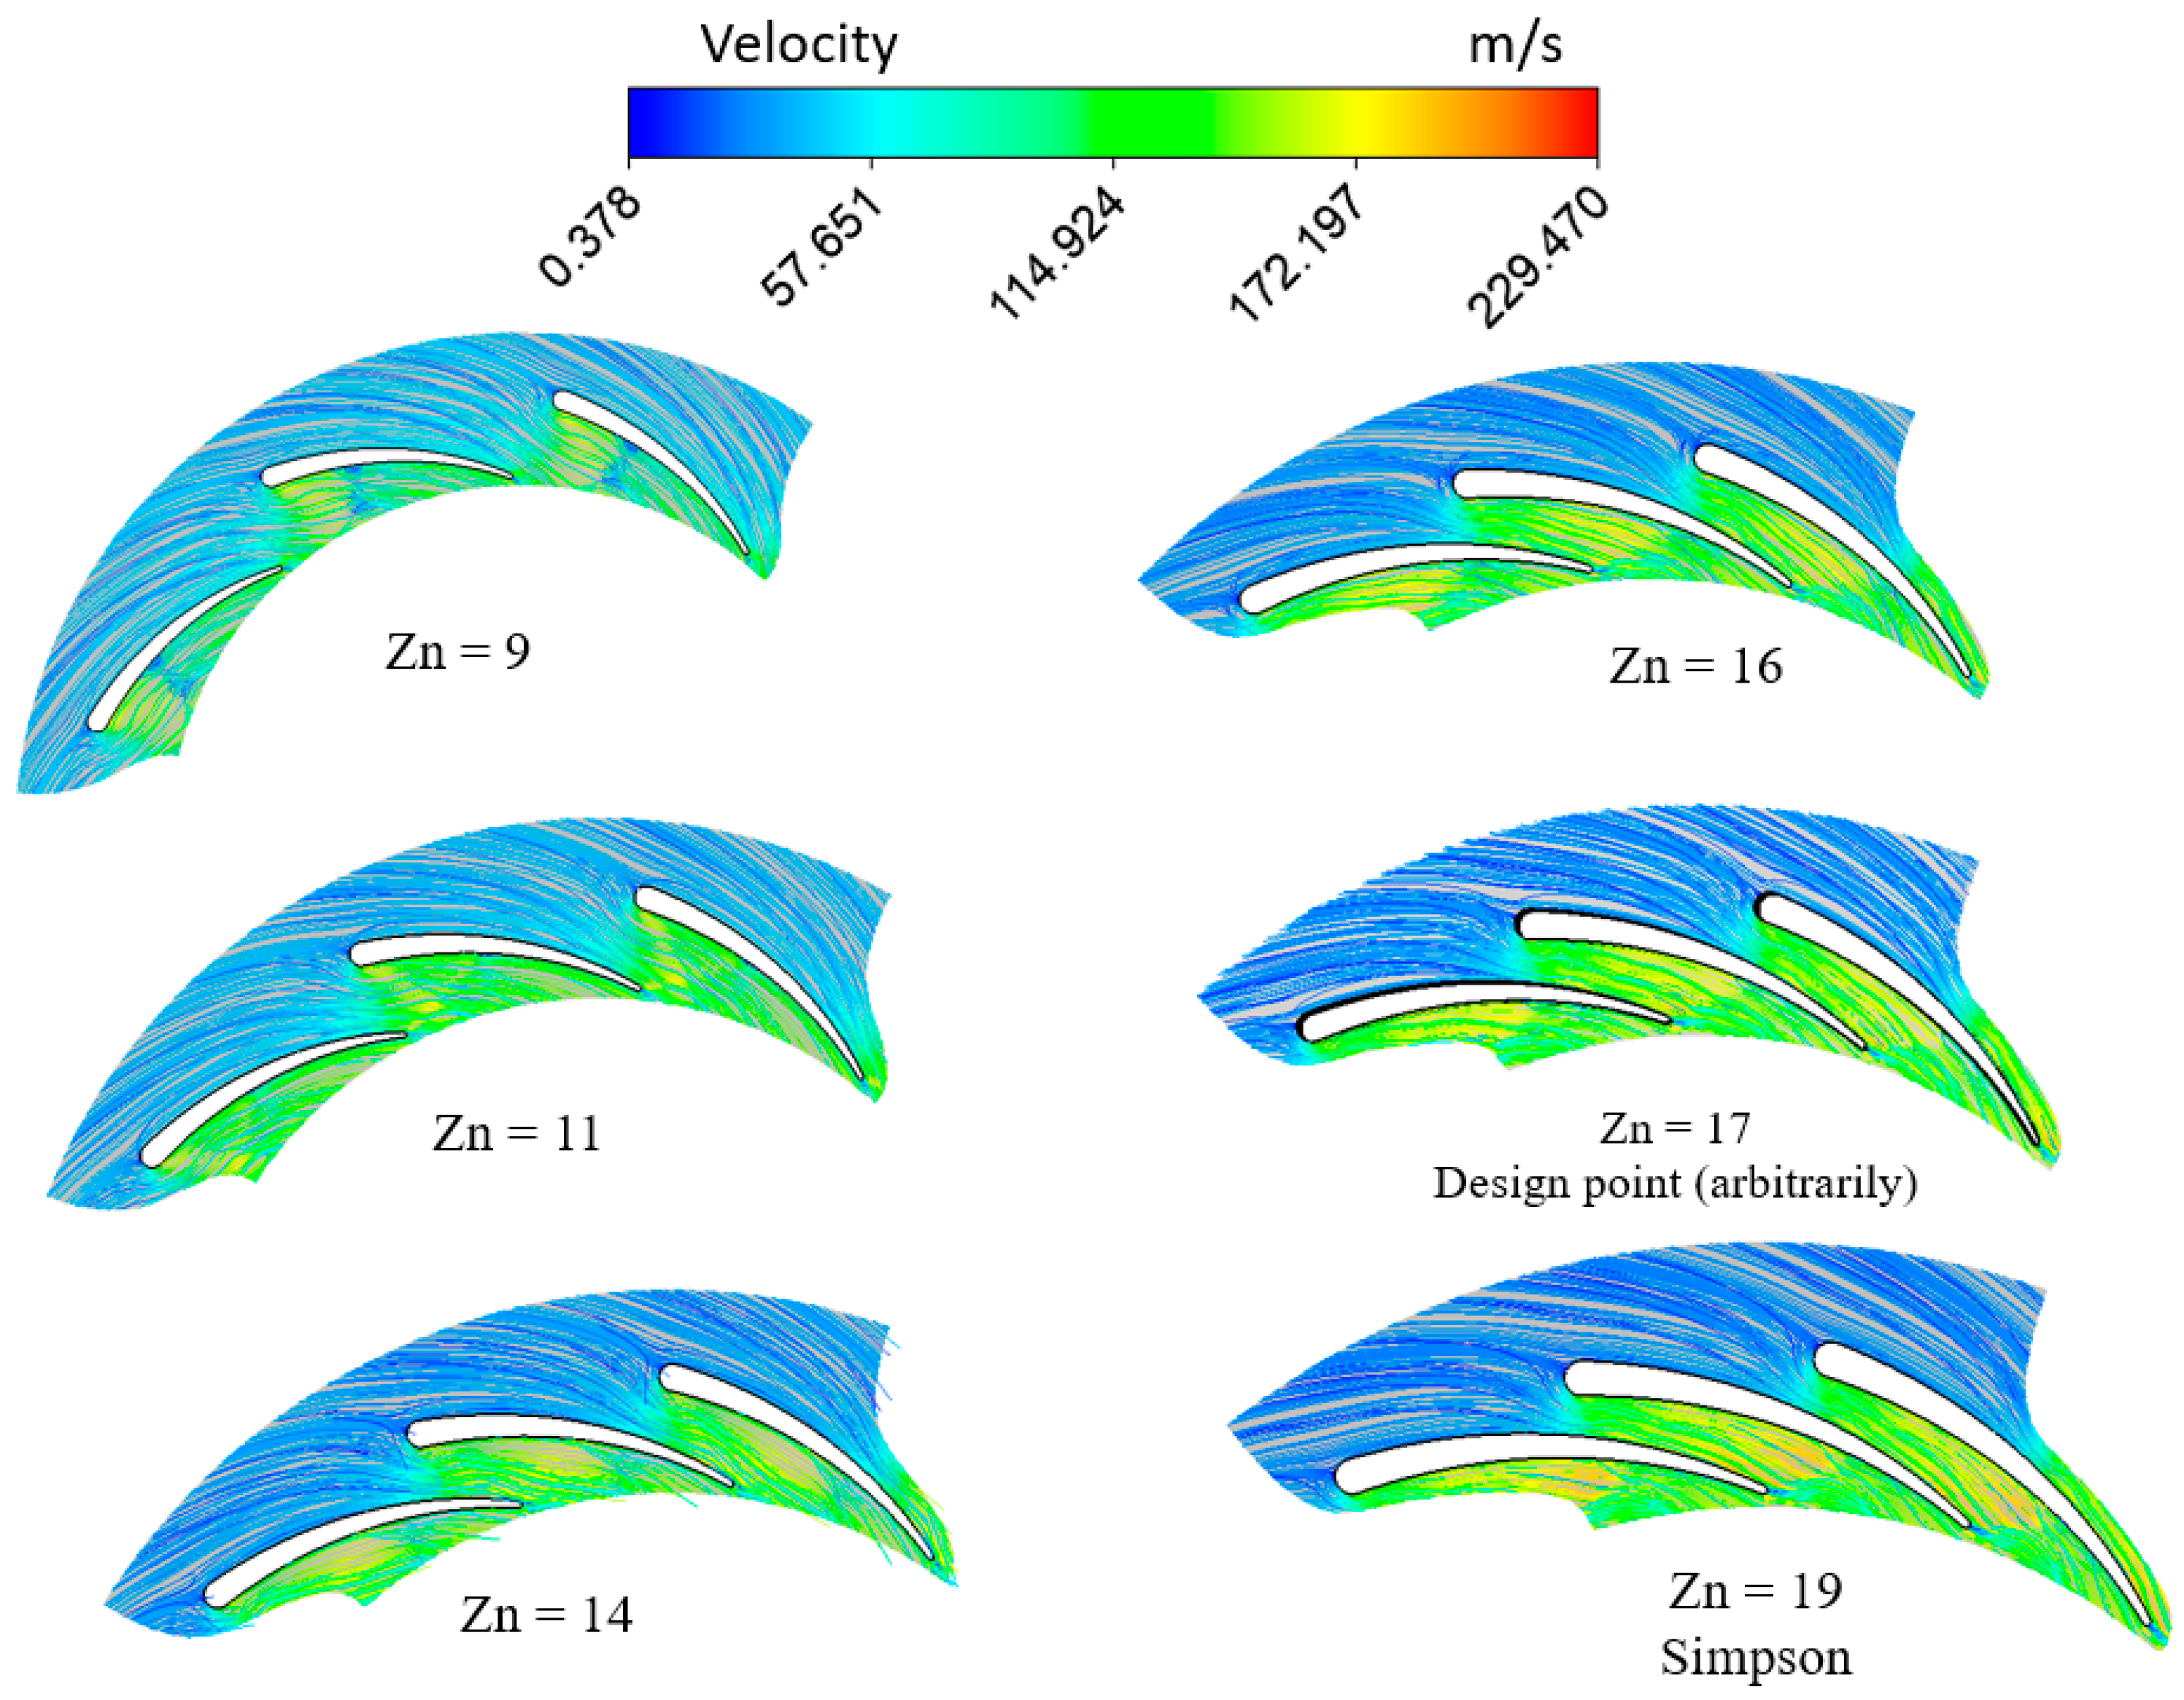
4.1. Impact of Stator Vane Number

The number of stator vanes is crucial in designing radial inflow turbines and optimizing their performance. It directly influences various aspects, such as isentropic efficiency, power output, pressure ratio, Mach number, and mass flow rate. It is important to note that the blade number is maintained at 15, and the rotational speed at 40,000 rpm, for the various vane numbers investigated. Figure 9 presents a sample of the 3D models of the nozzle vanes.

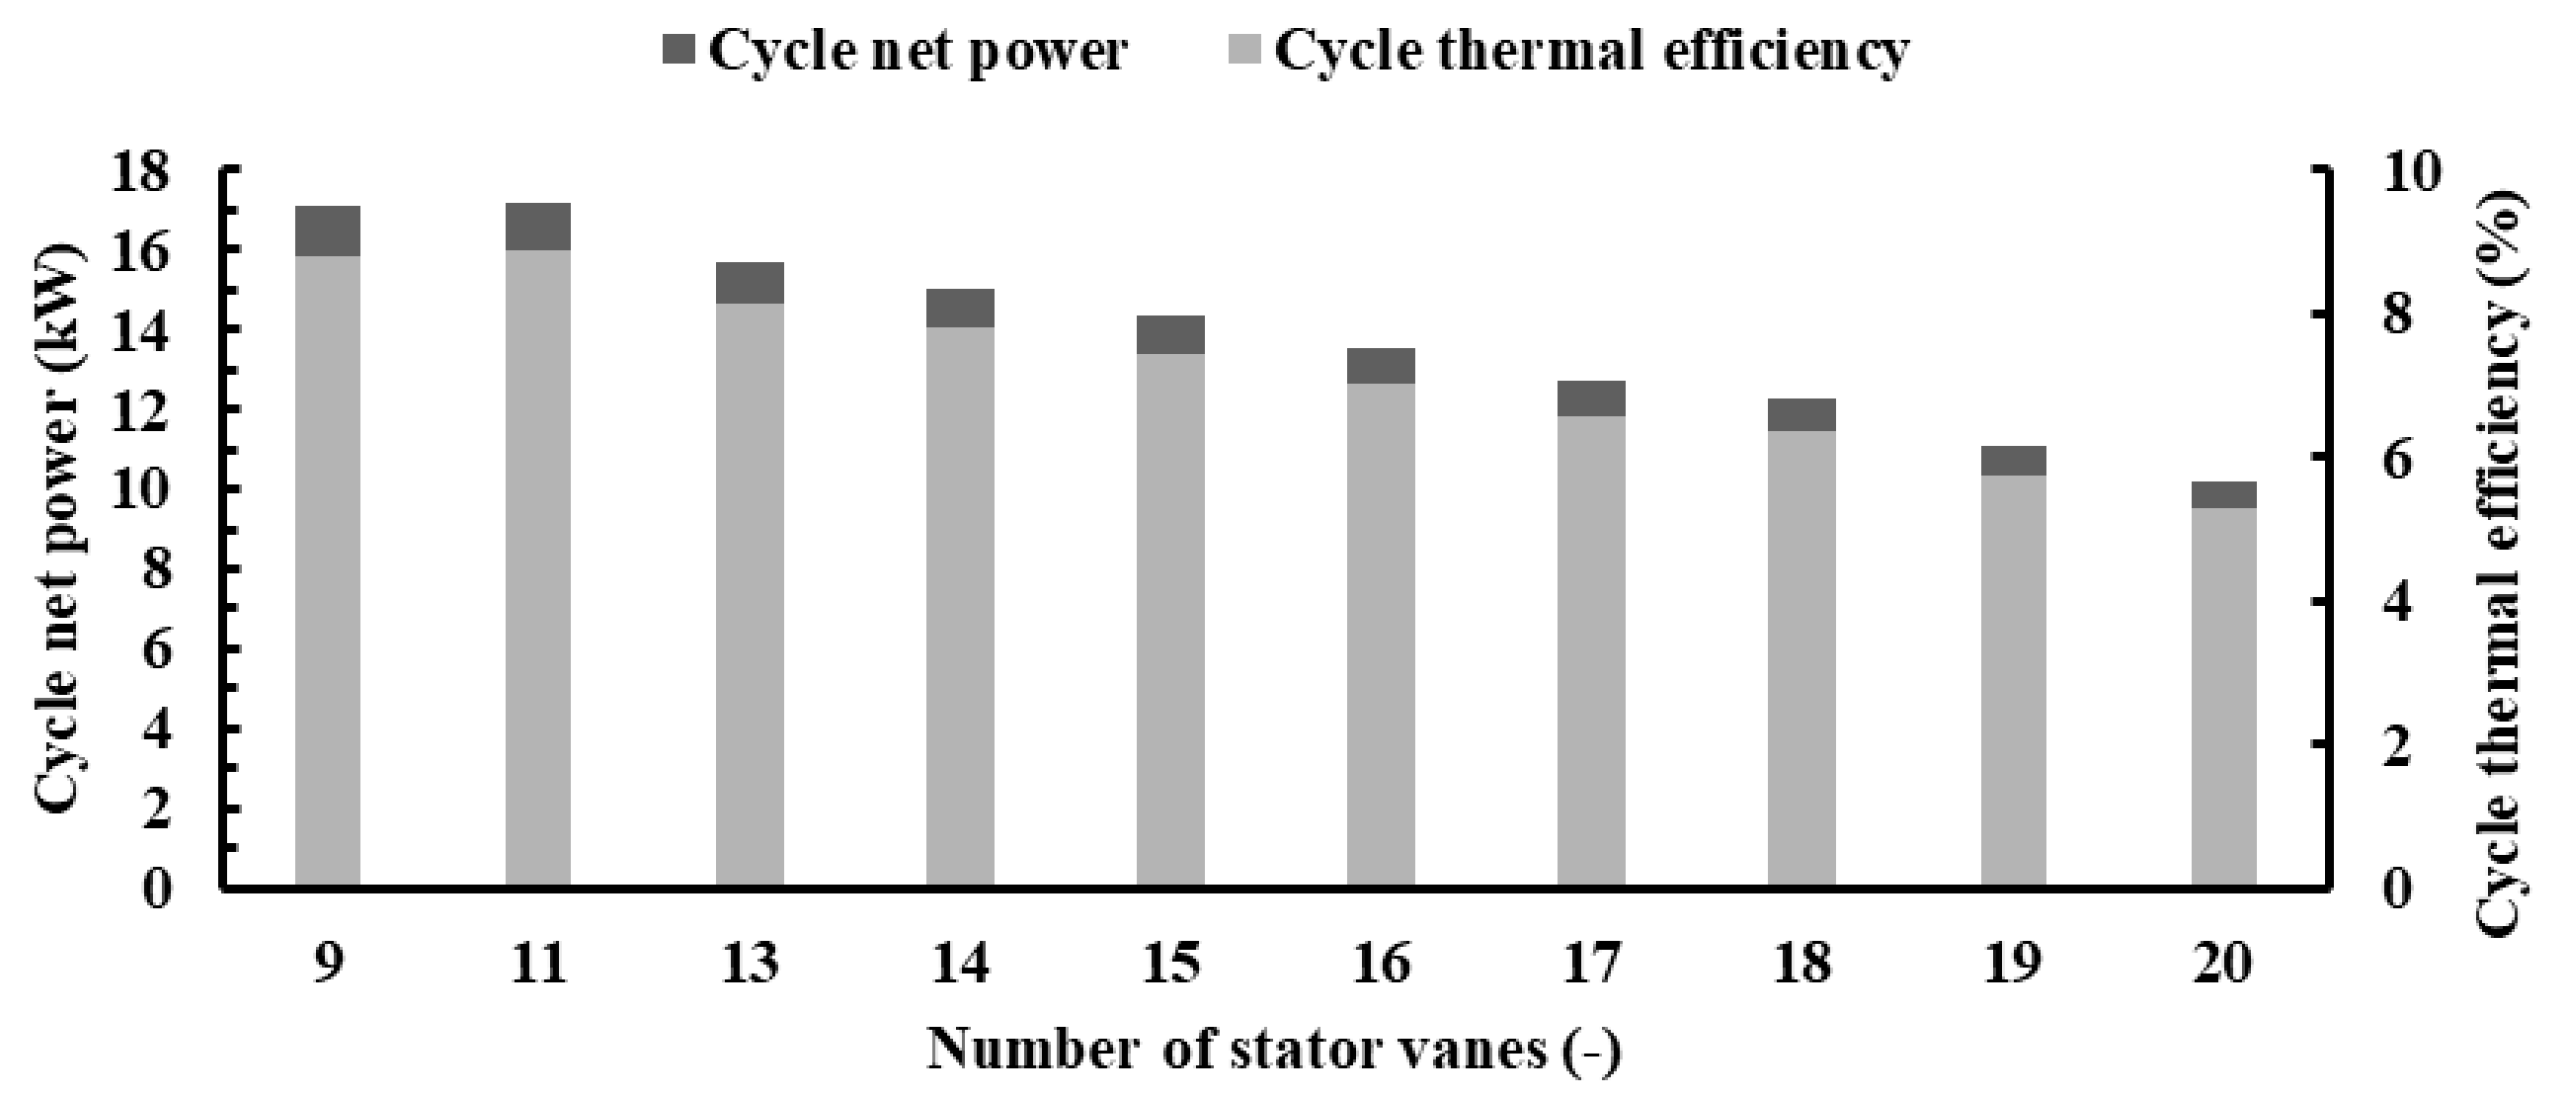
4.1.1. Impact of Vane Number on Global Parameters

This section presents the influence of varying vane numbers on key parameters, including turbine inlet mass flow rate, power output, Mach number, and isentropic efficiency. As illustrated in Figure 10, the alteration of vane numbers exhibits a discernible impact on the mass flow rate of the fluid entering the turbine stage, demonstrating a decrease in mass flow rate with an increase in vane number. This phenomenon aligns with expectations, as augmenting the vane number leads to heightened flow blockage, thereby reducing the effective area for fluid flow into the rotor. Specifically, elevating the vane number from 9 to 13 yields a 43.5% decrease in mass flow rate for a pressure ratio (PR) of 6.9, while for PR = 2.3, the reduction stands at 40.7%. Furthermore, Figure 10 elucidates the dependency of mass flow rate on pressure ratio for each stator number, revealing that PR = 6.9 yields the highest mass flow rate, followed by PR = 4.6, a trend consistent across varying vane numbers. It is noteworthy that the pressure ratio PR = 6.9 is designated as the design point, as delineated in Table 5.
Figure 11 illustrates the impact of vane number on turbine power output. The turbine demonstrates elevated power output at lower vane numbers, a trend directly linked to the mass flow rate, as expressed in Equation (2). As evidenced in Figure 10, an increase in vane number corresponds to a decrease in mass flow rate, consequently leading to diminished turbine power. Specifically, elevating the vane number from 11 to 13 results in a 15.24% reduction in turbine power output at a pressure ratio (PR) of 6.9. Notably, at PR = 2.3, the reduction is notably higher, standing at 71%. Furthermore, Figure 11 highlights a discrepancy in the performance predicted by the correlation proposed by Simpson et al. [25]. In practice, employing Simpson’s correlation (19 vanes) yields a turbine mass flow rate of 0.67 kg/s and a power output of 11.14 kW for PR = 6.9. However, the optimal turbine mass flow rate and power output are achieved with 11 vanes, measuring 1.67 kg/s and 17.22 kW, respectively. It is noteworthy that the decrease in power output observed from 9 to 11 vanes becomes less pronounced, despite the significant reduction in mass flow rate. This phenomenon is attributed to the flow reversal and Mach number values associated with nine vanes, as will be elucidated subsequently. Thus, designing a radial turbine with lower vane numbers proves advantageous for enhancing mass flow rate and, consequently, turbine power output.
Figure 12 presents the values of Mach numbers at the stator exit for different vane numbers. In a radial turbine, the nozzle exit experiences high Mach numbers, primarily because of the high velocity of the fluid passing through it, due to the reduction in cross-sectional area. When the fluid velocity approaches or surpasses the speed of sound, it enters the realm of high Mach numbers. As anticipated, the flow transitions to supersonic velocities at elevated pressure ratios, as depicted in Figure 12. Specifically, for PR = 6.9, Mach number values exceed unity across all vane number configurations, peaking at 1.32 with 14 vanes. At PR = 4.6, supersonic flow is observed at lower vane numbers (up to 16 vanes), gradually transitioning to subsonic velocities at higher vane numbers (from 17 to 20 vanes). Conversely, for PR = 2.3, the flow remains subsonic across the entire range of vane numbers.
Figure 13 and Figure 14 illustrate the influence of varying vane numbers on stator loss and, consequently, turbine isentropic efficiency, revealing distinct trends that are contingent upon the operating pressure ratio. Stator loss escalates as the number of vanes increases, demonstrating analogous patterns across various pressure ratios. At elevated pressure ratios (PR = 4.6 and 6.9), turbine efficiency demonstrates an increasing trajectory, culminating in peak values of 74% with 11 vanes for PR = 6.9, and 71.78% for PR = 4.6. Subsequently, post-peak, efficiency experiences a decline. In accordance with the Simpson correlation shown in Equation (17), and relative to the maximum efficiency levels, there is an efficiency reduction of 7.8% and 22.58% for PR = 6.9 and 4.6, respectively. The turbine’s design specification prioritizes operation at a pressure ratio of 6.9, which ensures optimal efficiency across a wide range of vane numbers. Conversely, for PR = 2.3, the highest turbine efficiency is attained with 20 vanes, registering at 40.67%. Additionally, it is noteworthy that although an 11-vane configuration represents the optimal choice for PR = 4.6 and PR = 6.9, it exhibits the lowest efficiency of 32.87% when PR = 2.3.

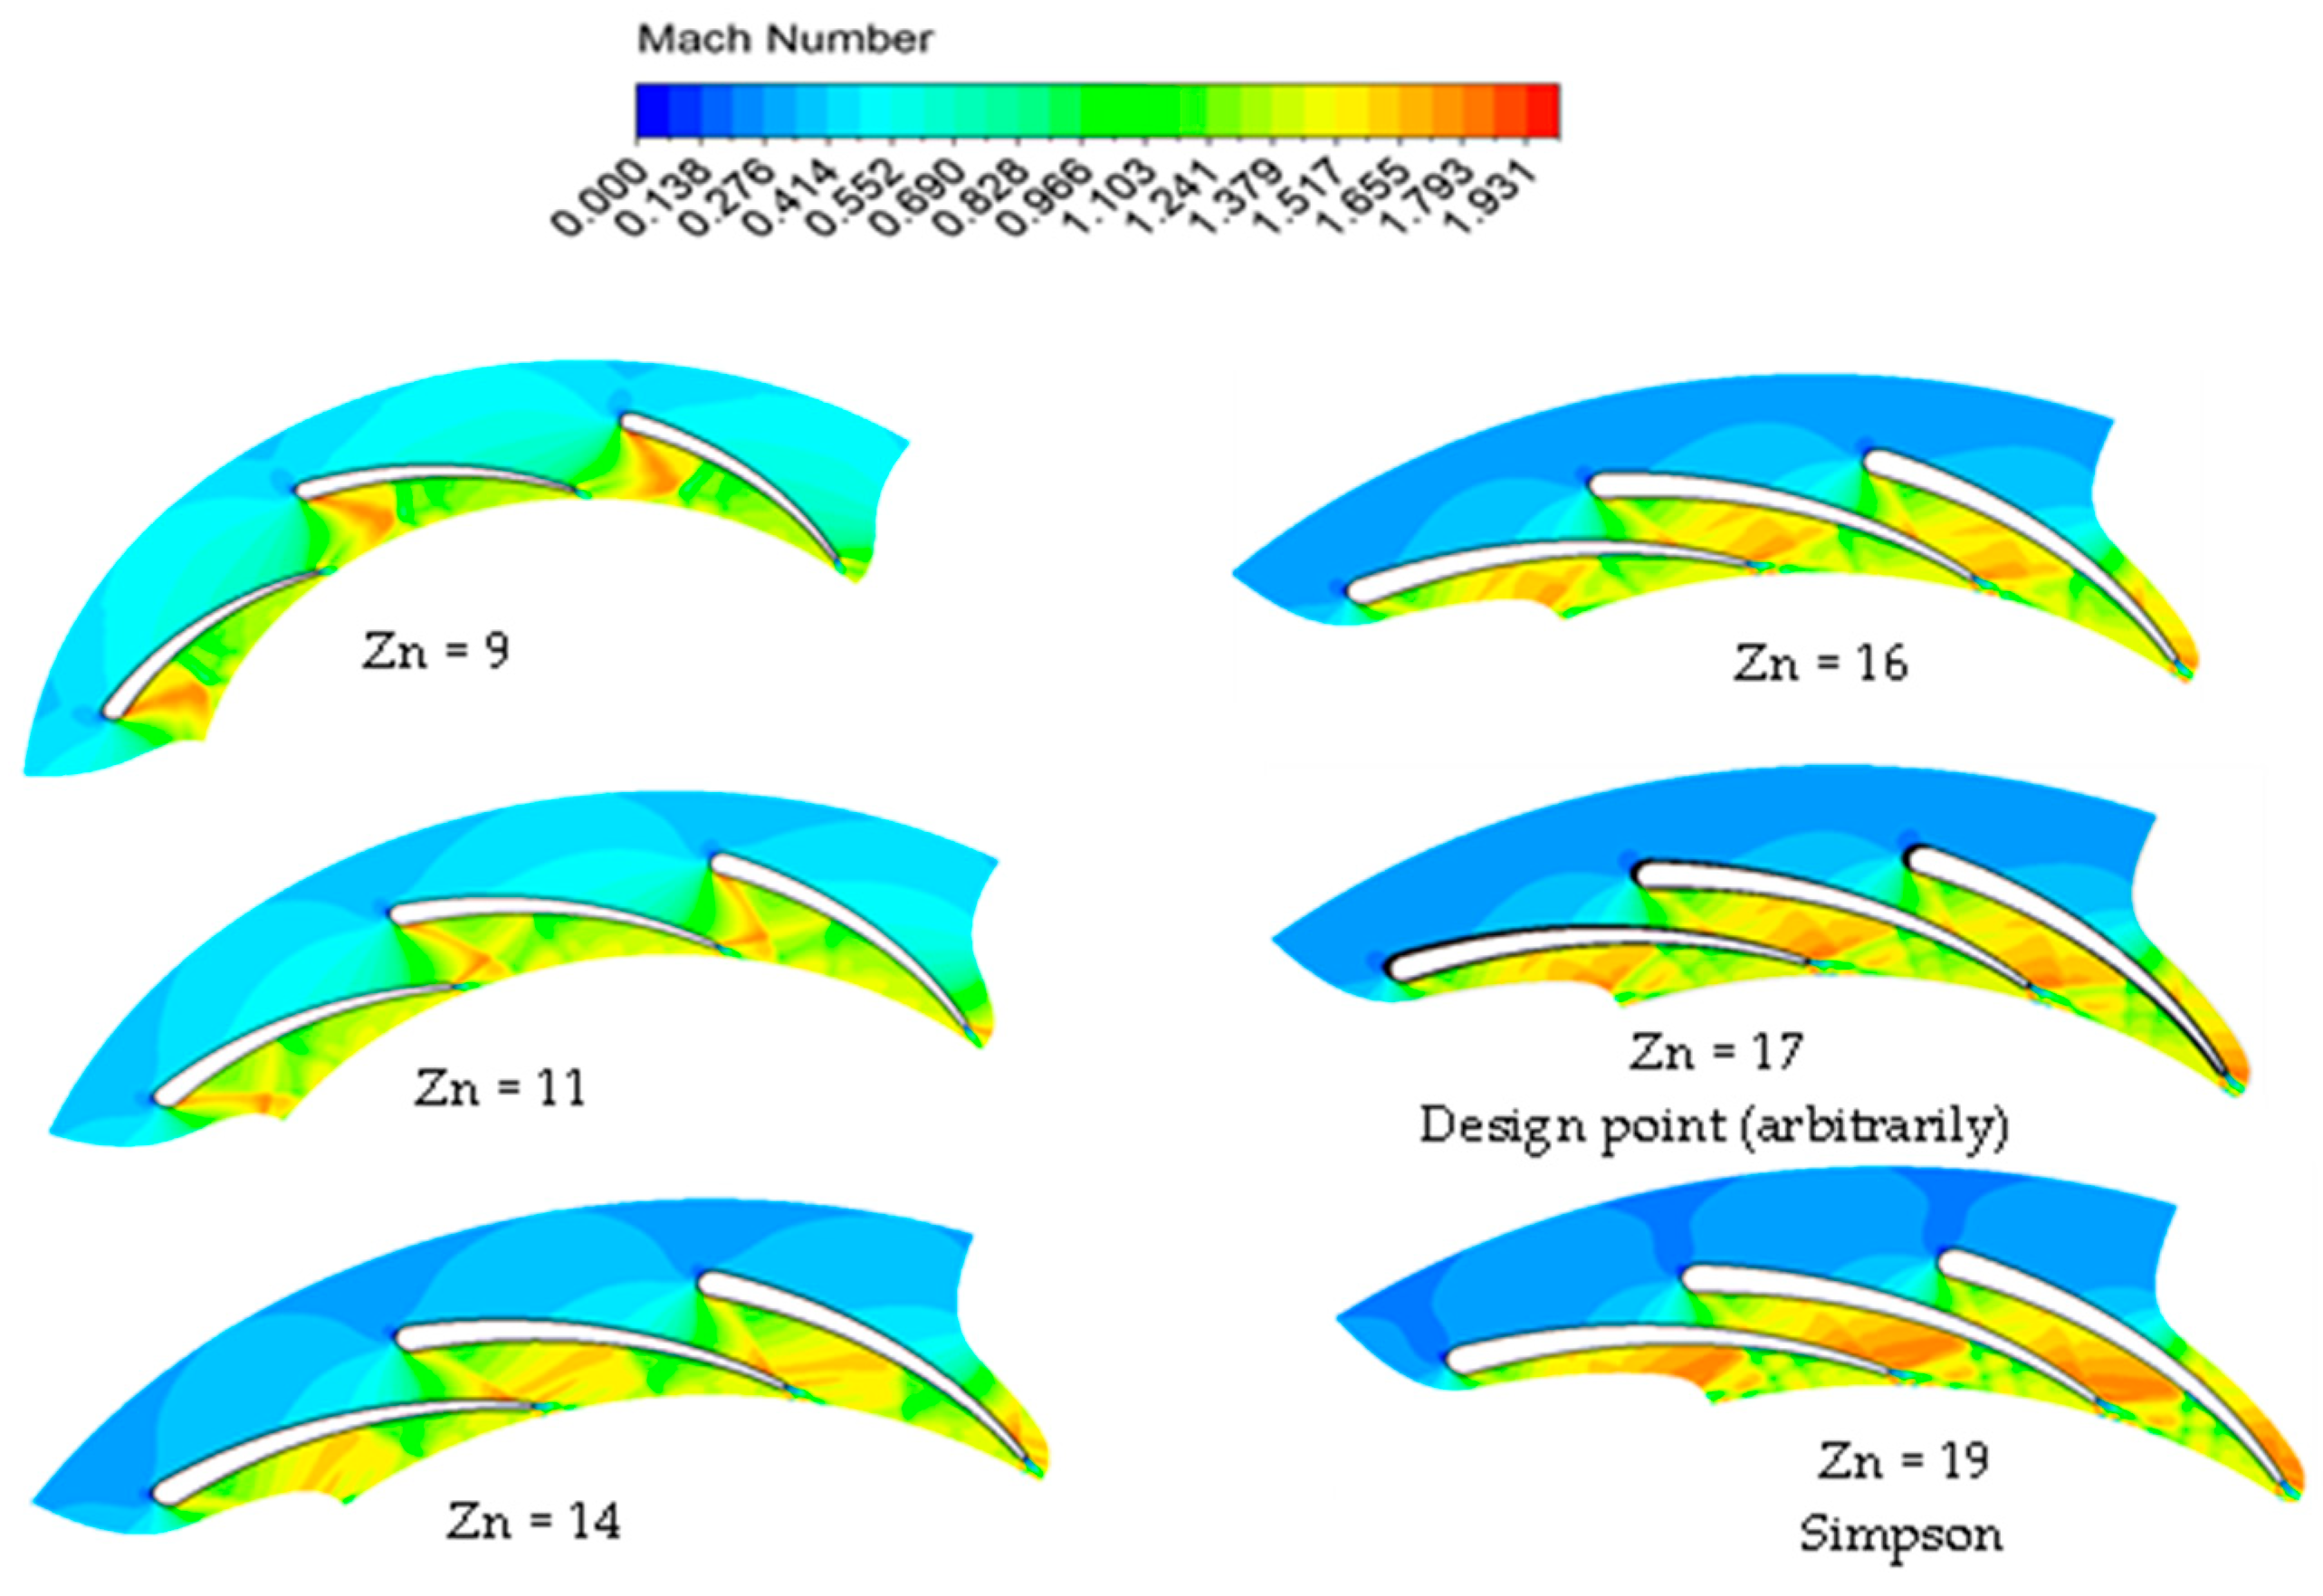
4.1.2. Impact of Vane Number on Flow Regime

In this section, the flow through the vanes is studied using CFD, considering different numbers of vanes. Figure 15 depicts the pressure distribution at 50% span of the vane and with PR = 6.9. The figure potrays the variation in pressure from the vane inlet to the exit, with the throat area depicting the highest variation. The figure also shows that the pressure presents large variation as the number of vanes inceases. This pressure variation justifies the significant variation in the flow velocity, as shown in Figure 16. The acceleration of the flow increases as the vane number increases. This phenomenon is expected, due to the reduced throat area required to pass the flow. Nevertheless, the abrupt increase in flow velocity is undesirable, as it influences the dynamic vibrations experienced by the spinning rotor blades.
Figure 16 illustrates that, across varying numbers of vanes, the flow velocity exhibits a gradual increase upstream of the throat, devoid of any separation or recirculation phenomena. However, the flow velocity significantly changes at the pressure side when reaching the throat.
Figure 17 illustrates the distribution of Mach numbers for different numbers of vanes, at 50% span. As anticipated, the Mach number exceeds unity across different vane configurations, denoting a supersonic flow pattern. This outcome is predictable, given the high pressure ratio (PR = 6.9). Additionally, the figure depicts a more uniform distribution of Mach numbers at lower vane numbers, attributable to the larger throat area, except for in the model with nine vanes.

4.2. Impact of Rotor Blade Number

The rotor serves as the primary component responsible for extracting fluid energy through its blades. As such, the design and aerodynamic attributes of the rotor blades play a crucial role in determining turbine performance. Figure 18 displays representative 3D models of the rotor blades. It is pertinent to mention that the vane number is held constant at 17, and the rotational speed remains at 40,000 rpm across the various blade configurations investigated.

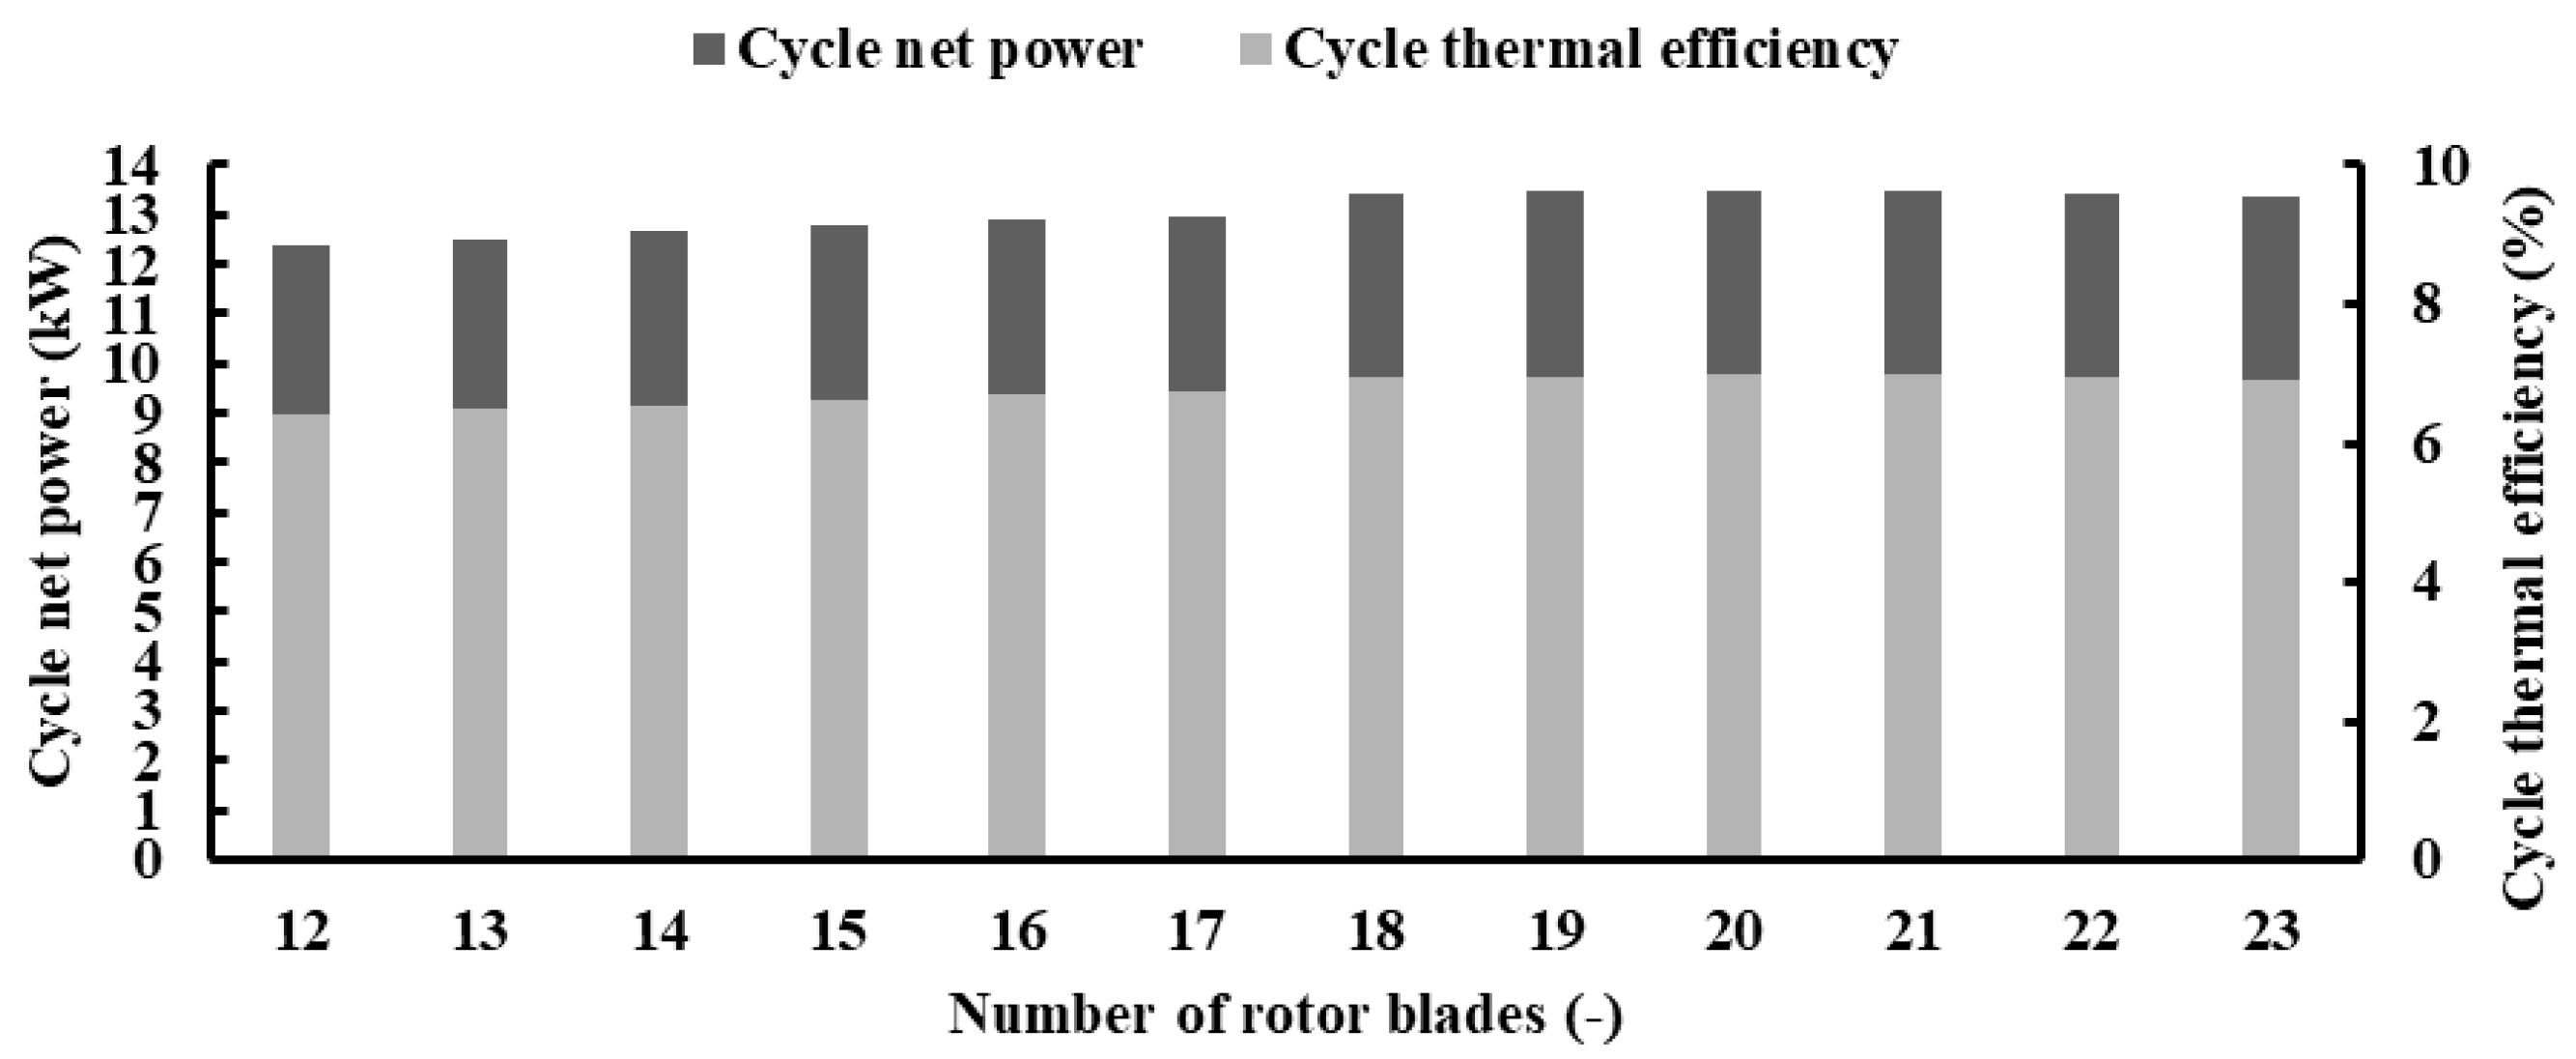
4.2.1. Impact of Blade Number on Global Parameters

Figure 19 illustrates the influence of rotor blade number on turbine efficiency and power output across various pressure ratios. Specifically, Figure 19a portrays the turbine’s isentropic efficiency, while Figure 19b showcases its power output. Additionally, Figure 19c offers a focused view of Figure 19a,b, specifically examining the scenario with a pressure ratio of 6.9, thereby elucidating the observed trends in greater detail. As the number of blades increases, there is a notable surge in both turbine power and isentropic efficiency observed between 12 and 18 blades, followed by a more subdued rise between 18 and 21 blades, and, subsequently, a decline initiates at 22 blades. This pattern holds consistent across all three pressure ratios. Such a trend is anticipated, as augmenting the blade number expands the surface area available for energy extraction from the fluid. Nonetheless, the trajectory begins to plateau, owing to heightened friction, ultimately leading to a decline in performance.
As the blade number increases from 12 to 16, there is an associated augmentation in turbine power and efficiency by 4.42% and 4.22%, respectively. Conversely, the advancement from 18 to 21 blades yields more modest increases of 0.5% in turbine power and 0.6% in efficiency. The marginal enhancement of turbine power and efficiency with increased blade numbers comes with the concomitant drawbacks of elevated inertia and associated costs. The variation in power and efficiency is correlated with the distribution of rotor losses, as illustrated in Figure 20. It is evident from the figure that incidence loss predominates, followed by passage loss, while trailing edge loss is relatively minor. The figure illustrates how these losses evolve with an increasing number of rotor blades. Incidence loss peaks at 12 blades, constituting 63.4% of the total rotor loss, and gradually declines to 57.5% with 22 blades. Similarly, passage loss decreases gradually with the number of blades, until it reaches a minimum at 21 blades, before rising again. The maximum passage loss occurs with 12 blades, amounting to 24%, while the lowest is observed at 20 blades, totaling 21.3%. Conversely, rotor clearance and trailing edge losses increase with the number of blades, peaking at 16% and 4.33%, respectively. Nevertheless, it is worth noting that the preceding losses, namely windage, passage, and clearance losses, exert a predominant influence, thereby elucidating the efficiency trend depicted in Figure 19.
Figure 21 illustrates the relative Mach number at the rotor exit. Augmenting the blade number diminishes the exit’s effective area, consequently elevating the flow velocity and, subsequently, the Mach number. Nonetheless, the relative Mach number remains below unity across the entire range of blade numbers, indicating a subsonic regime prevailing in this domain. It is notable that the Glassman correlation [22], commonly referenced in Table 1, does not necessarily yield optimal performance in ORC radial turbines operating at high pressure ratios.

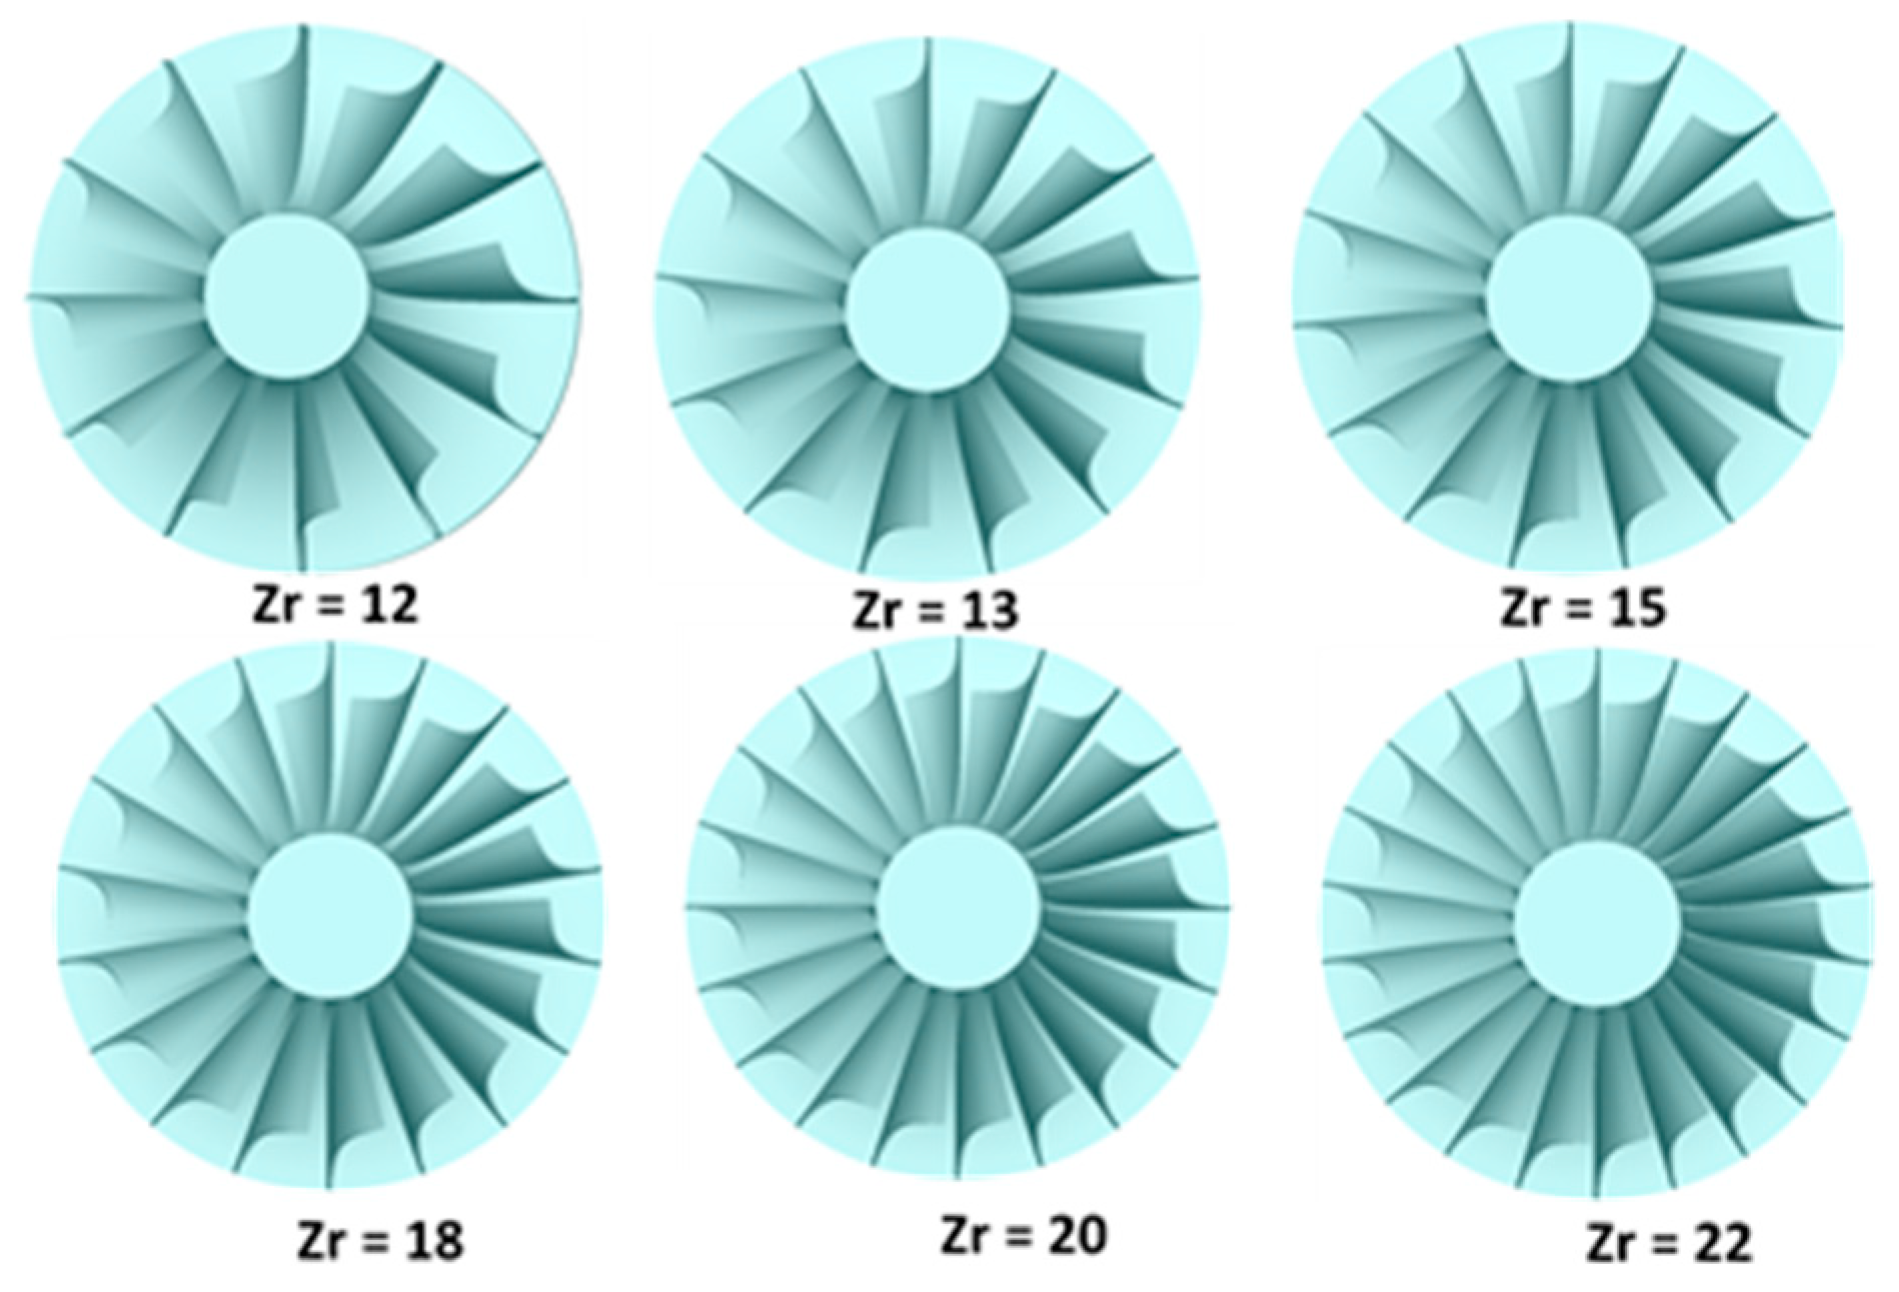
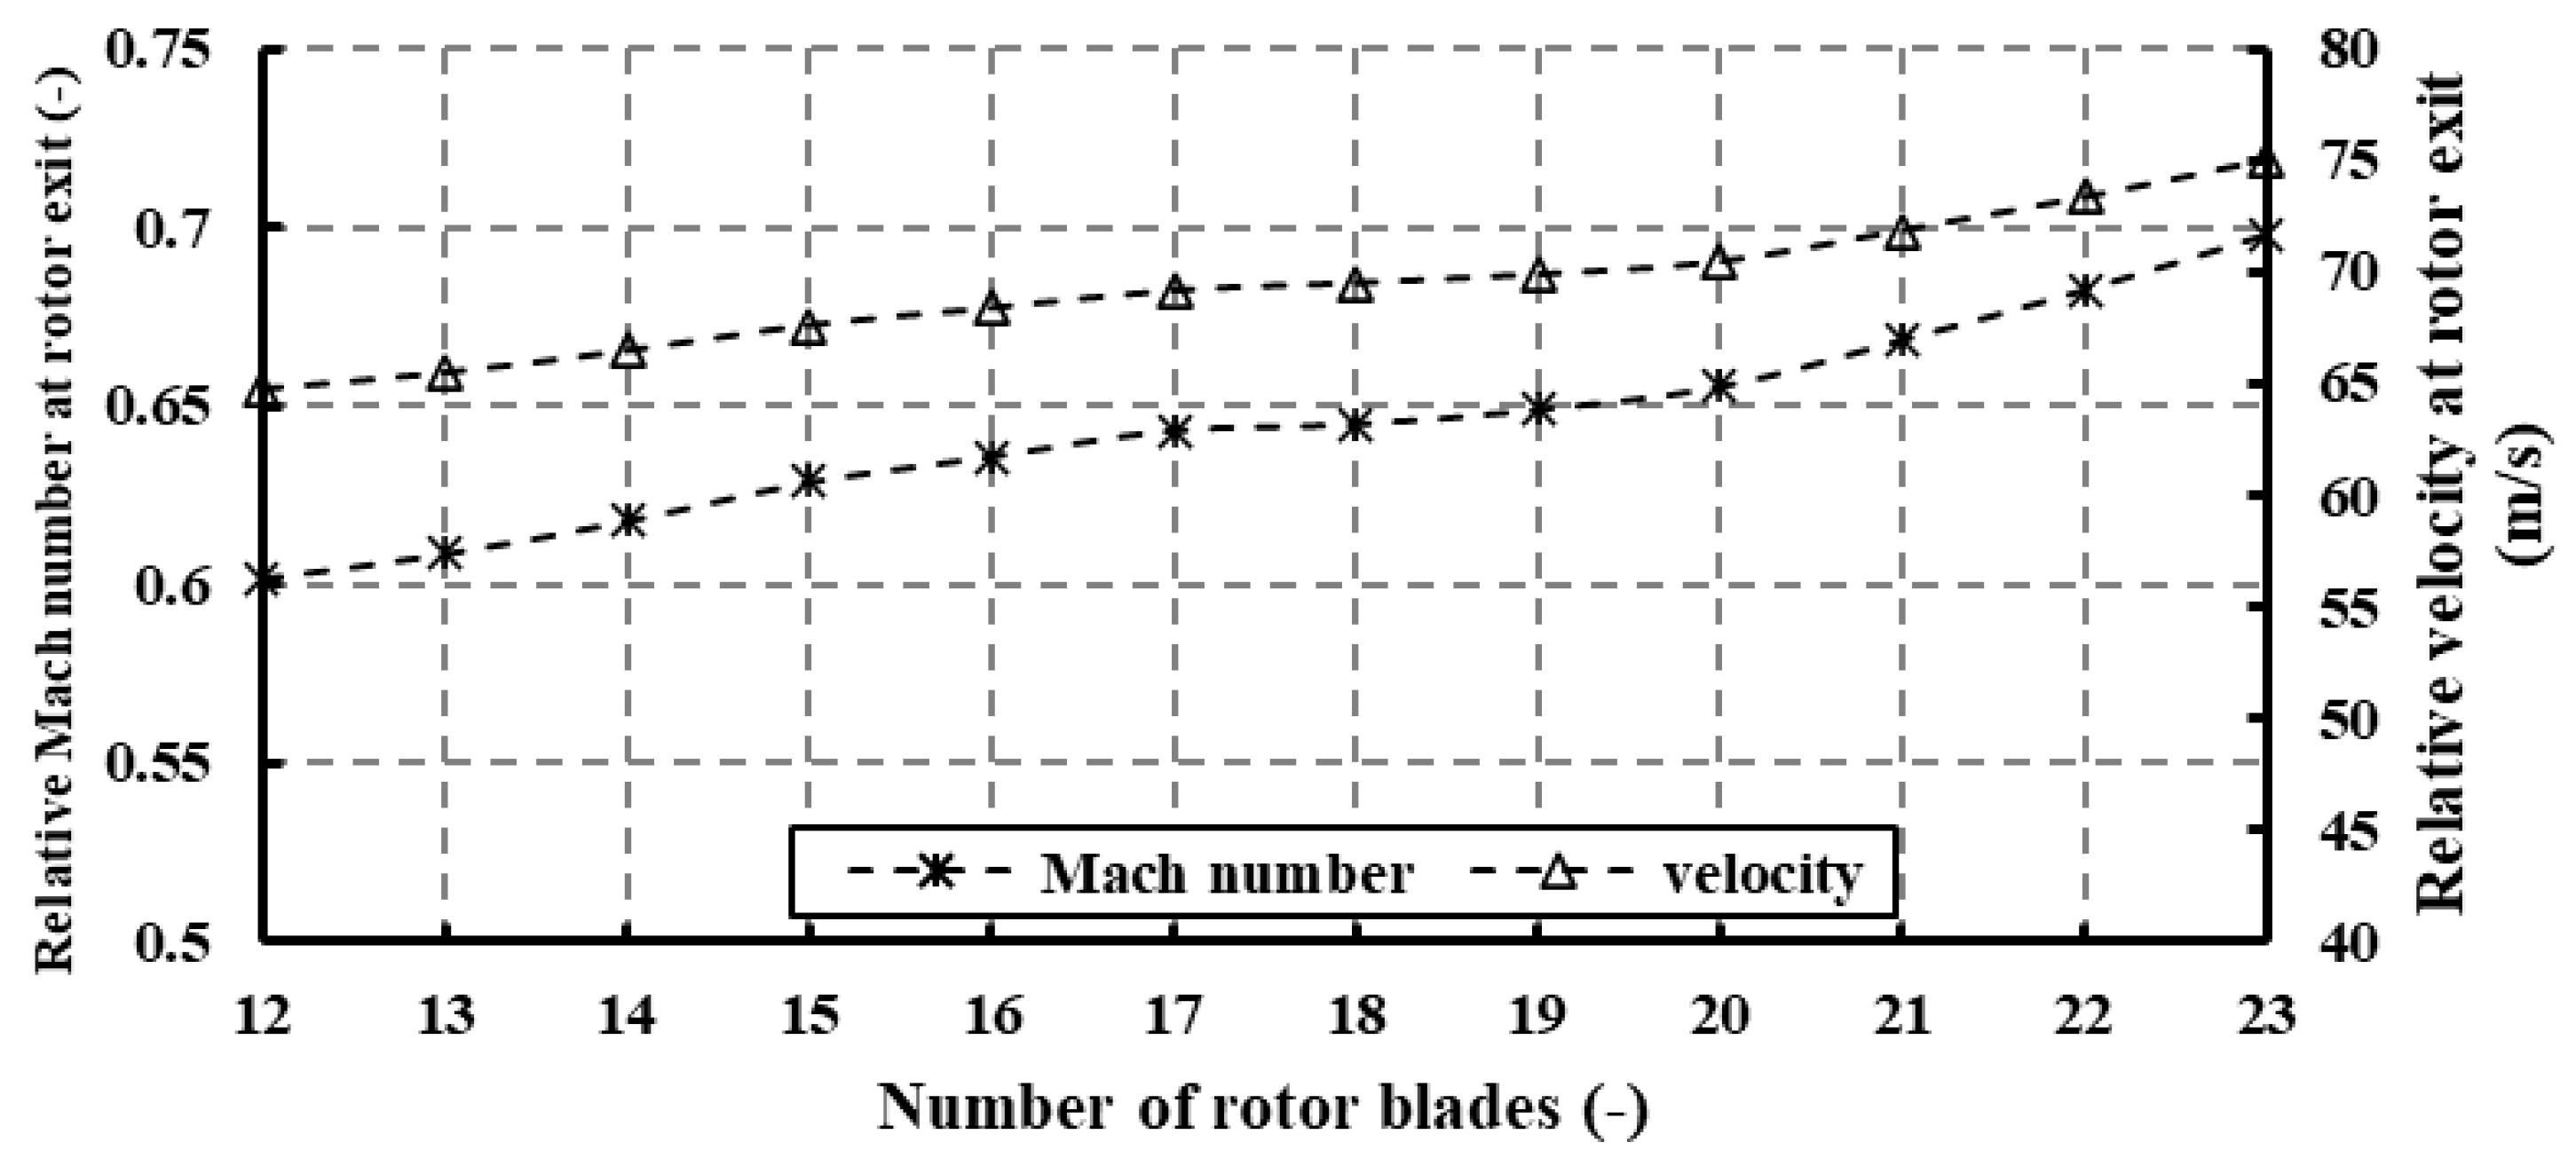
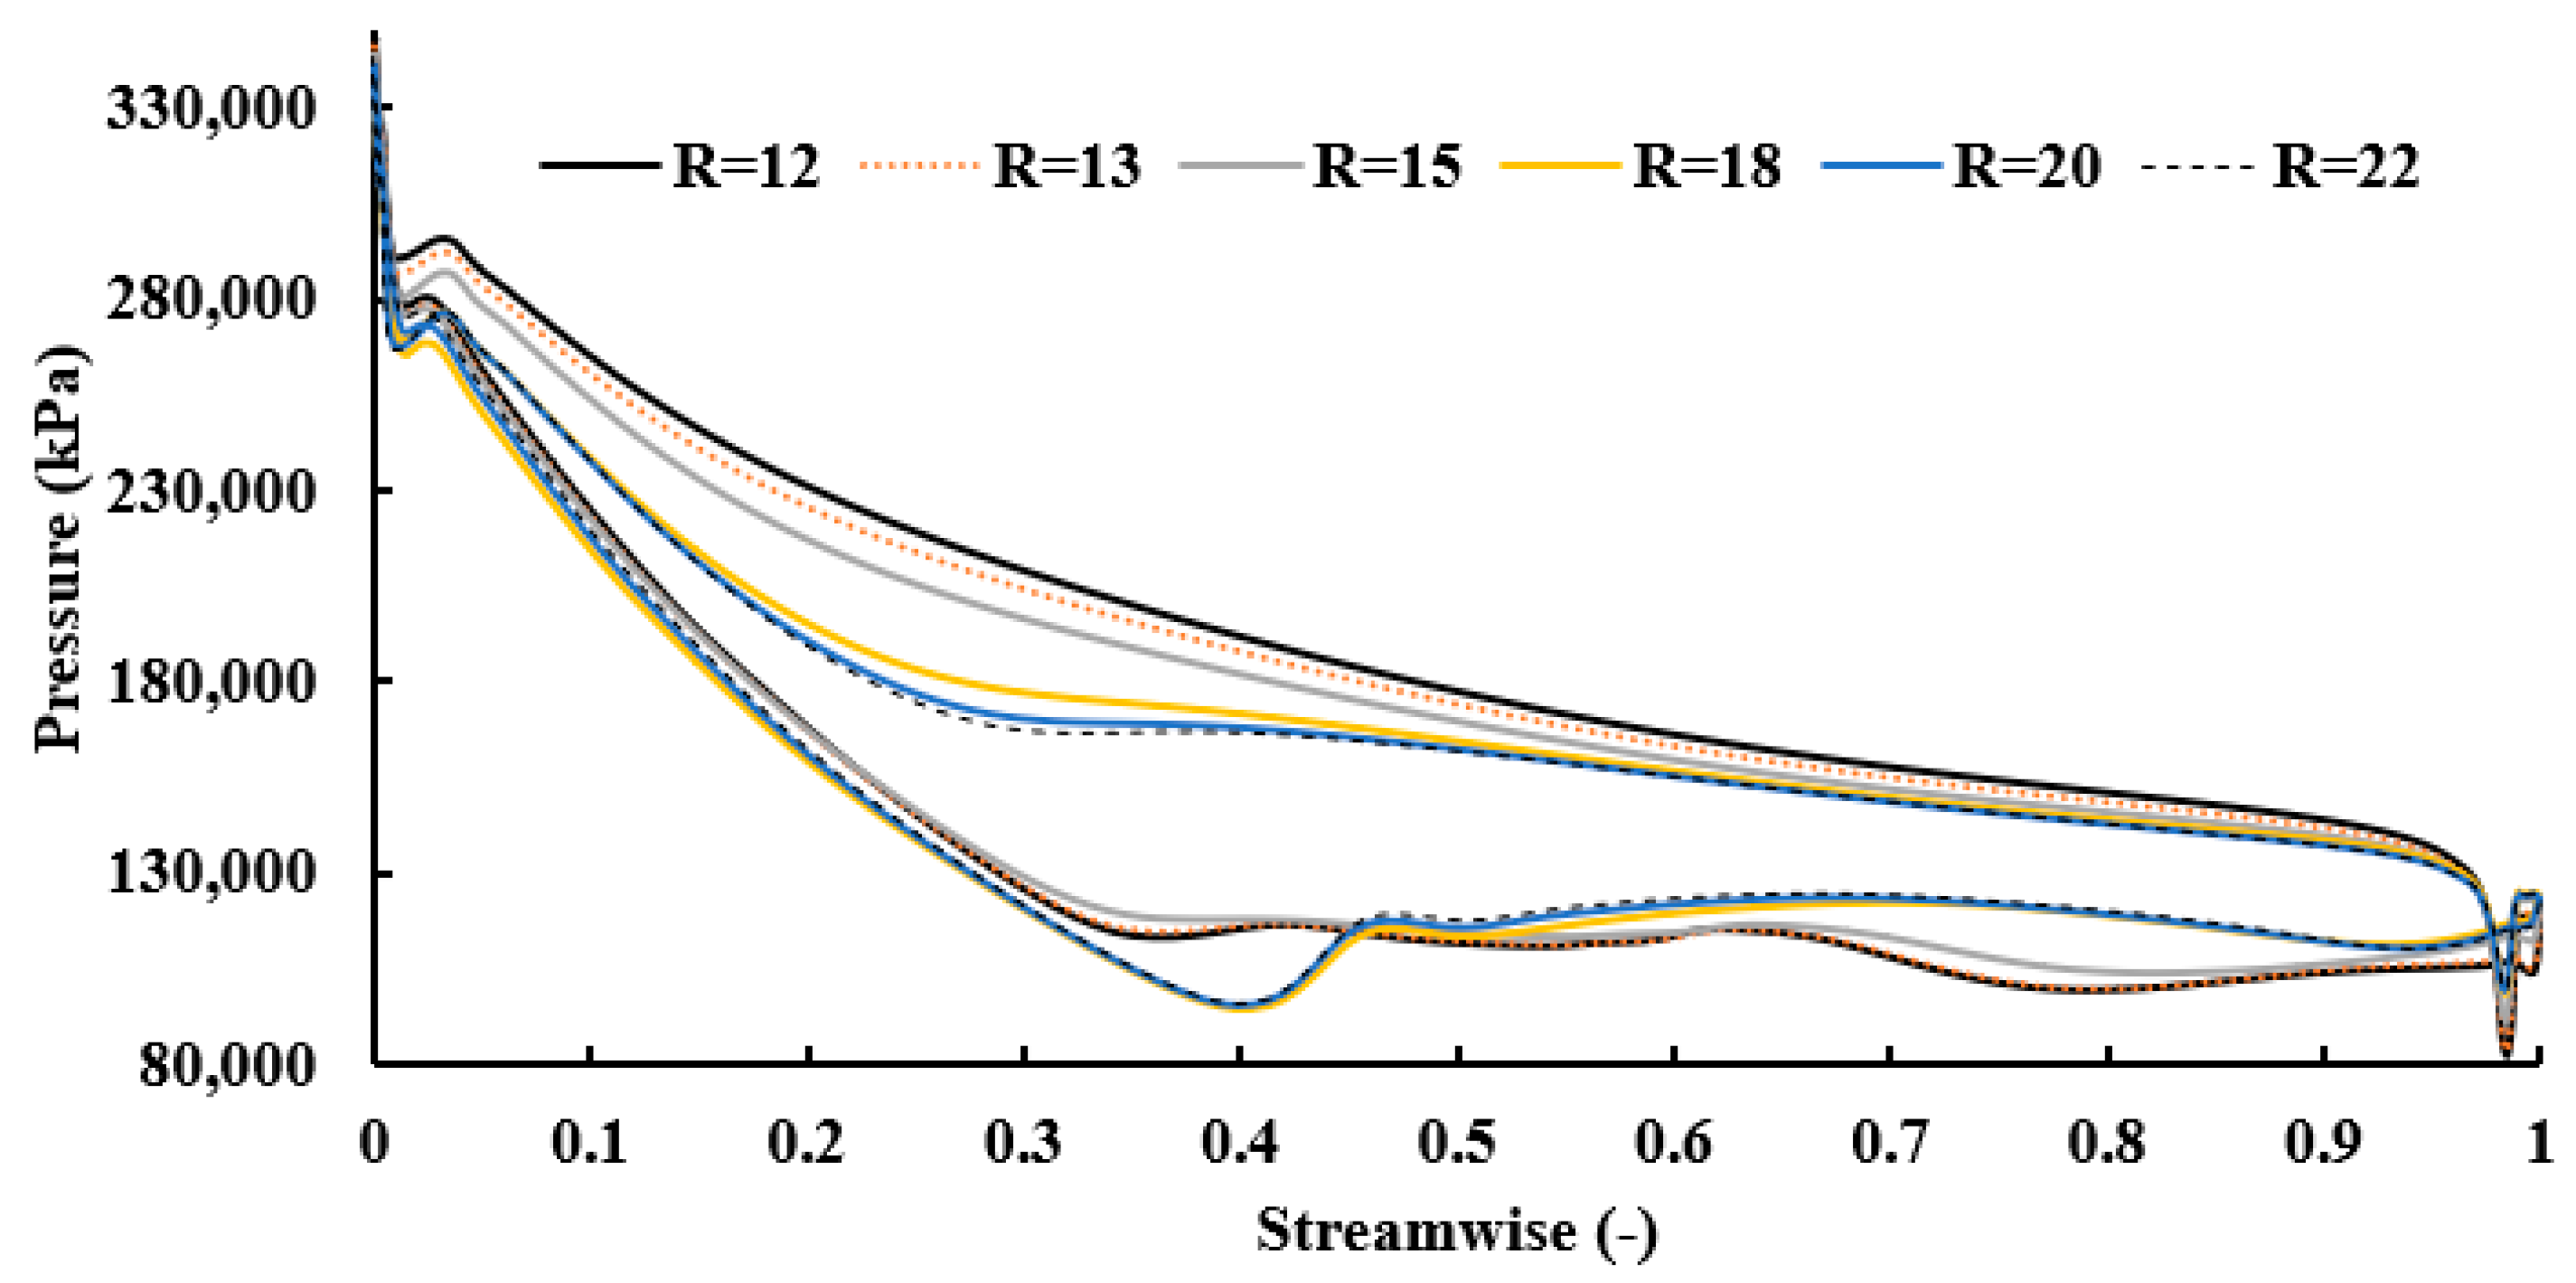
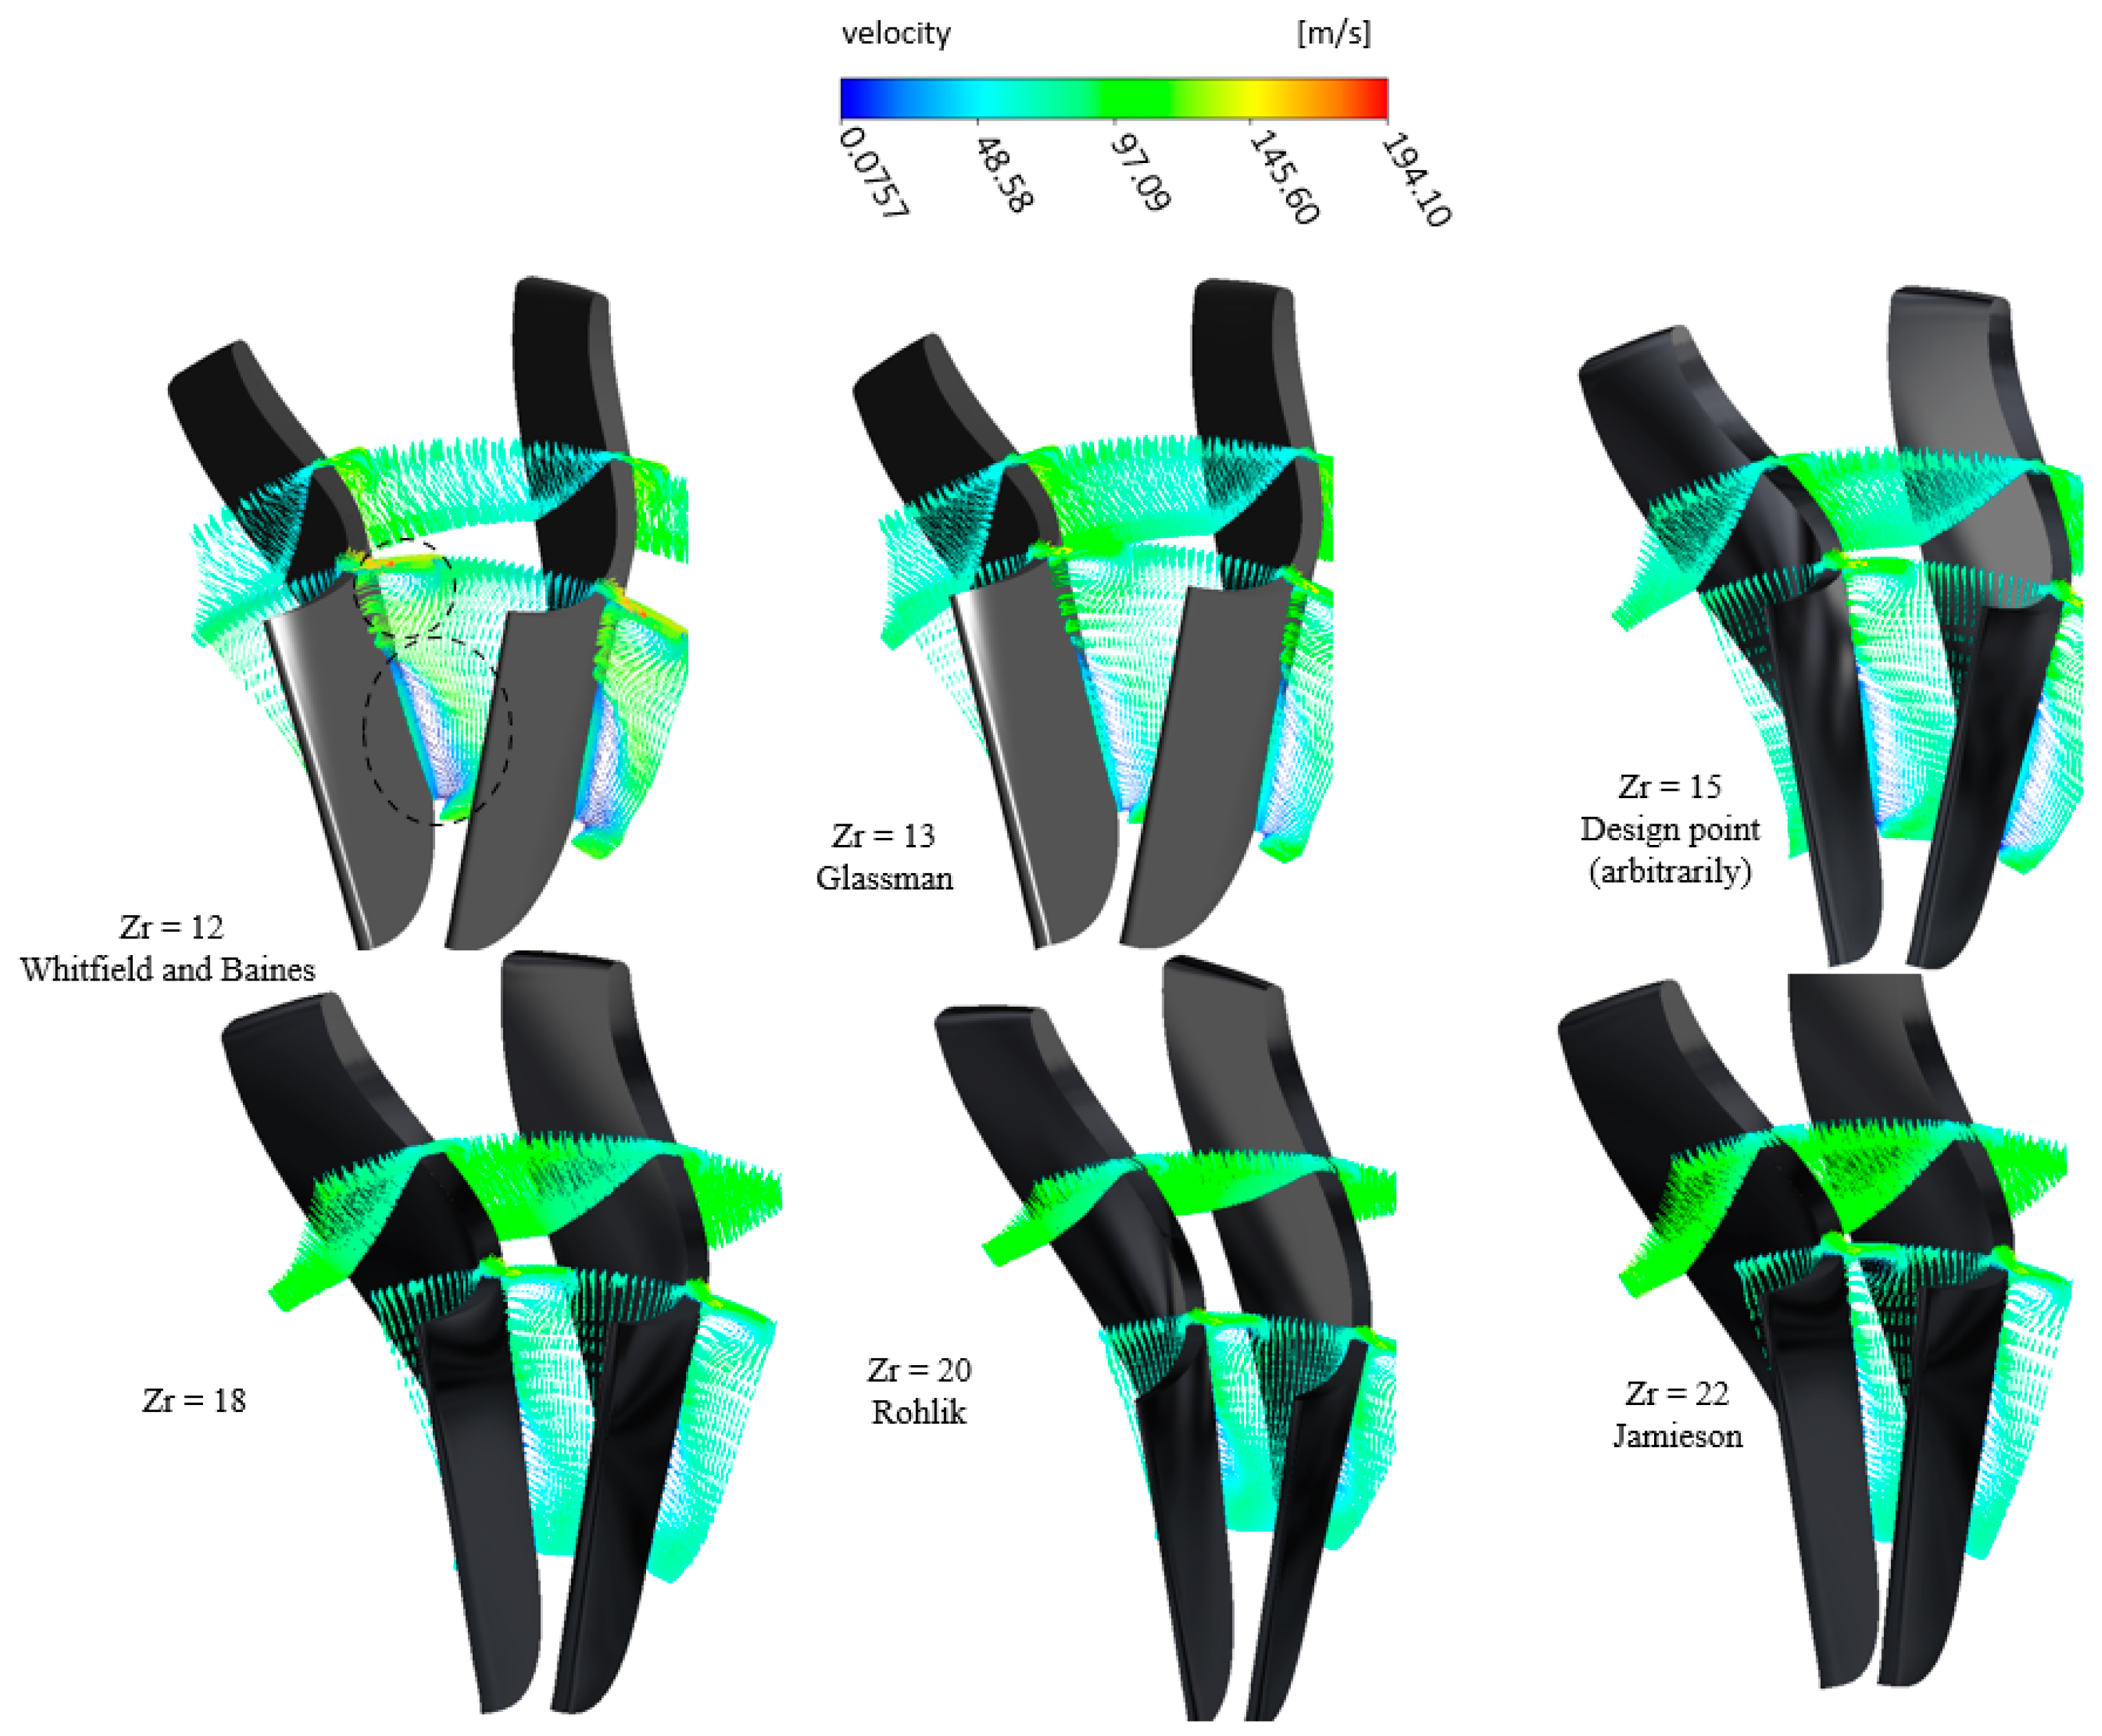
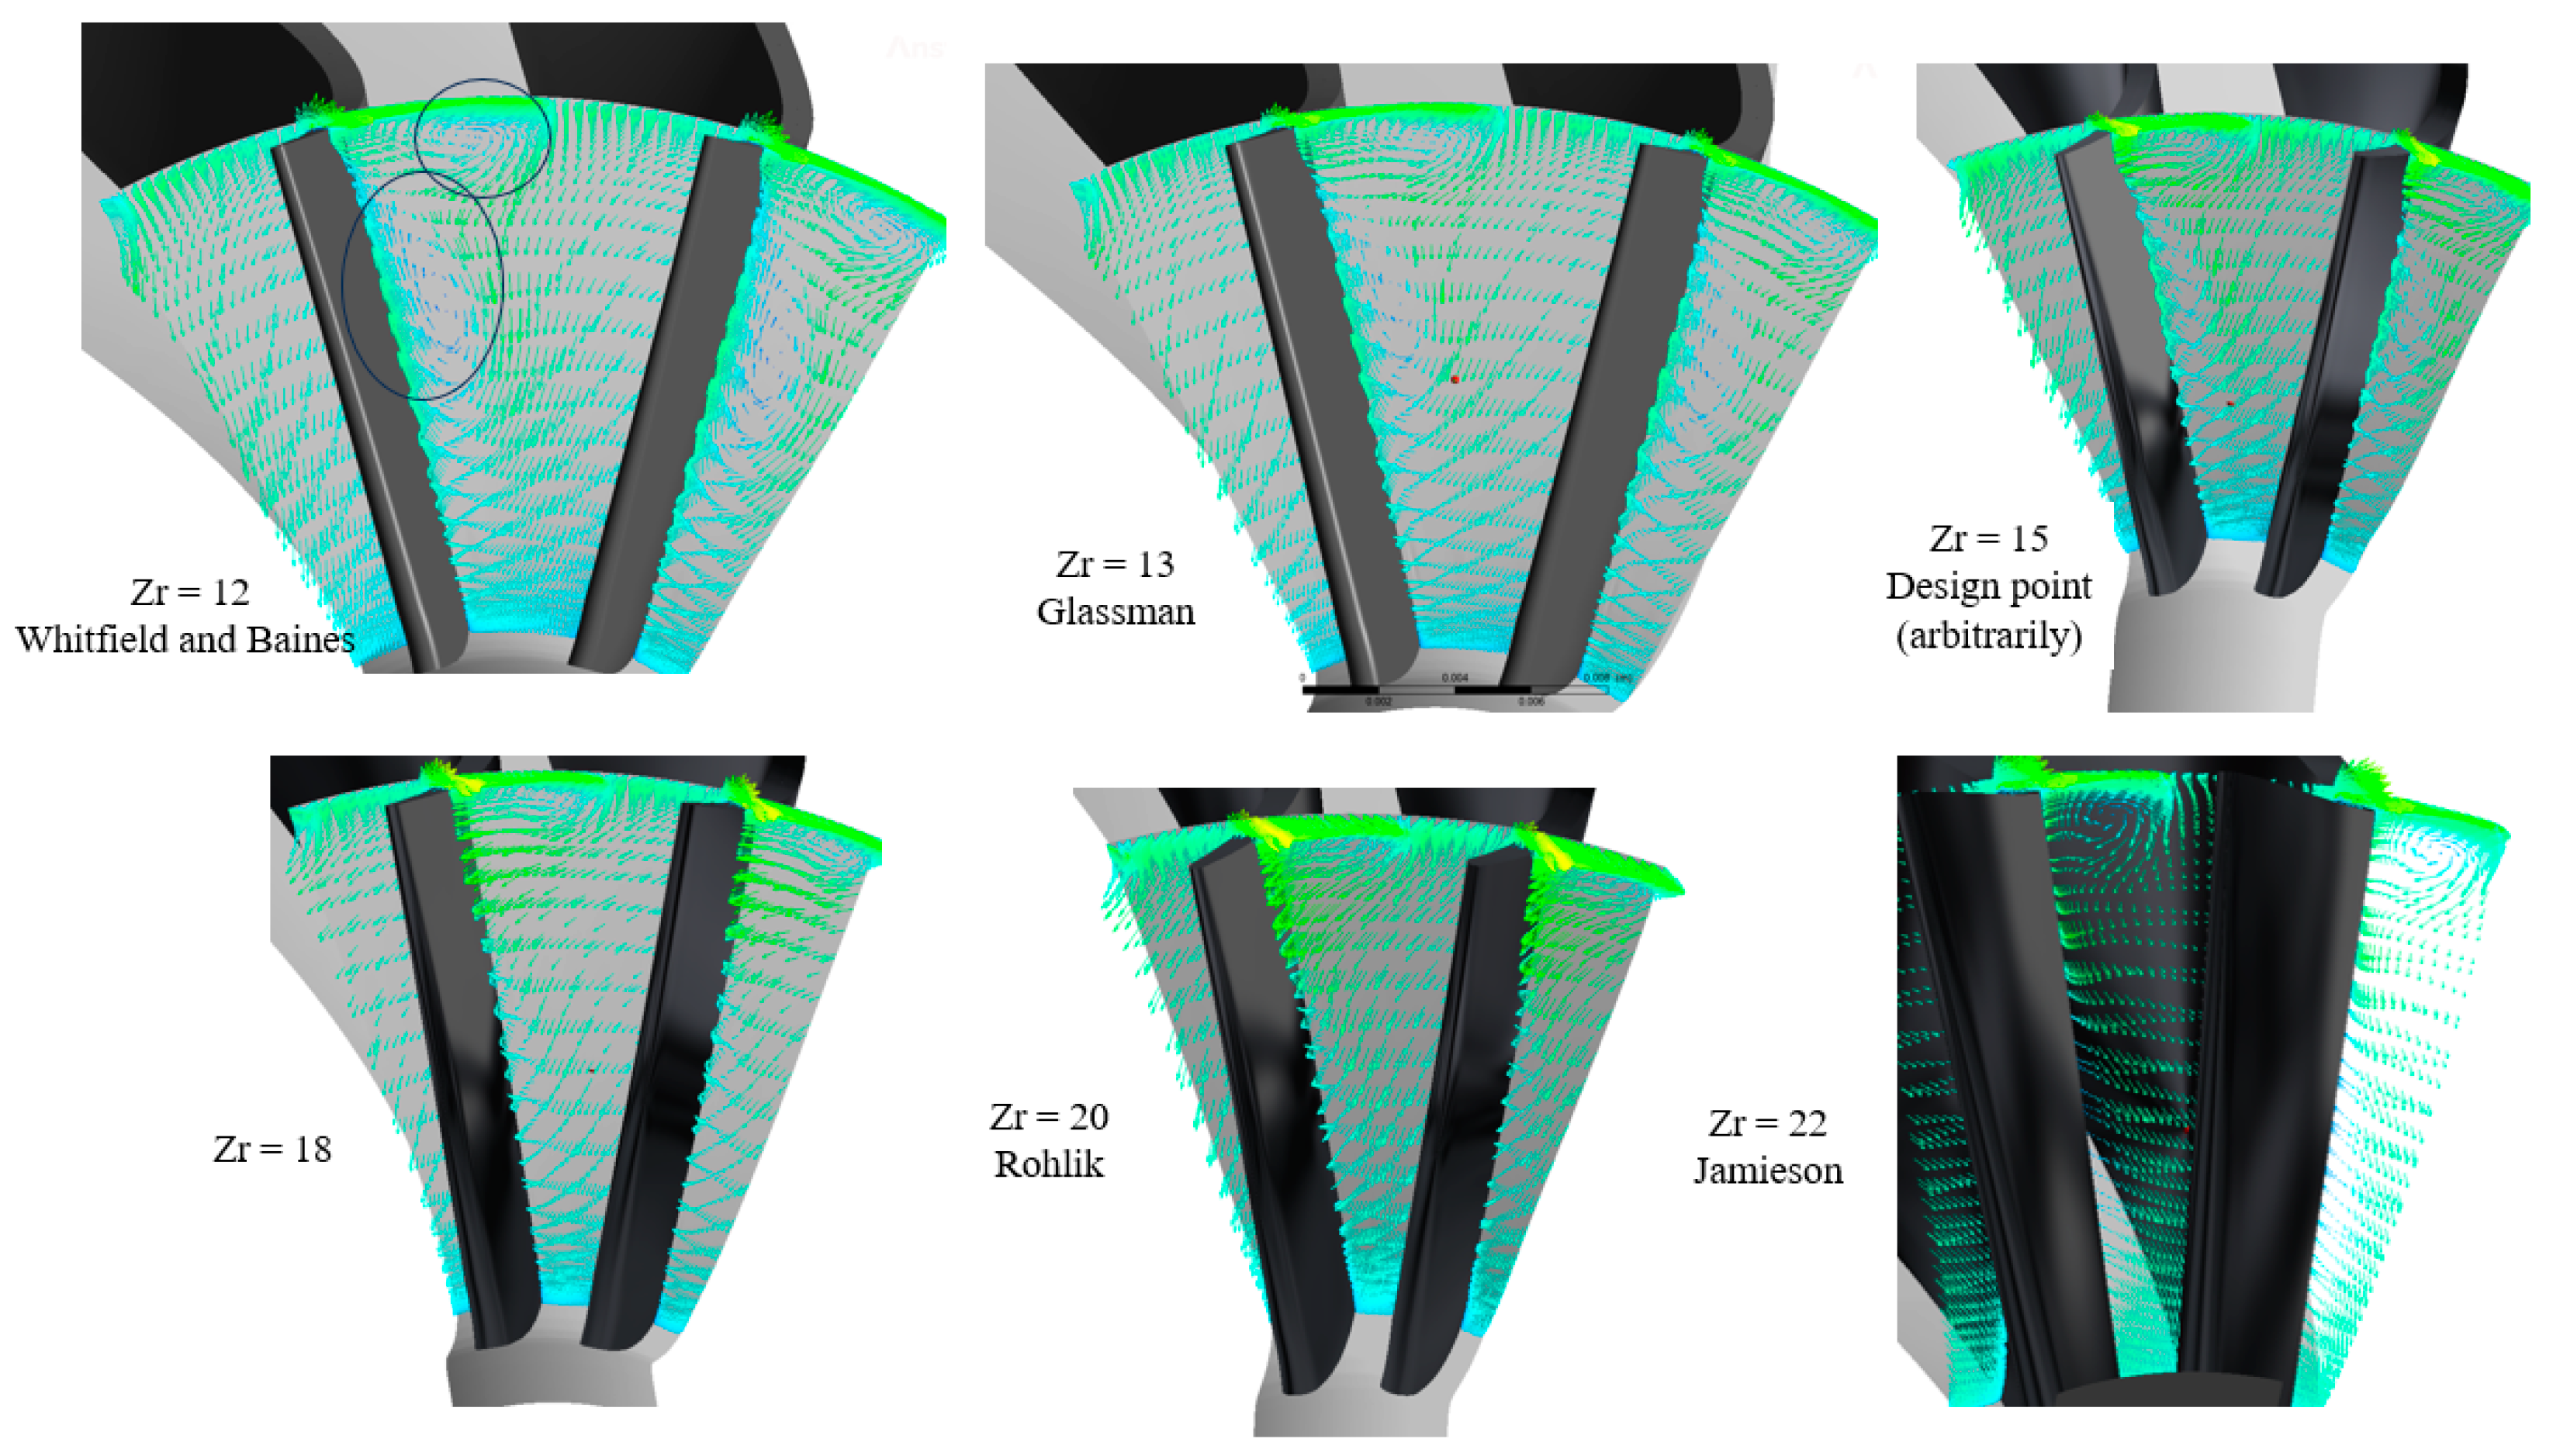
4.2.2. Impact of Blade Number on Flow Regime

It is essential to visualize the flow pattern within the rotor blades, in order to provide valuable insights into how the fluid interacts with the rotor blades. Figure 22 illustrates the blade loading for different blade numbers at 50% of the blade span. As depicted, low blade numbers suffer from high blade loading. Generally, the pressure distribution in the suction side decreases with a reduction in the number of blades, especially after 50% of the streamwise length. While a reduction in pressure is observed from the blade inlet to its exit, suboptimal blade geometry is evident from the presence of localized pressure drops near the trailing edge. This proximity to the trailing edge renders the region more prone to flow vortices. The extent of low-pressure areas expands with an augmentation in blade number, up to 15 blades, after which it diminishes with further increments in blade number.
Figure 23 illustrates the effect of blade number ( Z r ) on the pressure distribution in a radial turbine nozzle. The pressure contours show variations from high (red) to low (blue) as the flow expands through the vanes. Different blade numbers ( Z r = 12 to 22) are based on design recommendations from various researchers. Increasing Z r results in narrower passages, affecting flow acceleration, pressure drop, and efficiency. Lower Z r may lead to higher losses due to wider passages, while excessive Z r can cause increased frictional losses. Optimizing Z r is crucial for balancing aerodynamic performance and efficiency in turbine design.
The illustration presented in Figure 24 portrays the fluid velocity under varying blade numbers. As the flow converges towards the throat, particularly with fewer blades, pronounced flow reversals occur along the suction side and proximally to the blade tip, which are primarily attributed to diminished flow velocities in these regions. With an escalation in the number of blades, flow uniformity improves progressively. Additionally, Figure 25 delineates velocity vector distributions near the blade exit, revealing significant vortices on the suction side in scenarios with fewer blades. These vortices attenuate with the inclusion of additional blades. However, with 22 blades, a resurgence of vortices is observed near the blade tip.

4.3. Impact of Blade and Vane Numbers on Cycle Performance

Figure 26 and Figure 27 depict the effects of varying blade and vane numbers on cycle net power and thermal efficiency. As indicated in Equation (5), the thermal efficiency of the cycle is directly proportional to the net power output of the cycle, which, in turn, correlates with the power output of the turbine. It is worth noting that the heat input in the evaporator Q E ˙ is fixed for the various number of blades and vanes, since it is related to the input conditions.
Figure 26 indicates that both cycle net power and thermal efficiency follow the trend of the turbine power output discussed in Figure 19. With an increase in the number of blades, both the net power and thermal efficiency experience a rise, reaching peak values of 13.49 kW and 6.98%, respectively, when employing 21 blades. Subsequently, they decline to 13.34 kW and 6.9% with 23 blades. Raising the blade count from 12 to 21 results in a simultaneous increase of 7.9% in both the net power and thermal efficiency of the cycle.
Likewise, Figure 27 illustrates that the cycle’s net power and thermal efficiency exhibit a parallel trend to the turbine power as the vane number varies. The highest values of net power and thermal efficiency, recorded at 17.15 kW and 8.90%, respectively, correspond to 11 stator vanes. However, increasing the vane number from 11 to 20 leads to a notable 40.43% reduction in both cycle net power and thermal efficiency.

4.4. Flow Regime, Turbine Performance, and Cycle Performance

According to the findings delineated in the preceding sections, the most favourable combination of stator and vane quantities consists of 11 vanes and 20 blades, adhering to Rohlik’s correlation. The presence of 11 vanes proves effective in directing the flow at an appropriate angle of incidence, thereby ensuring minimal Mach numbers upon the flow’s exit from the vane structure, as shown in Figure 28. In the optimal configuration, a maximum Mach number of 1.6 is achieved, contrasting with the 1.9 Mach number associated with a configuration of 11 vanes and 15 blades, as illustrated in Figure 17. Figure 29 illustrates the streamline utilizing the optimal combination, demonstrating a seamless fluid flow from the vane inlet to the rotor exit. Meanwhile, Figure 30 portrays a nearly uniform pressure decline from the stator inlet to the rotor exit, signifying the efficacy of the optimal stator–rotor configuration in attaining the necessary pressure ratio across the turbine stage. Table 9 presents the potential enhancement in the overall system’s performance through the utilization of the optimal vane–rotor configuration. Substantial improvements are observed in turbine power, turbine efficiency, and thermal efficiency, with values reaching 16 kW, 77%, and 9%, respectively.
The findings of this research offer valuable insights for advancing waste heat recovery technologies through organic Rankine cycles (ORCs). By refining the configuration of rotor blades and stator vanes in radial inflow turbines, this study highlights notable enhancements in turbine performance, efficiency, and overall thermal effectiveness. These advancements play a crucial role in supporting the expanding field of sustainable energy solutions, particularly for industrial applications with significant waste heat potential. For example, adopting the proposed optimal configuration (11 vanes and 20 blades) at the Ha’il Cement Company could result in tangible energy savings and lower greenhouse gas emissions, aligning with global objectives for energy efficiency and decarbonization. Although the study provides an in-depth analysis utilizing 3D CFD modelling, certain limitations warrant consideration. Firstly, the findings are based on simulations validated against a single experimental dataset. While the results show strong agreement with the experimental data, further experimental validation across diverse operational conditions would enhance the robustness of the conclusions. Secondly, the study focuses on a specific working fluid (NOVEC 649) and operational parameters representative of the Ha’il Cement Company. The applicability of the results to other working fluids or systems operating under substantially different conditions, such as lower pressure ratios or alternative heat sources, remains unclear and requires further investigation.

5. Conclusions

ORC systems serve as prevalent waste heat recovery mechanisms in diesel engines, distinguished by their elevated temperatures and pressures. Within the array of ORC components, the radial inflow turbine holds particular importance, as it is tasked with power generation. This research examined the conventional correlations that are typically employed to ascertain the optimal stator vane and rotor blade numbers for radial inflow turbines operating with air. The study evaluated how well these correlations apply to ORC radial turbines that use organic fluids rather than air. The correlations were scrutinized across various pressure ratios by means of 3D CFD, encompassing a range of turbine configurations, with vane numbers spanning from 9 to 20 and blade numbers spanning from 12 to 23. The following conclusions can be drawn from the results:
  • At high pressure ratios, augmenting the number of stator vanes adversely affects the overall system performance, owing to the heightened stator losses. Nonetheless, when stator vane numbers are exceedingly low, the system experiences suboptimal operation, due to elevated Mach numbers and flow reversal. The turbine with 11 vanes demonstrates enhancements in turbine power, efficiency, and thermal efficiency by 34.8%, 4.17%, and 35.16%, respectively, compared to that with 17 vanes.
  • On the contrary, augmenting the number of rotor blades initially improves system performance up to a specific threshold, after which it diminishes at excessively high blade numbers, attributed to heightened rotor losses. Compared to the other traditional correlations, the Rohlik correlation with 20 blades yields optimal outputs of 13.54 kW turbine power, 75% turbine efficiency, and 6.98% thermal efficiency. The Whitefield and Baines correlation with 12 blades demonstrates the minimum outputs of 12.42 kW turbine power, 68.81% turbine efficiency, and 6.40% thermal efficiency.
  • Rotor losses vary as the number of rotor blades increases, with incidence loss being predominant, followed by passage loss, while trailing edge loss remains relatively minor.
  • In small-to-medium organic Rankine cycle applications operating under high pressure ratios, the integration of 11 vanes and 20 blades is advantageous for achieving enhanced performance and flow characteristics. The configuration of 11 vanes and 20 blades yields a turbine power of 16 kW, a turbine efficiency of 77%, and a thermal efficiency of 9% for the current application.
In the future, the performance of the optimized turbine configuration with other organic fluids will be considered. Moreover, transient CFD simulations will be employed to enhance the understanding of dynamic flow phenomena and further optimize turbine design.

Author Contributions

Conceptualization, F.A.; data curation, F.A. and A.A.; formal analysis, F.A.; funding acquisition, F.A.; investigation, F.A., A.S.A. and A.A.; methodology, F.A., A.S.A. and A.A.; project administration, F.A.; resources, A.S.A. and A.A.; software, F.A. and A.A.; supervision, F.A.; validation, F.A. and A.S.A.; visualization, F.A.; writing—original draft, F.A.; writing—review and editing, A.S.A. and A.A. All authors have read and agreed to the published version of the manuscript.

Funding

This research has been funded by a Scientific Research Deanship at University of Ha’il, Saudi Arabia, through project number (RCP-24 130).

Data Availability Statement

Data will be available upon request.

Conflicts of Interest

The authors declare no conflicts of interest.

Nomenclature

VariableSubscript
aspeed of sound0stagnation/total
bblade height1–7states through the cycle
Cspeed1–5states through the turbine
Cnchord lengthactactual
henthalpyCcondenser
m ˙ mass flow rateEevaporator
MMach numberisisentropic
othroat openingmmeridional
Ppressurennozzle
PRpressure ratioPpump
Q ˙ heat transferTturbine
rradiusththermal
snvane pitch Greek symbol
Utip speedαabsolute angle
W ˙ powerȠefficiency
Wrelative velocityρdensity
Z n nozzle vane numberσsolidity
Z r rotor blade numberωrotational speed
Abbreviations
COcarbon monoxide
NOxnitrogen oxides
ORCorganic Rankine cycle
PMparticulate matter

References

  1. Sanabria, E.; Maldonado, M.; Matiz, C.; Ribeiro, A.C.F.; Esteso, M.A. Methods of Capture and Transformation of Carbon Dioxide (CO2) with Macrocycles. Processes 2025, 13, 117. [Google Scholar] [CrossRef]
  2. Mikky, Y.A.; Bhran, A.A.; El-Araby, R.Y.; Mohamed, A.M.A.; Gadallah, A.G.; Shoaib, A.M. Optimization of Biodiesel–Nanoparticle Blends for Enhanced Diesel Engine Performance and Emission Reduction. Processes 2024, 12, 2471. [Google Scholar] [CrossRef]
  3. Özyalcin, C.; Sterlepper, S.; Roiser, S.; Eichlseder, H.; Pischinger, S. Exhaust gas aftertreatment to minimize NOX emissions from hydrogen-fueled internal combustion engines. Appl. Energy 2024, 353, 122045. [Google Scholar] [CrossRef]
  4. Dang, H.; Han, Y. Research on the Performance Characteristics of a Waste Heat Recovery Compound System for Series Hybrid Electric Vehicles. Processes 2024, 12, 605. [Google Scholar] [CrossRef]
  5. Corigliano, O.; Algieri, A.; Fragiacomo, P. Turning Data Center Waste Heat into Energy: A Guide to Organic Rankine Cycle System Design and Performance Evaluation. Appl. Sci. 2024, 14, 6046. [Google Scholar] [CrossRef]
  6. Yang, S.; Liang, A.; Jin, Z.; Xie, N. Investigation of a Cogeneration System Combining a Solid Oxide Fuel Cell and the Organic Rankine Cycle: Parametric Analysis and Multi-Objective Optimization. Processes 2024, 12, 2873. [Google Scholar] [CrossRef]
  7. Feng, J.; Cheng, X.; Yan, Y.; Zhao, L.; Dong, H. Thermodynamic and thermo-economic analysis, performance comparison and parameter optimization of basic and regenerative organic Rankine cycles for waste heat recovery. Case Stud. Therm. Eng. 2023, 52, 103816. [Google Scholar] [CrossRef]
  8. Rybiński, W.; Maurin, A.; Krzemianowski, Z.; Bykuć, S. Similarity Model of a Rotary Lobe Expander Working with Various Fluids. Appl. Sci. 2025, 15, 120. [Google Scholar] [CrossRef]
  9. Feng, J.; Cheng, X.; Wang, H.; Zhao, L.; Wang, H.; Dong, H. Performance analysis and multi-objective optimization of organic Rankine cycle for low-grade sinter waste heat recovery. Case Stud. Therm. Eng. 2024, 53, 103915. [Google Scholar] [CrossRef]
  10. Wang, H.-X.; Lei, B.; Wu, Y.-T.; Yang, P.-H.; Zhang, X.-M. Regulation strategies and optimizations of the expander and pump in organic Rankine cycle under off-design conditions. Appl. Therm. Eng. 2025, 259, 124807. [Google Scholar] [CrossRef]
  11. Witanowski, Ł. Numerical Investigation of Multi-Stage Radial Turbine Performance Under Variable Waste Heat Conditions for ORC Systems. Appl. Sci. 2024, 14, 11600. [Google Scholar] [CrossRef]
  12. Senyuk, M.; Beryozkina, S.; Safaraliev, M.; Nadeem, M.; Odinaev, I.; Kamalov, F. Methodology for Transient Stability Enhancement of Power Systems Based on Machine Learning Algorithms and Fast Valving in a Steam Turbine. Mathematics 2024, 12, 1644. [Google Scholar] [CrossRef]
  13. Guendaoui, S.; El Ouadefli, L.; El Akkad, A.; Elkhalfi, A.; Vlase, S.; Scutaru, M.L. Comparative Analysis of NURBS and Finite Element Method in Computational Fluid Dynamics Applications: Case Study on NACA 2412 Airfoil Aerodynamics. Mathematics 2024, 12, 3211. [Google Scholar] [CrossRef]
  14. Ariga, I.; Watanabe, I.; Fujie, K. Investigations Concerning Flow Patterns Within the Impeller Channels of Radial-Inflow Turbines, With Some Reference to the Influence of the Splitter Vanes. J. Eng. Power 1967, 89, 463–476. [Google Scholar] [CrossRef]
  15. Denton, J.D. The turboexpander a design, make and test student project. In Proceedings of the ASME 1996 International Gas Turbine and Aeroengine Congress and Exhibition, GT 1996, Birmingham, UK, 10–13 June 1996; Volume 5. [Google Scholar] [CrossRef]
  16. Watanabe, I.; Ando, T. Experimental study on radial turbine, with special reference to the influence of the number of impeller blades on performance characteristics. Bull. JSME 1959, 2, 457–462. [Google Scholar] [CrossRef]
  17. Chen, H.; Abidat, M.; Baines, N.C.; Firth, M.R. The Effects of Blade Loading in Radial and Mixed Flow Turbines. In Proceedings of the ASME 1992 International Gas Turbine and Aeroengine Congress and Exposition, Cologne, Germany, 1–4 June 1992. [Google Scholar]
  18. 3M Science Applied to Life. Organic Fluids. Available online: https://www.3m.com/ (accessed on 5 February 2018).
  19. Karvountzis-Kontakiotis, A.; Pesiridis, A.; Zhao, H.; Alshammari, F.; Franchetti, B.; Pesmazoglou, I.; Tocci, L. Effect of an ORC Waste Heat Recovery System on Diesel Engine Fuel Economy for Off-Highway Vehicles. SAE Tech. Pap. 2017-01-0136 2017. [Google Scholar] [CrossRef]
  20. Alshammari, F.; Elashmawy, M.; Ben Hamida, M.B. Effects of working fluid type on powertrain performance and turbine design using experimental data of a 7.25ℓ heavy-duty diesel engine. Energy Convers. Manag. 2021, 231, 113828. [Google Scholar] [CrossRef]
  21. Jamieson, A.W.H. ‘The Radial Turbine’, Gas Turbine Principles and Practice; Roxbee-Cox: Birmingham, UK, 1955. [Google Scholar]
  22. Glassman, A. Computer Program for Design Analysis of Radial-Inflow Turbines; NASA: Washington, DC, USA, 1976.
  23. Whitfield, A.; Baines, N.C. Design of Radial Turbomachines; Longman Scientific and Technical: Harlow, UK, 1990. [Google Scholar]
  24. Rohlik, H.E. Analytical Determination of Radial Inflow Turbine Design Geometry for Maximum Efficiency; TN D-4384; NASA: Washington, DC, USA, 1968.
  25. Simpson, J.; Spence, A.; Watterson, S. Numerical and Experimental Study of the Performance Effects of Varying Vaneless Space and Vane Solidity in Radial Inflow Turbine Stators. In Proceedings of the ASME Turbo Expo 2008: Power for Land, Sea and Air GT2008, Berlin, Germany, 9–13 June 2008. [Google Scholar]
  26. Alshammari, F.; Karvountzis-Kontakiotis, A.; Pesyridis, A.; Alatawi, I. Design and study of back-swept high pressure ratio radial turbo-expander in automotive organic Rankine cycles. Appl. Therm. Eng. 2020, 164, 114549. [Google Scholar] [CrossRef]
  27. Zheng, Y.; Hu, D.; Cao, Y.; Dai, Y. Preliminary design and off-design performance analysis of an Organic Rankine Cycle radial-inflow turbine based on mathematic method and CFD method. Appl. Therm. Eng. 2017, 112, 25–37. [Google Scholar] [CrossRef]
  28. Rahbar, K.; Mahmoud, S.; Al-Dadah, R.K.; Moazami, N. Modelling and optimization of organic Rankine cycle based on a small-scale radial inflow turbine. Energy Convers. Manag. 2015, 91, 186–198. [Google Scholar] [CrossRef]
  29. Al Jubori, A.M.; Al-Mousawi, F.N.; Rahbar, K.; Al-Dadah, R.; Mahmoud, S. Design and manufacturing a small-scale radial-inflow turbine for clean organic Rankine power system. J. Clean. Prod. 2020, 257, 120488. [Google Scholar] [CrossRef]
  30. Ventura, C.A.; Jacobs, P.A.; Rowlands, A.S.; Petrie-Repar, P.; Sauret, E. Preliminary design and performance estimation of radial inflow turbines: An automated approach. J. Fluids Eng. 2012, 134, 031102. [Google Scholar] [CrossRef]
  31. Wu, T.; Shao, L.; Wei, X.; Ma, X.; Zhang, G. Design and structure optimization of small-scale radial inflow turbine for organic Rankine cycle system. Energy Convers. Manag. 2019, 199, 111940. [Google Scholar] [CrossRef]
  32. Barsi, D.; Perrone, A.; Ratto, L.; Simoni, D.; Zunino, P. Radial inflow turbine design through multi-disciplinary optimisation technique. In Proceedings of the ASME Turbo Expo, Montreal, QC, Canada, 15–19 June 2015; Volume 8, pp. 1–12. [Google Scholar] [CrossRef]
  33. Kim, D.-Y.; Kim, Y.-T. Preliminary design and performance analysis of a radial inflow turbine for organic Rankine cycles. Appl. Therm. Eng. 2017, 120, 549–559. [Google Scholar] [CrossRef]
  34. Noughabi, A.K.; Sammak, S. Detailed design and aerodynamic performance analysis of a radial-inflow turbine. Appl. Sci. 2018, 8, 2207. [Google Scholar] [CrossRef]
  35. Han, Z.; Jia, X.; Li, P. Preliminary design of radial inflow turbine and working fluid selection based on particle swarm optimization. Energy Convers. Manag. 2019, 199, 111933. [Google Scholar] [CrossRef]
  36. Nithesh, K.; Chatterjee, D. Numerical prediction of the performance of radial inflow turbine designed for ocean thermal energy conversion system. Appl. Energy 2016, 167, 1–16. [Google Scholar] [CrossRef]
  37. Sarmiento, A.L.E.; Camacho, R.G.R.; de Oliveira, W. Performance analysis of radial-inflow turbine of ORC: New combined approach of preliminary design and 3D CFD study. J. Mech. Sci. Technol. 2020, 34, 2403–2422. [Google Scholar] [CrossRef]
  38. Li, X.; Lv, C.; Yang, S.; Li, J.; Deng, B.; Li, Q. Preliminary design and performance analysis of a radial inflow turbine for a large-scale helium cryogenic system. Energy 2019, 167, 106–116. [Google Scholar] [CrossRef]
  39. De Servi, C.M.; Burigana, M.; Pini, M.; Colonna, P. Design method and performance prediction for radial-inflow turbines of high-temperature mini-organic rankine cycle power systems. J. Eng. Gas Turbines Power 2019, 141, 091021. [Google Scholar] [CrossRef]
  40. Hu, D.; Li, S.; Zheng, Y.; Wang, J.; Dai, Y. Preliminary design and off-design performance analysis of an Organic Rankine Cycle for geothermal sources. Energy Convers. Manag. 2015, 96, 175–187. [Google Scholar] [CrossRef]
  41. Demierre, J.; Rubino, A.; Schiffmann, J. Modeling and experimental investigation of an oil-free microcompressor-turbine unit for an organic rankine cycle driven heat pump. J. Eng. Gas Turbines Power 2015, 137, 032602. [Google Scholar] [CrossRef]
  42. Da Lio, L.; Manente, G.; Lazzaretto, A. A mean-line model to predict the design efficiency of radial inflow turbines in organic Rankine cycle (ORC) systems. Appl. Energy 2017, 205, 187–209. [Google Scholar] [CrossRef]
  43. Zhou, A.; Song, J.; Li, X.; Ren, X.; Gu, C. Aerodynamic design and numerical analysis of a radial inflow turbine for the supercritical carbon dioxide Brayton cycle. Appl. Therm. Eng. 2018, 132, 245–255. [Google Scholar] [CrossRef]
  44. Lee, S.; Yaganegi, G.; Mee, D.J.; Guan, Z.; Gurgenci, H. Part-load performance prediction model for supercritical CO2 radial inflow turbines. Energy Convers. Manag. 2021, 235, 113964. [Google Scholar] [CrossRef]
  45. Schuster, S.; Markides, C.N.; White, A.J. Design and off-design optimisation of an organic Rankine cycle (ORC) system with an integrated radial turbine model. Appl. Therm. Eng. 2020, 174, 115192. [Google Scholar] [CrossRef]
  46. Alshammari, F.; Alghafis, A.; Alatawi, I.; Alshammari, A.S.; Alzamil, A.; Alrashidi, A. Potential of Variable Geometry Radial Inflow Turbines as Expansion Machines in Organic Rankine Cycles Integrated with Heavy-Duty Diesel Engines. Appl. Sci. 2023, 13, 12139. [Google Scholar] [CrossRef]
  47. Alshammari, F.; Pesyridis, A. Experimental study of organic Rankine cycle system and expander performance for heavy-duty diesel engine. Energy Convers. Manag. 2019, 199, 111998. [Google Scholar] [CrossRef]
  48. Hagen, B.A.; Agromayor, R.; Nekså, P. Equation-oriented methods for design optimization and performance analysis of radial inflow turbines. Energy 2021, 237, 121596. [Google Scholar] [CrossRef]
  49. Alshammari, F.; Pesyridis, A.; Elashmawy, M. Turbine optimization potential to improve automotive Rankine cycle performance. Appl. Therm. Eng. 2021, 186, 116559. [Google Scholar] [CrossRef]
  50. Uusitalo, A.; Grönman, A. Analysis of radial inflow turbine losses operating with supercritical carbon dioxide. Energies 2021, 14, 3561. [Google Scholar] [CrossRef]
  51. Lemmon, E.; Huber, M.; McLinden, M. NIST Standard Reference Database 23: Reference Fluid Thermodynamic and Transport Properties-REFPROP, Version 9.0; National Institute of Standards and Technology, Standard Reference Data Program: Gaithersburg, MD, USA, 2010.
  52. ANSYS Inc. ANSYS CFX-Solver Theory Guide, Release 18.0; ANSYS Inc.: Canonsburg, PA, USA, 2018. [Google Scholar]
  53. Menter, F.R. Two-equation eddy-viscosity turbulence models for engineering applications. AIAA J. 1994, 32, 1598–1605. [Google Scholar] [CrossRef]
  54. Simpson, A.T.; Spence, S.W.T.; Watterson, J.K. A Comparison of the Flow Structures and Losses Within Vaned and Vaneless Stators for Radial Turbines. J. Turbomach. 2009, 131, 31010–31015. [Google Scholar] [CrossRef]
  55. Savcı, İ.H.; Şener, R.; Duman, I. A study of signal noise reduction of the mass air flow sensor using the flow conditioner on the air induction system of heavy-duty truck. Flow Meas. Instrum. 2022, 83, 102121. [Google Scholar] [CrossRef]
Figure 1. Schematic of typical engine organic Rankine cycle system.
Processes 13 00500 g001
Figure 2. Three-dimensional turbine stage (left) and its meridional view (right).
Processes 13 00500 g002
Figure 3. Main parameters of nozzle vane.
Processes 13 00500 g003
Figure 4. Flow losses within rotor blade.
Processes 13 00500 g004
Figure 5. BladeGen software to generate 3D rotor blade (left) and nozzle vane (right).
Processes 13 00500 g005
Figure 6. Mesh independence of 3D CFD model.
Processes 13 00500 g006
Figure 7. Meshing of rotor blade and stator vane with 1 × 10 6 elements.
Processes 13 00500 g007
Figure 8. Number of blades as a function of rotor inlet flow angle for different correlations.
Processes 13 00500 g008
Figure 9. Generated stator with different numbers of vanes.
Processes 13 00500 g009
Figure 10. Effects of nozzle vane number on inlet mass flow rate for different pressure ratios (15 rotor blades and 40,000 rpm).
Processes 13 00500 g010
Figure 11. Effects of nozzle vane number on turbine power output for different pressure ratios (15 rotor blades and 40,000 rpm).
Processes 13 00500 g011
Figure 12. Effects of nozzle vane number on nozzle exit Mach number for different pressure ratios (15 rotor blades and 40,000 rpm).
Processes 13 00500 g012
Figure 13. Stator loss coefficients for different pressure ratios (15 rotor blades and 40,000 rpm).
Processes 13 00500 g013
Figure 14. Effects of nozzle vane number on isentropic efficiency for different pressure ratios (15 rotor blades and 40,000 rpm).
Processes 13 00500 g014
Figure 15. Distribution of static pressure for different vanes with PR = 6.9 (15 rotor blades and 40,000 rpm).
Processes 13 00500 g015
Figure 16. Velocity contours and streamlines for different vanes with PR = 6.9 (15 rotor blades and 40,000 rpm).
Processes 13 00500 g016
Figure 17. Distribution of Mach numbers for different vanes with PR = 6.9 (15 rotor blades and 40,000 rpm).
Processes 13 00500 g017
Figure 18. Generated rotor with different numbers of blades.
Processes 13 00500 g018
Figure 19. Effects of rotor blade number on (a) isentropic efficiency and (b) turbine power output for different pressure ratios (17 stator vanes and 40,000 rpm); (c) focused view of (a,b) at PR = 6.9.
Processes 13 00500 g019
Figure 20. Distribution of rotor losses at PR = 6.9 (17 stator vanes and 40,000 rpm).
Processes 13 00500 g020
Figure 21. Effects of rotor blade number on relative Mach number and relative velocity at PR = 6.9 (17 stator vanes and 40,000 rpm).
Processes 13 00500 g021
Figure 22. Blade loading at PR = 6.9 with different numbers of blades (17 stator vanes and 40,000 rpm).
Processes 13 00500 g022
Figure 23. Pressure distribution for different numbers of blades with PR = 6.9 (17 vanes, 40,000 rpm).
Processes 13 00500 g023
Figure 24. Velocity streamlines for different numbers of blades with PR = 6.9 (17 vanes, 40,000 rpm).
Processes 13 00500 g024
Figure 25. Flow recirculation near rotor exit for different numbers of blades with PR = 6.9 (17 vanes, 40,000 rpm).
Processes 13 00500 g025
Figure 26. Cycle net power and thermal efficiency for different blade numbers with PR = 6.9 (17 vanes, 40,000 rpm).
Processes 13 00500 g026
Figure 27. Cycle net power and thermal efficiency for different vane numbers with PR = 6.9 (15 blades, 40,000 rpm).
Processes 13 00500 g027
Figure 28. Mach number distribution with 11 vanes and 20 blades at 50% span.
Processes 13 00500 g028
Figure 29. Velocity streamlines with 11 vanes and 20 blades at 50% span.
Processes 13 00500 g029
Figure 30. Pressure distribution with 11 vanes and 20 blades at 50% span.
Processes 13 00500 g030
Table 2. Characteristics of diesel engine from Cement Company in Ha’il city.
ParameterValueParameterValue
Displaced Volume7230 ccNumber of Cylinders6
Stroke135 mmNumber of Valves4
Bore110 mmMaximum Torque1200 Nm @ 1600–1700 RPM
Compression Ratio18.5:1Maximum Power205 kW @ 2400 RPM
Table 3. Summary of organic Rankine cycle modelling, Alshammari et al. [47].
ComponentEquationEquation #Comments
Evaporator Q E ˙ = m w f ˙ h 1 h 7 (1) Q E ˙ is the heat transfer in the evaporator, in kW.
Turbine W T ˙ = m w f ˙ h 1 h 5 (2) W T ˙ is the turbine power output, in kW.
Condenser Q C ˙ = m w f ˙ h 5 h 6 (3) Q C ˙ is the heat transfer in the condenser, in kW.
Pump W P ˙ = m w f ˙ h 7 h 6 (4) W P ˙ is the pump power output, in kW.
- η t h = W T ˙ W P ˙ Q E ˙ = 1 Q C ˙ Q E ˙ (5) η t h is the cycle’s thermal efficiency.
Table 4. Summary of radial inflow turbine modelling [26].
EquationEquation #Comments
Ψ = h a c t U 4 2 = h a c t ( ω r 4 ) 2 (6)Calculate the tip speed,   U 4
r 4 = U 4 ω (7)Calculate the rotor radius, r 4
C m 5 = C m 4 1 + 5 b 4 r 4 2 (8)Calculate the meridional speed, C m 5 , and complete the velocity triangles
m ˙ w f = 2 π r 4 ρ 4 b 4 C m 4 (9)Calculate the rotor blade height, b 4
r 3 r 4 = b 3 c o s α 3 + α 4 2 (10)Calculate the stator vane radius, r 3
m ˙ w f = 2 π r 3 ρ 3 b 3 C m 3 (11)Calculate the stator vane height, b 3
o 3 = s v s i n α 3       f o r       M 3 < 1 o 3 = C m 3 ρ 3 ρ * a *       f o r       M 3 1 (12)Calculate the stator vane throat, o 4
Table 5. Input conditions for system, as provided by industrial partner.
ParameterUnitValue
Turbine inlet temperatureK471.55
Turbine inlet pressurekPa900
Working fluid mass flow ratekg/s0.92
Turbine exit pressurekPa130
Turbine speedrpm40,000
Table 6. Output parameters of radial turbine model.
ParameterSymbolUnitValue
Nozzle inlet radius r 2 cm4.28
Nozzle throat opening o n cm0.158
Nozzle exit radius r 3 cm3.43
Nozzle inlet flow angle α 2 Degree68.8
Nozzle exit flow angle α 3 Degree73.6
Nozzle exit Mach number M 3 -1.9
Nozzle exit total pressure P 03 KPa1622
Nozzle exit total temperature T 03 K470
Nozzle exit total enthalpy h 03 KJ/Kg471
Rotor inlet radius r 4 cm3.29
Rotor inlet blade height b 4 cm0.34
Rotor axial length z cm1.97
Rotor inlet tip speed U 4 m/s137
Rotor inlet relative speed W 4 m/s96
Rotor exit radius r 5 cm2.42
Rotor exit absolute speed C 5 m/s82
Rotor exit Mach number M 4 -0.78
Rotor exit total pressure P 05 KPa178
Rotor exit total temperature T 05 K439
Rotor exit total enthalpy h 05 KJ/Kg452
Table 7. Validation of CFD approach against experimental results.
ParameterTest [47]CFDDeviation (%)
T 05 (°C)176.49183.53.97
m ˙   (kg/s)0.430.455.12
η i s 35%36.404
W T ˙ 9.509.884
Table 8. Number of rotor blades and stator vanes for different correlations.
Blade Number CorrelationValueVane Number CorrelationValue
Jamieson [21]22Simpson et al. [25]19
Glassman [22]13 Z n   = Z r + 2 *
Whitfield and Baines [23] 12 Z n   = Z r + 3 *
Rohlik [24]20Input (design point)17
Input (design point)15
* This value varies according to the utilized rotor correlation.
Table 9. Optimum overall performance considering optimum vane–rotor configuration.
ParameterUnitValue
Turbine powerkW16
Turbine efficiency%77
Cycle thermal efficiency%9
Disclaimer/Publisher’s Note: The statements, opinions and data contained in all publications are solely those of the individual author(s) and contributor(s) and not of MDPI and/or the editor(s). MDPI and/or the editor(s) disclaim responsibility for any injury to people or property resulting from any ideas, methods, instructions or products referred to in the content.

