Abstract
Building the regional electricity spot market (RESM) in a representative area is an important move to promote the electricity market reform and new power system construction in China. In this paper, the RESM operation model and optimization method are established, which take into account the special power grid operation mechanism and market construction achievements in the provincial electricity spot market. Firstly, the influencing factors, core elements, market structure, and operation model of RESM construction in China are analyzed. Secondly, a bi-level optimization model of the RESM is established. The lower layer is the pre-clearing model of the provincial electricity spot market, which is used to optimize the unit combination strategy, considering unit operation constraints and power grid security constraints in the province. The upper layer is the optimization clearing model of the RESM, which is used to optimize the clearing price and adjust the unit operation strategy and inter-provincial electricity trading strategy, considering the security constraints of regional power grid tie lines. Finally, the RESM composed of power grids in the Yangtze River Delta region of China is simulated as an example. The analysis focuses on the operational state of the power grid after the operation of the RESM, considering its safety benefits, economic benefits, and environmental benefits. The optimization of the RESM can effectively solve the serious regional power grid congestion problem, which is achieved through the superposition and printing of pre-clearing results in various provinces, and the average daily cost of electricity purchasing in the region has been reduced by about CNY 11 million, while the annual cost has been reduced by about CNY 4 billion. In addition, the total carbon emissions have been reduced by 11,000 tons per day and 0.18 kg per kilowatt hour on average, and scenes without power abandonment account for more than 95% of the total scenes.
1. Introduction
The power supply and demand in China are generally in a reverse distribution. The power production bases are mainly located in the western and northern regions, while the power load center remains in the central and eastern regions, where it has been located for a long time. Judging from the distribution of power resources and the development trend of industrial structural adjustment in China, the scale and distance of power flows will further increase in the future, and the situation of a reverse distribution of power supply and demand will become more and more serious [1,2]. In order to alleviate the issues created by the gradual expansion of power supply and demand and realize the optimal allocation of power resources over a wide geographical range, it is necessary to carry out large-scale “trans-regional and inter-provincial” power transactions [3]. In order to promote the construction of a unified national electricity market system, give full play to the complementary role of large power grids, further expand the scale of cross-regional and inter-provincial market transactions, and guide the coordinated operation and integrated development of electricity markets at all levels (country, region, and province) [1,2], it is necessary to design an inter-provincial electricity spot market operation mechanism for regional interconnected power grids. In January 2024, a kick-off meeting of electricity market construction in the Yangtze River Delta was held in Shanghai, China, and the National Energy Administration of China announced the start of electricity market construction in the Yangtze River Delta. The Yangtze River Delta electricity market includes the power grids of 41 cities in Shanghai, Jiangsu, Zhejiang, and Anhui provinces. However, there are still difficulties in coordination between the regional spot electricity market, the existing inter-provincial power transmission and reception priority plan, and inter-provincial long-term transactions [4].
Against this background, it is necessary to analyze the practical problems involved in establishing an RESM in China and their causes, to put forward a regional market construction strategy suitable for China’s characteristics, and to establish a clearing model for an RESM with the coupling constraints of inter-provincial physical power flow and provincial market clearing. In this way, the clearing results of the regional spot electricity market can alleviate the risk of blockage of inter-provincial power grid tie lines, improve the rational distribution and sharing of power resources among regions, and provide reference suggestions for the construction of a regional spot electricity market and unified electricity market system in China.
1.1. Construction of RESM in China
In the context of the current energy transition and power sector reform in China, the development of the electricity spot market has become a crucial measure to promote the marketization of the power industry and facilitate efficient energy allocation. Recently, some progress has been made in developing the electricity spot market in China. Since 2017, the Chinese government has selected eight regions, including the China southern power grid, Inner Mongolia western power grid, Zhejiang, Shandong, Fujian, Sichuan, and Gansu, as the first batch of pilot projects for the electricity spot market. After several years of exploration and practice, these regions have gradually entered the stage of long-term settlement trial operations [5]. Subsequently, to further deepen the reform of the electricity market and expand the scope of the pilots, six provinces, namely Shanghai, Jiangsu, Anhui, Liaoning, Henan, and Hubei, were identified as the second batch of pilot projects for the electricity spot market [6]. They have successively initiated simulated trial operations, laying a solid foundation for formal operations. The selection of these pilot projects fully considered their geographical distribution, diversity of energy structures, and characteristics of electricity market demand, aiming to form a replicable and scalable mechanism for the electricity spot market through practical exploration.
Against this backdrop, the Chinese government has explicitly set the goal of establishing a unified nationwide electricity market system by 2025. This will achieve effective coordination between the national market and provincial/regional electricity markets, as well as the integrated design and joint operation of medium- and long-term electricity markets, spot markets, and ancillary service markets. By doing so, it seeks to enhance the market-based allocation efficiency of electricity resources across provinces and regions, promote the comprehensive participation of new energy sources, and improve their market competitiveness [7]. Besides this, the RESM is an important part of the national unified electricity spot market, and it is also an important form of transition from the provincial electricity spot market to the national unified electricity spot market [8,9,10,11,12,13,14,15], and the construction of RESM must be based on the construction achievements of the provincial electricity spot market at the present stage so as to avoid the waste of resources and ensure that the construction process of RESM does not deviate from the overall construction goal of national electricity.
- (1)
- Multi-level power dispatch management system and provincial-based responsibility for ensuring power supply and security in China
The power dispatching organization in China is structured into five levels. Specifically, the national, regional, and provincial power grid dispatching institutions are tasked with dispatching power transmission networks at corresponding levels. Municipal and county-level dispatching institutions are responsible for dispatching distribution networks at all levels. Regional dispatching institutions play a crucial role in maintaining the safe and stable operation of regional power grids, while provincial dispatching institutions are in charge of power balance within their respective provinces. Given this context, the existing global power market mechanisms cannot be seamlessly integrated with the power dispatching system in China. Consequently, when designing the RESM, it is essential to take into account the self-consistency and cooperation between market mechanism design and the power dispatching management system. Moreover, the provincial dispatching agencies prioritize ensuring the safe and reliable power supply within their provinces. Therefore, the provincial power grid actively participates in the construction of RESM only on the premise of guaranteeing their own power supply safety.
- (2)
- The construction of RESM is gradually promoted on the basis of the existing provincial power market construction achievements in China
Since 2017, when China announced the first batch of pilot provinces, the construction of provincial spot markets has been ongoing for six years. Currently, fourteen pilot provinces are steadily advancing with their construction, and nine provinces have been designated as key areas for promoting the spot market. This effort has generated remarkable economic benefits and achieved the rational allocation of resources. The construction of the regional market should not discard the completed provincial spot markets, as this would render a large amount of sunk costs irrecoverable and result in significant losses of humans and resources. Thus, when designing the RESM, it is necessary to take into account the existing achievements of provincial power market construction and the continuity of policies.
While addressing the above practical questions, the design of China’s regional electricity spot market needs to clarify the following core elements.
- (1)
- Connection between regional and provincial markets: Clearly define the interaction mechanisms and information-sharing channels between different-level markets to ensure coordinated market operation.
- (2)
- Optimization objectives of the regional market: Specify the optimization objectives of the regional market, such as maximizing economic benefits and facilitating the integration of renewable energy, to guide market design and operation.
- (3)
- Optimization Constraints of the regional market: Consider the operational constraints of the power system and the actual conditions of market participants, and establish appropriate market rules and constraints to guarantee the safe and stable operation of the market.
- (4)
- By clarifying the connection between regional and provincial markets, the optimization objectives of the regional market, and the constraints under the above mentioned circumstances, China’s regional electricity spot market can better adapt to the actual conditions of the Chinese electricity market and promote efficient operation and sustainable development of the electricity market.
1.2. Modeling and Optimization Methods for the RESM
The global development of the electricity spot market exhibits a diversified landscape. Different countries have developed their own market systems, tailored to their political, economic, and geographical characteristics. The United States, Northern Europe, and the United Kingdom (UK) are considered typical representatives of the spot electricity market, each with its distinct operation modes and market structures. Currently, there is no internationally applicable inter-provincial spot trading scheme that can be directly adopted in China. Specifically, the Pennsylvania–New Jersey–Maryland (PJM) electricity market in the United States [16,17] has a market scale and grid structure somewhat similar to that of the southern regional electricity market in China. However, the states in the United States enjoy a relatively high degree of independence. Most of their electricity supply and demand are balanced locally, resulting in a low demand for extensive energy allocation. Consequently, the PJM market is operated and dispatched by a single system operator without a multi-level dispatching structure, and a cross-regional transmission and trading system has not been established [18,19]. The regional electricity market in Northern Europe [20,21] has established a unified optimization clearance mechanism for cross-border electricity spot trading. Nevertheless, since congestion in the Nordic power system mainly occurs in cross-border and cross-regional areas, their clearance model does not account for fine-grained flow constraints within each region [22]. As such, it is not suitable for China’s regional electricity market, where congestion is a significant issue. Since 2005, the UK electricity spot market has undergone major reforms, aiming to create a unified and efficient electricity trading system [23]. These reforms include implementing a unified transaction, balance, and settlement mechanism; standardizing transmission pricing and power grid use rights contracts; and promoting market competition and the development of renewable energy. These measures have significantly reduced operating costs, broken market monopolies, and enhanced market competitiveness. Simultaneously, the reform has promoted the efficient utilization of renewable energy and cost reduction, steering the development of the UK electricity market in a more open, efficient, and sustainable direction [24,25].
In summary, the PJM market in the United States, the Nordic power market, and the UK power market each possess unique characteristics in terms of operational mechanisms, market structures, and trading modes. The PJM market emphasizes centralized trading and nodal pricing; the Nordic market focuses on cross-border trading and market integration, while the UK market relies primarily on bilateral contracts, supplemented by centralized trading. All three reflect the reform and development trajectories of power markets in different countries and regions. Therefore, the structural design of the unified spot electricity market system in the United States, Northern Europe, and the United Kingdom, which have leading power markets, is closely related to their respective institutional frameworks and cannot be replicated directly. Given the significant differences between Europe and the United States in power industry systems, market construction motivation, and objectives, especially in power dispatching management systems and other border conditions, simply emulating their structural design schemes in China is not viable. In a nutshell, the above-mentioned typical mature electricity market construction experiences do not align with the actual situation of regional electricity market construction in China.
In recent years, scholars have delved into the coordination between inter-provincial spot markets and provincial spot markets. Literature [26,27] proposes key issues and solutions for the coordinated operation of the inter-provincial and intra-provincial electricity spot markets in the future regional power grid, based on the current development status of the domestic spot market. It establishes an optimization and coordination mechanism between markets to promote orderly connection of multiple markets within and between provinces. Literature [28] uses Guangdong’s spot market pilot operations as a case study to evaluate the effectiveness of China’s electricity spot market using extensive ex-post market data. Literature [29] examines the impact of three electricity market structures, namely vertical monopoly, weak monopoly, and monopolistic competition, on promoting renewable energy through the actual data of the regional electricity market in Beijing–Tianjin–Tangshan areas. Literature [30] proposes a dual-layer model that incorporates the power exchange constraints of the sub-region. Its boundary conditions, based on the unit commitment results of each sub-region clearing model, are used for regional spot market clearing. To make full use of energy resources, multiple provincial-level power grids in China have engaged in inter-provincial electricity trading. Currently, research on the formation of inter-provincial electricity trading prices, trading mechanisms, and clearing models in China has gradually been conducted. Reference [31] introduces the trial operation and effectiveness of the inter-provincial electricity spot market since 2022 and analyzes the inter-provincial spot trading mechanism from the perspectives of market framework, clearing mechanism, and declaration mechanism. Reference [32] analyzes the advantages of a decentralized cross-provincial balanced market in reducing price distortions, allocating resources, maintaining electricity supply and demand balance at all times, and promoting the integration of renewable energy. Reference [33] proposes a two-stage market-clearing framework to promote inter-provincial electricity trading. In the first stage, pre-processing of the bidding curve is achieved. In the second stage, a two-layer model is established to describe the market-clearing process, including an upper-level model for inter-provincial transactions and a lower-level model for provincial transactions. Reference [34] proposes a provincial bi-level market-clearing decision-making model. The upper level optimizes the provincial market through a unilateral bidding model, minimizing the operating cost of the electricity market as the objective function. Meanwhile, the lower level optimizes power purchases by minimizing the cost of acquiring provincial renewable energy. To reduce the computational burden of the dual-level equilibrium model, reference [35] proposes a computationally efficient single-level equilibrium model in which producers/consumers offer/bid both energy and prices. Existing research on electricity spot market clearing has established provincial market-clearing models, and some studies have also developed bi-level clearing optimization models that consider both intra-provincial and inter-provincial electricity transactions. However, current models do not adequately consider several factors, such as the current state of China’s electricity spot market construction, the multi-level dispatch management system, provincial grid security assurance responsibilities, and inter-provincial grid coordination and optimization. The established models optimize unit operation strategies within the provincial market and adjust the interactive power between provincial grids during inter-provincial electricity transaction optimization, but they fail to adjust provincial unit operation strategies through inter-provincial grid optimization. As a result, these models cannot effectively address regional grid congestion and safe operation issues.
Generally speaking, the existing foreign electricity market system is not suitable for RESM construction in China. Moreover, the existing optimization model of the regional electricity market is typically a general model, which is simple and easy to solve but does not conform to the actual situation of RESM optimization in China. Existing clearing models mainly focus on specific scenarios, models, and trading technologies and do not consider the power system and demand of power security as a whole. Therefore, it is necessary to study a hierarchical optimization model based on RESM mechanism design to support the construction and efficient operation of the RESM in China.
1.3. The Work and Main Contributions of This Paper
To this end, taking into account the construction status of the RESM in China, this paper devises the RESM clearing and optimization mechanisms for the RESM at both provincial and regional levels. It constructs a hierarchical market-clearing model that takes into consideration the optimal unit commitment strategy in the provincial market and ensures the economic, safe, and low-carbon operation of the regional power grid. Additionally, a rapid solution method for the clearing model is proposed. Simulation analysis is then conducted based on the actual data of the RESM in the Yangtze River Delta of China. The main contributions of this paper are twofold:
- (1)
- A bi-level clearing framework and optimization model of RESM are developed. Given the unique challenges encountered in the construction of RESM in China, a bi-level clearing and operation optimization framework and model, namely, “pre-clearing in the provincial market + optimizing and adjusting in the regional market”, is put forward. The lower layer model serves as the pre-clearing model for the provincial electricity spot market. It optimizes the unit combination strategy while factoring in unit operation constraints and power grid security constraints within the province. The upper layer model is the optimization clearing model of RESM. It optimizes the clearing price and adjusts the unit operation strategy and inter-provincial electricity trading strategy, taking into account the security constraints of inter-provincial power grid tie lines.
- (2)
- The RESM composed of power grids in the Yangtze River Delta region of China is simulated as a case study. The analysis centers on the operational state of the power grid after the implementation of the RESM, evaluating its safety benefits, economic benefits, and environmental benefits. For safety benefits, the focus is on analyzing the number of line congestion periods, the number of congested lines, and the amount of line overflow. Economic benefits are assessed by examining the total electricity purchasing cost. Environmental benefits are analyzed through indicators such as carbon emissions per unit of electricity, the amount of renewable energy curtailment, and the curtailment rate of renewable energy.
The rest of this paper is organized as follows: Section 2 provides an introduction to the system structure and operation mechanism of RESM. Section 3 establishes the bi-level operation-optimization model of the regional electricity spot market. Section 4 details the model-solving method. Section 5 discusses the simulation results, and Section 6 presents the conclusions.
2. System Structure and Operation Mechanism of RESM
2.1. System Structure of RESM
The RESM studied in this paper is formed by the physical interconnection and coordinated operation of provincial electricity spot markets. The regional electricity spot market operator (RMO) serves as the organizer and operator of the RESM, while the provincial electricity spot market operator (PMO) acts as the actual participant. In the provincial electricity spot market, market participants include wind power, photovoltaic, hydropower (HP), and coal-fired power (CFP), as well as power wholesale users and power selling companies. The operating entity of the provincial electricity spot market is the pPMO. It is tasked with organizing power producers and consumers within the province to conduct market transactions locally and reporting the optimized unit commitment strategy and related optimization parameters to the RMO, the operator of the RESM. The RMO is responsible for the electricity clearing in RESM and adjusting the operation strategy based on the provincial quotation and power information submitted by the PMO, ensuring the economy and safe operation of the RESM. Figure 1 shows the system structure of RESM.
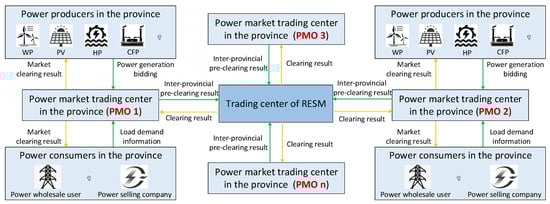
Figure 1.
System structure of RESM.
2.2. Key Influencing Factors: An Analysis of the RESM Design in China
To further clarify the practical issues and peculiarities in the process of RESM construction in China and provide a basis and support for the design of the RESM operation mechanism and the construction of the power clearing model, this section analyzes the impact of these peculiarities on the RESM construction. Based on the above analysis, this paper proposes a problem-solving strategy of “pre-clearing of provincial market + optimization and adjustment of inter-provincial market clearing”. Figure 2 shows the influence of the particularity on the RESM in China.
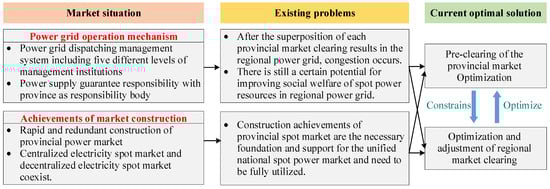
Figure 2.
Influence of the particularity on the RESM in China.
Considering that the superposition clearing of RMO after the PMO’s clearing will lead to severe congestion, security issues, and significant economic problems in the regional power grid, this paper innovatively introduces the concept of pre-clearing. Here, pre-clearing is defined as the decision-making process of the provincial market. In the electricity clearing strategy proposed in this paper, the PMO obtains the unit combination strategy within the province through pre-clearing optimization and reports it to the RMO. The RMO then determines the price based on the actual operation of the regional power grid, which is significantly different from existing RESM clearing models.
- (1)
- Impact analysis of the multi-level power dispatch management system and provincial-based responsibility for ensuring power supply and security
- (a)
- Impact analysis of the multi-level power dispatch management system
China’s power grid dispatch organizations are divided into five levels: the national power grid dispatch organization, cross-provincial/autonomous region/municipality power grid dispatch organization, provincial/autonomous region-/municipality-level power grid dispatch organization, municipal-level power grid dispatch organization, and county-level power grid dispatch organization. Among them, the national, regional, and provincial-level power grid dispatch organizations are responsible for the dispatch of various levels of transmission grids, while the municipal and county-level dispatch organizations are in charge of the dispatch of various levels of distribution grids. The regional dispatch organization ensures the safe and stable operation of the regional power grid, and the provincial dispatch organization is responsible for power balance within the province. The construction of spot markets needs to consider the coordination among the above three levels.
The national power grid dispatch organization is responsible for the safe operation of inter-provincial and inter-regional direct current (DC) transmission lines. The regional power grid dispatch organization is responsible for the safe operation of 500 kV alternating current (AC) transmission lines within the region. The provincial-level power grid is accountable for the safe operation of 220 kV AC transmission lines within the province.
Within a regional power grid, multiple provincial power grids are interconnected by AC transmission lines. As a result, the power flow of a province’s transmission lines is influenced not only by the generation output within that province but also by the generation output of other provinces in the region. After each province independently clears its market, the transmission lines may not experience congestion. However, when the power flows from various provinces are superimposed, new congestion may arise. This is because each province’s spot market-clearing process does not fully consider network constraints. Therefore, the regional market needs to conduct safety verification and congestion management of the market-clearing results of each province.
- (b)
- Impact analysis of the provincial-based responsibility for ensuring power supply and security
In China, each province bears the responsibility of ensuring a secure and reliable power supply within its own jurisdiction. This means that provinces should not compromise their own power supply safety to support regional development. Instead, they should prioritize their own power supply safety while engaging in mutual assistance and resource exchange with other provinces in the region.
To ensure the secure and reliable power supply, provinces should have the following rights:
Right A: The right to consider their own situations and define the overall framework for market supply, demand, import, and export. This requires each province to formulate reasonable import and export plans, ensuring that the power imported or exported is within an acceptable range. Each province’s power balance constraint should incorporate these import and export plans.
Right B: The right to decide the composition of their own generation units. Provinces need to determine the composition of their generation units in advance, report it to the regional level, and conduct market clearing within this framework, optimizing the output of the generation units. Meanwhile, the regional optimization objective function should not include the start-up and shutdown costs of the generation units.
Right C: The right to fix the output of certain generation units, restricting the number of generation units that can be optimized in the regional market.
In addition, these requirements do not specify the detailed RESM clearing model but rather the framework, emphasizing the responsibilities and rights of the provincial power grid and regional power grid.
- (2)
- Impact analysis of the current round of electricity market reform with provincial markets as the starting point
Since the National Development and Reform Commission (NDRC) and the National Energy Administration (NEA) announced the first batch of pilot provinces in September 2017, China has been engaged in the construction of provincial spot markets for six years. Currently, 14 pilot provinces are steadily advancing their market development, and nine provinces have been designated as key areas for promoting spot markets. Provinces such as Shanxi, Inner Mongolia, and Guangdong have already launched their provincial spot markets, generating significant economic benefits and achieving rational resource optimization.
The construction of regional markets should not undermine the completed provincial spot market construction, as this would lead to the loss of a large amount of sunk costs and cause substantial human and material losses. The development of regional markets exhibits path dependence and should build on the achievements of provincial spot market construction. On this basis, efficient connections with provincial spot markets should be established to break down provincial barriers and achieve optimized resource allocation over a larger spatial scope. The chronological approach mentioned in background one and background two, which involves clearing provincial markets first and then regional markets, is applicable.
Considering that provincial spot markets can be either decentralized or centralized, the construction of regional markets should account for scenarios where all provincial markets are either centralized, decentralized, or a combination of both. In centralized markets, medium-to-long-term contracts are of a financial nature and do not require physical execution, so spot market clearing does not need to consider them. In decentralized markets, however, most medium-to-long-term contracts are physical and require execution. When clearing spot markets, both upward and downward adjustments in generation output need to be considered within the electricity generation cost. Therefore, the optimization objectives for regional market clearing should include two parts: first, for centralized markets, the generation cost only needs to consider the cost of upward adjustments based on the minimum output of online units, as each province has already determined its unit combination; second, for decentralized markets, the generation cost should consider both upward and downward output adjustments, given that there is already a certain output plan for generation units within the province. Since each province needs to report its unit combination to the regional market, centralized markets should conduct pre-clearing first, while decentralized markets do not need to.
2.3. Operating Mechanism of RESM in China
As analyzed in Section 2.2, considering China’s unique multi-level power dispatch system and the current status of electricity spot market construction, the RESM clearing problem is a complex optimization challenge, constrained and influenced by multiple levels of electricity markets and power dispatch agencies. It is difficult to solve using a single model and clearly explain its underlying logic. Based on the market-clearing solution proposed in this paper, “pre-clearing of provincial market + optimization and adjustment of inter-provincial market clearing” [36,37,38], this section designs a bi-level regional market-clearing model. Figure 3 shows the trading mechanism of RESM.
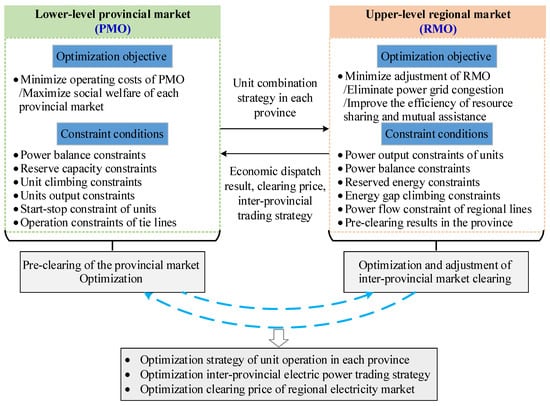
Figure 3.
Trading mechanism of RESM based on a bi-level clearing model.
Given that inter-provincial power purchase demands will reduce the trading space within the provincial market, increase the risk of cross-line tidal current in inter-provincial power grid tie lines, and affect the clearance results, this paper establishes a bi-level optimization model for decision-making in the formation of an RESM power purchase [39,40]. In this model, the clearance models for the intra-provincial and inter-provincial markets are set as upper and lower level problems, respectively. The decision variables passed between the superior and the subordinate are the pre-clearing result of the PMO and the clearing result after RMO’s optimization and adjustment.
In the bi-level operation mode of RESM, which integrates the inter-provincial electricity spot market and the provincial electricity spot market, first, all types of units in the province report the bidding information for market transactions to the PMO. At the same time, all types of wholesale power users and power sales companies in the province report their power load demand information to PMO. Based on the power generation bidding and load demand information, as well as the forecast of new energy output and load demand, the PMO obtains the unit combination strategy within the province through pre-clearing optimization and reports it to the RMO. The RMO then makes decisions on the economic dispatch strategy, clearing price, and inter-provincial trading strategy according to the actual operation of the regional power grid.
3. Bi-Level Operation-Optimization Model of Regional Electricity Spot Market
In the prevalent bi-level market-clearing model, the unit operation strategy determined after the provincial market clearing is often neglected for adjustment during the subsequent inter-provincial power grid clearing optimization at the upper. Consequently, the RMO can merely guarantee the safe operation of tie lines by optimizing the transaction plan between provincial power grids. This adjustment is limited and insufficient to meet operational safety requirements of the RESM in China. Based on the existing research and the analysis of the RESM’s operation mechanism presented in Section 2.2 and Section 2.3, this section establishes a comprehensive bi-level operation-optimization model.
The lower layer comprises the PMO’s pre-clearing model within the provincial electricity spot market. This model optimizes the unit commitment strategy by thoroughly considering the provincial electricity market’s supply–demand balance, security constraints, and economic benefits. The upper layer encompasses the RMO’s optimization clearing model within RESM, tasked with adjusting economic dispatch strategies. By taking into account the safety, greenness, and economic operation of the regional power grid, this model optimizes clearing prices and inter-provincial trading strategies and fine-tunes the unit operation strategies of diverse provincial markets to ensure the safe operation of the regional power grid.
3.1. PMO Pre-Clearing Model at the Lower Level
3.1.1. Objective Function
The lower-level model aims to minimize the expected operating costs of the provincial market, expressed by the following objective function:
where is the operating cost of the provincial market in the scenario s; is the state probability of the scenario s; is the total number of scenarios; is the number of generator within the province; and are the electricity biding price and reserve capacity biding price for generator n within the province; is the operating cost coefficient for the generator n; and are the clearing power and reserve capacity of the generator n within the province in the scenario s during the time period t; is the electricity purchased by inter-provincial traders in the inter-provincial market during the time period t; is the clearing price of the inter-provincial market during the time period t; , , and , respectively, represent the decision coefficients of switching (startup is 1; shutdown is 0), starting (startup is 1; non-startup is 0), and stopping (1 is shutdown; 0 is non-shutdown) of generator n at the time period t; represents the total number of segments of the upward/downward quotation of the unit; represents the upper adjustment amount of the unit in section b; is the adjustment quotation in section b; (<0) is the down-regulation quantity of the unit ; and (>0) is the down-regulation quotation of the unit .
3.1.2. Constraint Conditions
The following constraints pertain to provincial market-clearing constraints under centralized market conditions. For the decentralized market-clearing model, unit start–stop constraints are not involved, so this section will not repeat them.
- (1)
- Power balance constraint
Formula (2) defines the power balance constraint within the provincial market [26,30,33].
where is the electricity purchased by inter-provincial traders in the inter-provincial market during the time period t; is the load demand of electricity users m during the time period t in the scenario s; and is the number of electricity users within the province.
- (2)
- Reserve capacity constraint
Formula (3) defines the reserve capacity constraint of units within the provincial market [26,30,33].
where is the standby coefficient of the provincial power grid.
- (3)
- Unit climbing constraints
Formula (4) defines the unit climbing constraints within the provincial market [26,30,33].
where and are the upper and lower limits of the ramp for the generator n.
- (4)
- Unit output constraints
Formula (5) defines the unit output constraints within the provincial market [26,30,33].
where and are the upper and lower limits of the output of the generator n.
- (5)
- Start–stop constraint of units
Formula (6) defines the unit start–stop constraints within the provincial market [26,30,33].
where is the total time of the continuous operation or shutdown of the unit n, and and represent the minimum continuous shipment timer and the minimum continuous downtime of the unit n.
- (6)
- Operation constraints of tie lines
Formula (7) defines the operation constraint of tie lines [26,30,33].
where is the power of tie line n, and and are the upper and lower limits of the operation power of tie lines n.
3.2. RMO Optimization Clearing Model at the Upper Level
3.2.1. Objective Function
Unlike the traditional RESM operation-optimization model, the RESM operation-optimization model established in this paper accounts for the adjustment of RMO to the unit operation strategy within the RESM. Currently, both centralized and decentralized markets coexist in the market of China’s provincial electricity markets. This unique phenomenon necessitates that the RMO consider adjustments to unit operation strategy across different market types within the RESM operation-optimization model. This ensures that the operation optimization strategy takes into account both centralized and decentralized units, thereby enhancing the reliability and accuracy of the operation optimization results. The upper-level RESM clearing optimization model primarily focuses on the power purchase demand of provincial electricity spot markets and the constraint of safe operation of the regional power grid. It optimizes the power purchase plans of provinces and the power flow through inter-provincial tie lines within the RESM.
During the clearing process of the upper-level regional market, for the pre-clearing results of the centralized market, the optimization strategy involves adjusting the output of starting units upward from their minimum output levels. For the clearing results of the decentralized market, the optimization strategy involves adjusting the output of starting units both upward and downward based on the clearing results. By doing so, all relevant special factors are considered. Therefore, this paper adopts minimizing adjustment cost as the objective function for the upper-level optimization clearing model.
where represent decentralized provincial electricity spot markets; represent the number of optimization segments; and are the bidding power for the up/down adjustment of unit in the segment ; and are the quotation for the up/down adjustment of unit in the segment ; represent the thermal power unit in the centralized provincial electricity spot market; represent the number of quotation segments for the unit in the decentralized provincial electricity spot markets; is the biding power of unit in the segment ; is the quotation for segment of the unit ; represent the new energy units; and is the abandoned power of the new energy unit .
3.2.2. Constraint Conditions
- (1)
- Power output constraints of thermal power units
Formulas (9) and (10) define the power output constraints of thermal power units within the decentralized provincial electricity spot market.
where and are the benchmark output and final output of thermal power unit in the decentralized provincial electricity spot market at time t; and are the maximum and minimum outputs of the unit ; and are the maximum uphill and downhill climbing rates of the unit ; is the output of the thermal power unit in the centralized provincial electricity spot market at time t; and are the maximum and minimum outputs of the unit ; and and are the maximum uphill and downhill climbing rates of the unit .
- (2)
- Power output constraints of the new energy unit
Formulas (11) and (12) define the power output constraints of the new energy unit [26,30,33].
where is the predicted output of the new energy unit at time t, and is the biding power within the market.
- (3)
- Power output constraints of pumped storage units
Formulas (13)–(19) define the power output constraints of pumped storage units.
where , , and are the pumping/generating/final powers of the pumped storage unit at time t; and are the state variables for pumping/generating; is the stored energy of the pumped storage unit at time t; and are the maximum pumping/generating powers; and are the maximum/minimum stored energies; and and are the initial and final stored energies of the pumped storage unit .
- (4)
- Power balance constraints [26,30,33]
- (5)
- Reserved energy constraints for each province/region
Formulas (22)–(25) define the reserved energy constraints for each provincial and regional electricity spot markets.
where is the set of generator units in the province ; and are the upper/lower reserved energy constraints for the province ; and and are the regional up/down reserved energies.
- (6)
- Energy-gap climbing constraints for each province [26,30,33]
- (7)
- Energy-gap changes constraints for each province
4. Model Solving Method
The bi-level optimization model presented in this paper is structured in a staged manner. The PMO optimizes the clearing of the provincial market using the lower-level pre-clearing model and derives the unit commitment strategy for the provincial power grid, which is then relayed to the RMO as a parameter. The RMO, in turn, incorporates the optimal unit commitment strategy received from the lower model as a parameter into the upper-level clearing optimization model. This process yields the optimal clearing price, unit operation strategy, and tie-line power for the provincial power grid. Subsequently, these results are transmitted back to the PMO for implementation. Building on the aforementioned analysis, this section outlines a piecewise solution approach to tackle the bi-level model.
4.1. Model Solving Method of Pre-Clearing Model
4.1.1. Transformation of Pre-Clearing Model Based on MDP
In the provincial pre-clearing model, there are complex optimization variables, including 0–1 unit start–stop variables and power flow constraints, along with multiple constraints spanning both time and quantity dimensions. This complexity necessitates substantial calculation resources during the model’s solution process, making it challenging to solve quickly using conventional mathematical methods. Currently, electricity market-clearing methods in energy systems predominantly integrate optimization or heuristic algorithms. While optimization algorithms offer high computational efficiency, they often struggle to escape local optima when confronted with non-linear, non-convex, or discontinuous problems. On the other hand, heuristic algorithms can provide optimal solutions or Pareto frontiers under specified conditions, but they come with numerous limitations, including lengthy calculation times and inadequate generalization capabilities.
Reinforcement learning, grounded in Markov decision processes (MDP) theory, stands out as a pivotal machine learning technique characterized by its robust autonomous learning ability and adaptability. It constitutes a methodology for making sequential decisions within an unknown environment, possessing the agility to adjust strategies in real time through online learning from historical experiences. In the realm of RL, an agent engages with its environment and progressively learns in an adaptive manner through a process of “trial and error”, ultimately uncovering the optimal strategy. Notably, the RL approach does not necessitate prior knowledge of the distribution of uncertain factors within the system, rendering it a promising method for tackling optimization problems plagued by uncertainties. Its potential has been recognized in various domains, including electricity market-clearing optimization, where it has been introduced as a viable solution, as evidenced by references [41,42].
Therefore, the pre-clearing model for the lower-level provincial market problem is formulated as a discrete, finite-horizon MDP, given its nature as a decision-making problem within a stochastic environment. The MDP framework comprises four fundamental elements: state, action, reward, and discount rate. The reward and the action selected are contingent solely on the present energy information, independent of historical data. Consequently, this problem can be represented as a finite MDP, with the security-constrained unit commitment serving as the agent. Figure 4 shows the agent–environment interactive mode.
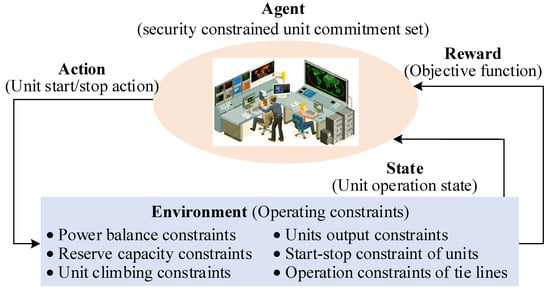
Figure 4.
Agent–environment interactive mode.
For the unit commitment problem, its agent is the security-constrained unit commitment set, and the environment is the operating constraints of the pre-clearing model. Here, the action space , the state space , and the reward function are modeled once.
- (1)
- Action space
In the unit commitment problem, the action encompasses both the start–stop decision-making process and the determination of the unit’s future output. The action space, in turn, represents the full range of decisions that can be made by all generating units.
where is the set of start–stop action combinations, which is determined by the switching decision coefficients of all units, and N is the total number of units participating in the unit-combination optimization.
- (2)
- State space
For the unit commitment problem, the state space should encompass the output power, the start/stop status of each unit, the total duration of continuous operation or shutdown for each unit, and the load demand (Formula (31)).
where and , respectively, represent the starting (startup is 1; non-startup is 0), and stopping (1 is shutdown; 0 is non-shutdown) of the generator n at time t; is the total time of the continuous operation or shutdown; and is the load demand of electricity users m during the time period t in the scenario s.
- (3)
- Reward function
The rational design of the reward function exerts a significant impact on the agent’s action trajectory and the convergence of the algorithm. In this paper, we develop a reward function based on the objective function of the pre-clearing model, taking into account two extreme operating scenarios: one where the minimum start–stop time constraint cannot be met and another where the constraints at full power rate cannot be balanced.
where and are the penalty coefficients of the start–stop time deviation for start and stop actions, and is the penalty coefficient of the power balance deviation.
- (4)
- MDP Pre-clearing model of lower-level provincial market
Combined with the agent–environment relationship depicted in Figure 4, the state space model, moving space model, establishing function, and MDP pre-clearing model for the lower-level provincial market have been established.
where is the state at time t; is the action at time t; is the current reward; is the future reward; and is the discount rate, . When , the agent only cares about the current profit maximization; when , in the case of relatively stable environment, any action will bring benefits but may lead to endless explorations. In most experiments, is set to balance the current reward with the future reward by adjusting the discount rate.
4.1.2. Solving Algorithm Based on Q-Learning
Here, the MDP problem established in Section 4.1.1 is solved by the Q-learning method, which solves the problem of sequence decision in an unknown environment by mapping selection probability from the state to action [43,44]. Figure 5 shows a flowchart of Algorithm 1.
If the agent chooses strategy at the given moment, then is the probability of when . The value function of the state under strategy as is written; that is, from the state , the expected probability value of the reward is obtained by the agent when making decisions according to the strategy .
Similarly, the value of action taken by the strategy in the state can be recorded as . Then, according to strategy , from the state , after action is executed, the expected returns of all possible decision sequences can be obtained.
Then, the Bellman equation is introduced to represent an iterative relationship of correlation between the current and future state values.
Moreover, the iterative relationship of the correlation between the current action and future action can be obtained. Here, is the current reward.
The value composed of “state–action” forms the Q-table, which shows the Q-value of all actions in all states. In several iterations, the Q-value will tend to converge. On the basis of Formulas (37) and (38), the Q-learning algorithm is used to obtain the maximum Q-value, thus obtaining the optimal strategy .
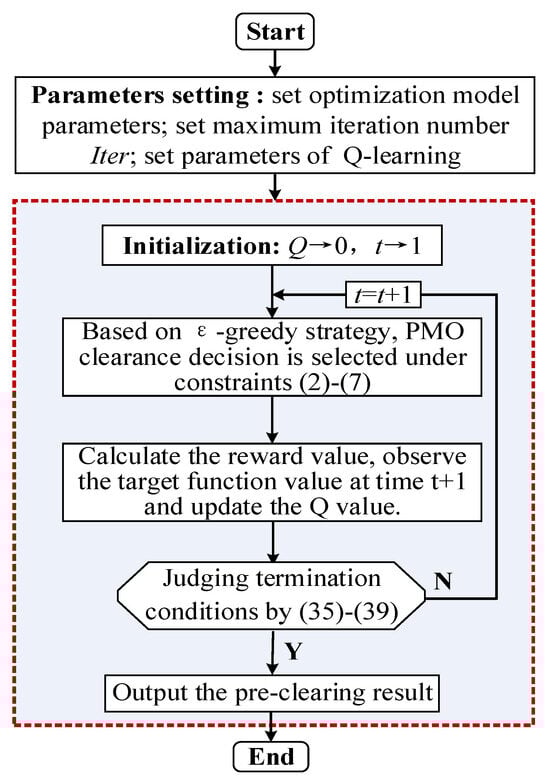
Figure 5.
Flow chart of Algorithm 1.
4.2. Model Solving Method of Optimization Clearing Model
After applying Algorithm 1 to solve the pre-clearing model, we obtain the security-constrained unit commitment results for each province. These results are then used as input parameters for the solving process of the optimization clearing model. Following the linearization of Formula (16) using the method outlined in reference [45], the optimization clearing model transforms into a continuous linear optimization problem with convex function properties, amenable to solution by standard linear programming techniques. Consequently, the optimization clearing model is solved by calling the CPLEX solver. All the simulations are completed by a PC (Lenovo Group, Hong Kong, China) with an Intel Core i5-13400 CPU @ 2.50 GHz with 32.00 GB RAM, and the optimal problems are solved using MATLAB software R2020b (MathWorks, Natick, MA, USA) by calling the CPLEX solver 12.63 (International Business Machines Corporation, Armonk, NY, USA).
5. Case Study
5.1. Basic Parameters
In this paper, the RESM comprising power grids in the Yangtze River Delta region of China is simulated as a case study. The studied RESM comprises the provincial electricity spot market of Jiangsu, Anhui, Shanghai, Zhejiang, and Fujian. It consists of five 500 kV power nodes and six 500 kV inter-provincial power grid connection lines. Figure 6 shows the topology and parameters of inter-provincial tie lines in the RESM. Table 1 shows the power supply installation of RESM in 2020 [46]; Figure 7 shows the load curve of RESM in 2020 [47]; and Figure 8 shows the wind power and photovoltaic power curves of RESM in 2020. Furthermore, power generation enterprises all submit their bids based on marginal cost. The average wholesale price of coal is 1134.62 CNY/t, and the price of industrial pipeline natural gas is 3.23 CNY/m3.
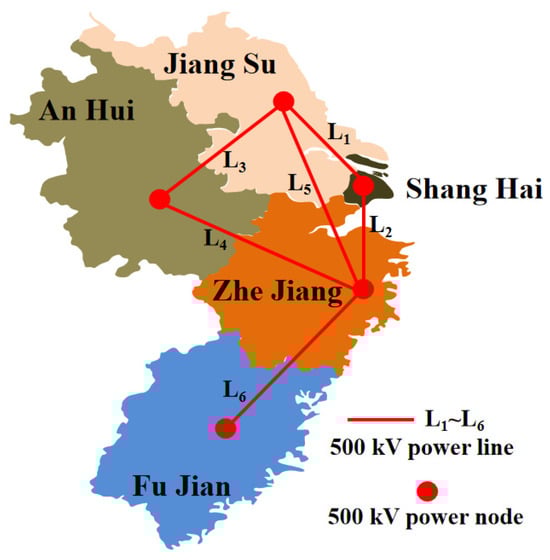
Figure 6.
Topology and parameters of inter-provincial tie lines in the RESM.

Table 1.
Power supply installation of RESM in 2020.
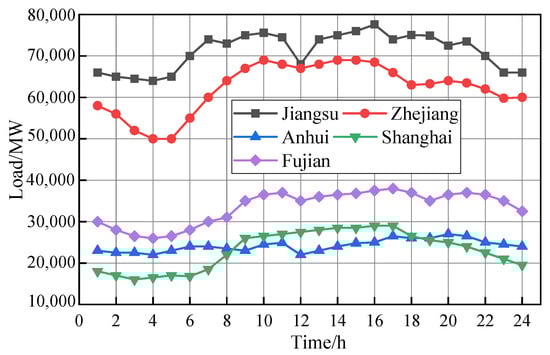
Figure 7.
Load curve of RESM in 2020.
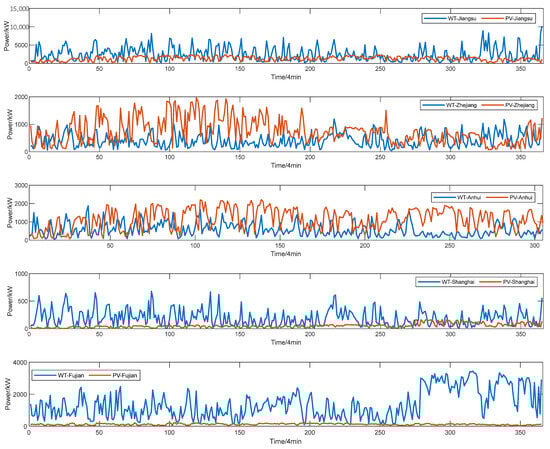
Figure 8.
Wind power and photovoltaic power curves of RESM in 2020.
To thoroughly assess the merits of the model established in this paper for operational optimization in the RESM, a simulation scenario approach is employed. Initially, representative weeks encompassing Tomb-Sweeping Day, summer peak load, National Day, and Spring Festival are chosen as the foundational scenarios for the four seasons of 2020. Each week spans three days, selected as typical within their respective weeks, resulting in a total of 12 representative days throughout the year. Subsequently, based on the daily output of renewable energy such as WT and PV, three output scenarios are devised: large, middle, and small. Each scenario encompasses 10 output variations, collectively forming a total of renewable energy output scenes. Ultimately, through scenario superposition, 360 simulation scenarios for 2020 are generated. It is important to note that uncertainties in renewable energy generation and load are not considered in this study. This is because the focus of this research lies in verifying the applicability and reliability of the new model in the RESM clearing process, and uncertainties do not impact the model’s execution capability.
Utilizing the design scenarios and the innovative optimization model introduced in this paper, the simulations and analysis primarily focus on the operational state of the power grid after the operation of the RESM, considering its safety benefits, economic benefits, and environmental benefits. In terms of safety benefits, the analysis mainly considers three indicators: the number of periods with line congestion, the number of congested lines, and the magnitude of line overflows. Economic benefits are primarily analyzed through the total purchasing cost in the region. Environmental benefits are gauged using three indicators: carbon emissions per unit of electricity, the amount of renewable energy curtailment, and the curtailment rate of renewable energy.
5.2. Simulation Results
This section presents the numerical simulation results of the bi-level operation-optimization model of RESM. Figure 9 shows the convergence of the Q-value and learning speed.
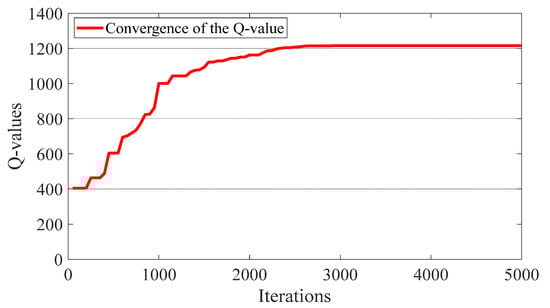
Figure 9.
It can be observed that at the beginning, the agent (PMO) does not know how to select an action to result in a high Q-value. However, as the number of iterations increases, the Q-value increases as PMO learns from the environment by trial and error, finally converging to the maximum value at about 2915 iterations in 139 s.
5.2.1. Simulation Results of Safety Benefit
For the RESM in the Yangtze River Delta, if only the market clearing within each province is taken into account without implementing coordinated operation optimization through the construction of an RESM framework, the direct superposition of each province’s clearing results leads to a regional power grid characterized by numerous blocking sections, prolonged durations, and severe over-limits. However, the significant regional power grid congestion arising from this superposition of clearing results in various provinces can be effectively solved by constructing the Yangtze River Delta RESM with collaborative optimization and carrying out intra-provincial and regional joint clearing through the bi-level optimization model established in this paper.
As illustrated in Figure 10, the frequency of cross-section blocking periods on a single simulation day exhibits an approximate normal distribution, and scene blocking occurs in all periods of the whole day. Notably, the maximum number of blocking events, totaling 85 instances, occurred at 7:00, while the minimum, with only two occurrences, was recorded at 20:00. Between 0:00 and 10:00, with the exception of 1:00, the count of blocking scenes exceeded 20 instances. In contrast, the number of blocking events was lower from 11:00 to 23:00.
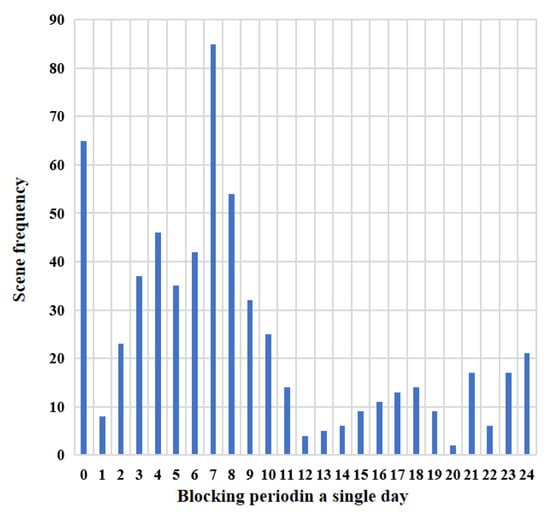
Figure 10.
Schematic diagram of frequency of blocking period.
As shown in Figure 11, the highest frequency of the simulation day is two-section blockage, reaching 222 times, and the least is no-section blockage, only 30 times. The frequency of blocking of one section is also more than 200 times, while the blocking of no section or three or four sections is less than 60 times.
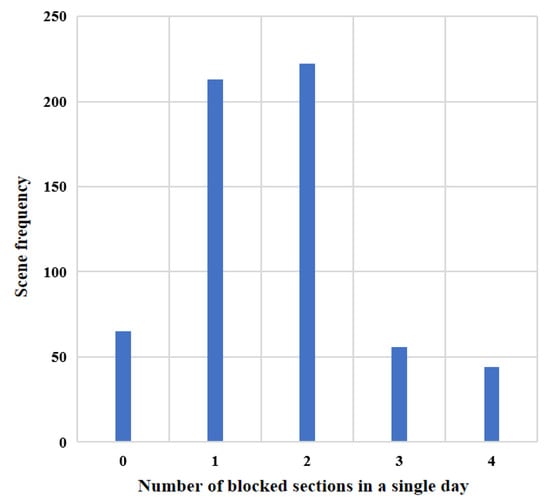
Figure 11.
Schematic diagram of frequency of blocking sections.
As shown in Figure 12, except for 500 MW exceeding the limit, all the others exceeding the limit have scenes. Among them, the maximum frequency of exceeding the limit of 1800 MW is 71 times; exceeding the limit of 200 MW only occurs once. The scenes that do not exceed the limit, 1500 MW, 1800 MW, 2100 MW, 2900 MW, and 3000 MW, all appear more than 30 times. According to statistics of all scenarios, the annual (before regional optimization) average single-day cross-section tidal current in the Yangtze River Delta is 1968.142 MW.
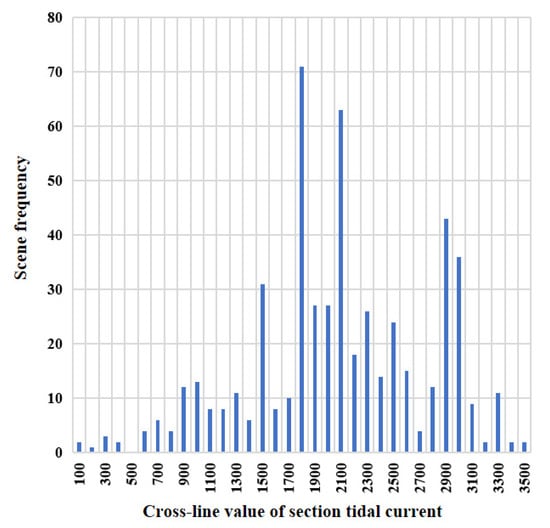
Figure 12.
Schematic diagram of cross-section tidal current value frequency.
5.2.2. Simulation Results of Economic Benefits
After the development of the spot electricity market in the Yangtze River Delta region, the average daily electricity purchase cost in the region has decreased by about 11 million, and the annual electricity purchase cost has decreased by about 4 billion. Figure 13, Figure 14, Figure 15 and Figure 16 show the schematic diagram of frequency reduction scenarios of regional power grid purchases in spring, summer, autumn, and winter, respectively. Table 2, Table 3, Table 4 and Table 5 show the schematic diagram of frequency reduction scenarios of regional power grid purchases in spring, summer, autumn, and winter, respectively.
As shown in Figure 13, the frequency of decreasing electricity purchase cost per day presents an approximate normal distribution. Among them, the minimum reduction is CNY 9 million, and the maximum is CNY 28 million. The scene with a reduction of CNY 15 million has the highest frequency, more than 20 times, and the scene with a reduction of CNY 28 million has the least frequency, only once. Scenes that reduce the amount from CNY 11 million to CNY 19 million appear more than 10 times, and scenes that reduce the cost below CNY 10 million and above CNY 20 million appear less. According to all the scenarios, before the Yangtze River Delta in the spring, the average daily electricity purchase cost was reduced by CNY 15.53 million.
Table 2.
Electricity purchase reduction under different optimization scenarios in spring.
Table 2.
Electricity purchase reduction under different optimization scenarios in spring.
| Decrease Amount/CNY Million | Maximum | Minimum Value | Average Value |
|---|---|---|---|
| Big scene | 21.6 | 8.1 | 13.8 |
| Middle scene | 22.4 | 10.1 | 14.9 |
| Small scene | 27.1 | 10.6 | 16.4 |
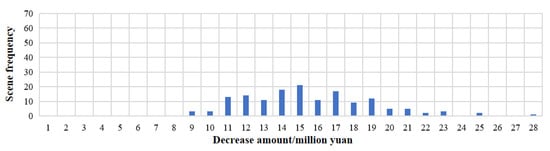
Figure 13.
Schematic diagram of frequency reduction scenarios in spring.
As shown in Figure 14, the frequency of decreasing electricity purchase cost per day presents an approximate normal distribution. Among them, the minimum reduction is CNY 13 million, and the maximum is CNY 27 million. The frequency of scenes with a reduction of CNY 19 million is the highest, reaching 17 times, and the frequency of scenes with CNY 26 million and CNY 27 million is the least, only once. Scenes that reduce the amount of CNY 17 million to CNY 21 million appear more than 10 times, and scenes that reduce the cost by less than CNY 17 million and more than CNY 21 million appear less. According to all the scenarios, before the Yangtze River Delta in the summer, the average daily electricity purchase cost was reduced by CNY 19.11 million.
Table 3.
Electricity purchase reduction under different optimization scenarios in summer.
Table 3.
Electricity purchase reduction under different optimization scenarios in summer.
| Decrease Amount/CNY Million | Maximum Value | Minimum Value | Average Value |
|---|---|---|---|
| Big scene | 26.7 | 12.4 | 18.0 |
| Middle scene | 25.5 | 13.2 | 19.0 |
| Small scene | 24.6 | 14.1 | 19.0 |
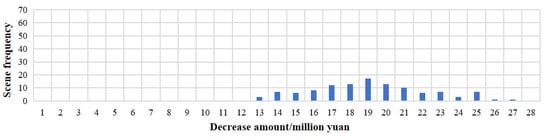
Figure 14.
Schematic diagram of frequency reduction scenarios in summer.
As shown in Figure 15, the frequency of decreasing electricity purchase cost per day presents an approximate normal distribution. Among them, the minimum reduction is CNY 1 million, and the maximum is CNY 7 million. The scene with a reduction of CNY 3 million has the highest frequency, reaching 67 times, and the scene with a reduction of CNY 7 million has the least frequency, only once. The frequency of scenes that reduce the amount from CNY 2 million to CNY 4 million is more than 30 times, and the scenes that reduce the cost by CNY 1 million and more than CNY 5 million are rare. According to all the scenarios, before the Yangtze River Delta in the autumn, the average daily electricity purchase cost was reduced by CNY 3.18 million.
Table 4.
Electricity purchase reduction under different optimization scenarios in autumn.
Table 4.
Electricity purchase reduction under different optimization scenarios in autumn.
| Decrease Amount/CNY Million | Maximum Value | Minimum Value | Average Value |
|---|---|---|---|
| Big scene | 6.7 | 0.7 | 2.9 |
| Middle scene | 4.0 | 1.2 | 2.6 |
| Small scene | 4.4 | 1.4 | 2.6 |
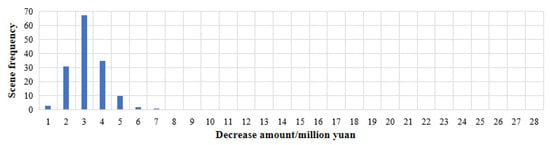
Figure 15.
Schematic diagram of frequency reduction scenarios in autumn.
As shown in Figure 16, the frequency of decreasing electricity purchase cost per day presents an approximate normal distribution. Among them, the minimum reduction is CNY 5 million, and the maximum is CNY 15 million. The frequency of scenes with a reduction of CNY 6 million is the highest, reaching 34 times, and the frequency of scenes with CNY 14 million and CNY 15 million is the least, only once. Scenes that reduce the amount of CNY 6 million to CNY 9 million appear more than 20 times, and scenes that reduce the cost by CNY 5 million and more than CNY 8 million appear less. According to all the scenarios, before the Yangtze River Delta in the winter, the market will reduce the electricity purchase cost by an average of CNY 8.4 million per day.
Table 5.
Electricity purchase reduction under different optimization scenarios in winter.
Table 5.
Electricity purchase reduction under different optimization scenarios in winter.
| Decrease Amount/CNY Million | Maximum Value | Minimum Value | Average Value |
|---|---|---|---|
| Big scene | 12.5 | 5.0 | 7.5 |
| Middle scene | 14.1 | 4.2 | 7.8 |
| Small scene | 13.1 | 4.5 | 8.4 |
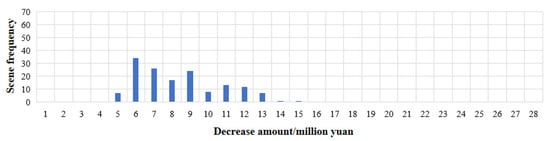
Figure 16.
Schematic diagram of frequency reduction scenarios in winter.
5.2.3. Simulation Results of Environmental Benefit
After the optimization of the RESM, the Yangtze River Delta regional power grid reduces the total carbon emissions by 11,000 tons per day and 0.18 kg per kilowatt hour on average and reduces the carbon emissions by about 4 million tons throughout the year. Figure 17 shows the frequency of single-day carbon emission reduction in the whole year; Figure 18 shows the frequency of reduction of carbon emissions per day in the whole year.
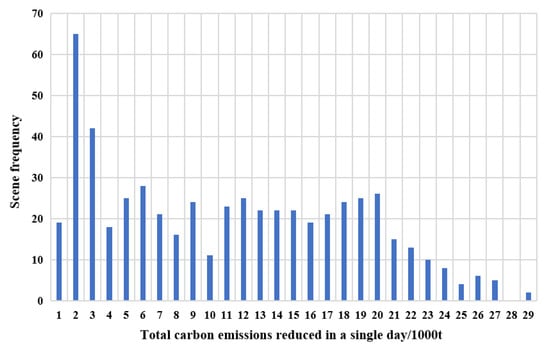
Figure 17.
Frequency of single-day carbon emission reduction in the whole year.
As shown in Figure 17, all scenarios appeared on the simulation day except for 28 kilotons of carbon emission reduction. Among them, the most frequent scene is 2000 tons of carbon emission reduction, reaching 65 times, and the least frequent is 29,000 tons of carbon emission reduction, only twice. In the scene of 1–22 kiloton carbon emission reduction, the frequency of occurrence is more than 10 times, and that of 23 kiloton carbon emission reduction and above is less than 10 times. According to the statistics of all scenarios, the Yangtze River Delta will reduce its total carbon emissions by 13.08 thousand tons per day.
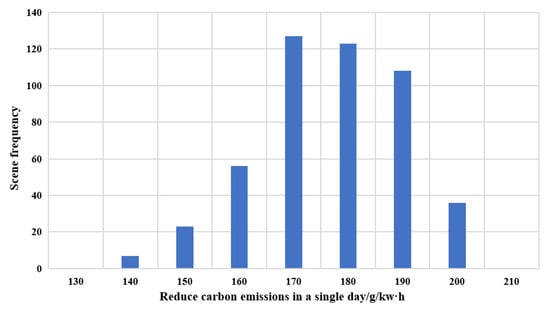
Figure 18.
Frequency of reduction of carbon emissions per day throughout the whole year.
As shown in Figure 18, the frequency of decreasing carbon emissions per day in the simulation day presents an approximate normal distribution. Among them, the minimum reduction is 140 g/kWh, and the maximum is 200 g/kWh. The scene of reducing 170 g/kWh electric carbon emissions in a single day is the most frequent, reaching 127 times, and the scene of reducing 140 g/kWh electric carbon emissions in a single day is the least frequent, only seven times. The scenes of reducing carbon emissions by 170 g/kWh, 180 g/kWh, and 190 g/kWh in a single day all exceeded 100 times, and the frequency of other carbon emissions was less than 50 times. According to the statistics of all scenarios, the annual average single-day reduction of carbon emissions in the Yangtze River Delta is 176.75 g/kWh.
Besides, under the market model, with the growth of renewable energy, the demand for regulation resources in the Yangtze River Delta provinces will surge. However, under the situation of developing the spot market in each province, there will be no large-scale renewable energy power abandonment, and it may only be abandoned in some days and some periods. After the optimization of the RESM, the scenes without power abandonment account for more than 95% of the total scenes, and the daily power abandonment rate of power abandonment scenes is less than 0.4%. The reasonable distribution and trading of power resources in the RESM has greatly reduced the average amount of electricity purchased in the region.
6. Conclusions
This paper presents the RESM operation model and optimization approach, which take into account the distinct power grid operation mechanisms and market development achievements of China’s provincial electricity spot markets. As an illustrative example, the RESM comprising power grids in the Yangtze River Delta region of China is simulated. The analysis centers on the operational status of the power grid following the implementation of RESM, examining its safety, economic, and environmental benefits. In terms of safety, when the pre-clearing results of various provinces are directly combined, the regional power grid exhibits characteristics such as numerous blocked sections, prolonged durations, and significant tidal current crossings. The optimization of RESM can effectively solve the serious regional power grid congestion issue arising from the superposition and aggregation of pre-clearing results from various provinces. Regarding the economical operation, through RESM optimization, the average daily cost of electricity purchase in the region has been reduced by about CNY 11 million, and the annual cost has been reduced by about CNY 4 billion. In terms of carbon emissions, through the optimization of RESM, the total carbon emissions are reduced by 11,000 tons per day and 0.18 kg per kilowatt hour on average, and the carbon emissions are reduced by about 4 million tons throughout the year. After regional optimization, the scenarios without power abandonment account for more than 95% of the total, and the daily power abandonment rate in such scenarios is less than 0.4%.
In this paper, uncertainties in renewable energy generation and load forecasting are not considered. However, in the actual operation of the RESM, these uncertainties have a substantial impact on both the timeliness of model solving and the accuracy of clearing results. Therefore, future research should incorporate uncertainty factors into the bi-level clearing model and propose rapid solving methods to enhance the model’s robustness. Furthermore, the innovative market-clearing model established in this paper is tailored to the current unique power dispatch system and market mechanism in China. The practicality of this model for other market structures still needs to be enhanced through further optimization and improvement of the model.
Author Contributions
Methodology, Y.L. and Y.C.; software, Y.L. and H.C.; investigation, F.Z.; writing—original draft, Y.L. and L.Z.; supervision, L.Z. All authors have read and agreed to the published version of the manuscript.
Funding
This work was funded by the State Grid Corporation of China Headquarters Management Technology Project: Research on the Impact Analysis of Offer Price Limit in Inter-provincial Electricity Spot Markets Driven by Big Data (No. 5108-202355444A-3-2-ZN).
Data Availability Statement
The original contributions presented in this study are included in the article. Further inquiries can be directed to the corresponding author.
Conflicts of Interest
The authors declare no conflicts of interest.
Nomenclature
| RESM | regional electricity spot market |
| CFP | coal-fired power |
| PMO | Provincial electricity spot market operator |
| RMO | Regional electricity spot market operator |
| DC | Direct current |
| AC | Alternating current |
| NDRC | National Development and Reform Commission |
| NEA | National Energy Administration |
| The operating cost of the provincial market in the scenario s | |
| The state probability of the scenario s | |
| The total number of scenarios | |
| The number of generators within the province | |
| , | The electricity and reserve capacity biding prices for generator n within the province, MW |
| The operating cost coefficient for the generator n, CNY/MW | |
| , | The clearing power and reserve capacity of the generator n within the province in the scenario s during the time period t, MW |
| The electricity purchased by inter-provincial traders in the inter-provincial market during the time period t, MW | |
| The clearing price of the inter-provincial market during the time period t, CNY/MW | |
| The decision coefficients of switching (startup is 1; shutdown is 0) | |
| The decision coefficients of starting (startup is 1; non-startup is 0) | |
| The decision coefficients of stopping (1 is shutdown; 0 is non-shutdown) | |
| The upper adjustment amount of the unit in section b, MW | |
| The down-regulation quantity of the unit , MW | |
| The down-regulation quotation of the unit , MW | |
| The adjustment quotation in section b, MW | |
| The load demand of electricity users m during the time period t in the scenario s, MW | |
| The standby coefficient of the provincial power grid | |
| The upper limit of the ramp for generator n, MW | |
| The lower limit of the ramp for generator n, MW | |
| , | The upper and lower limits of the output of generator n, MW |
| The power of tie line n, MW | |
| The upper limit of the operation power of tie lines n, MW | |
| The lower limit of the operation power of tie lines n, MW | |
| The decentralized provincial electricity spot market, MW | |
| The number of optimization segments | |
| , | The bidding power for the up/down adjustment of the unit in the segment , MW |
| , | The quotation for the up/down adjustment of the unit in the segment , MW |
| The thermal power unit in the centralized provincial electricity spot market, MW | |
| The number of quotation segments for the unit | |
| Thermal elasticity coefficient of prosumers | |
| The quotation for segment of the unit , MW | |
| The new energy units | |
| The abandoned power of the new energy unit , MW | |
| , | The benchmark and final outputs of thermal power unit in the decentralized provincial electricity spot market at time t, MW |
| , | The maximum and minimum outputs of the unit , MW |
| , | The maximum uphill and downhill climbing rates of the unit , MW/h |
| The output of thermal power unit in the centralized provincial electricity spot market at time t, MW | |
| , | The maximum and minimum outputs of the unit , MW |
| The predicted output of the new energy unit at time t, MW | |
| The biding power in the market, MW | |
| , , | The pumping/generating/final powers of the pumped storage unit at time t, MW |
| , | The state variable for pumping/generating |
| The stored energy of the pumped storage unit at time t, MW | |
| The maximum pumping power, MW | |
| The maximum generating power, MW | |
| , | The maximum/minimum stored energies, MW |
| , | The initial and final stored energy of the pumped storage unit , MW |
| The total system demand at time t, MW | |
| The fixed output unit | |
| The cross-regional transmission line | |
| The maximum transmission capacity of the transmission line, MW | |
| The set of generator units in the province | |
| , | The upper/lower reserved energy constraints for the province , MW |
| , | The regional up/down reserved energies, MW |
| The energy gap of province at time t | |
| , | The uphill/downhill climbing constraints for the energy gap in the province , MW/h |
| The collection of provinces with energy gaps | |
| The set of start–stop action combinations | |
| , | The penalty coefficient of the start–stop time deviation for start and stop actions, CNY/MW |
| The penalty coefficient of the power balance deviation, CNY/MW | |
| The state at time t | |
| The action at time t | |
| The current reward | |
| The future reward | |
| The discount rate, |
References
- Zhang, Y.; Zhang, J.; Yang, Z.; Li, J. Analysis of the distribution and evolution of energy supply and demand centers of gravity in China. Energy Policy 2012, 49, 695–706. [Google Scholar] [CrossRef]
- Liu, J.; Niu, D.; Song, X. The energy supply and demand pattern of China: A review of evolution and sustainable development. Renew. Sustain. Energy Rev. 2013, 25, 220–228. [Google Scholar] [CrossRef]
- Zhang, L.; Sun, Y.; Zhang, Y. Research on mechanism of inter-provincial contract transfer and replacement transaction in South China Electricity Market. Power Syst. Technol. 2012, 36, 262–268. [Google Scholar]
- Xu, Z.; Chen, W.; Ding, J. Optimization path of inte-provincial medium and long-term transaction mechanism in southern China under two-level transaction mode. Electr. Power Autom. Equip. 2022, 42, 175–181. [Google Scholar]
- National Development and Reform Commission Office; National Energy Administration General Office. Notice on Carrying Out Pilot Projects of the Electricity Spot Market Construction. 2017. Available online: https://www.ndrc.gov.cn/xxgk/zcfb/tz/201709/t20170905_962552.html (accessed on 20 January 2024).
- National Development and Reform Commission Office; National Energy Administration General Office. Notice on Further Accelerating the Construction of Electricity Spot Markets. 2023. Available online: https://www.ndrc.gov.cn/xxgk/zcfb/tz/202311/t20231101_1361704.html (accessed on 20 January 2024).
- National Development and Reform Commission and National Energy Administration. Guiding Opinions on Accelerating the Construction of a Unified National Electricity Market System. 2022. Available online: https://www.gov.cn/zhengce/zhengceku/2022-01/30/content_5671296.htm (accessed on 20 January 2024).
- Wu, Z.; Wang, J.; Zhong, H.; Gao, F.; Pu, T.; Tan, C.-W.; Chen, X.; Li, G.; Zhao, H.; Zhou, M.; et al. Sharing economy in local energy markets. J. Mod. Power Syst. Clean Energy 2023, 11, 714–726. [Google Scholar] [CrossRef]
- Ahlqvist, V.; Holmberg, P.; Tangerås, T. A survey comparing centralized and decentralized electricity markets. Energy Strategy Rev. 2022, 40, 100812. [Google Scholar] [CrossRef]
- Song, Y.; Bao, M.; Ding, Y.; Shao, C.; Shang, N. Review of Chinese electricity spot market key issues and its suggestions under the new round of Chinese power system reform. Proc. CSEE 2020, 40, 3172–3187. [Google Scholar]
- Wu, Z.; Wang, J.; Zhou, M.; Xia, Q.; Tan, C.-W.; Li, G. Incentivizing frequency provision of power-to-hydrogen toward grid resiliency enhancement. IEEE Trans. Ind. Inform. 2023, 19, 9370–9381. [Google Scholar] [CrossRef]
- Cao, Y.; Lin, R.; Liu, B.; Meng, Z.; Wetzel, D. Tracking China’s Provincial Spot Market Designs: 2019. Rocky Mountain Institute at. Available online: https://rmi.org/insight/tracking-chinas-provincial-spot-market-designs (accessed on 20 January 2024).
- Davidson, M.R.; P’erez-Arriaga, I. Avoiding pitfalls in China’s electricity sector reforms. Energy 2020, 41, 119–142. [Google Scholar] [CrossRef]
- Yi, Y.; Zhang, L.; Du, L. Cross-regional integration of renewable energy and corporate carbon emissions: Evidence from China’s cross-regional surplus renewable energy spot trading pilot. Energy Econ. 2024, 135, 107649. [Google Scholar] [CrossRef]
- Fatras, N.; Ma, Z.; Duan, H.; Jørgensen, B.N. A systematic review of electricity market liberalisation and its alignment with industrial consumer participation: A comparison between the Nordics and China. Renew. Sustain. Energy Rev. 2022, 167, 112793. [Google Scholar] [CrossRef]
- Cody, H.; Chiara, P.L.; Ashish, R.; Webster, M. Intraday markets, wind integration and uplift payments in a regional U.S. power system. Energy Policy 2023, 175, 113503. [Google Scholar]
- Zhang, Y.; Anvari-Moghaddam, A.; Peyghami, S.; Blaabjerg, F. Novel Frequency Regulation Scenarios Generation Method Serving for Battery Energy Storage System Participating in PJM Market. Energies 2024, 17, 3479. [Google Scholar] [CrossRef]
- Qu, Z.; He, L.; Lu, X.J. A Two-Stage Forecasting Approach for Day-Ahead Electricity Price Based on Improved Wavelet Neural Network with ELM Initialization. IEEE Trans. Ind. Appl. 2024, 60, 5061–5073. [Google Scholar] [CrossRef]
- Chen, H.; Pilong, C.; Patricio, R.; Frogg, D.; Jayachandran, M.; Manno, D.; Sexauer, J.; Callaghan, C.; Dropkin, R.; Mulhern, J.; et al. Grid Resilience with High Renewable Penetration: A PJM Approach. IEEE Trans. Sustain. Energy 2023, 14, 1169–1177. [Google Scholar] [CrossRef]
- Nord Pool. The Market Data in Nordic Pool [EB/OL]. (5 December 2021) [21 November 2022]. Available online: https://www.nordpoolgroup.com/en/search/?query=The+Market+Data+in+Nordic+Pool (accessed on 20 January 2024).
- Nagel, N.O.; Böhringer, C.; Rosendahl, K.E.; Bolkesjø, T.F. Impacts of green deal policies on the Nordic power market. Util. Policy 2023, 80, 101475. [Google Scholar] [CrossRef]
- Liu, S.; Huang, Y.; Wang, Y.; Shao, Q.; Zhou, H.; Wang, J.; Chen, C. Incentive Mechanisms to Integrate More Renewable Energy in Electricity Markets in China. Energies 2023, 16, 6573. [Google Scholar] [CrossRef]
- Jinqi, L.; Jihong, W.; Joel, C. Evolution and reform of UK electricity market. Renew. Sustain. Energy Rev. 2022, 161, 112317. [Google Scholar]
- Bock, J.; Geissel, S. Evolution of stock market efficiency in Europe: Evidence from measuring periods of inefficiency. Financ. Res. Lett. 2024, 62, 105129. [Google Scholar] [CrossRef]
- Micklitz, H. Book Review: Personal Debt in Europe: The EU Financial Market and Consumer Insolvency, by Federico Ferretti and Daniela Vandone; Common Market Law Review; Cambridge University Press: Cambridge, UK, 2023. [Google Scholar]
- Chen, Y.; Zhang, W.; Zhang, C.; Wu, P. Operation mechanism of inter-provincial and intra-provincial spot market for promoting new energy consumption. Autom. Electr. Power Syst. 2021, 45, 104–113. [Google Scholar]
- Ji, P.; Zeng, D.; Sun, T.; Huang, W.; Shen, W. Study on Deepening the Construction of National Unified Electricity Market System—Taking the design of the coupling evolution path of inter-provincial and intra-provincial markets as the breakthrough point. Price Theory Pract. 2022, 2022, 105–109. [Google Scholar]
- Liu, Y.; Jiang, Z.; Guo, B. Assessing China’s provincial electricity spot market pilot operations: Lessons from Guangdong province. Energy Policy 2022, 164, 112917. [Google Scholar] [CrossRef]
- Zhao, X.; Sun, C.; Zhong, Z.; Liu, S.; Yang, Z. Effect of market structure on renewable energy Development—A simulation study of a regional electricity market in China. Renew. Energy 2023, 215, 118911. [Google Scholar] [CrossRef]
- Du, F.; Hu, R.; Liu, Z.; Zhang, X.; Zhang, R. Research on Regional Spot Market Clearing Model Considering Subregional Power Exchange Constraints. J. Phys. Conf. Ser. 2023, 2592, 012069. [Google Scholar] [CrossRef]
- Guan, L.; Chang, J.; Sun, D.; Wang, D.; Huang, G.; Zhang, R.; Zhao, T. Analysis and Thinking on Trial Operation of Inter-provincial Electricity Spot Market. Autom. Electr. Power Syst. 2024, 48, 2–10. [Google Scholar]
- Liu, S.; Cai, B.; Gao, M.; Wu, Y.; Chen, K.; Zhu, X.; He, S. Empirical evidence for the edge of a centralized regional market over a cross-province balancing market in allocating electricity resources: A case study of Yunnan in China. Energy Rep. 2023, 9 (Suppl. S7), 911–921. [Google Scholar] [CrossRef]
- Chen, Y.; Wang, H.; Yan, Z.; Xu, X.; Zeng, D.; Ma, B. A two-phase market clearing framework for inter-provincial electricity trading in Chinese power grids. Sustain. Cities Soc. 2022, 85, 104057. [Google Scholar] [CrossRef]
- Wang, C.; Ni, M.; Shi, Y. Optimizing electricity market Clearing with Segmented Electricity Prices: A Bilevel Model. Sustainability 2023, 15, 13575. [Google Scholar] [CrossRef]
- Liu, X.; Conejo, A.J. Single-Level Electricity Market Equilibrium with Offers and Bids in Energy and Price. IEEE Trans. Power Syst. 2021, 36, 4185–4193. [Google Scholar] [CrossRef]
- Zhang, L.; Chen, H.; Huang, X.; Qiao, N.; Zhang, C. The design logic of European electricity balance market mechanism and its enlightenment to the development planning of auxiliary service market under the goal of carbon neutrality in China. Proc. CSEE 2023, 43 (Suppl. S1), 14–30. [Google Scholar]
- Zhang, L. Thoughts on the Construction of China electricity market System under the New Situation. China Power Enterp. Manag. 2022, 4, 20–25. [Google Scholar]
- Zhang, H.; Hun, H.; Zhang, L. Framework design of regional power grid security check mechanism in complex market environment. China Electr. Power 2021, 54, 11–18. [Google Scholar]
- Liu, Z.; Zhao, S.; Luo, X.; Huang, Y.; Gu, R.; Li, J.; Li, L. Two-layer energy dispatching and collaborative optimization of regional integrated energy system considering stakeholders game and flexible load management. Appl. Energy 2025, 379, 124918. [Google Scholar] [CrossRef]
- Apel, C.; Ozan, K. Risk-averse optimal bidding strategy considering bi-level approach for a renewable energy portfolio manager including EV parking lots for imbalance mitigation. Sustain. Energy Grids Netw. 2021, 28, 100539. [Google Scholar]
- Wu, J.; Wang, J.; Kong, X. Strategic bidding in a competitive electricity market: An intelligent method using Multi-Agent Transfer Learning based on reinforcement learning. Energy 2022, 256, 124657. [Google Scholar] [CrossRef]
- Paudel, D.; Das, K. A deep reinforcement learning approach for power management of battery-assisted fast-charging EV hubs participating in day-ahead and real-time electricity markets. Energy 2023, 283, 129097. [Google Scholar] [CrossRef]
- Harrold, D.; Cao, J.; Fan, Z. Renewable energy integration and microgrid energy trading using multi-agent deep reinforcement learning. Appl. Energy 2022, 318, 119151. [Google Scholar] [CrossRef]
- Lu, R.; Hong, S.H.; Zhang, X. A Dynamic pricing demand response algorithm for smart grid: Reinforcement learning approach. Appl. Energy 2018, 220, 220–230. [Google Scholar] [CrossRef]
- Chen, H. Research on Optimal Dispatching Method of Power and Energy System with 0–1 Variables. Ph.D. Thesis, South China University of Technology, Guangzhou, China, 2019. [Google Scholar]
- New Energy Cloud of State Grid Corporation of China. Data Set of Installed Capacity of Provinces in East China. Available online: https://sgnec.sgcc.com.cn/ (accessed on 20 January 2024).
- National Development and Reform Commission Office. Typical Power Load Curves of Provincial Power Grids in China. 2020. Available online: https://www.ndrc.gov.cn/xwdt/tzgg/202012/P020201202546044875868.pdf (accessed on 20 January 2024).
Disclaimer/Publisher’s Note: The statements, opinions and data contained in all publications are solely those of the individual author(s) and contributor(s) and not of MDPI and/or the editor(s). MDPI and/or the editor(s) disclaim responsibility for any injury to people or property resulting from any ideas, methods, instructions or products referred to in the content. |
© 2025 by the authors. Licensee MDPI, Basel, Switzerland. This article is an open access article distributed under the terms and conditions of the Creative Commons Attribution (CC BY) license (https://creativecommons.org/licenses/by/4.0/).