Abstract
The influence of various factors, such as the natural properties of rock and in-situ stress conditions, results in uneven and rough fracture surfaces post-hydraulic fracturing. This significantly impacts the transport and placement of proppant within the fracture, thereby affecting the effectiveness of fracture stimulation. This study employs the rectangular wave method to characterize the roughness of fracture wall morphology, detailing the variation of roughness by altering the number and height of micro-protuberances, and constructs a three-dimensional model of rough fractures. The Euler–Euler model is utilized to simulate the placement and transport patterns of proppant within the fracture. Sand banks within the fracture profile are segmented based on proppant concentration, and the dimensionless area of each concentration interval is calculated to analyze the structure of sand banks and the suspension and settling effects of proppant. This research investigates the variation patterns of sand dune structures within fractures characterized by different levels of roughness and morphologies; it also examines the impact of injection velocity and fracturing fluid viscosity on the transport and placement of proppant within rough fractures. The findings indicate that the complex spatial structure of rough fractures modifies the edge shape of sand dunes. Moreover, it impedes proppant transport, leading to the formation of sand plugs near the wellbore. The maximum distance of sand placement for rough fractures is only 55.2% of that for fractures without considering roughness. The increase in the number and height of micro-protrusions enhances fracture roughness, leading to a stronger retarding effect. However, variations in these two types of roughness have distinct impacts on the morphology of sand dunes. Higher injection velocities facilitate the transport of proppant within rough fractures. The furthest distance of proppant placement at an injection velocity of 0.5 m3/min is only 68.4% of that at an injection velocity of 1.5 m3/min. The study’s findings contribute to a more intuitive understanding of the impact of rough fracture wall surfaces on the transport and placement patterns of proppant, providing a foundation for the optimization of fracturing design and operational parameters.
1. Introduction
China boasts a wealth of unconventional oil and gas resources, which have emerged as the predominant contributors to the newly identified oil and gas reserves in recent years [1]. Enhancing the exploitation and application of unconventional oil and gas resources is essential for augmenting national energy security [2]. Fracturing represents a pivotal technology in improving the recovery efficiency of unconventional oil and gas reservoirs [3]. Nevertheless, there persists a phenomenon where a portion of the enhanced wells exhibit lower than expected production capacities. The monitoring data reveal that the deposition of some proppant particles within the vicinity of the wellbore results in insufficient fracture support length, which is one of the primary factors contributing to the lower production capacity [4,5,6]. Therefore, it is necessary to implement efficient fracturing measures to transform the reservoir, ensuring the delivery of proppant to the depths of the fractures to achieve effective support and establish high-permeability oil and gas channels [7,8,9].
To gain a deeper understanding of the transport behavior and placement patterns of proppant within rough fractures, numerous scholars have conducted extensive physical experiments and numerical simulations. Huang et al. [10] employed a casting process to three-dimensionally reconstruct the surface of coarse fractures in outcrop rock from hydraulic fracturing, establishing a large-scale visualized experimental setup for coarse fractures to conduct proppant transport experiments. They studied the typical characteristics and underlying mechanisms of proppant transport and placement within coarse fractures. Zhou et al. [11] analyzed the rough surface characteristics of shale and tight sandstone samples and established a rough fracture model. They employed the Two-Fluid Model (TFM) to simulate the transport process of proppant within rough fractures and investigated the impact of wall retardation effects on proppant transport and settlement. Huang et al. [12] conducted a series of proppant transport experiments to compare the transport mechanisms of proppant in rough and smooth fractures, quantitatively revealing the impact of roughness on the instantaneous transport of proppant and the final placement of proppant. Li et al. [13] combined digitalization of rough surfaces with 3D printing technology to construct a double-sided rough fracture model, and explored the accumulation and transport mechanisms of proppant in vertical rough fractures. Experimental studies on the transport mechanisms of proppant within rough fractures have certain limitations, such as the small fracture size due to the scale limitations of experimental setups, the high cost of simulating fracture roughness in experiments, and the significant differences between experimental conditions and actual reservoir conditions. Guo et al. [14] employed the Computational Fluid Dynamics-Discrete Element Method (CFD-DEM) for numerical simulation to investigate the migration and placement of proppant within complex fractures, taking into account the roughness of the fracture walls. Their study focused on how the roughness of the fracture surfaces impacts the distribution and transport of proppant, which is crucial for understanding the effectiveness of hydraulic fracturing treatments in enhancing the conductivity of the fractures. Zhou et al. [15] utilized Synfrac software to simulate the morphology of rough fractures and real rock fractures. They employed a combined approach of Computational Fluid Dynamics (CFD) and Discrete Element Method (DEM) to study the fundamental characteristics of proppant transport within rough fractures. Yin et al. [16] proposed a method for generating rough surface fractures based on fractal interpolation theory and established a proppant-fracturing fluid two-phase flow model coupled with Computational Fluid Dynamics (CFD) and Discrete Element Method (DEM). This model takes into account the interactions between particles, particle-wall, and particle-fluid, and has been verified with experimental data, proving its capability to accurately match the transport and accumulation of proppants in rough fractures. Huang et al. [17] employed Computational Fluid Dynamics (CFD) modeling to investigate the interactions between proppant particles, the carrying fluid phase, and the rough fracture walls. Wang et al. [18] scanned the surface morphology of rock samples after fracturing and generated fractures with varying roughness using high-order interpolation functions. They established a numerical model for proppant transport under different roughness conditions based on the Euler–Euler two-phase flow model. Zhang et al. [19] employed laboratory-scale synthetic rough fractures that mimic real rock fractures and utilized an improved Computational Fluid Dynamics-Discrete Element Method (CFD-DEM) coupling approach to investigate the impact of fracture roughness on proppant transport and placement. Current numerical simulation studies on the impact of rough fracture wall surfaces on proppant transport and placement patterns are largely based on modeling derived from scanned results of actual fracture surfaces, which leads to the creation of fracture models with very small dimensions (at the cm/mm scale). The simulation results only reflect the impact of local characteristics of rough fractures on the mechanisms and patterns of proppant transport and placement, and cannot represent the overall distribution of proppant within the entire fractured network.
To address the issue of small-scale geometric modeling of rough fractures and to investigate the overall impact of rough fracture walls on the transport and placement patterns of proppants, this paper employs a rectangular wave to describe the roughness of the fracture walls and establishes a three-dimensional model of rough fracture. The Euler–Euler model was selected to simulate the placement and transport of proppant within the fracture, and the dimensionless area describing the sand arch structure in different concentration intervals of the fracture was calculated. The study investigated the variations in sand arch structures within fractures of different roughness levels and morphologies, and analyzed the impact of injection velocity, injection concentration, and fracturing fluid viscosity on proppant transport and placement within rough fractures, establishing a foundation for elucidating the transportation and placement patterns of proppant within fractures.
2. Theoretical Basis
2.1. Characterization of Fracture Roughness
Deng et al. [20] reconstructed complex fracture structures from CT images by establishing an image processing method that incorporates geometric shape constraints. In this research, the rough morphology of the fracture wall is approximated as a rectangular wave, and the associated properties of the rectangular wave are employed to characterize the patterns of roughness variation. The schematic diagram of the equivalent transformation is shown in Figure 1.
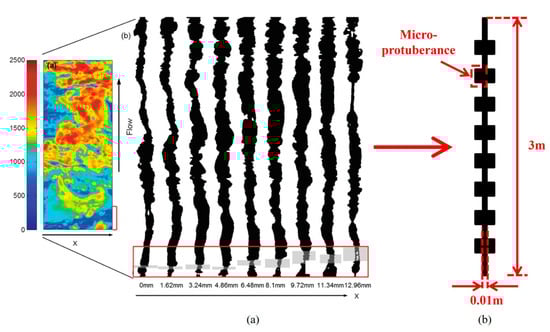
Figure 1.
Equivalent Transformation Schematic Diagram. (a) Distribution and profile of small-scale rough fracture openings based on CT impact reconstruction [20]. (b) Describing large-scale fracture wall roughness patterns with rectangular waves.
In practical fracturing operations, the morphologies of roughness among various fractures are not uniform. To more conveniently delineate the disparities in the roughness morphologies of fractures, the surface roughness ratio, as proposed by Lange et al. [21], is employed to quantify the degree of roughness.
In the formula, represents the true surface area, while denotes the projected area. As can be seen from Figure 1 and Equation (2), the roughness of the fracture surface mainly depends on the total size of the lateral surface area of the micro-protuberances.
Incorporating the properties of rectangular waves and methods for characterizing roughness, it can be observed that as the wavelength of the rectangular wave decreases, the number of wall micro-protrusions increases, leading to an increase in roughness. Similarly, as the wave height of the rectangular wave increases, the height of the wall micro-protrusions increases, resulting in an increase in roughness.
2.2. Mathematical Model
The flow of sand-carrying fluid in fractures is considered a solid-liquid two-phase flow problem. In this paper, a mixture turbulence model is employed for the simulation and calculation. In the mixture turbulence model, the motion of the sand-carrying fluid can be described using the momentum equations of the mixture, the continuity equation, and the transport equation for the solid phase volume fraction. The momentum equation can be expressed as follows:
In Equation (3), represents the mass-average velocity of the mixture, ; is the pressure, ; is the gravitational acceleration; ; is the mass fraction of solid phase; is the relative velocity between the solid and liquid phases; ; is the density of the mixture, given by
In Equation (4), is the density of the solid phase and is the density of the fluid phase; is the solid phase volume fraction.
According to the Krieger expression [22], the viscosity of a mixture can be represented as
In Equation (5), represents the dynamic viscosity of the liquid; denotes the maximum particle concentration.
In the mixture model, the continuity equation is given by
The transport equation for the solid phase can be expressed as follows:
In Equation (7), represents the solid phase velocity. It can be expressed as
Substitute Equation (8) into Equation (7):
Rao et al. [23] and Subia et al. [24] used the particle flux instead of the solid-liquid relative velocity to describe the continuity equation:
Accordingly, the solid phase transport equation is
Therefore, the relationship between the solid-liquid relative velocity and the particle flux can be derived as
In conclusion, it can be derived that
In Equation (13), is the settling velocity of a single particle in a liquid, m/s; and are empirical fitting parameters:
Among them, is the radius of the particle, m.
The shear rate tensor is represented as
In this paper, the transport and placement patterns of proppants are simulated using the COMSOL Multiphysics® 6.2 simulation software.
3. Material and Methods
3.1. Geometric Model
As shown in Figure 2, the sand-carrying fluid mainly flows in the y-direction within the rough fracture, with the direction of gravity being the negative z-axis. The semicircular edge a serves as the entrance for the sand-carrying fluid, which is the connection point between the fracture and the wellbore, and is set as a velocity inlet boundary. To reduce computational load and shorten calculation time, the geometric model is designed as half of the entire fracture. Assuming that the cap rock does not produce fractures, edge c is the connection point between the fracture and the cap rock. The top and bottom surfaces of the fracture are both set as no-slip boundary conditions. Edge d is the connection point between the fracture and the surrounding reservoir, and it is set as a pressure outlet boundary. λ represents the wavelength of the micro-protrusions, and H represents the wave height of the micro-protrusions.
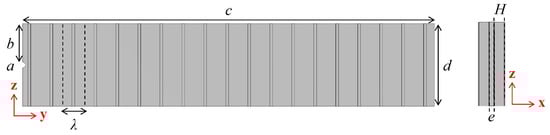
Figure 2.
Three-dimensional rough fracture geometric model.
Considering computational load, the radius of the horizontal well is set to 0.02 m, the height of the fracture is set to 0.6 m, the length of the fracture is set to 3 m, the thickness of the fracture is set to 0.01 m, λ (the wavelength of the micro-protrusions) is set to 0.16 m, and H (the wave height of the micro-protrusions) is set to 0.02 m.
The geometric model was meshed and solved using the finite element method. To more accurately capture the solid-phase parameters, mesh refinement was applied near the entrance and the lower boundary. The basic parameters used in the calculations are shown in Table 1.

Table 1.
Parameters.
3.2. Assumptions
This study utilizes the Euler–Euler model to simulate the placement and transport patterns of proppant within a rough fracture, with the following assumptions:
- (1)
- The fracturing fluid is regarded as a Newtonian fluid.
- (2)
- The fluid loss in the fracture is neglected, assuming that the flow of the fracturing fluid within the fracture will not be diminished due to adsorption by the fracture walls.
- (3)
- Due to the turbulent flow regime of the fracturing fluid carrying proppant within the fracture, the standard k-ε model is employed.
- (4)
- The proppant particles are considered to be uniform and of the same size, and no phase transformation occurs within the proppant particles.
- (5)
- During the flow of the fracturing fluid, there is a mutual coupling between the fluid and the proppant phase. The fracturing fluid exerts buoyancy and drag forces on the proppant, and the acceleration of the solid particles exerts an apparent mass force on the fluid. Other interphase forces are considered negligible.
3.3. Model Validation
Establish a three-dimensional vertical planar fracture model for model validation. The fracture has a length of 5 m, a height of 0.6 m, and a width of 0.03 m. The inlet radius is 0.02 m, and the total number of grid cells is 87,659. The mesh and boundary settings are shown in Figure 3. The proppant particle size, volume fraction, and density are 2 mm, 0.2, and 2650 kg/m3, respectively. The density and viscosity of the fluid are 1000 kg/m3 and 10 mPa·s, respectively. The injection rate is 0.2 m3/min. In the simulation, a velocity inlet and a pressure outlet were used.
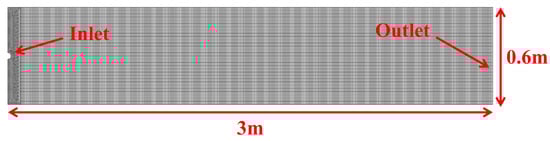
Figure 3.
Mesh and boundary settings.
The experimental data from Wang et al. [25] were used to validate the model presented in this paper. The dimensionless area of the sand bank at dynamic equilibrium under the injection velocity condition of 0.2 m/s in their experiments was compared. The comparison results are shown in Figure 4.
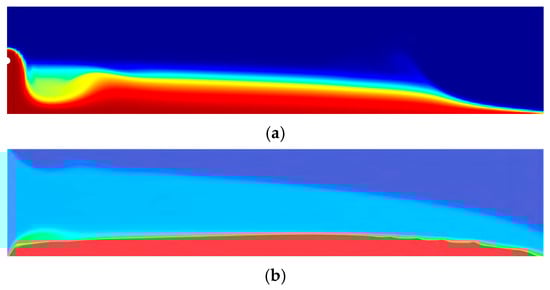
Figure 4.
Comparison of sandbar morphologies. (a) The morphology of the sandbar in this model. (b) The morphology of the sandbar in [25].
The dimensionless area of the sand bank obtained from this model is 0.4874, while that reported in Reference 25 is 0.5015. The difference is 2.81%, which indicates that the model presented in this paper has strong rationality. The discrepancy in the results is primarily due to differences in the inlet velocity boundary conditions. In this study, the inlet boundary geometry is set as the cylindrical side surface, whereas in [25], the inlet boundary geometry is rectangular. In addition, the Eulerian–Eulerian model also has certain limitations. For example, some of its closure equations are not suitable for describing the static behavior of proppant after settling, and thus cannot accurately reproduce the quasi-static state of proppant settling observed in laboratory experiments.
4. Results and Discussion
4.1. Comparison of Proppant Placement Morphology in Smooth and Rough Fractures
The term “sand spreading morphology” refers to the depiction of the accumulation state of solid sand particles during a specific moment in the sand spreading process, where the concentration of particles at various locations is calculated and then illustrated using contour plots or field diagrams. By employing the parameter settings outlined in Table 1, calculations were conducted to determine the distribution of particle concentrations, thereby yielding the sand spreading morphologies at various time points.
The fracture profile can be divided into sand-free and sand-rich regions based on the presence of sand. This paper further categorizes the sand-rich region according to the concentration of sand placement, analyzing the structure of the sandbar and the suspension and settlement effects of the proppant. In this study, the concentration ranges are delineated as follows: areas with a concentration of 0–0.1 are designated as low-concentration regions; regions with a concentration of 0.1–0.2 are categorized as medium-concentration regions; and areas with a concentration above 0.2 are identified as high-concentration regions.
Comparing Figure 5 and Figure 6, it can be observed that there are differences in the sandbar morphology between rough and smooth fractures. In smooth fractures, the leading edge of the proppant placement forms a “sand pocket” that advances forward, whereas in rough fractures, the sand placement morphology within the fracture maintains a slope-like shape at all times, and the edges of the sandbar exhibit a serrated pattern.
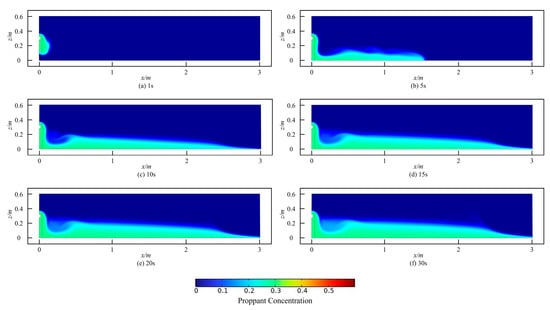
Figure 5.
The morphology of sand dikes at different moments in smooth fracture.
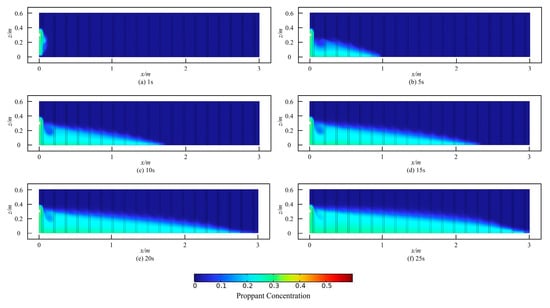
Figure 6.
The morphology of sand dikes at different moments in rough fracture.
As depicted in Figure 7, the maximum distance of sand placement in smooth fractures increases linearly with time and has a relatively high slope, whereas the curve of the maximum distance of sand placement in rough fractures exhibits nonlinearity, with the slope gradually decreasing over time.
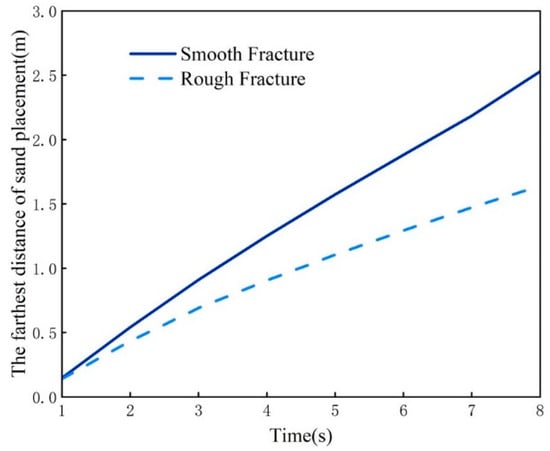
Figure 7.
The maximum distance of sand placement in smooth versus rough fractures.
As depicted in Figure 8, the dimensionless area within smooth and rough fractures across various concentration intervals is presented. In the early stages, the sand ridge area within smooth fractures increases rapidly, while in the middle and later stages, the rate of change gradually decelerates. The sand ridge area within rough fractures essentially increases linearly with time. In smooth fractures, the sand ridge area in the low-concentration region is dominant, while in rough fractures, the sand ridge structure is more uniform. At 20 s, the area of the low-concentration region in the rough fracture is only 56.8% of that in the smooth fracture. Rough wall surfaces exacerbate the sedimentation behavior of proppant particles.
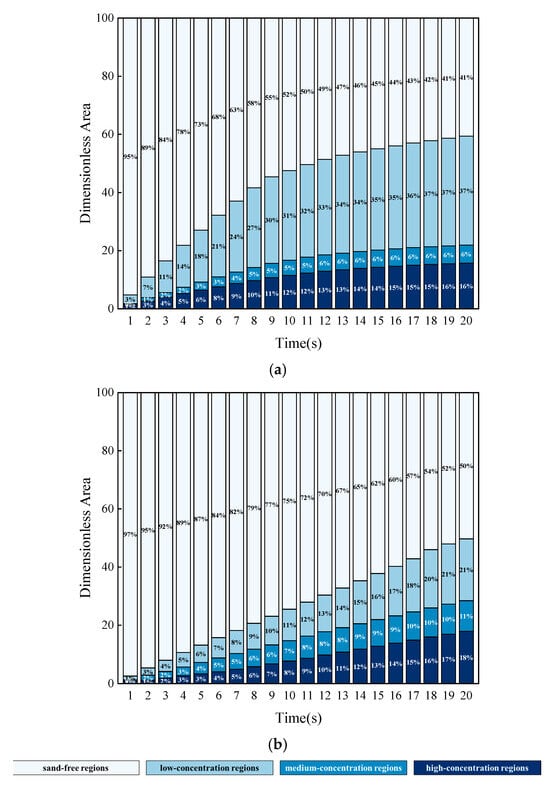
Figure 8.
The dimensionless area across various concentration intervals within both smooth and rough fractures. (a) Smooth Fracture. (b) Rough Fracture.
4.2. The Impact of the Number of Micro-Protuberances
With all other parameters held constant, the distribution of sand placement concentration within rough fractures with varying numbers of micro-protuberances at 20 s is shown in Figure 9. With an increase in the number of micro-protuberances, the roughness of the fracture increases, and the degree of serration along the edges of the sand barrier diminishes progressively.
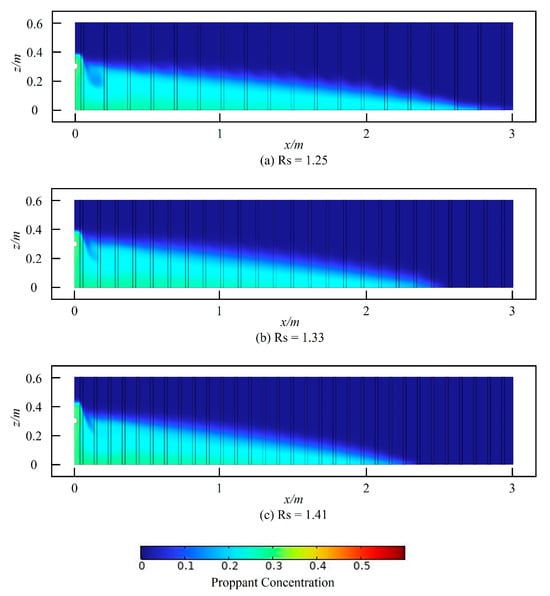
Figure 9.
The sand placement concentration distribution in rough fractures with varying numbers of micro-protuberances at 20 s.
The maximum sand placement distance within the rough fracture at various times is shown in Figure 10. When the fracture roughness is 1.25, 1.33, and 1.41, the maximum proppant placement distance within the fracture at 18 s is 2.734 m, 2.4018 m, and 2.1948 m, respectively. With the increase in fracture roughness, the resistance effect is enhanced, and, consequently, the maximum distance of sand placement within the fracture at the same moment decreases.
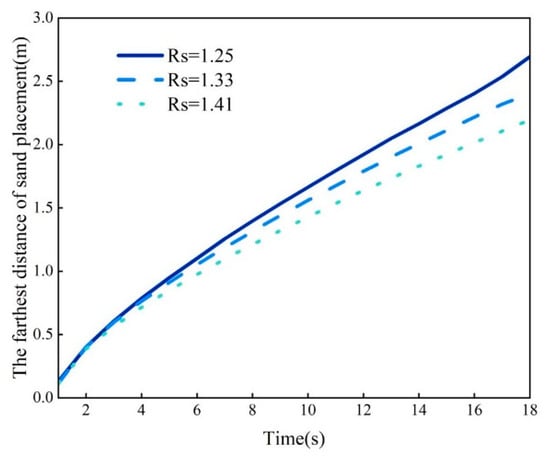
Figure 10.
The maximum sand placement distance in rough fractures with varying numbers of micro-protuberances.
As shown in Figure 11, the dimensionless area of each concentration interval within the fracture increases progressively with the number of micro-protuberances. With an increase in fracture roughness, the sand barrier area decreases, with the reduced area primarily concentrated in the low and high concentration regions. At 20 s, the sand barrier area for Rs = 1.41 is only 86% and 87.8% of that for Rs = 1.25 and Rs = 1.33, respectively.
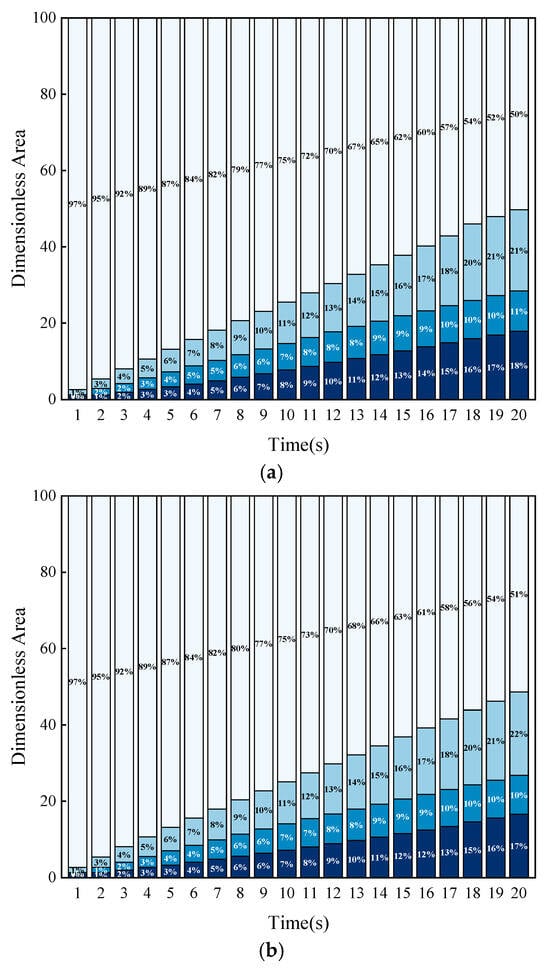
Figure 11.
The dimensionless area of various concentration intervals in rough fractures with different numbers of micro-protuberances. (a) Rs = 1.25; (b) Rs = 1.33; (c) Rs = 1.41; (d) Comparison of dimensionless area of sandstone dikes with different rough fractures at 20 s.
4.3. The Impact of the Height of Micro-Protuberances
With all other parameters held constant, the distribution of sand placement concentration in rough fractures with varying micro-ridge heights at 20 s is shown in Figure 12. As the height of micro-protuberances increases, the roughness of the fracture surface also increases, leading to a progressively more pronounced serration at the edges of the sand barrier.
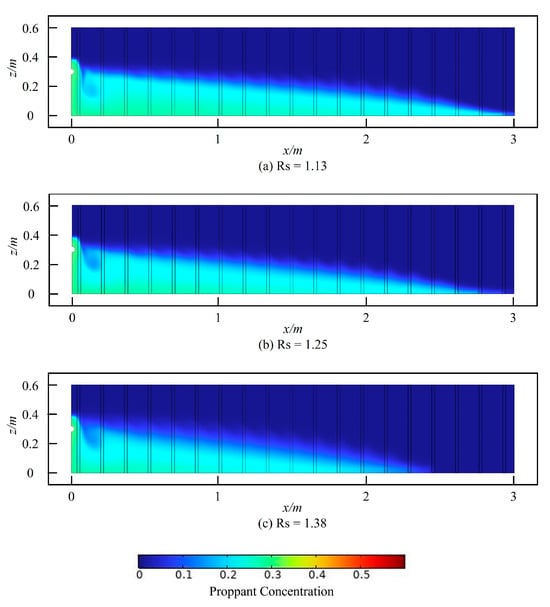
Figure 12.
The sand placement concentration in rough fractures with different heights of micro-protuberances at 20 s.
The maximum distance of sand placement within the rough fracture at various times is depicted in Figure 13. When the fracture roughness is 1.13, 1.25, and 1.38, the maximum proppant placement distance within the fracture at 14 s is 2.594 m, 2.1649 m, and 1.9067 m, respectively. As the fracture roughness increases, the resistance effect gradually intensifies, and the maximum distance of sand placement within the fracture at the same moment correspondingly decrease.
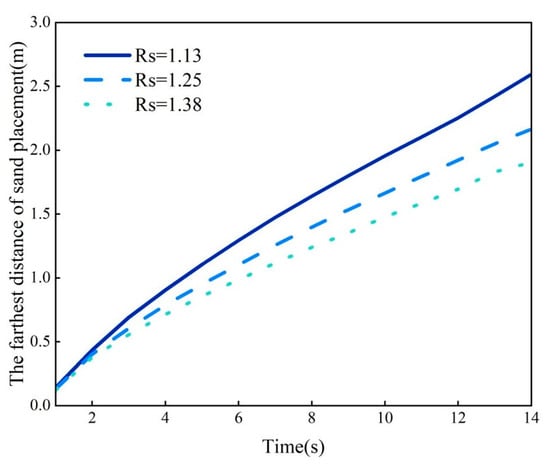
Figure 13.
The maximum sand placement distance in rough fractures with different micro-ridge heights.
Figure 14 illustrates the dimensionless areas within the rough fracture at various concentration intervals at different times under the condition of increasing micro-protrusion height. As the height of micro-protrusions increases, the roughness of the fracture enhances, leading to a reduction in the sand ridge area, which is predominantly concentrated in the high-concentration regions, while the area in the medium-concentration regions remains essentially unchanged. At 20 s, the sand ridge area for Rs = 1.38 is only 83.1% and 88.0% of that for Rs = 1.25 and Rs = 1.13, respectively.
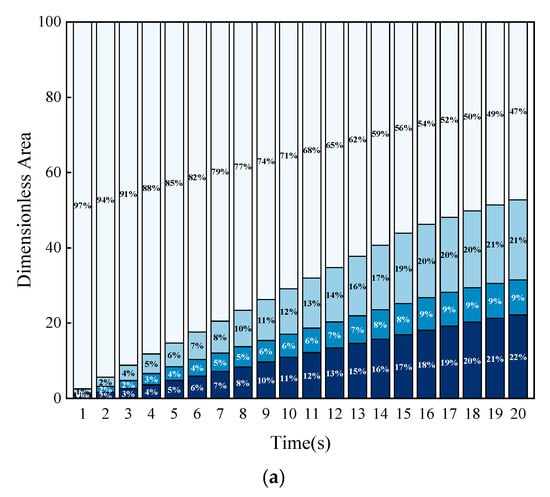
Figure 14.
The dimensionless area of various concentration intervals in rough fractures with different heights of micro-protuberances. (a) Rs = 1.13; (b) Rs = 1.25; (c) Rs = 1.38; (d) Comparison of dimensionless area of sandstone dikes with different rough fractures at 20 s.
4.4. The Impact of Different Roughness Morphologies
Under conditions of constant roughness, variations in the morphology of the rough wall also lead to dissimilar impacts on the transport and placement patterns of the proppant. Construct four types of rough fractures: Fracture I (λ = 0.1 m, H = 0.01 m), Fracture II (λ = 0.15 m, H = 0.015 m), Fracture III (λ = 0.2 m, H = 0.02 m) and Fracture IV (λ = 0.26 m, H = 0.025 m). It can be observed that, under identical roughness conditions, the quantity of micro-protrusions is inversely proportional to their height.
At 20 s, the distribution of sand concentration in fractures with identical roughness but varying roughness morphologies is depicted in Figure 15. With the increase in the height of micro-protrusions, the serrated nature at the edges of the sand ridges becomes increasingly pronounced.
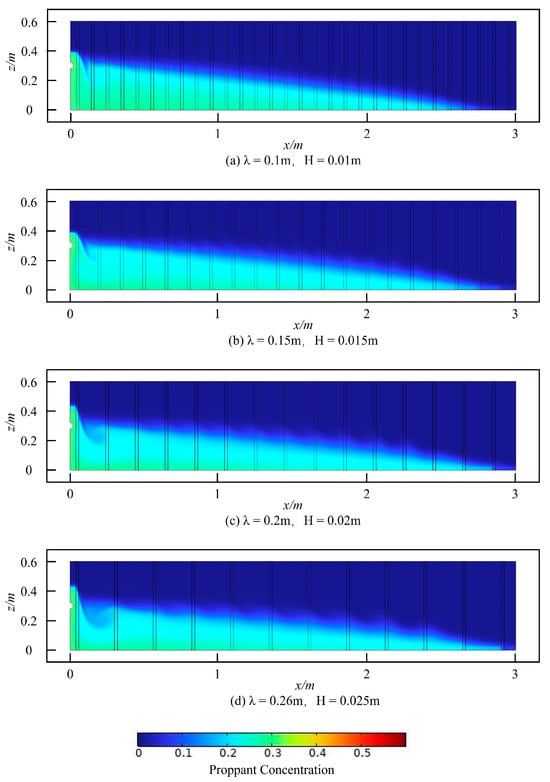
Figure 15.
The sand concentration distribution in the 20 s period for cracks of the same roughness but different morphologies.
The furthest distances of sand placement in fractures with the same roughness but different roughness morphologies are illustrated in Figure 16. Fracture I (λ = 0.1 m, H = 0.01 m), Fracture II (λ = 0.15 m, H = 0.015 m), Fracture III (λ = 0.2 m, H = 0.02 m), and Fracture IV (λ = 0.26 m, H = 0.025 m) exhibit the maximum sand placement distances of 2.2534 m, 2.3892 m, 2.5501 m, and 2.7229 m, respectively, at 15 s.
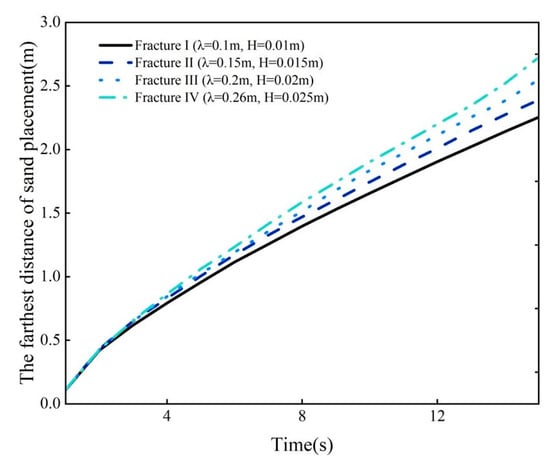
Figure 16.
The maximum sand placement distances in fractures with identical roughness but varying roughness morphologies.
Figure 17 illustrates the non-dimensional areas across different concentration intervals for fractures with uniform roughness but varying morphologies. It is observed that as the number of micro-protrusions increases (with a corresponding decrease in their height), there is a slight reduction in the sand ridge area within the fracture profile. Within the sand ridge zone, the area of the high-concentration region exhibits a decrease with an increase in micro-protrusion count (and a reduction in their height), whereas the areas of the low and medium-concentration regions show a slight increase.
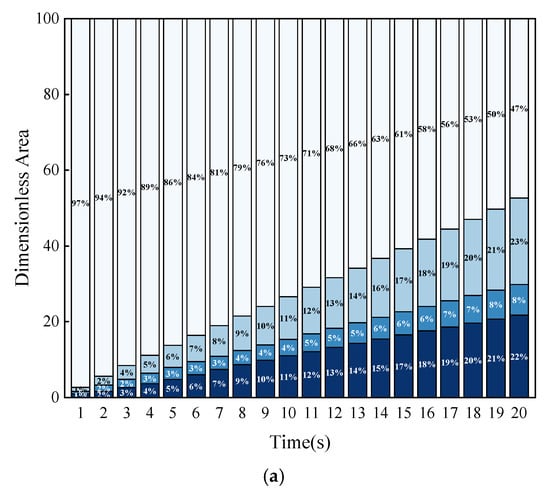
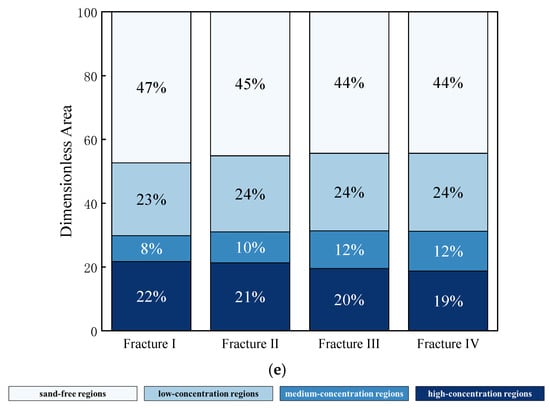
Figure 17.
The dimensionless area of various concentration intervals for cracks with the same roughness but different roughness patterns. (a) Fracture I (λ = 0.1 m, H = 0.01 m); (b) Fracture II (λ = 0.15 m, H = 0.015 m); (c) Fracture III (λ = 0.2 m, H = 0.02 m); (d) Fracture IV (λ = 0.26 m, H = 0.025 m); (e) Comparison of dimensionless area of sandstone dikes under different roughness morphologies at 20 s.
4.5. The Impact of Injection Velocity
With all other parameters held constant, the morphology of the sand ridge at 20 s under different injection velocities is depicted in Figure 18. As the injection velocity increases, the degree of serration at the sand ridge edges gradually intensifies.
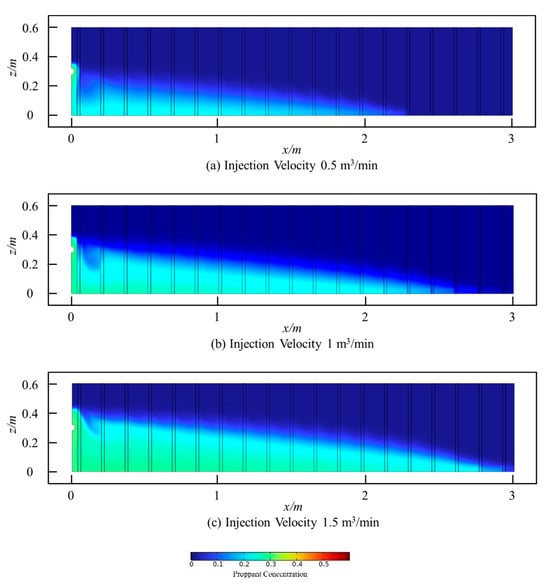
Figure 18.
The morphology of the sand ridge at 20 s under varying injection velocities.
The maximum distance of sand placement within the fracture is shown in Figure 19. At injection velocities of 0.5 m3/min,1.0 m3/min, and 1.5 m3/min, the maximum sand placement distances at 15 s are 1.8668 m, 2.287 m, and 2.7291 m, respectively. As the injection velocity increases, the maximum distance of sand placement also increases, and the curve of the maximum sand placement distance over time exhibits a more pronounced nonlinear characteristic.
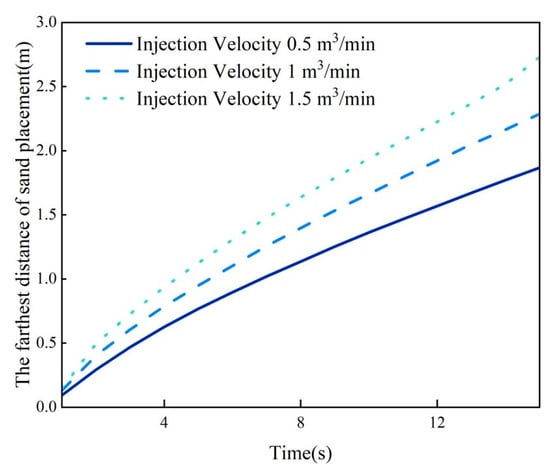
Figure 19.
The maximum proppant transport distance in rough fractures under varying injection velocity.
Figure 20 illustrates the dimensionless areas within the seam for various concentration intervals under different injection velocity conditions. The injection velocity significantly impacts the structure of the sandbar. At injection velocities of 0.5 m3/min and 1 m3/min, the area of low-concentration in the sandbar region is maximized at 20 s, while at an injection velocity of 1.5 m3/min, the high-concentration area becomes predominant. The variation in injection velocity primarily affects the sandbar structure through changes in the area of high-concentration regions. Under the 0.5 m3/min condition, the high-concentration area in the sandbar region is only 22.2% and 14.3% of that under the 1 m3/min and 1.5 m3/min conditions, respectively.
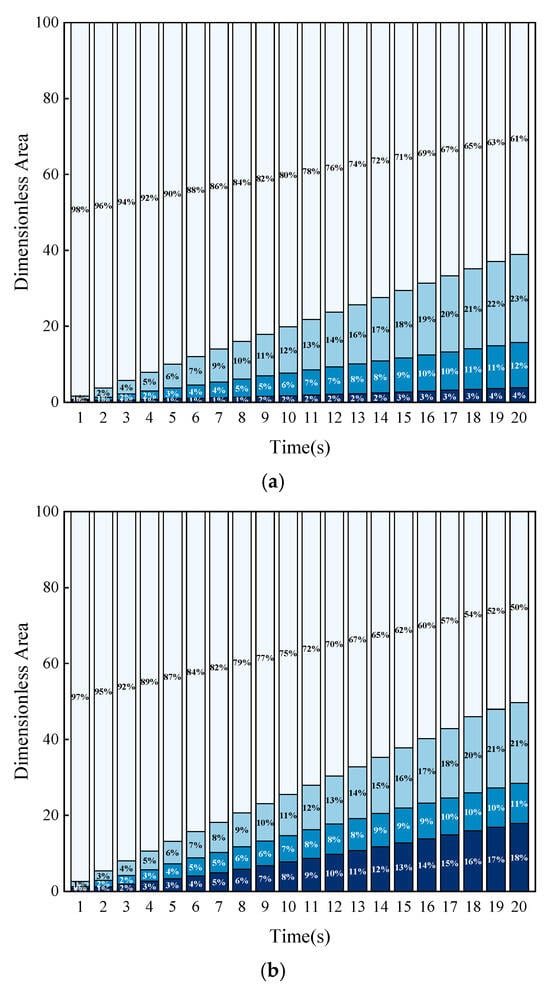
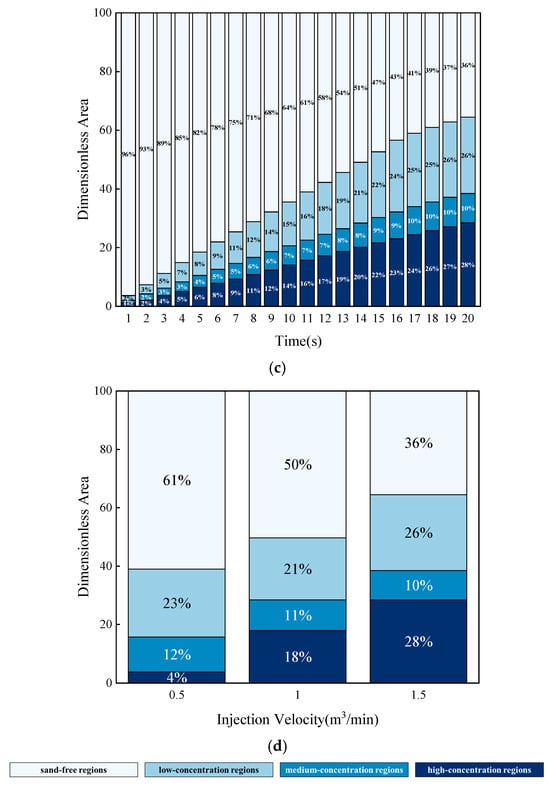
Figure 20.
The dimensionless area of rough fractures under different concentration ranges at various injection velocities. (a) Injection Velocity 0.5 m3/min; (b) Injection Velocity 1 m3/min; (c) Injection Velocity 1.5 m3/min; (d) Comparison of dimensionless area of sandstone dikes under different injection velocities at 20 s.
4.6. The Impact of Fracturing Fluid Viscosity
With all other parameters held constant, the distribution of proppant concentration at 20 s under varying viscosity conditions of the fracturing fluid is depicted in Figure 21.
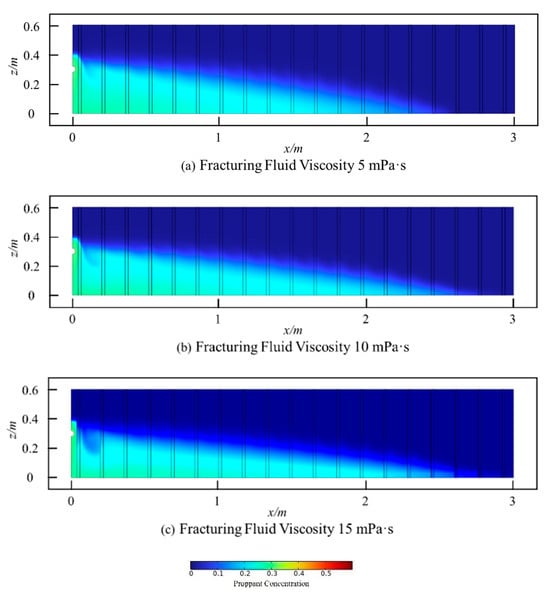
Figure 21.
The distribution of proppant concentration at 20 s in rough fractures under different viscosities of fracturing fluids.
The maximum proppant placement distance within the rough fractures is shown in Figure 22. At 18 s, the maximum proppant placement distances within the fractures were 2.4146 m, 2.6053 m, and 2.734 m for fracturing fluid viscosities of 5 mPa·s, 10 mPa·s, and 15 mPa·s, respectively. An increase in the viscosity of the fracturing fluid results in an increase in the maximum proppant placement distance.
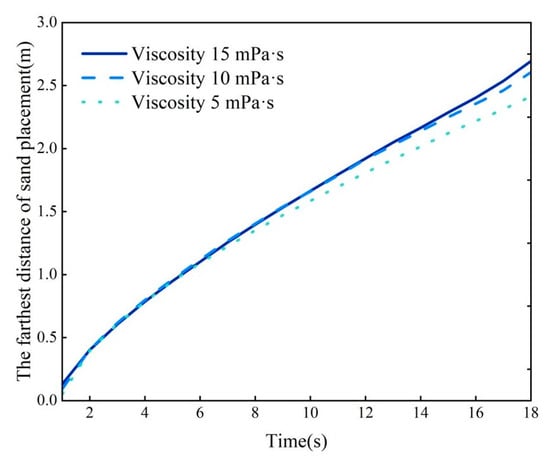
Figure 22.
The maximum proppant transport distance in rough fractures under varying viscosities of fracturing fluids.
As shown in Figure 23, the dimensionless area of different concentration regions varies with different fracturing fluid viscosities. At 20 s, the sand ridge area for a viscosity of 5 mPa·s is only 87.7% and 82.0% of the sand ridge areas for viscosities of 10 mPa·s and 15 mPa·s, respectively. Notably, the area of the low-concentration region of the sand ridge significantly increases. At 20 s, the area of the low-concentration region of the sand ridge for a viscosity of 5 mPa·s is only 75.0% and 65.6% of the areas for viscosities of 10 mPa·s and 15 mPa·s, respectively. An increase in fracturing fluid viscosity promotes the suspension behavior of the proppant.
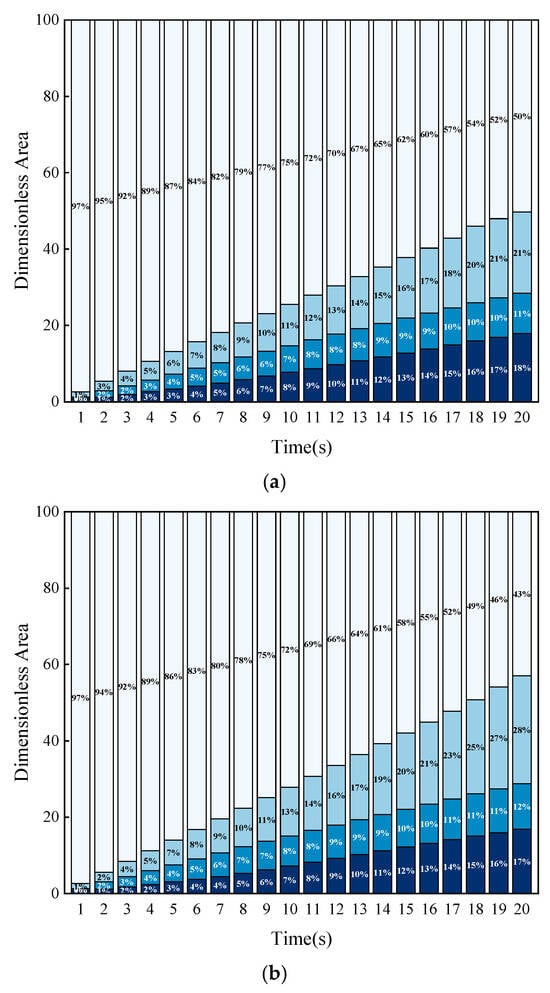
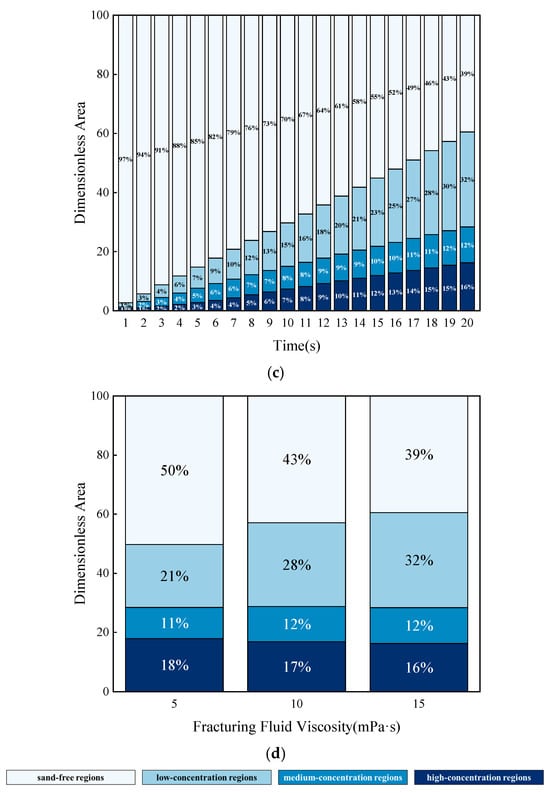
Figure 23.
The dimensionless area of rough fractures under different concentration ranges at various Fracturing Fluid Viscosity. (a) Viscosity 5 mPa·s; (b) Viscosity 10 mPa·s; (c) Viscosity 15 mPa·s; (d) Comparison of dimensionless area of sandstone dikes under different fluid viscosities at 20 s.
5. Conclusions
To elucidate the mechanisms and distribution patterns of proppant transport within fractures, this study employs a rectangular wave to describe the roughness of the fracture walls and establishes a three-dimensional model of a rough fracture. The Euler–Euler model was selected to simulate the placement and transport of proppant within the fracture, and the dimensionless area describing the sand arch structure in different concentration intervals of the fracture was calculated. The study investigated the variations in sand arch structures within fractures of different roughness levels and morphologies, and analyzed the impact of injection velocity, injection concentration, and fracturing fluid viscosity on proppant transport and placement within rough fractures. The main conclusions are as follows:
- (1)
- The rough and complex spatial structure of fractures can hinder the migration of proppant, leading to reduced support efficiency. The edges of rough fractures are serrated, and the sedimentation near the wellbore is significant, forming sand plugs. The furthest distance of proppant placement in rough fractures is only 55.2% of that in smooth fractures.
- (2)
- The increased roughness of fractures enhances the retarding effect. Both the quantity and height of micro-protrusions contribute to the increase in fracture roughness, but the changes in these two types of roughness have different impacts on the morphology of the sand ridge. An increase in the number of micro-protrusions weakens the serrated degree of the sand ridge edge, while an increase in the height of micro-protrusions leads to an enhanced serrated degree at the edge.
- (3)
- Higher injection rates are conducive to the transport of proppant in rough fractures, carrying the proppant deep into the fractures for effective support. The furthest distance of proppant placement at an injection velocity of 0.5 m3/min is only 68.4% of that at an injection velocity of 1.5 m3/min. The increase in fracturing fluid viscosity primarily serves to elevate the height of the sand ridge, promoting the suspension behavior of the proppant.
6. Limitations
There are two major limitations in this study that could be addressed in future research.
- (1)
- In actual reservoirs, natural fractures and bedding planes are often extensively developed. After hydraulic fracturing treatments, complex fracture networks are typically formed. However, this study has only conducted preliminary research on the transport and placement of proppants in rough single fractures. In the future, we will expand the scope of our research to further investigate the transport and placement behavior of proppants in complex fracture networks with rough walls. This research will provide an important theoretical basis and practical guidance for optimizing fracturing designs and selecting relevant parameters.
- (2)
- This study employs the Eulerian–Eulerian model to simulate the transport behavior of proppants in rough fractures. The model treats both the solid and liquid phases as continuous media, enabling efficient characterization of macroscopic flow features with relatively low computational costs, making it suitable for large-scale numerical simulations. However, as both phases are considered continuous, the model cannot precisely describe the trajectories of individual particles and their interactions. Consequently, it faces limitations in optimizing proppant parameters. In future research, simulations will be conducted using higher-precision models based on the large-scale fracture model.
Author Contributions
B.X., project administration, resources, funding acquisition, validation; H.L., data curation, visualization, writing—original draft preparation; C.W., visualization, validation; W.Z., resources; T.S., validation; M.Y., methodology, writing—review and editing; All authors have read and agreed to the published version of the manuscript.
Funding
We are very grateful to all those who contributed to this work. This research was supported by the Open Fund project of Sinopec Key Laboratory of Drilling Completion and Fracturing of Shale Oil and Gas (35800000-22-ZC0613-0029).
Data Availability Statement
The raw data supporting the conclusions of this article will be made available by the authors on request.
Conflicts of Interest
Authors Bo Xiao and Ming Yue were employed by the company Sinopec Research Institute of Petroleum Engineering Co., Ltd. The remaining authors declare that the research was conducted in the absence of any commercial or financial relationships that could be construed as a potential conflict of interest.
References
- Li, G.X.; Lei, Z.D.; Dong, W.H.; Wang, H.; Zheng, X.; Tan, J. Progress, challenges and prospects of unconventional oil and gas development of CNPC. China Pet. Explor. 2022, 27, 1. [Google Scholar]
- Wu, Y.H.; Wen, Q.Z.; Zhang, Y.X.; Sun, Q.Q.; Zhang, Y.X.; Wang, L.; Guo, S.T. Control optimization on proppant spiting. Fault-Block Oil Gas Field 2012, 19, 662–665. [Google Scholar]
- Zhao, J.Z.; Ren, L.; Shen, C.; Li, Y. Latest research progresses in network fracturing theories and technologies for shale gas reservoirs. Nat. Gas Ind. B 2018, 5, 533–546. [Google Scholar] [CrossRef]
- Wan, H.B.; Li, T.Z. Research status and prospect of deposition and transport of propellant in shale pneumatic fracture. Contemp. Chem. Ind. 2019, 48, 1775–1778. [Google Scholar]
- He, X.; Wei, D.; Yu, H.; Bai, B.; Chen, A.; Liang, T. Proppant Migration within a Rough Hydraulic Fracture. J. Porous Media 2023, 26, 1–15. [Google Scholar] [CrossRef]
- Zhu, W.Y.; Zhang, Q.T.; Yue, M.; Zhang, L. Effect of uneven distribution of proppant in fracture network on exploitation dynamic characteristics. Chin. J. Eng. 2020, 42, 1318–1324. [Google Scholar]
- Jiang, C.B.; Li, Q. Understanding and field practice of deep shale reservoir stimulation. J. Jianghan Pet. Univ. Staff Work. 2020, 33, 28–30. [Google Scholar]
- Xu, J.H.; Wen, S.C. Gel breaking performance evaluation and field application of clean fracturing fluid for development of low temperature coal bed gas. Contemp. Chem. Ind. 2018, 47, 520–523. [Google Scholar]
- Wang, X. Analysis of factors affecting proppant settlement in fractures. Petrochem. Ind. Technol. 2017, 24, 292. [Google Scholar]
- Huang, H.; Zheng, Y.; Wang, Y.; Wang, H.; Ni, J.; Wang, B.; Yang, B.; Wang, W. Characteristics of proppant transport and placement within rough hydraulic fractures. Pet. Explor. Dev. 2024, 51, 453–463. [Google Scholar] [CrossRef]
- Zhou, H.; Guo, J.; Zhang, T.; Gou, H.; Chen, C.; Wang, S.; Tang, T. Numerical study of the wall-retardation effect on proppant transport in rough fractures. Comput. Geotech. 2023, 159, 105425. [Google Scholar]
- Huang, H.; Babadagli, T.; Li, H.; Develi, K.; Zhou, D. A visual experimental study on proppants transport in rough vertical fractures. Int. J. Rock Mech. Min. Sci. 2020, 134, 104446. [Google Scholar] [CrossRef]
- Li, J.; Liu, P.; Kuang, S.; Yu, A. Visual lab tests: Proppant transportation in a 3D printed vertical hydraulic fracture with two-sided rough surfaces. J. Pet. Sci. Eng. 2021, 196, 107738. [Google Scholar] [CrossRef]
- Guo, T.K.; Luo, Z.L.; Zhou, J.; Gong, Y.Z.; Dai, C.L.; Tang, J.; Yu, Y.; Xiao, B.; Niu, B.L.; Ge, J.J. Numerical simulation on proppant migration and placement within the rough and complex fractures. Pet. Sci. 2022, 19, 2268–2283. [Google Scholar] [CrossRef]
- Zhou, M.; Yang, Z.; Xu, Z.; Song, X.; Wang, B.; Zheng, Y.; Zhou, Q.; Li, G. CFD-DEM modeling and analysis study of proppant transport in rough fracture. Powder Technol. 2024, 436, 119461. [Google Scholar] [CrossRef]
- YIN, B.; Zhang, C.; Wang, Z.; Sun, B.; Gao, Y.; Wang, X.; Bi, C.; Zhang, Q.; Wang, J.; Shi, J. Proppant transport in rough fractures of unconventional oil and gas reservoirs. Pet. Explor. Dev. 2023, 50, 712–721. [Google Scholar] [CrossRef]
- Huang, X.; Yuan, P.; Zhang, H.; Han, J.; Mezzatesta, A.; Bao, J. Numerical study of wall roughness effect on proppant transport in complex fracture geometry. In SPE Middle East Oil and Gas Show and Conference; SPE: Kuala Lumpur, Malaysia, 2017; p. D021S012R001. [Google Scholar]
- Wang, T.; Zhong, P.; Li, G.; Sheng, M.; Wen, H.; Tian, S. Transport pattern and placement characteristics of proppant in different rough fractures. Transp. Porous Media 2023, 149, 251–269. [Google Scholar] [CrossRef]
- Zhang, B.; Gamage, R.P.; Zhang, C.; Wanniarachchi, A. Hydrocarbon recovery: Optimized CFD-DEM modeling of proppant transport in rough rock fractures. Fuel 2022, 311, 122560. [Google Scholar] [CrossRef]
- Deng, H.; Ellis, B.R.; Peters, C.A.; Fitts, J.P.; Crandall, D.; Bromhal, G.S. Modifications of Carbonate Fracture Hydrodynamic Properties by CO2-Acidified Brine Flow. Energy Fuels 2013, 27, 4221–4231. [Google Scholar]
- Lance, D.A.; Jennings, H.M.; Shah, S.P. Relationship between fracture surface roughness and fracture behavior of cement paste and mortar. J. Am. Ceram. Soc. 1993, 76, 589–597. [Google Scholar]
- Krieger, I.M.; Dougherty, T.J. A Mechanism for Non-Newtonian Flow in Suspensions of Rigid Spheres. Trans. Soc. Rheol. 1959, 3, 137–152. [Google Scholar] [CrossRef]
- Rao, R.; Mondy, L.; Sun, A.; Altobelli, S. A numerical and experimental study of batch sedimentation and viscous resuspension. Int. J. Numer. Methods Fluids 2002, 39, 465–483. [Google Scholar] [CrossRef]
- Subia, S.R.; Ingber, M.S.; Mondy, L.A.; Altobelli, S.A.; Graham, A.L. Modelling of concentrat ed suspensions using a continuum constitutive equation. J. Fluid Mech. 1998, 373, 193–219. [Google Scholar] [CrossRef]
- Wang, J.; Zhao, K.J.; Fu, S.S.; Xu, H.L.; Zhang, L.J.; Jiang, H.S. Migration and settlement laws of proppant in multi-scale fractures during the fracturing in the unconventional reservoirs. Nat. Gas Ind. 2024, 44, 109–119. [Google Scholar]
Disclaimer/Publisher’s Note: The statements, opinions and data contained in all publications are solely those of the individual author(s) and contributor(s) and not of MDPI and/or the editor(s). MDPI and/or the editor(s) disclaim responsibility for any injury to people or property resulting from any ideas, methods, instructions or products referred to in the content. |
© 2025 by the authors. Licensee MDPI, Basel, Switzerland. This article is an open access article distributed under the terms and conditions of the Creative Commons Attribution (CC BY) license (https://creativecommons.org/licenses/by/4.0/).