Abstract
Hydrogen energy is considered the most promising clean energy in the 21st century, so hydrogen refuelling stations (HRSs) are crucial facilities for storage and supply. HRSs might experience hydrogen leakage (HL) incidents during their operation. Hydrogen-producing and refuelling integrated stations (HPRISs) could make thermal risks even more prominent than those of HRSs. Considering HL as the target in the HPRIS, through the method of fault tree analysis (FTA) and analytic hierarchy process (AHP), the importance degree and probability importance were appraised to obtain indicators for the weight of accident level. In addition, the influence of HL from storage tanks under ambient wind conditions was analysed using the specific model. Based upon risk analysis of FTA, AHP, and ALOHA, preventive measures were obtained. Through an evaluation of importance degree and probability importance, it was concluded that misoperation, material ageing, inadequate maintenance, and improper design were four dominant factors contributing to accidents. Furthermore, four crucial factors contributing to accidents were identified by the analysis of the weight of the HL event with AHP: heat, misoperation, inadequate maintenance, and valve failure. Combining the causal analysis of FTA with the expert weights from AHP enables the identification of additional crucial factors in risk. The extent of the hazard increased with wind speed, and yet wind direction did not distinctly affect the extent of the risk. However, this did affect the direction in which the risk spreads. It is extremely vital to rationally plan upwind and downwind buildings or structures, equipment, and facilities. The available findings of the research could provide theoretical guidance for the applications and promotion of hydrogen energy in China, as well as for the proactive safety and feasible emergency management of HPRISs.
1. Introduction
Hydrogen energy can reduce environmental pollution and energy shortage to a certain extent [1,2,3]. Hydrogen has been widely recognised as one of the most promising energy sources in the 21st century due to its cleanliness and efficiency, as well as its abundance [4,5,6]. Numerous countries have prioritised hydrogen development in production, preservation, transportation, and utilisation to better achieve low-carbon economies. Hydrogen refuelling stations (HRSs) play a pivotal role in the future of hydrogen energy [7,8]. Data from the H2 station and the China Hydrogen Energy Alliance indicate that there are over 800 HRSs worldwide, with China accounting for 245 by the end of 2022, as illustrated in Figure 1. China has rapidly developed various types of HRSs, as depicted in Figure 2. Hydrogen-producing and refuelling integrated stations (HPRISs) integrate hydrogen production, preservation, and utilisation for various typical applications. HPRISs could mitigate the risks associated with transport to some extent. Hydrogen exhibits a wide inflammability range (4–75%) and low ignition energy (0.018 mJ) [9]. These properties tend to trigger spontaneous combustion, jet fires, flash fires, combustion, and explosions, resulting in additional personal casualties and property losses [10,11]. Moreover, hydrogen in the high temperatures and pressures (typically 35 to 70 MPa) of HPRISs is prone to leakage. In recent years, hydrogen incidents have attracted distinct attention worldwide. Norway experienced a hydrogen safety incident in 2019 that resulted in two injuries. In the USA, North Carolina experienced a hydrogen explosion, causing approximately 60 houses to be damaged. Implementing immediate safety measures during the initial stages could minimise the risk of hydrogen incidents.
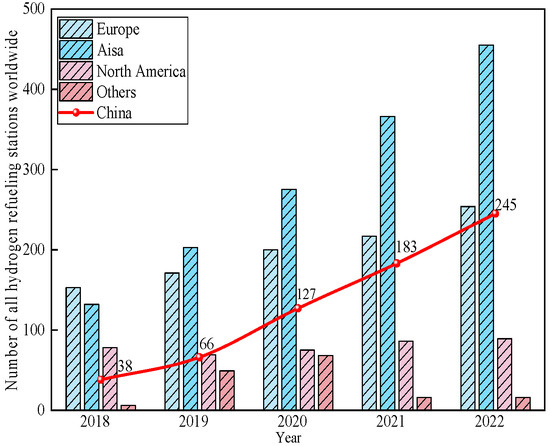
Figure 1.
Number of all HRSs worldwide between 2018 and 2022.
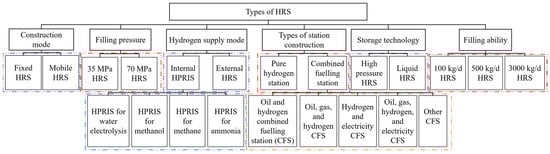
Figure 2.
Types of hydrogen refuelling stations in China.
The European Union has painstakingly devised the European Norm 17127 standard [12,13]. This standard provides a regulatory scaffold for HRSs, covering the entire process from design conceptualisation to construction and daily operation. With risk mitigation as the key focus, it effectively strengthens safety protection. In the United States, the main reliance is on the NFPA 2 standard [14,15]. This standard covers a wide range of hydrogen energy technology aspects and sets out safety management rules for HRSs in a comprehensive and systematic way. It includes detailed regulations about equipment safety standards and operation procedures. In China, the safety design of HRSs stringently complies with the national standard [16,17]. This standard focuses on the crucial aspects of hydrogen storage and distribution and analyses potential safety perils in depth. It also formulates highly specific safety measures and regulatory prescriptions to ensure the HRSs operate securely and stably. Consequently, nations and regions across the globe have swiftly responded by enacting hydrogen energy safety standards that are customised to meet their specific requirements [18,19]. The main purpose of these actions is to proficiently handle the wide variety of potential risks related to hydrogen energy infrastructure. Presently, the international hydrogen safety standard regime is undergoing continuous enhancement. However, there are still notable differences. These differences can be seen in the specific provisions and focal points of the regulatory frameworks. The reasons for these differences are the disparities in national circumstances, energy strategies, and industrial development trajectories.
Risk assessment (RA) methods encompass quantitative risk assessment (QRA), fault tree analysis (FTA), analytic hierarchy process (AHP), Bayesian networks, and other methodologies [20,21,22,23,24,25,26,27,28,29,30,31,32,33,34,35]. Kim et al. [22] proposed the RA model of hydrogen energy infrastructure using a relative risk index. They assessed the risk associated with hydrogen-related processes and technology and determined the relative risk levels of each infrastructure. Tsunemi et al. [23] considered ignition probability and failure probability. They conducted QRA to not only assess risks to human life during the operation of HRSs, but also calculate the probability of accidents in three accident scenarios. Kang et al. [24] constructed a multilevel variable-weight fuzzy Petri net. They also identified the evolutionary paths of the explosion risk and determined the most likely accidental root causes. According to the findings derived from these studies, the characteristics of FTA, QRA, AHP, and Bayesian networks are compared and summarised, as presented in Table 1.

Table 1.
The characteristics of FTA, QRA, AHP, and Bayesian networks.
The diffusion characteristics of hydrogen leakage (HL) in HRSs are influenced by factors such as wind speed, wind direction, leakage volume, and ventilation facilities [36,37]. Li et al. [38] employed CFD software to investigate the impacts of ventilation scenarios and ambient wind on the diffusion characteristics of HL in mobile hydrogen refuelling stations. Li et al. [39] utilised ANSYS Fluent software to scrutinise hydrogen diffusion characteristics under constant and variable wind speeds. Cui et al. [40] scrutinised the effects of wind direction, temperature, and humidity on the diffusion characteristics of HL at Ningbo seaport, Zhejiang Province, PR China. They found that the risk of HL was higher when the wind direction was opposite to the leakage; however, the influence of temperature and humidity on HL risk was minimal instead. As indicated by these studies, a variable wind speed could result in larger gas cloud sizes and increased risk. The influence of wind speed on the radial diffusion of hydrogen volume concentration is notable.
As the research needs to clearly and intuitively present the causation of the fault, and it also needs to be simple and easy, the FTA is selected for fault analysis. There are subjective factors in FTA fault analysis. A decision is made to quantify subjective judgment factors. Specifically, the research introduced the AHP on the basis of FTA. The method formed was a combined FTA-AHP analysis. The following steps have two advantages through this integration. First, the strengths of FTA in systematically organising the fault logic structure can be maximally harnessed. Second, with the aid of AHP, the subjective insights of experts or decision-makers can be effectively translated into quantifiable weights. Consequently, fault risks can be appraised in a more comprehensive and precise manner by FTA-AHP analysis.
In this study, the AHP method was introduced and combined with the FTA method to better assess the risk of HL in HPRISs. The research also investigated the influence of uncontrollable environmental factors, such as wind, on HL accidents in HPRISs. The study’s findings could offer valuable insights into how to forestall leakage incidents in HPRISs.
2. Method and Simulation
2.1. Analysis of Fault Tree Analysis
FTA is primarily used to analyse potential accidents and failures in engineering systems or processes, as well as to identify the root causes of such accidents [41]. Furthermore, FTA can analyse paths and likelihoods of accidents by constructing logical fault tree structures, which further aid in the identification and assessment of potential risks in the system [42]. This method can derive minimum cut sets and minimal path sets, conduct importance degree analysis, and perform probabilistic importance analysis using FTA.
The construction of a fault tree is divided into six parts.
- (a)
- The first part is the objective or top accident [43]. The target of this research is HL.
- (b)
- The second part is the identification of factors contributing to accidents [44].
- (c)
- The third part is the classification of these factors [45].
- (d)
- The fourth part is the identification of the root cause [25]. These root causes are basic events.
- (e)
- The fifth part is the establishment of causal relationships between all factors by logic gates [43].
- (f)
- The sixth is the formation of a fault tree [46]. According to fault theory, certain rules should be adhered to during the process [27].
The following steps are for the identification of the minimum cutting set [47].
- (a)
- First, start with the top event and employ the top-down approach to convert the fault tree into equivalent Boolean equations.
- (b)
- Second, two Boolean laws should be applied to eliminate redundancies. Two Boolean laws are the distributive law and the law of absorption.
- (c)
- Third, enumerate all the simplified minimal combinations. These combinations are the minimum cutting set of fault trees.
The minimum cut set indicates the hazard level of the system, whereas the minimum path set reflects the safety level [48]. The difference in hazard will be indicated by the sign. An increase in the count of minimal cut sets tends to elevate the overall hazard level in an accident tree. More minimal path sets indicate a safer system.
The importance degree is a qualitative evaluation. The following steps are for calculating the degree of importance [47,48,49,50].
- (a)
- First, determine all minimum cut sets in the fault tree.
- (b)
- Second, the cutting set in which the basic event will be contained will be determined.
- (c)
- Third, calculate the weight value of each cutting set where the basic event is located. is the total number of basic events in the cut set where the basic event is located.
- (d)
- Fourth, calculate the product of the contributing values for each cutting set.
- (e)
- Fifth, subtract the product of the previous step from 1. In addition, derive the importance degree of the root causes . The formula for calculating the structural importance is given in Equation (1).
The probabilistic importance degree is a quantitative evaluation. The following steps are for calculating the probabilistic importance degree [49,50]. This is to further assess the extent to which variations in the occurrence probabilities of basic events can affect the occurrence probability of the top–level event. Then, there is a need to analyse the probability and importance of basic events. The occurrence probability function of top events has a specific property, which is a multiple linear function. The multilinear function is the sum of the products of the elementary events of each minimal cut set. By taking the first-order partial derivative with respect to the independent variable, the probability importance coefficient of each basic event can be simply obtained, as illustrated in Equation (2).
2.2. Analysis of Analytic Hierarchy Process
The AHP method, which combines both quantitative and qualitative elements, is useful in the analysis of multi-criteria decision-making. It is commonly used to model the hierarchy, construct judgment matrices (JM), and conduct consistency tests [48,51].
The following steps are for the construction of a hierarchy [32,52,53,54,55].
- (a)
- The first step is the objective. This objective is also the target level. The target layer is represented by the letter A. The letter A refers to HL, which will be mentioned.
- (b)
- The second step is the intermediate factors that affect the objective. The origins of intermediate factors are derived by categorising the results of the FTA analysis. Intermediate factors are refinements and decompositions of the objective. These are independent of each other and comprehensively cover all aspects affecting the objective. The standardised layer is also the set of all intermediate factors. The standardised layer is represented by . is the total number of intermediate factors.
- (c)
- The third step is the specific solution. The index layer is also the set of all specific options. The index layer factors are represented by ; . is the total number of factors in the index layer where intermediate factor is located.
- (d)
- The fourth step is to arrange the objective, the intermediate factors and the scheme in an order from the top to the bottom.
- (e)
- The fifth step is the formation of a structural model.
- (f)
- The sixth step is to establish relationships between objective and intermediate factors and between intermediate factors and scheme by lines.
- (g)
- The seventh step is to form a hierarchy, as illustrated in Figure 3.
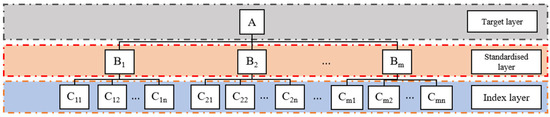 Figure 3. Accident analytic hierarchy model for AHP.
The following steps are for the creation of a judgement matrix [56,57,58].
- (a)
- The first step is the definition of the scale of comparison; the scale of comparison is the commonly used 1–9 scale [58], as listed in Table 2.
Table 2. The scale of comparison.
- (b)
- The second step is the determination of comparison values. When the intermediate factor is a , the schemes are , , …, . If and are both the scheme of , then comparison value is . And is the scheme of , is the other scheme of , then comparison value is or . The comparative values are determined based upon comparative scales, (, , …, ), (, , …, ).
- (c)
- The third step is the derivation of the other values of the scheme on ( = 1, 2, …, ), in turn, as the fourth step. The matrix is obtained as follows: Equation (3). These matrices are known as JM.
A consistency test means that the judgements of the scheme in the JM should be logically consistent. Furthermore, the degree of importance is in accordance with a certain logical relationship. The consistency test includes three parameters: consistency index (CI), consistency ratio (CR), and random consistency index (RCI).
The steps hereinafter are for the calculation of CR.
- (a)
- The first step is to obtain the largest eigen-root of each JM, where the intermediate factor is located by mathematical calculation [50].
- (b)
- The second step is the calculation of CI, as follows in Equation (4), and is the matrix order.
- (c)
- Finally, the CR is calculated through Equation (5). Based upon the order of the JM, the corresponding RCI value is obtained from the table of RCI, as presented in Table 3.
Table 3. RI standard value [31].
The CR can be checked by calculating the CI and the RCI. If CR < 0.1, the JM is considered acceptable [59]. The research is concerned with risk factors. At this point, the weights of the risk factors calculated on the basis of this scoring matrix are reliable. Limited resources are allocated proportionally to the various defence and control measures on the basis of these weights. If CR > 0.1, the values need to be readjusted. After several iterations, the CRs of all matrices finally meet the requirement CR < 0.1. The new weights are then used to allocate resources.
If CR < 0.1, the following steps are for the calculation of the weight values of the scheme in the matrix.
- (a)
- The first step is to calculate the sum of the absolute values on each row element. The value of the sum is denoted by . is the JM row count. is shown in Equation (6).
- (b)
- The second step is to carry out the normalisation, and the normalised matrix is represented by , as presented in Equation (7). .
- (c)
- The third step is the determination of the weight vector of [59], as presented in Equation (8).
- (d)
- The fourth step is to take the value of , , …, . , and other values of can be calculated in a similar way.
- (e)
- The fifth step is the determination of the weight values of the scheme, that is, .
2.3. Simulation by Areal Location of Hazardous Atmosphere
ALOHA, known as a calculation program, was jointly developed by the Environmental Protection Agency (EPA) and the National Oceanic and Atmospheric Administration (NOAA) of the USA for the comprehensive assessment of the impact of hazardous chemical leakage [60,61]. It can be used to calculate the expansion process of hazardous chemicals in space to obtain the distribution of hazardous chemicals after leakage and the radiation range of potential accidents [62]. The critical concentration of fuel in the air is the inflammability level of concern. Fuel may pose a risk of inflammability when the concentration exceeds a certain threshold. The default indexes for the inflammable gas cloud of unignited HL were 40,000 ppm, 10% LEL, and 60% LEL.
Accidental HL may be a prominent contributor to explosion accidents. The consequences and impact of the accident closely depend on the diffusion mode [63]. According to data disclosed by the Chinese government, the major accidents involving hazardous chemicals are primarily concentrated from July to September yearly [64]. Therefore, various inflammable and hazardous chemicals are more prone to volatilisation and leakage during the high-temperature season.
There are several fundamental parts that typically need to be taken into account when employing ALOHA [61,65].
- (a)
- The initial part is to specify the city in which the chemical release takes place, together with the exact date and time.
- (b)
- The second part is about extracting chemicals from ALOHA’s chemical information database. Extract hydrogen from ALOHA’s chemical database, which is none other than CAMEO Chemicals 3.0.0.
- (c)
- The third step is to enter details pertaining to the prevailing weather conditions. Enter the parameters that indicate weather conditions, including wind speed, wind direction, temperature, humidity, and environment.
- (d)
- The fourth part is to provide a description of how the chemical substance manages to escape from the containment. Configure the type and storage status of the storage tank, along with the location and size of the leak port. The relevant parameters are presented in Table 4. Choose the type of dispersion calculation for ALOHA.
- (e)
- The fifth part involves instructing ALOHA to generate a threat-zone map. This map delineates regions where one or multiple hazards, such as toxicity, inflammability, thermal radiation, or destructive overpressure, have the potential to surpass the critical level of concern (LOC). These areas can pose a notable threat to both human lives and property.
- (f)
- In the sixth part, ALOHA is capable of presenting this threat-zone map on the MARPLOT®-supplied electronic map of the city where the incident took place.
The initial part encompasses the following elements:
- (a)
- Input the date and time when the accident occurred.
- (b)
- Input the latitude, longitude, and altitude of the accident site to enable precise positioning on the satellite map. Specifically, we have selected a HPRIS situated in Dalian City, Liaoning Province, PR China. Its geographical coordinates are the location and the altitude of the storage tank in Table 4.
- (c)
- Identify the type of building that the toxic gas release might penetrate.
The limitations of the ALOHA 5.4.4 software:
- (a)
- It is of utmost necessity to have detailed information concerning local atmospheric conditions, the attributes of chemicals, and the leakage scenarios.
- (b)
- ALOHA is designed to provide a close upper bound to the threat distances associated with chemical spills. Wherever uncertainty is unavoidable, ALOHA will err in favour of overestimating rather than underestimating threat distances. In some cases, ALOHA will notably overestimate threat zones.
- (c)
- Typical scales for threat zones are in the range of 102 to 105 m, with durations of up to an hour.
Basic assumptions:
- (a)
- Given that the density of hydrogen is lower than that of air, the Gaussian model is selected by default.
- (b)
- Given that the HPRIS is in a suburban area, a bungalow-type building has been chosen.
Dalian, in general, features a temperate monsoon climate that is characterised by warm summers and relatively cold winters. As per the data furnished by the China Meteorological Administration, the average summer temperature at the HPRIS is 29 °C, with a relative humidity of 87%. Therefore, the initial ambient temperature of the storage tank is configured at 29 °C, and the relative humidity is adjusted to 87%. When comprehensively considering factors like compression energy consumption, the safety of the storage tank, and the investment in filling equipment, it is determined that the pressure of the high-pressure hydrogen storage tank is set at 45 MPa. A leakage aperture of 10 mm in the hydrogen storage tank aligns more closely with real-world scenarios. Tank diameter, tank height, and tank number are determined by referring to relevant literature sources [66,67,68].
Table 4.
Input parameters.
Table 4.
Input parameters.
| Condition | Parameter |
|---|---|
| Location (latitude and longitude) | 121.77° E, 39.17° N. |
| Altitude of the storage tank | 72 m |
| Storage tank ambient temperature | 29 °C |
| Relative humidity | 87% |
| Tank diameter | 4 m |
| Tank height | 5 m |
| Tank number | 4 |
| Storage pressure | 45 MPa |
| Leakage hole shape | Circular |
| Leakage hole diameter | 10 mm |
This software can determine the hazardous area of the cloud following the leakage of storage tanks in Dalian City, Liaoning Province, PR China. The parameters of the simulation scenario in HPRISs are summarised in Table 4.
3. Results and Discussion
3.1. Assessment of FTA for Hydrogen Leakage
Essential equipment and facilities used in this study included dispensers, compressors, storage tanks, and other components. Hydrogen can readily leak and lead to explosions due to the sufficient energy available in these scenarios. While HPRISs mitigate the risks commonly associated with the fill-transport-unloading process, they elevate the risks related to hydrogen production equipment and cooling systems.
First, the intermediate events and basic events of the fault tree will be investigated and determined. Based on the literature review [9,24,69,70,71,72,73,74], the common intermediate events of hydrogen leakage in HRSs are summarised. Subsequently, the purification device of the HPRIS is taken into account through the disclosed data. Then, redundant events are removed. Thus, the intermediate events and basic events of the fault tree are determined. The top event, intermediate events, and basic events are replaced by symbols T, M, and X, respectively. It includes one top-level event, nine intermediate events –, and 15 basic events –. The basic meaning and description of each event are presented in Table 5. Finally, the top events, intermediate events, and basic events obtained are plotted in accordance with the logical gate relationships. The fault tree diagram is drawn using the freeFTA V1.0 software. In addition, the resulting fault tree is shown in Figure 4. The limitation of freeFTA software, the meaning described by the symbols M1–M9 is consistent with that of –. Furthermore, the meaning described by the symbols X1–X15 is consistent with that of –.
Table 5.
Symbols and events expression for the fault tree of HL.
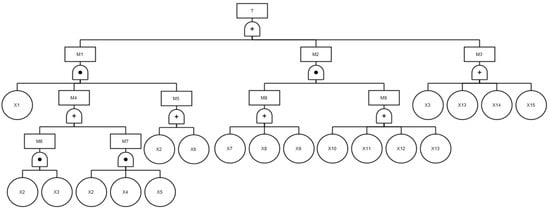
Figure 4.
HL fault tree for HPRISs.
The minimum cut set and the minimum path set of FTA for HL were obtained using the Boolean algebra simplification method. The minimal cut sets are 14, and the minimal path sets are 8. The minimum cut sets and minimum path sets are listed in Table 6.
Table 6.
Minimum cut sets and minimum path sets of HL in FTA.
Minimal cut sets containing 1, 2, and 4 basic events are represented by sets 1, 4, and 9, respectively. Examination of the fault tree structure reveals 14 fundamental causes for HL events. The minimal path sets reveal eight feasible approaches to forestall the top event from occurring. Notably, none of the individual basic events within any of the minimal path sets occurred simultaneously, enabling stations to forestall leakage. Table 6 also illustrates the involvement of numerous basic events in the minimal path sets, indicating multiple viable methods for forestalling leakage. Therefore, further research is required to conduct an important degree analysis to better determine the impact of each basic event on the top event.
3.1.1. Analysis Regarding the Importance of a Degree in Basic Events
There is an insufficiency of effective data regarding hydrogen-related facilities and components within the HPRIS. Based on the literature review [9,21,24,69,70,71,72,73,74], the failure probability of each basic event is summarised. The failure probability of each basic event is presented in Table 7.
Table 7.
The failure probability of each basic event.
Through calculations by Equation (1), the importance degree ranking of basic events followed: I(X15) = I(X14) = I(X13) = I(X3) > I(X12) = I(X11) = I(X10) = I(X9) = I(X8) = I(X7) = I(X6) > I(X5) = I(X4) = I(X2) = I(X1).
The basic events are arranged in the colour-coded diagram by descending the degree of importance. Colours and arrows denote the degree of influence on the top event. A darker colour indicates a more important basic event, which has a greater influence on the top event. In the figure, the second column is the basic events, and the first column is the symbol of the basic event. The arrows pointing upwards signify relatively large impacts, while the arrows pointing downwards indicate relatively small impacts. Figure 5 presents the colour-coded diagram of the degree of importance of each basic event.
Figure 5.
Importance degree in basic events.
The compiled importance degree (Figure 5) indicates that there are four basic events with the highest importance in the fault tree: Material ageing, inadequate maintenance, misoperation, and improper design. Similarly, there are four basic events of the lowest importance: Compressor failure, switch failure, valve failure, and heat losses. This part of the study suggests that material ageing, misoperation, and inadequate maintenance are distinct contributors to accidents during the operation and maintenance of the HPRISs.
Based upon accident causation theory, the measures of control accidents include four factors: Operator, machine, management, and medium. Combining accident causation theories, material ageing is attributed to unsafe machine conditions, improper design, and misoperation belonging to unsafe anthropogenic behaviours; inadequate maintenance falls under inadequate management [75]. Consequently, research indicates that measures to alleviate leakage events and mitigate severe consequences should prioritise addressing issues related to anthropogenic, machine, and management.
However, individuals are influenced by psychological, physiological, organisational management, and other external environmental factors. Anthropogenic factors account for the highest proportion of accidents [76,77], and this highlights the primary importance of addressing unsafe human behaviours in leakage safety management. This is followed by addressing unsafe machine conditions and inadequate management.
3.1.2. Analysis Regarding the Probabilistic Importance in Basic Events
Through calculations by Equation (2), the probability importance of each basic event can be acquired where . The probability importance values of each basic event and their symbols are presented in Table 8.
Table 8.
Probabilistic importance of .
Based upon the probability importance values of each basic event, the probabilistic importance follows the order: . The order shows that misoperation, material ageing, inadequate maintenance, and improper design are prominently predominant among all factors. These basic events can severely compromise HL safety in the HPRIS.
Additionally, HPRISs are characterised by abundant storage, extensive high-pressure equipment, and high heat [72]. HPRIS equipment (hydrogen storage tank and dispenser) operates in a high-pressure environment. The dispenser machine generates heat during the filling process. When the aforementioned equipment is operated repeatedly, HL becomes more frequent in various components, such as flanges, valves, instruments, compressors, filters, and other parts [78,79]. Frequent leakage of these components is indicative of unsafe machine conditions. HL accidents often occur under unstable conditions, both internally and externally, according to the trajectory intersection theory. The instability condition results from the interaction between unsafe human behaviours and unsafe machine conditions. The conclusion regarding probabilistic importance aligns with the degree of importance. Therefore, in conjunction with the analysis of Table 8 and Figure 5, it is evident that unsafe human behaviour is the primary concern in management and operation. The unsafe machine conditions and inadequate management are slightly less prominent than the unsafe behaviours of individuals [80].
3.2. Assessment of AHP for Hydrogen Leakage
3.2.1. Construction Model and Judgment Matrix of AHP
Based upon the qualitative and quantitative analysis results of FTA, operators, machines, medium, and management are selected as the intermediate factors in the standard layer of the AHP. The basic events within the FTA are selected as the scheme for the index layer. The intermediate factors are replaced by symbol . It includes 1 objective and 4 intermediate events –. There are two schemes associated with , eight schemes for , two schemes for , and three schemes for . The two schemes within are described by the letters –. The eight schemes within are described by the letters –. The two schemes within are described by the letters –. The three within are described by the letters –. The AHP model is illustrated in Figure 6.
Figure 6.
Accident analytic hierarchy model for HL.
The JM for operators , machine , medium , and management are as illustrated in Equation (9).
3.2.2. Consistency Test of Judgment Matrix
The maximum eigenvalue and eigenvector were obtained from matrices. The computation of the consistency for the judgment matrices is presented in Table 9.
Table 9.
Consistency test for JM.
As indicated in Table 9, all CR values of the JM are less than 0.1. This suggests that the weights are reasonably allocated and that the judgment matrices meet the consistency requirement. The weight vectors of each matrix are obtained through normalisation calculation, as illustrated in Equation (10).
The correlation between the elements of the standardised layer and the factors of the index layer is listed in the table according to the values of the weight matrix. Factor weighting of the index layer can be seen in Table 10. The meaning described by the symbols – is consistent with that of and . The meaning described by the symbols – is consistent with that of , , , , , , , , , and . The meaning described by the symbols –. Is consistent with that of , and . The meaning described by the symbols –. Is consistent with that of , , and .
Table 10.
Factors weighting of index layer.
The factors can be ordered as follows in terms of their weights: . Hence, factor (heat) is the largest weight, whereas factor X6 is the smallest weight. It can be observed from Table 10 that heat (), misoperation (), inadequate maintenance (), and valve failure () are noticeable causes of accidents. These factors result from poor medium, unsafe operator behaviour, inadequate management, and unsafe conditions of machines, respectively. Based upon the theories of accident causation and trajectory intersection theory, accidents primarily depend on these factors. Medium serves as the prerequisite condition for unsafe operator behaviour and unsafe conditions of machines [81,82,83]. The results of FTA and AHP are presented in Table 11.
Table 11.
The results presented of FTA and AHP.
It can be found by comparing the results of FTA and AHP that the FTA method primarily emphasises the factors directly associated with the probability of accident occurrence, such as misoperation, material ageing, inadequate maintenance, and improper design. These factors are predominantly grounded in the logical connections of the fault tree, enabling a quantitative analysis of the causal relationships among events. The AHP utilises expert scoring in conjunction with weight calculation techniques to comprehensively evaluate the relative importance of various environmental and human-induced factors. The obtained results through AHP demonstrate that heat holds the most position within the AHP analysis, with a weight value of 0.833. This is followed by misoperation, which is assigned a weight of 0.750, and inadequate maintenance, having a weight of 0.672.
The utilisation of FTA or AHP methods alone makes it difficult to fully identify causal relationships and relative weights of complex accident factors [84,85]. This research brings together the FTA and AHP methods. It maintains the logical derivation traits of FTA and simultaneously incorporates the subjective assessment of factor weights from AHP. As a result, the risk assessment results become more comprehensive and accurate [86,87]. The FTA analysis finds that misoperation and material ageing are the principal causes of accidents, while the AHP further gauges the importance of heat and valve failure. Note that this outcome is partially consistent with certain results obtained from the FTA. However, the AHP approach introduces additional crucial factors, with heat being one of them. The AHP result prominently features heat (0.833) as a crucial risk factor, which is not adequately represented in the standalone FTA analysis, thereby suggesting that the combined approach is capable of identifying certain important factors that are challenging to quantify by FTA alone.
3.3. Simulation of Hydrogen Storage Tank Leakage Dispersion
3.3.1. Impact Zones of Ambient Wind Speed on HL for Hydrogen Storage Tanks
The meteorological data collected from these areas of Dalian City, Liaoning Province, PR China, was examined, and the wind speed was set to 3.0, 4.0, 5.0, and 6.0 m/s. The measurement point height was 3 m above the ground. The influence of wind speed on the HL was primarily reflected in cloud transport, concentration dilution, and air entrainment. The impact zones of the inflammable gas cloud movement and dispersion at wind speeds of 3.0, 4.0, 5.0, and 6.0 m/s, respectively, are demonstrated in Figure 7.
Figure 7.
Impact zones of HL at different ambient wind speeds.
As depicted in Figure 7, when the wind speeds changed from 3.0 to 6.0 m/s, the distances from the inflammable gas clouds diffused in the yellow zone to the leakage source were 462, 394, 348 and 315 m, respectively. The distances decreased rapidly with the wind speed. A similar swift decrease was obtained for the other zones (orange zone and red zone). The width of the inflammable gas cloud also decreased when the wind speed increased. This trend can be attributed to the high flow rate in the early stage of the jet [88,89]. Higher ambient wind speeds resulted in a shift in the direction of the jet flow, thereby causing the combustible gas cloud to move along the downwind direction. This exacerbated diffusion and ambient air entrainment in all directions, led to a reduction in the volume of the combustible cloud and thus formed a short diffusion distance. Conversely, lower ambient wind speeds predominantly affected the low-speed flow at the end of the jet and at the boundary of the gas mixture. This, therefore, resulted in a farther distance due to strengthened disturbing turbulence. Another reason for this was that an under-expanded jet region was formed after the leakage of high-pressure hydrogen [89,90]. The Froude number of the gas cloud in this region might be larger, leading to diffusion controlled by momentum, which consequently caused a relatively far horizontal distance. As the Froude number decreased, diffusion was influenced by both momentum and buoyancy, enabling hydrogen to keep advancing a certain distance. In addition, hydrogen gradually rose upwards and forward due to buoyancy and wind speed, thereby resulting in a longer diffusion distance.
As can be seen from Figure 7, for a given ambient wind speed, the inflammable gas cloud diffused in the three zones, showing an ellipse. A similar zone at different wind speeds also showed an ellipse. This might be attributed to the high pressure of the storage tanks and the high momentum of hydrogen [91]. When leakage occurred, hydrogen was driven by momentum to eject forward and further spread forward by wind speed. Simultaneously, hydrogen continued to diffuse upwards by buoyancy, which resulted in a larger radial distance. The concentration was diluted by wind speed and buoyancy, leading to a narrower width of the combustible gas mixture. It is also evident that the red zone was the most dangerous among the three zones, so this required heightened attention during loss prevention management. The presence of sufficient energy in this zone could not only lead to ignition but also directly cause fatalities and substantial property damage.
3.3.2. Impact Zones of Ambient Wind Direction on HL for Hydrogen Storage Tanks
The next step was to investigate the meteorological data for the region where Dalian City, Liaoning Province, PR China, was located. The prevailing wind directions in the area are southwest, south, northwest, north, and northeast. The measurement point of this study was 3 m above the ground. The wind directions (southwest, south, northwest, north, and northeast) were chosen. The impact of wind direction on HL diffusion is shown in Figure 8.
Figure 8.
The impact zones of HL are in different wind directions. (a) Southwesterly wind; (b) Southerly wind; (c) Northwesterly wind; (d)Northerly wind; (e) Northeasterly wind.
As seen in Figure 8, for a given constant parameter (e.g., wind speed, release direction, and release rate), there is negligible variation in the effects of wind direction upon the inflammable gas clouds diffusing in three zones (horizontal distance and inflammable size). The direction of inflammable gas clouds is the same as the wind direction because the release direction of tanks was consistent with the wind direction; hydrogen migrated and spread in the downwind direction [92,93,94]. The HPRISs were surrounded by a series of equipment and precision manufacturers in the southeast and northeast, and residential areas lay in the southwest and northwest. The HPRIS includes hydrogen production units, gas transmission pipelines, and associated systems. The red area indicates the highest concentration, posing a potential threat of death to individuals within its vicinity if an ignition source is present. Notably, the hydrogen production unit and the gas delivery pipe are situated upwind of the cloud gas in the storage tank, where the high temperature generated by the production unit might serve as an ignition source. Consequently, the hydrogen production unit and the gas delivery pipe could trigger an explosion or flash fire.
The prevailing regulations in China clearly stipulate that a fire interval of 15, 10, and 8 m between primary, secondary, and tertiary storage containers and production areas should be considered. In addition, the fire interval between primary, secondary, and tertiary storage containers and dispensing facilities was 10, 8, and 6 m, respectively [95]. As depicted in Figure 8, the red area represents the highest level of danger, with the orange area following closely behind. Consequently, even if hydrogen-related systems within the red zone maintain the prescribed fire separation distances, the risk remains noteworthy.
3.4. Prevention Countermeasures of HL for HPRISs
As one of the future hydrogen energy facilities, the integrated HPRISs should be well-prepared for both prevention and response to leakage incidents.
3.4.1. Technical Measures
- (1)
- The implementation of a heat conduction model is required to model and analyse the heat distribution of critical equipment to detect potential hotspot areas. Temperature monitoring methods and systems for core equipment, such as compressors, need to be developed with the aim of detecting potential hot spots. The relevant technologies have already been implemented in the temperature monitoring of photovoltaic modules.The basic principle of this technology is as follows [96]:
- (a)
- The utilisation of infrared thermal imaging and visible light image acquisition.
- (b)
- The conduction of spatial registration and preprocessing by the edge computing unit, obtaining standardised temperature data, and storing the historical data set.
- (c)
- The performance of a wavelet transforms on the historical data and combining graph convolution with deep neural networks to train a temperature prediction model.
- (d)
- The entrance of the standardised and predicted temperature data into models like hierarchical clustering to identify abnormal areas.
- (e)
- The entrance of the characteristics of these abnormal areas and comparing them with historical fault data.
- (f)
- The diffusion range is calculated through graph neural networks and other methods.
- (g)
- The generation of early warning information through fuzzy inference.
- (h)
- The early warning information is sent to the operation and maintenance platform, thus achieving comprehensive and intelligent temperature monitoring and fault warning.
This shows the next step, where the previously obtained standardised and predicted temperature data is fed into models, such as hierarchical clustering, for the purpose of identifying abnormal areas.
- (2)
- Utilisation of a highly efficient cooling system [97], such as mixed refrigerant refrigeration or pre-cooling refrigerants, should be essential for maintaining the equipment within a safe operating temperature range. The adoption of a mixed refrigerant cooling system is recommended to ensure the equipment operates within a safe temperature range. The system achieves efficient temperature control by optimising the composition ratio, or pre-cooling refrigerants like liquid nitrogen can be applied as auxiliary coolants. The refrigeration system is utilised to achieve cooling during the hydrogen compression and refuelling process.The basic principle of this technology is as follows [98].
- (a)
- A heat exchange jacket is installed on the outside of the 20 and 45 MPa gas cylinder groups. The heat exchange jacket is connected to a cooling tower through a circulating pipe and a water pump. The connection is applied to cool and insulate the hydrogen in the gas cylinder groups, thus alleviating the temperature rise during compression.
- (b)
- The hydrogen enters the first-stage compressor through the hydrogen buffer tank for pressurisation and, after being pre-cooled by the first-stage cooler, it is stored in the 20 MPa gas cylinder group. Then, it is pressurised again by the second-stage compressor and, after being pre-cooled by the second-stage cooler, it is stored in the 45 MPa gas cylinder group.
- (c)
- A hydrogen refuelling cooler is installed on the pipeline connecting the 45 MPa gas cylinder group and the hydrogen dispensers, and the hydrogen is cooled as needed during hydrogen refuelling. All links work together to ensure the safety of hydrogen refuelling.
- (3)
- The implementation of a modern automation control system employing logic control and preset parameters is necessary to automate key operations [99]. This approach is able to curtail manual intervention and mitigate the risk of leakage caused by human error.
There is automation in the distributed energy system for hydrogen from methanol coupled with fuel cells. Based upon this system, in the event of hydrogen leakage, the safety system will carry out the following operations [100].
The hydrogen leakage interlock alarm device is designed to promptly detect any abnormal hydrogen concentration. Once detected, it immediately sends out an alarm signal, which is swiftly transmitted to the programmable control subsystem. Upon receiving this signal, the programmable control subsystem activates the fire extinguishing device, causing carbon dioxide (CO2) to spray out from the nozzles. This effectively dilutes the explosive mixture formed by the leaked hydrogen, substantially diminishing the risk of explosion.
Meanwhile, safety components, such as the solenoid valve, safety valve, and flame arrester, installed on the buffer tank vent pipeline play crucial roles in preventing the further escalation of potential danger. In addition, within the containerised skid-mounted unit, the electrostatic grounding box and the equipment’s lightning protection grounding device are in place to forestall secondary accidents that could be caused by static electricity or lightning strikes. In this way, they ensure the overall safety and integrity of the system.
3.4.2. Management
- (1)
- Human factorsThe measures of reducing manual intervention are as follows.
- (a)
- During the facility planning phase, it is essential to implement cross-departmental collaborative training. This measure aims to guarantee that both the design team and the operation team share a unified comprehension regarding environmental variables and layout optimisation.
- (b)
- The automation system should be designed with ergonomic principles to ensure easy operation of the man-machine interface and diminish operator fatigue. Meanwhile, operators should be provided with regular training on their operation skills to enhance their emergency response capabilities.
- (c)
- The establishment of a specialised training program that covers thermal conduction, cooling system equipment operators, material properties, equipment replacement plans, and so on. Specifically, for special types of work, the annual training hours should be no less than 20 h.
- (2)
- The environmental risk of hydrogen leakage. The installation of temperature sensors and the implementation of a data monitoring system are imperative for monitoring equipment temperature changes. Upon abnormal temperature increases, the cooling mechanism should be automatically activated to effectively mitigate the upward trend of hydrogen pressure. Concentration sensors should be arranged in a circular formation, with the centre being the highest temperature heat source point and the radius being the minimum ignition distance.The arrangement of sensors is as follows:
- (a)
- For the main risks of hydrogen energy facilities, the sensor arrangement follows the high-risk priority principle. Hydrogen leakage sensors are placed around hydrogen storage tanks, purification devices, and pressure relief devices to form closed-loop monitoring.
- (b)
- Pressure sensors are set at key pipeline nodes and high-pressure areas.
- (c)
- Temperature sensors cover the outer walls of storage tanks, refrigeration systems, and hot spots.
- (d)
- Hydrogen concentration sensors are arranged in a circular layout around hot spots.
- (e)
- Vibration sensors are applied for compressors and high-frequency equipment.
- (f)
- Material ageing sensors are installed at pipeline connection points and equipment surfaces. Flow sensors are placed at refrigerant pipeline inlets and outlets.
4. Conclusions
HPRISs can integrate various typical utilisation scenarios, including hydrogen storage, production, and supply. The pronounced thermal risks associated with HPRIS should be the focus of the research on HL in HPRISs. We employed the methods of FTA and AHP to evaluate the degree of importance, probability importance, and indicator layer weights. In addition, a model was constructed for the accident hierarchy analysis of HL risk in AHP. This research also employed ALOHA software to analyse the hazardous area of hydrogen post-leakage. The strategies proposed for preventing HL are as follows.
- The qualitative analysis of minimal cut sets, minimal path sets, and degree of importance in FTA of HL indicated that the accident tree contained 14 minimal cut sets and 8 minimal path sets. It also revealed that material ageing, inadequate maintenance, misoperation, and improper design were vital quantitative factors that led to HL accidents.
- The results generated from the quantitative analysis of probability importance in FTA of HL suggest the top four risk factors of misoperation, material ageing, poor maintenance, and improper design.
- Based upon the results obtained from the model designed for the accident hierarchy analysis for HL events and the weight calculation of index layer factors made. Clearly, heat, misoperation, inadequate maintenance, and valve failure are noticeable contributors to accidents as well.
- By comparing the results of FTA and AHP, the FTA method emphasises factors related to accident occurrence, relying on fault tree logic for causal analysis. The AHP employs expert scoring and weight calculations, where heat is the most notable factor (with a weight of 0.833). By combining the two methods, the traits of FTA are retained, and the subjective assessment of AHP is incorporated. This combination can identify additional crucial factors.
- By referring to the ALOHA analysis of the uncontrollable factor, ambient wind, on the HL gas cloud of HPRISs, it was found that the wind speed and direction primarily influenced the horizontal diffusion distance and diffusion direction of the gas cloud. The greater the wind speed, the closer the horizontal distance of HL gas. Three hydrogen-related equipment areas were identified as the key monitoring areas within HPRISs. Downwind of the hydrogen storage tanks, hydrogen production facilities upwind, and ignition area are also the centre of point management. Moreover, HPRISs need to arrange hydrogen concentration sensors in some zones. Among the scenarios considered were the furthest distance where hydrogen is most likely to ignite and the corners of the area where hydrogen accumulation is most likely to occur.
- Based upon the risk analysis made of FTA, AHP, and ALOHA, the findings suggest preventive and control measures at the HPRISs. These measurements are as follows: Utilising infrared thermal imaging and visible light image acquisition in the heat conduction model. A hydrogen refuelling cooler will be installed on the pipeline connecting the 45 MPa gas cylinder group and the hydrogen refuelling machine. A programmable control subsystem to activate the fire extinguishing device, enabling the nozzle to release carbon dioxide (CO2). Hydrogen leakage sensors, purification devices, and pressure relief devices should be placed around hydrogen storage tanks to form closed-loop monitoring. Installing material ageing sensors at pipeline connection points and equipment surfaces. Placing flow sensors at refrigerant pipeline inlets and outlets.
Author Contributions
Methodology, project administration, conceptualisation, writing—review, J.Q.; investigation, formal analysis, writing—original draft, T.Z.; software, H.Z.; resources, J.D.; resources, Z.L.; resources, F.C.; modification, R.W.; modification, review, Y.C.; supervision, writing—review and editing, C.S. All authors have read and agreed to the published version of the manuscript.
Funding
The authors gratefully acknowledge financial support from the National Natural Science Foundation of China (Grant no. 52104214), the Chongqing Key Laboratory of Emergency Fuel Supply Sustainment and Oil and Gas Safety Protection (Grant no. LQ24KFJJ03), and the Shaanxi Innovation Ability Support Plan Technological Innovation Team (Grant no. 2024RS-CXTD-52).
Data Availability Statement
Data are contained within the article.
Conflicts of Interest
The authors declare that they have no known competing financial interests or personal relationships that could have appeared to influence the work reported in this paper.
Nomenclature
| Acronyms | |
| AHP | Analytic hierarchy process |
| CFS | Combined fuelling station |
| CI | Consistency index |
| CR | Consistency ratio |
| FTA | Fault tree analysis |
| FT | Fault tree |
| HL | Hydrogen leakage |
| HPRISs | Hydrogen-producing and refuelling integrated stations |
| HRSs | Hydrogen refuelling stations |
| JM | Judgment matrix |
| QRA | Quantitative risk assessment |
| RCI | Random consistency index |
| Symbols | |
| The basic events. . | |
| The intermediate events. . | |
| The symbol of intermediate factors in standardised layer. . | |
| The symbol of factors in the index layer factor. | |
| The total number of intermediate factors. | |
| The total number of factors in the index layer where intermediate factor is located | |
| or | The comparison value. |
| The sum of the absolute values on each row element. | |
| The judgment matrix where the intermediate factor is located. | |
| The result of normalising matrix . | |
| The weight vector of . | |
| The symbol of partial derivative. | |
| The sum of the products of the elementary events of each minimal cut set. | |
| The symbols probabilistic importance of each basic event. | |
| Importance degree in each basic event. | |
| The total number of basic events in the cut set where the basic event is located. | |
| Matrix order. | |
| Maximum eigenvalue. | |
| The product of the contributing values for each cutting set. | |
References
- Hirscher, M.; Yartys, V.A.; Baricco, M.; Bellosta von Colbe, J.; Blanchard, D.; Bowman, R.C.; Broom, D.P.; Buckley, C.E.; Chang, F.; Chen, P.; et al. Materials for hydrogen-based energy storage-past, recent progress and future outlook. J. Alloys Compd. 2020, 827, 153548. [Google Scholar] [CrossRef]
- Wang, C.P.; Zhao, L.C.; Qu, J.; Xiao, Y.; Deng, J.; Shu, C.M. Minireview on the leakage ignition and flame propagation characteristics of hydrogen: Advances and perspective. Energy Fuels 2023, 37, 5653–5666. [Google Scholar] [CrossRef]
- Yang, Z.X.; Li, X.G.; Yao, Q.L.; Lu, Z.H.; Zhang, N.; Xia, J.; Yang, K.; Wang, Y.Q.; Zhang, K.; Liu, H.; et al. 2022 roadmap on hydrogen energy from production to utilizations. Rare Met. 2022, 41, 3251–3267. [Google Scholar] [CrossRef]
- Chen, Y.Y.; Liu, Y.K.; Xu, Y.J.; Guo, X.D.; Cao, Y.; Ming, W.Y. Review: Modeling and simulation of membrane electrode material structure for proton exchange membrane fuel cells. Coatings 2022, 12, 1145. [Google Scholar] [CrossRef]
- Jia, W.L.; Ren, Q.Y.; Zhang, H.; Yang, M.; Wu, X.; Li, C.J. Multicomponent leakage and diffusion simulation of natural gas/hydrogen mixtures in compressor plants. Saf. Sci. 2023, 157, 105916. [Google Scholar] [CrossRef]
- Zhao, Y.L.; Guo, Y.; Diao, A.N.; Zhang, J.T.; Peng, X.Y. Thermodynamic analysis of diaphragm compressor in hydrogen refuelling stations by using fluid-structure interaction method. Appl. Therm. Eng. 2024, 242, 122394. [Google Scholar] [CrossRef]
- Gökçek, M.; Paltrinieri, N.; Liu, Y.L.; Badia, E.; Dokuz, A.Ş.; Erdoğmuş, A.; Urhan, B.B.; Yoldaş, Ö. Optimum sizing of hybrid renewable power systems for on-site hydrogen refuelling stations: Case studies from Türkiye and Spain. Int. J. Hydrogen Energy 2024, 59, 715–729. [Google Scholar] [CrossRef]
- Qu, J.; Zhao, H.L.; Wang, C.P.; Luo, Z.M.; Cheng, F.M.; Wang, T.; Li, H.T.; Zhao, L.C.; Zhou, T.; Wang, R.; et al. Coupled analysis between explosion overpressure and flame propagation characteristics of H2-Air premixed gas. Int. J. Hydrogen Energy 2025, 101, 568–581. [Google Scholar] [CrossRef]
- Zhang, C.Z.; Cao, X.J.; Bujlo, P.; Chen, B.; Zhang, X.; Sheng, X.F.; Liang, C. Review on the safety analysis and protection strategies of fast filling hydrogen storage system for fuel cell vehicle application. J. Energy Storage 2022, 45, 103451. [Google Scholar] [CrossRef]
- Hansen, O.R. Hydrogen infrastructure-efficient risk assessment and design optimization approach to ensure safe and practical solutions. Process Saf. Environ. Prot. 2020, 143, 164–176. [Google Scholar] [CrossRef]
- Park, B.; Kim, Y.; Lee, K.; Paik, S.; Kang, C. Risk assessment method combining independent protection layers (IPL) of layer of protection analysis (LOPA) and riskcurves software: Case study of hydrogen refueling stations in urban areas. Energies 2021, 14, 4043. [Google Scholar] [CrossRef]
- Yang, F.Y.; Wang, T.Z.; Deng, X.T.; Dang, J.; Huang, Z.Y.; Hu, S.; Li, Y.Y.; Ouyang, M. Review on hydrogen safety issues: Incident statistics, hydrogen diffusion, and detonation process. Int. J. Hydrogen Energy 2021, 46, 31467–31488. [Google Scholar] [CrossRef]
- Gatto, A.; Sadik-Zada, E.R.; Lohoff, T.; Aldieri, L.; Vinci, C.P.; Peitz, K.A. An exemplary subsidization path for the green hydrogen economy uptake: Rollout policies in the United States and the European Union. J. Clean. Prod. 2024, 440, 140757. [Google Scholar] [CrossRef]
- Farrell, N. Policy design for green hydrogen. Renew. Sustain. Energy Rev. 2023, 178, 113216. [Google Scholar] [CrossRef]
- Bade, S.O.; Tomomewo, O.S. A review of governance strategies, policy measures, and regulatory framework for hydrogen energy in the United States. Int. J. Hydrogen Energy 2024, 78, 1363. [Google Scholar] [CrossRef]
- Moon, S.; Kim, K.; Kim, J. A study on public acceptance of hydrogen portfolio standard for renewable energy expansion: Comparative analysis of hydrogen production mix plans. Int. J. Hydrogen Energy 2024, 49, 538. [Google Scholar] [CrossRef]
- Kou, J.; Zhang, R. Driving logic and effectiveness assessment of german hydrogen strategy based on an analysis of the global hydrogen industrial space. Chin. J. Eur. Stud. 2024, 42, 121. (In Chinese) [Google Scholar]
- Sun, X.; Xu, X.; Luo, K.; Zhang, B.; Yang, Y.; Liu, Z.; Peng, S. Strategic framework for safety risk prevention and control for new energy application. Strateg. Study Chin. Eng. Sci. 2023, 25, 179. (In Chinese) [Google Scholar] [CrossRef]
- Chen, H.; Yang, L. Path selection for China’s hydrogen industry development under the goal. China Pop. Res. Environ. 2024, 34, 94. [Google Scholar]
- Zhang, J.X.; Zhang, S.H.; Liang, Z.W.; Lang, X.S.; Shi, M.H.; Qiao, J.Y.; Wei, J.H.; Dai, H.Y.; Kang, J. A risk assessment method Based upon DEMATEL-STPA and its application in safety risk evaluation of hydrogen refueling stations. Int. J. Hydrogen Energy 2024, 50, 889. [Google Scholar] [CrossRef]
- Zhu, T.L.; Qi, M.; Yin, M.K.; Dang, J.; Zhang, X.H.; Zhao, D.F. On the hazards of proton exchange membrane (PEM) water electrolysis systems using system theoretic process analysis (STPA). Process Saf. Environ. Prot. 2023, 180, 1118. [Google Scholar] [CrossRef]
- Kim, J.; Lee, Y.; Moon, I. An index-based risk assessment model for hydrogen infrastructure. Int. J. Hydrogen Energy 2011, 36, 6387–6398. [Google Scholar] [CrossRef]
- Tsunemi, K.; Kihara, T.; Kato, E.; Kawamoto, A.; Saburi, T. Quantitative risk assessment of the interior of a hydrogen refueling station considering safety barrier systems. Int. J. Hydrogen Energy 2019, 44, 23522–23531. [Google Scholar] [CrossRef]
- Kang, J.; Wang, L.D.; Jin, H.; Zhang, J.X. Proposed model of potential accident process at hydrogen refueling stations Based upon multi-level variable weight fuzzy Petri net. Int. J. Hydrogen Energy 2022, 47, 29162. [Google Scholar] [CrossRef]
- Zermane, A.; Mohd, Z.M.T.; Mohd, R.B.; Hamdan, M.Y. Risk assessment of fatal accidents due to work at heights activities using fault tree analysis: Case study in Malaysia. Saf. Sci. 2022, 151, 105724. [Google Scholar] [CrossRef]
- Ikwan, F.; Sanders, D.; Mohamed, H. Safety evaluation of leak in a storage tank using fault tree analysis and risk matrix analysis. J. Loss Prev. Process Ind. 2021, 73, 104597. [Google Scholar] [CrossRef]
- Kuzu, A.C.; Senol, Y.E. Fault tree analysis of cargo leakage from manifold connection in fuzzy environment: A novel case of anhydrous ammonia. Ocean Eng. 2021, 238, 109720. [Google Scholar] [CrossRef]
- Kang, J.; Su, T.; Li, J.; Wang, Z.; Zhang, J. Research on risk evolution, prevention, and control of fire and explosion accidents in hydrogen refueling stations Based upon the AcciMap-FTA model. Process Saf. Environ. Prot. 2025, 194, 107. [Google Scholar] [CrossRef]
- Kwon, D.; Choi, S.K.; Yu, C. Improved safety by crossanalyzing quantitative risk assessment of hydrogen refueling stations. Int. J. Hydrogen Energy 2022, 47, 10788. [Google Scholar] [CrossRef]
- Qi, S.; Shuai, J.; Shi, L.; Li, Y.T.; Zhou, L. Quantitative risk assessment of leakage accident of crude oil storage tank Based upon fuzzy Bayesian network and improved AHP. J. Loss Prev. Process Ind. 2024, 90, 105341. [Google Scholar] [CrossRef]
- Messaoudi, D.; Settou, N.; Negrou, B.; Rahmouni, S.; Settou, B.; Mayou, I. Site selection methodology for the wind-powered hydrogen refueling station Based upon AHP-GIS in Adrar, Algeria. Energy Procedia 2019, 162, 67–76. [Google Scholar] [CrossRef]
- Keramati, A.; Lu, P.; Afrooz, M.K. Evaluating crash severity at highway-rail grade crossings using an analytic hierarchy process-based hazard index model. Accid. Anal. Prev. 2025, 211, 107918. [Google Scholar] [CrossRef]
- Lu, Z.; Cao, Y.; Zou, Y.; Li, X.; Yang, F.; Khakzad, N.; Chen, C. Dynamic risk analysis of fire and explosion domino accidents at hydrogen refueling stations using Dynamic Bayesian Network. Int. J. Hydrogen Energy 2024, 95, 546. [Google Scholar] [CrossRef]
- Li, X.H.; Fu, Y.Q.; Liu, Y.Z.; Han, Z.Y.; Zhang, Z.D. Copula-BN based risk assessment methodology of marine ship collisions. China Saf. Sci. J. 2023, 33, 204. (In Chinese) [Google Scholar]
- Wang, L.; Zhang, J.; Wang, H.; You, Q.; Zhuo, J.; Zhang, S.; Qiao, J.; Wei, J. Hydrogen leakage risk assessment of HECS Based upon dynamic bayesian network. Int. J. Hydrogen Energy 2024, 78, 256. [Google Scholar] [CrossRef]
- Gong, L.; Yang, S.N.; Han, Y.F.; Jin, K.Y.; Lu, L.F.; Gao, Y.J.; Zhang, Y.C. Experimental investigation on the dispersion characteristics and concentration distribution of unignited low-temperature hydrogen release. Process Saf. Environ. Prot. 2022, 160, 676. [Google Scholar] [CrossRef]
- Zhang, Z.G.; Shang, M.H. Research on hydrogen leakage and diffusion mechanism in hydrogenation station. Sci. Rep. 2024, 14, 3363. [Google Scholar] [CrossRef] [PubMed]
- Li, Y.J.; Wang, Z.R.; Shi, X.M.; Fan, R.J. Safety analysis of hydrogen leakage accident with a mobile hydrogen refueling station. Process Saf. Environ. Prot. 2023, 171, 619. [Google Scholar] [CrossRef]
- Li, X.J.; Xu, Y.X.; Li, X.; Jin, Z.J.; Qian, J.Y. Effect of wind condition on unintended hydrogen release in a hydrogen refueling station. Int. J. Hydrogen Energy 2021, 46, 5537–5547. [Google Scholar] [CrossRef]
- Cui, W.Y.; Yuan, Y.P.; Tong, L.; Shen, B.Y. Numerical simulation of hydrogen leakage diffusion in seaport hydrogen refueling station. Int. J. Hydrogen Energy 2023, 48, 24521. [Google Scholar] [CrossRef]
- Qin, G.J.; Li, R.L.; Yang, M.; Wang, B.H.; Ni, P.G.; Wang, Y.H. Failure probability estimation of natural gas pipelines due to hydrogen embrittlement using an improved fuzzy fault tree approach. J. Clean. Prod. 2024, 448, 141601. [Google Scholar] [CrossRef]
- So, J.; Chae, M.; Hong, J.; Youm, J.; Kim, S.H.; Kim, J. Integrated mobility hub location selection for sustainable urban mobility. Sustain. Cities Soc. 2023, 99, 104950. [Google Scholar] [CrossRef]
- Zhu, C.; Tang, S.; Li, Z.; Fang, X. Dynamic study of critical factors of explosion accident in laboratory Based upon FTA. Saf. Sci. 2020, 130, 104877. [Google Scholar] [CrossRef]
- Chen, G.; Wang, S.; Ran, Y.; Cao, X.; Fang, Z.; Xu, Z. Intelligent monitoring and quantitative evaluation of fire risk in subway construction: Integration of multi- source data fusion, FTA, and deep learning. J. Clean. Prod. 2024, 478, 143832. [Google Scholar] [CrossRef]
- Hyun, K.C.; Min, S.; Choi, H.; Park, J.; Lee, I.M. Risk analysis using fault-tree analysis (FTA) and analytic hierarchy process (AHP) applicable to shield TBM tunnels. Tunn. Undergr. Sp. Technol. 2015, 49, 121–129. [Google Scholar] [CrossRef]
- Wang, Y.; Ni, X.; Wang, J.; Hu, Z.; Lu, K. A Comprehensive investigation on the fire hazards and environmental risks in a commercial complex based upon fault tree analysis and the analytic hierarchy process. Int. J. Environ. Res. Public Health 2020, 17, 7347. [Google Scholar]
- Vesely, W.E.; Goldberg, F.F.; Roberts, N.H.; Haasl, D.F. Fault Tree Handbook (NUREG-0492); U.S. Nuclear Regulatory Commission: Washington, DC, USA, 1981. Available online: https://www.nrc.gov/docs/ML1007/ML100780465.pdf (accessed on 27 January 2025).
- Shi, S.L.; Jiang, B.Y.; Meng, X.R. Assessment of gas and dust explosion in coal mines by means of fuzzy fault tree analysis. Int. J. Min. Sci. Technol. 2018, 28, 991–998. [Google Scholar] [CrossRef]
- Stamatelatos, M.G. Fault Tree Handbook with Aerospace Applications; National Aeronautics and Space Administration: Washington, DC, USA, 2002. [Google Scholar]
- Yang, Y.; Chen, G.; Wang, D. A Security Risk Assessment Method Based upon Improved FTA-IAHP for Train Position System. Electronics 2022, 11, 2863. [Google Scholar]
- Cho, S.; Kim, J.; Lim, D. Optimal design of renewable energy certificate multipliers using an LCOE-Integrated AHP model: A case study of South Korea. Renew. Energy 2024, 226, 120386. [Google Scholar] [CrossRef]
- Pinheiro, B.C.; de Mello-Sant’Ana, P.H. AHP-based decision making to selecting energy-efficient air conditioning equipaments in a commercial building. Energy Build. 2025, 329, 115281. [Google Scholar] [CrossRef]
- Singh, P.; Ajay, S.K. Unravelling barriers associated with dissemination of large-scale biogas plant with analytical hierarchical process and fuzzy analytical hierarchical process approach: Case study of India. Bioresour. Technol. 2024, 413, 131543. [Google Scholar] [CrossRef] [PubMed]
- Caporale, D.; Rinaldi, A. The application of analytical hierarchy process to assess adaptation strategies for flood and landslides risks: A case study of a multi-risk area community. Environ. Sci. Policy 2025, 163, 103959. [Google Scholar] [CrossRef]
- Saaty, T.L. Decision-making with the AHP: Why is the principal eigenvector necessary. Eur. J. Oper. Res. 2003, 145, 85–91. [Google Scholar] [CrossRef]
- Ahmed, F.; Kilic, K. Fuzzy analytic hierarchy process: A performance analysis of various algorithms. Fuzzy Sets Syst. 2019, 362, 110–128. [Google Scholar] [CrossRef]
- Chan, H.K.; Sun, X.T.; Chung, S.H. When should fuzzy analytic hierarchy process be used instead of analytic hierarchy process. Decis. Support Syst. 2019, 125, 113114. [Google Scholar] [CrossRef]
- Faisal, S.M.F.; Chandra Banik, S.; Sen Gupta, P. Development of a readiness model for industry 4.0 using analytical hierarchy process and fuzzy inference system: Bangladesh perspective. Heliyon 2024, 10, 23664. [Google Scholar] [CrossRef]
- Ahmad, S.; Parvez, M.; Khan, T.A.; Khan, O. A hybrid approach using AHP–TOPSIS methods for ranking of soft computing techniques Based upon their attributes for prediction of solar radiation, Environ. Challenges 2022, 9, 100634. [Google Scholar]
- Bouramdane, A.A. Crafting an optimal portfolio for sustainable hydrogen production choices in Morocco. Fuel 2024, 358, 130292. [Google Scholar] [CrossRef]
- Roberts, J.; Williams, L.; Debra, S.B. ALOHA: Areal Locations of Hazardous Atmospheres. Technical Documentation. U.S. Dept. of Commerce, NOAA Technical Memorandum NOS OR&R 43. Washington, DC, USA. 2013. Available online: https://response.restoration.noaa.gov/sites/default/files/ALOHA_Tech_Doc.pdf (accessed on 27 January 2025).
- Anjana, N.S.; Amarnath, A.; Harindranathan Nair, M.V. Toxic hazards of ammonia release and population vulnerability assessment using geographical information system. J. Environ. Manag. 2018, 210, 201–209. [Google Scholar] [CrossRef]
- Nan, F.; Luo, Z.M.; Cheng, F.M.; Xiao, Y.; Li, R.K.; Su, B.; Wang, T. Research progress and development trends of hydrogen explosion suppression materials and mechanisms. Process Saf. Environ. Prot. 2024, 184, 1318. [Google Scholar] [CrossRef]
- Li, Y.; Ping, H.; Ma, Z.H.; Pan, L.G. Statistical analysis of sudden chemical leakage accidents reported in China between 2006 and 2011. Environ. Sci. Pollut. Res. 2014, 21, 5547–5553. [Google Scholar] [CrossRef] [PubMed]
- Orozco, J.L.; Van Caneghem, J.; Hens, L.; González, L.; Lugo, R.; Díaz, S.; Pedroso, I. Assessment of an ammonia incident in the industrial area of matanzas. J. Clean. Prod. 2019, 222, 934–941. [Google Scholar] [CrossRef]
- Wang, X.; Ding, J.; Yang, X.; Tang, X.; Weng, P. Dynamic evolution of leakage and explosion accident in high pressure hydrogen storage system. J. Saf. Sci. Technol. 2023, 19, 150. (In Chinese) [Google Scholar]
- Li, J.Y.; Zhao, Y.Z.; Zheng, J.Y. Simulation and analysis on leakage and explosion of high pressure hydrogen in hydrogen refueling station. J. Zhejiang Univ. (Eng. Sci.) 2015, 49, 1389–1394. (In Chinese) [Google Scholar]
- Wang, K.; Zhang, S.; Liu, X.; Wang, H.; Zhao, L.; Shi, T.; Zhou, M. Research on hydrogen dispersion behavior induced by storage cylinder group failure in oil-hydrogen refueling station. J. Saf. Environ. 2024, 24, 1691. (In Chinese) [Google Scholar]
- Park, B.; Kim, Y.; Paik, S.; Kang, C. Numerical and experimental analysis of jet release and jet flame length for qualitative risk analysis at hydrogen refueling station. Process Saf. Environ. Prot. 2021, 155, 145–154. [Google Scholar] [CrossRef]
- Wang, X.; Gao, W. Hydrogen leakage risk assessment for hydrogen refueling stations. Int. J. Hydrogen Energy 2023, 48, 35795. [Google Scholar] [CrossRef]
- Yoo, B.; Wilailak, S.; Bae, S.; Gye, H.; Lee, C. Comparative risk assessment of liquefied and gaseous hydrogen refueling stations. Int. J. Hydrogen Energy 2021, 46, 35511–35524. [Google Scholar] [CrossRef]
- Xu, X.; Hu, W.; Liu, W.; Wang, D.; Huang, Q.; Huang, R.; Chen, Z. Risk-based scheduling of an off-grid hybrid electricity/hydrogen/gas/refueling station powered by renewable energy. J. Clean. Prod. 2021, 315, 128155. [Google Scholar] [CrossRef]
- Rosyid, O.A.; Jablonski, D.; Hauptmanns, U. Risk analysis for the infrastructure of a hydrogen economy. Int. J. Hydrogen Energy 2007, 32, 3194–3200. [Google Scholar] [CrossRef]
- Liu, K.; Yang, X.; Dai, C. Study on the safety risk of hydrogen refueling station based upon risk assessment and fault tree analysis. J. Saf. Sci. Technol. 2021, 17, 50–55. [Google Scholar]
- Yuan, S.Q.; Yang, M.; Reniers, G.; Chen, C.; Wu, J.S. Safety barriers in the chemical process industries: A state-of-the-art review on their classification, assessment, and management. Saf. Sci. 2022, 148, 105647. [Google Scholar] [CrossRef]
- Chauhan, A.; Golestani, N.; Liu, H.R.; Salehi, F.; Abbassi, R. Human reliability assessment in hydrogen refuelling stations: A system dynamic approach. Int. J. Hydrogen Energy 2024, 56, 41. [Google Scholar] [CrossRef]
- Theophilus, S.C.; Esenowo, V.; Arewa, A.O.; Ifelebuegu, A.; Nnadi, E.O.; Mbanaso, F.U. Human factors analysis and classification system for the oil and gas industry (HFACS-OGI). Reliab. Eng. Syst. Saf. 2017, 167, 168–176. [Google Scholar] [CrossRef]
- Sun, K.; Pan, X.M.; Li, Z.Y.; Ma, J.X. Risk analysis on mobile hydrogen refueling stations in Shanghai. Int. J. Hydrogen Energy 2014, 39, 20411–20419. [Google Scholar] [CrossRef]
- Zhang, X.C.; Qiu, G.; Wang, S.L.; Wu, J.X.; Peng, Y.A. Hydrogen leakage simulation and risk analysis of hydrogen fueling station in China. Sustainability 2022, 14, 12420. [Google Scholar] [CrossRef]
- Wang, X.Y.; Zou, X.; Gao, W. Flammable gas leakage risk assessment for methanol to hydrogen refueling stations and liquid hydrogen refueling stations. Int. J. Hydrogen Energy 2024, 54, 1286. [Google Scholar] [CrossRef]
- Abohamzeh, E.; Salehi, F.; Sheikholeslami, M.; Abbassi, R.; Khan, F. Review of hydrogen safety during storage, transmission, and applications processes. J. Loss Prev. Process Ind. 2021, 72, 104569. [Google Scholar] [CrossRef]
- Dou, Z.; Jiang, J.C.; Wang, Z.R.; Pan, X.H.; Shu, C.M.; Liu, L.F. Applications of RBI on leakage risk assessment of direct coal liquefaction process. J. Loss Prev. Process Ind. 2017, 45, 194–202. [Google Scholar] [CrossRef]
- Miao, Y.; Jia, C.H.; Hua, Y.; Zhang, X.L.; Sun, L.J.; Huang, G.; Liu, H.B. Quantification of concentration characteristics of hydrogen leakage in electro-hydrogen coupled system with different obstacles via background oriented schlieren. J. Energy Storage 2024, 83, 110764. [Google Scholar] [CrossRef]
- Friederich, J.; Molnar, S.L. Reliability assessment of manufacturing systems: A comprehensive overview, challenges and opportunities. J. Manuf. Syst. 2024, 72, 38. [Google Scholar] [CrossRef]
- Yazdi, M.; Kabir, S.; Walker, M. Uncertainty handling in fault tree based risk assessment: State of the art and future perspectives. Process Saf. Environ. Prot. 2019, 131, 89–104. [Google Scholar] [CrossRef]
- Fu, G.; Cao, J.L.; Zhou, L.; Xiang, Y.C. Comparative study of HFACS and the 24 Model accident causation models. Pet. Sci. 2017, 14, 570–578. [Google Scholar] [CrossRef]
- Zhou, J.L.; Shia, Y.B.; Sun, Z.Y. A hybrid fuzzy FTA-AHP method for risk decision-making in accident emergency response of work system. J. Intell. Fuzzy Syst. 2015, 29, 1381–1393. [Google Scholar] [CrossRef]
- Gao, Q.X.; Wang, L.J.; Peng, W.; Zhang, P.; Chen, S.Z. Safety analysis of leakage in a nuclear hydrogen production system. Int. J. Hydrogen Energy 2022, 47, 4916–4931. [Google Scholar] [CrossRef]
- Liang, Y.; Pan, X.M.; Zhang, C.M.; Xie, B.; Liu, S.J. The simulation and analysis of leakage and explosion at a renewable hydrogen refuelling station. Int. J. Hydrogen Energy 2019, 44, 22608–22619. [Google Scholar] [CrossRef]
- Qian, J.Y.; Li, X.J.; Gao, Z.X.; Jin, Z.J. A numerical study of unintended hydrogen release in a hydrogen refueling station. Int. J. Hydrogen Energy 2020, 45, 20142–20152. [Google Scholar] [CrossRef]
- Shu, Z.Y.; Liang, W.Q.; Zheng, X.H.; Lei, G.; Cao, P.; Dai, W.X.; Qian, H. Dispersion characteristics of hydrogen leakage: Comparing the prediction model with the experiment. Energy 2021, 236, 121420. [Google Scholar] [CrossRef]
- Li, X.H.; Jia, M.R.; Zhang, R.R.; Han, Z.Y. Dispersion modeling and assessment of natural gas containing hydrogen released from a damaged gas transmission pipeline. Int. J. Hydrogen Energy 2022, 47, 35365. [Google Scholar] [CrossRef]
- Qu, J.; Zhao, H.L.; Zhao, L.C.; Luo, Z.M.; Wang, T.; Deng, J. Flame propagation characteristics of non-uniform premixed hydrogen-air mixtures explosion in a pipeline. Int. J. Hydrogen Energy 2024, 88, 462. [Google Scholar] [CrossRef]
- Qian, J.Y.; Li, X.J.; Gao, Z.X.; Jin, Z.J. A numerical study of hydrogen leakage and diffusion in a hydrogen refueling station. Int. J. Hydrogen Energy 2020, 45, 14428–14439. [Google Scholar] [CrossRef]
- Chen, L.X.; Deng, Y.; Mao, Z.Q.; Ma, J.X.; Zheng, J.Y.; Yuan, B.Y. Technical Code for Hydrogen Fuelling Station, GB50516, 2021, Ministry of Housing and Urban-Rural Development of the People’s Republic of China. Available online: https://www.mohurd.gov.cn/gongkai/zhengce/zhengcefilelib/202104/20210402_249677.html (accessed on 27 January 2025).
- Zhang, Y.; Dong, X.; Sun, S.; Ma, X. Method and System for Monitoring the Temperature of Photovoltaic Modules. Patent CN119151525A, 17 December 2024. [Google Scholar]
- Xu, J.X.; Huang, F.J.; Chen, X.; Yang, Q.G.; Zhang, H. Design and optimization of cryogenic supercritical hydrogen storage system coupled with mixed refrigerant and gas expansion cycle. Appl Therm. Eng. 2024, 243, 122606. [Google Scholar] [CrossRef]
- Tan, Y.; Guan, S.; Ye, Q.; Li, Y.; Tang, Z.; Xu, B.; Mao, Y.; Wu, Y.; Li, H.; Wang, T.; et al. A Cooling System for Hydrogen Refuelling. Station. Patent CN221991545U, 12 November 2024. [Google Scholar]
- Huang, Q.Y.; Guo, M.Y.; Wei, Y.N.; Zhang, J.Y.; Xie, F.; Jin, X.P. Influence of automation level of human-machine system on operators’ mental load. J. Saf. Sustain. 2024, 1, 42–52. [Google Scholar] [CrossRef]
- Yang, C.; Li, W.; Wei, G.; Zhang, D.; Yang, J.; Zhou, X.; Chen, H.; Hu, S.; Hu, Y. A Distributed Energy System and Operation Method for Methanol-to-Hydrogen Coupled Fuel Cell. Patent CN112349937A, 9 February 2021. [Google Scholar]
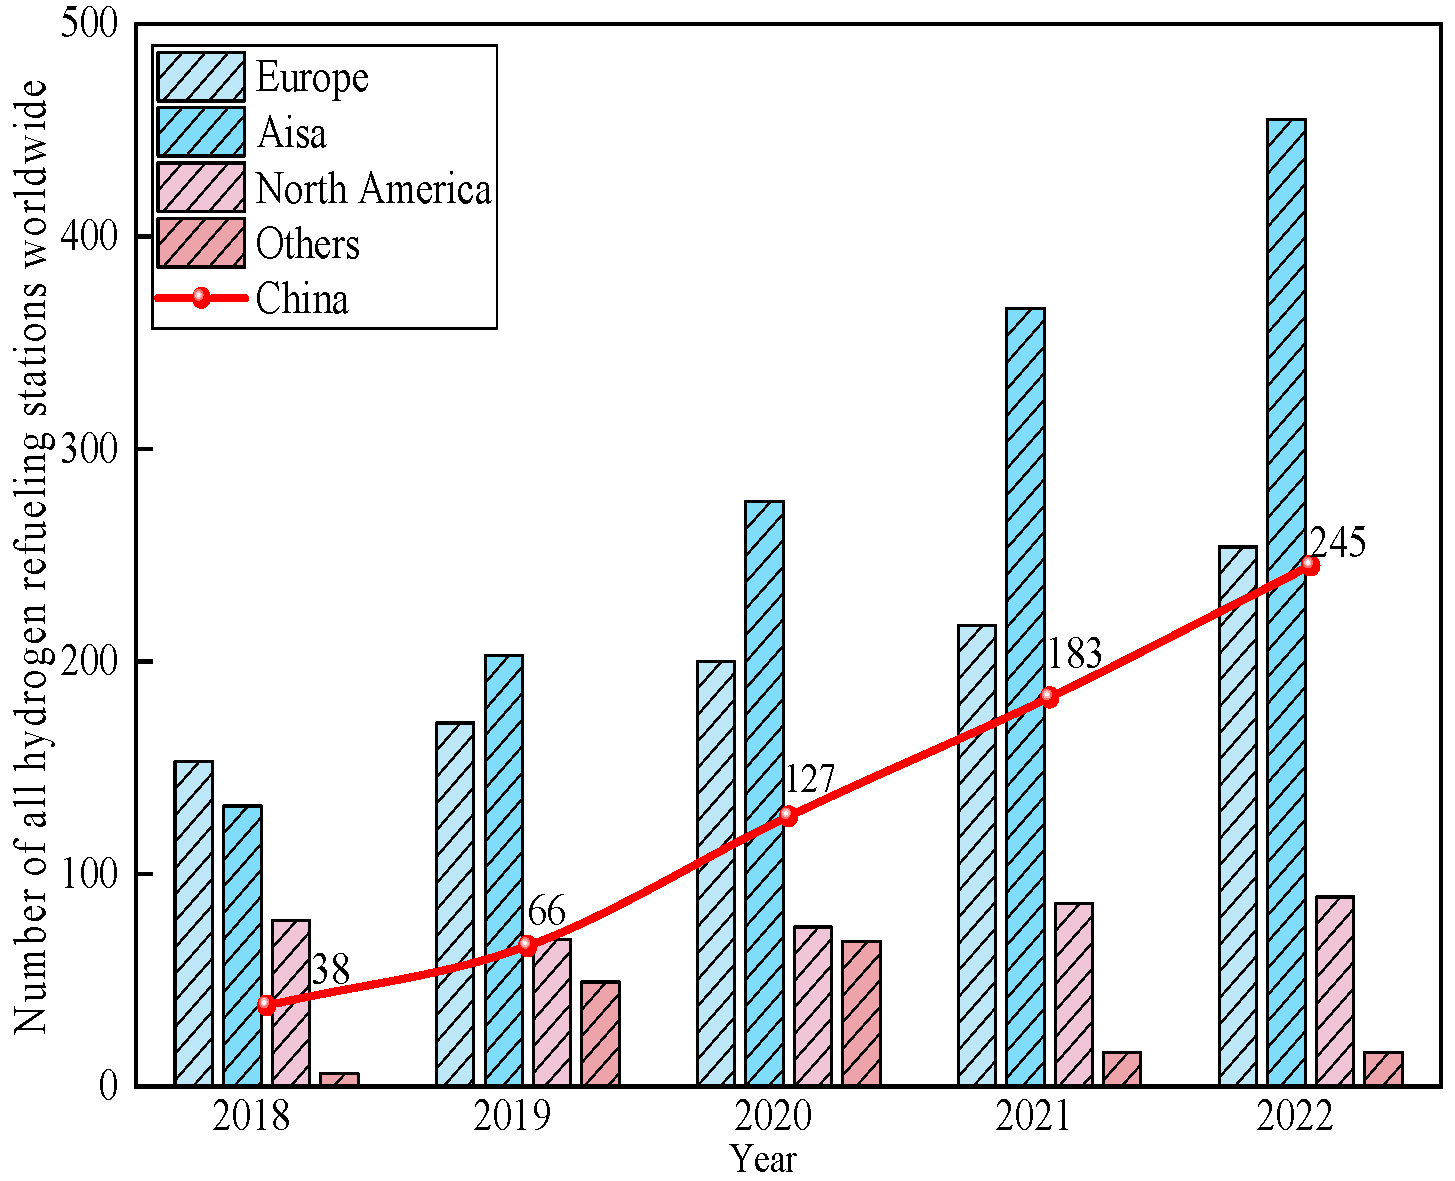
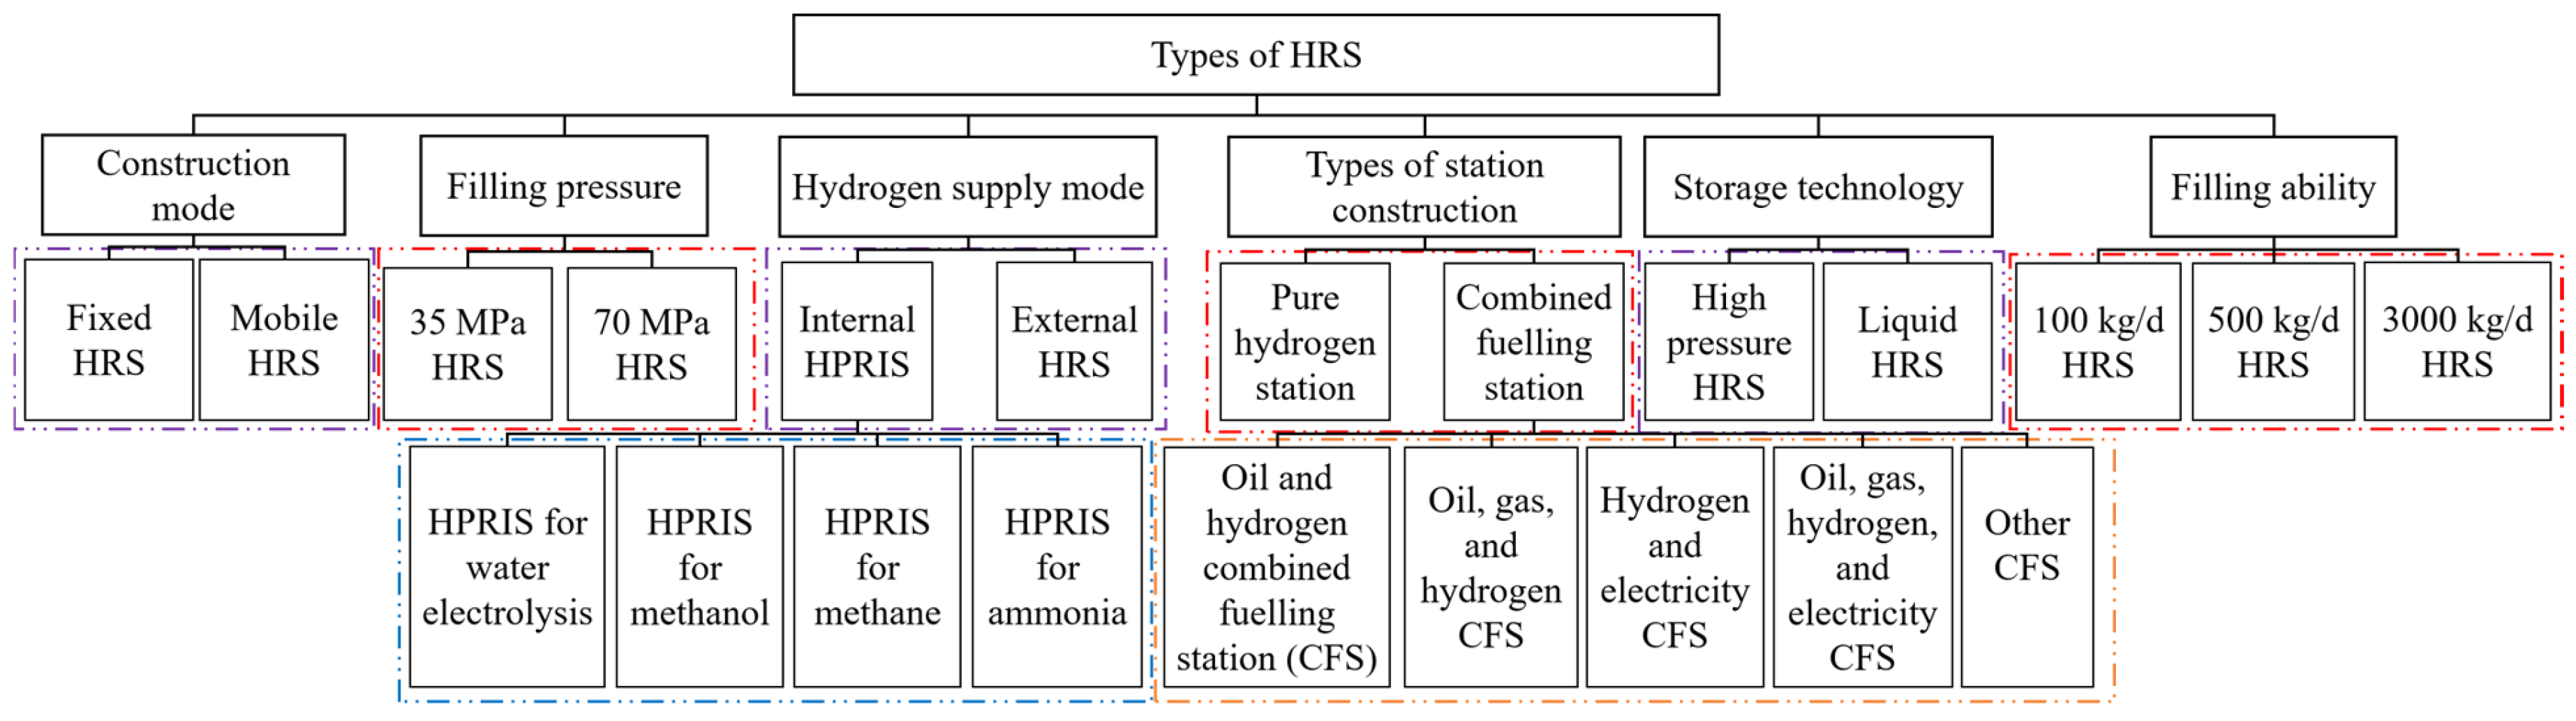

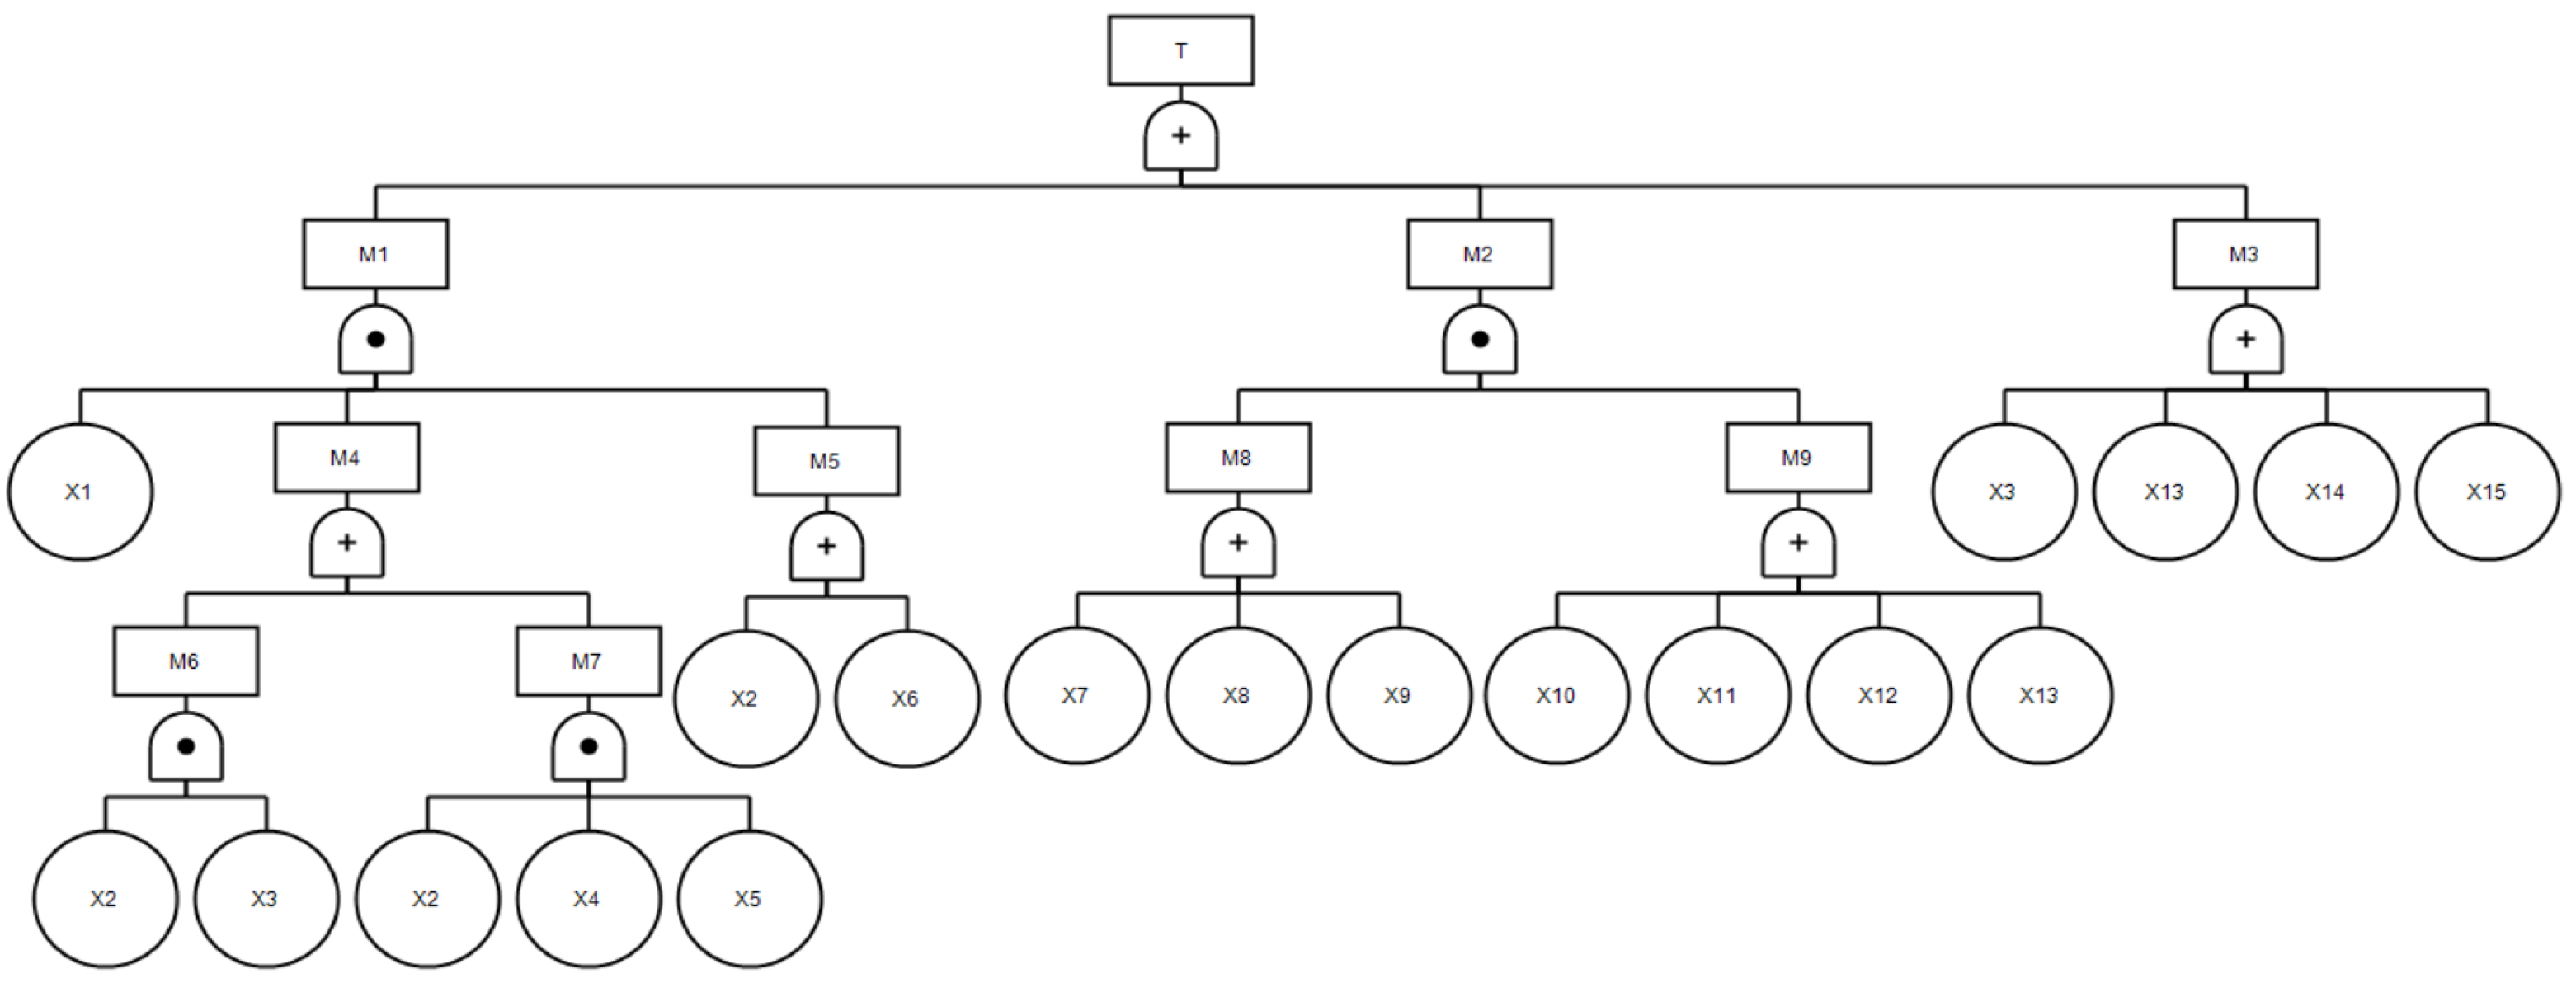

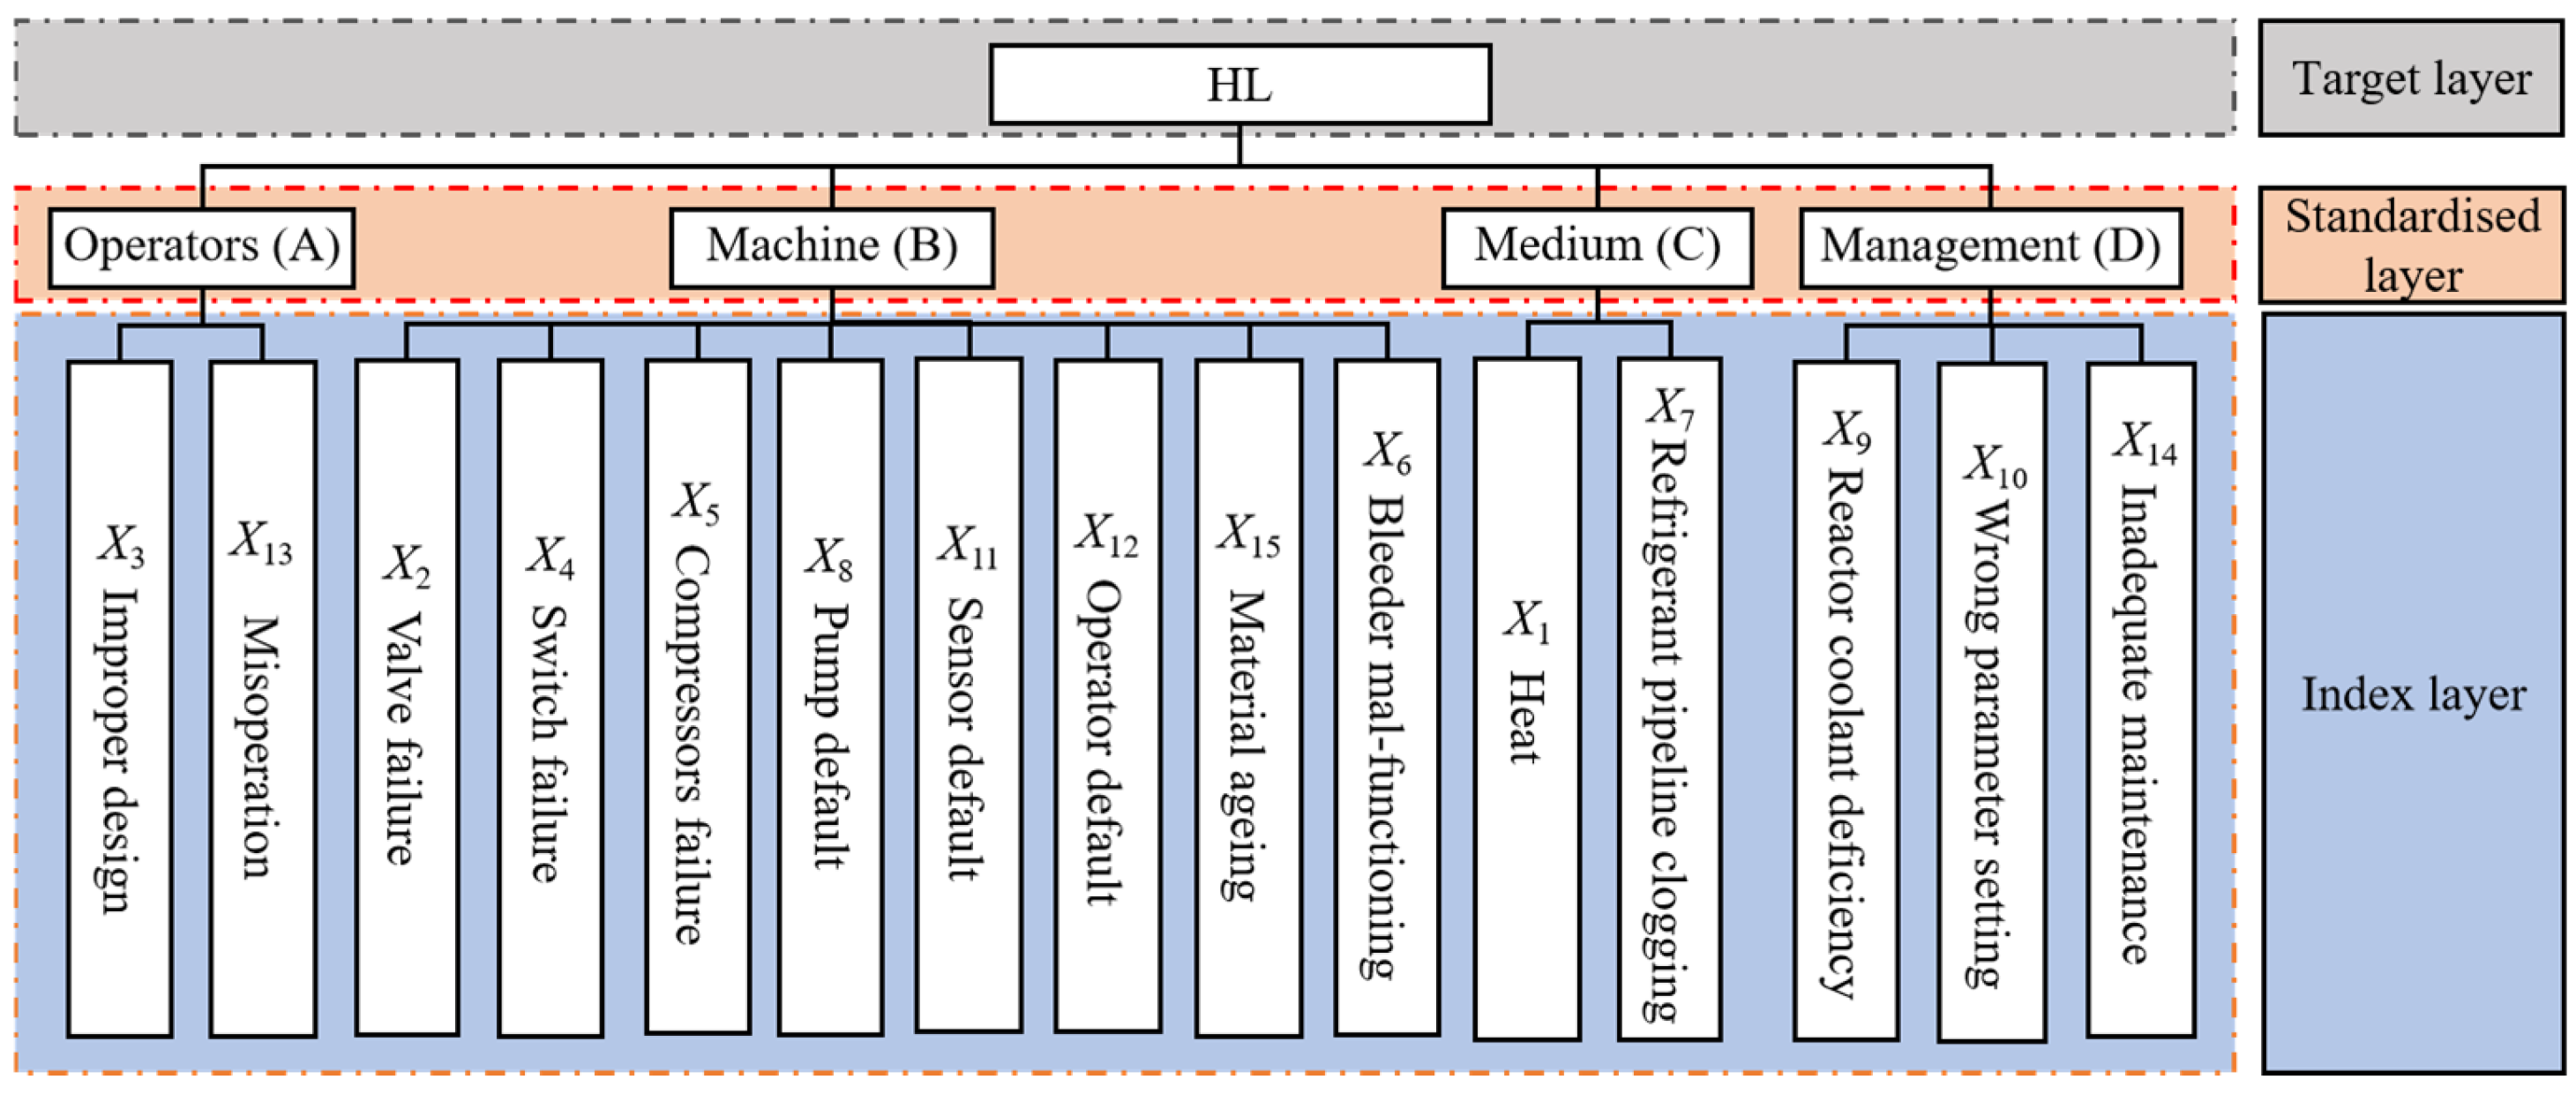


Disclaimer/Publisher’s Note: The statements, opinions and data contained in all publications are solely those of the individual author(s) and contributor(s) and not of MDPI and/or the editor(s). MDPI and/or the editor(s) disclaim responsibility for any injury to people or property resulting from any ideas, methods, instructions or products referred to in the content. |
© 2025 by the authors. Licensee MDPI, Basel, Switzerland. This article is an open access article distributed under the terms and conditions of the Creative Commons Attribution (CC BY) license (https://creativecommons.org/licenses/by/4.0/).