Article

Signal Positioning of Lightning Detection and Warning System Combining Direction of Arrival Algorithm and Capon Algorithm

School of Electric Power Engineering, Kunming University of Science and Technology, Kunming 650032, China
*
Author to whom correspondence should be addressed.
Processes 2025, 13(2), 398; https://doi.org/10.3390/pr13020398
Submission received: 11 October 2024 / Revised: 11 December 2024 / Accepted: 13 January 2025 / Published: 2 February 2025
(This article belongs to the Section AI-Enabled Process Engineering)

Abstract

:
Aiming at the poor warning effect and slightly low precision of signal positioning in the traditional lightning detection and warning system, the research utilizes the artificial intelligence approach to signal positioning in the lightning detection and warning system for performance improvement. The study first digitized the lightning signal using the arrival direction algorithm and then used the Capon algorithm based on the digitized processing to reduce the interference and improve the accuracy of lightning positioning. The results indicated that the root mean square error value and positioning angle error of lightning warning signal positioning data processing by hybrid algorithm were 6.72% and 5.93%, respectively. Meanwhile, the percentage of detection efficiency and real time was 96.36% and 95.16%, respectively, and the anti-interference ability was 94.02%. Moreover, the average value of time-consuming lightning warning positioning and the positioning error were 2.39 s and 2.69%, respectively. Moreover, the performance of all the comparison indexes was better than that of the comparison methods. This indicates that the method not only improves the precision of lightning signal positioning but also enhances the stability and real-time performance of the system. It has significant application potential in the field of lightning detection and warning and can effectively improve the precision and timeliness of lightning warning.

1. Introduction

Lightning, as a common meteorological phenomenon in nature, poses a serious threat to human activities, aerospace, and communication systems with its powerful electric current and electromagnetic radiation. With global climate change and the frequent occurrence of extreme weather events, the threat posed by lightning hazards to human society has become increasingly prominent [1,2]. Traditional lightning warning systems mostly rely on meteorological observation and satellite remote sensing data, but the warning effect and precision of these methods are often limited in complex terrain and electromagnetic environment [3,4]. Meanwhile, signal positioning technology is one of the key links in the research of lightning detection and warning system. In addition, traditional lightning positioning methods often rely on the time difference or phase difference between multiple sensors or receiving sites. However, these methods are limited by many factors in practical application, such as terrain, electromagnetic interference, etc., resulting in unsatisfactory positioning precision and stability [5,6]. Therefore, exploring new signal positioning algorithms to improve the performance of lightning detection and warning systems is the research focus of signal positioning for lightning warning systems. For lightning detection, the direction of arrival (DOA) algorithm can accurately estimate the source direction of lightning signal data, which provides an important basis for subsequent warning and protection. The Capon beamforming algorithm (Capon), as a high-resolution beamforming technique, further improves the precision and stability of signal positioning by optimizing the array weight vectors to enhance the signals in specific directions and suppress the interference from other directions [7,8]. The need for effective positioning analysis is also utilized, e.g., Khan et al. utilized an efficient wave DOA estimation method for positioning analysis of lightning methods. The method achieved source signal separation and DOA estimation by accurately estimating the instantaneous frequency of signals received by multiple sensors. Experiments demonstrated that the method outperforms existing techniques in terms of computational efficiency and positioning precision, and can work effectively in specific situations, providing a new solution for arrival direction estimation [9]. Automatic identification algorithms can also be utilized in the computational analysis of lightning transmissions when locating and analyzing lightning warnings. During the positioning analysis of lightning warnings, the automatic recognition algorithm can also be used to calculate and analyze the lightning transmission situation. For example, Chuang and Chen recorded a large number of transient events using the instrument for the study of upper atmospheric lightning (ISUAL) experiment on the FORMOSAT-2 satellite. However, only 16.3% were identified as transient lightning events. An autonomous algorithm was proposed to identify 292,248 strong lightning events and to construct a global strong lightning distribution map. Strong lightning was most active near the equator, with the bimodal pattern peaking in April and September. Spectral analysis revealed the generality of nitrogen band emissions, and the radiative flux associated with lightning energy [10]. Jamroen et al. also utilized an efficient curve fitting technique of the Gauss–Newton method for evaluating lightning strike voltage parameters. This method quickly determined the fundamental curve of lightning impulse voltage, and its precision was verified by comparing it with the standard recommended method. The results of the study demonstrated that the method was not only accurate in terms of results, but also had a shorter execution time, which made it suitable for the evaluation of lightning impulse voltage parameters [11].
In summary, although many experts and scholars have achieved significant results with lightning detection and warning systems, there are still obvious deficiencies in their lightning detection and warning positioning. Therefore, the study fuses the DOA algorithm with the Capon algorithm for lightning detection and warning system signal positioning research. The innovation of the study lies in the fact that the use of the DOA algorithm can provide the Capon algorithm with an initial estimation of the direction, thereby enabling the Capon algorithm to form a narrower beam in the correct direction. This, in turn, enhances the recognition ability of lightning signals. Concurrently, the Capon algorithm can also enhance the precision of the DOA algorithm by optimizing the array weight vectors, thereby markedly enhancing the overall performance of the lightning detection and warning system. The objective of the study is to propose novel approaches and methodologies for enhancing the efficacy of the lightning detection and warning system. The unique innovation of the proposed method lies in the introduction of adaptive thresholding in DOA and Capon algorithms. Therefore, the algorithm can adjust its parameters more effectively in a dynamic environment. The computational complexity of the DOA and Capon algorithms is reduced by parallel computation or optimized data flow. It emphasizes the combination of a lightning locator, active radar, and global lightning data set for comprehensive analysis. The main contribution of the research is to improve the robustness of the algorithm in complex environments. The framework of time series analysis is introduced to predict the trend of lightning activity.

2. Methods and Materials

2.1. Study on Digital Analysis of Lightning Signals

In the field of lightning detection, the collected lightning data serve as the signal source data. To effectively analyze lightning detection, the study applies the DOA algorithm to the analysis of lightning signal digitization. This makes it possible to accurately estimate the arrival direction of the lightning signal source. Before the digitization analysis, the lightning signal data must be collected effectively [12]. Through the summary of related research and practical application analysis and summary, the study will be the acquisition process of lightning signal data using the Beidou satellite positioning system for marking. Marking is a prerequisite for obtaining reliable data. The overall data acquisition process is as follows: first of all, it is necessary to carry out data series parallelism for multiple data streams and to determine whether lightning is generated by one of the data. Then, according to the lightning signal, the data frequency conversion is operated, and the signal after frequency conversion is marked. When each signal marking is completed, it is necessary to store it once, and then the memory module will extract the lightning data from the external memory module. After the extraction of the lightning data are completed, the data can be transferred to the corresponding relationship analysis matrix, thus forming the data analysis module. The schematic diagram of the whole process is shown in Figure 1.
In Figure 1, starting from data input, it passes through several steps such as serial-to-parallel conversion, digital data controller processing, and time synchronization. It finally realizes the accurate acquisition and efficient processing of lightning data. This process not only includes data preprocessing and storage control but also emphasizes the importance of time synchronization to ensure the precision and real-time nature of the data. After completing the lightning data acquisition, the effectiveness of the data acquisition process also needs to be analyzed. The study uses the covariance matrix to analyze the validity of the lightning signal data obtained by the DOA algorithm as a means of verifying the lightning arrival direction obtained from the data signal analysis. The pulse signal in the figure represents the transient electromagnetic radiation during lightning discharge. This pulse signal can effectively capture the electric field and current changes at the moment of a lightning strike and provides important signal characteristics for subsequent signal processing and position analysis. The collection of signals from two independent data sources serves to enhance data redundancy and, consequently, to improve system reliability. If one data source is disrupted or fails, the other data source can still provide core information to ensure continuity and accuracy of lightning location and warning. Since the nature of the lightning signal is a broadband signal, the study uses white noise to simulate the analysis process of the lightning signal so as to realize the effectiveness analysis. In the analysis process, a lightning reference signal and its displacement can be employed to obtain other signals as a reference signal. The use of different reference signals can be utilized to define and analyze the position of the time series of the signal. The process of definition can be expressed by Equation (1) [13].
N = d sin θ c ( n 1 )
In Equation (1), N denotes the signal timing position and d denotes the distance between neighboring timing signals. θ denotes the incidence angle of the signal, and c denotes the value of the timing signal coefficient. n denotes the number of time series signals. After completing the definition of the signal time series position, when there is a delay period between the lightning data, data preprocessing can be utilized to obtain an estimate of the angle of incidence, which can be defined using Equation (2) [13].
θ = arcsin ( 2 f 0 f x )
In Equation (2), f 0 denotes the lowest frequency in the lightning data. f x denotes the value of the frequency parameter. Upon completion of the verification and analysis of the lightning data signals, a frequency conversion operation can be performed on the collected signal data. Noise can be removed and the signal quality improved through frequency domain filtering techniques in the frequency conversion operation, which may include lowering the sampling rate to reduce data processing and storage requirements. In performing the frequency conversion operation, the study demodulates the signal before the frequency conversion process and then utilizes the covariance matrix for data computation. This operation makes it possible to eliminate the mirroring problem caused by the DOA algorithm for lightning signal analysis, thus improving the accuracy of data processing. 
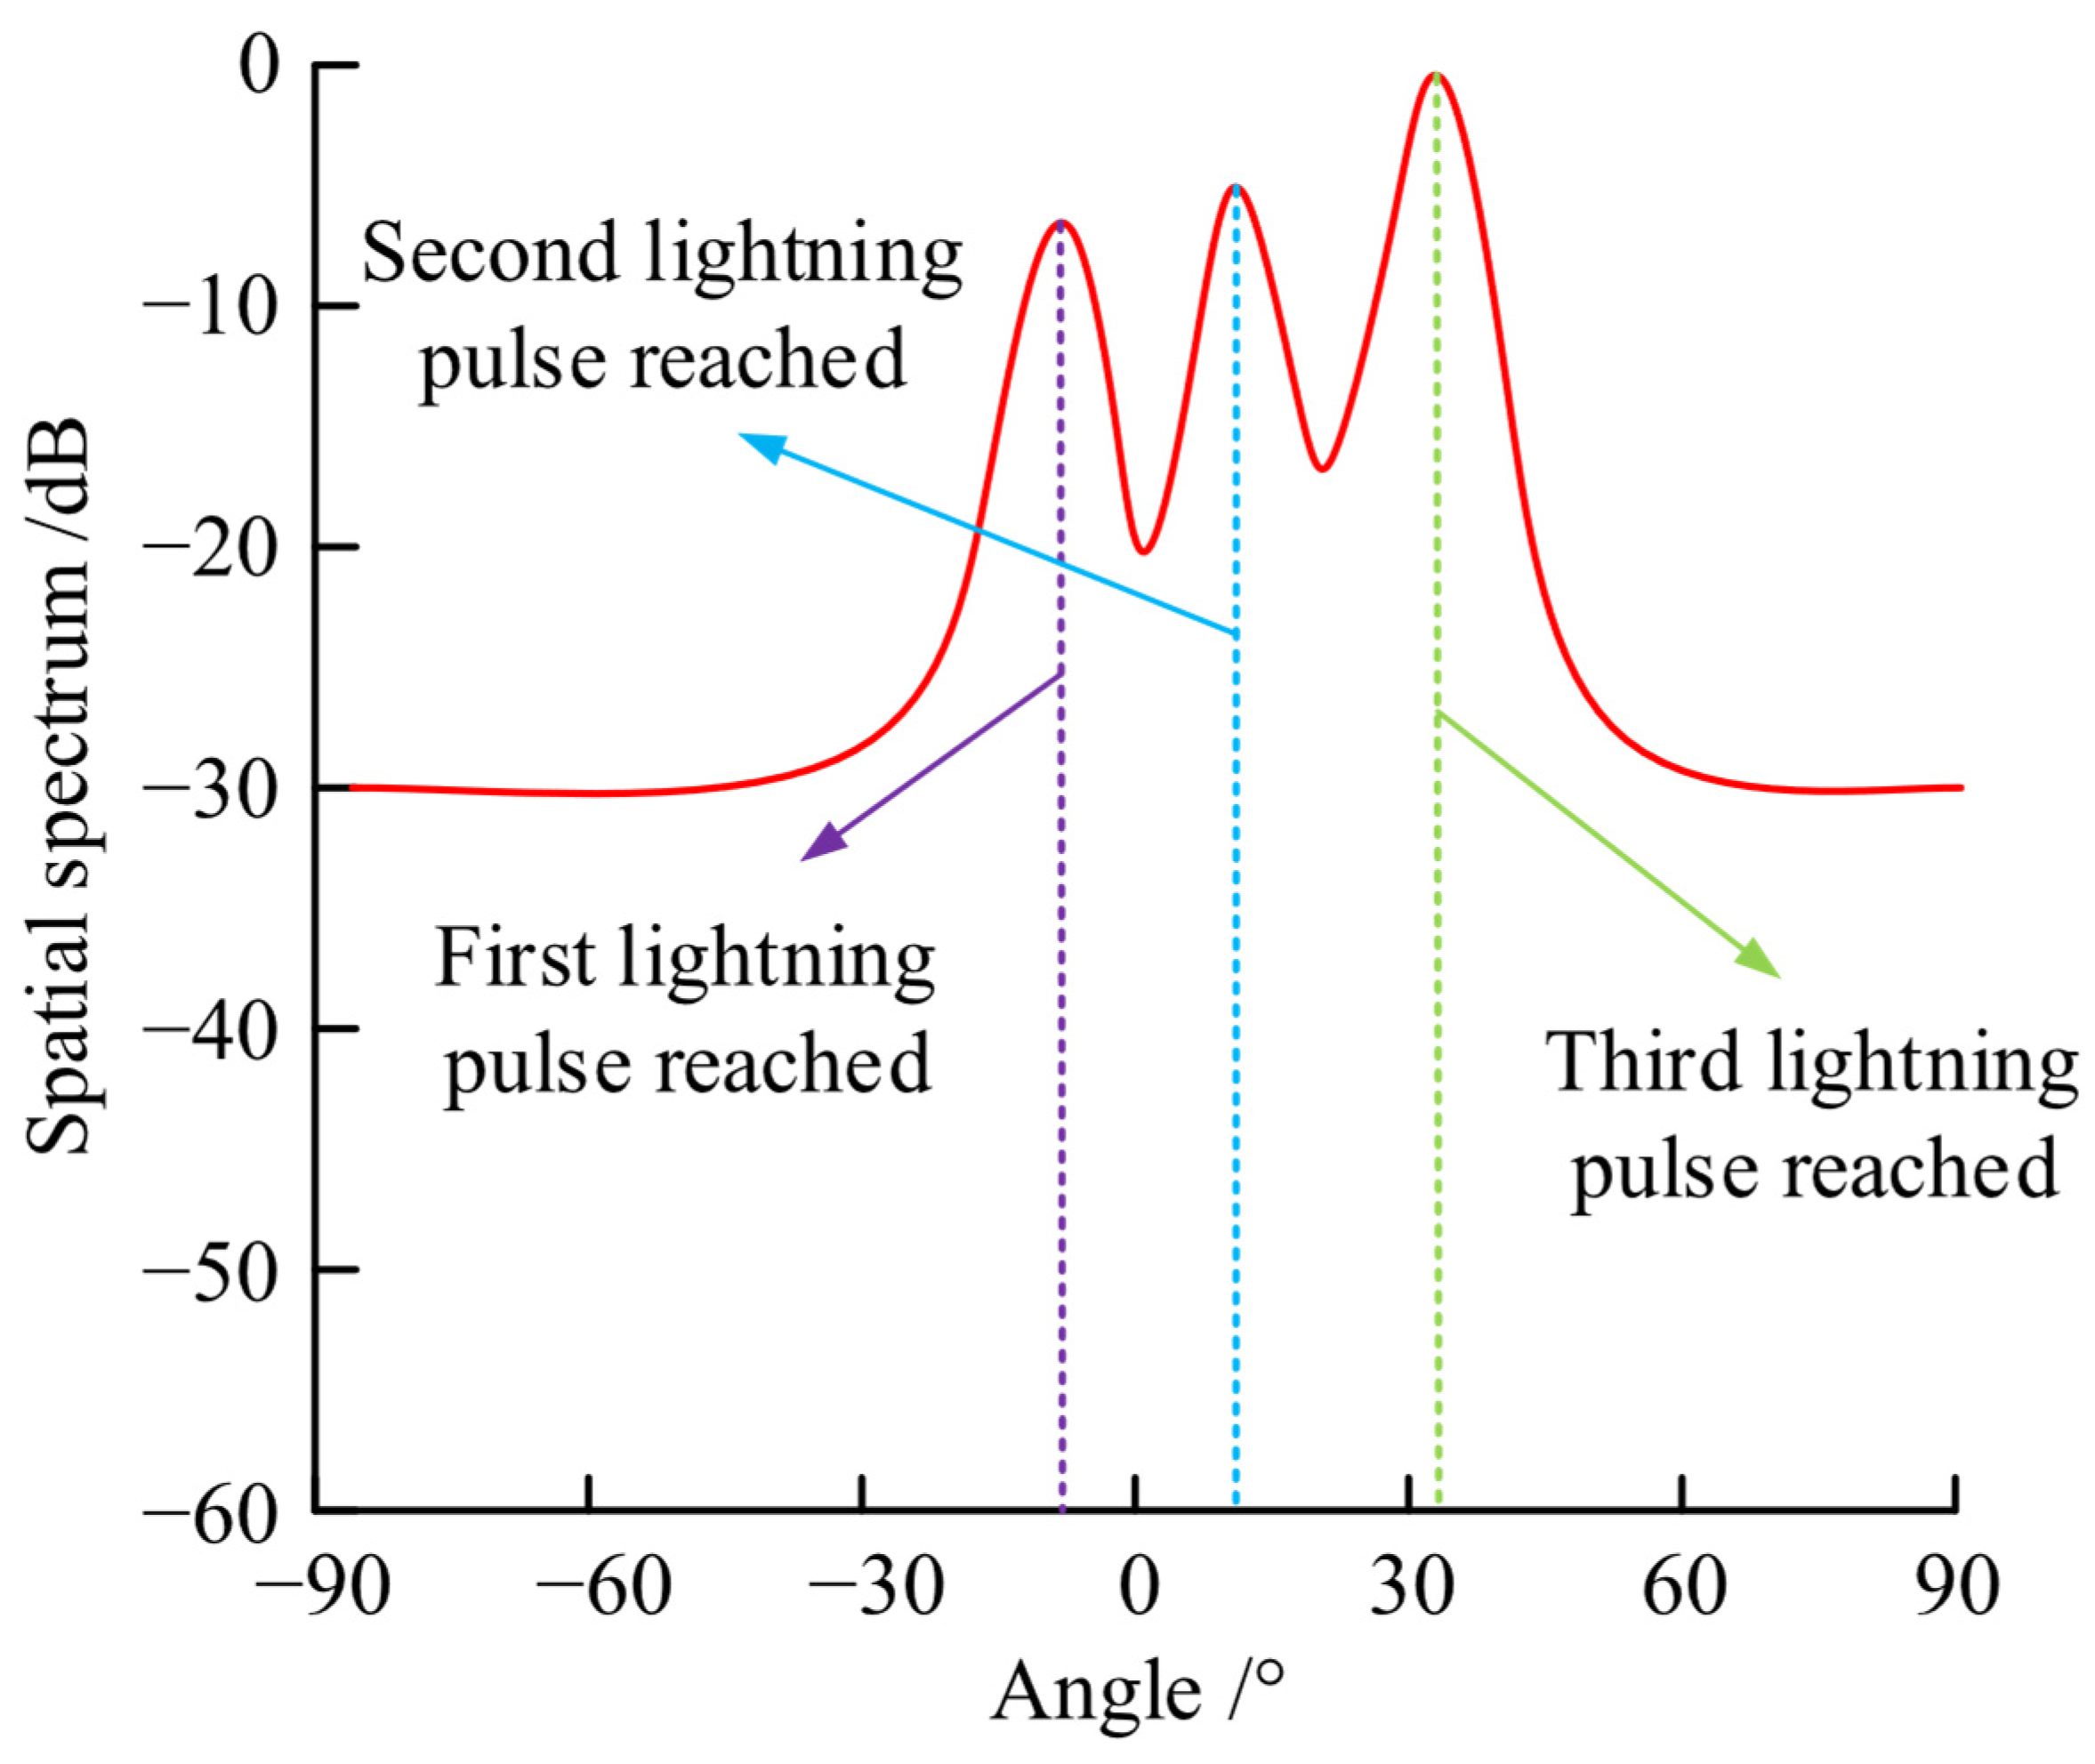
Figure 2 shows the simulation effect of the frequency conversion processing of lightning signal data based on the covariance matrix.
In Figure 2, after completing the processing of lightning-related data information, the study is able to estimate and analyze the arrival time difference in the lightning pulse. By measuring the time difference between the arrival of lightning pulses at different detection stations, it is possible to realize the effective positioning of the location of the lightning [14]. The estimation of the time difference between different stations in the lightning warning system is the matching operation of the lightning homologation pulse. The minimum value on the curve in the figure corresponds to the region with the weakest value of the spatial spectrum, indicating that the signal energy received at that angle is relatively low. In the process of lightning homologation pulse matching, the matching process is divided into two parts: pulse pre-screening and judgment. The pulse pre-screening can analyze the collected lightning pulse signals for homologation, and the screening criteria can be defined by Equation (3) [14].
τ A D A B V c τ B τ A + D A B V c
In Equation (3), τ A denotes the lightning pulse received by ground monitoring station A. τ B denotes the lightning pulse received by ground monitoring station B. D A B denotes the distance between the two monitoring stations. V c denotes the speed of light. Using Equation (3), the initial screening of lightning pulses can be completed. After completing the initial screening, the judgment can be carried out to obtain the real pulse queue of the lightning pulse. The determination of the same lightning pulse queue can be defined by Equation (4) [14].
R x y ( τ ) = ( x n x ¯ ) ( y n + τ ) y ¯ ( x n x ¯ ) 2 ( y n y ¯ ) 2
In Equation (4), R x y ( τ ) denotes the same lightning pulse queue. x n and y n denote the signal data received between two monitoring stations A and B, respectively. x ¯ and y ¯ denote the average value of the signal data, respectively. τ denotes the total number of lightning pulses. By determining the lightning pulse queue, the final queue data can be obtained. However, when analyzing the lightning data, the corresponding correction of the queue time difference estimation result is also required in the lightning pulse queue. The corresponding received lightning pulse moments in different monitoring stations can be expressed by Equation (5) [14].
t A = t 0 + L A / V c t B = t 0 + L B / V c
In Equation (5), t A denotes the moment when monitoring station A obtains the lightning pulse. t 0 denotes the moment when lightning appears. L A denotes the predicted distance between monitoring station A and lightning. t B denotes the real value of the lightning pulse obtained by monitoring station B. L B denotes the predicted distance between monitoring station B and the lightning. By analyzing Equation (5), the actual time difference can be analyzed at this time, and the analysis process can be expressed by Equation (6).
Δ t = t A t B = ( L A L B ) / V c
In Equation (6), Δ t denotes the actual time difference. Through the above related research operations, it is possible to obtain a graph of the lightning pulse moments obtained by the monitoring station, which is shown in
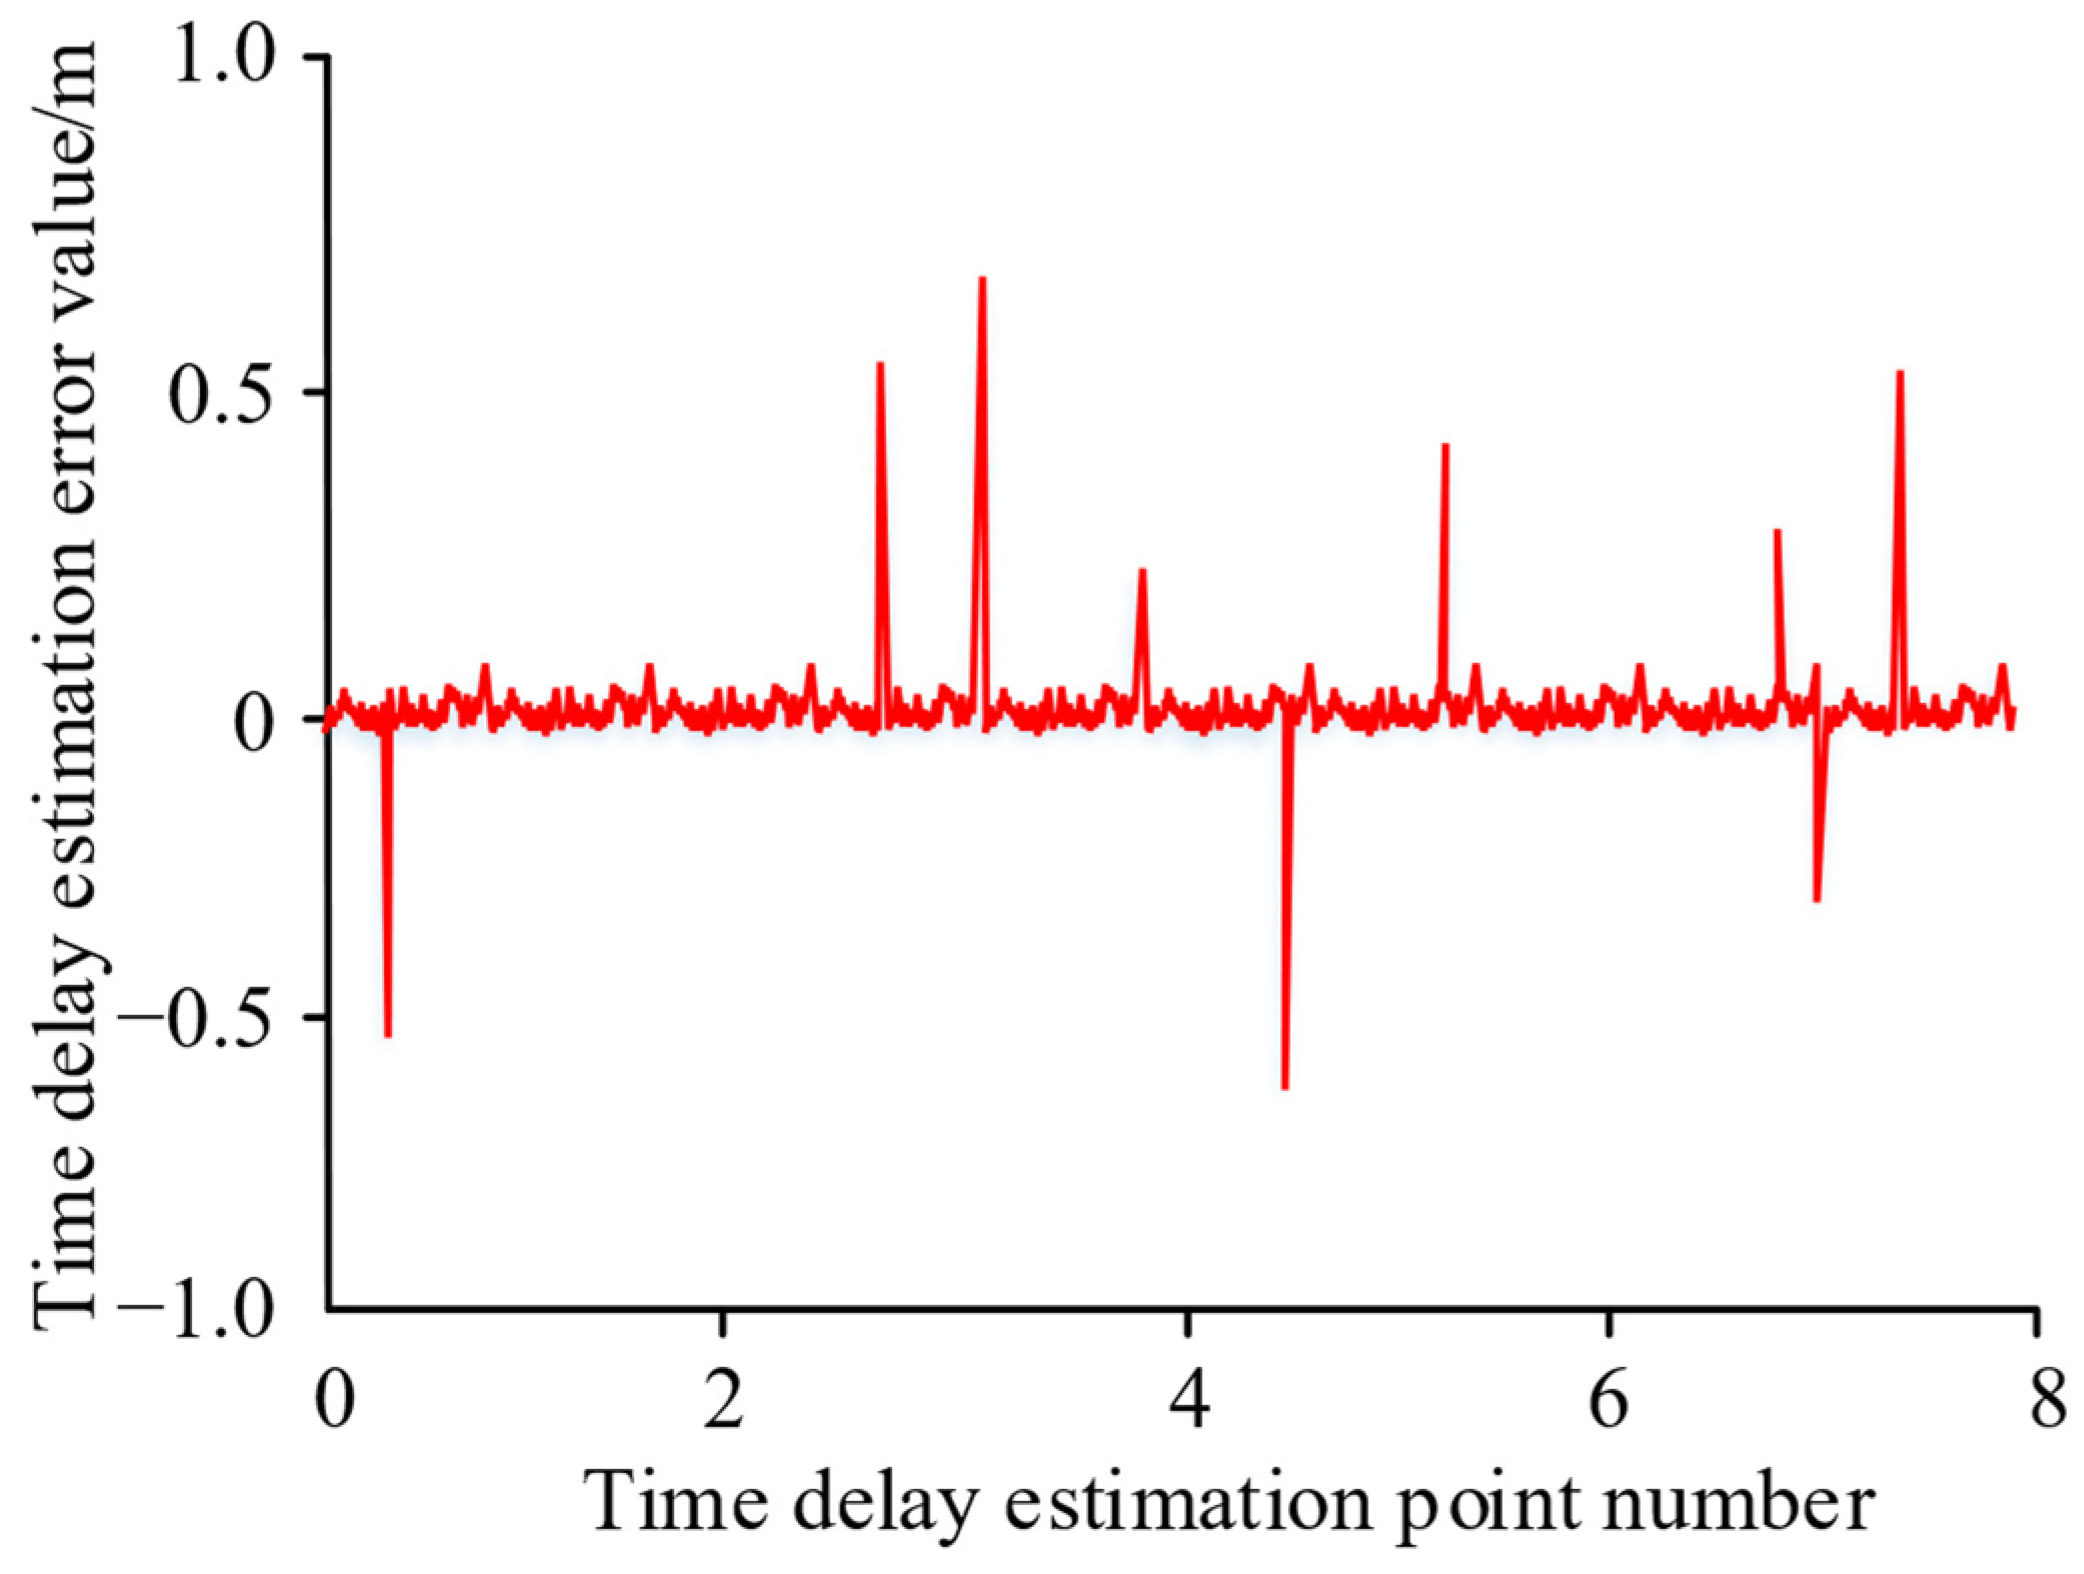
 Figure 3.
In Figure 3, some of the curves have significant changes, and these changes are the monitoring of lightning pulses. If the lightning pulse has a large time difference, the graph will fluctuate significantly. When the time difference in the lightning pulse becomes smaller, the graph becomes smooth again. Therefore, the estimation error caused by the time delay can be greatly reduced by using the time difference estimation method.

2.2. Lightning Signal Positioning Based on Hybrid Algorithm

Through the lightning data signal analysis, it is found that in the lightning signal positioning process, the presence of noise will greatly reduce the positioning ability of early warning systems [15]. Therefore, the study introduces the Capon algorithm into the lightning signal positioning study based on the lightning signal data analysis using the DOA algorithm. The Capon algorithm is able to utilize circular arrays to reduce the errors present in the positioning process. To enhance the reliability of Capon’s algorithm in lightning signal positioning, the study incorporates a uniform circumferential array into Capon’s algorithm as a means of determining the orientation information of the lightning signal source. The uniform circumferential array is able to optimize key parameters such as the number of array elements and the spacing of the array elements to maximize the performance and adaptability of the array. The specific implementation method is as follows: First, the structure design of uniform circular array is the core component of the algorithm performance. The array consists of multiple sensors uniformly distributed on a ring with a fixed radius to improve the spatial resolution of the signal and maximize the reception ability of the lightning signal. The choice of radius and the number of sensor elements are important parameters of the array. The radius of the uniform circular array is set as r value. N sensor elements in the array are evenly distributed along the circumference. The element spacing is calculated as shown in Equation (7).
d = ( 2 π r ) / N
In Equation (7), d represents element spacing calculation. This formula ensures that the appropriate distance between each sensor is maintained to avoid interference with each other. In the implementation phase of the algorithm, the preliminary DOA estimation is performed to obtain the signal direction information. In this stage, the received lightning signals are digitally processed, and the covariance matrix is used to support signal separation and direction detection. Then, in the implementation of the Capone algorithm, the obtained directional information is combined to optimize the weight vector of the array.
The main reason for selecting DOA and Capon algorithms is that these methods have more accurate directional and spectral estimation capabilities than other algorithms. The OA algorithm is specifically designed for signal direction estimation. It can efficiently identify the angle of the signal source, thus providing highly accurate initial information for lightning location. Capon algorithm, as an optimized spectrum estimation method, can provide high-resolution information in single signal detection. It emphasizes the characteristics of the target signal by minimizing the interference of the interfering signal. 
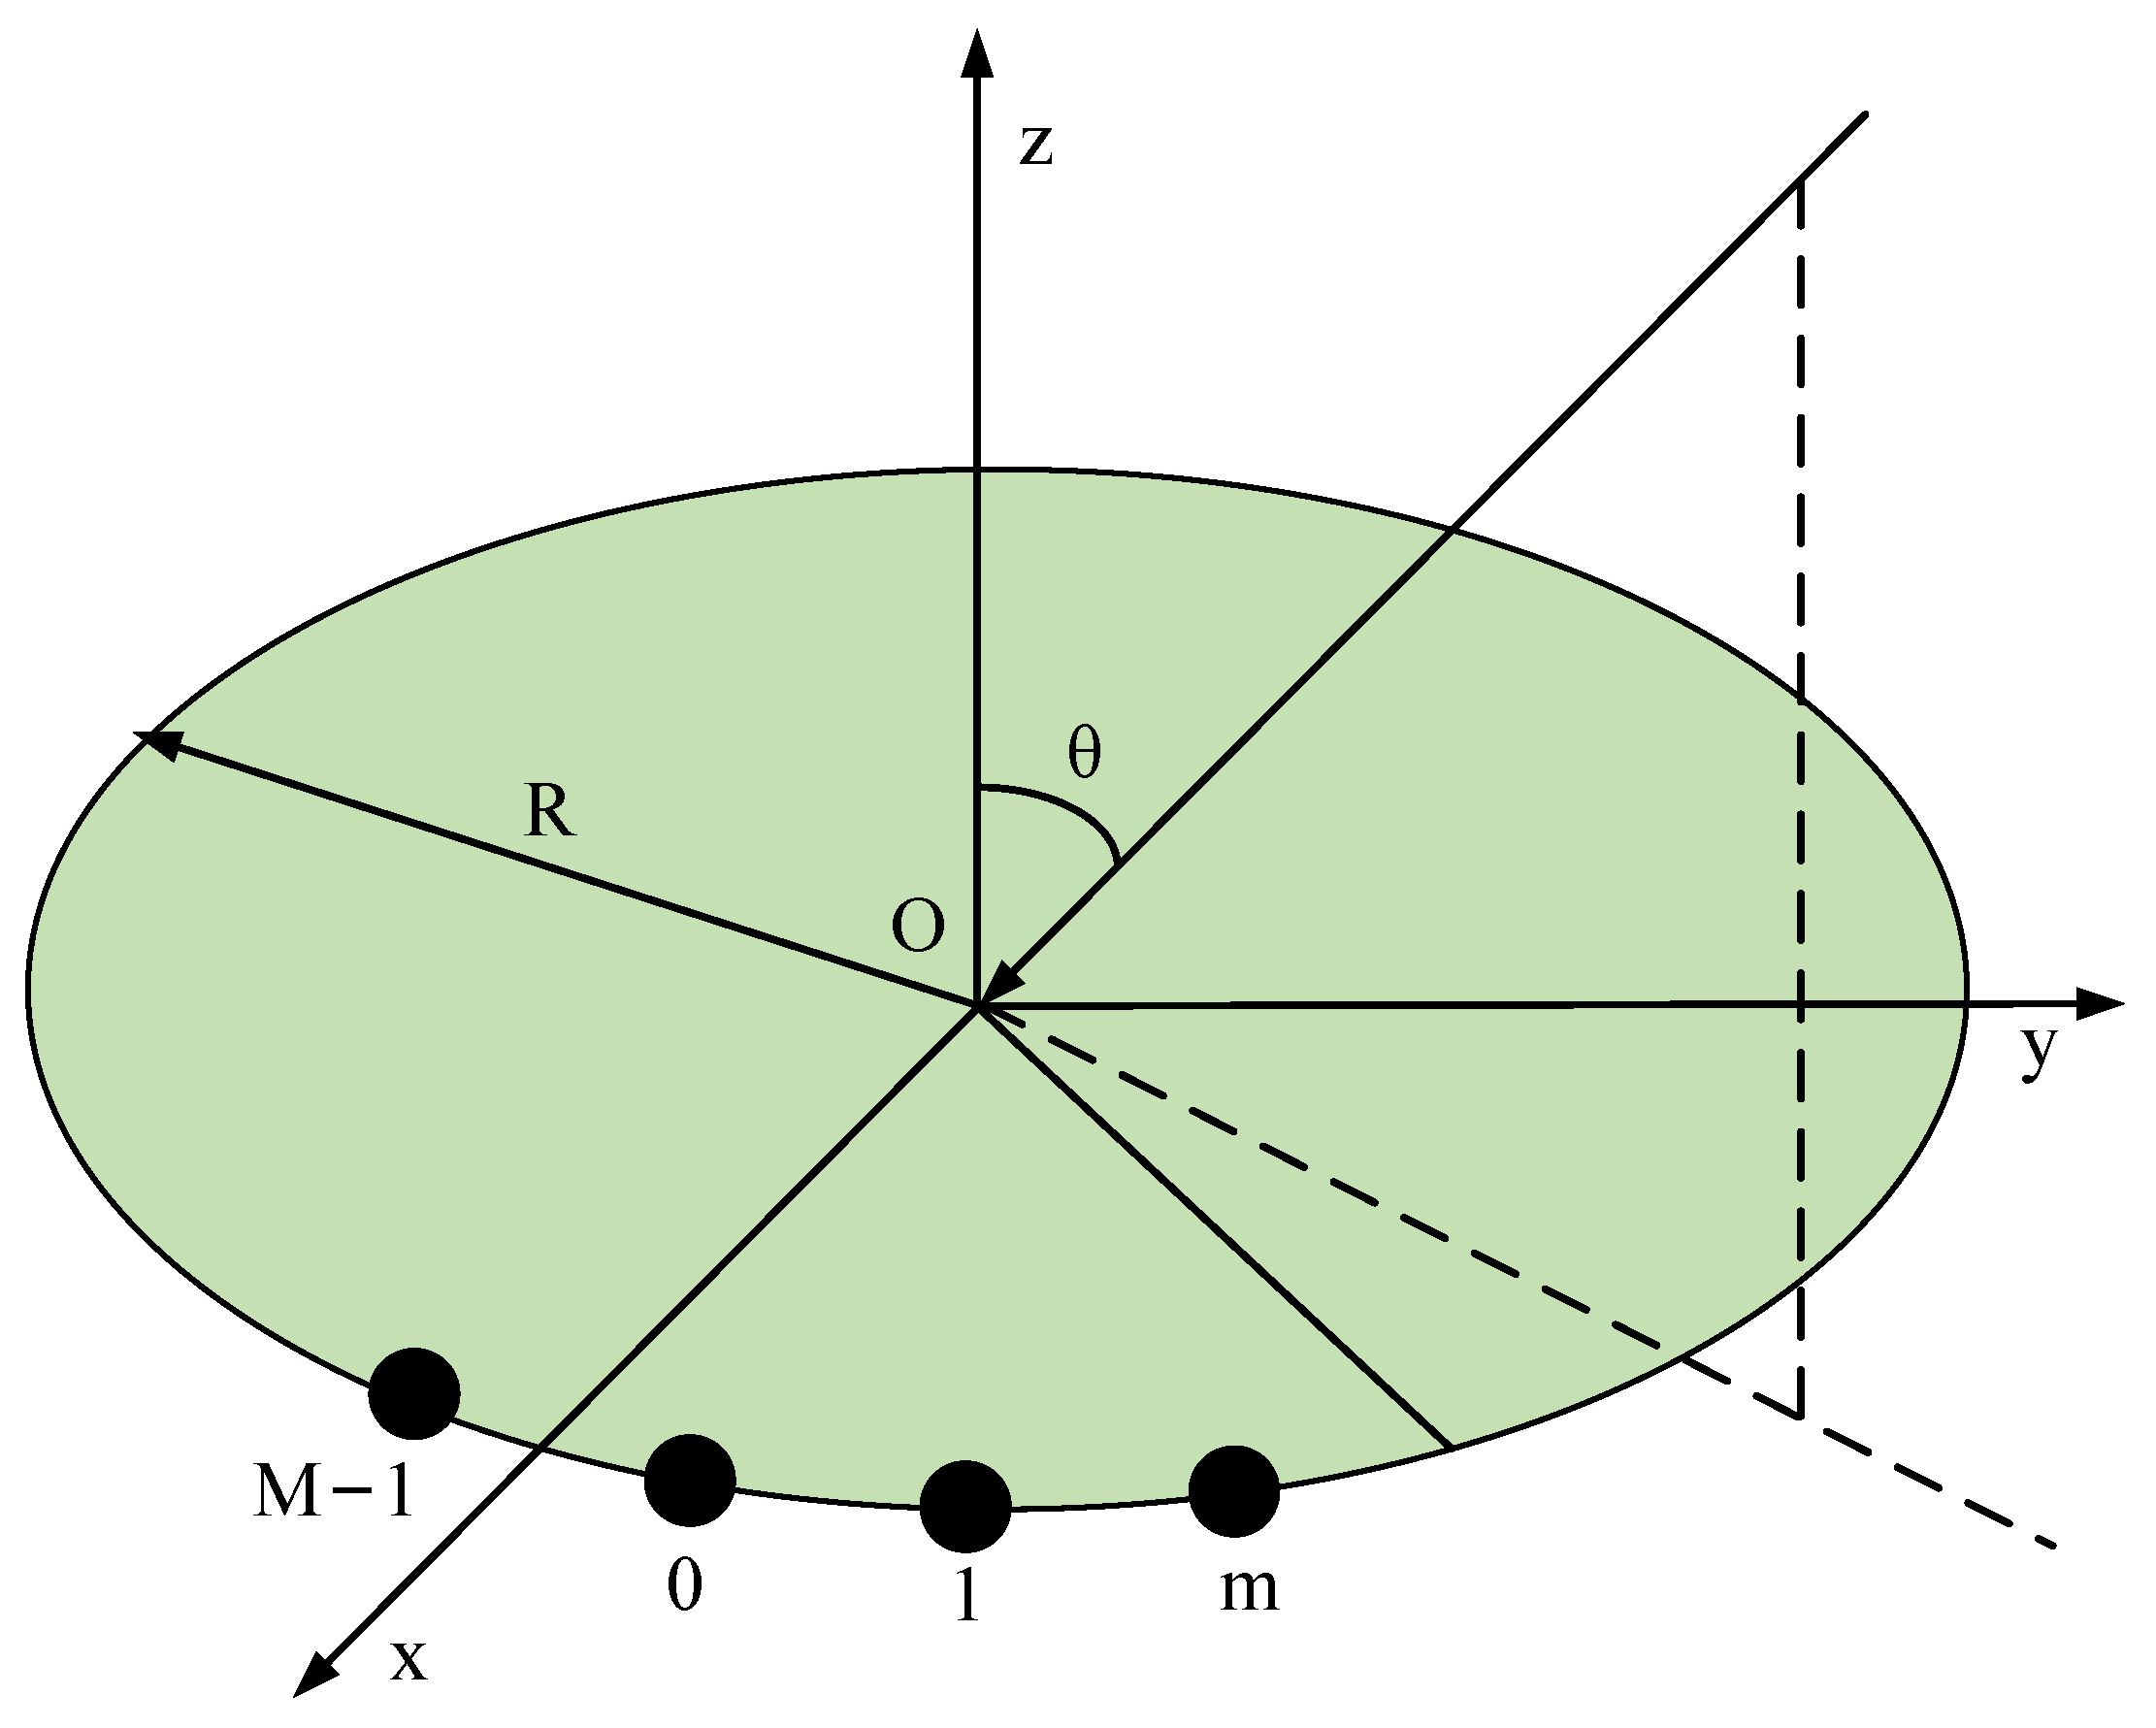
Figure 4 shows a schematic diagram combining the Capon algorithm with the uniform circular array.
In Figure 4, O denotes the center of the great circle, which represents the center point of the uniform circular array. R denotes the radius of the great circle, which represents the coverage of the uniform circular array. m represents the transmission distance of the signal wave. M − 1 represents the signal processing point on the uniform circular array. 0 and 1 denote different lightning pulse information, respectively. The spatial resolution of the array antenna is closely related to the array spacing. In general, the smaller the array spacing, the higher the spatial resolution of the array antenna. Therefore, it can locate the source signal more accurately. However, in the uniform circumferential array configuration, too small a spacing may cause the side lobe gain problem, which affects the judgment of the true signal direction. Therefore, appropriate optimization can improve the accuracy according to different scenarios and provide support for specific lightning monitoring needs. The setting of the array spacing also influences the azimuth and angle resolution of the array. When the distance is large, the resolution of the array to the signal above or below the direct incident is relatively poor. In a specific lightning signal angle range, the ideal array layout can ensure better directional confirmation, effectively improving positioning accuracy. Through the fusion of DOA algorithm and Capon algorithm, the lightning signal output response at this time can be expressed by Equation (8).
x ( t ) = A s ( t ) + n ( t )
In Equation (8), x ( t ) denotes the signal output response and A denotes the response coefficient value. s ( t ) denotes the vector value of the lightning signal source and n ( t ) denotes the vector value of the processed signal source. At this time, the lightning signal array flow matrix can be expressed by Equation (9).
A ( Θ ) = ( a ( Θ 1 ) , a ( Θ 2 ) , , a ( Θ ) N )
In Equation (9), A ( Θ ) denotes the matrix and a denotes the nodes in the matrix. Θ denotes the orientation information. At this point the vector value of the orientation information can be calculated by Equation (10).
a ( Θ ) N = ( e w 0 τ 1 , e w 0 τ 2 , , e w 0 τ N )
In Equation (10), a ( Θ ) N denotes the value of orientation information vector. w 0 denotes the angular frequency of the lightning signal. τ N denotes the pulse vector, which can be calculated by Equation (11).
τ N = r V c cos ( θ 2 π ( m 1 ) M ) cos φ N
In Equation (11), m denotes the azimuth of the signal incident to the matrix. M denotes the omni-directional matrix. φ N denotes the lightning signal pulse coefficient. By analyzing the above research, the study is able to obtain the value of the reliability covariance of the lightning data, which can be expressed in Equation (12).
R = σ o 2 a ( θ 0 ) + σ n 2 I
In Equation (12), R denotes the lightning data covariance reliability value. σ o 2 denotes the power value of the lightning desired signal. a denotes the covariance matrix coefficients. θ 0 denotes the guidance vector value. σ n 2 denotes the noise power value. I denotes the matrix unit. After the covariance analysis of the lightning data are completed, the monitoring station can be used to locate the time difference, thus completing the positioning of lightning warnings. When using the monitoring station for lightning warning positioning, it is necessary to remove the positioning ambiguity caused by redundant data. After removing the redundant data, it is possible to detect and analyze the lightning. In the specific lightning warning detection and positioning, the hybrid algorithm can be used to detect the power to complete the positioning analysis. Specifically, the hybrid algorithm can first use the lightning signal data collected by the sensor network to extract the characteristic information related to the power. Then, through the analysis and processing of this characteristic information, the power magnitude and distribution of the lightning signals can be calculated [16,
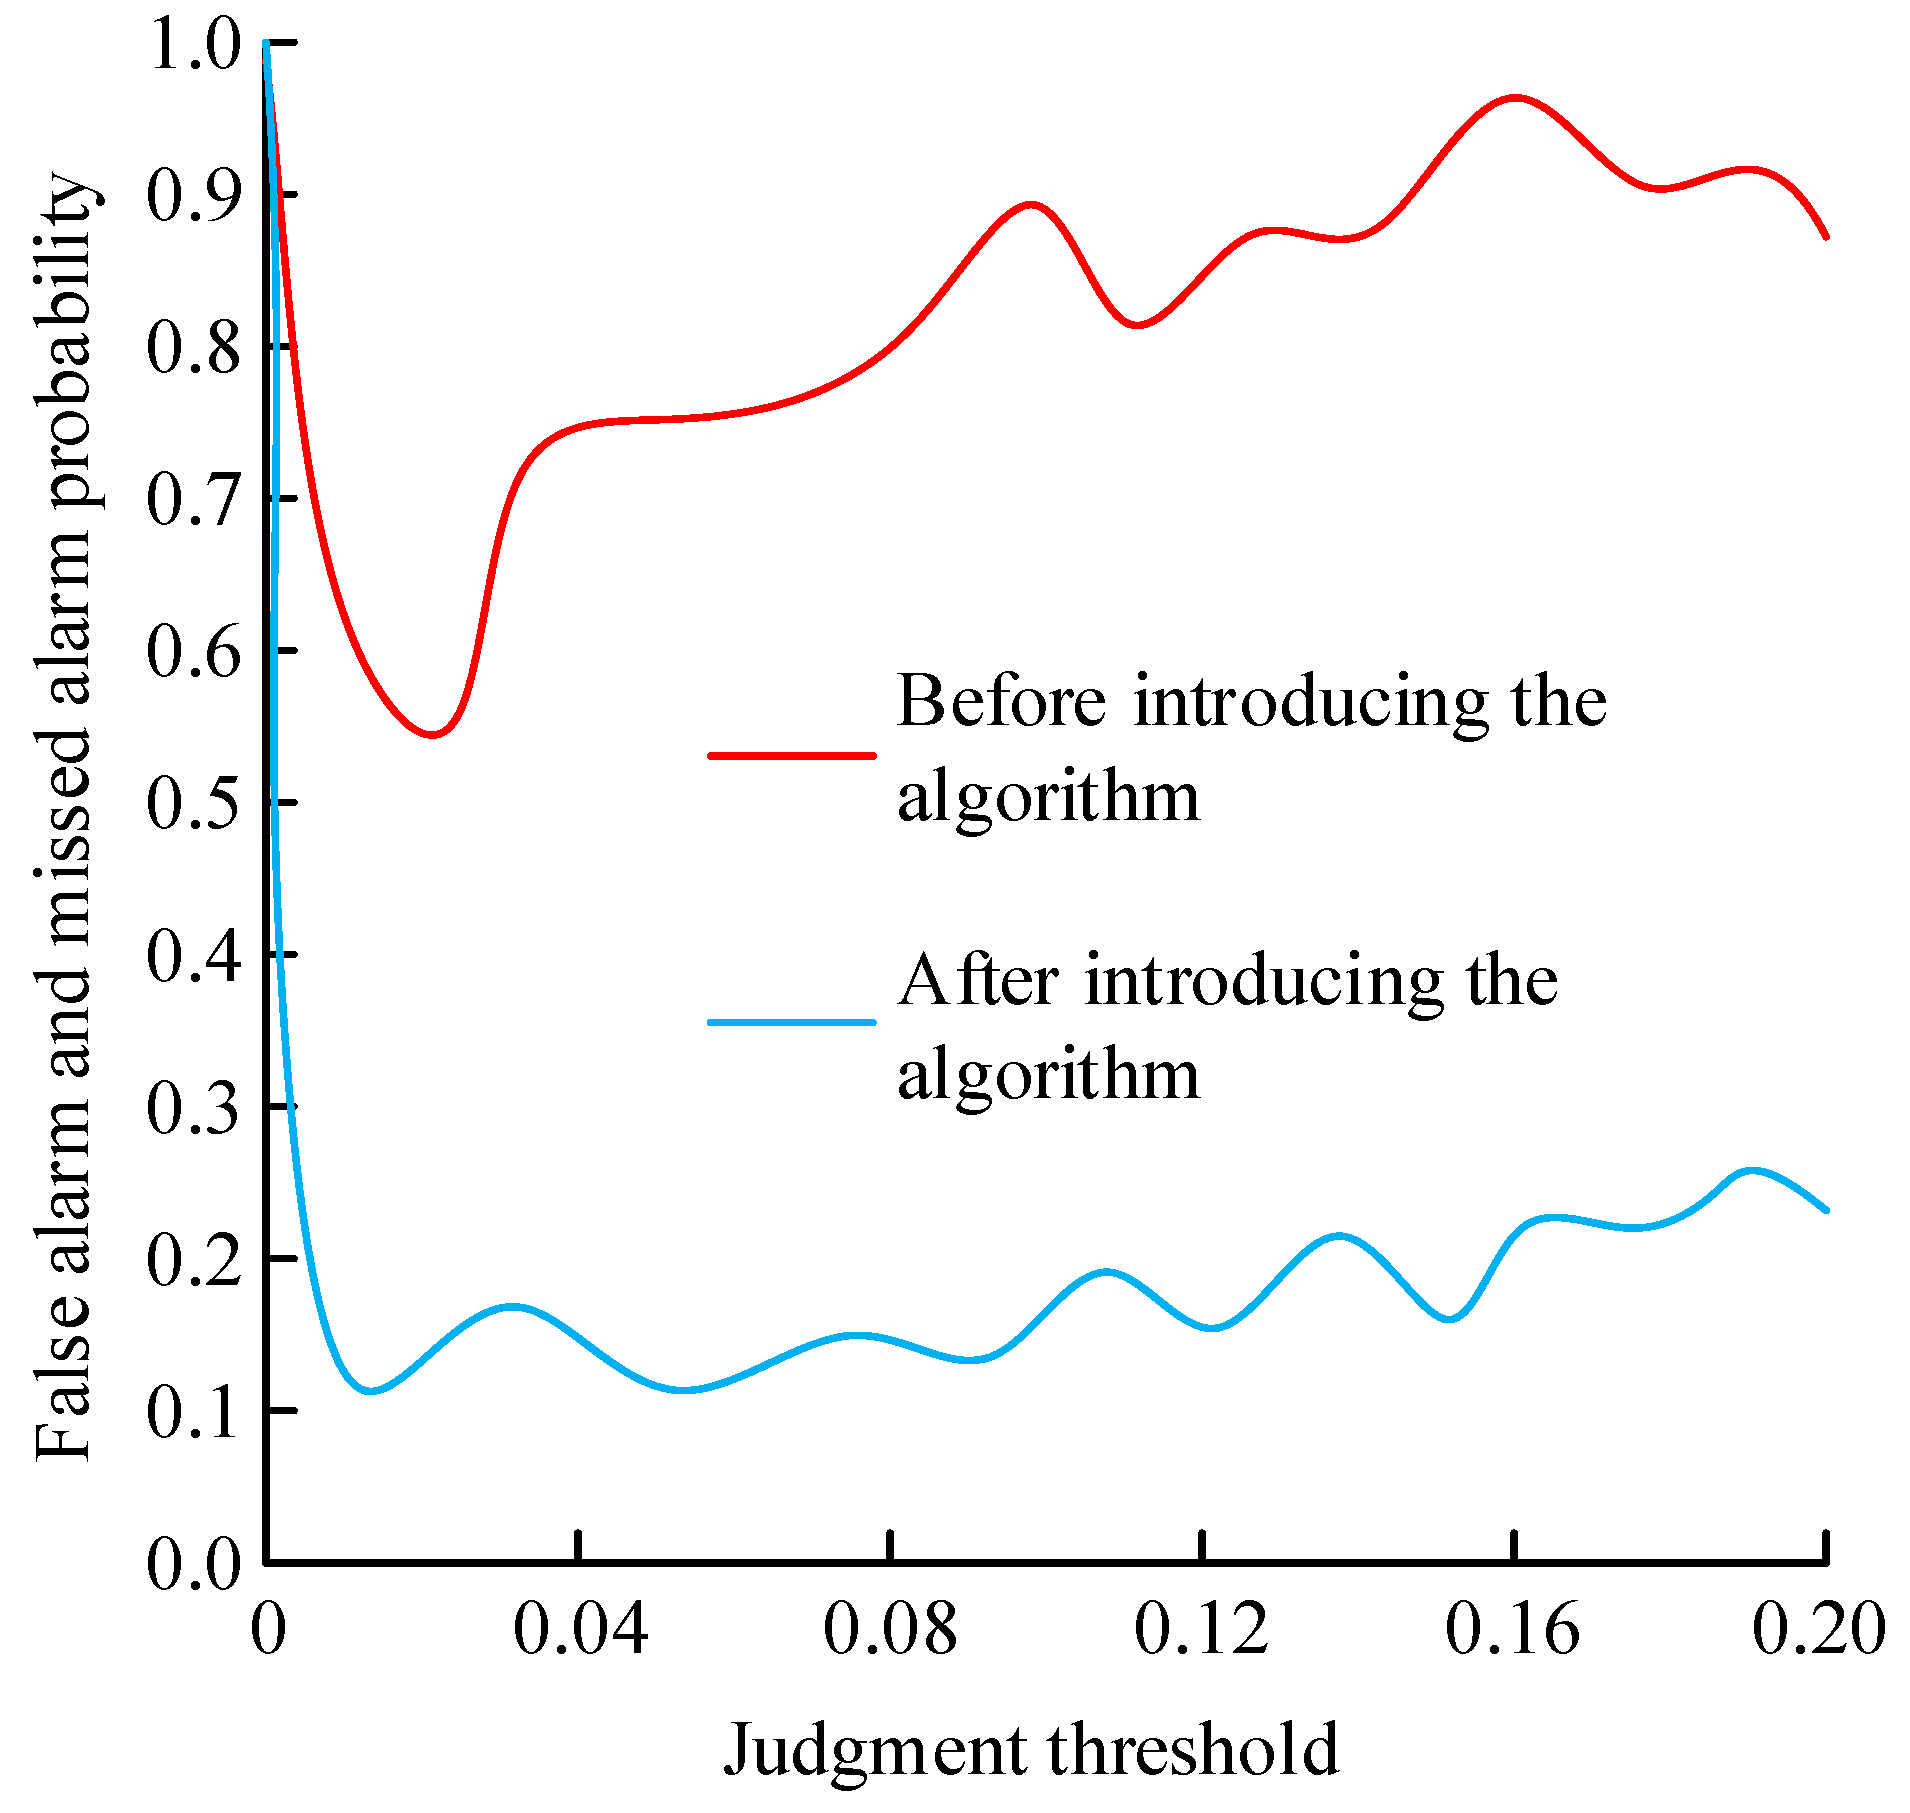
17]. After completing the lightning signal positioning detection, the study analyzes the operational stability of the hybrid algorithm using a digital bandpass filter at 110 MHz. The analyzed results are shown in Figure 5.
In Figure 5, the power of the lightning signal is closely related to the intensity and distance of the lightning. Therefore, the location and intensity information of the lightning can be indirectly inferred by detecting the change in the power.

3. Results

3.1. Performance Analysis of Lightning Warning Signal Positioning Data Processing

To verify the performance of the lightning warning signal positioning algorithm constructed by combining the DOA algorithm and Capon’s algorithm, the study compares the lightning locator with the Doppler radar. The comparison method is used to analyze and process the lightning position data. In addition, the study uses the Vaisala Global Lightning Dataset360 (GLD360) as a data source for simulation experiments. In this study, 5000 samples are selected from GLD360 data set as the training set, and 500 samples are selected as the test set. The specific configuration and parameters of the uniform circular array are as follows: the array radius is 1.5 m, the number of sensor elements is 8, the sensor spacing is 1.18 m, the main lobe width is 30°, the signal sampling frequency is 100 MHz, the signal bandwidth is 20 MHz, and the sampling number is 512. Figure 6 shows the result of precision comparison of three lightning warning signal positioning data processing.
In Figure 6a, the root mean square error (RMSE) value of lightning warning signal positioning data processing for hybrid algorithm is 6.72%. The RMSE value of positioning data processing for Doppler radar and light locator is 9.84% and 13.69%, respectively. In Figure 6b, the angular error is one of the main influences on the positioning precision. The angular errors of hybrid algorithm, Doppler radar, and lightning locator positioning are 5.93%, 9.95%, and 11.82%, respectively. This shows the efficiency and precision of the hybrid algorithm in the processing of lightning warning signal positioning data. At the same time, the hybrid algorithm becomes the preferred method in lightning warning and positioning data processing due to its low error rate. The performance difference in the Doppler radar may be due to the extremely short and transient nature of lightning events, which may result in the inability of Doppler radar to capture complete information in time. The intensity of the electromagnetic radiation signal generated by lightning may be quite different from that received by the Doppler radar. Since lightning releases a lot of energy instantaneously, the detection principle of the Doppler radar is related to the specific frequency band or intensity of the echo signal, which in some cases may result in the inability to fully detect the lightning signal and affect performance.
Figure 7 shows the comparison results of the resolution and anti-interference ability of the three methods in lightning location data. The detection efficiency is calculated by comparing the total number of lightning events detected by the algorithm and the actual occurrence of lightning events. Real-time performance is evaluated by measuring the average time it takes the algorithm to process each lightning event. The anti-interference capability is evaluated by analyzing the ability of the algorithm to correctly identify lightning events in the presence of background noise or other signal interferences, and the false positive rate and false negative rate can be calculated using the confusion matrix. In Figure 7a, in the comparison of detection efficiency and real-time performance, the detection efficiency and real-time performance of hybrid algorithm are 96.36% and 95.16%, respectively. While the detection efficiency of the Doppler radar and the lightning locator positioning are 90.05% and 89.51%, and the real-time performance are 92.03% and 90.66%. In Figure 7b, the comparison results of the hybrid algorithm, Doppler radar, and lightning locator positioning in terms of hardware and software anti-interference ability are 93.68%, 92.73%, 91.68% and 94.02%, 93.05%, and 91.84%, respectively. This indicates that the hybrid algorithm is better than the Doppler radar and lightning locator in terms of detection efficiency, real-time, and anti-interference ability of lightning positioning data. Furthermore, it can provide more accurate and reliable data support for lightning warning and positioning.
The comparison results of convergence and loss value of the three methods in data processing are shown in Figure 8. The evaluation of convergence is usually performed by observing the changing trend of the loss function during training. As the number of iterations increases, the loss value should continue to decrease, indicating that the model is gradually learning and improving. The loss value calculation is a measure of the difference between the predicted output of the model and the actual label. The study evaluates the time spent in lightning early warning positioning by the Doppler radar and lightning locator. The Doppler radar determines the speed of the target by transmitting electromagnetic waves and analyzing the frequency change in the reflected waves. The operating frequency of The Doppler radar is S-band, and the detection range is 500 km. The lightning locator locates lightning events by detecting electromagnetic radiation or sound waves during the lightning discharge. The frequency band is VLF band, and the detection range is 200 km. In Figure 8a, the convergence of the three methods in data processing decreases significantly as the number of iterations increases. The convergence value of the hybrid algorithm is finally in the range [0.01, 0.03]. The convergence value of the Doppler radar is finally in the range [0.25, 0.38]. The convergence value of the lightning locator is finally in the range [0.40, 0.53]. In Figure 8b, there are certain differences in the loss values of the three methods in the study of data processing loss values. The loss values of the hybrid algorithm, the Doppler radar, and the lightning locator during data processing are 0.09, 0.12, and 0.13, respectively. The change in loss values is 0.05, 0.04, and 0.04, respectively. This indicates that the hybrid algorithm has higher precision and efficiency in data processing and is the best performing choice among these three methods.
Figure 9 shows the comparison results of the time consuming and positioning errors of the three methods in lightning warning data processing. A total of 5000 samples are used for training. In Figure 9a, the average value of time-consuming lightning warning positioning of the hybrid algorithm is 2.39 s. The average values of time-consuming lightning warning positioning of the Doppler radar and lightning locator are 3.59 s and 4.12 s, respectively. In Figure 9b, in the lightning warning positioning error comparison, the positioning errors of the hybrid algorithm, the Doppler radar and lightning locator are 2.69%, 3.28%, and 3.95%, respectively. This shows that the hybrid algorithm has obvious advantages in lightning warning data processing. It is not only faster in processing speed but it is also more accurate in positioning precision.

3.2. Performance Analysis of Lightning Warning System Positioning Simulation Experiment

To further validate the performance of hybrid algorithm in lightning warning system positioning, the study applies the secondary warning and tertiary warning for the validation of positioning performance. Figure 10 shows the comparison results of secondary warning and tertiary warning based on hybrid algorithm.
In Figure 10a, the data points in the plot are shown in blue color and are distributed at different coordinate positions. These points represent the relationship between the locations of different lightning events and the difference in longitude between them. The distribution of the points shows that most of the points are concentrated in the central region, but some points are scattered in more distant locations. This indicates that there is a certain range of precision for predicting or determining the lightning position under the secondary warning strategy. In Figure 10b, the data points are shown in red. From the distribution of the points, the overall distribution of the red points seems to be more concentrated than the blue points, especially in the center area. This indicates that under the three-level warning strategy, the prediction or determination of the lightning position has a higher precision. Moreover, it can more accurately reflect the relationship between the location of the actual lightning event and the difference in longitude.
Figure 11 shows the result of the comparison between the predicted value and true value of the lightning warning system in terms of system stability and synchronization. In Figure 11a, the predicted error value of the lightning warning system positioning is 6.93% and the true value of lightning prediction is 5.01%, which is a 1.92% difference. This indicates that there is a certain gap between the lightning warning system constructed by the research using the hybrid algorithm and the true value. However, the gap is small, which also verifies that the lightning warning system has a high feasibility. In Figure 11b, in the comparison of synchronization, the overall running time of the lightning warning system positioning is 39.2 s, and the true prediction time of the lightning prediction is 35.9 s, which is a difference of 3.3 s. This shows that the lightning warning system has high feasibility and effectiveness. Although there are some gaps between it and the true value, these errors and gaps are relatively small and do not significantly affect the performance of the lightning warning system. To further verify the performance of the lightning warning positioning system, the study compares the positioning success rate predicted value with the true value. Table 1 shows the results of the comparison between the predicted value and the true value of the positioning success rate.
In Table 1, in all 10 samples, the predicted value is slightly lower than the true value, and there are no cases where the predicted value is higher than the true value. The validation results on the performance of the lightning warning and positioning system show that the difference between the predicted value and the true value of the system’s positioning success rate is generally small, showing a high prediction precision. In most cases, the system tends to estimate the positioning success rate conservatively, which contributes to the reliability of the warning. Although in some cases the difference between the predicted value and the true value is slightly larger, the overall prediction performance of the system remains stable and robust. This result validates the feasibility and effectiveness of the lightning warning positioning system.
To further substantiate the sophistication of the proposed method, the real-world data set, comprising the VLF/LF 3D lightning detection network data set, which encompasses 371 detection stations, is employed to ascertain the lightning activity parameters, including the time, type, latitude and longitude, height, and peak current intensity of lightning in real time. The objective is to monitor the location of lightning, the cumulative density distribution, and the moving trend in order to achieve the monitoring and early warning of severe convective thunderstorm weather. Time compensation algorithm-based wide area lightning detection technology (TCA-WALDT) and time difference and clustering algorithm-based lightning localization method (TDCA-LLM) are used. The results of the baseline comparison are shown in Table 2.
The results in Table 2 show that the RMSE of the proposed hybrid algorithm is 6.72%, which is significantly lower than the 9.45% of TCA-WALDT and 11.12% of TDCA-LLM. This shows that the hybrid algorithm has higher accuracy in locating lightning signals and can capture the real location of lightning events more effectively. The detection efficiency of the hybrid algorithm is as high as 96.36%, and the detection efficiency of the hybrid algorithm is as high as 96.36%. The performance of the anti-interference ability is 94.02 dB, which is better than TCA-WALDT and TDCA-LLM. The results show that the research method provides a novel technical basis for emergency response, disaster prevention and mitigation, and enhances the capability of decision support under thunderstorm conditions. By optimizing the signal processing process and enhancing the anti-interference capability, the hybrid algorithm may facilitate the advancement of lightning detection and early warning technology and has significant technical implications for the improvement of scientific and effective meteorological disaster early warning.

4. Discussion

In lightning detection and warning system research, the precision of signal positioning was critical to the timeliness and precision of the warning. With the DOA algorithm, the system could quickly determine the source direction of lightning signals, while the Capon algorithm was able to further refine this direction and provide more accurate positioning information. The results indicated that in the prediction error analysis of lightning warning system positioning, the prediction error value of the research method was 6.93%, and the true value of lightning prediction was 5.01%, with a difference of 1.92% between the two. This indicated that hybrid algorithm had high reliability in the prediction of lightning warning system positioning data. It had a similar effect with Liu et al. who utilized a low frequency lightning positioning system to improve the precision and continuity of 3D lightning source positioning [18]. Meanwhile, the overall running time in the positioning process of the lightning warning system was 39.2 s, and the true prediction time of lightning prediction was 35.9 s, with a difference of 3.3 s. In the comparison of the success rate prediction with the true scenario, the maximum difference between the predicted value and the true value was 1.06%, and the lowest difference was 0.1%. To analyze the reliability of the thunder and lightning warning in Nanchang County, Zhong and Lei carried out the warning analysis by using the atmospheric electric field meter. After threshold adjustment, their warning precision was significantly improved. The electric field intensity on sunny days was characterized by seasonal and daily changes, and the field intensity was lowest in June. The application of the atmospheric electric field meter provided an effective means for lightning warning in Nanchang County [19]. Wang et al. derived an analytical expression for the electric field of a space charged thundercloud using a thundercloud cylindrical charge stack model and simplified the calculation by approximation. The study revealed that the approximate solution is similar to the exact solution, which could be used for the short-range electric field approximation calculation and significantly improve the computational efficiency. The study also analyzed the electric field characteristics of typical structural charge stack excitation, which is of great significance for the lightning protection of moving targets [20]. By comparing and analyzing the effects achieved by the above scholars in lightning warning with the research, it was found that their results were similar, which indicated that the hybrid algorithm successfully improved the performance of lightning detection and warning system signal positioning. In the research, the integration of the DOA algorithm and Capon algorithm significantly improved the performance of the lightning detection and early warning system, which was reflected in many aspects. First, the DOA algorithm furnished a high-precision signal source direction estimation, which served as a foundation for the subsequent processing of the Capon algorithm. This enabled the formation of a narrower beam in an accurate direction and the achievement of efficient signal enhancement. Second, the Capon algorithm had excellent feature extraction ability. By optimizing the array weight vector, it could effectively suppress interference signals, thus improving the anti-interference ability and positioning accuracy of the system in complex environments. Finally, this fusion not only reduced the RMSE and angle error of the lightning location, but also greatly improved the detection efficiency and real-time response ability, ensuring the reliability and accuracy of the system in lightning early warning. Therefore, the integration of DOA and Capon algorithms provided complementary benefits and unique performance improvements for lightning detection and early warning systems.

5. Conclusions

The objective of this study was to enhance the signal positioning capabilities of a lightning detection and early warning system. To this end, the high-precision direction estimation capabilities of a DOA algorithm were integrated with the efficient feature extraction and recognition functionality of a Capon algorithm. This integration aimed to improve the signal positioning capabilities of a lightning detection and early warning system. The fusion of DOA algorithm and Capon algorithm effectively improved the precision of signal positioning. The DOA algorithm was able to accurately estimate the signal arrival angle, while the Capon algorithm improved the signal resolution through spatial spectrum estimation. The combination of the two enabled the system to maintain high positioning performance in the face of complex environments. The system exhibited high precision and efficiency, and its performance in practical applications was also excellent. The main findings of the study were that the hybrid algorithm showed some improvement in lightning location performance compared to the Doppler radar and lightning locator alone, especially under low SNR conditions. The hybrid algorithm optimized the signal processing flow and enabled the system to produce results in a very short time when performing environmental adaptability analysis. The real-time warning capability was significantly improved. In the event of an emergency response, the system supported decisions faster and ensured timely action. Despite the impressive outcomes of the research, there are still some limitations to be considered. For instance, in the event of extreme weather conditions, the system may be susceptible to signal attenuation and interference, which could result in a decline in positioning precision. Further research is needed to further optimize the algorithm, improve the system’s anti-interference capabilities, and explore additional application scenarios to better serve lightning disaster prevention and early warning work.

Author Contributions

Conceptualization, Y.H.; Methodology, Y.H. and B.H.; Formal analysis, B.H.; Investigation, B.H.; Resources, Y.H.; Data curation, B.H.; Writing—original draft, Y.H.; Writing—review & editing, H.S.; Supervision, H.S.; Project administration, H.S.; Funding acquisition, H.S. All authors have read and agreed to the published version of the manuscript.

Funding

This study was funded by National Fund (Research on mechanism and data-driven lightning risk warning for mid and high voltage overhead power lines (52207109)) and Major Science and Technology Project of Yunnan Province (Research and application of key technologies for large-scale energy storage to support the high proportion of new energy connected to the power grid in Yunnan (202402AG050006)).

Data Availability Statement

The original contributions presented in the study are included in the article, further inquiries can be directed to the corresponding author.

Conflicts of Interest

The authors declare no conflict of interest.

References

  1. Kadlec, P.; Marek, M.; Štumpf, M. Lightning stroke localization—A time-domain approach based on evolutionary optimization. IEEE Trans. Electromagn. Compat. 2020, 62, 2111–2118. [Google Scholar] [CrossRef]
  2. Fan, R.; Zhang, C.; Xiao, W.; Zhi, Y. Design and implementation of lightning analysis software based on lightning location system data. Meteorol. Environ. Res. 2020, 11, 21–23. [Google Scholar]
  3. Choudhuri, S.; Adeniye, S.; Sen, A. Distribution alignment using complement entropy objective and adaptive consensus-based label refinement for partial domain adaptation. Artif. Intell. Appl. 2023, 1, 43–51. [Google Scholar] [CrossRef]
  4. Karami, H.; Mostajabi, A.; Azadifar, M.; Rubinstein, M.; Rachidi, F. Machine learning-based lightning localization algorithm using lightning-induced voltages on transmission lines. IEEE Trans. Electromagn. Compat. 2020, 62, 2512–2519. [Google Scholar] [CrossRef]
  5. Wang, T.; Shi, L.H.; Qiu, S.; Sun, Z.; Zhang, Q.; Li, Y. Time delay correction for the MARCOS lightning VHF mapping array system. IEEE Trans. Electromagn. Compat. 2021, 63, 1981–1988. [Google Scholar] [CrossRef]
  6. Mahomed, M.; Clulow, A.D.; Strydom, S. Assessment of a ground-based lightning detection and near-real-time warning system in the rural community of Swayimane, KwaZulu-Natal, South Africa. Weather. Clim. Soc. 2021, 13, 605–621. [Google Scholar] [CrossRef]
  7. Abdelbari, A.; Bilgehan, B. A probabilistic-based approach for direction-of-arrival estimation and localization of multiple sources. Int. J. Commun. Syst. 2020, 33, e4425. [Google Scholar] [CrossRef]
  8. Liouane, H.; Messous, S.; Cheikhrouhou, O.; Hamam, H. Regularized least square multi-hops localization algorithm for wireless sensor networks. IEEE Access 2021, 9, 136406–136418. [Google Scholar] [CrossRef]
  9. Khan, N.A.; Ali, S.; Choi, K. An efficient direction of arrival estimation algorithm for sources with intersecting signature in the time—Frequency domain. Appl. Sci. 2021, 11, 1849. [Google Scholar] [CrossRef]
  10. Chuang, C.W.; Chen, A.B.-C. Global distribution and spectral features of intense lightning by the ISUAL experiment. J. Geophys. Res. Atmos. 2022, 127, e2022JD036473. [Google Scholar] [CrossRef]
  11. Jamroen, P.; Yoosorn, P.; Waengsothorn, S.; Yutthagowith, P. Modified gauss–Newton algorithm for evaluation of full lightning impulse voltage parameters. Sens. Mater. 2021, 33, 2471–2480. [Google Scholar] [CrossRef]
  12. Shi, T.; Hu, D.; Ren, X.; Huang, Z.; Zhang, Y.; Yang, J. Investigation on the lightning location and warning system using artificial intelligence. J. Sens. 2021, 2021, 6108223. [Google Scholar] [CrossRef]
  13. Lee, E.K.; Lee, J.H. Performance analysis of conventional beamforming algorithm for angle-of-arrival estimation under measurement uncertainty. Int. J. Antennas Propag. 2020, 2020, 7515139. [Google Scholar] [CrossRef]
  14. Murphy, K.M.; Bruning, E.C.; Schultz, C.J. A spatiotemporal lightning risk assessment using lightning mapping data. Weather Clim. Soc. 2021, 13, 571–589. [Google Scholar] [CrossRef]
  15. Liu, Q.; Wang, X.; Wan, L.; Huang, M.; Sun, L. An accurate sparse recovery algorithm for range-angle localization of targets via double-pulse FDA-MIMO radar. Wirel. Commun. Mob. Comput. 2020, 2020, 6698446. [Google Scholar] [CrossRef]
  16. Belikova, M.Y.; Baranovskiy, N.V.; Karanin, A.V. Assessment of the uncertainty for the spatial distribution of lightning discharge density based on the smoothed bootstrap procedure and WWLLN data: A case study. Int. J. Eng. Appl. 2022, 10, 138–148. [Google Scholar] [CrossRef]
  17. Farnell, C.; Rigo, T. The lightning jump algorithm for nowcasting convective rainfall in Catalonia. Atmosphere 2020, 11, 397. [Google Scholar] [CrossRef]
  18. Liu, B.; Shi, L.H.; Qiu, S.; Liu, H.Y.; Sun, Z.; Guo, Y.F. Three-dimensional lightning positioning in low-frequency band using time reversal in frequency domain. IEEE Trans. Electromagn. Compat. 2019, 62, 774–784. [Google Scholar] [CrossRef]
  19. Zhong, L.; Lei, H.U. Analysis of characteristics of lightning and atmospheric electric field in Nanchang County. Meteorol. Environ. Res. 2020, 11, 5–10. [Google Scholar]
  20. Wang, L.; Wan, H.; Chen, Y. Approximate calculation and feature analysis of electric field in space by thunderclouds. Int. J. Antennas Propag. 2021, 2021, 1827619. [Google Scholar] [CrossRef]
Figure 1. Schematic diagram of the lightning data signal acquisition process.
Processes 13 00398 g001
Figure 2. Simulation effect of variable frequency processing of lightning signal data based on covariance matrix.
Processes 13 00398 g002
Figure 3. Curve plot of lightning pulse time obtained by the monitoring station.
Processes 13 00398 g003
Figure 4. Schematic diagram of combining Capon algorithm with uniform circular array.
Processes 13 00398 g004
Figure 5. Analysis of the operational stability of the hybrid algorithm.
Processes 13 00398 g005
Figure 6. Comparison of precision results of three lightning warning signal positioning data processing methods.
Processes 13 00398 g006
Figure 7. Comparison results of resolution and anti-interference ability of three methods in lightning positioning data.
Processes 13 00398 g007
Figure 8. Comparison of convergence and loss values of three methods in data processing.
Processes 13 00398 g008
Figure 9. Comparison of time consumption and positioning error of three methods in lightning warning data processing.
Processes 13 00398 g009
Figure 10. Search results for second and third level warning strategies.
Processes 13 00398 g010
Figure 11. Comparison between predicted and true values of lightning warning system.
Processes 13 00398 g011
Table 1. Comparison results between predicted and real positioning success rates.
NumberTime of Lightning OccurrencePrediction and Positioning Success Rate (%)Real Positioning Success Rate (%)Difference (%)
11 May 2023 12:0089.9590.050.10
21 May 2023 13:3088.7989.130.34
31 May 2023 15:1594.0294.290.27
42 May 2023 9:4585.7986.180.39
52 May 2023 11:2092.3693.010.65
62 May 2023 14:3089.9690.660.70
73 May 2023 10:0092.0792.680.61
83 May 2023 12:4586.2587.130.88
93 May 2023 16:1591.0592.111.06
104 May 2023 11:3088.6988.930.24
Table 2. Comparison results of model advancement.
Algorithm TypeRMSE (%)Angle Error (°)Detection Efficiency (%)Real-Time Performance (s)Anti-Interference Capability (dB)
Research method6.725.9396.362.3994.02
TCA-WALDT9.458.3989.103.0588.00
TDCA-LLM11.1210.2784.754.2285.50
Disclaimer/Publisher’s Note: The statements, opinions and data contained in all publications are solely those of the individual author(s) and contributor(s) and not of MDPI and/or the editor(s). MDPI and/or the editor(s) disclaim responsibility for any injury to people or property resulting from any ideas, methods, instructions or products referred to in the content.

