Article

Synergistic Effect of Ultrasound and Osmotic Pretreatment on the Drying Kinetics and Antioxidant Properties of Satkara (Citrus macroptera): A Novel Preservation Strategy

1
Department of Food Engineering and Tea Technology, Shahjalal University of Science and Technology, Sylhet 3114, Bangladesh
2
Department of Agro Product Processing Technology, Jashore University of Science and Technology, Jashore 7408, Bangladesh
3
Department of Nutrition and Food Engineering, Daffodil International University, Dhaka 1216, Bangladesh
4
CBQF—Centro de Biotecnologia e Química Fina—Laboratório Associado, Escola Superior de Biotecnologia, Universidade Católica Portuguesa, Rua Diogo Botelho, 1327, 4169-005 Porto, Portugal
*
Authors to whom correspondence should be addressed.
Processes 2025, 13(2), 384; https://doi.org/10.3390/pr13020384
Submission received: 31 December 2024 / Revised: 29 January 2025 / Accepted: 30 January 2025 / Published: 31 January 2025
(This article belongs to the Special Issue Advanced Drying Technologies in Food Processing)

Abstract

:
This study aimed to investigate the effects of combined ultrasound and osmotic pretreatment conditions on the drying kinetics and antioxidant properties, such as total phenolic content (TPC), total flavonoid content (TFC), vitamin C content, and DPPH radical scavenging activity, of dried Citrus macroptera (Satkara) fruits. The fruit slices were immersed in 10% aqueous solutions of sucrose (S), glucose (G), and fructose (F) followed by an ultrasound treatment (40 kHz) for 10, 20, or 30 min. The samples were then dried in a convective oven at 50, 60, or 70 °C and 30% relative humidity with a constant air velocity of 3 m s−1. Four thin-layer kinetic models, namely Page, Newton, Henderson and Pabis, and Logarithmic, were evaluated. Among these, Page was found to be the most suitable model for predicting the drying kinetics. The pretreatment process accelerated the drying process significantly, reducing the drying time up to 6 h. Additionally, the pretreated samples exhibited improved retention of quality attributes, with vitamin C being best preserved in S solutions, TPC in both S and F solutions, TFC in F solutions, and DPPH in all three sugar solutions (S, F, and G). The application of ultrasound during osmotic treatment also had a positive impact on TPC and TFC retention, whereas it presented a negative effect on vitamin C when used for a prolonged duration and a negligible one on the antioxidant capacity. Overall, this study provides a new perspective on the drying kinetics of Satkara fruits, and their respective properties after drying, and being subjected to combined ultrasound and osmotic pretreatment. These findings will contribute to the development of effective and efficient drying methods suitable for industrial applications to produce dried Satkara products with a minimum quality degradation.

Graphical Abstract

1. Introduction

Citrus macroptera (Order: Sapindales, Family: Rutaceae) commonly referred to as Melanesian papeda, Bengali hatkhora, wild orange, Cabuyao, or Satkara is a wide-ranging semi-wild species distributed across South and Southeast Asia and the South Pacific [1]. This fruit is renowned for its ethnomedicinal uses, particularly in treating fever, digestive disorders, diarrhea, abdominal pain, high blood pressure, and as an antiseptic [1,2,3,4]. Click or tap here to enter text. Amani et al. [5] evaluated the use of this fruit, in a recent study, for herbal formulation to be used as a natural remedy. The therapeutic potential of the fruit is attributed to its rich phytochemical composition, including high levels of β-carotene, vitamin C, polyphenols, and flavonoids. These bioactive compounds also contribute to the antioxidative, cytotoxic, antimicrobial, antihypertensive, and antipyretic properties of the fruit [1,4].
In certain regions of Bangladesh, the rind of mature fruits has been utilized in culinary practices, serving as an ingredient in curries, pickle preparations, or consumed as a vegetable [1]. From an industrial perspective, this fruit’s cooking stability [6] and its juice’s physicochemical properties [7] have been analyzed previously. However, the high moisture content of C. macroptera (approximately 75% w/w) renders it susceptible to spoilage within a few days under ambient conditions (20–25 °C) [8]. While refrigeration can extend the fruit’s shelf life a bit, limited refrigerator access within Bangladesh necessitates alternative preservation methods. To overcome these challenges and ensure year-round availability, drying has emerged as a viable strategy to prolong the shelf life of fruits.
However, drying often results in extended processing times and, in many cases, the rates are substantially low, which can impact the nutritional and sensory qualities of the product negatively [9]. Adverse effects include alterations in color, taste, and texture, as well as shrinkage, hardening, and loss of essential nutrients. To mitigate these adverse effects, the process of drying is often combined with several pretreatment methods including osmotic dehydration [8,10] and sonication [11].
Osmotic pretreatment is commonly employed to preserve the flavor, aroma, and structural integrity of dried products. This process involves the partial removal of water from a product by immersing it in a concentrated solution, using the osmotic pressure difference between the two as a driving force [12]. However, when used for fruit products, the efficiency of this pretreatment decreases significantly due to the fruit epidermis’s low permeability, which substantially inhibits mass transfer during the pretreatment process [13]. In this context, the application of ultrasound can be a promising solution. This method uses sonic waves, which effectively reduce the drying time by improving the mass transfer rate [14]. Ultrasound treatment generates cavitation bubbles in the fruit’s liquid medium, which collapse and create microjets. This enhances cell membrane permeability, improving protective solute infusion during osmotic pretreatment and reducing the time needed for the water removal [11,14]. Ultrasound also disrupts cellular structures in a controlled manner, which can protect antioxidants by reducing oxidative reactions during drying [11,12].
Thus, a combined application of ultrasound and osmotic pretreatments (US-OP) during the drying of fruit products holds significant promise. This novel pretreatment process mainly focuses on utilizing the combined effects of sonication and osmotic pressure gradient to facilitate the removal of moisture in a much shorter period by creating microscopic channels within the cellular structure [15]. Research on a variety of fruits and vegetables, including papaya [16], pumpkin [17], strawberries [18], Garcinia pendunculata [11], and bitter gourd [19] has demonstrated the effectiveness of US-OP in improving drying efficiency and further improving the quality of the final product. Still, the application of US-OP during the drying of Satkara fruits remains a gap in the research.
Effective drying requires the assessment of drying kinetics and the development of a model based on a representative sample set. Conducting full-scale experiments to determine optimal drying conditions can be both time-intensive and costly. Consequently, drying kinetics is employed to characterize the moisture removal process. An accurate drying model thus necessitates establishing the relationship with process variables and understanding the drying rate comprehensively [8,11,12]. Thus, the objective of this study was to comprehensively evaluate the influence of US-OP on the air-drying kinetics, and physicochemical attributes of Satkara fruits. This study is an extension of our previous research [8], which evaluated the impact of osmotic pretreatment on Satkara fruit drying kinetics and quality. Despite promising results from osmotic pretreatment, the pursuit of superior product quality has motivated this investigation into the application of emerging technologies. More specifically, the objective of this work was to study the effects of the osmotic dehydration in three different 10% hypertonic solutions (sucrose, fructose, and glucose) at a fruit-to-solution ratio of 1:4 (w/w), followed by ultrasound treatment at 30 °C for different periods of 10, 20, and 30 min on the convective drying kinetics (50, 60, and 70 °C) and quality parameters (vitamin C, TPC, TFC, DPPH) of Satkara fruit slices. In addition, four commonly employed mathematical models were used to determine the optimal pretreatment and drying conditions for preserving the nutritional value of the dried product.

2. Materials and Methods

2.1. Materials

Fresh, mature Satkara (C. macroptera) fruits (6–7 cm in diameter), exhibiting no external damage or imperfections, were procured one day after harvest from a local supplier at Modina Market, Sylhet, Bangladesh. The fruits were stored at 8 °C until use in the experiments. Fructose, sucrose, glucose, and additional chemicals, including ethanol, Folin–Ciocalteu reagent, sodium carbonate (Na2CO3), aluminum trichloride (AlCl3), gallic acid, quercetin, potassium acetate, DPPH (2,2-diphenyl-1-picrylhydrazyl), sodium oxalate, and L-ascorbic acid, essential for quality assessment, were acquired from Sigma-Aldrich (St. Louis, MO, USA) and Merck (Darmstadt, Germany).

2.2. Sample Preparation

The fruits were meticulously cleaned with distilled water to eliminate contaminants after collection. For the experiments, only the peel portion of the fruit was used. After deseeding and removing the core, the peel was sectioned in slices (4 cm × 2 cm × 2 cm) for subsequent pretreatment and drying operations [20,21].

2.3. Ultrasound-Osmotic Pretreatment (US-OP) Process

Four different osmotic solutions, 10% sucrose (S), 10% glucose (G), 10% fructose (F), and distilled water, were used during the pretreatment process. The sugar concentrations were selected based on existing literature and preliminary trials [20,21]. The sliced fruit samples were immersed in the respective solutions at a solid-to-solution ratio of 1:4 (w/w) to prevent excessive moisture loss, and the ultrasound treatment was started immediately [10,11,22,23] in an ultrasonic water bath (GT Sonic, 40 kHz, 150 W, Shenzhen, China), maintained at 30 °C, for 10, 20, or 30 min. A control group, exempted from both osmotic and ultrasonic treatments, was included. The experimental conditions, including the type of osmotic solution and duration of ultrasound treatment, are summarized in Table 1.

2.4. Drying of Satkara

Following pretreatment, the fruit slices were carefully removed from the solutions and gently blotted with tissue paper to eliminate residual liquid. Subsequently, they were arranged in a single layer (2 cm thickness) on multiple trays and subjected to convective drying in a temperature and humidity-controlled chamber (VS-8111H-150, Vision, Daejeon-Si, Republic of Korea). Drying conditions were established at air temperatures of 50, 60, and 70 °C, as determined by reviewing previous studies [8,24] and preliminary experiments, with a constant air velocity of 3 ms−1 and a relative humidity of 30%. Weight loss measurements were recorded at 30 min intervals for the initial 1.5 h and subsequently at hourly intervals until a constant weight was achieved, indicated by a weight variation of less than 0.01 g between consecutive readings (AY220—Electronic analytical balance, Shimadzu Corporation, Kyoto, Japan) [22].

2.5. Drying Kinetics

2.5.1. Determination of Moisture Content

The initial moisture content was determined using the method described by Roy et al. [22]. Briefly, 5 g of samples were taken and dried at 120 °C for 24 h in a drying oven (FD-56, Binder, Tuttlingen, Germany). Equation (1) was used to calculate the moisture content on a dry basis:
MC   ( dry   basis ) = W w W d W d × 100 %
where MC represents the moisture content, Ww indicates the sample weight, and Wd is the dry weight of the sample.
The data obtained for moisture content was then converted to moisture ratio to fit various drying models, following Equation (2),
MR = M t M e M 0 M e
where MR represents the moisture ratio, a dimensionless number; Mt reflects the moisture content of the sample at any time t (g moisture/g dry matter); and M0 and Me regard the initial and equilibrium moisture content of the dried sample (g moisture/g dry matter), respectively.

2.5.2. Mathematical Modeling of Drying Data

A comprehensive evaluation of various mathematical models was conducted to accurately predict the drying kinetics of Satkara fruit, particularly when subjected to combined ultrasound and osmotic pretreatment. Given the absence of prior research on the drying behavior of Satkara fruit slices under US-OP conditions, four commonly employed thin-layer models—Page, Newton, Henderson and Pabis, and logarithmic models—were selected for this study (Table 2). These models, derived from Fick’s second law of diffusion, have been widely used to predict the drying behavior of various agricultural products. The most suitable model for accurately describing the drying kinetics of Satkara fruits under specific conditions was identified through rigorous testing.

2.5.3. Evaluation of Mathematical Models

Models are usually evaluated based on their ability to predict the experimental data accurately. Statistical metrics such as the coefficient of determination (R2) and reduced chi-square (χ2) are used extensively to determine the adequacy of the models. The value of R2 describes the precision of the models, whereas the value of χ2 indicates the model accuracy [29]. In addition to these parameters, the root mean squared error (RMSE) was also calculated for a more comprehensive evaluation. Under the established criteria, a model with the lowest values for RMSE and χ2 (close to zero) and the highest R2 value (close to one) is considered to be the most suitable [22]. The following Equations (3)–(5), were used to determine these parameters:
R 2 = 1 i 1 n ( MR ( exp , i ) MR pred , i ) 2 i 1 n ( MR ( exp , i ) MR - ) 2
χ 2 = i 1 n ( MR ( exp , i ) MR pred , i ) 2 N z
RMSE = i 1 n   ( MR ( exp , i ) MR pred , i ) 2 N
where MR ( exp , i ) ,   MR pred , i are the experimental and predicted moisture ratio (dimensionless), respectively; MR - indicates the mean of all experimental moisture ratio values; N and z are the number of observations and constants.

2.5.4. Determination of the Activation Energy (Ea)

After assessing the best-fit model, the activation energy (Ea) for each pretreatment group was also calculated based on the linearized Arrhenius equation [22],
ln ( k ) = ln ( A ) E a RT
The rate constant (k) was calculated through the model fit for each pretreatment condition at three different temperatures, 50, 60, and 70 °C. By plotting the natural logarithm of these rate constants (ln (k)) against the reciprocal of temperature (1/T, T in K), the activation energy was determined from the slope of this linear relationship, which is given by −Ea/(RT), where R is the ideal gas constant (8.314 J/(mol.k)) and A is the Arrhenius factor.

2.6. Quality Assessment of Satkara

2.6.1. Preparation of Sample Extracts

For extract preparation, samples from each treatment group, including the fresh group, were initially homogenized using an electric blender (HL710, Philips, Amsterdam, The Netherlands). Subsequently, 5 g of homogenized sample was mixed with 40 mL of 60% ethanol and subjected to centrifugation at 3100 rpm for 10 min (416 G Benchtop Centrifuge, Gyrozen, Gimpo, Republic of Korea). After collecting the supernatant, the process was repeated three times to ensure complete extraction. The resulting supernatants were gathered and filtered using the Whatman No. 1 filter paper. The filtrates were then stored at −20 °C for subsequent analysis of total polyphenols, flavonoids, ascorbic acid, and antioxidant capacity [30].

2.6.2. Determination of Vitamin C (Ascorbic Acid) Content

Ascorbic acid content was quantified spectrophotometrically following the method of Hossain et al. [31]. To initiate the analysis, 10 mL of 0.056 M sodium oxalate was added with 1 g of sample (fresh or any pretreated group) and the mixture was then homogenized properly for about 5 min (VM-2000 Vortex Mixer, Digisystem, New Taipei, Taiwan). Following homogenization, the extracted liquid was kept at rest for another 5 min, and the homogenate was subsequently filtered through Whatman No. 1 filter paper. For Vitamin C measurements, 0.5 mL of the filtrate was diluted with 5 mL of sodium oxalate solution (0.056 M), and the absorbance was measured at 266 nm using a UV-spectrophotometer (UV1800, Shimadzu, Kyoto, Japan). Sodium oxalate solution was used as a blank, and an L-ascorbic acid standard curve equation was used to quantify the vitamin C content (y = 10.257x + 0.2889; R2 = 0.9925). The results are expressed as ascorbic acid equivalents (AAE)/100 g of fresh sample.

2.6.3. Determination of Total Phenolic Content

To determine the total phenolic content, a modified version of the method described by Zzaman et al. [10] was employed. In brief, a mixture was prepared by combining 20 mL of each sample extract, 1.58 mL of distilled water, and 100 mL of Folin–Ciocalteu reagent followed by vigorous mixing. After 8 min, 300 mL of Na2CO3 solution (0.2 g/mL) was added to the mixture, and the resulting solution was then incubated in dark conditions at a temperature of 40 °C for another 30 min. A blank was prepared using distilled water instead of the sample extract. The absorbance measurements were taken at a wavelength of 765 nm using a UV spectrophotometer (UV1800, Shimadzu, Kyoto, Japan). The results are expressed as milligrams of Gallic acid equivalent (GAE) per 100 g of fresh sample and calculated using a standard curve equation (y = 0.0902x + 0.0542; R2 = 0.9998).

2.6.4. Determination of Total Flavonoid Content

Total flavonoid content was determined using the well-known aluminum trichloride method, as described by Del Caro et al. [31]. For the determination, 0.5 mL of sample extracts were mixed thoroughly with 1.5 mL ethanol (95%), 0.1 mL of aluminum trichloride (AlCl3) solution (0.1 g/mL), 0.1 mL of potassium-acetate (1 M), and 2.8 mL of distilled water. The mixture was then incubated for 40 min at ambient conditions, and, subsequently, the absorbance measurements were taken using a UV-spectrophotometer (UV1800, Shimadzu, Japan) at 415 nm. Distilled water, instead of the sample, with all the other reagents, served as the blank, and the results are expressed as milligrams of quercetin equivalent (QE) per 100 g of fresh sample (y = 0.004x + 0.0236; R2 = 0.9981).

2.6.5. Antioxidant Activity Assessment

The antioxidant capacity of fresh and dried Satkara fruit slices was evaluated using the 2,2-diphenyl-1-picrylhydrazyl (DPPH) radical scavenging assay [32]. Briefly, 2 mL of the sample extract was mixed with a methanolic solution of DPPH radical (6 × 10⁻⁵ M), and the mixture was incubated in completely dark conditions for 30 min at room temperature. DPPH solution without any extract was used as the control. A UV-spectrophotometer (UV1800, Shimadzu, Japan) was then used to measure the change in the color of the mixture at a wavelength of 517 nm. The percentage of DPPH scavenging activity was calculated using the following standard Equation (7):
Inhibition   ( % ) = A 0   A 1 A 1   × 100 %
where A1 and A0 are the absorbance values of the sample and the control, respectively.

2.7. Statistical Analysis

The results are expressed as mean ± standard deviation after conducting all the experiments in triplicates. Microsoft Excel 2019 was used to analyze the experimental data and also to prepare all the figures. To compare the mean groups, one-way analysis of variance (ANOVA) followed by Tukey’s test was performed using Minitab version 21.0 (Minitab 21.0, LLC, State College, PA, USA). A similar software package was also used for performing Pearson correlation analysis. Differences were considered statistically significant at a level of p < 0.05.

3. Results and Discussion

3.1. Drying Characteristics of Ultrasound-Osmotic Pretreated Satkara

Figure 1 depicts the drying kinetics of Satkara fruit subjected to various drying temperatures and pretreatment (US-OP) conditions. While factors such as air velocity and relative humidity were kept constant, the drying behavior of Satkara was primarily influenced by drying temperature, osmotic agent type, and ultrasound treatment duration, as evidenced by the presented drying curves.
Three distinct drying temperatures (50, 60, and 70 °C) were employed in this study, with the corresponding drying kinetics shown in Figure 1a–i. As illustrated, an increase in the drying temperature led to a notable reduction in the time required to attain an equilibrium in moisture content. The drying duration for the Satkara fruit slices ranged from 6.5 to 12.5 h at 50 °C, 5.5 to 8.5 h at 60 °C, and only 4.5 to 7.5 h when dried at 70 °C. This observed trend is a common phenomenon primarily attributed to the enhanced moisture diffusivity and elevated drying rates at higher temperatures [33]. Compared to the untreated group, pretreated samples dried more quickly, corroborating the findings of Kek et al. [34] and Garcia-Noguera et al. [35]. Kek et al. [34] found that a combined application of ultrasound and osmotic pretreatments reduced the drying time of guava slices by over 30%, whereas Garcia-Noguera et al. [35] observed a 135 min reduction in drying time for the pretreated strawberries compared to the control group.
Among all sample groups, UT, F30, W10, and W30 exhibited the longest drying times of 12.5 h (at 50 °C), while the S30 pretreatment group at 70 °C required the shortest drying time of only 4.5 h. In addition, sucrose was the most effective as an osmotic agent, significantly reducing the drying times of the fruit slices under all the studied conditions. This aligns finely with the observations of Ispir and Toǧrul [36], who reported a similar phenomenon during the osmotic dehydration of apricots, where sucrose-treated samples exhibited higher moisture loss compared to those treated with fructose, glucose, sorbitol, and maltodextrin. According to the authors, the distinct molecular structure of sucrose and its interaction with apricot cells likely contributed to the observed differences.
Sonication also exerted a positive influence on the drying kinetics. With increasing time duration, the samples exhibited accelerated water loss at any given time interval. This occurred mainly due to the formation of microscopic channels within the fruit slices during sonication, facilitating the moisture to evaporate more rapidly [37]. A similar effect was observed by Li et al. [38] during the drying of ultrasound–osmotic pretreated Sanhua plums. This process can also improve mass transfer by creating vibrations through sound waves, which eventually reduce disruptions in the boundary layer [37]. It is evident that with prolonged sonication, the samples became more exposed to these sound waves, resulting in enhanced moisture removal within a shorter timeframe.

3.2. Fitting and Evaluation of Mathematical Models

The models used in the present work for Satkara, Page, Newton, Henderson and Pabis, and logarithmic models, had previously been used for Garcinia pedunculata [11,21], pomelo [39], and mango [40] to predict their drying nature. The adequacy of a model for a particular dataset can be assessed by examining the various statistical parameters. In this study, three such parameters, R2, RMSE, and χ2, were calculated from the experimental data and are listed in Table 3.
In simpler terms, R2 values, or the coefficient of determination values, indicate how well the models can explain the variance that exists in the experimental data. This parameter is perhaps the most important of all. RMSE or root mean square error measures the average differences between the experimental and the model predicted values. Lastly, the χ2 or chi-square values are used to assess the goodness-of-fit between the model and the experimental data, i.e., how well the model matches the actual values [16]. Each of these parameters has its role in assessing model fit and performance. Castro et al. [29] mentioned that R2, and χ2 were frequently used to predict the drying characteristics of food products. In the literature, R2, RMSE, and χ2 have been considered the most important model parameters for predicting the mass transfer of food materials [11,12,22,29] and they are discussed in the following paragraphs.
For the Page model, the values for R2, RMSE, and χ2 ranged from 0.9816 to 0.9997, 0.0067 to 0.0475, and 0.0001 to 0.0028, respectively. Similarly, for the Newton model, the values of these parameters were between 0.8303 and 0.9947, 0.0238 and 0.1478, and 0.0006 and 0.0246, respectively. The values for the Henderson and Pabis model were observed to be in the ranges of 0.1176 to 0.9945, 0.0241 to 0.331, and 0.0007 to 0.1409, respectively. Finally, for the logarithmic model, the values were found between 0.43 and 0.9941, 0.024 and 0.2254, and 0.0009 and 0.0728, respectively, for these statistical parameters.
Higher R2 values generally indicate better fits. Based on this criterion, both the Page and Newton models can be considered suitable (R2 > 0.83) for predicting the drying nature of pretreated Satkara. However, when considering the other precision criteria of lower RMSE and χ2 values, only the Page model was singly found to be more appropriate for modeling drying kinetics. Moreover, the fact that the experimental values for all the pretreatment and untreated groups lie close to the model predicted lines, shown in Figure 1 with dotted curve lines, further confirms the suitability of the Page model in describing the drying properties of the Satkara fruit slices subjected to convective drying conditions. This Page model has been developed by simplifying Fick’s second law of diffusion and is an empirical modification of the Newton model [25]. Previous studies, including Hossain et al. [21], Roy et al. [8], Biswas et al. [22], and Korese and Achaglinkame [24] have already demonstrated the effectiveness of this model for various drying applications. Assis et al. [23] had also found that the Page and Newton models were among other tested models that could describe the moisture content well during the air-drying (25–80 °C) process of osmotically pre-treated apple cubes.
Yet, despite the good predictability, these empirical models are still inadequate for comprehensive analysis. In their studies, Meisami-asl et al. [41] and López et al. [42] mentioned these empirical models and their inability to involve various factors, such as irregular changes in process variables or diverse characteristics of the product during the drying process. In this study, the air velocity and the relative humidity were kept constant, and still the changes in shape during the process and their impact on the kinetics remained unfolded.
Since the Page model was found to be the most appropriate for modeling drying kinetics, the activation energy (Ea) values were calculated for the k parameter of this model for each pretreatment condition (Table 4). The energy values vary from 15.75 kJ/mol (observed for the G10 group) to 42.06 kJ/mol (observed for the S30 group). This range of activation energies falls within the typical range reported for food products, which is generally considered to be between 11.01 and 43.16 kJ/mol [43]. However, not all determinations followed Arrhenius rule, as R2 were rather low, namely for pretreatment using glucose solutions and for the control (UT). For some osmotic pretreatments, such as the ones with sucrose solutions, the Ea values tended to increase with the sonication duration, suggesting that the Satkara fruit slices treated with ultrasounds required more energy to initiate the moisture removal process. A study by Santos et al. [44] also reported a similar trend where the authors attributed the temperature sensitivity of the diffusion process to the increased energy values of sonication. However, an opposite effect was observed in Kaveh et al.’s study [45], where the Ea decreased significantly from 36.44 kJ/mol to 28.55 kJ/mol during a 40 min sonication pretreatment of almonds.

3.3. Quality Evaluation of Dried Satkara

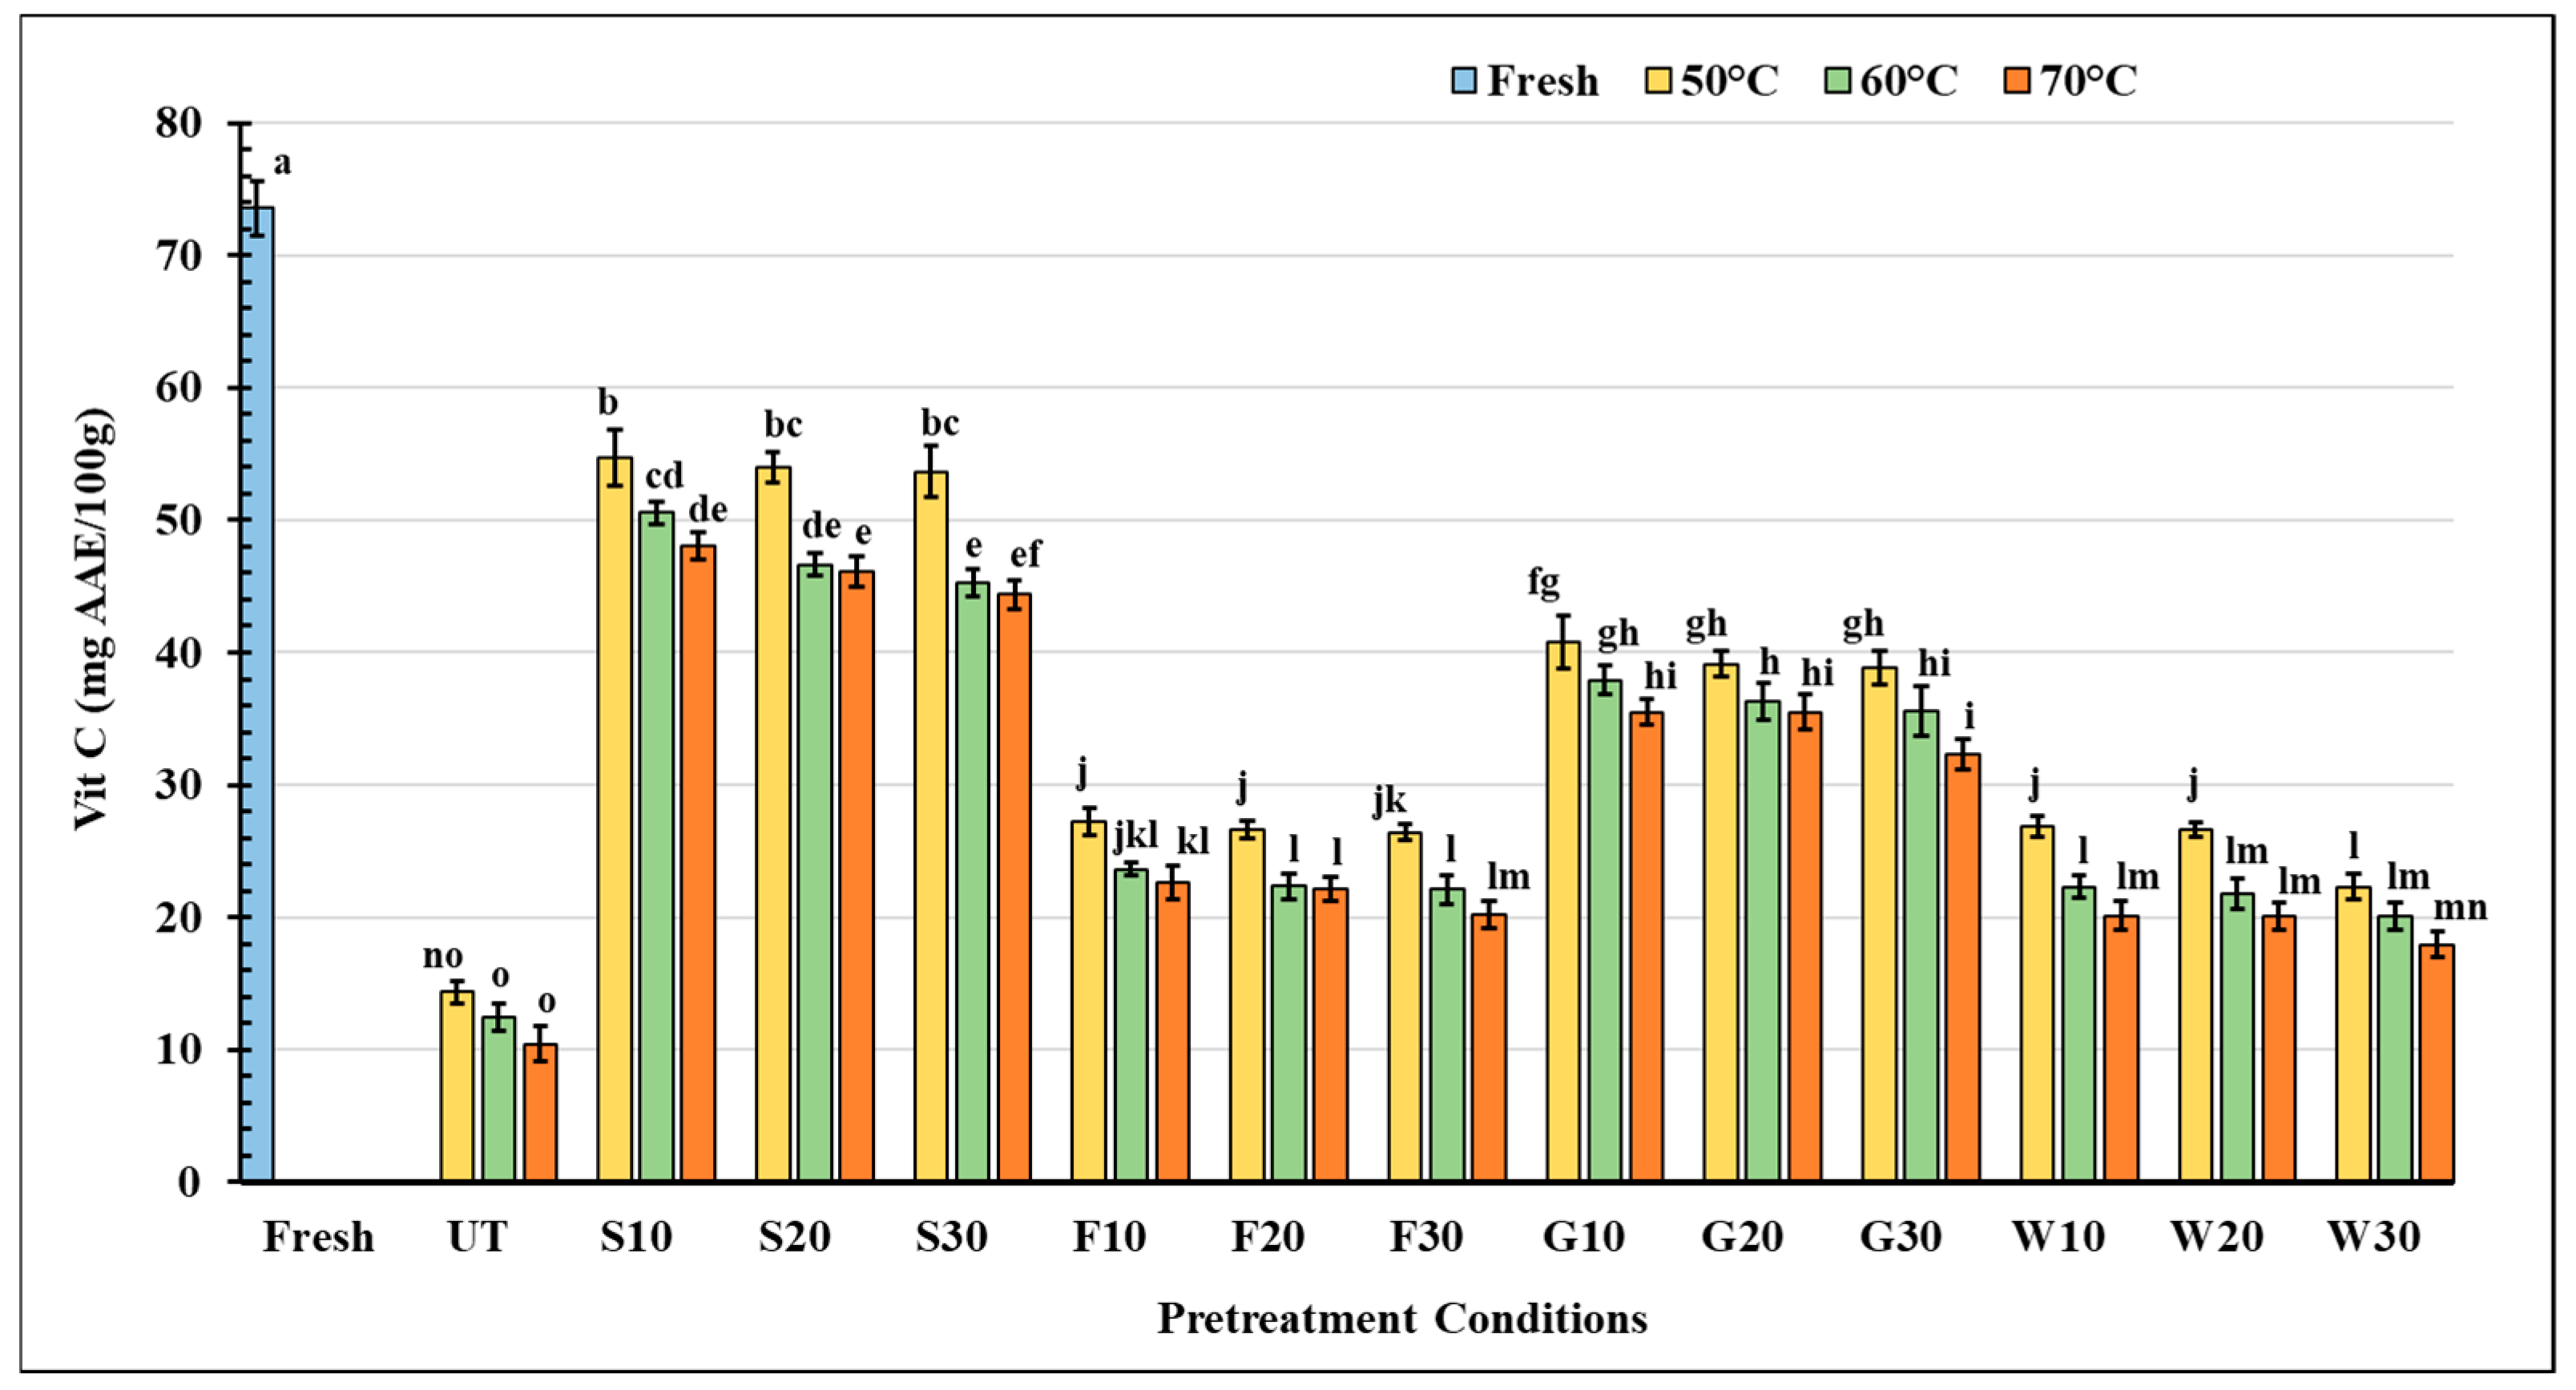
For the quality evaluation of pretreated Satkara dried in different drying conditions, the levels of bioactive compounds and the antioxidant activity were assessed and are displayed in Figure 2, Figure 3, Figure 4 and Figure 5.

3.3.1. Vitamin C (Ascorbic Acid) Content

Among all the vitamins, vitamin C is considered to be the most sensitive, primarily due to its high water solubility and thermal instability. For this, it is assumed that if Vitamin C can be successfully retained during processing, it is likely that other vitamins will also be maintained at a similar or greater level [46].
The changes in vitamin C content in Satkara subjected to different pretreatment conditions are presented in Figure 2. The initial value was recorded as 73.57 ± 2.04 mg ascorbic acid equivalents (AAE)/100 g of sample, which declined by 25.64% to 85.81% following the drying process (p < 0.05). Most of the reduction was observed when the samples were dried at higher temperatures. This is consistent with previous findings by Vega-Gálvez et al. [47] and Santos and Silva [48], who attributed the decrease to enhanced oxidation reactions at elevated drying temperatures.
Compared to the untreated sample, all samples treated in different osmotic solutions showed higher retention of vitamin C. Among the different solutions, sucrose was found to be more effective, resulting in a loss of only 25.64% to 39.12% vitamin. A similar effect of sucrose was observed in our previous experiment [3], where sucrose-pretreated samples showed a relatively higher ascorbic acid retention. These findings also align with the observation of Zzaman et al. [10] during the quality evaluation of pineapples, dried at different temperatures. The protective effect of sucrose may come from enhancing the activation-energy barrier for ascorbic acid oxidation, as reported by Hsieh and Harris [49]. The combination of sucrose pretreatment, in this study, with 10 min of sonication (S-10) and drying at 50 °C yielded the highest vitamin C content (54.71 ± 1.98 mg AAE/100 g).
However, a negative effect of sonication could be noticed, among the pretreated sample groups, on the vitamin content. At any given temperature, the levels declined with increasing duration of sonication. The production of new free radicals during cavitation can be a possible explanation for this reduction [50], while other researchers have attributed the increased heat production during sonication to vitamin C degradation [51].

3.3.2. Total Phenolic Content (TPC)

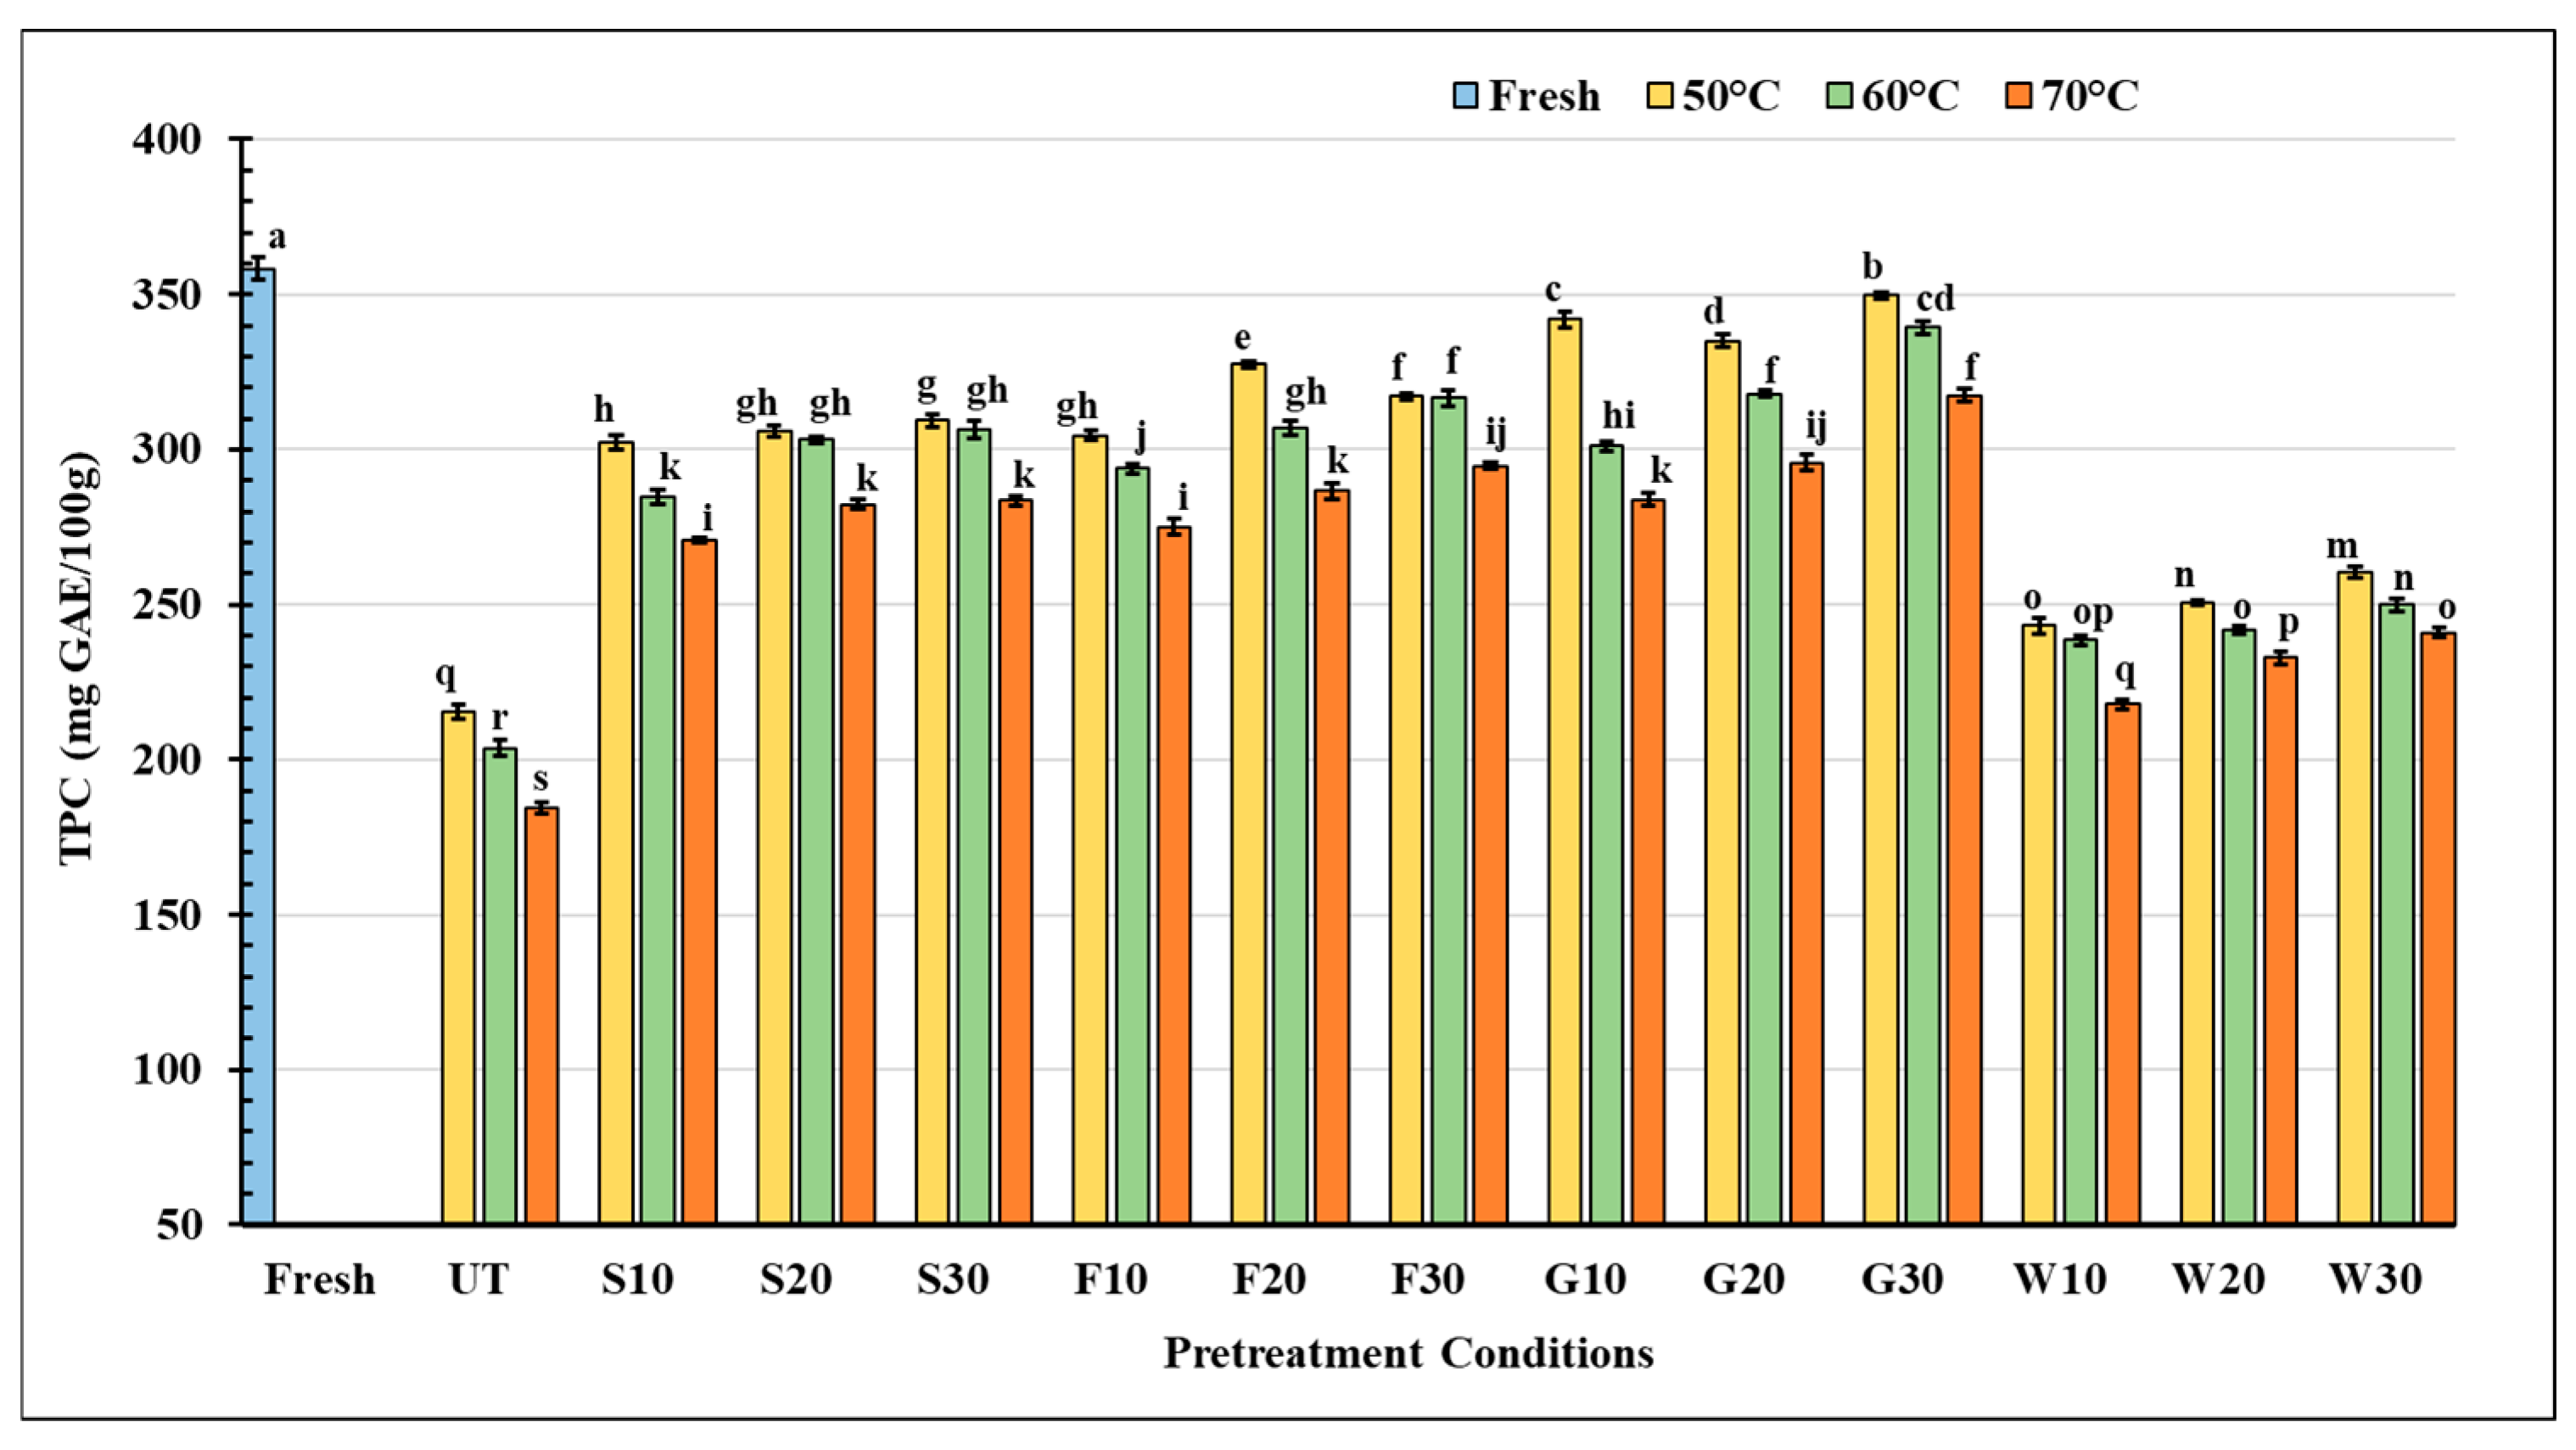
Phenols are important as they contribute to the taste, color, and nutritional qualities of the food products [39]. However, these compounds are heat-liable and undergo permanent structural alterations when subjected to prolonged heating [33]. Thus, it becomes crucial to investigate the changes in phenolics during the drying process. Figure 3 illustrates the effects of different US-OP conditions on the total phenolic content of dried Satkara.
The TPC in the fresh Satkara was found to be 358.32 ± 3.61 mg GAE/100 g of sample. The drying process led to a considerable loss of phenolic content, with a reduction ranging from 2.4% to 48.6%. With increasing the drying temperature, almost every pretreatment group showed a substantial reduction (p < 0.05) in phenolic compounds, which again validates their heat liability nature. Our findings align closely with the work of López et al. [42], who also observed a substantial reduction in these compounds in hot air-dried blueberries. The continuous exposure to elevated temperatures can disrupt glycosidic linkages in phenolic compounds, leading to their degradation or transformation into non-bioactive forms [43]. Apart from the negative impacts of the heat, the leaching of these hydrophilic compounds with the water during the osmotic pretreatment can also be a possible reason for the reduction [42]. Nearly 27–39% reductions were observed when the samples were dried after immersion only in water. Interestingly, the range was much less prevalent when pretreatment was carried out in sugar solutions.
Compared to the untreated sample, all samples treated in different osmotic solutions showed higher TPC. Most of the retention was found in the samples treated with sucrose and fructose solutions, approximately 87% to 76% and 91% to 77%, respectively. This enhanced retention occurred due to the shortening of drying time and the protective effects of osmotic agents. Sugar solutions can form barrier layers at the product surface, limiting oxygen interactions with phytoconstituents present in the fruit [52]. Moreover, they can also substitute for water molecules, which helps maintain the stability of phospholipids and water molecules, ensuring the integrity of the cell membrane as previously reported for strawberries by Jiang et al. [18].
Similarly, except for the F30 and G20 pretreatment groups, sonication also posed a positive impact on the TPC of Satkara and for most of the conditions, the effect was found to be significant (p < 0.05). Surprisingly, for the sucrose pretreatment group, the effect was not significant compared to the samples subjected to 20 and 30 min of sonication time (p > 0.05).

3.3.3. Total Flavonoid Content (TFC)

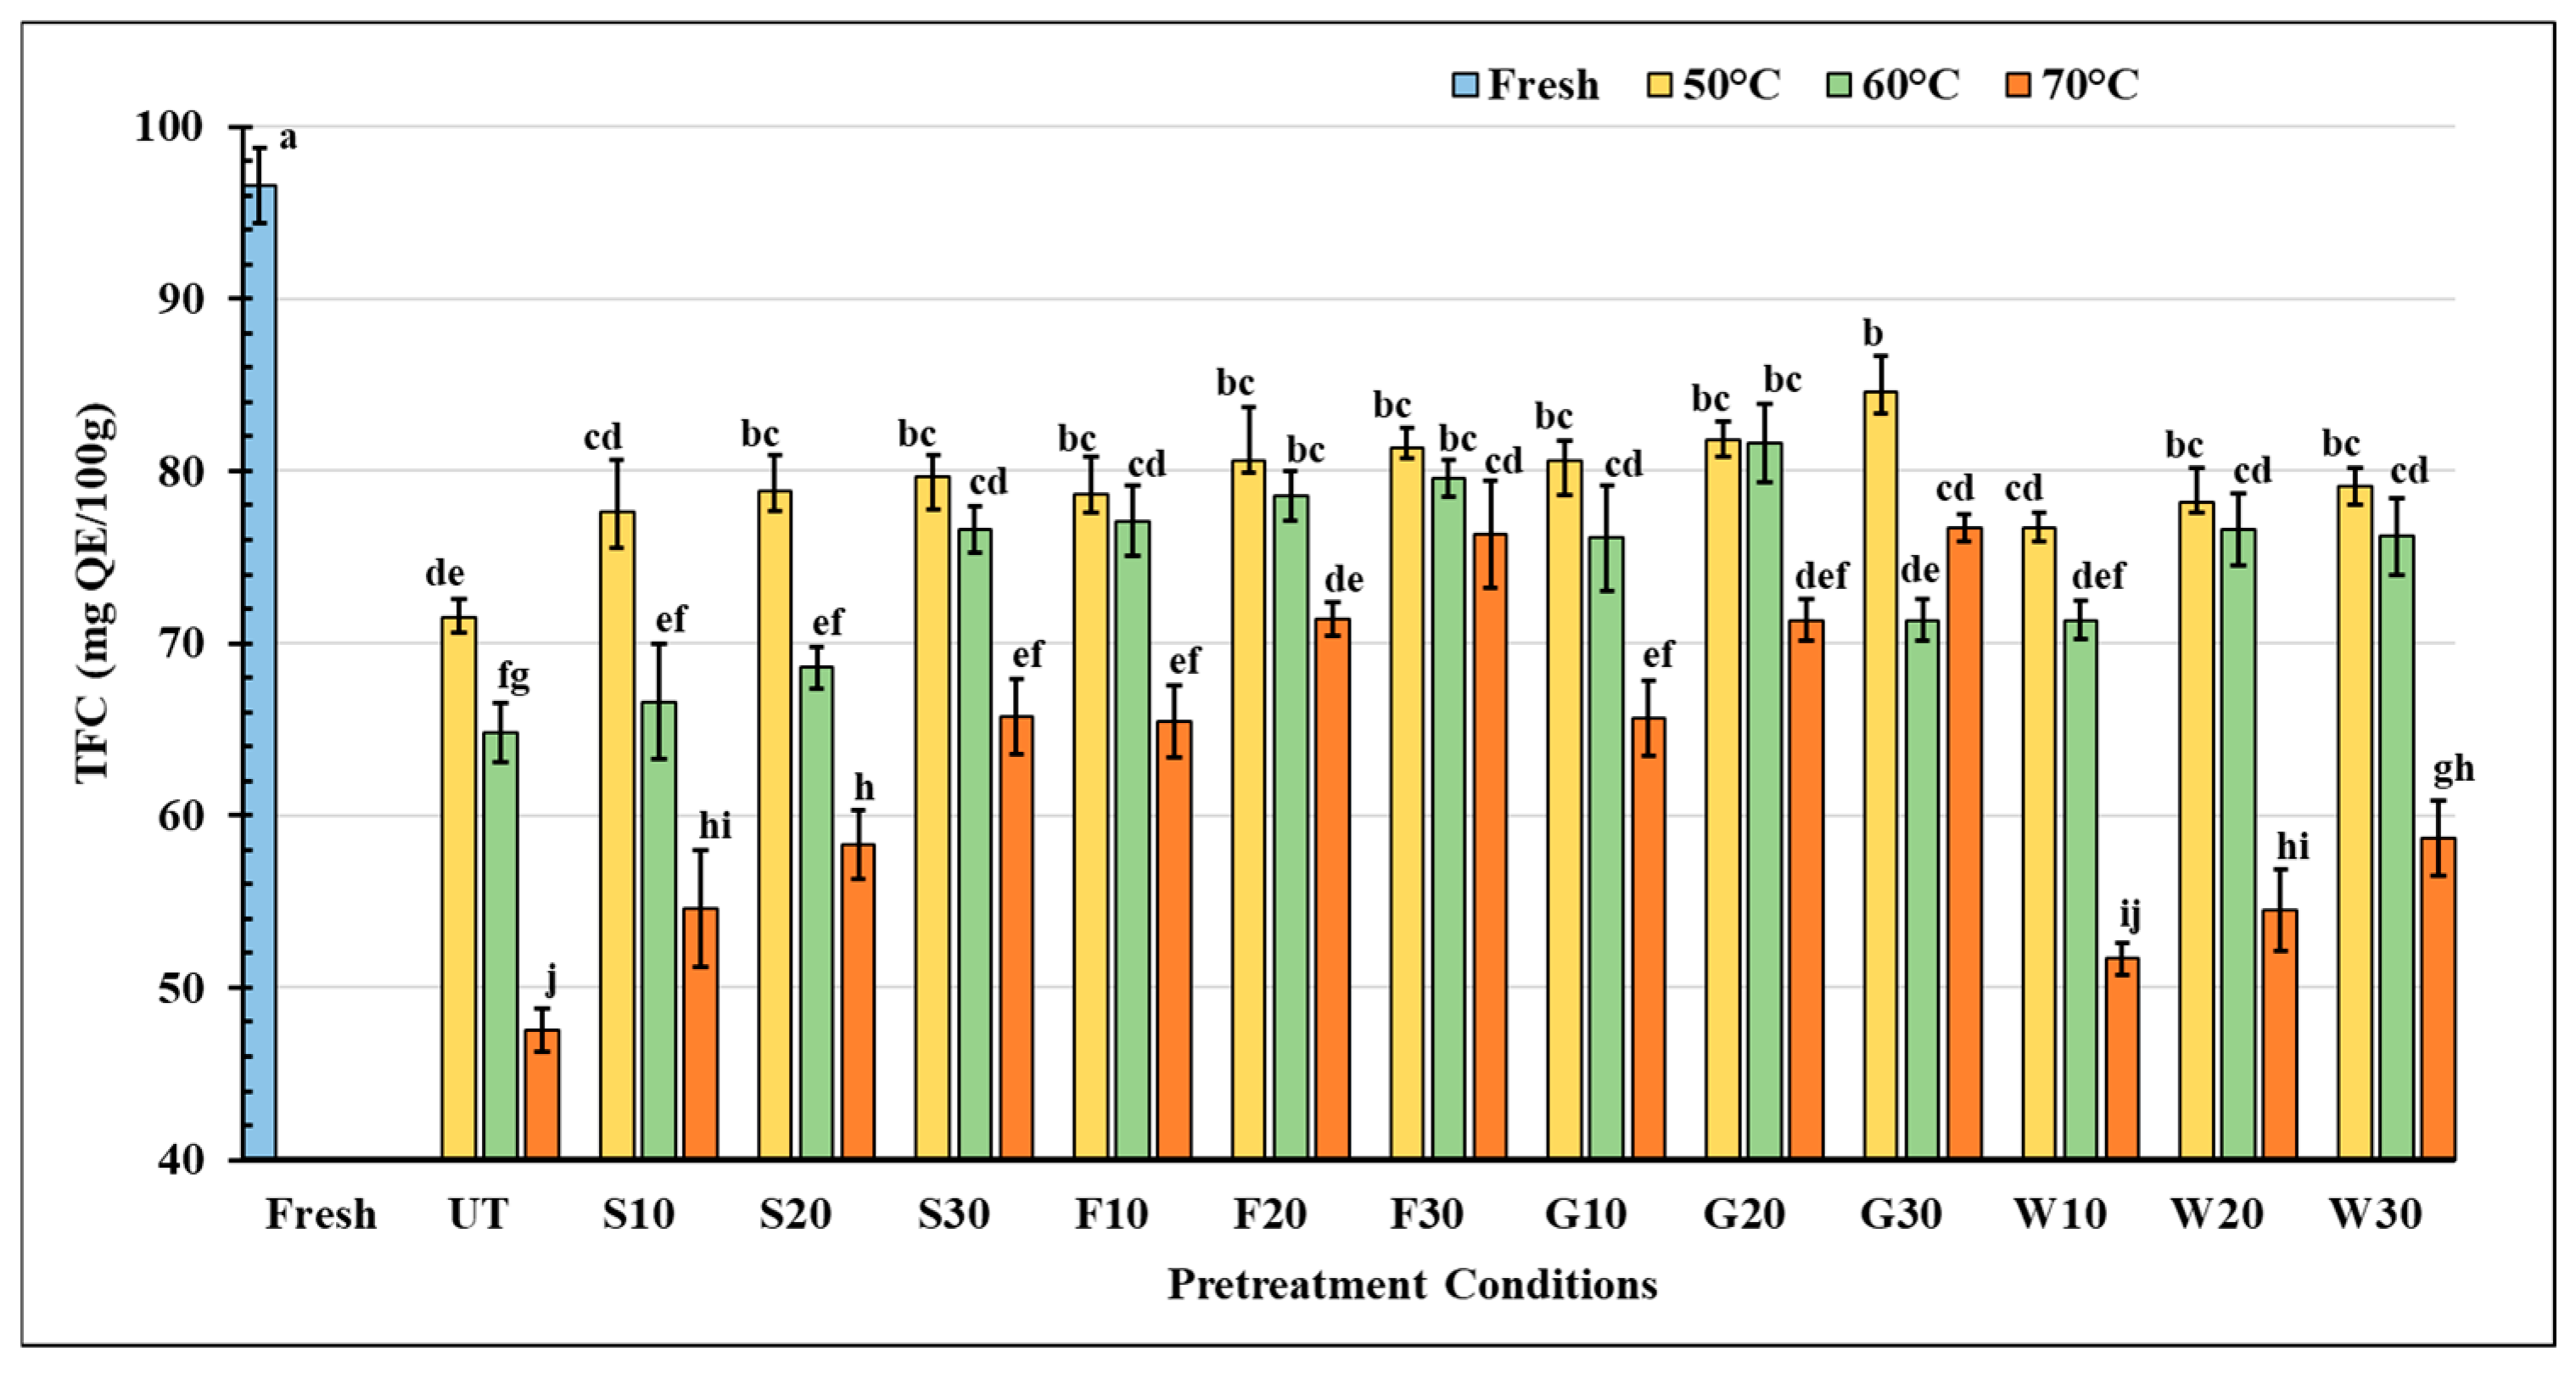
Flavonoids, a subgroup of polyphenols, are found in plants naturally and include flavones, flavonoids, isoflavones, catechins, and anthocyanins. In addition to their principal function of pigmentation, their role as antioxidants has also been supported by studies [53]. The TFC of pretreated Satkara fruit slices dried at three different temperatures is shown in Figure 4.
From 96.58 ± 2.21 mg QE/100 g of sample, recorded with fresh Satkara, the TFC concentration was greatly decreased (p < 0.05), ranging from a 12.4% reduction in glucose-treated samples dried at 50 °C with 30 min of sonication (G30) to a 50.8% reduction in untreated samples dried at 70 °C. The decrease appeared to be more pronounced as the drying temperature rose. Heat increases enzymatic activity and oxidation processes, leading to the degradation of these beneficial molecules [10]. In their review, Kamiloglu et al. [50] also reported on the destruction of flavonoids, highlighting how the drying process affects the antioxidant potential of plant products. Authors such as Shang et al. [54] attributed the thermal deterioration and oxidative degradation to reductions in these compounds during the drying process. However, the negative effect of temperature was less apparent when the samples were treated in the fructose solution; in this case, the majority of retention was observed with a minimal loss of approximately 15–32%.
Similarly, the loss of TFC was less pronounced with increasing sonication duration, reducing it by 1–11% across all pretreatment conditions. This increased the retention of these compounds with longer sonication times mostly due to the shortening of drying time, release of bound phenols, and inactivation of some phenolic enzymes in the Satkara. Similarly to our findings, Ren et al. [55] found that the onion samples subjected to ultrasound pretreatment preserved more of their flavonoids than the untreated samples. However, the effect of ultrasound tended to be more significant when fruit slices were dried at relatively higher temperatures. In contrast to this, Liu et al. [56] reported that the sonication treatment only resulted in a better retention of flavonoids when the peach samples were dried at low temperatures. The difference in the drying temperatures employed, the presence of specific flavonoids, and their structure in the two samples could be attributed to this discrepancy.

3.3.4. Antioxidant Activity

Figure 5 illustrates the antioxidant activity of fresh and dried Satkara measured by the DPPH method. The fresh Satkara exhibited a radical inhibition percentage of 76.32 ± 0.98% which declined noticeably after the drying process, aligning with what was reported for European cranberry bush [33] and pomelo [39].
It was noticed that the antioxidant activity of Satkara slices declined with the increasing drying temperatures, with most of the decline observed at 70 °C. The reduction in antioxidant capacity during thermal treatment is generally associated with phenol degradation. Compared to the untreated sample, all samples treated in different osmotic solutions showed higher DPPH values.
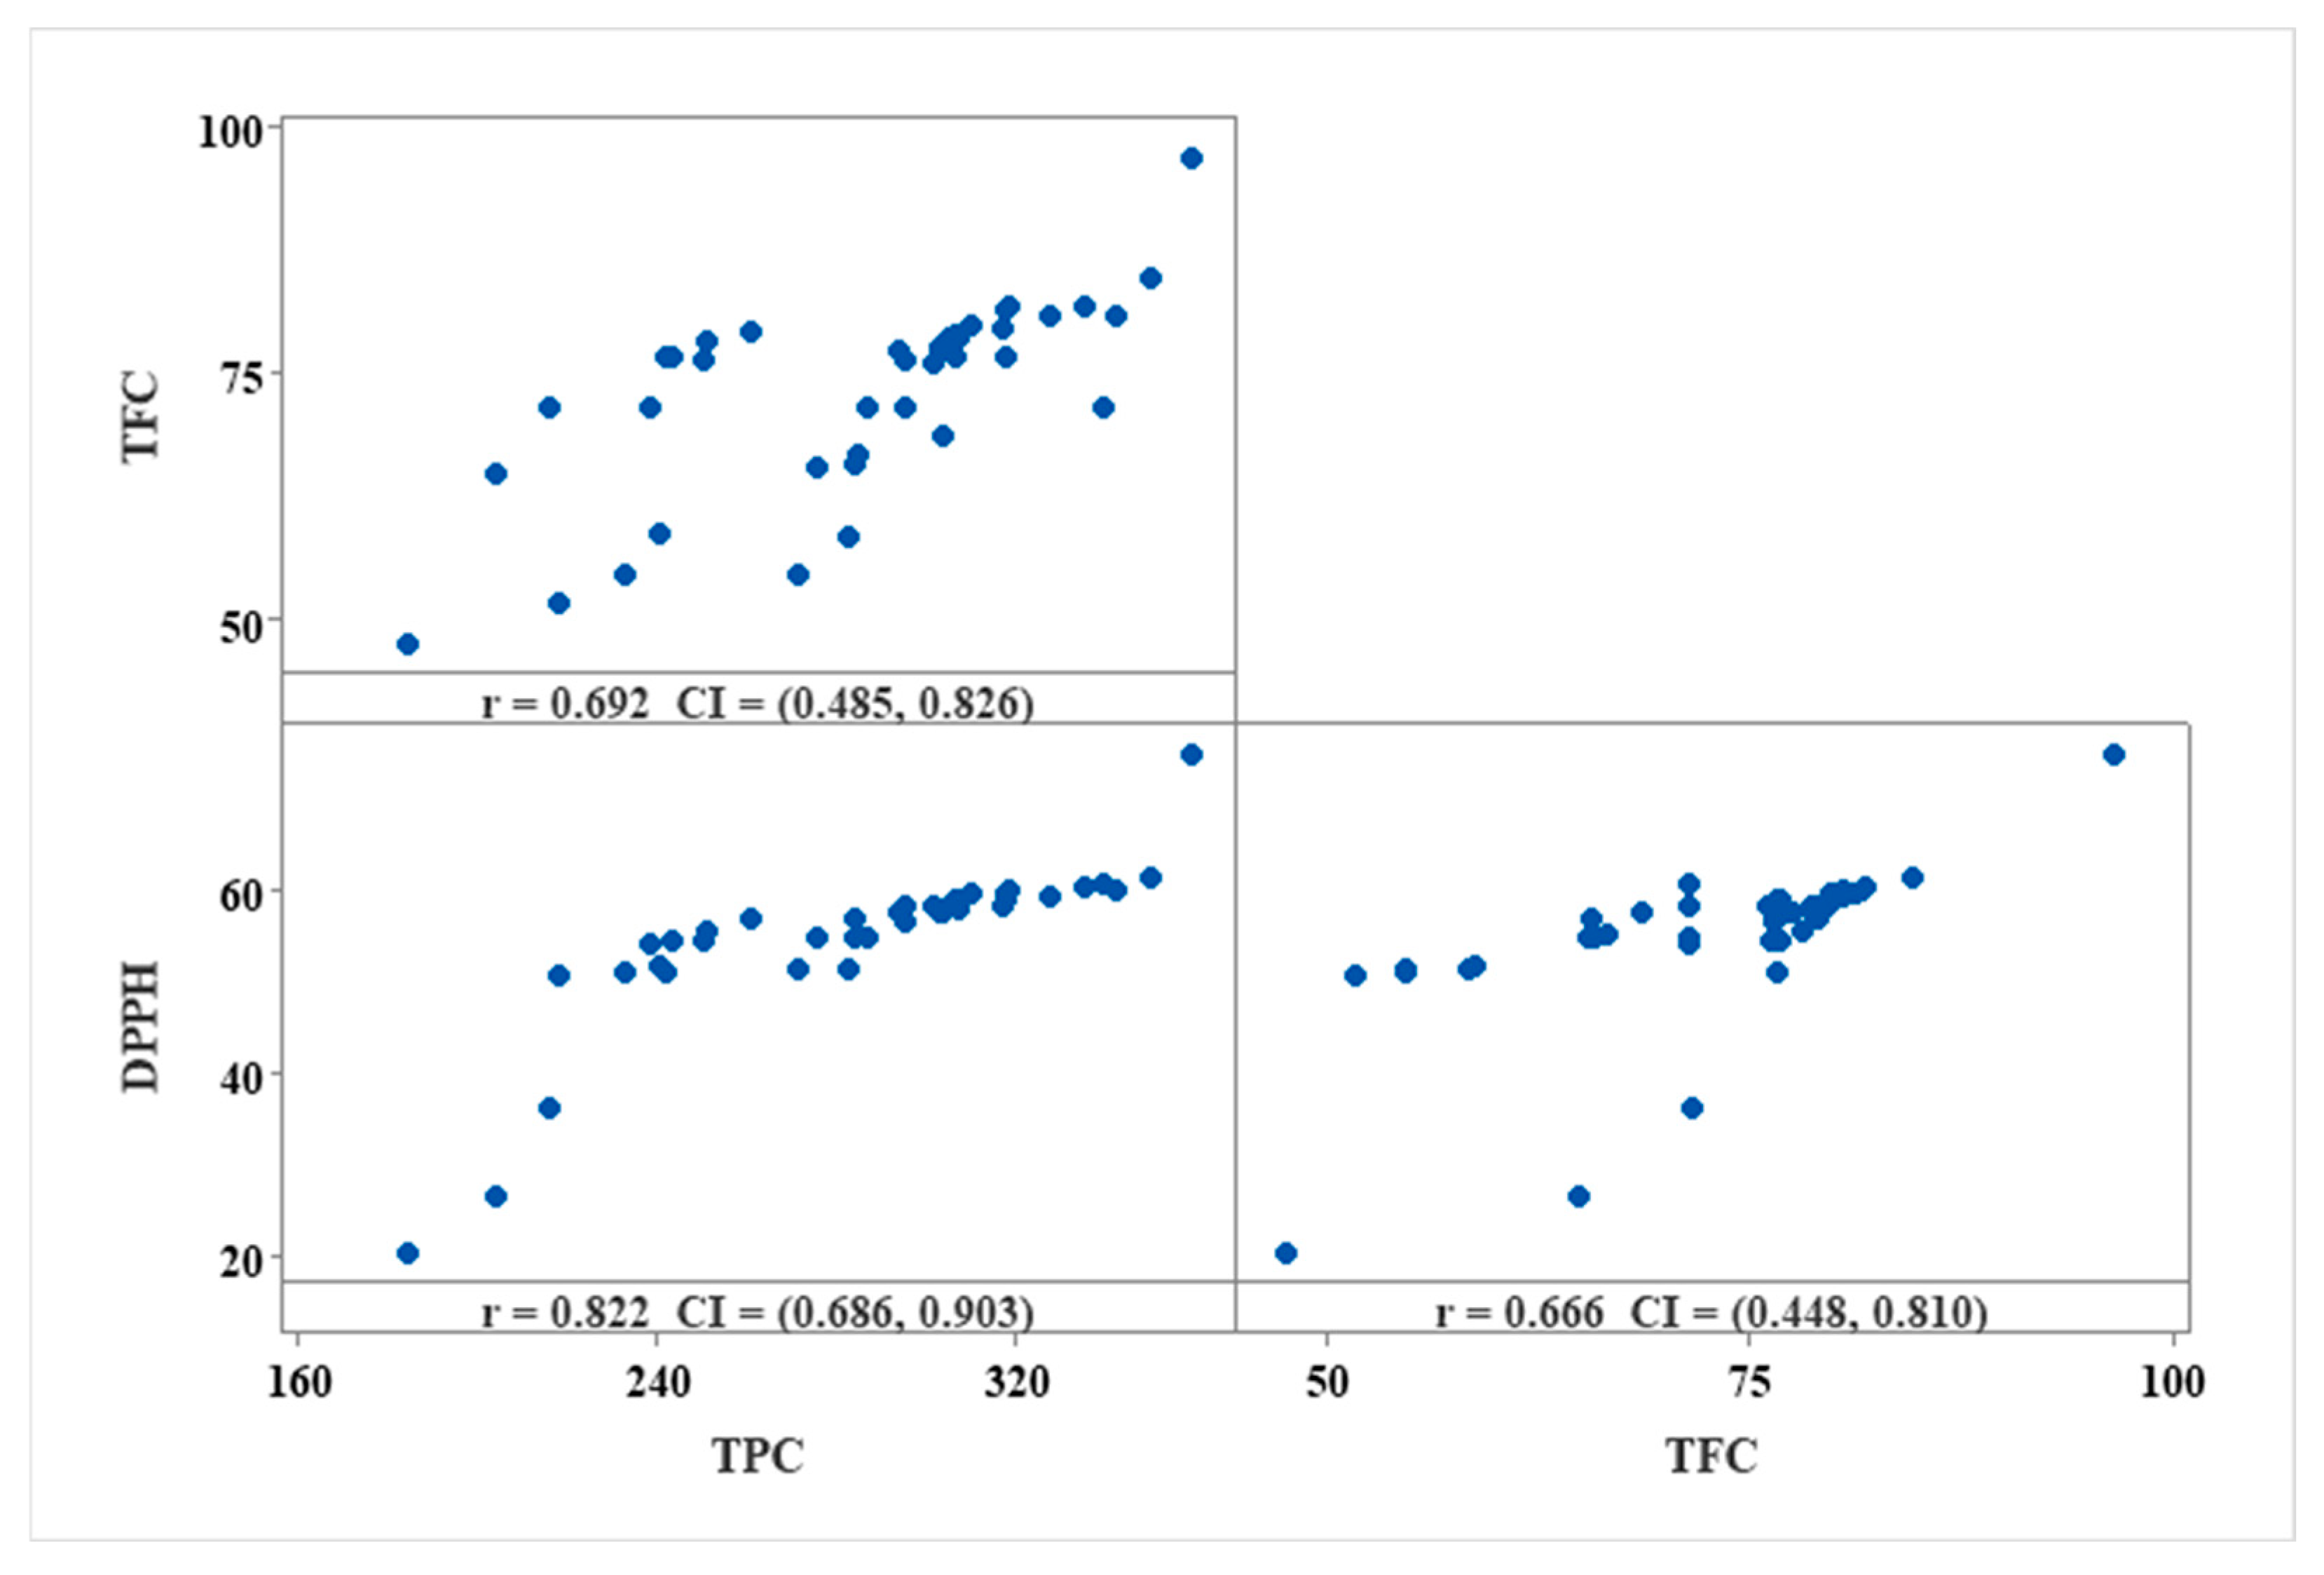
Previous studies, including Zhou et al. [57], have consistently demonstrated a positive correlation between the levels of phenolic compounds and antioxidant activity. In the present study, a strong correlation between the total phenolic content (TPC) and antioxidant capacity (r = 0.82) was also observed, while the correlation between total flavonoid content (TFC) and antioxidant capacity was slightly weaker (r = 0.67), shown in Figure 6. This correlation analysis further confirms that TPC plays a more significant role in determining the antioxidant potential of the studied US-OP Satkara than TFC. The lower contribution of flavonoids in antioxidant activity, as indicated by previous studies [58,59], coupled with the higher concentration of phenolic compounds in the fresh fruit, may explain this phenomenon.
However, as Alonzo-Macías et al. [60] pointed out, the changes in antioxidant capacity during processing are indeed complex and cannot be always predicted solely based on the quantity of phenols. Their study on dried strawberries revealed that despite declining phenolic content, the dried strawberries showed higher radical inhibition values. This suggests that factors beyond phenolic compounds, such as the formation of new compounds, the inactivation of hydrolytic and oxidative enzymes, and deterioration due to UV radiation, can also contribute to variations in antioxidant capacity [61].
Interestingly, the deteriorative impact of temperature was mostly alleviated when the samples were treated with different sugar solutions. The retention was comparable in the fruit slices treated in sucrose, fructose, and glucose solutions, and the highest value was achieved with glucose pretreatment, 30 min of sonication (G-30), and a drying temperature of 50 °C, reaching 61.4 ± 2.07%. However, compared to the other parameters evaluated in this study, the effect of sonication duration was found to be mostly insignificant in terms of the antioxidant activity of Satkara (p > 0.05).
Overall, the osmotic pretreatment of Satkara involves immersion in a hypertonic solution, which draws water out of the fruit through osmosis. This reduces the moisture content and creates a protective barrier against nutrient loss. At the same time there is a penetration of the solute from the solution into the fruit [23]. The osmotic process also minimizes the thermal damage during subsequent drying by reducing the drying time, thereby preserving heat-sensitive compounds like vitamins and antioxidant compounds. As already mentioned in Section 1, ultrasound treatment reduces the time needed for water removal and it can also protect antioxidants during drying [11,12,51,53]. In the present study, vitamin C content, TPC, TFC and DPPH were higher when the osmotic ultrasound-assisted pretreatment was used (Figure 2, Figure 3, Figure 4 and Figure 5). In addition, vitamin C retention was higher when sucrose was used in the osmotic ultrasound-assisted pretreatment in comparison with the other sugars (Figure 2), but TPC was lower (Figure 3). As a disaccharide with a higher molecular weight than glucose and fructose, sucrose exhibits lower permeability through cell membranes compared to monosaccharides. This characteristic limits its diffusion into the food matrix, thereby reducing the leaching of water-soluble nutrients. Studies have shown that using sucrose in the osmotic solution resulted in better retention of nutrients such as ascorbic acid, as well as lower levels of anti-nutrients like tannins, which are phenolic compounds [62,63].

4. Conclusions

This study aimed to evaluate the impact of different osmotic ultrasound-assisted pretreatment conditions on the drying kinetics (50–70 °C) and the quality of dried Satkara fruit. Among the four models assessed, Page’s model was found to be the most suitable to fit the drying kinetics. The osmotic ultrasound-assisted pretreatment reduced the drying time for all conditions tested. This pretreatment was most effective in preserving the vitamin C, TPC and TFC of Satkara, thereby minimizing the nutrient and bioactive compound degradation, while improving the drying process efficiency. However, a longer sonication treatment had a more destructive effect on vitamin C, whereas its effect on TPC and TFC was positive. Sucrose, in the osmotic solution, was shown to be more effective in preserving vitamin C compared to smaller sugars like glucose and fructose.
The findings in this study suggest that this osmotic ultrasound-assisted pretreatment method holds a high potential for industrial applications, particularly for producing high-quality dried products or to preserve different perishable fruits. Industrial applications could extend to the development of value-added dried fruit snacks, and functional food ingredients. In the present work, a method was successfully established to mitigate quality degradation during the drying of Satkara. Future research could be focused on optimizing packaging materials and techniques to maintain product quality during storage. As the stability of phytonutrients is critical for the long-term marketability and health benefits of dried fruit products, future studies should prioritize investigating the effects of various storage conditions, such as temperature, humidity, and light exposure on nutrient preservation. Moreover, exploring advanced packaging solutions, such as active or intelligent packaging systems, could help to extend shelf life while ensuring minimal loss of functional properties.

Author Contributions

Conceptualization, M.A.H.; methodology, M.A.H., L.C.S., T.I.R., F.M. and M.A.P.; software, M.A.I., S.A., R.B. and M.A.P.; validation, M.A.H., A.S. and A.M.M.B.M.; investigation, M.A.H.; data curation, M.A.H., R.B., F.M. and M.A.P.; writing—original draft preparation, L.C.S. and T.I.R.; writing—review and editing, M.A.H., A.M.M.B.M., R.M.S.C.M. and S.A.; supervision, M.A.H., and A.S.; project administration, M.A.H. All authors have read and agreed to the published version of the manuscript.

Funding

This research received no external funding.

Data Availability Statement

Data are contained within the article. Further inquiries can be directed to the corresponding authors.

Acknowledgments

The first nine authors of this study would like to thank the Department of Food Engineering and Tea Technology at Shahjalal University of Science and Technology, Sylhet 3114, Bangladesh, for providing all the necessary laboratory facilities to conduct the research.

Conflicts of Interest

The authors declare no conflicts of interest.

References

  1. Kumar Bhattacharjya, D.; Pujirahayu, N.; Suzuki, T.; Katayama, T. Chemical constituents of whole fruit of Citrus macroptera and their antioxidant activity. J. For. Biomass Util. Soc. 2020, 15, 29–38. [Google Scholar]
  2. Upadhaya, A.; Chaturvedi, S.S.; Tiwari, B.K. Utilization of wild Citrus by Khasi and Garo tribes of Meghalaya. Ind. J. Tradit. Knowl. 2016, 15, 121–127. [Google Scholar]
  3. Hazarika, T.K.; Singh, T.S. Wild edible fruits of Manipur, India: Associated traditional knowledge and implications to sustainable livelihood. Genet. Resour. Crop Evol. 2018, 65, 319–332. [Google Scholar] [CrossRef]
  4. Aktar, K.; Foyzun, T. Phytochemistry and Pharmacological Studies of Citrus macroptera: A Medicinal Plant Review. Evid. Based Complement. Alternat. Med. 2017, 2017, 9789802. [Google Scholar] [CrossRef] [PubMed]
  5. Amani, T.; Surenthar, M.; Shanmugam, R. Anti-inflammatory and Antioxidant Activity of Cucumis sativus and Citrus macroptera Herbal Formulation: An In-Vitro Study. Cureus 2024, 16, e51818. [Google Scholar] [CrossRef] [PubMed]
  6. Razzak, A.; Mahjabin, T.; Khan, M.R.M.; Hossain, M.; Sadia, U.; Zzaman, W. Effect of cooking methods on the nutritional quality of selected vegetables at Sylhet City. Heliyon 2023, 9, e21709. [Google Scholar] [CrossRef]
  7. Hasan, M.M.; Roy, P.; Alam, M.; Hoque, M.M.; Zzaman, W. Antimicrobial activity of peels and physicochemical properties of juice prepared from indigenous citrus fruits of Sylhet region, Bangladesh. Heliyon 2022, 8, e09948. [Google Scholar] [CrossRef]
  8. Roy, M.; Bulbul, M.A.I.; Hossain, M.A.; Shourove, J.H.; Ahmed, S.; Sarkar, A.; Biswas, R. Study on the drying kinetics and quality parameters of osmotic pre-treated dried Satkara (Citrus macroptera) fruits. J. Food Meas. Charact. 2022, 16, 471–485. [Google Scholar] [CrossRef]
  9. Xu, B.; Sylvain Tiliwa, E.; Yan, W.; Roknul Azam, S.M.; Wei, B.; Zhou, C.; Ma, H.; Bhandari, B. Recent development in high quality drying of fruits and vegetables assisted by ultrasound: A review. Food Res. Int. 2022, 152, 110744. [Google Scholar] [CrossRef]
  10. Zzaman, W.; Biswas, R.; Hossain, M.A. Application of immersion pre-treatments and drying temperatures to improve the comprehensive quality of pineapple (Ananas comosus) slices. Heliyon 2021, 7, e05882. [Google Scholar] [CrossRef]
  11. Hossain, M.A.; Talukder, S.; Uz Zaman, A.; Sarkar, A.; Yasin, M.; Biswas, R. Effective drying processes for Taikor (Garcinia pedunculata Roxb.) fruit by ultrasound-assisted osmotic pretreatment: Analysis of quality and kinetic models. Ultrason. Sonochem. 2024, 103, 106784. [Google Scholar] [CrossRef] [PubMed]
  12. Prithani, R.; Dash, K.K. Mass transfer modelling in ultrasound assisted osmotic dehydration of kiwi fruit. Innov. Food Sci. Emerg. Technol. 2020, 64, 102407. [Google Scholar] [CrossRef]
  13. Kucner, A.; Klewicki, R.; Sójka, M. The Influence of Selected Osmotic Dehydration and Pretreatment Parameters on Dry Matter and Polyphenol Content in Highbush Blueberry (Vaccinium corymbosum L.) Fruits. Food Bioproc. Technol. 2013, 6, 2031–2047. [Google Scholar] [CrossRef]
  14. Mothibe, K.J.; Zhang, M.; Nsor-Atindana, J.; Wang, Y.C. Use of Ultrasound Pretreatment in Drying of Fruits: Drying Rates, Quality Attributes, and Shelf-Life Extension. Drying Technol. 2011, 29, 1611–1621. [Google Scholar] [CrossRef]
  15. Oladejo, A.O.; Ma, H.; Qu, W.; Zhou, C.; Wu, B.; Yang, X. Influence of ultrasound pretreatments on diffusion coefficients, texture and colour of osmodehydrated sweet potato (Ipomea batatas). Int. J. Food Sci. Technol. 2017, 52, 888–896. [Google Scholar] [CrossRef]
  16. Chandra, A.; Kumar, S.; Tarafdar, A.; Nema, P.K. Ultrasonic and osmotic pretreatments followed by convective and vacuum drying of papaya slices. J. Sci. Food Agric. 2021, 101, 2264–2272. [Google Scholar] [CrossRef]
  17. Gül, O.; Açikgöz, N.; Gül, L.B. Effect of ultrasound assisted osmotic dehydration pre-treatment on drying kinetics and some functional properties of pumpkin (Cucurbita moschata). GIDA—J. Food 2022, 47, 874–888. [Google Scholar]
  18. Jiang, J.; Zhang, M.; Devahastin, S.; Yu, D. Effect of ultrasound-assisted osmotic dehydration pretreatments on drying and quality characteristics of pulsed fluidized bed microwave freeze-dried strawberries. LWT 2021, 145, 111300. [Google Scholar] [CrossRef]
  19. Jin, W.; Zhang, M.; Mujumdar, A.S.; Yu, D. Influence of ultrasonic-assisted osmotic dehydration pretreatment on hot air-assisted radio frequency drying of bitter gourd. Food Biosci. 2024, 59, 103923. [Google Scholar] [CrossRef]
  20. Ramallo, L.A.; Mascheroni, R.H. Quality evaluation of pineapple fruit during drying process. Food Bioprod. Process. 2012, 90, 275–283. [Google Scholar] [CrossRef]
  21. Hossain, M.A.; Dey, P.; Joy, R.I. Effect of osmotic pretreatment and drying temperature on drying kinetics, antioxidant activity, and overall quality of taikor (Garcinia pedunculata Roxb.) slices. Saudi J. Biol. Sci. 2021, 28, 7269–7280. [Google Scholar] [CrossRef] [PubMed]
  22. Biswas, R.; Hossain, M.A.; Zzaman, W. Thin layer modeling of drying kinetics, rehydration kinetics and color changes of osmotic pre-treated pineapple (Ananas comosus) slices during drying: Development of a mechanistic model for mass transfer. Innov. Food Sci. Emerg. Technol. 2022, 80, 103094. [Google Scholar] [CrossRef]
  23. Assis, F.R.; Morais, R.M.S.C.; Morais, A.M.M.B. Osmotic dehydration with sorbitol combined with hot air convective drying of apple cubes. J. Food Sci. Technol. 2017, 54, 3152–3160. [Google Scholar] [CrossRef] [PubMed]
  24. Korese, J.K.; Achaglinkame, M.A. Convective drying of Gardenia erubescens fruits: Effect of pretreatment, slice thickness and drying air temperature on drying kinetics and product quality. Heliyon 2024, 10, e25968. [Google Scholar] [CrossRef] [PubMed]
  25. Agrawal, Y.C.; Singh, R.P. Thin-Layer Drying Studies on Short-Grain Rough Rice; American Society of Agricultural Engineers: St. Joseph, MI, USA, 1977. [Google Scholar]
  26. Ayensu, A. Dehydration of food crops using a solar dryer with convective heat flow. Sol. Energy 1997, 59, 121–126. [Google Scholar] [CrossRef]
  27. Westerman, P.W.; White, G.M.; Ross, I.J. Relative Humidity Effect on the High-Temperature Drying of Shelled Corn. Trans. ASAE 1973, 16, 1136–1139. [Google Scholar] [CrossRef]
  28. Yagcioglu, A.D.A.C.F. Drying characteristic of laurel leaves under different conditions. In Proceedings of the 7th International Congress on Agricultural Mechanization and Energy, Adana, Turkey, 26–27 May 1999; pp. 565–569. [Google Scholar]
  29. Castro, A.M.; Mayorga, E.Y.; Moreno, F.L. Mathematical modelling of convective drying of fruits: A review. J. Food Eng. 2018, 223, 152–167. [Google Scholar] [CrossRef]
  30. Hossain, M.A.; Evan, M.S.S.; Moazzem, M.S.; Roy, M.; Zzaman, W. Response Surface Optimization for Antioxidant Extraction from Jackfruit (Artocarpus heterophyllus Lam.) Seed and Pulp. J. Sci. Res. 2020, 12, 397–409. [Google Scholar] [CrossRef]
  31. Del Caro, A.; Piga, A.; Pinna, I.; Fenu, P.M.; Agabbio, M. Effect of Drying Conditions and Storage Period on Polyphenolic Content, Antioxidant Capacity, and Ascorbic Acid of Prunes. J. Agric. Food Chem. 2004, 52, 4780–4784. [Google Scholar] [CrossRef]
  32. Ahmed, S.; Jubair, A.; Hossain, M.A.; Hossain, M.M.; Azam, M.S.; Biswas, M. Free radical-scavenging capacity and HPLC-DAD screening of phenolic compounds from pulp and seed of Syzygium claviflorum fruit. J. Agric. Food Res. 2021, 6, 100203. [Google Scholar] [CrossRef]
  33. Taşkin, O.; İzli, G.; İzli, N. Convective drying kinetics and quality parameters of European Cranberrybush. Tarim Bilim. Derg. 2018, 24, 349–358. [Google Scholar] [CrossRef]
  34. Kek, S.P.; Chin, N.L.; Yusof, Y.A. Direct and indirect power ultrasound assisted pre-osmotic treatments in convective drying of guava slices. Food Bioprod. Process. 2013, 91, 495–506. [Google Scholar] [CrossRef]
  35. Garcia-Noguera, J.; Oliveira, F.I.P.; Gallão, M.I.; Weller, C.L.; Rodrigues, S.; Fernandes, F.A.N. Ultrasound-Assisted Osmotic Dehydration of Strawberries: Effect of Pretreatment Time and Ultrasonic Frequency. Dry. Technol. 2010, 28, 294–303. [Google Scholar] [CrossRef]
  36. Ispir, A.; Toǧrul, I.T. Osmotic dehydration of apricot: Kinetics and the effect of process parameters. Che. Eng. Res. Des. 2009, 87, 166–180. [Google Scholar] [CrossRef]
  37. Tao, Z.; Yang, Z.; Yu, F.; Yang, Z. Effect of ultrasound on heat pump drying characteristics of pea seeds. Int. J. Food Eng. 2018, 14, 20180204. [Google Scholar] [CrossRef]
  38. Li, L.; Yu, Y.; Xu, Y.; Wu, J.; Yu, Y.; Peng, J.; An, K.; Zou, B.; Yang, W. Effect of ultrasound-assisted osmotic dehydration pretreatment on the drying characteristics and quality properties of Sanhua plum (Prunus salicina L.). LWT 2021, 138, 110653. [Google Scholar] [CrossRef]
  39. Yildiz, G.; İzli, G. Influence of microwave and microwave-convective drying on the drying kinetics and quality characteristics of pomelo. J Food Process. Preserv. 2019, 43, e13812. [Google Scholar] [CrossRef]
  40. Thao, B.T.T.; Vo, T.T.K.; Tran, T.Y.N.; Le, D.T.; Tran, T.T.; Bach, L.G.; Dao, T.P. Application of mathematical techniques to study the moisture loss kinetics and polyphenol degradation kinetics of mango (Mangifera indica L.) slices during heat pump drying by pilot equipment. LWT 2023, 176, 114454. [Google Scholar] [CrossRef]
  41. Meisami-asl, E.; Rafiee, S.; Keyhani, A.; Tabatabaeefar, A. Determination of Suitable Thin Layer Drying Curve Model for Apple Slices (variety-Golab). Plant Omics 2010, 3, 103–108. [Google Scholar]
  42. López, J.; Uribe, E.; Vega-Gálvez, A.; Miranda, M.; Vergara, J.; Gonzalez, E.; Di Scala, K. Effect of air temperature on drying kinetics, vitamin c, antioxidant activity, total phenolic content, non-enzymatic browning and firmness of blueberries variety óneil. Food Bioproc. Technol. 2010, 3, 772–777. [Google Scholar] [CrossRef]
  43. Onwude, D.I.; Hashim, N.; Chen, G. Recent advances of novel thermal combined hot air drying of agricultural crops. Trends Food Sci. Technol. 2016, 57, 132–145. [Google Scholar] [CrossRef]
  44. Santos, N.C.; Almeida, R.L.J.; da Silva, G.M.; Monteiro, S.S.; André, A.M. Effect of ultrasound pre-treatment on the kinetics and thermodynamic properties of guava slices drying process. Innov. Food Sci. Emerg. Technol. 2020, 66, 102507. [Google Scholar] [CrossRef]
  45. Kaveh, M.; Jahanbakhshi, A.; Abbaspour-Gilandeh, Y.; Taghinezhad, E.; Moghimi, M.B.F. The effect of ultrasound pre-treatment on quality, drying, and thermodynamic attributes of almond kernel under convective dryer using ANNs and ANFIS network. J. Food Process Eng. 2018, 41, e12868. [Google Scholar] [CrossRef]
  46. Bai, J.W.; Gao, Z.J.; Xiao, H.W.; Wang, X.T.; Zhang, Q. Polyphenol oxidase inactivation and vitamin C degradation kinetics of Fuji apple quarters by high humidity air impingement blanching. Int. J. Food Sci. Technol. 2013, 48, 1135–1141. [Google Scholar] [CrossRef]
  47. Vega-Gálvez, A.; Di Scala, K.; Rodríguez, K.; Lemus-Mondaca, R.; Miranda, M.; López, J.; Perez-Won, M. Effect of air-drying temperature on physico-chemical properties, antioxidant capacity, colour and total phenolic content of red pepper (Capsicum annuum, L. var. Hungarian). Food Chem. 2009, 117, 647–653. [Google Scholar] [CrossRef]
  48. Santos, P.H.S.; Silva, M.A. Retention of Vitamin C in Drying Processes of Fruits and Vegetables—A Review. Dry. Technol. 2008, 26, 1421–1437. [Google Scholar] [CrossRef]
  49. Hsieh, Y.H.P.; Harris, N.D. Effect of Sucrose on Oxygen Uptake of Ascorbic Acid in a Closed Aqueous System. J. Agric. Food Chem. 1993, 41, 259–262. [Google Scholar] [CrossRef]
  50. Kamiloglu, S.; Toydemir, G.; Boyacioglu, D.; Beekwilder, J.; Hall, R.D.; Capanoglu, E.A. Review on the Effect of Drying on Antioxidant Potential of Fruits and Vegetables. Crit. Rev. Food Sci. Nutr. 2016, 56, S110–S129. [Google Scholar] [CrossRef]
  51. Cao, X.; Islam, M.N.; Zhong, S.; Pan, X.; Song, M.; Shang, F.; Nie, H.; Xu, W.; Duan, Z. Drying kinetics, antioxidants, and physicochemical properties of litchi fruits by ultrasound-assisted hot air-drying. J. Food Biochem. 2020, 44, e13073. [Google Scholar] [CrossRef]
  52. Shi, J.; Le Maguer, M. Lycopene in Tomatoes: Chemical and Physical Properties Affected by Food Processing. Crit. Rev. Food Sci. Nutr. 2000, 40, 1–42. [Google Scholar] [CrossRef]
  53. Krishnan, K.R.; Rayaguru, K.; Nayak, P.K. Ultra-sonicated vacuum drying’s effect on antioxidant activity, TPC, TFC and color of elephant apple slices: Drying of elephant apple. Food Biosci. 2020, 36, 100629. [Google Scholar] [CrossRef]
  54. Shang, J.; Zhang, Q.; Wang, T.; Xu, Y.; Zang, Z.; Wan, F.; Yue, Y.; Huang, X. Effect of Ultrasonic Pretreatment on the Far-Infrared Drying Process and Quality Characteristics of Licorice. Foods 2023, 12, 2414. [Google Scholar] [CrossRef] [PubMed]
  55. Ren, F.; Perussello, C.A.; Zhang, Z.; Kerry, J.P.; Tiwari, B.K. Impact of ultrasound and blanching on functional properties of hot-air dried and freeze-dried onions. LWT 2018, 87, 102–111. [Google Scholar] [CrossRef]
  56. Liu, Y.; Zeng, Y.; Wang, Q.; Sun, C.; Xi, H. Drying characteristics, microstructure, glass transition temperature, and quality of ultrasound-strengthened hot air drying on pear slices. J. Food Process. Preserv. 2019, 43, e13899. [Google Scholar] [CrossRef]
  57. Zhou, L.; Cao, Z.; Bi, J.; Yi, J.; Chen, Q.; Wu, X.; Zhou, M. Degradation kinetics of total phenolic compounds, capsaicinoids and antioxidant activity in red pepper during hot air and infrared drying process. Int. J. Food Sci. Technol. 2016, 51, 842–853. [Google Scholar] [CrossRef]
  58. Saeed, N.; Khan, M.R.; Shabbir, M. Antioxidant activity, total phenolic and total flavonoid contents of whole plant extracts Torilis leptophylla L. BMC Complement. Altern. Med. 2012, 12, 221. [Google Scholar] [CrossRef]
  59. Li, M.; Pare, P.W.; Zhang, J.; Kang, T.; Zhang, Z.; Yang, D.; Wang, K.; Xing, H. Antioxidant capacity connection with phenolic and flavonoid content in Chinese medicinal herbs. Rec. Nat. Prod. 2018, 12, 239–250. [Google Scholar] [CrossRef]
  60. Alonzo-Macías, M.; Cardador-Martínez, A.; Mounir, S.; Montejano-Gaitán, G.; Allaf, K. Comparative Study of the Effects of Drying Methods on Antioxidant Activity of Dried Strawberry (Fragaria Var. Camarosa). J. Food Res. 2013, 2, 92–107. [Google Scholar] [CrossRef]
  61. García-Moreira, D.P.; Hernández-Guzmán, H.; Pacheco, N.; Cuevas-Bernardino, J.C.; Herrera-Pool, E.; Moreno, I.; López-Vidaña, E.C. Solar and Convective Drying: Modeling, Color, Texture, Total Phenolic Content, and Antioxidant Activity of Peach (Prunus persica (L.) Batsch) Slices. Processes 2023, 11, 1280. [Google Scholar] [CrossRef]
  62. Chobot, M.; Kozłowska, M.; Ignaczak, A.; Kowalska, H. Development of drying and roasting processes for the production of plant-based pro-healthy snacks in the light of nutritional trends and sustainable techniques. Trends Food Sci. Technol. 2024, 149, 104553. [Google Scholar] [CrossRef]
  63. Yulni, T.; Agusta, W.; Jayanegara, A.; Alfa, M.N.; Hartono, L.K.; Mariastuty, T.E.P.; Hermansyah, H.D.; Fauziah, P.Y.; Anggraeni, D.; Lintang, M.M.J. Unveiling the Influence of Osmotic Pretreatment on Dried Fruit Characteristics: A Meta-Analysis Approach. Prev. Nutr. Food Sci. 2024, 29, 178. [Google Scholar] [CrossRef]
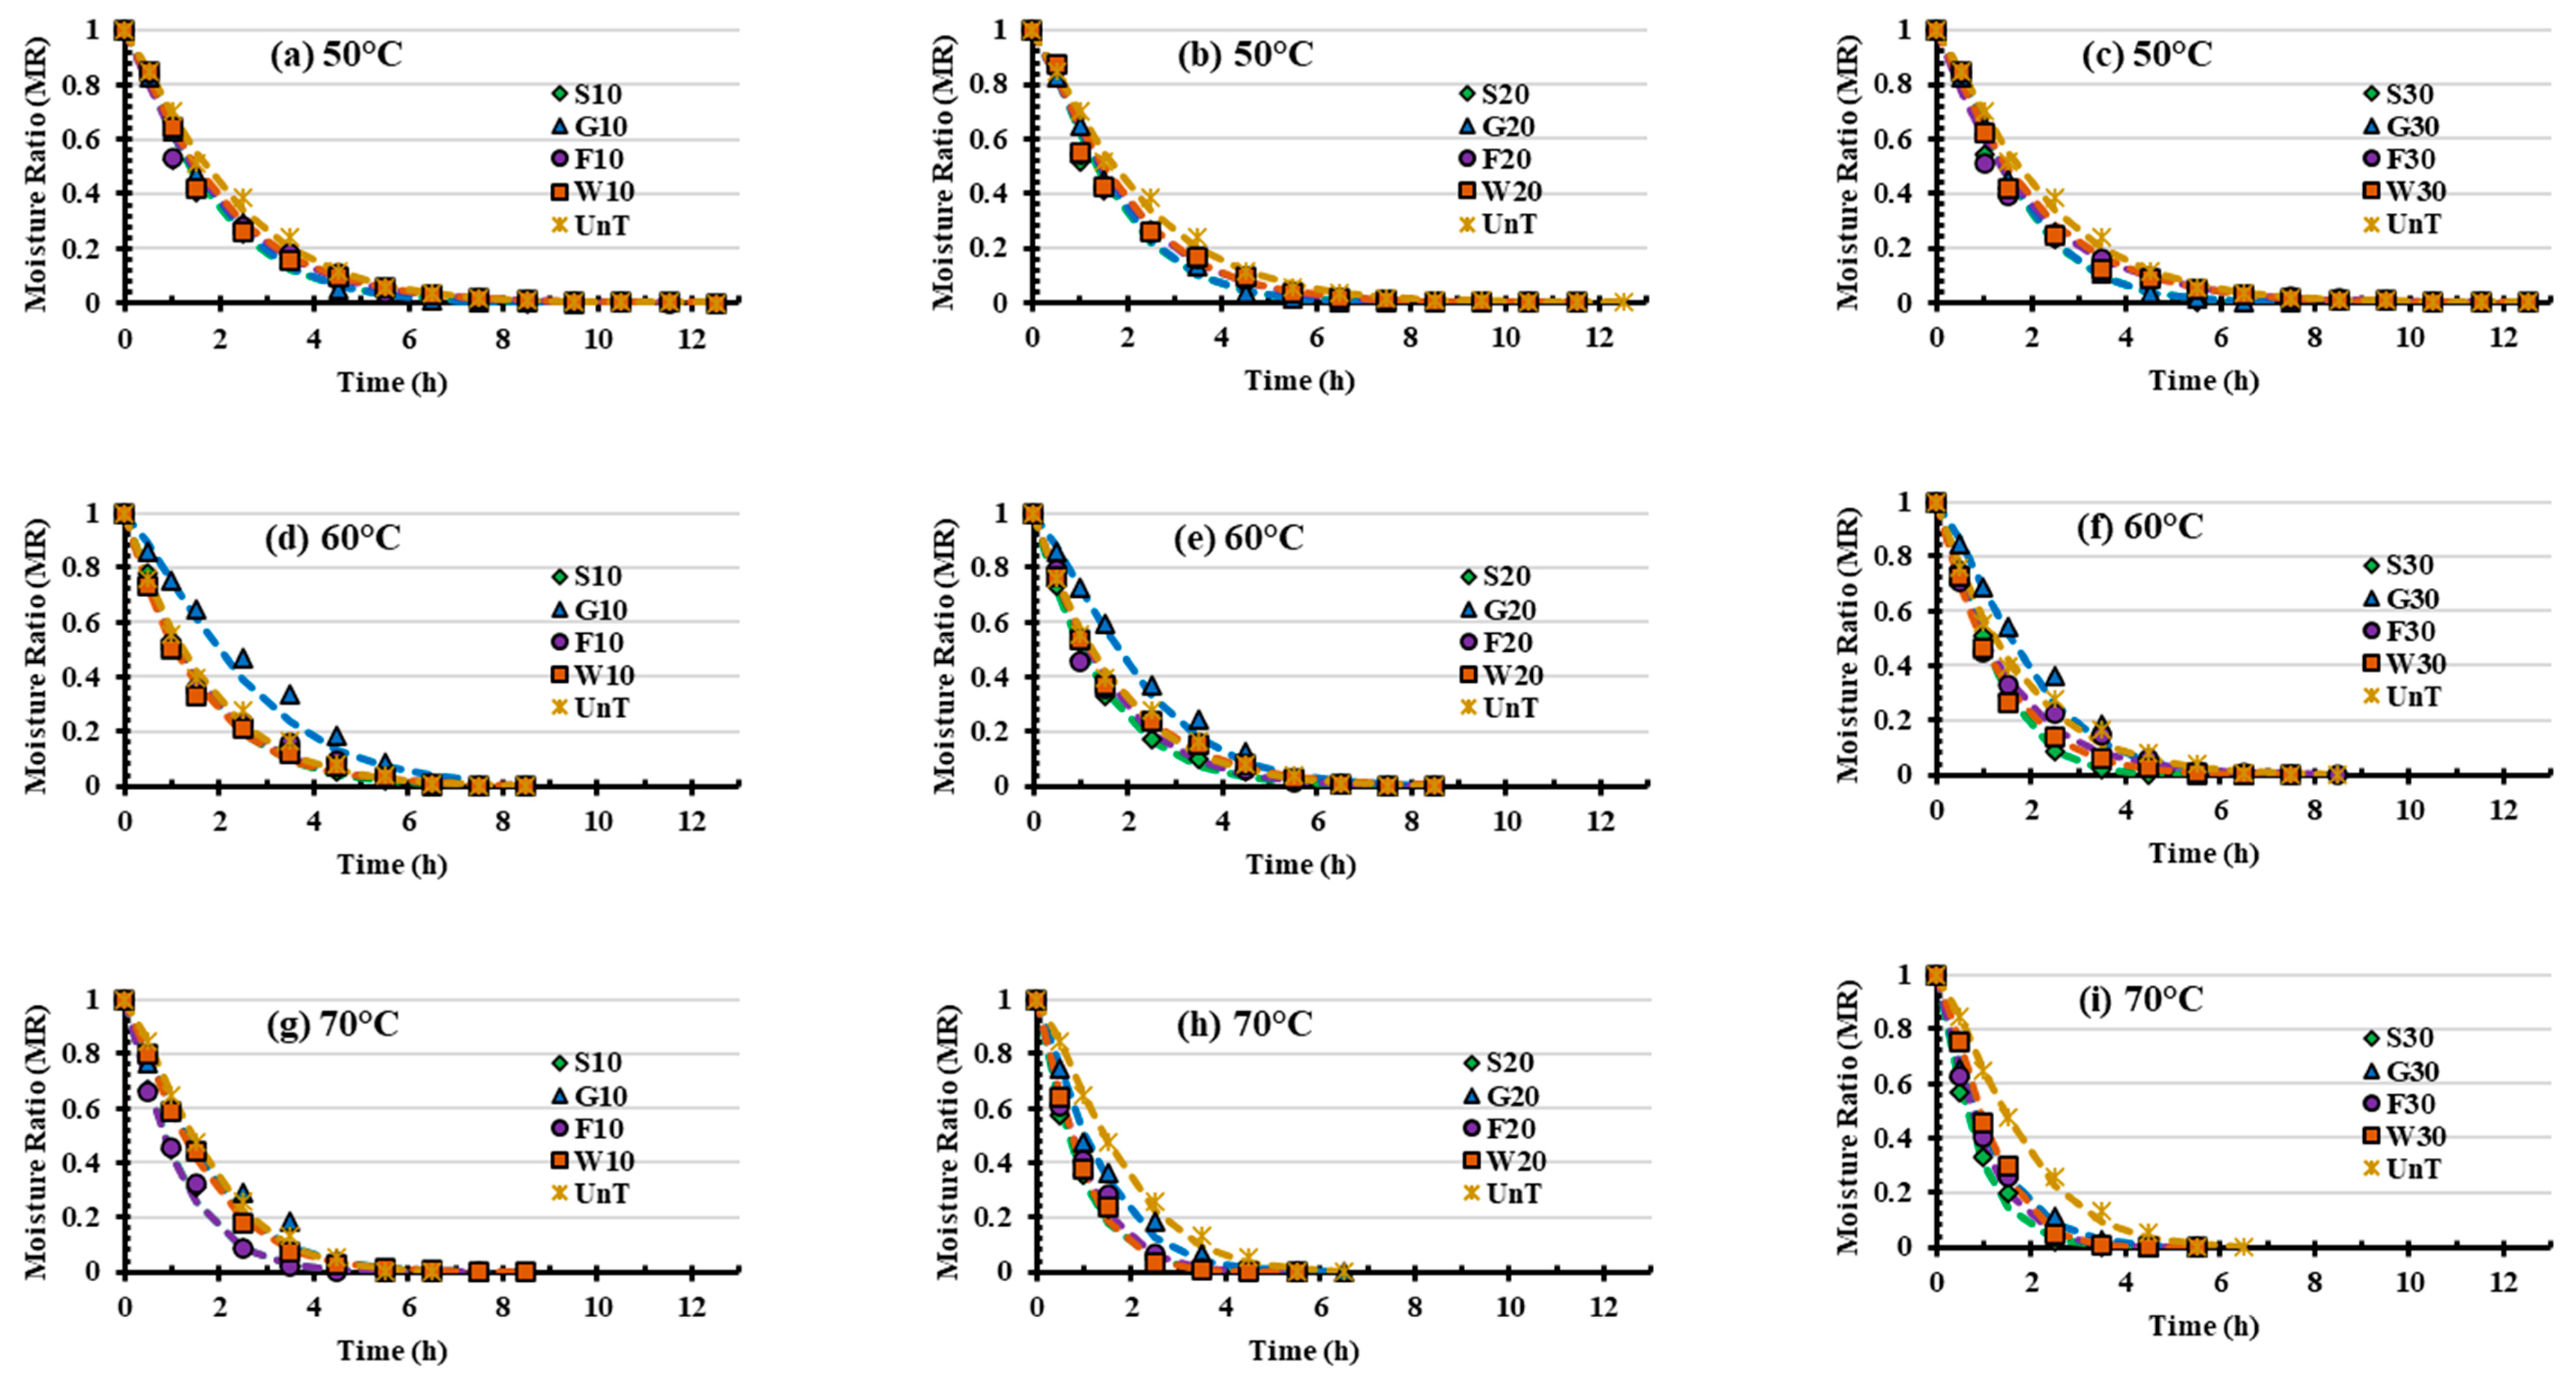
Figure 1. Drying kinetics of Satkara subjected to different US-OP conditions at (50, 60, and 70 °C). The dotted lines show the best model (Page) fit curves. S (sucrose), G (glucose), F (fructose), and W (distilled water) represent the four types of osmotic solution used. The numbers 10, 20, and 30 denote the duration (min) of the application of ultrasound. UT indicates the untreated sample.
Processes 13 00384 g001
Figure 2. Changes in vitamin C content in different US-OP conditions during Satkara drying. Different letters at the top of the bars indicate significant differences among samples.
Processes 13 00384 g002
Figure 3. Changes in total phenolic content (TPC) in different US-OP conditions during Satkara drying. Different letters at the top of the bars indicate significant differences among samples.
Processes 13 00384 g003
Figure 4. Changes in total flavonoid content (TFC) in different US-OP conditions during Satkara drying. Different letters at the top of the bars indicate significant differences among samples.
Processes 13 00384 g004
Figure 5. Changes in DPPH radical inhibition capacity (%) in different US-OP conditions during Satkara drying. Different letters at the top of the bars indicate significant differences among samples.
Processes 13 00384 g005
Figure 6. Pearson Correlation analysis with matrix plot (95% CI) of TPC, TFC, and DPPH for Satkara drying subjected to different US-OP conditions.
Processes 13 00384 g006
Table 1. Different US-OP conditions and their respective symbols.
Group SymbolsPretreatment Conditions
UTNeither osmotic nor sonication treatment was involved
S1010% Sucrose solution with 10 min sonication
G1010% Glucose solution with 10 min sonication
F1010% Fructose solution with 10 min sonication
W10Water with 10 min sonication
S2010% Sucrose solution with 20 min sonication
G2010% Glucose solution with 20 min sonication
F2010% Fructose solution with 20 min sonication
W20Water with 20 min sonication
S3010% Sucrose solution with 30 min sonication
G3010% Glucose solution with 30 min sonication
F3010% Fructose solution with 30 min sonication
W30Water with 30 min sonication
Table 2. Four thin layer models assessed in this study.
Name of the ModelEquationReferences
PageMR = exp (−ktn)[25]
NewtonMR = exp (−kt)[26]
Handerson and PabisMR = a exp (−kt)[27]
LogarithmicMR = a exp (−kt) + c[28]
MR is the moisture ratio; t is the drying time (h); k, n, a, and c are the model constants.
Table 3. Model constants and statistical parameter values obtained for different mathematical models evaluated during Satkara drying.
Tem.Pre-TreatmentPage ModelNewton ModelHenderson and Pabis Model Logarithmic Model
knR2RMSEχ2kR2RMSEχ2kaR2RMSEχ2akcR2RMSEχ2
50 °CUT0.36821.17140.9970.01840.00040.53540.97170.05610.00340.56720.77820.83380.13580.02131.24140.76860.09380.88890.1110.0154
S100.48631.15920.98910.03520.00150.64590.98290.0440.00210.68670.80920.87390.11950.01750.96360.70480.08130.9710.05730.0045
G100.44041.22260.9980.01550.00030.6790.95860.06960.00530.73710.71140.72870.17830.03821.02680.65390.07180.9690.06030.0049
F100.47671.07490.98990.03220.00120.5520.99130.02980.00090.5641.09000.98560.03840.00171.0110.70650.0780.96650.05860.0044
W100.44181.10330.99390.02540.00070.53650.99290.02730.00080.54270.95250.98370.04130.0021.10250.73050.05970.96810.05790.0042
S200.47611.26260.98420.04310.00230.76520.94860.07790.00670.86041.53480.71160.18440.04251.16151.1580.06330.56930.22540.0726
G200.44371.31980.99740.01810.00040.78230.92070.09980.01110.88780.62200.51120.24770.07671.11850.80020.08030.94270.08480.008
F200.44821.16980.98890.03490.00140.61480.98440.04140.00190.64170.83850.910.09950.01171.1970.87810.07660.92870.08860.0102
W200.43401.17980.98830.03560.00150.61050.98350.04230.00190.63130.86090.92610.08940.0081.05420.69150.05510.97680.05010.0032
S300.46991.2970.98860.03720.00180.76780.94540.08140.00750.87170.67280.59380.22190.06331.07190.6770.02530.98470.0430.0028
G300.44311.33980.99820.01530.00030.80330.91420.10440.010.91310.61010.48890.25480.08121.24740.93170.07840.8870.11980.0205
F300.51441.02130.98850.03340.00130.52490.9890.03270.00120.51651.06850.97650.04790.00261.17460.93390.08560.92630.08470.009
W300.45751.09480.99370.02560.00080.53970.99340.02630.00070.53771.01580.99450.02410.00071.18080.75420.03650.96530.06030.0045
60 °CUT0.55641.08230.99340.02640.00090.69050.97870.04760.00280.7530.72340.77590.15450.02921.25770.95020.07520.87280.11640.0187
S100.58651.11870.99160.03060.00120.74810.98240.04420.00220.80760.76540.82760.13850.0240.98030.81730.0780.97540.05240.0039
G100.28551.29330.98160.04750.00280.56980.83230.1430.02270.69620.56630.11760.32820.13461.03990.47550.0940.94160.08450.0102
F100.60721.03970.99370.02550.00080.69830.98830.03470.00130.75290.75340.83990.12860.02020.92060.62690.04120.98890.03380.0016
W100.64881.02560.99620.01990.00050.71240.99450.02380.00060.75280.81120.91180.09540.01110.9670.74170.04480.99210.02850.0011
S200.67931.06810.99670.01870.00040.79660.99260.02780.00090.84760.76780.86940.1170.01671.01220.80530.03060.99410.0240.0009
G200.32251.3430.99290.03010.00110.62990.88330.1220.01650.7430.60120.33870.29020.10531.18920.67810.08870.90350.11120.0177
F200.58851.12090.98470.0410.0020.75970.97650.05030.00280.82080.72850.79570.14820.02690.88590.71260.08020.96310.0630.0055
W200.57381.0290.99630.01990.00050.73280.98020.04610.00230.80090.70280.75780.16120.03181.04540.76550.0550.98020.04610.0029
S300.70701.36890.99970.00670.0011.1380.91930.10210.11911.27160.65840.58690.23090.07111.4951.6330.07170.64770.21330.0728
G300.37281.39790.98550.04320.00240.77580.83030.14780.02460.93630.54210.14830.3310.14091.04850.61310.08610.94570.08360.0105
F300.69221.0310.990.03160.00120.78430.98520.03850.00160.84170.74270.83940.12690.01970.87820.82230.09620.96080.06270.0054
W300.74461.07860.99710.0180.00040.83460.99470.02420.00070.84960.93460.98010.0470.00281.44761.43050.05280.75870.16360.0382
70 °CUT0.42261.37620.99750.01790.00040.79870.89560.11560.0150.93560.59310.37150.28370.10351.13750.78970.07370.94020.08750.0115
S100.82891.1940.99650.02010.00051.1240.95920.06840.00531.2120.71460.75140.1670.03670.90230.9820.10830.94190.08170.01
G100.50411.24680.98460.04230.00220.85860.88910.11350.014310.52910.31320.28250.09980.95130.64030.08680.96350.06510.0061
F100.84021.16760.99490.02370.00071.09550.96470.06250.00431.13840.82440.87610.11710.01711.36521.54530.06770.78820.1530.0335
W100.53051.24810.99920.01010.00010.81390.95290.07540.00630.87230.73900.76090.16990.03531.010.87740.07460.94810.07920.0086
S201.08991.14650.99490.02390.00081.36310.97230.05580.00361.47120.71280.78030.1570.03291.48071.86340.03760.67420.19120.0585
G200.65651.24950.99380.0270.00091.01340.93510.08720.00861.14650.60180.52590.23580.07150.97450.85730.07630.97270.05660.0048
F200.95871.18760.99060.03280.00141.29140.94940.08780.00671.42790.65240.65520.19840.05250.86791.1150.12240.93460.08650.012
W201.00661.2670.99680.01960.00051.42010.94350.0820.00771.53820.69110.70840.18620.04630.98211.08020.04380.98360.04420.0031
S301.17261.19690.9950.02430.00081.48630.96590.06350.00471.62110.71920.76390.1670.03910.94261.36940.08280.97130.05820.0059
G300.84821.15710.99720.01810.00041.09230.96890.060.0041.19810.71820.74640.1710.0391.11221.26720.07450.94010.08310.0111
F300.98281.24340.99410.02630.00091.360.94470.08080.00751.4740.69980.71640.1830.04460.91621.23160.1190.93450.08790.0124
W300.76031.46660.99770.01740.00041.36550.87320.1290.0191.53150.59480.46610.26480.09350.98920.98190.08270.430.08160.0106
Table 4. Activation energy (Ea) and Arrhenius factor (A) for k parameter of Page model fit of Satkara drying under different pretreatment conditions.
Pretreatment ConditionEa (kJ/mol)A (min−n)R2
UT16.661.590.61
S1024.498.370.97
G1015.751.160.54
F1026.058.940.98
W1018.72.510.64
S2038.0813.420.99
G2017.565.560.78
F2034.9112.160.96
W2038.6113.490.95
S3042.0614.890.99
G3029.449.980.54
F3029.7810.410.64
W3023.68.080.79
Disclaimer/Publisher’s Note: The statements, opinions and data contained in all publications are solely those of the individual author(s) and contributor(s) and not of MDPI and/or the editor(s). MDPI and/or the editor(s) disclaim responsibility for any injury to people or property resulting from any ideas, methods, instructions or products referred to in the content.