
NADES-in-Oil Emulsions Enriched with Essential Oils for Cosmetic Application

 , , ,
, , ,  , ,
, ,  ,
,  ,
,  ,
,  ,
,  ,
,  , ,
, ,  and
and 
Abstract

1. Introduction
2. Materials and Methods
2.1. Materials
2.2. Methods
2.2.1. NADES Preparation
2.2.2. Translucent NADES-in-Oil Emulsions (TEs) Preparation
2.2.3. Total Phenolic Content
2.2.4. Total Flavonoid Content (TFC)
2.2.5. Antioxidant Activity
DPPH Assay
ABTS Assay
Ferric Reducing Antioxidant Power (FRAP) Assay
2.2.6. Chelating Power
2.2.7. Tyrosinase Inhibition Assay
2.2.8. Elastase Inhibition Assay
2.2.9. Identification of Compounds Present in Essential Oils
Gas Chromatography–Mass Spectrometry (GC-MS)
Liquid Chromatography–Mass Spectrometry (LC-MS)
2.2.10. Characterization and Stability of TEs
TEs Organoleptic Properties
TEs Accelerated Stability
TEs Size, Dispersity, and Charge
TEs Texture Evaluation
TEs Viscoelastic Properties
Thermogravimetric Analysis (TGA)
2.2.11. Skin Permeation Studies
2.2.12. Antimicrobial Activity
2.2.13. Galleria mellonella Assays
2.2.14. Statistical Analysis
3. Results and Discussion
3.1. TE Preparation and Chemical Composition
3.2. Physico-Chemical Properties of TEs
3.3. Transdermal Permeation of TEs
3.4. Antimicrobial Activity of the Essential Oils and TEs
3.5. Effect of NADES-Extracts and TEs on the Health Index of Galleria mellonella and on the Melanization Phenomenon
4. Conclusions
Supplementary Materials
Author Contributions
Funding
Data Availability Statement
Conflicts of Interest
References
- Abbott, A.P.; Barron, J.C.; Ryder, K.S.; Wilson, D. Eutectic-Based Ionic Liquids with Metal-Containing Anions and Cations. Chem.—Eur. J. 2007, 13, 6495–6501. [Google Scholar] [CrossRef]
- Dai, Y.; van Spronsen, J.; Witkamp, G.-J.; Verpoorte, R.; Choi, Y.H. Natural deep eutectic solvents as new potential media for green technology. Anal. Chim. Acta 2013, 766, 61–68. [Google Scholar] [CrossRef] [PubMed]
- Dai, Y.; Verpoorte, R.; Choi, Y.H. Natural deep eutectic solvents providing enhanced stability of natural colorants from safflower (Carthamus tinctorius). Food Chem. 2014, 159, 116–121. [Google Scholar] [CrossRef] [PubMed]
- Dai, Y.; Witkamp, G.-J.; Verpoorte, R.; Choi, Y.H. Tailoring properties of natural deep eutectic solvents with water to facilitate their applications. Food Chem. 2015, 187, 14–19. [Google Scholar] [CrossRef] [PubMed]
- Cunha, S.C.; Fernandes, J.O. Extraction techniques with deep eutectic solvents. TrAC Trends Anal. Chem. 2018, 105, 225–239. [Google Scholar] [CrossRef]
- Cheng, H.; Qi, Z. Applications of deep eutectic solvents for hard-to-separate liquid systems. Sep. Purif. Technol. 2021, 274, 119027. [Google Scholar] [CrossRef]
- Wawoczny, A.; Gillner, D. The Most Potent Natural Pharmaceuticals, Cosmetics, and Food Ingredients Isolated from Plants with Deep Eutectic Solvents. J. Agric. Food Chem. 2023, 71, 10877–10900. [Google Scholar] [CrossRef]
- Villa, C.; Caviglia, D.; Robustelli della Cuna, F.S.; Zuccari, G.; Russo, E. NaDES Application in Cosmetic and Pharmaceutical Fields: An Overview. Gels 2024, 10, 107. [Google Scholar] [CrossRef]
- Rente, D.; Cvjetko Bubalo, M.; Panić, M.; Paiva, A.; Caprin, B.; Radojčić Redovniković, I.; Duarte, A.R.C. Review of deep eutectic systems from laboratory to industry, taking the application in the cosmetics industry as an example. J. Clean. Prod. 2022, 380, 135147. [Google Scholar] [CrossRef]
- Benoit, C.; Virginie, C.; Boris, V. Chapter Twelve—The use of NADES to support innovation in the cosmetic industry. In Advances in Botanical Research; Verpoorte, R., Witkamp, G.-J., Choi, Y.H., Eds.; Academic Press: Cambridge, MA, USA, 2021; Volume 97, pp. 309–332. [Google Scholar]
- Chen, C.; Wang, Y.; Jiang, W.; Zhu, C.; Yao, S. Transdermal release behaviors of bioactive deep eutectic solvents as natural skin care and mechanism. J. Mol. Liq. 2022, 367, 120412. [Google Scholar] [CrossRef]
- Vasyliev, G.; Lyudmyla, K.; Hladun, K.; Skiba, M.; Vorobyova, V. Valorization of tomato pomace: Extraction of value-added components by deep eutectic solvents and their application in the formulation of cosmetic emulsions. Biomass Convers. Biorefinery 2022, 12, 95–111. [Google Scholar] [CrossRef]
- Rocha, D.; Freitas, D.S.; Magalhães, J.; Fernandes, M.; Silva, S.; Noro, J.; Ribeiro, A.; Cavaco-Paulo, A.; Martins, M.; Silva, C. NADES-Based Cork Extractives as Green Ingredients for Cosmetics and Textiles. Processes 2023, 11, 309. [Google Scholar] [CrossRef]
- Freitas, D.S.; Rocha, D.; Santos, J.; Noro, J.; Tavares, T.D.; Teixeira, M.O.; Araújo, D.; Castro, J.; Silva, S.; Felgueiras, H.P.; et al. Developing translucent emulsions using sustainable NADES-based extracts. J. Mol. Liq. 2024, 415, 126413. [Google Scholar] [CrossRef]
- Firmino, J.P.; Fernández-Alacid, L.; Vallejos-Vidal, E.; Salomón, R.; Sanahuja, I.; Tort, L.; Ibarz, A.; Reyes-López, F.E.; Gisbert, E. Carvacrol, Thymol, and Garlic Essential Oil Promote Skin Innate Immunity in Gilthead Seabream (Sparus aurata) Through the Multifactorial Modulation of the Secretory Pathway and Enhancement of Mucus Protective Capacity. Front. Immunol. 2021, 12, 633621. [Google Scholar] [CrossRef]
- Freitas, D.S.; Rocha, D.; Castro, T.G.; Noro, J.; Castro, V.I.B.; Teixeira, M.A.; Reis, R.L.; Cavaco-Paulo, A.; Silva, C. Green Extraction of Cork Bioactive Compounds Using Natural Deep Eutectic Mixtures. ACS Sustain. Chem. Eng. 2022, 10, 7974–7989. [Google Scholar] [CrossRef]
- Pavlić, B.; Mrkonjić, Ž.; Teslić, N.; Kljakić, A.C.; Pojić, M.; Mandić, A.; Stupar, A.; Santos, F.; Duarte, A.R.C.; Mišan, A. Natural Deep Eutectic Solvent (NADES) Extraction Improves Polyphenol Yield and Antioxidant Activity of Wild Thyme (Thymus serpyllum L.) Extracts. Molecules 2022, 27, 1508. [Google Scholar] [CrossRef] [PubMed]
- Zhishen, J.; Mengcheng, T.; Jianming, W. The determination of flavonoid contents in mulberry and their scavenging effects on superoxide radicals. Food Chem. 1999, 64, 555–559. [Google Scholar] [CrossRef]
- Re, R.; Pellegrini, N.; Proteggente, A.; Pannala, A.; Yang, M.; Rice-Evans, C. Antioxidant activity applying an improved ABTS radical cation decolorization assay. Free. Radic. Biol. Med. 1999, 9–10, 1231–1237. [Google Scholar] [CrossRef]
- Bounatirou, S.; Smiti, S.; Miguel, M.G.; Faleiro, L.; Rejeb, M.N.; Neffati, M.; Costa, M.M.; Figueiredo, A.C.; Barroso, J.G.; Pedro, L.G. Chemical composition, antioxidant and antibacterial activities of the essential oils isolated from Tunisian Thymus capitatus Hoff. et Link. Food Chem. 2007, 105, 146–155. [Google Scholar] [CrossRef]
- Carrasco, A.; Martinez-Gutierrez, R.; Tomas, V.; Tudela, J. Lavandula angustifolia and Lavandula latifolia Essential Oils from Spain: Aromatic Profile and Bioactivities. Planta Med. 2016, 82, 163–170. [Google Scholar] [CrossRef]
- Di Petrillo, A.; González-Paramás, A.M.; Era, B.; Medda, R.; Pintus, F.; Santos-Buelga, C.; Fais, A. Tyrosinase inhibition and antioxidant properties of Asphodelus microcarpus extracts. Complement. Altern. Med. 2016, 16, 453. [Google Scholar] [CrossRef] [PubMed]
- Ndlovu, G.; Fouche, G.; Tselanyane, M.; Cordier, W.; Steenkamp, V. In vitro determination of the anti-aging potential of four southern African medicinal plants. BMC Complement. Altern. Med. 2013, 13, 304. [Google Scholar] [CrossRef] [PubMed]
- Santos, S.A.O.; Villaverde, J.J.; Sousa, A.F.; Coelho, J.F.J.; Neto, C.P.; Silvestre, A.J.D. Phenolic composition and antioxidant activity of industrial cork by-products. Ind. Crops Prod. 2013, 47, 262–269. [Google Scholar] [CrossRef]
- Freitas, D.S.; Quesado, V.; Rocha, D.; Noro, J.; Martins, M.; Cavaco-Paulo, A.; Silva, C. Lipase-Catalysed Polymerization of Eutectic Mixtures. ChemSusChem 2023, 16, e202202374. [Google Scholar] [CrossRef]
- Bauer, A.W.; Kirby, W.M.; Sherris, J.C.; Turck, M. Antibiotic susceptibility testing by a standardized single disk method. Am. J. Clin. Pathol. 1966, 45, 493–496. [Google Scholar] [CrossRef]
- European Committee for Antimicrobial Susceptibility Testing (EUCAST) of the European Society of Clinical Microbiology and Infectious Diseases (ESCMID). Determination of minimum inhibitory concentrations (MICs) of antibacterial agents by broth dilution. Clin. Microbiol. Infect. 2003, 9, ix–xv. [Google Scholar] [CrossRef]
- Araújo, D.; Mil-Homens, D.; Henriques, M.; Silva, S. Anti-EFG1 2′-OMethylRNA oligomer inhibits Candida albicans filamentation and attenuates the candidiasis in Galleria mellonella. Mol. Ther. Nucleic Acids 2022, 27, 517–523. [Google Scholar] [CrossRef]
- Tsai, C.J.-Y.; Loh, J.M.S.; Proft, T. Galleria mellonella infection models for the study of bacterial diseases and for antimicrobial drug testing. Virulence 2016, 7, 214–229. [Google Scholar] [CrossRef]
- Serrano, I.; Verdial, C.; Tavares, L.; Oliveira, M. The Virtuous Galleria mellonella Model for Scientific Experimentation. Antibiotics 2023, 12, 505. [Google Scholar] [CrossRef]
- Gallorini, M.; Marinacci, B.; Pellegrini, B.; Cataldi, A.; Dindo, M.L.; Carradori, S.; Grande, R. Immunophenotyping of hemocytes from infected Galleria mellonella larvae as an innovative tool for immune profiling, infection studies and drug screening. Sci. Rep. 2024, 14, 759. [Google Scholar] [CrossRef]
- Saeed, N.; Khan, M.R.; Shabbir, M. Antioxidant activity, total phenolic and total flavonoid contents of whole plant extracts Torilis leptophylla L. BMC Complement. Altern. Med. 2012, 12, 221. [Google Scholar] [CrossRef] [PubMed]
- Gullón, B.; Muñiz-Mouro, A.; Lú-Chau, T.A.; Moreira, M.T.; Lema, J.M.; Eibes, G. Green approaches for the extraction of antioxidants from eucalyptus leaves. Ind. Crops Prod. 2019, 138, 111473. [Google Scholar] [CrossRef]
- Jamaleddine, A.; Urrutigoïty, M.; Bouajila, J.; Merah, O.; Evon, P.; de Caro, P. Ecodesigned Formulations with Tomato Pomace Extracts. Cosmetics 2023, 10, 7. [Google Scholar] [CrossRef]
- Wirtu, S.F.; Ramaswamy, K.; Maitra, R.; Chopra, S.; Mishra, A.K.; Jule, L.T. Isolation, characterization and antimicrobial activity study of Thymus vulgaris. Sci. Rep. 2024, 14, 21573. [Google Scholar] [CrossRef]
- Tejada-Muñoz, S.; Cortez, D.; Rascón, J.; Chavez, S.G.; Caetano, A.C.; Díaz-Manchay, R.J.; Sandoval-Bances, J.; Huyhua-Gutierrez, S.; Gonzales, L.; Chenet, S.M.; et al. Antimicrobial Activity of Origanum vulgare Essential Oil against Staphylococcus aureus and Escherichia coli. Pharmaceuticals 2024, 17, 1430. [Google Scholar] [CrossRef]
- Tavares, T.D.; Antunes, J.C.; Padrão, J.; Ribeiro, A.I.; Zille, A.; Amorim, M.T.P.; Ferreira, F.; Felgueiras, H.P. Activity of Specialized Biomolecules against Gram-Positive and Gram-Negative Bacteria. Antibiotics 2020, 9, 314. [Google Scholar] [CrossRef]
- Rota, M.C.; Herrera, A.; Martínez, R.M.; Sotomayor, J.A.; Jordán, M.J. Antimicrobial activity and chemical composition of Thymus vulgaris, Thymus zygis and Thymus hyemalis essential oils. Food Control 2008, 19, 681–687. [Google Scholar] [CrossRef]
- Allegra, E.; Titball, R.W.; Carter, J.; Champion, O.L. Galleria mellonella larvae allow the discrimination of toxic and non-toxic chemicals. Chemosphere 2018, 198, 469–472. [Google Scholar] [CrossRef]
- Fernandes, L.; Barco-Tejada, A.; Blazquez, E.; Araujo, D.; Ribeiro, A.; Silva, S.; Cusso, L.; Costa-de-Oliveira, S.; Rodrigues, M.E.; Henriques, M. Development and Evaluation of Microencapsulated Oregano Essential Oil as an Alternative Treatment for Candida albicans Infections. ACS Appl. Mater. Interfaces 2024, 16, 40628–40640. [Google Scholar] [CrossRef]
- Brożyna, M.; Dudek, B.; Kozłowska, W.; Malec, K.; Paleczny, J.; Detyna, J.; Fabianowska-Majewska, K.; Junka, A. The chronic wound milieu changes essential oils’ antibiofilm activity—An in vitro and larval model study. Sci. Rep. 2024, 14, 2218. [Google Scholar] [CrossRef]


| Essential Oil | Abbreviation | TE-Oil |
|---|---|---|
| Olive oil | OlO | TE-OlO |
| Thyme oil | TO | TE-TO |
| Oregano oil | OrO | TE-OrO |
| Thyme:oregano oil (50:50 wt.%) | TO:OrO | TE-TO:OrO |
| LA:GLY Ratio (LA:GLY) | Phenolic Content (mgGA/g) | Flavonoids Content (mgQ/g) | Chelating Power (mgEDTA/g) | DPPH (mgTE/g) | FRAP (mgFe2+/g) | ABTS (mgTE/g) | |
|---|---|---|---|---|---|---|---|
| Oil | |||||||
| OlO | --- | 5.2 ± 1.2 | 3.6 ± 0.9 | 28.6 ± 1.0 | 44.8 ± 1.5 | 27.8 ± 2.5 | 94.2 ± 2.1 |
| TO | --- | 23.8 ± 1.0 | 20.7 ± 1.0 | 26.9 ± 1.5 | 179.5 ± 1.1 | 291.8 ± 2.9 | 507.7 ± 1.9 |
| OrO | --- | 26.4 ± 0.5 | 11.4 ± 1.2 | 25.2 ± 1.4 | 196.3 ± 1.3 | 372.1 ± 2.0 | 515.2 ± 2.6 |
| TO:OrO | --- | 29.2 ± 0.8 | 17.0 ± 0.8 | 27.0 ± 1.0 | 183.3 ± 1.2 | 374.3 ± 2.2 | 509.2 ± 2.3 |
| TE | |||||||
| TE-OlO | 1:1 | 16.0 ± 2.0 | 1.1 ± 0.6 | 29.4 ± 0.5 | 58.8 ± 2.2 | 23.1 ± 2.0 | 105.5 ± 2.1 |
| 1:4 | 17.0 ± 1.3 | 1.3 ± 0.8 | 12.6 ± 0.9 | 58.2 ± 2.1 | 25.1 ± 1.8 | 105.6 ± 1.8 | |
| TE-TO | 1:1 | 21.1 ± 1.2 | 13.7 ± 1.1 | 22.0 ± 1.0 | 123.8 ± 1.5 | 30.3 ± 1.5 | 172.0 ± 1.6 |
| 1:4 | 22.0 ± 0.9 | 13.9 ± 1.0 | 15.2 ± 1.1 | 120.5 ± 1.2 | 36.2 ± 1.6 | 172.4 ± 1.6 | |
| TE-OrO | 1:1 | 22.1 ± 1.0 | 9.1 ± 0.4 | 20.3 ± 0.9 | 153.6 ± 1.8 | 32.1 ± 1.0 | 226.8 ± 1.7 |
| 1:4 | 24.0 ± 0.8 | 9.9 ± 0.7 | 14.7 ± 0.7 | 135.2 ± 1.5 | 49.8 ± 1.7 | 225.4 ± 1.4 | |
| TE-TO:OrO | 1:1 | 21.4 ± 0.9 | 11.2 ± 0.6 | 25.6 ± 1.1 | 137.8 ± 1.0 | 34.1 ± 1.1 | 209.2 ± 1.3 |
| 1:4 | 28.1 ± 1.6 | 11.9 ± 0.5 | 16.3 ± 1.3 | 142.0 ± 2.0 | 41.3 ± 1.3 | 213.5 ± 1.5 |
| NADES Ratio (LA:GLY) | Fungi | Bacteria | ||||||||
|---|---|---|---|---|---|---|---|---|---|---|
| T. mentagrophytes | S. aureus | S. epidermidis | E. coli | K. pneumoniae | ||||||
| ZoI (mm) | ZoI (mm) | MIC (µg/mL) RI (%) | ZoI (mm) | MIC (µg/mL) RI (%) | ZoI (mm) | MIC (µg/mL) RI (%) | ZoI (mm) | MIC (µg/mL) RI (%) | ||
| EO | ||||||||||
| OlO | --- | 6.5 ± 0.6 a | 6.0 ± 0.0 a | ˃1000.0 | 6.0 ± 0.0 a | ˃1000.0 | 6.0 ± 0.0 a | ˃1000.0 | 6.0 ± 0.0 a | ˃1000.0 |
| TO | --- | 43.8 ± 0.5 c | 38.3 ± 0.9 c | 36.9 ± 1.1 | 26.3 ± 1.1 c | 34.3 ± 2.2 | 31.7 ± 0.9 c | 12.3 ± 1.8 | 45.0 ± 1.5 c | 7.8 ± 2.1 |
| OrO | --- | 55.0 ± 1.0 c | 25.0 ± 1.0 c | 41.1 ± 2.2 | 28.0 ± 0.8 c | 40.9 ± 2.5 | 40.8 ± 1.4 c | 17.2 ± 1.2 | 45.0 ± 1.9 c | 10.6 ± 1.5 |
| TO:OrO | --- | 51.5 ± 1.1 c | 27.0 ± 0.5 c | 42.3 ± 3.0 | 40.0 ± 1.0 c | 35.3 ± 1.1 | 40.0 ± 1.1 c | 16.3 ± 1.1 | 45.0 ± 1.2 c | 9.9 ± 1.2 |
| TE | ||||||||||
| TE-OlO | 1:1 | 6.5 ± 0.4 a | 6.0 ± 0.0 a | ** | 6.0 ± 0.0 a | ** | 6.0 ± 0.0 a | ** | 6.0 ± 0.0 a | ** |
| 1:4 | 7.0 ± 0.5 a | 6.0 ± 0.0 a | ** | 6.0 ± 0.0 a | ** | 6.0 ± 0.0 a | ** | 6.0 ± 0.0 a | ** | |
| TE-TO | 1:1 | 90.0 ± 0.0 c* | 12.3 ± 0.2 b | 100 *** | 8.3 ± 0.4 a | 100 *** | 9.3 ± 1.1 a | 100 *** | 13.0 ± 0.3 b | 100 *** |
| 1:4 | 90.0 ± 0.0 c* | 8.0 ± 0.6 a | 100 *** | 8.0 ± 0.3 a | 100 *** | 10.0 ± 0.8 a | 100 *** | 15.0 ± 0.7 b | 100 *** | |
| TE-OrO | 1:1 | 90.0 ± 0.0 c* | 15.0 ± 1.7 b | 100 *** | 9.7 ± 0.9 a | 100 *** | 12.7 ± 0.5 b | 100 *** | 19.3 ± 1.0 b | 100 *** |
| 1:4 | 90.0 ± 0.0 c* | 11.0 ± 0.6 a | 100 *** | 11.0 ± 0.5 a | 100 *** | 13.0 ± 0.5 b | 100 *** | 18.7 ± 1.1 b | 100 *** | |
| TE-TO:OrO | 1:1 | 90.0 ± 0.0 c* | 12.0 ± 0.3 a | 100 *** | 9.0 ± 0.7 a | 100 *** | 12.3 ± 0.8 b | 100 *** | 19.0 ± 0.8 b | 100 *** |
| 1:4 | 90.0 ± 0.0 c* | 9.0 ± 0.5 a | 100 *** | 9.0 ± 0.3 a | 100 *** | 11.3 ± 0.9 a | 100 *** | 18.3 ± 0.6 b | 100 *** | |
| T. mentagrophytes | S. aureus | S. epidermidis | E. coli | K. pneumoniae | |
|---|---|---|---|---|---|
| TE-OlO |  6.5 mm | 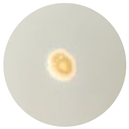 6 mm |  6 mm |  6 mm | 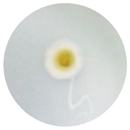 6 mm |
| TE-TO |  Total | 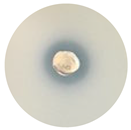 12.3 mm |  8.3 mm |  9.3 mm |  13.0 mm |
| TE-OrO | 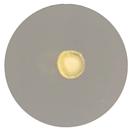 Total |  15.0 mm | 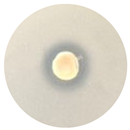 9.7 mm |  12.7 mm |  19.3 mm |
| TE-TO:OrO | 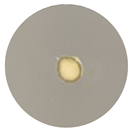 Total |  11.0 mm | 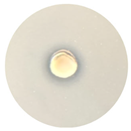 9.0 mm |  12.3 mm |  19.0 mm |
Disclaimer/Publisher’s Note: The statements, opinions and data contained in all publications are solely those of the individual author(s) and contributor(s) and not of MDPI and/or the editor(s). MDPI and/or the editor(s) disclaim responsibility for any injury to people or property resulting from any ideas, methods, instructions or products referred to in the content. |
© 2025 by the authors. Licensee MDPI, Basel, Switzerland. This article is an open access article distributed under the terms and conditions of the Creative Commons Attribution (CC BY) license (https://creativecommons.org/licenses/by/4.0/).
Share and Cite
Freitas, D.S.; Rocha, D.; Santos, J.; Noro, J.; Tavares, T.D.; Teixeira, M.O.; Araújo, D.; Castro, J.; Almeida, C.; Silva, S.; et al. NADES-in-Oil Emulsions Enriched with Essential Oils for Cosmetic Application. Processes 2025, 13, 374. https://doi.org/10.3390/pr13020374
Freitas DS, Rocha D, Santos J, Noro J, Tavares TD, Teixeira MO, Araújo D, Castro J, Almeida C, Silva S, et al. NADES-in-Oil Emulsions Enriched with Essential Oils for Cosmetic Application. Processes. 2025; 13(2):374. https://doi.org/10.3390/pr13020374
Chicago/Turabian StyleFreitas, David S., Diana Rocha, Joana Santos, Jennifer Noro, Tânia D. Tavares, Marta O. Teixeira, Daniela Araújo, Joana Castro, Carina Almeida, Sónia Silva, and et al. 2025. "NADES-in-Oil Emulsions Enriched with Essential Oils for Cosmetic Application" Processes 13, no. 2: 374. https://doi.org/10.3390/pr13020374
APA StyleFreitas, D. S., Rocha, D., Santos, J., Noro, J., Tavares, T. D., Teixeira, M. O., Araújo, D., Castro, J., Almeida, C., Silva, S., Felgueiras, H. P., Ribeiro, A., Venâncio, A., Cavaco-Paulo, A., & Silva, C. (2025). NADES-in-Oil Emulsions Enriched with Essential Oils for Cosmetic Application. Processes, 13(2), 374. https://doi.org/10.3390/pr13020374