Review

Insights from the Last Decade in Computational Fluid Dynamics (CFD) Design and Performance Enhancement of Darrieus Wind Turbines

1
“Thermodynamics and Energy” Research Team, Energy Research Center, Physics Department, Faculty of Science, Mohammed V University in Rabat, 4 Avenue Ibn Batouta, BP 1014, Rabat 10000, Morocco
2
Interdisciplinary Research Center for Sustainable Energy Systems (IRC-SES), King Fahd University of Petroleum & Minerals, Dhahran 31261, Saudi Arabia
3
Department of Industrial Engineering, University of Padova, Via Venezia, 1, 35131 Padova, Italy
4
National School of Applied Sciences (ENSA) of Fez, Sidi Mohamed Ben Abdellah University (USMBA), Avenue My Abdallah Km 5 Route d’Imouzzer, BP 0072, Fes 30000, Morocco
5
Moulay Ismail University (MIU), Km 5, Route d’Agouray, N6, Meknes 50040, Morocco
*
Author to whom correspondence should be addressed.
Processes 2025, 13(2), 370; https://doi.org/10.3390/pr13020370
Submission received: 11 November 2024 / Revised: 31 December 2024 / Accepted: 26 January 2025 / Published: 28 January 2025
(This article belongs to the Special Issue Turbulence Models for Turbomachinery)

Abstract

:
This review provides an analysis of advancements in the design and performance assessment of Darrieus wind turbines over the past decade, with a focus on the contributions of computational fluid dynamics (CFD) to this field. The primary objective is to present insights from studies conducted between 2014 and 2024, emphasizing the enhancement of Darrieus wind turbine performance through various technological innovations. The research methodology employed for this review includes a critical analysis of published articles related to Darrieus turbines. The focus on the period from 2014 to 2024 was considered to highlight recent parametric CFD studies on Darrieus turbines, avoiding overlap with previously published reviews and maintaining originality relative to existing review works in the literature. By synthesizing a collection of articles, the review discusses a wide range of recent investigations utilizing CFD modeling techniques, including both 2D and 3D simulations. These studies predominantly utilize the “Ansys-Fluent” V12.0 and “STAR CCM+” V9.02 solvers to evaluate the aerodynamic performance of Darrieus rotors. Technological advancements focus on modifying the geometry of Darrieus, including alterations to blade profiles, chord length, rotor diameter, number of blades, turbine height, rotor solidity, and the integration of multiple rotors in various configurations. Additionally, the incorporation of flow deflectors, the use of advanced blade shapes, such as V-shaped or twisted blades, and the application of an opening ratio on the blades are explored to enhance rotor efficiency. The review highlights the significant impact of these geometric modifications on key performance metrics, particularly the moment and power coefficients. A dedicated section presents CFD-derived visualizations, including vorticity fields, turbulence contours illustrated through the Q-criterion, velocity vectors, and dynamic pressure contours. These visualizations provide a description of the flow structures around the modified Darrieus rotors. Moreover, the review includes an analysis of the dynamic performance curves of Darrieus, which show improvements resulting from the modifications of the baseline design. This analysis covers the evolution of pressure coefficients, moment coefficients, and the increased power output of Darrieus.

1. Introduction

The focus on Darrieus wind turbines in this review is driven by their unique aerodynamic characteristics and potential for enhanced energy capture efficiency in diverse wind conditions. Unlike horizontal axis wind turbines (HAWTs), Darrieus operates efficiently in turbulent and multi-directional flows, making them suitable for urban and offshore applications. The need to optimize these turbines is critical due to their simpler design, lower maintenance requirements, and potential for reduced noise pollution. This review aims to consolidate recent advancements in CFD studies related to Darrieus turbines, highlighting key findings and identifying future research directions to enhance their efficiency and applicability. For instance, Ahmad et al. [1] investigated the optimization of double-Darrieus (DD) hybrid VAWTs using numerical and experimental approaches, achieving improved performance. Similarly, this goes with the findings of Zheng et al. [2], who introduced a parameter optimization methodology for contra-rotating VAWTs, leveraging numerical simulations and response surface techniques to achieve significant performance gains.
Moreover, the impact of geometric and structural parameters on turbine efficiency has been widely studied, underscoring their critical role in performance enhancement. To illustrate, Satrio et al. [3] analyzed the effects of circular flow disturbance distance ratios on turbine performance through combined experimental and numerical investigations. In addition, Shen et al. [4] further explored the role of critical structural indicators in the aerodynamic performance of DD turbines. Furthermore, Yadav et al. [5] examined rotor spacing configurations—both overlapping and non-overlapping—and their influence on the aerodynamic efficiency of counter-rotating twin-rotor VAWTs.
In parallel, innovative design modifications have substantially improved VAWT efficiency. For example, Ansaf et al. [6] demonstrated the benefits of integrating fixed guiding walls into H-type Darrieus turbines, resulting in notable efficiency improvements. Similarly, Ahmad et al. [7] investigated the application of leading-edge tubercles, showing significant aerodynamic enhancements through a detailed analysis. Additionally, Huang et al. [8] introduced variable solidity blades, which improved self-starting behavior and overall turbine performance.
Likewise, advancements in blade design have also been a critical research focus. For instance, Celik et al. [9] studied the aerodynamic characteristics of self-starting H-type VAWTs featuring J-shaped airfoils under diverse design conditions. Along similar lines, Tian et al. [10] introduced a gear-like turbine layout, demonstrating improved efficiency through structural innovation. Moreover, Ibrahim et al. [11] highlighted the performance benefits of trapped vortex cavities, while Abdolahifar et al. [12] identified swept blades as an effective strategy for enhancing aerodynamic efficiency.
In addition to these innovations, research on flexible blade technologies has yielded significant insights into adaptive aerodynamic performance. For instance, Hijazi et al. [13] investigated the role of flexible blades in improving VAWT efficiency under varying operational conditions. Similarly, Yan et al. [14] demonstrated the aerodynamic advantages of leading-edge protuberances, leading to enhanced turbine performance.
Furthermore, dynamic shape optimization methods have played a pivotal role in advancing turbine designs. Baghdadi et al. [15], for example, applied blade-morphing techniques for dynamic shape optimization, while Bakhumbsh et al. [16] utilized micro-cylinders as passive flow controllers to increase the performance of Darrieus turbines. In addition, Marzec et al. [17], who employed a one-way fluid-structure interaction (FSI) approach to optimize the integrity and performance of H-rotor blades, addressed structural optimization. Moreover, Chegini et al. [18] focused on enhancing the self-starting capabilities of Darrieus–Savonius hybrid turbines through the integration of innovative deflectors.
Finally, aerodynamic characterization and performance analyses have been extensively undertaken, further contributing to the field. For example, Jiang et al. [19] investigated the effects of drag-disturbed flow devices on the aerodynamic performance of H-Darrieus turbines, while Reddy et al. [20] studied the influence of aspect ratios on the efficiency and wake recovery of lift-type helical hydrokinetic turbines. Similarly, Kumar et al. [21] expanded this research by analyzing the performance of spherical-shaped Darrieus turbines for in-pipe hydropower applications. In the same vein, Reddy et al. [22] explored aerodynamic performance enhancements in H-Darrieus rotors through the addition of auxiliary blades, and Eltayesh et al. [23] implemented aerodynamic upgrades to enhance the performance of small-scale Darrieus turbines.
In the studies by various authors, the aerodynamic and hydrodynamic performance of VAWTs and other renewable energy systems were comprehensively analyzed using advanced numerical simulations. To begin with, the aerodynamic performance of a straight-bladed Darrieus wind turbine was numerically investigated by Iddou et al. [24] using 2D URANS simulations with ANSYS/FLUENT. Four turbulence models, namely Spalart–Allmaras, SST k-ω, TSST, and realizable k-ε, were evaluated. It was demonstrated that the realizable k-ε model provided results closely aligned with experimental data, leading to its identification as the most accurate model for such simulations. Furthermore, optimal performance conditions for the turbine were identified through additional investigations.
In addition, the potential of Darrieus-type VAWTs for hydrokinetic applications was explored by Mohamed et al. [25], focusing on arrays in free-surface channels. An integrated simulation approach employing the actuator line method (ALM) and volume of fluid (VOF) model within the RANS solver of ANSYS Fluent was utilized. A sensitivity analysis and validation with field data indicated good agreement with experimental results. The findings highlighted significant two-way interactions between turbines and the channel, demonstrating the influence of water level and inflow velocity on efficiency. Moreover, insights into turbine clustering in confined channels and associated hydraulic impacts were provided by the three-dimensional modeling results.
Similarly, Mohamed et al. [26] also investigated the deployment of closely spaced Darrieus turbines, employing ALM to simulate twin-rotor configurations. It was shown that the method effectively predicted blade loads and mutual interaction effects at medium and high TSRs. Flow fields and wake development were accurately reproduced, as confirmed by proper orthogonal decomposition (POD) analysis. Furthermore, the low computational cost of ALM, compared to blade-resolved CFD, established it as a reliable tool for VAWT applications.
Continuing this line of research, Khedr et al. [27] examined the aerodynamic performance of small HAWTs under low Reynolds number flow conditions using steady CFD with the MRF method. A lack of standardized simulation practices was identified through a comparative literature review. Consequently, a sensitivity analysis was conducted, addressing parameters such as domain size, discretization, meshing criteria, freestream turbulence intensity, and turbulence modeling. The experimental blockage effect was corrected empirically, revealing its significant impact. As a result, guidelines for accurate simulation setups were subsequently proposed.
Furthermore, in the study carried out by Eltayeb et al. [28], modifications to NACA 0015 airfoils using plain flaps (PF) and Gurney flaps (GF) were analyzed to enhance the performance of Darrieus VAWTs in urban environments. Simulations using the k-ω SST URANS model revealed that the 0.6c, 10° PF configuration increased the C p by 9.8% compared to the baseline, while GFs provided stable torque under varying conditions. These results emphasized the importance of balancing efficiency and torque stability, with suggestions for future studies focusing on adaptive flap designs and experimental validation.
On a related note, Sanaye et al. [29] optimized helical-bladed VAWTs for urban use through 3D CFD simulations. The Taguchi method was applied to reduce the computational cost of simulating 125 cases to 25. The optimal configuration—a tip speed ratio of 1.33, a helical angle of 30°, and an airfoil chord length of 0.4 m—achieved an average power coefficient of 0.17542. Consequently, this framework was proposed as a systematic approach for optimizing helical VAWTs.
In a complementary study, Chen et al. [30] employed CFD analysis, the Taguchi method, and the MAM to optimize the design of a VAWT. Factors including the blades’ number, α, airfoil type, TSR, and wind velocity were analyzed. The optimal configuration yielded a power coefficient of 0.421 at specific design conditions. It was shown that wind velocity and TSR significantly influenced performance, followed by other design parameters.
Moreover, dynamic CFD start-up models and the Taguchi-based design of experiments (DoE) methodology were used to optimize VAWT pairs in another study. It was determined that the angle between adjacent rotors had a significant impact on start-up behavior, while the blade number had minimal influence. As a result, the optimized layout facilitated faster self-starting for downstream rotors, improving wind farm layouts by accommodating additional rotors [31].
For urban applications, the EN0005 blade profile’s blade was proposed by Fatahian et al. [32] for Darrieus VAWTs, enabling self-starting without external components. Field tests validated the methodology, demonstrating its potential for standalone operations. Additionally, Marwa et al. [33] using numerical simulations analyzed the influence of rotor flexibility on turbine performance. It was revealed that blade deformations altered aerodynamic profiles and flow dynamics, with a scaling law for mean blade bending angle derived. Consequently, these insights contribute to the design and optimization of flexible rotors.
Lastly, Tian et al. [34] examined vortex-induced vibration (VIV) suppression using quasi-active control methods. Banki rotors demonstrated superior vibration suppression, reducing amplitude by up to 99% and achieving consistent results across various flow velocities. These findings underscore the dual benefits of vibration suppression and drag reduction, recommending Banki rotors for such applications.
Wind energy, recognized as a sustainable and inexhaustible resource, necessitates continuous advancements in turbine design to fully harness its potential. Recent studies, such as that by Shen et al. [35], emphasize the importance of optimization strategies for Darrieus VAWTs, focusing on critical performance metrics including energy efficiency, self-starting capability, structural reliability, and noise reduction. By analyzing methods such as geometric modifications and advanced flow control techniques and sophisticated modeling approaches like response surface methods and proxy model optimization, actionable guidelines have been proposed. These findings aim to enhance turbine design, thereby promoting the development of efficient wind energy systems aligned with global sustainability objectives.
Integral to these advancements is the research into airfoil design, which significantly influences the C p and self-starting performance of Darrieus. Addressing existing gaps, Chen et al. [36] conducted a review of airfoil optimization methodologies, particularly those utilizing Panel and CFD methods. The study also explored database construction strategies and improvements in models such as momentum, vortex, and cascade. Notably, two inverse design methodologies were proposed to assist researchers in aligning airfoil designs with specific operational and theoretical frameworks, thereby advancing the precision and applicability of airfoil engineering.
While Darrieus VAWTs show promise for urban and low-wind-speed environments, challenges persist, particularly regarding low power coefficients and suboptimal self-starting capabilities. Tayebi et al. [37] reviewed passive and active flow control strategies aimed at mitigating flow separation and improving the ratio’s efficiency. Their findings critically evaluated the efficacy and limitations of various techniques, highlighting unresolved research gaps. Such insights are pivotal for guiding future advancements in flow control technologies and improving the aerodynamic performance of Darrieus turbines.
The increasing urgency of combating climate change and implementing renewable energy policies has further spurred interest in small wind turbines for urban applications, as highlighted by Ghasemian et al. [38]. VAWTs, characterized by their structural simplicity, omnidirectional wind acceptance, and reduced noise, are ideally suited for such environments. A review of CFD simulations provided essential guidelines for turbulence modeling, numerical methods, and domain sizing. In addition, critical parameters such as TSR and design of the blade were examined, along with advancements in noise reduction, stall control, and self-starting performance. These insights aim to optimize the deployment of VAWTs as urban energy solutions.
SB-VAWTs, known for their structural robustness and simplicity, are particularly advantageous in rural and marine contexts. However, enhancing their aerodynamic efficiency remains a complex challenge. Li et al. [39] examined the application of CFD techniques in SB-VAWT research, covering critical aspects such as domain configuration, meshing strategies, time step selection, turbulence modeling, and Y+ value optimization. Furthermore, solutions to 18 common CFD challenges were identified, offering valuable guidance for researchers seeking to refine the performance of SB-VAWTs.
The growing energy crisis and environmental concerns have also catalyzed interest in hydrokinetic technologies, particularly lift-based vertical-axis hydrokinetic turbines (VAHTs). Reddy et al. [40] demonstrated that such turbines, optimized for high tip speed ratios and flow-independent rotation, offer significant advantages, including the potential for unsubmerged generator designs. A comparative analysis of straight-bladed and helical-bladed VAHTs provided key insights into design and operational parameters, while future research directions were suggested to enhance efficiency and promote industrial commercialization of these systems.
In the context of tropical urban environments, decentralized technologies, such as building-integrated reduced models of VAWTs, represent a viable solution for advancing decarbonization efforts. Díaz et al. [41] categorized 48 studies by geographic region and methodology, revealing a lack of emphasis on environmental assessment and resilience metrics. Given the heightened exposure of tropical areas to severe weather events, integrating resilience considerations is imperative for enabling widespread deployment. The study also identified on-site measurements, CFD simulations, and numerical climate modeling as prevalent techniques while proposing decision-making frameworks to facilitate strategic planning and adoption of wind energy technologies in these regions.
Finally, the wake of VAWTs, particularly in densely populated built environments and multi-turbine wind farm configurations, remains a critical area of research. Peng et al. [42] reviewed techniques such as wind tunnel experiments, particle image velocimetry (PIV), field measurements, CFD investigations, and mathematical modeling to study wake flow dynamics and vortex behaviors. The asymmetric and counter-rotating nature of VAWT wakes underscores the need for advanced wake modeling to optimize both standalone turbines and multi-turbine layouts. The study concludes by offering recommendations to advance understanding and innovation in VAWT wake aerodynamics.
This review targets a thorough examination of the latest progress in the design and performance of Darrieus, underscoring the pivotal role of CFD over the past ten years. In fact, it provides an in-depth discussion of CFD-based studies, incorporating both 2D and 3D simulations, with a primary reliance on “Ansys-Fluent” and “STAR CCM+” solvers for assessing aerodynamic performance. The core findings emphasize the influence of geometric modifications on performance metrics, such as moment and power coefficients, resulting from adjustments in blade profiles, chord length, rotor diameter, and the integration of multiple rotors. Innovations, including the incorporation of flow deflectors, the adoption of advanced blade shapes (such as V-shaped or twisted blades), and the application of variable blade opening ratios, have been investigated to enhance efficiency. The review includes CFD visualizations, such as vorticity fields, Q-criterion turbulence contours, velocity vectors, and dynamic pressure distributions, offering a comprehensive understanding of the intricate flow structures around modified rotors. Additionally, the review examines dynamic performance curves, illustrating significant enhancements in pressure and moment coefficients, along with increased power output, attributable to design modifications.
The review is structured to provide a systematic analysis of the advancements in CFD and performance enhancement of Darrieus wind turbines over the past decade. Section 1 begins with an introduction that highlights the significance of Darrieus wind turbines and the role of CFD in advancing their design and performance. Subsequently, Section 2 offers an overview of blade profiles, rotor specifications, and performance analysis in Darrieus wind turbines. Following this, Section 3 discusses the aerodynamic parameters used in evaluating the performance of these turbines. Furthermore, Section 4 explores the design and deployment concepts of Darrieus turbines for renewable energy harvesting in both terrestrial and offshore environments. In addition, Section 5 provides a detailed examination of parametric optimization of Darrieus rotor design for enhanced aerodynamic efficiency, analyzing various optimization techniques and their impacts on turbine performance. Moreover, Section 6 includes CFD contours for visualizing the effects of design modifications on complex flow structures, providing insights into vortex dynamics and flow behavior around Darrieus rotors. Lastly, Section 7 investigates performance indicators enhancement for improved energy efficiency of Darrieus turbines, covering a range of factors influencing aerodynamic performance and power output. The review concludes with a summary of the main findings and research perspectives in Section 8.

2. Summary of Darrieus Wind Turbine Parameters and CFD Studies

Table 1 provides a summary of key parameters related to blade profiles, rotor dimensions, and performance investigations for various Darrieus wind turbines. It offers a comparative view of different studies, highlighting the common use of NACA airfoil profiles, particularly NACA 0021, NACA 0018, and NACA 0020, across a wide range of rotor sizes and configurations. Rotor diameters vary significantly, ranging from 200 mm to 3854 mm, with corresponding differences in rotor height, blade chord, and the blades’ number. The solidity, which is a critical factor in turbine performance, is explicitly mentioned in some studies, indicating the focus on enhancing the aerodynamic efficiency of the Darrieus. Investigations covered in the table encompass a variety of approaches, including CFD simulations, optimization techniques, and experimental analyses. The studies explore different methods for enhancing turbine efficiency, such as the use of deflectors, cavity layouts, variable pitch, and hybrid turbine designs. Additionally, some research focuses on the structural aspects of the turbines, such as the integration of flexible blades or the impact of leading-edge protuberances.
Table 2 and Table 3 provide a comprehensive overview of 2D and 3D CFD investigations, respectively, focusing on mesh resolution, boundary conditions, and solver configurations. Across both 2D and 3D studies, mesh resolution exhibits significant variability, ranging from approximately 65,000 elements in 2D simulations to as many as 70 million elements in 3D simulations. This broad range reflects the models’ adaptability to different levels of computational precision and the specific requirements of each investigation. In both cases, a consistent emphasis on boundary layer thickness is evident, with most studies targeting ( y + ) less than 1, ensuring accurate capture of near-wall turbulence phenomena.
Investigations into Darrieus rotors, in both 2D and 3D configurations, typically employ the following turbulence models: transient k- ω SST [43], standard k- ε [3], realizable k- ε [44], Spalart–Allmaras [45], improved delayed IDDES [2], and LES [14]. These models are selected for their ability to resolve the complex turbulent flow phenomena around the rotors. The selection of turbulence model is dependent on the flow complexity, with advanced models such as IDDES and LES being utilized to capture transient and large-scale turbulence. The values of y + are generally chosen between 1 and 5 to ensure an accurate representation of near-wall turbulence [1]. For 2D simulations, the generated mesh typically consists of 33 to 35 million elements, while for 3D simulations, the mesh can extend up to 70 million elements, enabling a detailed resolution of flow phenomena [46]. Additionally, the size of the first mesh layer near the surface of the turbine can be adjusted to 10 5 times the blade chord length for 2D configurations [19] and to 0.001 m for 3D configurations [7], ensuring precise capture of boundary layer effects. These methodological choices are essential for ensuring the reliability of CFD results, enabling the resolution of both small-scale turbulence and larger flow structures effectively (Table 2 and Table 3).
The k-ω (SST) model is predominantly used in both 2D and 3D CFD modeling, underscoring its robustness in handling complex flow phenomena. In 3D studies, the use of advanced turbulence models, for instance, the IDDES and the Spalart–Allmaras model, highlights efforts to balance computational cost with simulation accuracy. Boundary conditions, including velocity inlets, pressure outlets, and rotating zone interfaces, are uniformly applied across the studies, suggesting a standardized approach to rotor aerodynamics simulation within both 2D and 3D frameworks.
Solver settings vary across both 2D and 3D simulations, with algorithms such as SIMPLE, PISO, and coupled schemes being employed depending on the specific needs of the studies. The consistent use of second-order discretization methods for spatial and temporal variables ensures high-fidelity results, while the stringent convergence criteria adopted across the studies emphasize the importance of accuracy in capturing the unsteady nature of flow around rotating components. This systematic approach ensures that the computational models are robust, reliable, and capable of delivering high-fidelity results for complex flow simulations in both 2D and 3D contexts.
Table 1. Summary of blade profiles, rotor dimensions, and performance investigations in Darrieus wind turbine.
ReferencesBlade ProfileRotor Diameter
(mm)
Rotor
Height
(mm)
Blade
Chord
(mm)
Number
of Rotor Blades
Rotor
Solidity
Investigations
Tian et al. [10]NACA00211030-85.82-100.33–1.66Yield Of Darrieus Enhanced Using A Gear Device
Chegini et al. [18]NACA00211030-85.830.25CFD-Based Study On Darrieus–Savonius Hybrid Wind Turbine, Focusing On Self-Starting And Performance With Deflectors
Zidane et al. [47]NACA00211030100085.8030.5Optimization Study On H-Darrieus Turbine Performance Using Upstream Deflectors
Singh et al. [48]NACA00211030145685.830.25Numerical Analysis Of Darrieus With Varying Aspect Ratios For Energy Harvesting
Ibrahim et al. [11]NACA00211030-85.830.25Power Of Darrieus Turbine Blades Enhanced Using Trapped Vortex Cavity
Roshan et al. [49]NACA00211030-85.83-Performance Of Darrieus Turbines Improved With Different Cavity Layouts
Rasekh et al. [50]NACA00211030-85.830.5Multi-Objective Optimization Of Variable Pitch VAWT Using NSGA-II With CFD
Rasekh et al. [51]NACA00211030-85.83-Sensitivity Analysis Of Variable Pitch VAWT Using Taguchi–CFD Approach
Ansaf et al. [6]NACA002110301000853-Efficiency Optimization Of Darrieus Using Fixed Guiding Walls
Shen et al. [4]NACA0021800/200012003004-Study On The Impact Of Structural Indicators On Double Darrieus Turbine Aerodynamic Efficiency
Hijazi et al. [13]NACA00212000120026520.265CFD Investigation Of The Use Of Flexible Blades For Darrieus
Zheng et al. [2]NACA0021200012002652-Indicator Optimization CFD Method Of Contra-Rotating VAWT
Ghareghani et al. [52]NACA0021198011503003-CFD Investigation On The Helix Angle To Smoothen The Torque Output Of The 3-PB Darrieus
Franchina et al. [53]NACA0021103029148630.253D URANS Calculations Of A H-Shaped Darrieus
Eltayesh et al. [23]NACA002110281460853-Aerodynamic Enhancement Of A Small Scale Darrieus
Franchina et al. [45]NACA00211510151853-3D CFD Modeling Of A Troposkein Turbine At Different Operating Regimes
Baghdadi et al. [15]NACA00212000-26530.127Designs Enhancement Of A VAWT Using Blade Morphing Method
Kouaissah et al. [54]NACA0021100010001013-CFD Study On The Performance Of A Tilted H-Darrieus Turbine
Jiang et al. [19]NACA0018800-1253-CFD Evaluation Of A H-Darrieus Equipped With A DD Flow Layout
Yadav et al. [5]NACA00181030-85.830.25Effect Of Several Indicators On The Performance Of A Coupled Twin Darrieus Rotor Using CFD
Marzec et al. [17]NACA0018200019002873-Structural Optimization Of H-Darrieus Using One-Way FSI
Reddy et al. [55]NACA00183003001003-Wind Tunnel Testing And CFD Analysis Of Wooden-Bladed Darrieus At Low TSR
Kong et al. [56]NACA0018800-20030.75Enhancement Of Self-Starting And Power Extraction In H-Type Hydrokinetic Rotor Using Blade Deflection
Bundi et al. [57]NACA00181700(Aspect
ratio 12)
2463-Pitch Control Of Darrieus Using Gain Scheduling Methods
Tirandaz et al. [58]NACA00181000-6010.06Effect Of Symmetric Airfoil On Power Coefficient Of Vawts In Dynamic Stall Regime
Yan et al. [14]NACA001817007802463-Aerodynamic Enhancement Of Darrieus Improved By Leading-Edge Layout
Ahmad et al. [1]NACA0018385431205463-Shape Enhancement Of DD Hybrid Rotor
Celik et al. [9]NACA0018750-833-CFD Analysis Of Self-Starting Darrieus With J-Shaped Blades
Bakhumbsh et al. [16]NACA0018280010001403-Impact Of Micro-Cylinder R On Darrieus Efficiency
Huang et al. [8]NACA0018600–2100-7550.357–1.25Optimal Design Of Darrieus With Variable Solidity
Geng et al. [59]NACA0018100010006020.12CFD Investigations And Fatigue Modeling For Lifetime Prediction Of Vawts
Reddy et al. [20]NACA0020200150–35062.8030.30Effect Of Aspect Ratio On The Efficiency And Wake Recovery Of Helical Hydrokinetic Turbines
Abdolahifar et al. [12]NACA0020240460563-Performance Evaluation And Flow Analysis Of Darrieus Turbines With V-Shaped Swept Blades
Tunio et al. [60]NACA0020150015002003-Analysis Of Duct Augmentation Impacts On The Performance Of Straight-Blade Darrieus Hydrokinetic Turbines
Wilberforce et al. [61]NACA0012100010001003-Innovative Concepts For Domestic Wind Energy In Areas With Suboptimal Wind Conditions
Gupta et al. [43]NACA00152500-4003-Analysis Of Flow Patterns And Performance Sensitivity In Variable Pitching Vawts
Anggara et al. [44]NACA0015165010003753-Evaluation Of Vortex Addition Influence On Darrieus H-Rotor Turbine Performance Through Numerical Simulation
Ahmad et al. [7]NACA0015250030004003-Multifaceted Examination Of Leading-Edge Tubercle Effects On VAWT Efficiency Improvement
Mohamed et al. [62]DU06W2002000-25020.25Study On The Mechanisms Behind Power Augmentation In Counter-Rotating Darrieus Turbine Pairs
Reddy et al. [22]NREL S823300-100/506-Study On The Influence Of Auxiliary Blades In Traditional H-Darrieus Rotors
Kamal et al. [63]S-1046200150603-Impact Of Changing System And Operational Conditions On The Performance Of Hybrid Hydrokinetic Turbines
Satrio et al. [3]NACA63(4)021500666703-Study Of The Impact Of Circular Flow Disturbance Distance On The Performance Of Vawts: Experimental And Numerical Approaches
Kumar et al. [21]NACA442164, 68, 72-143, 40.288–0.324/
0.385–0.433
Investigation Of Spherical Darrieus Hydrokinetic Turbine Performance For In-Pipe Hydropower Systems
Durkacz et al. [64]NACA77154000100010003-Numerical Simulation And Prototype Testing Of Vawts In Planetary Cluster Systems
Table 2. Overview of mesh resolution, boundary conditions, and solver configurations for 2D CFD investigations.
ReferencesMesh Resolution and
Boundary Layer
Thickness
Turbulence
Model
and y +
Boundary
Conditions
Solver Settings
Jiang et al.
[19]
-
33–35 million elements
-
The thickness of the first layer of the mesh on the blade surface was set at 10−5 blade chord length
Transition
k- ω   (SST)
y + < 1
Velocity inlet, pressure outlet, rotation field, stationary field
  • A second-order unsteady implicit scheme was used for discretization, with the momentum equation, turbulent kinetic energy, and k-ε equation all solved using a second-order upwind scheme
  • For reliable and stable data, the HDWT completed ten rotations in the fluid simulation calculations. To prevent startup-induced flow field instability from influencing the results, the data from the 10th rotation were considered for analysis, excluding the first 9 rotations.
Gupta et al.
[43]
-
267,028 elements
-
The thickness of the first cell adjacent to the wall within the viscous sublayer of the boundary layer was set to 0.01 mm.
-
The inflation process produced 30 layers, with each layer exhibiting a growth rate of 1.2
k- ω   (SST)
y + < 1
Velocity inlet, pressure outlet, free-slip wall, fixed zone, interface, rotating zone, sliding mesh technique
  • Pressure–velocity coupling was solved using a COUPLED scheme combined with an implicit transient formulation.
  • The spatial discretization of pressure, momentum, turbulence kinetic energy, and specific dissipation rate was carried out using a second-order upwind scheme.
  • A Green–Gauss cell-based method was utilized for solving the URANS equations.
  • For every time step, the convergence residuals were established at 10−6
  • To maintain solution stability and accuracy, the time step was modified in accordance with the Courant–Friedrichs–Lewy (CFL) criterion, ensuring it remained below 1.0
Satrio et al.
[3]
-
206,734 elements
-
The study applied the inflation layer approach, targeting a first-layer height that corresponds to y + = 1
k-ε
y + = 3.86
Velocity inlet, pressure outlet, symmetry, no-slip wall boundary on the blade surfaces, fixed zone, interface, rotating zone, sliding mesh technique
  • Transient simulations with the sliding mesh method were carried out.
  • The transport equation, derived from unsteady RANS, was used.
  • The simulation utilized a time step size of 1°.
  • Following four rotations, the turbine reached a steady instantaneous moment. The simulation data were validated by comparison with experimental results prior to the parametric studies.
Anggara et al.
[44]
-
(-)
-
The boundary layer was calculated using a velocity of 8 m/s
-Realizable
k-ε
-(-)
Velocity inlet, pressure outlet, symmetry, fixed zone, interface, rotating zone, sliding mesh technique
  • The SIMPLE algorithm was applied for pressure–velocity coupling.
  • For the turbulent study in this simulation, the Realizable k-ε viscous model was used.
  • Pressure, turbulent kinetic energy, and dissipation rate were solved using second-order spatial and temporal discretization schemes.
  • The time for physical setup was T 360 , where T was the rotation period of the rotor.
  • Each time step was limited to a maximum of 250 iterations, and the residuals were set to 10−3.
Tian et al.
[10]
-
750,000 elements
-
20 layers
k- ω   (SST)
y + < 1
Velocity inlet, pressure outlet, zero shear-wall, fixed zone, interface, rotating zone, sliding mesh technique
  • The pressure–velocity coupling was performed using a coupled algorithm.
  • The method used for pressure–velocity coupling was the coupled algorithm.
  • The gradients were determined using the least squares cell-based algorithm.
  • Convergence was achieved when all scaled residuals dropped below 10−5. The maximum number of iterations per time step was set to 15.
  • Time steps range from 0.2°/step to 1°/step.
Yadav et al.
[5]
-
1,550,000 elements
-
Near the wall, the thickness of the first layer was kept at 0.008 mm, and the sizing increment was set to 1.005
k- ω   (SST)
y + < 1
Velocity inlet, pressure outlet, symmetry, moving walls for the blades, overset interface, interface, rotating zone, sliding mesh technique
  • The problem was solved using the incompressible URANS solver Fluent 19.2
  • The coupled implicit scheme was used for pressure–velocity coupling.
  • To ensure low numerical diffusion, the second-order upwind scheme was applied for spatial discretization of pressure, momentum, turbulent kinetic energy, and specific dissipation rate.
  • Spatial gradients were discretized using the least-squares cell-based method
  • For time integration, a first-order implicit scheme was applied.
  • The   selected   time   step   was   10 4 s.
Chegini et al.
[18]
-
808,000 elements
-
First layer thickness 0.0145 mm
k- ω   (SST)
y + = 0.56
Velocity inlet, pressure outlet, symmetry,
rotating zone, fixed zone, interface, rotating zone, sliding mesh technique
  • Fluent 22.2 software was employed to perform the transient simulations.
  • For solving the continuity and momentum equations in incompressible flow, the pressure-based solver was adopted.
  • A segregated algorithm with a second-order spatial and temporal discretization scheme was employed for pressure–velocity coupling using the SIMPLE method.
  • A   convergence   criterion   of   10 6 was applied for the residuals of the problem variables.
  • The   number   of   iterations   per   time   step   was   set   to   30 ,   with   residuals   dropping   below   10 6 in each time step.
Zidane et al.
[47]
-
650,000 elements
-
A grid height of 0.0054 mm was set around the airfoil
k- ω   (SST)
y + < 1
Velocity inlet, pressure outlet, symmetry,
rotating zone, fixed zone, interface, rotating zone, sliding mesh technique
  • Momentum, turbulence kinetic energy, and dissipation ratio were calculated using a second-order upwind scheme.
  • Optimizing the time step involved performing several simulations at different angular speeds for both rotors, with an angular step of 1°.
Reddy et al.
[55]
-
100,000 elements
-
The airfoil boundary was meshed with 10 inflation layers, exhibiting a growth rate of 1.2
k- ε
y + < 5
Velocity inlet, pressure outlet, symmetry,
rotating zone, fixed zone, interface, rotating zone, sliding mesh technique
  • A fully coupled pressure–velocity coupling scheme was used in the steady-state solver.
  • The use of a fully coupled pressure–velocity coupling scheme ensures that both pressure and velocity fields converged at the same time, facilitating faster and more accurate convergence (set to < 10 5 ).
Jain et al.
[65]
-
488,961 elements
-
(-)
k- ω   (SST)
y + = 1
Velocity inlet, pressure outlet, symmetry
  • The flow was solved using a segregated pressure–velocity second-order solver.
  • An implicit unsteady solver of second order was applied.
  • The   asymptotic   stopping   criterion   of   10 5 was employed at each time step.
Reddy et al.
[22]
-
170,324 elements
-
The first layer thickness of 0.02 mm. A total of 10 inflation layers were introduced on the blade boundaries, with a growth rate of 1.2
Standard
k- ε y + < 5
Velocity inlet, pressure outlet, symmetry,
rotating zone, fixed zone, interface, rotating zone, sliding mesh technique
  • First-order upwind schemes were used for certain time steps in the simulations, after which a second-order scheme was employed to enhance the accuracy of the results.
  • For velocity-pressure coupling, a SIMPLE scheme was employed.
  • For the transient simulation, the number of iterations per time step varied (20, 30, 50, and 70).
  • A second-order spatial discretization was employed to achieve the transient solutions.
Wilberforce et al. [61]
-
65,121 elements
-
The boundary layer of the blade was discretized with 20 levels of quadrangular cells
k- ω   (SST)
y + = 1
Velocity inlet, pressure outlet, walls, rotating zone, fixed zone, interface, rotating zone, sliding mesh technique
  • Solver: Pressure-based
  • Time setting: Transient
  • The time step size was set to 0.05 s.
  • 1000 time steps were considered in the simulation.
  • A maximum of 30 iterations was allowed per time step.
Rasekh et al.
[50]
-
Each rotating blade was discretized with 1600 nodes on its surface
-
34 boundary layers
k- ω   (SST)
y + < 1
Velocity inlet, pressure outlet, no friction wall, rotating zone, fixed zone, interface, rotating zone, sliding mesh technique
  • For the transient algorithm, a second-order implicit scheme was employed
  • Least-squares cell-based algorithms were employed for the spatial discretization of gradients
  • A second-order scheme was applied to discretize the momentum, turbulent kinetic energy, and specific dissipation rate equations
  • Each variable was considered converged when the criterion reached 10−6
  • The time required for each converged simulation was roughly 12 h.
Geng et al.
[59]
-
64,486 elements
-
(-)
k- ω   (SST)
y + < 1
Velocity inlet, pressure outlet, symmetry,
rotating zone, fixed zone, interface, rotating zone, sliding mesh technique
  • The incompressible URANS equations were solved using the CFD software package ANSYS Fluent 16.1.
  • For both space and time, a second-order discretization approach was utilized.
  • The pressure–velocity coupling was provided by the SIMPLE algorithm.
Rasekh et al.
[51]
-
265,351 elements
-
34 boundary layers. A distance of 0.01 mm was specified for the first node from the blade surface
k- ω   (SST)
y + < 1
Velocity inlet, pressure outlet, no friction wall, rotating zone, fixed zone, interface, rotating zone, sliding mesh technique
  • ANSYS Fluent software was used to perform the simulations
  • Pressure–velocity coupling was achieved using the PISO algorithm.
  • For the transient algorithm, a second-order implicit scheme was utilized.
  • For spatial discretization of gradients, a least-square cell-based algorithm was employed.
  • For discretizing the momentum, turbulent kinetic energy, and specific dissipation rate equations, a second-order method was applied.
  • It   was   assumed   that   the   convergence   criteria   would   be   less   than   10 6 .
  • It took around 24 hours for two simulations to converge
Huang et al.
[8]
-
362,832 elements
-
The mesh consisted of 20 layers, the first of which had a thickness of 0.0348 mm and a growth rate factor of 1.1
k- ω   (SST)
y + < 1
Velocity inlet, pressure outlet, symmetry,
rotating zone, fixed zone, interface, rotating zone, sliding mesh technique
  • ANSYS Fluent 2020 R2 was used for carrying out the numerical simulations
  • To solve the RANS equations, the PISO solver with pressure–velocity coupling and a second-order upwind spatial discretization scheme was utilized.
  • A   fixed   convergence   criterion   of   10 5 was applied for the residuals.
Ibrahim et al.
[11]
-
420,000 nodes
-
The selection of the first layer thickness was made to keep the y + value within the range needed by the k–ω (SST) turbulence model
k- ω   (SST)
y + = 1
Velocity inlet, pressure outlet, symmetry,
rotating zone, fixed zone, interface, rotating zone, sliding mesh technique
  • Pressure–velocity coupling was resolved using the SIMPLE algorithm.
  • To approximate the convection/diffusion terms, the second-order upwind convection scheme was used.
  • The second-order implicit time advancing scheme utilized a time step size of 0.5°.
  • The   in - step   iterations   for   all   equations   used   a   residual   level   of   10 5 .
  • A minimum of 25 turbine rotation cycles were run for each simulation until the repeated cyclic behavior was reached.
Bakhumbsh et al. [16]
-
140,000–160,000 elements
-
The first 20 boundary layers near the blade surface were set with a growth rate of 1.15 and the thickness of the initial layer was fixed at 0.02 mm
k- ω   (SST)
y + < 1
Velocity inlet, pressure outlet, symmetry,
rotating zone, fixed zone, interface, rotating zone, sliding mesh technique
  • A pressure-based solver using the SIMPLE method was selected.
  • The pressure, momentum equations, turbulent kinetic energy, dissipation rate, and transient formulation were calculated using second-order methods.
  • For   all   equations ,   the   in - step   iterations   utilized   a   residual   level   of   10 5 .
Table 3. Overview of mesh resolution, boundary conditions, and solver configurations for 3D CFD investigations.
ReferencesMesh Resolution and
Boundary Layer
Thickness
Turbulence
Model
and y +
Boundary ConditionsSolver Settings
Shen et al. [4]
-
5,793,988 elements
-
2.71662 mm
k- ω SST
y + = 0.1 / 1.2
Velocity inlet, pressure outlet, slip walls, rotating zone, stationary zone, interface, (use of the sliding mesh technique)
  • The continuity equation was addressed through the implicit non-stationary separated flow method.
  • In the second-order windward format, the control equation was defined.
  • For time discretization, the second-order central difference method was employed.
  • The SIMPLE pressure–velocity coupling method, in its semi-implicit form, was employed to solve the continuity and momentum equations in separate iterations.
  • A   threshold   of   10 4 was used for the convergence criterion.
Hijazi et al. [13]
-
3.8 million elements
-
The first layer thickness of the inflation layers ranged from 0.045 mm to 0.03 mm
k- ω SST
y + = 1
Velocity inlet, pressure outlet, slip walls, rotating zone, stationary zone, interface, (use of the sliding mesh technique)
  • ANSYS Fluent, a commercial software, was employed for the numerical simulations.
  • To solve the time-dependent URANS equations, a transient pressure-based solver was utilized.
  • The coupled scheme was applied for pressure–velocity coupling, while the least squares cell-based method was used for spatial discretization of gradients.
  • For pressure, momentum, turbulent kinetic energy, and specific dissipation rate, a second-order upwind scheme was used, complemented by a second-order implicit transient formulation.
Zheng et al.
[2]
-
2.7 million elements
-
The total thickness of the boundary layer was set to 10 mm.
Improved Delayed Detached Eddy Simulation
(IDDES)
y + < 1
Velocity inlet, pressure outlet, slip walls, rotating zone, stationary zone, interface, (use of the sliding mesh technique)(-)
Ahmad et al.
[7]
-
8.1 million elements
-
The element dimensions in proximity to the turbine surface were fixed at 0.001 m
k- ω SST
y + < 1
Velocity inlet, pressure outlet, slip walls, symmetry, rotating zone, stationary zone, interface, (use of the sliding mesh technique)
  • Given the low wind speed anticipated for the turbine’s operation, a pressure-based solver was chosen
  • In order to accurately capture the time-dependent flow variations, the transient state was employed.
  • The angular velocity, corresponding to a particular TSR, was assigned to the rotating inner domain.
  • A moving no-slip wall condition was applied to the turbine wall relative to the rotating domain.
Marzec et al.
[17]
-
28 million elements
-
(-)
k- ω SST
y + = 3 30
Velocity inlet, pressure outlet, symmetry, rotating zone, stationary zone, interface, (use of the sliding mesh technique)
  • The discretization schemes applied were least squares cell-based for gradients, PRESTO for pressure, second order upwind for density and momentum, and first order upwind for turbulent kinetic energy and specific dissipation rate.
Kumar et al.
[21]
-
9.8 million elements
-
10 layers
k- ω SST
y + < 1
Velocity inlet, pressure outlet, no-slip walls, rotating zone, stationary zone, interface, (use of the sliding mesh technique)
  • The   rotating   domain   motion   was   considered ,   with   the   coordinate   frame   along   the   z - axis .   A   transient   blade   row   analysis   was   performed   using   the   2 nd   order   backward   Euler   transient   scheme .   Output   frequency   was   set   to   every   time - step ,   turbulence   intensity   was   medium   ( 5 % ) ,   and   convergence   criteria   were   RMS   10 6 ). The advection scheme was upwind.
Singh et al.
[48]
-
5.6 million elements
-
15 prism layers, the first-layer thickness of about 0.03 mm
k- ω SST
y + = 1
Velocity inlet, pressure outlet, symmetry, rotating zone, stationary zone, interface, (use of the sliding mesh technique)
  • The study was carried out in 3D with the use of Star CCM+ software.
  • Shear   stress   transport   ( SST )   k ω was used as the turbulence model in conjunction with Implicit URANS.
  • Second-order temporal discretization, along with the coupled solver, was implemented.
Abdolahifar et al. [12]
-
2.8 million elements
-
Sixteen prism layers were applied, with the maximum prism side length on the blade surface set to 5 mm
Realizable k- ε
y + = 1
Velocity inlet, pressure outlet, slip walls, rotating zone, stationary zone, interface, (use of the sliding mesh technique)
  • Incompressible turbulent transient flow around all sample turbines was simulated in 3D using the RANS equations.
  • For   resolving   the   viscous   sub - layer ,   the   realizable   k     ε turbulence model with the enhanced wall treatment near-wall method was used.
  • The SIMPLE method was used to achieve pressure and velocity coupling.
  • Pressure was discretized with a second-order scheme, and momentum variables were handled with a second-order upwind scheme.
Ghareghani et al. [52]
-
5,550,000 elements
-
A grid layer with a height of 0.06 mm was applied at the blade surface
k- ω SST
(-)
Velocity inlet, pressure outlet, symmetry, rotating zone, stationary zone, interface, (use of the sliding mesh technique)
  • A pressure-based double-precision solver for pressure and velocity coupling was implemented using the SIMPLEC method.
  • The second-order discretization method was used for pressure, and a second-order upwind scheme was applied to the momentum variables.
  • A computer with eight processors and a clock frequency of 4.00 GHz was used for performing the solution.
  • The   residual   criteria   for   solution   convergence   in   each   time   step   of   the   simulation   were   set   to   10 4 for   the   continuity   equation   and   the   k   and   ω terms ,   while   for   the   velocity   components ,   the   criterion   was   set   to   10 6
Kamal et al.
[63]
-
14,590,032 elements
-
A total of 15 prism layers were generated, with the first layer thickness of 0.015 mm
RNG k- ε
y + = 4.20
Velocity inlet, pressure outlet, free slip condition, no-slip walls, rotating zone, stationary zone, interface, (use of the sliding mesh technique)
  • The numerical simulations were performed using a pressure-based ANSYS CFX solver.
  • To solve the pressure and velocity variables simultaneously, the coupled algorithm was used.
  • The numerical setup involves a second-order backward Euler unsteady scheme and a high-resolution advection scheme.
  • The   numerical   simulation   convergence   was   ensured   by   setting   the   residual   magnitude   to   10 5 , with a time-step size of 10° per rotor angle increment.
  • Five revolutions of the rotor were required to establish steady-state periodic conditions.
Ahmad et al.
[1]
-
2 million
-
A 4 mm element size was selected for the regions near the walls
k- ε
y + < 5
Velocity inlet, pressure outlet, symmetry, wall conditions were applied to the turbine blades, (use of the sliding mesh technique)
  • A PISO algorithm was employed to conduct the transient simulations.
  • Through the coupled algorithm, the full pressure–velocity gradient was effectively coupled.
  • A second-order discretization approach was used to solve the convective terms in both the momentum and turbulence equations.
  • The rotor began with a transient response, eventually stabilizing into a quasi-steady state.
Franchina et al. [45]
-
32 million elements
-
(-)
Spalart–Allmaras
y + = 1
Velocity inlet, pressure outlet, no-slip walls, symmetry, rotating zone, stationary zone, interface, (use of the sliding mesh technique)
  • Incompressibility of the fluid was assumed, along with constant thermo-physical properties
  • For both divergence and Laplacian terms in the equations, as well as for temporal discretization, second-order accurate schemes were used
  • At each time step, the governing equations were solved using an algebraic multigrid solver, iterating until a predefined accuracy threshold was met
  • For each operating condition, the computations continued until a periodic solution was obtained, which took approximately 15–20 turbine revolutions
Yan et al.
[14]
-
11.16 million elements
-
Considered as an investigated parameter
LES
y + < 1
Velocity inlet, pressure outlet. The blade surface was set as non-slip walls. A periodic condition was enforced at the spanwise direction, (use of the sliding mesh technique)
  • The URANS calculations for the isolated blade were performed using FLUENT software
  • The VAWT was analyzed through LES simulations performed with Code Saturne
  • The   two - equation   SST   k ω turbulence model, known for its reliability, was used for the unsteady RANS calculation
  • The adopted method included a pressure-based solver, second-order spatial scheme, and the SIMPLE time marching method
  • The mesh resolution near the wall was fine enough, eliminating the need for wall functions
Chen et al. [46]
-
70 million cells
-
The blade was discretized into 400 nodes, and the growth factor for layer generation was limited to a maximum of 1.2
k- ω SST
y + < 1
Velocity inlet, pressure outlet, symmetry, rotating zone, stationary zone, interface, (use of the sliding mesh technique)
  • STAR-CCM+ was utilized for the numerical simulations
  • For both convective and diffusive fluxes, as well as temporal discretization, second-order schemes were employed
  • Incompressibility was assumed for the flow
  • The SIMPLE algorithm was employed within a segregated approach for pressure–velocity coupling
  • The one-equation Spalart-Allmaras turbulence model with rotation-curvature correction was applied in the URANS framework
Tunio et al.
[60]
-
4,483,265 elements
-
The first cell layer on all turbine surfaces was defined with a height to ensure it fell within the viscous sub-layer
k- ω SST
y + < 1
Velocity inlet, pressure outlet, stationary wall with the no-slip condition, (use of the Moving Frame of Reference (MRF) technique)
  • Second - order   discretization   was   used   for   the   pressure ,   momentum ,   k ,   and   ω equations
Ortiz-Rodríguez et al. [66]
-
3,087,970 elements
-
The   grids   were   densified   near   the   airfoil   surfaces   to   capture   the   boundary   layer   and   keep   the   y + value minimal
k- ω SST
y + < 1.20
Velocity inlet, pressure outlet, symmetry, walls, rotating zone, stationary zone, interface, (use of the sliding mesh technique)
  • The   transient   SST   k ω turbulence model, based on the RANS equations, was utilized.
  • In transient mode, the double-precision pressure-based coupled solver algorithm was utilized.
  • The spatial and temporal discretization were performed using a second-order scheme.
  • The solver utilizes the SIMPLEC pressure–velocity coupling scheme with a second-order implicit transient formulation, and the transient time step was set to 0.000555 s, ensuring a rotational angle of 0.6° per time step.
Reddy et al.
[20]
-
17.60 million elements
-
To capture the boundary layer behavior, the rotor blades were treated with the inflation technique
RNG k- ε y + < 1 Velocity inlet, pressure outlet, free-slip walls, no-slip walls (blades)
  • The governing equations were coupled, non-linear, second-order partial differential equations.
  • The   k ε RNG turbulence model was employed to simulate CFD models.
Kouaissah et al. [54]
-
24 million polygonal cells
-
A minimum spacing of 0.02 mm
k- ω SST
y + = 1
Velocity inlet, pressure outlet, no-slip condition was imposed at solid surfaces
  • The numerical method assumes the fluid to be an incompressible ideal gas, characterized by constant thermo physical properties.
  • The governing equations were discretized using URANS modeling, supported by wall-resolved turbulence models.
  • The   turbulence   model   used   was   the   k - ω SST mode.
  • The discretization in space and time was performed with second-order accurate schemes.

3. Aerodynamic Parameters Used in Darrieus Turbines Performance Evaluation

In the evaluation of VAWT performance, several pivotal aerodynamic parameters are essential for the assessment and enhancement of turbine efficiency. This section provides an in-depth examination of these performance indicators, including the tip speed ratio (TSR), solidity, and AoA, as well as various aerodynamic coefficients such as lift, drag, moment, and power coefficients. The mathematical formulations for these indicators, based on fluid dynamics principles, are presented to enable an understanding of the forces and moments exerted on the turbine blades. Furthermore, the correlations between these indicators and the overall turbine performance are analyzed, yielding insights into the aerodynamic behavior of the straight-bladed Darrieus-type VAWT under different operating conditions.
The TSR, denoted as λ , is defined by Equation (1) [4].
T S R = ω × R V  
where ω represents the angular velocity of the rotor, R denotes the rotor radius, and V corresponds to the free stream velocity of the fluid.
The average Reynolds number R e ¯ and the average Mach number M ¯ are defined as indicated in Equations (2) and (3) [23].
R e ¯ = ρ T S R × V c μ
M ¯ = T S R × V 343
where μ represents the fluid’s viscosity, c denotes the chord length and ρ denotes the fluid’s density.
The solidity σ is defined by Equation (4) [65].
σ = N × c R
where N represents the number of blades.
The solidity of spherical turbines is defined as the fraction of the turbine circumference occupied by the blade, as described by Equation (5) [21].
σ s p h e r i c a l = N × c × b A s  
b (m) is the span length of the blades, and A s   ( m 2 ) signifies the total swept area of the sphere.
The blockage ratio (BR) is defined as the ratio of the turbine’s projection area to the cross-sectional area of the channel or passage through which the fluid is transmitted, as given by Equation (6) [21].
B R = π R 2 A p  
where (BR) denotes the blockage ratio, and A p   ( m 2 ) signifies the cross-sectional area of the pipe.
The lift coefficient per unit span, C l , is expressed in Equation (7) [50].
C l = F l 1 2 ρ V 2 c
where F l represents the lift force.
In addition, the drag coefficient per unit span, C d , is defined in Equation (8) [48].
C d = F d 1 2 ρ V 2 c  
where F d denotes the drag force.
The moment coefficient, C m , is defined by Equation (9) [12].
C m = T t u r b i n e 1 2 ρ V 2 A R
where A represents the swept area.
Moreover, the power coefficient, C p , is defined by Equation (10) [13].
C p = T t u r b i n e × ω 1 2 ρ A V 3 = T S R × C m  
The coefficient of pressure, C o P , is defined by Equation (11) [65].
C o P = P i P 1 2 ρ V 2  
where P i denotes the pressure at the specified point, and P represents the free-stream pressure.
The suction momentum C μ is defined as the mass flow removed from the blade’s cavity, expressed as a function of the turbine’s operating conditions. To address these aspects simultaneously, C μ is presented in a dimensionless form as detailed in [11]. Under the assumption of incompressible flow, C μ can be represented as specified in Equation (12).
C μ = V s 2 × S W V 2 D
where V s denotes the suction velocity in ( m / s ) , S W represents the suction slot width in meters, and D signifies the turbine diameter [11].
The enhancement of overall performance in VAWTs is contingent upon an understanding of blade aerodynamics. The straight-bladed Darrieus-type VAWT, recognized for its simplicity in design, presents a complex aerodynamic analysis due to the variability of induced velocities in both upstream and downstream regions [43]. The turbine blades function as an obstruction that extracts a portion of the wind energy to generate torque, consequently diminishing the wind’s intensity. This reduction in axial velocity is referred to as the axial induction velocity, with the associated reduction factor termed the induction factor [43]. The blade is subjected to cyclic variations in local AoA, relative velocity, and Reynolds number ( R e ) [43]. The relative velocity V R (Equations (15) and (16)) is calculated by considering the components of chord wise velocity V c (Equation (13)) and normal velocity V n (Equation (14)) [60].
V c = V a cos θ + R ω  
V n = V a sin θ  
V R = V c 2 + V n 2
V R = ( V a sin θ ) 2 + ( V a cos θ + ω R ) 2  
where V a denotes the induced axial flow velocity through the rotor. By normalizing the relative velocity with the freestream wind velocity V and applying the definition of the axial induction factor a = V a / V alongside the TSR ( λ ) , a non-dimensional form of Equation (17) is derived [20].
V R V = ( a sin θ ) 2 + ( a cos θ + λ ) 2
The local AoA or α is represented in Equation (18), which is subsequently simplified to Equation (19) upon the substitution of the axial induction factor a and λ [54].
tan α = V a sin θ V a cos θ + ω R  
α = t a n 1 a sin θ a cos θ + λ
The optimal blade pitch position, based on the turbine design parameters relative to the azimuth position θ , is determined by Equation (20) [43].
β = S × s i n θ t a n 1 sin θ cos θ + λ  
where S denotes the maximum pitch angle.
The expression for α can be utilized to estimate the local variations in the normal force coefficient C n and the tangential force coefficient C t through the application of the formulas presented in Equations (21) and (22) [8].
C n = C l c o s α + C d s i n α  
C t = C l s i n α C d c o s α  
The normal F n and tangential F t force components for each blade at any given azimuth angle can be determined by applying Equations (23) and (24) [11].
F n = 1 2   ρ V R 2 × h c × C n  
F t = 1 2   ρ V R 2 × h c × C t  
where ρ represents the air density, and h denotes the vertical airfoil height. The normal and tangential force components are strongly dependent on the rotor azimuth angle θ . The tangential force component primarily contributes to torque generation within the turbine, and the average tangential force for a single airfoil can be calculated using Equation (25) [43].
F T a v g = 1 2 π   0 2 π F t θ d θ
Equation (26) [43] defines the total torque exerted on the wind turbine.
T = N R 2 π   0 2 π F t θ d θ  
Therefore, the torque can be utilized to calculate the total turbine power output, as demonstrated in Equation (27) [54].
P o u t p u t = T × ω = ω N R 2 π   0 2 π F t θ d θ

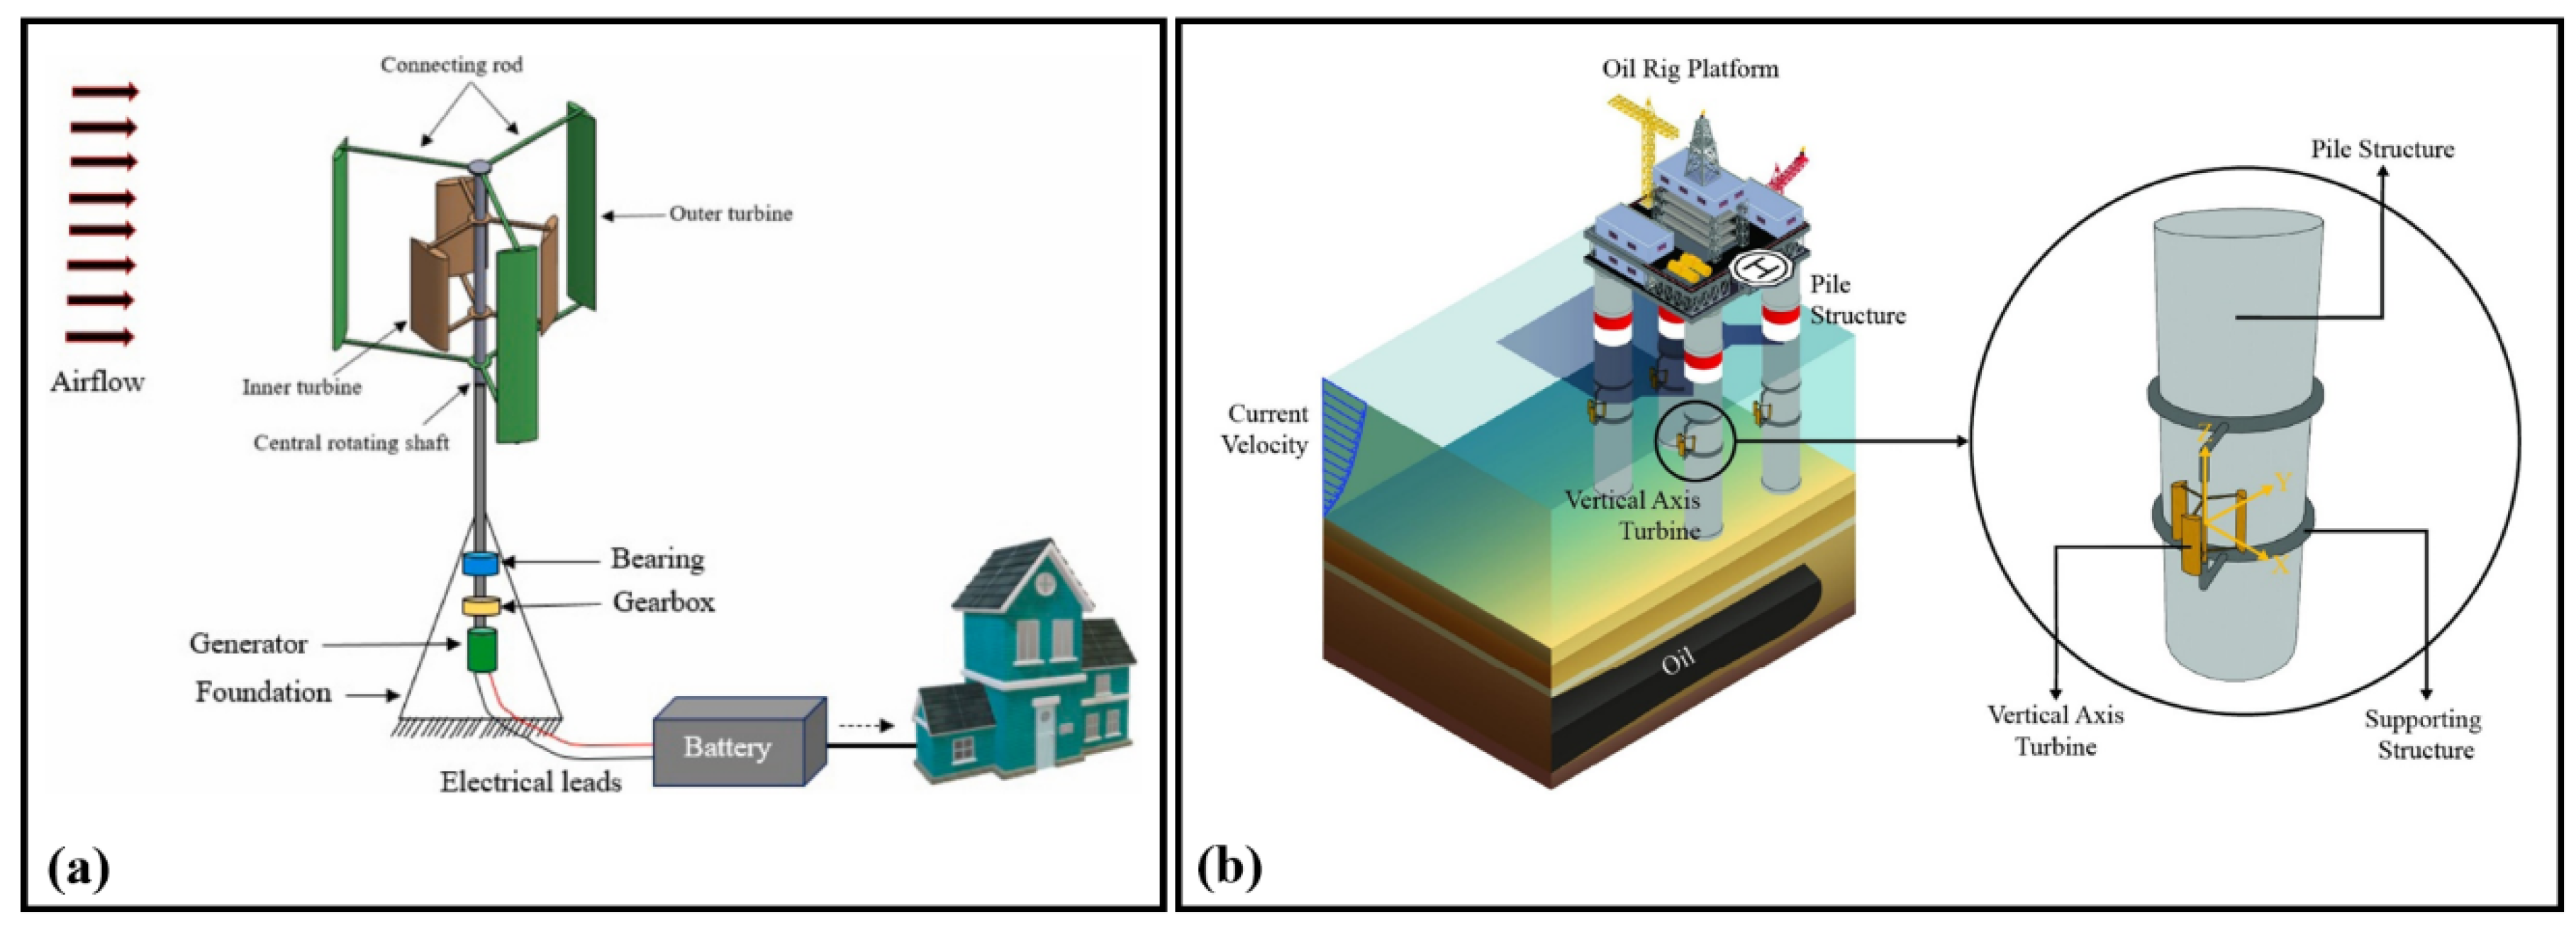
4. Design and Deployment Concepts of Darrieus Turbines for Renewable Energy Harvesting in Terrestrial and Offshore Environments

The application of CFD in turbine design has been shown to significantly enhance turbine efficiency and performance. CFD enables the detailed analysis of aerodynamic and flow characteristics, which facilitates the optimization of rotor designs to maximize energy capture while minimizing aerodynamic losses. Through advanced simulation methods, key parameters including blade profiles, rotor geometry, and operational conditions are refined, resulting in improvements to power coefficients and rotor efficiency. Additionally, CFD has been demonstrated to contribute to cost reduction by reducing the necessity for physical prototypes and experimental testing. Virtual simulations allow for the precise prediction of turbine performance under various operational and environmental conditions, thereby identifying cost-effective design configurations [67]. This reduction in design uncertainty results in lower manufacturing, installation, and operational costs. Furthermore, CFD allows for the optimization of turbine designs based on specific site conditions, enhancing energy production and operational efficiency. From an environmental perspective, CFD contributes to the reduction of the ecological impact of wind turbines. By optimizing turbine designs for higher efficiency, the demand for land and materials required to achieve a given power output is minimized [68]. Moreover, the enhanced performance of turbines leads to increased renewable energy generation, thereby decreasing reliance on fossil fuels and mitigating the environmental impact associated with conventional energy sources. As CFD technology continues to advance, its role in the development of more efficient, cost-effective, and environmentally sustainable wind turbine designs becomes increasingly significant.
Primarily, Figure 1a depicts a dual-rotor Darrieus hybrid wind turbine, where an inner and outer turbine are coaxially mounted on a central rotating shaft. This configuration has been extensively investigated, as highlighted by Ahmad et al. [1], with the primary objective of enhancing the turbine’s overall efficiency. The dual-rotor system aims to maximize the capture of wind energy by utilizing both turbines, which are connected by a series of rods. It has been demonstrated that this design can lead to significant improvements in power output while maintaining structural integrity, as also explored in studies on variable solidity types [8].
To mitigate the limitations of current designs, a double-Darrieus hybrid VAWT has been proposed as an engineering solution. In this investigation, the benefits of both lift-based and drag-based VAWTs were integrated into a hybrid configuration. The existing Darrieus–Savonius hybrid VAWT was modified by replacing the Savonius turbine with a Darrieus turbine utilizing a cambered airfoil. The reconfigured hybrid VAWT is composed of a larger outer Darrieus turbine with a symmetric airfoil and a smaller inner Darrieus turbine with a cambered airfoil.
The conceptual design and operational mechanism of the modified hybrid VAWT are depicted in Figure 1a [1]. Design parameters of the inner Darrieus turbine, including chord length, blade count, rotor height, rotor diameter, and pitch angle, were optimized through the application of design of experiments (DOE) methodologies [46,66]. Detailed analysis of aerodynamic performance was carried out using CFD simulations [1].
A novel design for a double-Darrieus hybrid VAWT has been explored. The traditional Savonius turbine within the Darrieus–Savonius hybrid VAWT was substituted with a Darrieus turbine incorporating a cambered airfoil. DOE techniques were employed to optimize design parameters such as chord length, blade count, rotor height, blade distance from the central rotating shaft, and pitch angle. The aerodynamic performance of the proposed hybrid VAWT was found to be improved by approximately 10–14% when compared to both standard Darrieus turbines and existing Darrieus–Savonius hybrids.
In addition, Figure 1b illustrates the application of VAWTs in offshore environments, specifically attached to the pile structures of an oilrig platform. This concept is of particular interest in the context of marine energy extraction, where the integration of turbines within existing infrastructure is seen as a means to harness the kinetic energy of ocean currents. This configuration has been validated through both numerical simulations and experimental studies, as indicated by Kumar et al. [21] and Reddy et al. [20]. By utilizing the pile structures as supporting elements, the turbines can operate efficiently under varying current velocities, thus contributing to the diversification of energy sources for offshore platforms.
A substantial number of offshore oilrig platforms, exceeding 7500 units globally as of 2006, have been installed [69], with approximately 635 units situated in Indonesia. Upon reaching the end of their operational lifespan, these structures must undergo decommissioning. The available decommissioning options include complete removal, conversion to artificial reefs, or repurposing for alternative uses [70]. Among these, repurposing the structures for alternative applications is associated with the minimal environmental impact [71].
Operational offshore platforms have explored the integration of renewable energy sources [72] for electricity generation. While ocean tidal turbines are limited in their capacity to serve as primary power generators, they can provide supplementary electricity due to the predictable nature of tidal currents [73]. Before utilizing the jacket structure as a flow disturbance, it is essential to conduct preliminary feasibility and structural analyses, which are beyond the scope of the present study.
The shape of the pile structure, characterized by a tubular form, results in a circular cross-section in 2D analysis, which correlates with the flow disturbance shapes in variations V5-V19. The VAT should be positioned downstream from the pile structure relative to the predominant current direction at an angle of 60°. For instance, if the predominant current flows from the north, the VAT should be placed to the south, with a 60° offset to the east or west of the pile structure. Consequently, the pile structure can function as an upstream flow disturbance, as depicted in Figure 1b [3].

5. Parametric Optimization of Darrieus Rotor Design for Enhanced Aerodynamic Efficiency

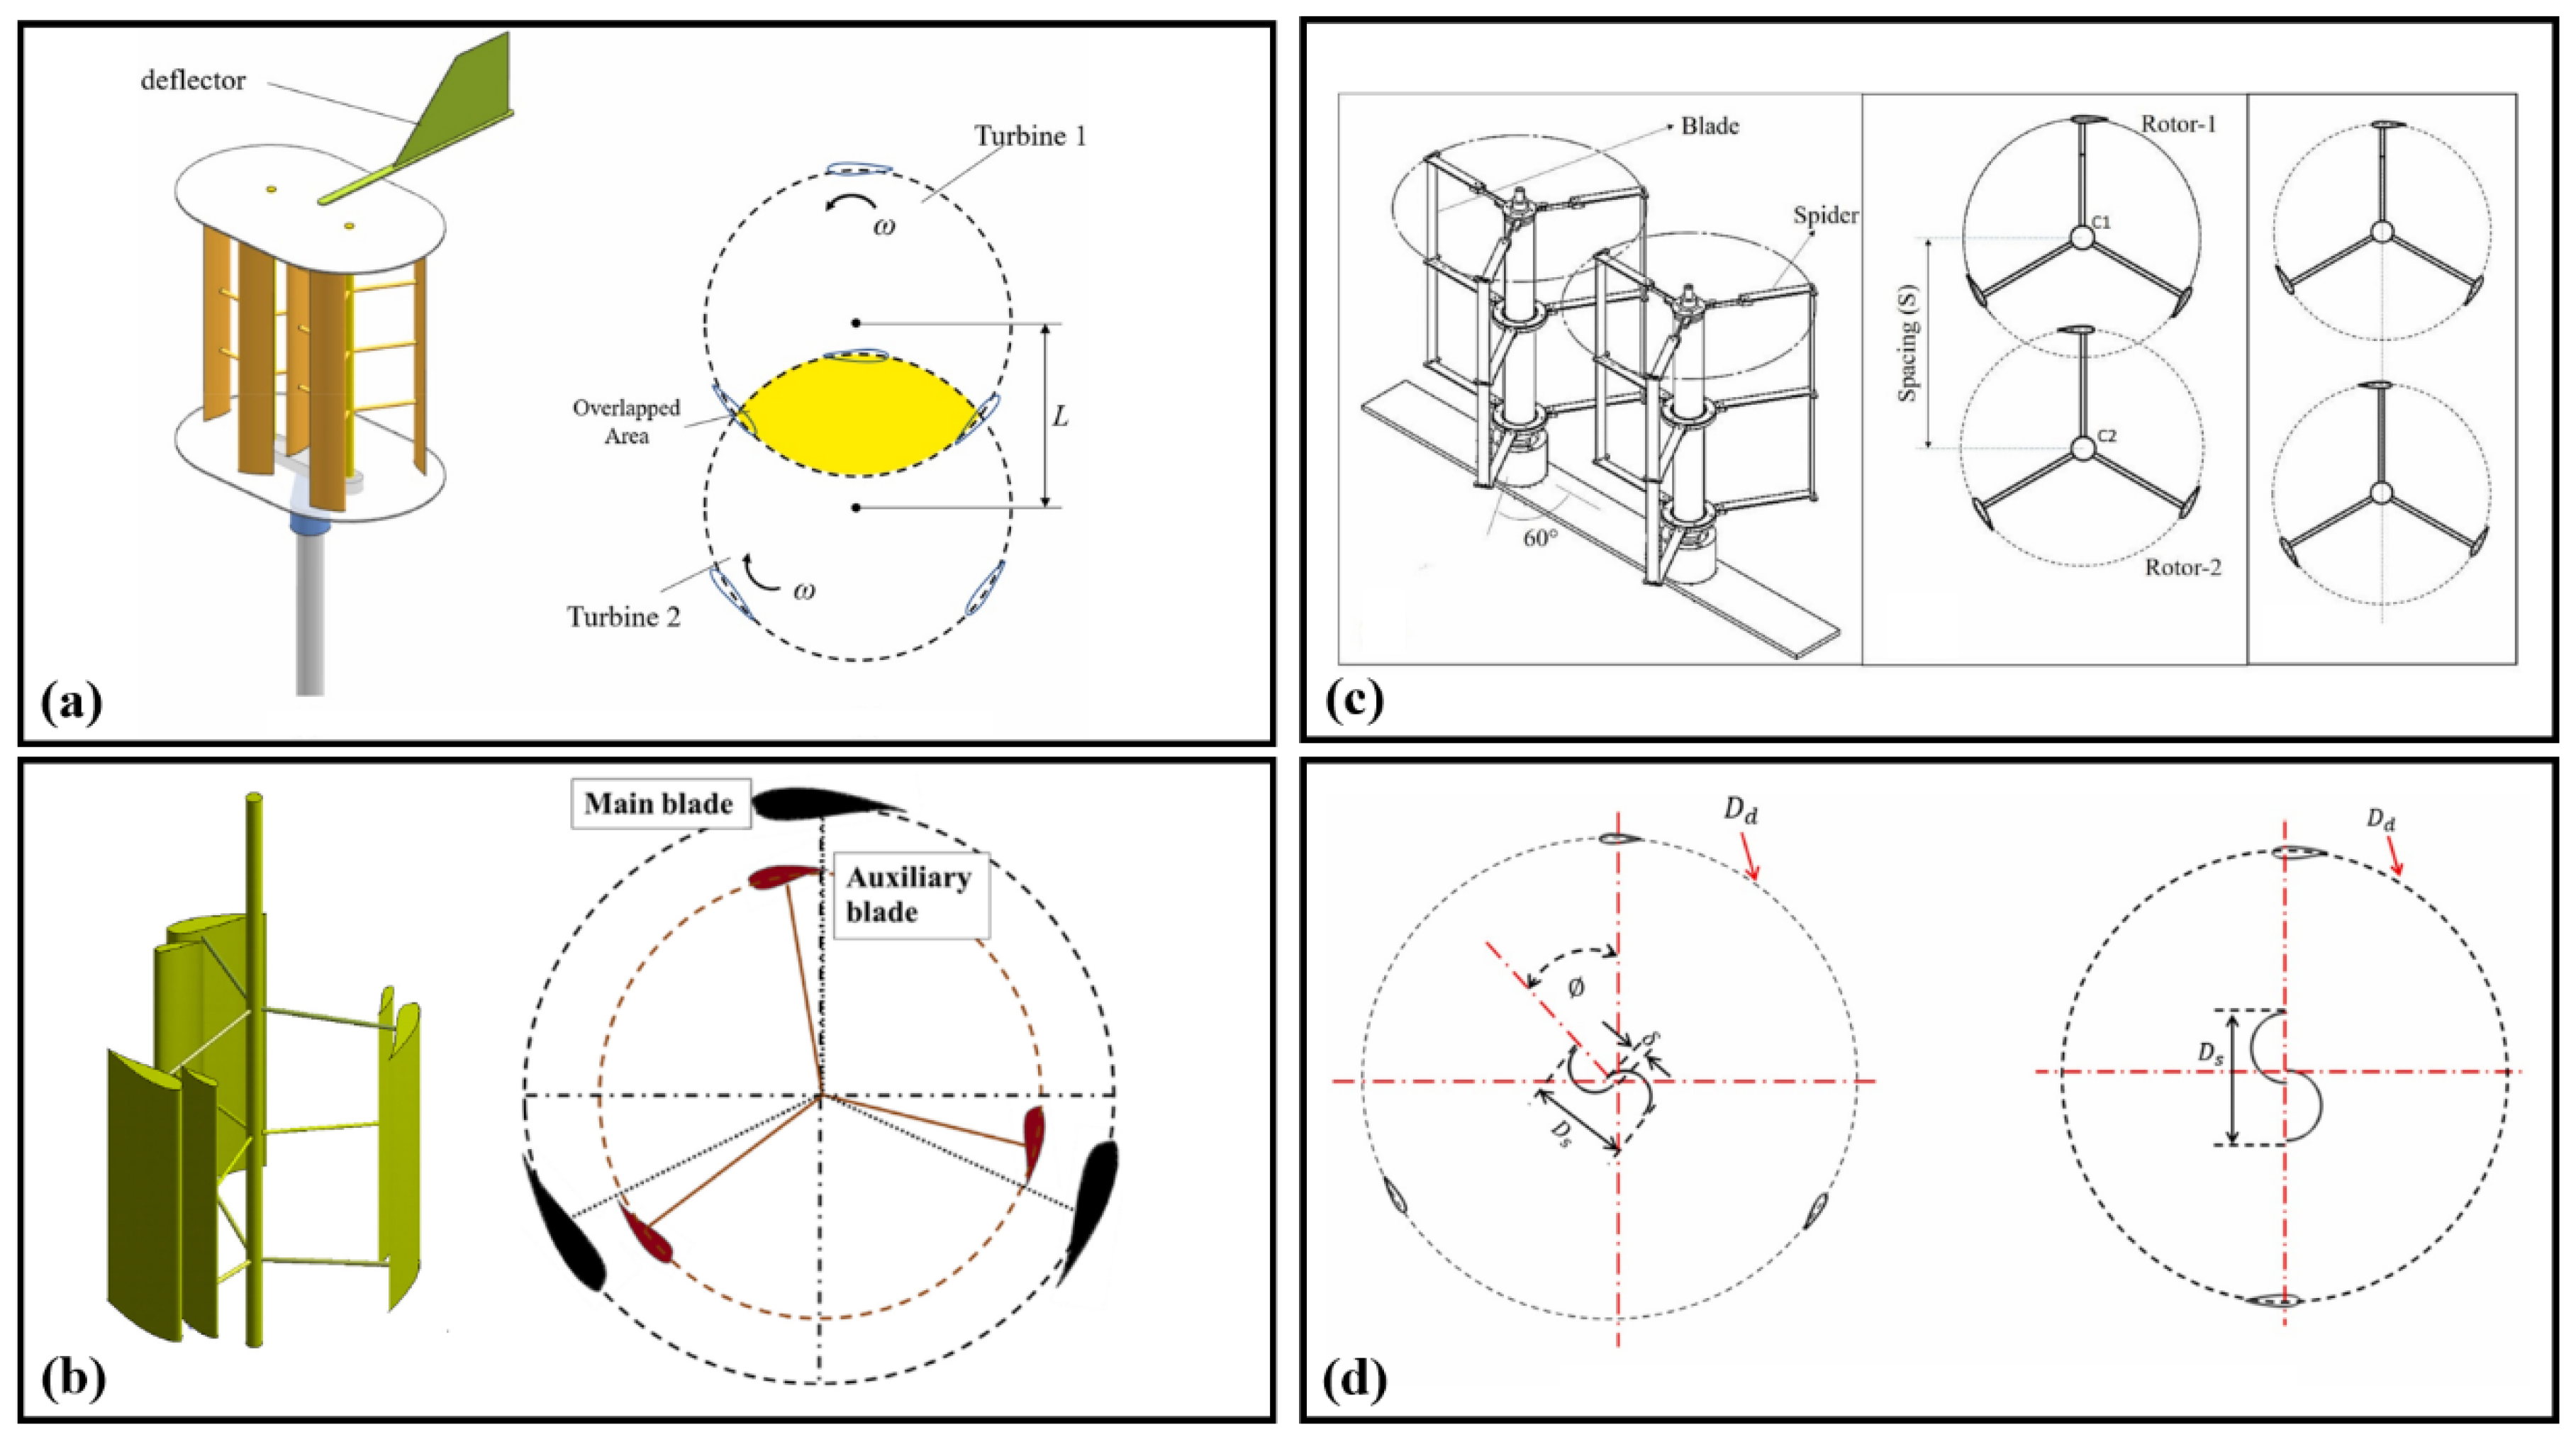
5.1. Analysis of Structural Design, Performance Enhancement, and Experimental Evaluation of Hybrid Darrieus Rotors

The schematic representation of the double-Darrieus hybrid vertical-axis wind turbine (DD-VAWT) structure is illustrated in Figure 2a. The wind turbine primarily comprises blades, a main shaft, and support rods. In the computational model of the DD-VAWT employed in their investigations [4], simplifications were made to the main shaft and support rods, focusing on the inner and outer ring turbines. The blades of the wind turbine utilize NACA 0021 airfoils, with an installed pitch angle of 0°. As a result, the outer surface of the blade serves as the pressure side in the upstream half-cycle and transitions to the suction side in the downstream half-cycle [74]. The initial structural parameters for the DD-VAWT can be found in [4].
Furthermore, optimized design configurations for the outer turbine and the design matrix from the DOE (Box–Behnken) method were utilized to perform computer-aided design (CAD) modeling. The larger outer turbine was strategically positioned on the outer side to maximize wind energy extraction. To achieve self-starting capability, an inner turbine, designed with a DU 06-W-200 cambered airfoil, was employed as a replacement for the Savonius VAWT. Both the outer and inner turbines in the hybrid configuration are connected to the central rotating shaft, which is further linked to the generator. The isometric view of the CAD model for the DD hybrid VAWT is depicted in Figure 2b [1].
In fact, it has been found that the standard Darrieus configuration’s output power is effectively zero below a wind speed of 3.65 m/s, indicating its inability to convert the kinetic energy of airflow into electrical power at such low speeds. In contrast, the proposed hybrid wind turbine demonstrates a self-starting capability at a wind speed as low as 2.81 m/s, with a rated power output of 1.522 kW at 7.5 m/s. The enhanced power coefficient achieved by this research team and the ability of the proposed hybrid wind turbine to harness wind energy at lower wind speeds extend its potential for application in various small to large-scale power projects.
To supplement, a straight-bladed VAWT was enhanced with flat plate guiding walls, and a 2D simulation was conducted to optimize the parameters of these flat plates through metamodeling. Due to their simplicity and cost-effectiveness, flat guiding walls have been retrofitted to standalone Darrieus VAWTs to increase efficiency, making them suitable for both urban and rural installations. As depicted in Figure 2c, the guiding walls were arranged around the rotor of a straight-bladed Darrieus VAWT [6].
Indeed, a comparison between an open Darrieus VAWT and an optimal Darrieus VAWT equipped with guiding walls demonstrated a significant improvement of up to 177% in the power coefficient at λ = 3 . This enhancement is attributed to the increased airflow velocity when guiding walls are employed with the VAWT. Therefore, the strategic placement and configuration of guiding walls plays a crucial role in maximizing the power output.
The simultaneous consideration of aerodynamic performance and self-starting capability in D-VAWTs is of critical importance. In fact, previous studies have primarily focused on fixed-radius or fixed-solidity D-VAWTs, with limited research available on variable-solidity VAWTs. The self-starting ability and aerodynamic efficiency of D-VAWTs are influenced by changes in solidity. In fact, their research [8] introduces a novel variable-solidity D-VAWT, designed to improve both self-starting capability and efficiency by adjusting the turbine’s radius to alter its solidity. The concept of this innovative variable-solidity D-VAWT is illustrated in Figure 2d [8]. The maximum C p achieved is 0.342 at an optimal λ = 3.25 . In comparison to a fixed-solidity D-VAWT σ = 0.83 , the maximum power output of the single D-VAWT increased from 53.42 W to 100.39 W, representing an increase of 188%.
Additionally, to establish a baseline for comparison, a model of the hybrid VAWT without tubercles is depicted in Figure 2e. This model serves as a reference for assessing the impact of tubercles on the hybrid VAWT’s performance. To investigate these effects, three distinct configurations were developed [7], each featuring specific blade arrangements:
  • Tubercles applied exclusively to the blades of the inner turbine.
  • Tubercles applied solely to the blades of the outer turbine.
  • Tubercles incorporated on the blades of both the inner and outer turbines.
The results demonstrated that the highest C p of 0.475 was achieved by the proposed hybrid VAWT at a TSR of 3. Additionally, the proposed turbine exhibited superior C p values at both low TSRs (ranging from 1 to 2.1) and high TSRs (from 4.1 to 5) when compared to the existing hybrid VAWT and the H-rotor Darrieus turbine.
For experimental testing, a scaled-down hybrid VAWT model with tubercle blades, designed at a scale factor of 18, was developed. A photograph of the scaled model is provided in Figure 2f [7]. To ensure consistent flow velocity, an automatic control mechanism was implemented. The wind turbine’s angular velocity was regulated in accordance with the varying speed of the incoming airflow, adjusted based on the specific testing conditions. A bracket was engineered, ensuring precise alignment of the turbine at its center via a central rotating shaft. The rotor of the turbine was supported by two deep-groove ball race bearings, which functioned as thrust bearings to bear the turbine’s weight and facilitate the free rotation of the shaft. The alignment and position of the central shaft were fine-tuned using nuts and bolts. To reduce friction between the model shaft and the upper holding assembly, grease and lubricating oil were applied. Remote adjustments of the propeller blades’ pitch angle were made to control the airflow speed. The data collected were thoroughly analyzed to confirm that the results accurately reflected the hybrid wind turbine’s performance under free-air conditions. Performance evaluation was conducted using a pulley and weight mechanism directly attached to the rotor shaft. The dynamic force generated was measured and converted into dynamic torque. A digital tachometer with laser light and an accuracy of ±2% was employed by this research team [7] to estimate the rotational velocity of the wind turbine. The generated aerodynamic moments were recorded, and various aerodynamic performance parameters were derived from the observations.

5.2. Parametric Design and Performance Analysis of Darrieus with Advanced Configurations and Enhanced Stability

The proposed study involves the calculations and parametric analysis for Darrieus-type contra-rotating wind turbines. The feasibility of the simulation model is validated by comparing the simulation results with the wind tunnel experimental data obtained from the wind turbine model by Li et al. [75]. In their analysis, the CRVAWT was modeled using the parametric CAD modeling program SolidWorks 2019, as depicted in Figure 3a [2]. The VAWT, which comprises an upper rotor and a lower rotor, with each rotor containing two NACA0021 blades connected by brackets, is designed to rotate in opposite directions. A disk generator is attached between the rotors, and a floating platform is positioned at the bottom of the turbine. The rotor’s radius R and height H have been set to 1000 mm and 1200 mm, respectively, while the chord length c of the blades is 265 mm. The spacing d between the rotors is established at 0.25 H , and the blade pitch angle β is fixed at 6° based on Li’s experimental data [75].
Initially, a numerical simulation of an isolated VAWT was conducted using “STAR CCM+” software, and the results were compared with wind tunnel tests to confirm the model’s accuracy. Subsequently, the proposed CRVAWT was simulated and comparatively analyzed. The findings revealed that the CRVAWT demonstrates a lower power coefficient but enhanced stability than the isolated VAWT. Following optimization, the C p of the CRVAWT was increased to 0.1837, representing a 36.68% improvement over the pre-optimization C p , and reaching 99.19% of the C p of the isolated VAWT. Additionally, the total torque of the turbine was reduced by 96.96%, providing a significant stability advantage [2].
Alongside these, the conventional lift-drag combined HDWT effectively addresses the challenge of difficult start-up conditions. However, a rapid decrease in wind energy utilization efficiency is observed when λ exceeds 1, due to the interference caused by the drag blades. To address this issue, a convertible HDWT with drag-disturbed flow mode switching HDWT-D-DF is introduced in the investigations of Jiang et al. [19]. When λ reaches or exceeds 1, the D-DF device retracts, functioning to disturb the flow and thereby enhancing the aerodynamic performance of the turbine’s lift blades, with λ = 1 serving as the transition point for D-DF. Details are provided in Figure 3b [19].
In their study, 2D simulations were conducted to analyze the impact of various D-DF devices on the moment and wind energy consumption coefficients of the HDWT. Additionally, the process by which D-DF devices enhance the performance of the HDWT was elucidated through an analysis of the vortex cloud diagram. The results demonstrated that significant performance improvements are achieved during the startup phase of HDWTs equipped with D-DF devices. Specifically, it was shown that the drag blade effectively enhances the moment coefficient of the HDWTs at low TSRs by an average of approximately 41.74%. Furthermore, once the HDWTs are started and operating at high TSRs, all D-DF devices, except for the DF-Tri, can be utilized within the λ = 1.2 2 range to enhance the torque coefficient of the HDWT by an average of about 7.53%.
For the 3D modeling of the Darrieus HKT, design parameters such as blade profile and aspect ratio were considered by Kumar et al. [21] based on their previous study, which identified the optimum performance [76]. The NACA 4421 blade profile was selected for the design of the Darrieus HKT blade, with the aspect ratio set to unity, after evaluating multiple NACA profiles. The blade pitch angle was found to have a negligible effect on the performance of the HKT. They observed that the performance increase with solidity up to a certain limit, after which it declined. Consequently, in their study, blade profile and blade pitch angle were excluded from the scope, as they were deemed insignificant in the context of open channel applications. Furthermore, instead of varying the helix angle, a spherical shape was introduced to the blade by creating a spherical curve around the central point (i.e., the center of the sphere) of the turbine. The blade shape was then generated using the sweep method, with the NACA 4421 blade profile as the “profile” and a spherical curve as the “path”. The 3D models of the turbines were subsequently converted into IGES format and imported into “Ansys-CFX workbench” software for numerical analysis. Finally, the same 3D models were fabricated using 3D printing technology via the selective laser sintering (SLS) process, as shown in Figure 3c [21]. It was determined that C p increased with the blockage ratio. Overall, the performance of the 4-bladed SDHKT was found to be superior to that of the 3-bladed SDHKT. However, this research team for further analysis due to operational constraints considered the performance of the 3- and 4-bladed SDHKTs at a blockage ratio of 0.796. It was observed that the overall C p increased with fluid velocity, albeit less proportionately. Additionally, pressure drops across the turbine increased with higher TSR and fluid flow velocities inside the pipe. Concurrently, the VAWT model was analyzed at peak power and off-design TSR values. The predictions were evaluated by considering the complex flow field and the development of the near-wake region. It was determined that the 3D flow originating from the struts, finite blade effects, and the tilted operating condition critically influence the machine’s performance. High-fidelity simulations of an H-shaped VAWT in both upright and tilted conditions were conducted using the CFD solver “STAR-CCM+” (refer to Figure 3d [54] for details on the reference system and geometry representation).

5.3. Performance Impact of Strut Configurations and Blade Geometry on Vertical and Hydrokinetic Turbines

It has been suggested in previous investigations [77] that inclined struts could enhance the efficiency of VAWTs. The concept is based on the significant lifting force experienced by the blade during the upstream portion of the turbine revolution 0 ° < θ < 180 ° , where energy is extracted from the flow because the positive circumferential component of the lift exceeds the negative component of the drag. Conversely, the drag force exerted by the struts generates a negative torque on the turbine shaft, requiring energy for the struts to rotate with the blade. Therefore, in turbines equipped with inclined struts, certain configurations may allow the struts to generate lift, similar to the blade, and extract energy from the flow. To investigate this possibility, turbines with varying blade–strut angles were simulated by this research team [78], and the geometries are presented in Figure 4a [78]. It was found that the best turbine configuration presented in their investigation achieved an efficiency more than 20% higher than that of the reference turbine without struts.
As a further point, a geometrical lift-type hydrokinetic turbine model was developed using three helical blades in “Autodesk Inventor” a CAD-based software for product design. The NACA 0020 blade hydrofoil was selected due to its advantageous characteristics, including superior hydrodynamic performance among symmetric NACA airfoils, durability, and ease of manufacture, making it widely employed in the design of LHHTs [79]. A hydrofoil was generated by this research team [20] using the NACA airfoil data file, and a helical blade was subsequently created (Figure 4b, [20]) by selecting the profile along a helical path through the coil approach. Furthermore, a 3-bladed helical rotor was developed by employing a circular pattern, as depicted in Figure 4b [20].
In this context, numerical simulations were performed on the 3D-CFD LHHT model to investigate the influence of aspect ratio, considered within the range of 0.75–1.75, on performance at different TSR and water velocities. Additionally, wake recovery analysis was conducted by measuring the velocity deficit at various downstream locations of the rotor under a constant velocity of 1.0 m/s [20]. They found that the aspect ratio strongly affects the power coefficient, torque pulsations, and wake recovery. In addition, they observed that for an aspect ratio of ≥1.25, water velocity fully recovers at a distance 21 times the rotor diameter along the channel, where a second machine could be installed.
Figure 4c illustrates the upper half of the turbine along with the coordinate system. The cylindrical coordinates of the blade stacking line r z , positioned at the mid-chord of the airfoil, are detailed in [80]. Starting from ϑ = 0 ° , the first and second quarters represent the upwind side, while the third and fourth quarters correspond to the downwind side. Similarly, the fourth and first quarters constitute the windward part of the revolution, whereas the second and third quarters comprise the leeward portion. In their study, two versions of the rotor were considered, both sharing the number of blades, blade profile, and the troposkein curve. The first turbine, referred to as the “base” or “slanted” rotor, corresponds to the laboratory model that was tested in a wind tunnel. For this machine, the rotor was manufactured by bending the originally straight blade beams according to the prescribed troposkein curve r z , resulting in the blade profile being orthogonal to the troposkein curve rather than to the axis of rotation. Consequently, in all sections except the midspan, the profile cut in a plane normal to the axis of rotation exhibits increased thickness. In the quasi-linear portion of the troposkein, which covers approximately half of the rotor’s axial extent, the actual airfoil thickness increases to about 30% of the chord [45]. This suggests that the more cost-effective manufacturing process is recommended not only for structural reasons, but also due to aerodynamic considerations.
To supplement, the viability of V-shaped blades for vertical-axis turbines was investigated (Figure 4d [12]). The flow structure and performance of V-shaped blade turbines were studied, and the effects of sweeping shapes on modifying flow structure were scrutinized by other research teams. The introduction of sweep was found to promote a secondary spanwise flow, which alters dynamic stall. However, V-shaped blade turbines were determined to be inferior to straight and helical types. Analysis of V-shaped blade turbines at low TSRs, which are crucial for assessing the turbine’s ability to initiate rotation and reach higher TSRs, revealed that these turbines do not offer significant performance improvements compared to conventional types, despite the increased complexity of blade manufacturing compared to straight designs.

5.4. Aerodynamic Performance Enhancement of Darrieus Turbines Using Gear-like Layouts and Auxiliary Blades

In another investigation, the efficiency of Darrieus turbines was enhanced through the implementation of a gear-like turbine layout [10]. A gearbox unit was installed between two turbines, which were rigidly connected by a drive shaft to enable synchronous and opposite rotation. The turbines were designed to rotate alternately, resembling gears, and operate independently without interference (Figure 5a [10]). The number of turbines in a Darrieus layout is denoted by N , and when N = 2 , the installation consists of two conventional Darrieus turbines, as shown in Figure 4a. The gap between adjacent turbines is represented by L .
The turbine numerically modeled in their study [10] is a three-bladed Darrieus turbine with a NACA 0021 airfoil, a chord length of 85.8 mm, and a turbine diameter of 1030 mm. This turbine had previously been tested by Castelli et al. [81] and was utilized for the validation of their CFD model.
Meanwhile, a 2D CFD method was employed by the research team [10] to propose a Darrieus turbine layout based on the gear meshing principle, allowing the adjacent turbine gap to be smaller than the turbine diameter. A comparative analysis was conducted on the new layout, considering two rotational directions, five turbine gaps, and varying numbers of turbines in the multi-turbine layout. The findings indicated that in the two-turbine layout, an efficiency improvement of 28.92% was achievable, while in the multi-turbine layout, efficiency gradually increased with the number of turbines at a TSR of 3.0, eventually stabilizing at a corrected power coefficient C p c o r r of 0.588.
Concurrently, to conduct their computational study [22], the entire geometry of both the conventional and modified H-rotor was computationally designed using “Ansys Design Modeler”, as illustrated in Figure 5b [22]. The manufacturing of the conventional and modified H-rotor models was subsequently performed for experimental investigation. In their investigation, an unsymmetrical airfoil, specifically “NREL S823,” was selected to examine the effects of an auxiliary blade on aerodynamic performance. The design incorporated three S823 airfoils, each with a chord length of 100 mm, while the modified H-rotor featured three pairs of blades. Each pair consisted of a main blade and an auxiliary blade. The chord length of the main blade C 1 was maintained at 100 mm, and the auxiliary blade C 2 had a chord length of 50 mm, resulting in a chord length ratio C 1 C 2 of 2. The incidence angle defined as the angle between the airfoil chord and the tangent velocity vector for both the main and auxiliary blades was set to 0°. The vertical distance between the main and auxiliary airfoils, denoted by y , was approximately 20% of the rotor’s radius. According to the experimental results, the maximum static torque coefficient C t s and C p of the modified H-rotor were found to be 0.11 and 0.18, respectively, representing increases of 84% and 22% compared to the conventional H-rotor. Their study concluded that the inclusion of auxiliary blades can significantly improve the performance of the H-rotor, making it a more competitive option for harnessing wind energy in regions with low wind speeds.
Complementary to this, the physical model of the coupled twin-rotor VAWT pair, including rotor discs for both overlapping S D < 1 and non-overlapping S D > 1 configurations, is illustrated in Figure 5c [5]. The coupled twin-rotor setup consists of two H-rotors arranged with a fixed stagger, ensuring that the blades of the two rotors do not interfere with each other even when their paths cross. For comparison purposes, simulations were conducted with coupled rotors for scenarios where relative spacing’s exceed unity S D > 1 . In practice, such a fixed stagger could be achieved through either a gear mechanism or an electromagnetic system that maintains a constant phase relationship between the rotors. This research team found that at optimal overlap, each rotor in the coupled counter-rotating twin-rotor configuration generated a power output 25% greater than that of a single-rotor VAWT.
Moreover, the aerodynamic performance of hybrid Darrieus–Savonius turbine rotors was assessed across varying diameter ratios, attachment angles, and a constant overlap ratio of 0.2. Additionally, the influence of dimples on both individual Darrieus rotors and hybrid rotors was evaluated. The hybrid rotors under investigation consist of one three-blade Darrieus rotor and one two-blade Savonius rotor. The Darrieus rotor analyzed is the straight-blade NACA 0021, as examined by Castelli et al. [81]. The Savonius rotor is composed of two semicircular blades, previously studied by Asadi and Hassanzadeh [82]. Detailed specifications and geometrical parameters for both turbine rotors are provided in [23]. The schematic representation of the hybrid rotor being tested is depicted in Figure 5d [23]. It was determined that a dimple with a circular diameter, equal to 8% of the blade chord and positioned 0.25 blade chord lengths from the leading edge, provides optimal performance.

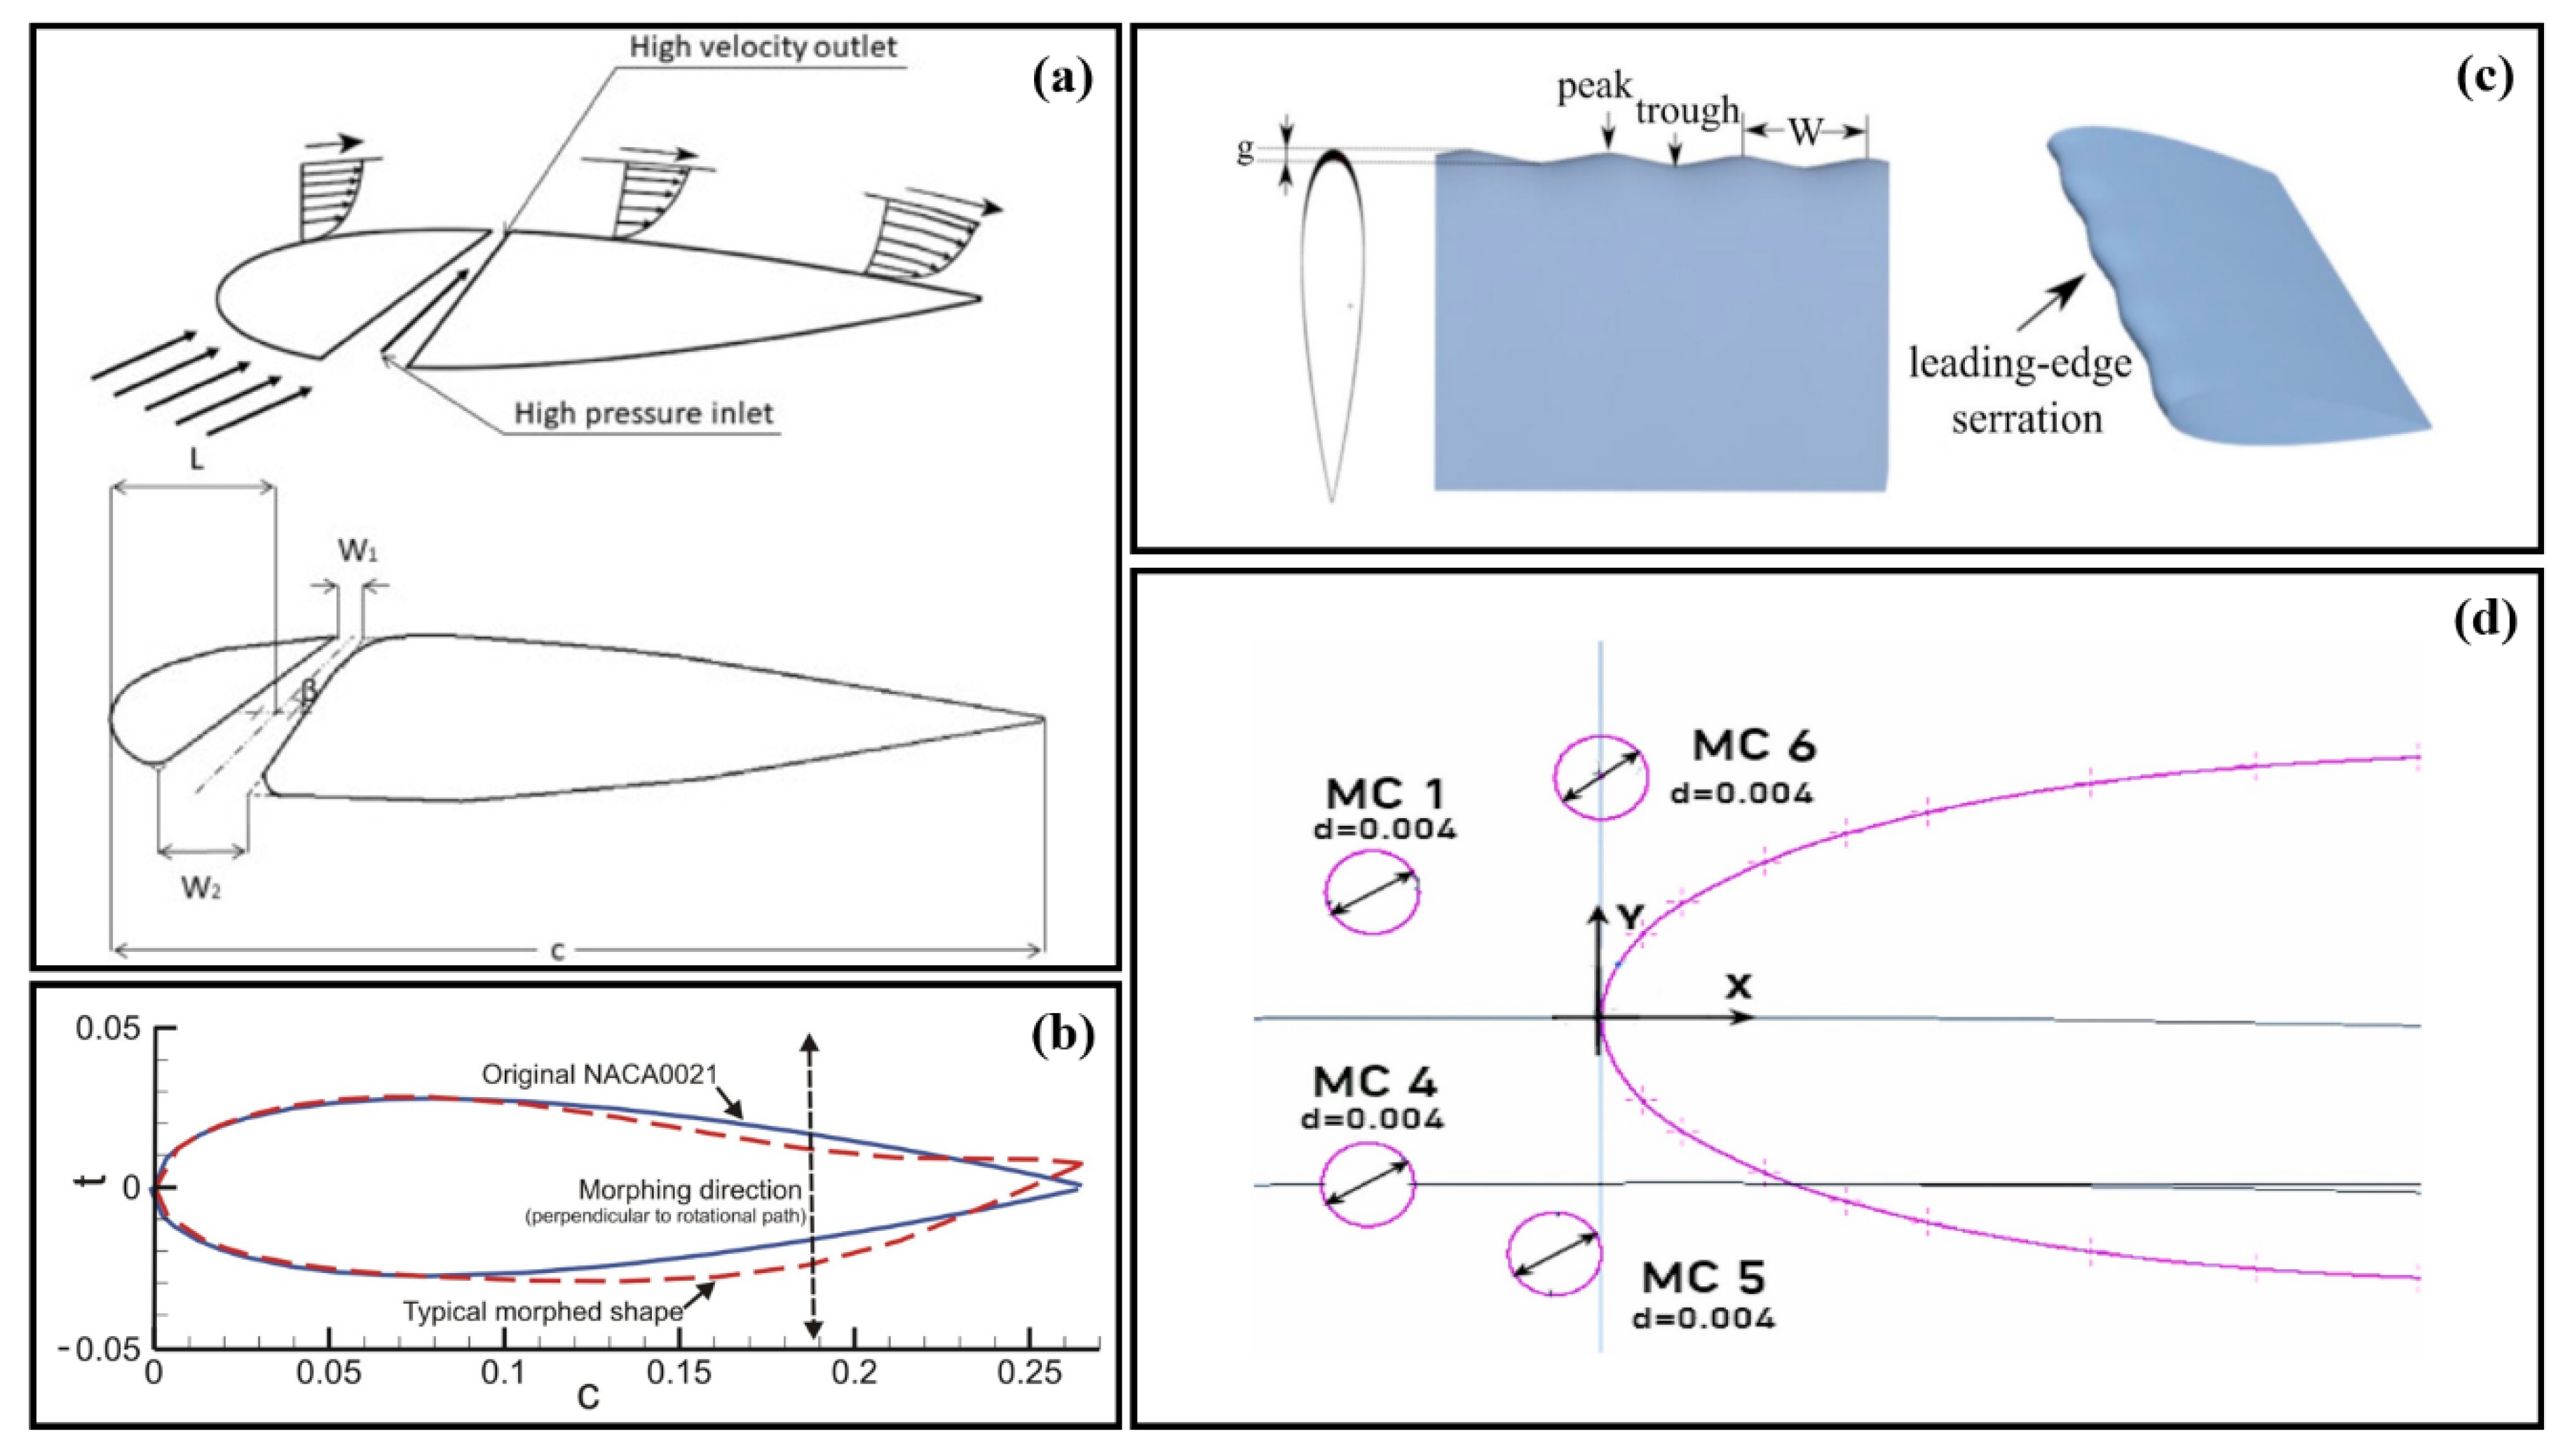
5.5. Analysis of Advanced Aerodynamic Modifications for Enhancing Darrieus Turbine Performance

The geometrical parameters of the suction cavity (SC) are depicted in Figure 6a. The objective of the study [11] was to conduct a preliminary evaluation of the trapped vortex cavity as a boundary layer control method for Darrieus turbine blades. Consequently, some geometric parameters of the cavity were kept constant to focus primarily on aerodynamic considerations. The main geometric features of the cavity were selected based on a previous study by Ibrahim [83] and are detailed in [11]. It should be noted that further research would be required to extend the analysis and determine the optimal cavity geometry in relation to the base airfoil and operating conditions. High-fidelity CFD simulations were employed following validation against experimental results. The impact of the suction momentum ratio C µ on turbine performance was investigated. It was found that the turbine equipped with suction cavity airfoils (SC) demonstrated a higher power coefficient compared to the turbine with baseline airfoil (BL) blades, particularly at low TSRs. For the tested scenario, the maximum predicted power coefficient for the SC turbine was 0.435 at TSR = 2.3, whereas the baseline turbine achieved 0.375 at TSR = 2.6. At lower TSRs, specifically TSR = 2, the power coefficient of the SC turbine was approximately twice that of the BL turbine.
On top of that, the influence of dual-cavity configurations on wind turbine performance has been examined, as illustrated in Figure 6b [49]. The cavity size remained constant, with only variations in the positions of the cavities. Six distinct cavity positions were considered, as referenced in [49]. An initial increase in the C p was observed, reaching a peak before declining with further increases in TSR across all cases. This pattern aligns with the results presented in ref [84]. For the ULST and USLT airfoils, substantial enhancements in C m and C p were recorded, relative to the airfoil without a cavity, indicating the beneficial impact of incorporating a dual cavity. The ULST airfoil demonstrated the highest C p value of 0.34, representing a maximum improvement of 10% compared to an airfoil without a cavity.
Extending this idea, the turbine equipped with J-shaped airfoils featuring varying opening ratios has been assessed regarding performance at both low and high λ values, as well as dynamic start-up behavior under a freestream wind speed of V = 5   m / s . The turbine characteristics examined correspond to those in the validation study, utilizing a conventional NACA0018 airfoil, a turbine radius of R = 0.375 m , and a blade chord length of c = 0.083   m . Six opening ratios—10%, 20%, 30%, 40%, 60%, and 90%—positioned on both the outer and inner surfaces of the airfoil were analyzed [9]. The turbine’s schematic with the original NACA0018 airfoil profile (uncut) and the airfoils with the six different opening ratios (OR) when openings are positioned on the outer surface is illustrated in Figure 6c [9].
The findings indicate that a dynamic start-up model is essential for an assessment of the self-starting capability of the J-shaped airfoil, rather than relying on calculated torque/power coefficients at constant TSRs. Furthermore, it has been observed that openings on the inner surface of the airfoil do not provide any performance advantages, whereas the self-starting ability of the turbine increases with a higher opening ratio. Additionally, a significant improvement in starting ability is noted with the use of the thicker NACA 0018 airfoil, and it has been found that the reversed versions of cambered airfoils exhibit superior self-starting capabilities compared to their original profiles. Moreover, a better self-starting ability has been identified in the turbine utilizing a J-shaped airfoil with a slightly positive pitch angle β = 2 ° .
Additionally, the schematic representation of a typical airfoil and the specific airfoils analyzed in their study are depicted in Figure 6d [65]. In the design of an H-type Darrieus turbine, several crucial parameters, including TSR, solidity σ , AoA α , and performance indicators such as C l , C d , C m , C p , and C o P , must be taken into account [65]. Jain et al. [65] have explored the influence of the blade thickness-to-chord ratio (t/c) on the dynamic stall phenomenon in an H-type Darrieus wind rotor. A 2D incompressible numerical analysis was conducted on a single-bladed rotor at a TSR of 2, aimed at understanding the complex flow physics surrounding the blade by utilizing a transitional shear stress transport (TSST) model. Symmetrical NACA airfoils with five different t / c ratios (9%, 12%, 15%, 18%, and 21%) were studied. It was found that for thinner airfoils ( t / c = 9 %   a n d   12 % ), the dynamic stall vortex (DSV) formation was preceded by the formation and bursting of a leading edge (LE) laminar separation bubble (LSB), resulting in a more abrupt LE-type stall. For t/c = 15%, a mixed-type stall was observed, with LSBs distributed over the airfoil, leading to the development of two coherent vortex structures that eventually merged to form the DSV. Thicker airfoils (t/c = 18% and 21%) exhibited a trailing edge (TE) type stall. The highest peaks in the lift and drag coefficients C l and C d , with values of 1.87 and 1.27, respectively, were recorded with the thinnest airfoil.
In another study [56], the blade section analyzed in their conducted study features a NACA0018 profile. During rotation, the blade’s leading edge is capable of producing a smooth bending deflection at point O , as depicted in Figure 6e [56], resulting in a continuous and smooth change in camber. The leading-edge radius remained unchanged. In Figure 6e, β represents the deflection angle, l denotes the length of the dynamically deflectable leading-edge portion, and α indicates the increment of the AoA. The findings indicate that significant improvements in the blade surface flow field can be achieved by actively controlling the deflection of the blade’s leading edge, which allows the turbine to complete the self-starting process and stabilize the output torque more quickly. In comparison to conventional hydrokinetic turbines, the hydrokinetic turbine equipped with blades that possess a deflectable leading edge can reach a stable state after just one rotation cycle, reducing the time required for the self-starting process considerably.

5.6. Aerodynamic Optimization Techniques for Enhanced Darrieus Turbine Performance

The Darrieus-type wind turbine, a lift-driven VAWT, primarily focuses on the lift force exerted on the turbine blade. However, at higher angles of attack, flow separation occurs due to the positive pressure gradient toward the airfoil’s trailing edge. The typical flow behavior along an airfoil section, including the initiation of flow separation at the trailing edge for both conventional and slotted airfoils, is depicted in Figure 7a. The slot, which extends from the pressure side (lower side) to the suction side (upper side) [85], creates a jet flow due to the pressure difference between the two sides. This jet injects high momentum into the boundary layer of the upper surface, effectively eliminating separation at mild angles of attack and extending the airfoil’s high lift range. As shown in their investigations, the slot parameters—location, angle of inclination, and dimensions—were optimized for the NACA 0018 airfoil, commonly used in Darrieus turbines. The flow over the turbine was modeled using the “Ansys-Fluent” code. The main findings indicate that the VAWT equipped with a slotted airfoil (SA) exhibits a lower optimum TSR compared to the baseline (BL) turbine. This reduction in TSR is associated with the SA turbine’s capability to generate higher torque at lower rotational speeds. Additionally, the aerodynamic analysis of the SA turbine demonstrates that the airfoil slot delays flow separation at high angles of attack, thereby enhancing the torque and power coefficients at low TSR.
From a manufacturing perspective, optimizing the blade shape at every azimuthal angle or time step is not practically feasible. Consequently, the optimization process was conducted at 60° intervals, with deformations permitted in the direction perpendicular to the blade’s path, as shown in Figure 7b [15]. After each optimization cycle, the coordinates of the optimized blade were extracted and stored for subsequent use. These optimized shapes were then incorporated into their solver using a curve-fitting function. Linear interpolation between two optimized intervals (i.e., 60°) was performed to define the blade shape at each azimuthal angle or time step. The subsequent sections will provide a more detailed description of this process. The performance of the morphed-blade rotor was evaluated in comparison to a fixed-blade rotor.
It should be noted that while significant work has been conducted on implementing leading-edge protuberances on stationary wings, the optimization of their configuration for application on an H-type rotor has not been fully elucidated. The primary objective of the current study is to investigate the effects of leading-edge protuberances on both an isolated stationary blade and a three-blade Darrieus H-type wind rotor. The three-dimensional CAD model of a single blade is presented in Figure 7c [14]. In their investigation, to optimize the leading-edge configuration, various sinusoidal wave serrations were implemented and tested. A comparative analysis of the leading-edge protuberances, considering parameters such as amplitude and wavelength, was performed to assess detailed flow characteristics and power generation of the VAWTs. Additionally, a thorough analysis of the counter-rotating vortices induced by the leading-edge protuberance was conducted to evaluate their impact on static and dynamic stall mechanisms [14]. They have found that among all the tested configurations, the protuberance with an amplitude of 1% of the chord length (c) and a wavelength of 2.5%c exhibited the best performance.
The placement of micro-cylinders around airfoils, as illustrated in Figure 7d [16], has been investigated with the aim of enhancing the performance of the Darrieus turbine. This research involves the examination of micro-cylinders of various diameters, specifically with diameter-to-chord ratios d / c of 0.029, 0.05, and 0.065. It has been observed that turbine performance improves under two specific conditions: when the micro-cylinder has a smaller diameter, where the average power coefficient C p a v g increases by 9.5% compared to the conventional turbine at M C 1   d / c = 0.029 , and when the micro-cylinder is installed at the front of the blade’s leading edge, where C p a v g shows an increase of approximately 14.1% compared to the conventional turbine at location M C 8 . Conversely, turbine performance is found to decrease when the micro-cylinder has a larger diameter or is positioned on the suction side or further down toward the pressure side of the blade’s leading edge.

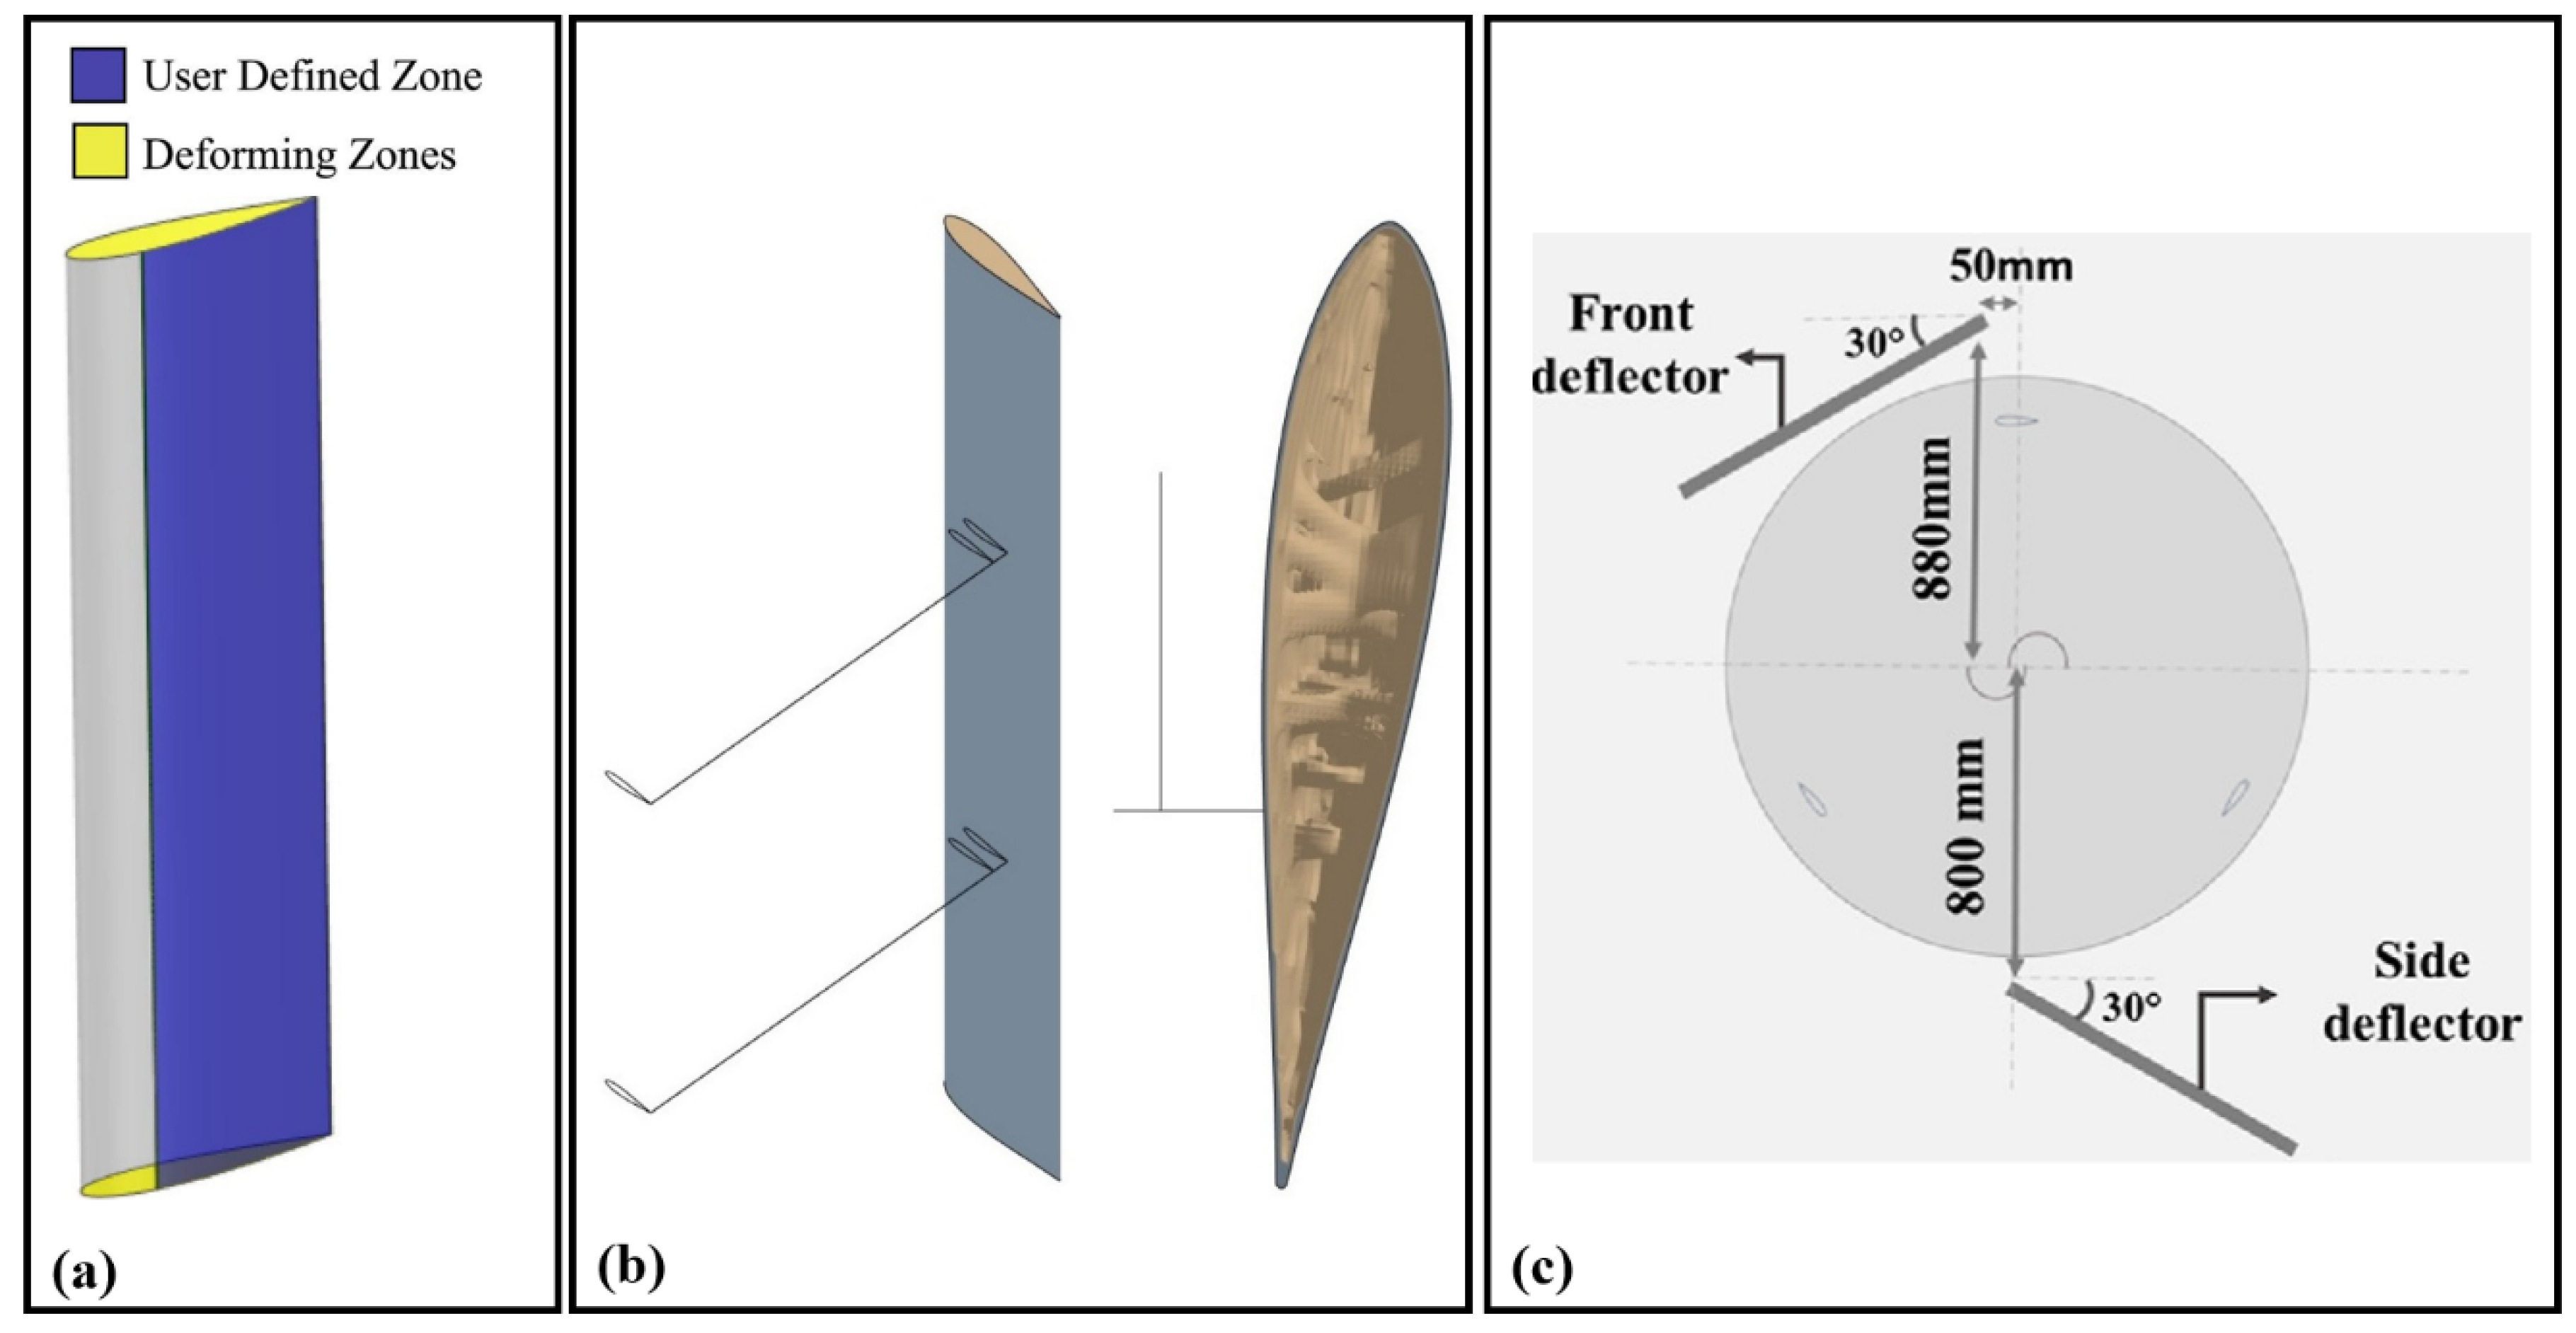
5.7. Mesh Techniques and Structural Optimization for Enhanced Darrieus Turbine Performance

A dynamic mesh, commonly utilized for simulating problems involving boundary motion, is employed in the assessment carried out by Hijazi et al. [13] to facilitate the deformation required during the turbine’s rotation using a compiled user-defined function (UDF) in “Ansys-Fluent”. To ensure the maintenance of element quality and to prevent negative cell volumes, which can occur if the mesh is excessively displaced during each time step, smoothing and remeshing schemes were applied in configuring their dynamic mesh model. Since remeshing is applicable only to tetrahedral meshes in 3D and triangular meshes in 2D, a mesh with triangular elements is utilized in their study. The diffusion method, known for its ability to handle large deformations, was selected for the mesh smoothing process. Mesh smoothing parameters are configured as follows: the cell volume is used as the diffusion function to mitigate the risk of negative cell volumes during blade deformation, while the diffusion parameter and the maximum number of iterations are maintained at their default values in “Ansys-Fluent”, set at 1.5 and 50, respectively. Additionally, dynamic mesh zones are established to control the node positions on the blade surfaces. Specifically, the deforming portion of the blade is defined by a user-defined zone, which is compelled to follow the UDF compiled in “Ansys-Fluent”. The top and bottom surfaces of the blade are designated as deforming zones to accommodate the deformation of the user-defined zone, as illustrated in Figure 8a [13].
Furthermore, the study conducted by Marzec et al. [17] focuses on the structural topology optimization of an H-rotor wind turbine using a one-way fluid structure interaction (FSI) approach. This methodology integrates the unsteady Reynolds averaged Navier–Stokes equations (URANS) with steady-state linear elasticity equations and a density-based topology optimization method. Pressure profiles from CFD simulations were applied at the rotation point where the highest forces were observed on the blade surface, and centrifugal forces were considered in the structural model. Simulations were conducted at a wind speed of 30 m/s and a rotational velocity of 90 rad/s, representing extreme operating conditions. The final blade topology is depicted in Figure 8b for enhanced visualization [17].
Previous investigations into deflector parameters affecting the efficiency of Darrieus rotors have examined factors such as angle, distance, and placement. Syawitri et al. [86] observed that upper deflectors positioned upstream of the rotor result in greater power enhancement compared to lower deflectors. Jin et al. [87] found that an increase in the distance of the deflector from the turbine is associated with a decrease in the maximum power coefficient. Chen et al. [88] identified an optimal deflector configuration with a reduced vertical distance between the upper deflector and the rotor’s center, achieving a deflector angle of 30°. To improve aerodynamic efficiency, their investigation introduces a front deflector set at a 30° angle, strategically positioned upstream and close to the turbine. They utilized a double deflector setup in their study to leverage the benefits of both deflectors for enhanced performance. The deflectors are designed to be 0.8 m long and 0.01 m wide. The schematic illustrating the precise placement of both deflectors is shown in Figure 8c [18].

6. CFD Contours for Visualizing Design Effects on Complex Flow Structures: Parametric Studies on Darrieus Rotors

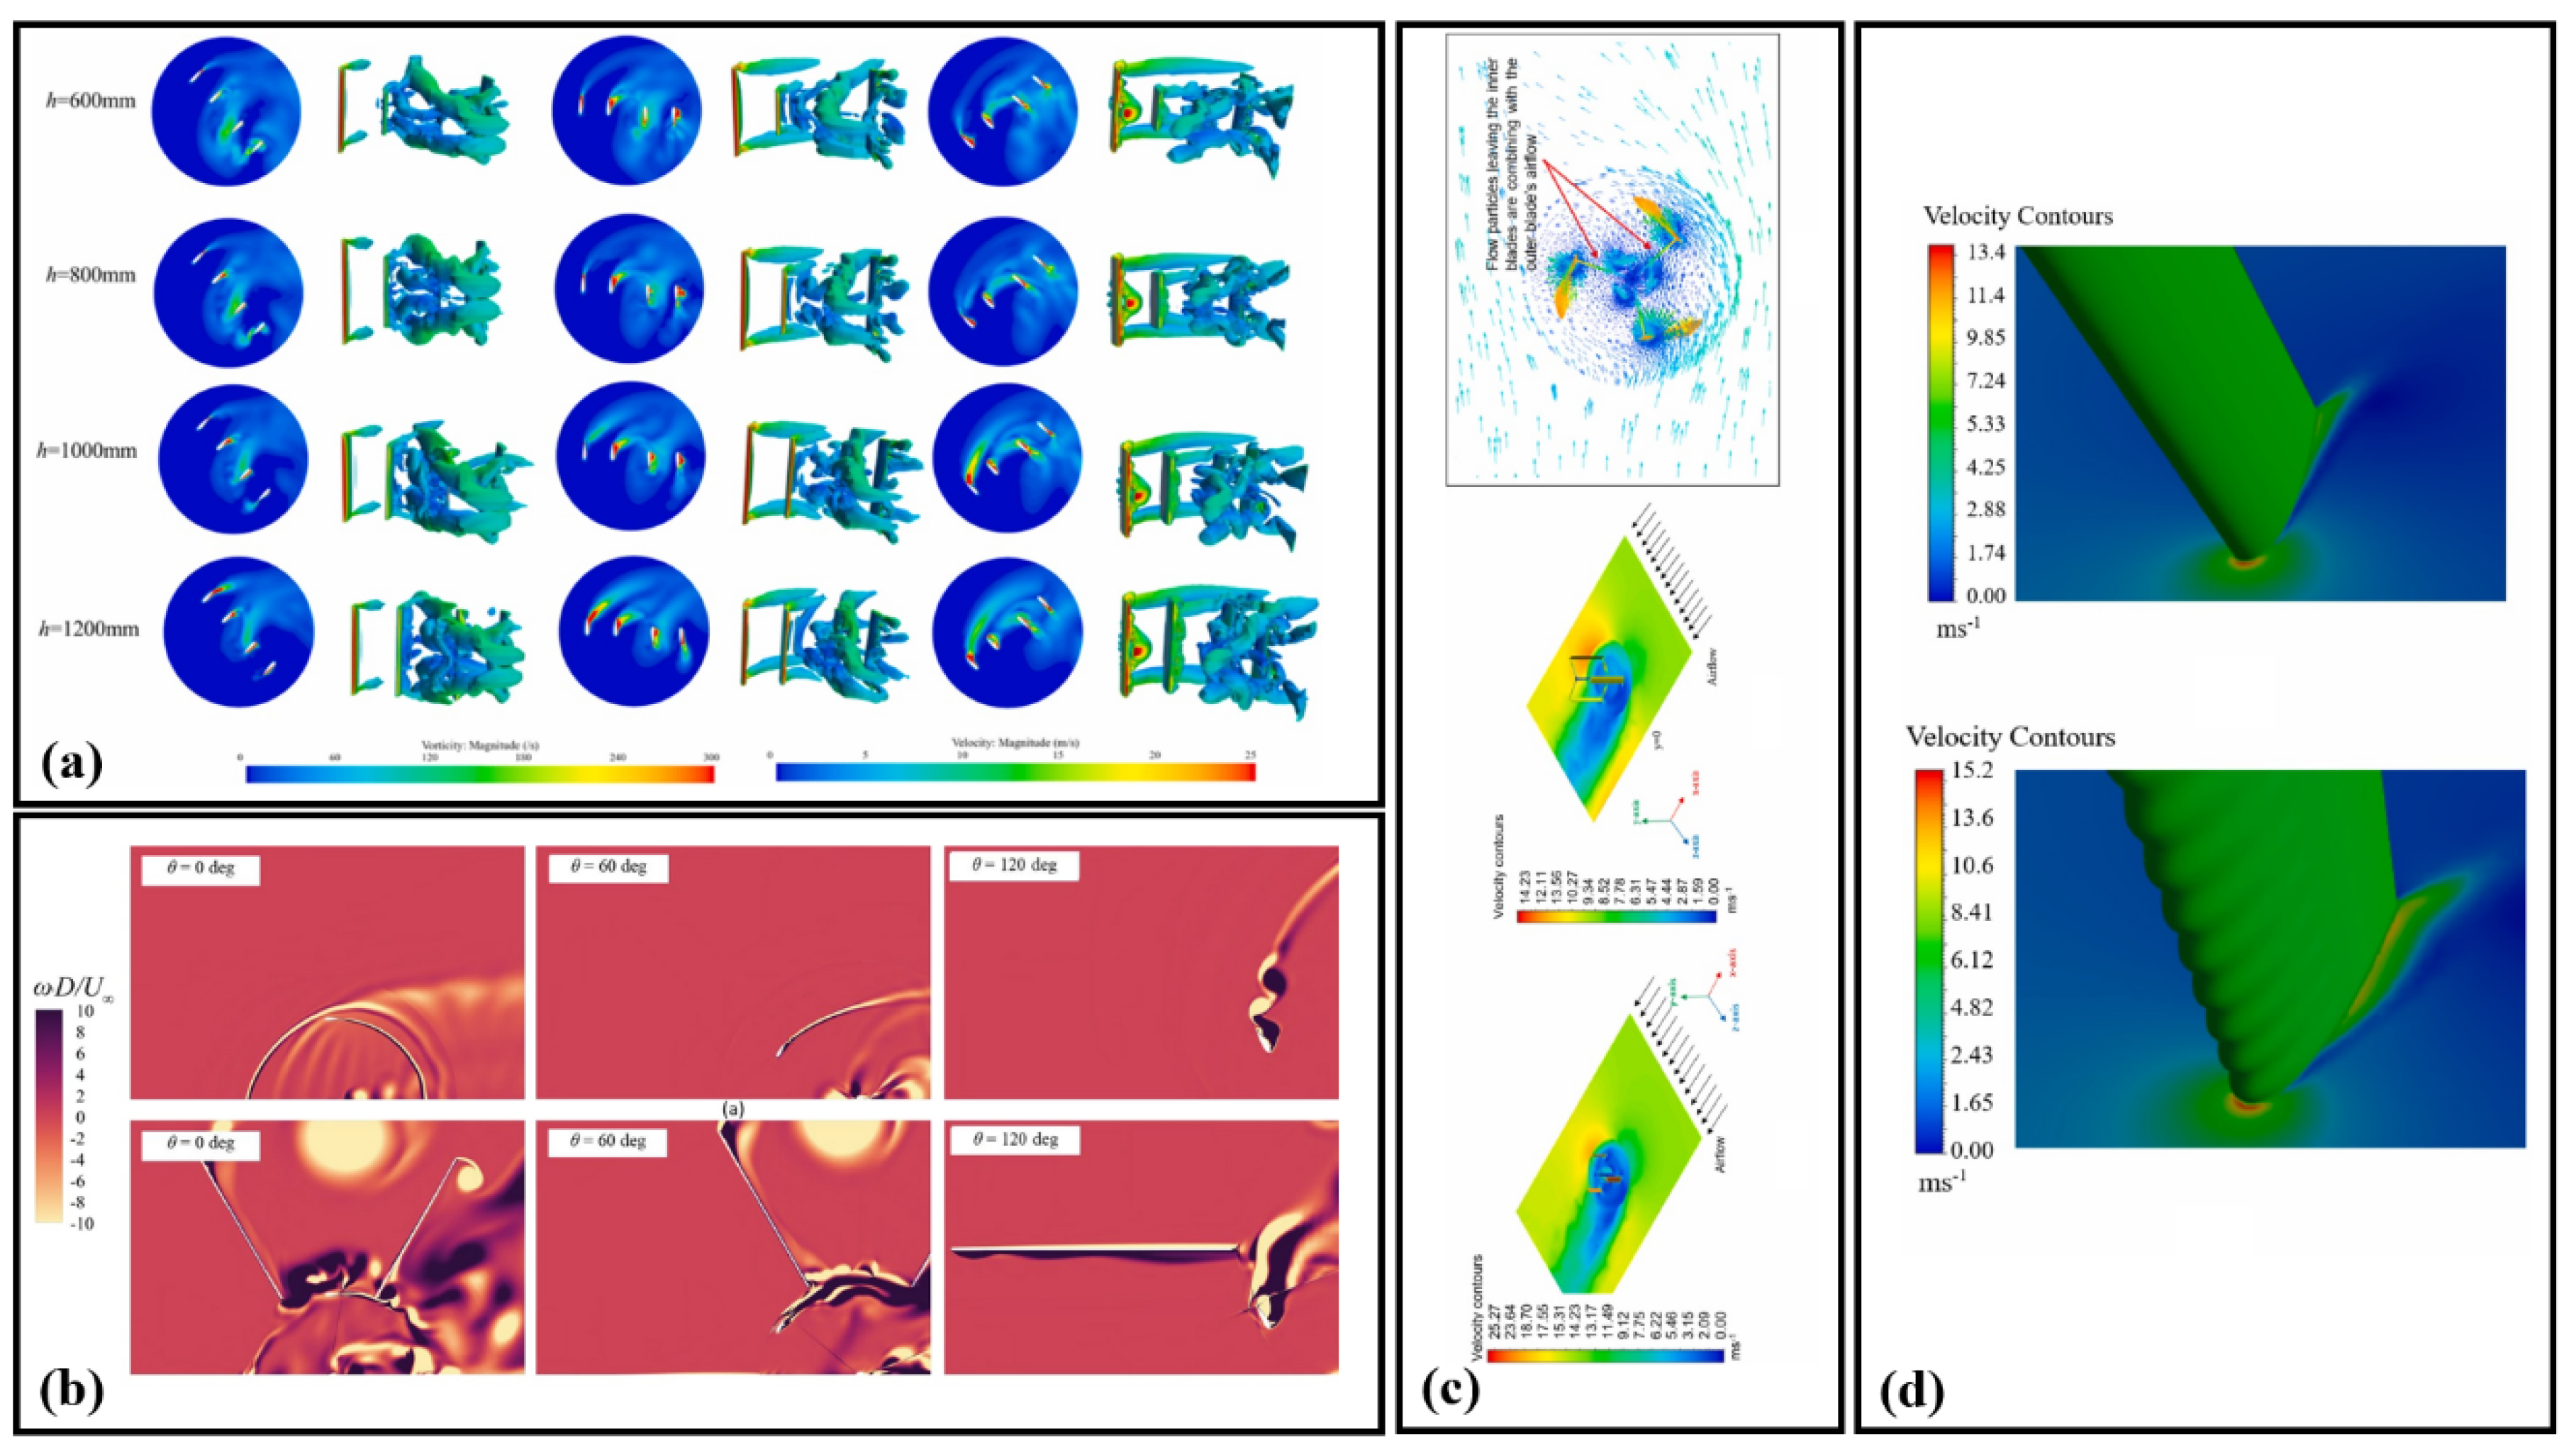
6.1. Vortex Dynamics and Velocity Contours in Advanced Double-Darrieus Turbine Configurations

In Figure 9a [4], the vortex contours in the top plane of the inner ring turbine are illustrated for various inner ring turbine heights, alongside Q-criterion iso-surfaces differentiated by air velocity, corresponding to outer-ring blade azimuth angles of 45°, 90°, and 135°. The figure demonstrates that altering the height of the inner ring turbine significantly affects the vortex field surrounding its blades as evidenced by the research team [4]. When the inner ring turbine height is 600 mm and the azimuth angle is 45°, the vortex is primarily attached to the suction side of the inner ring blade. As the height increases, flow separation on the suction side of the inner ring blades is further promoted, enhancing the intensity of vortex shedding from the blade’s trailing edge.
In a similar vein, as the TSR increased further, it was shown that the wake flow effect intensified significantly at λ = 3.3 (Figure 9b [6]). Specifically, at θ = 60 ° and 120°, the wake region expanded considerably compared to the conditions at λ = 2.5 and 3 . This wake expansion into the surrounding air resulted in a substantially wider diffusive track, thereby affecting downwind turbines across broader angle intervals. The vortex in the reference case likely dissipated more rapidly compared to the optimal case equipped with guiding walls. As the turbine continued to rotate, the vortex generated on the surface of the open VAWT at 120° began to detach from the surrounding air. A strong vortex was observed in the flow structure of the VAWT at approximately 120° [6].
Meanwhile, to validate the outcomes derived from the DOE response optimizer, a CFD analysis was conducted. Utilizing the optimized geometric parameters, a CAD model was generated using Solidworks software and subsequently imported into “Ansys-Fluent” for flow-field analysis.
The computational domain was established in accordance with the settings applied during the DOE analysis, maintaining consistency in domain settings, mesh size, and time step size. To examine the flow physics around the turbine blades during operation, various iso-planes along the horizontal and vertical axes were generated. Figure 9c [1] illustrates the velocity variation along the xz-plane at y = 1.5   m . The rotor extracts power from the wind as the relative velocity in each iso-plane diminishes from upstream to downstream. The velocity contours demonstrate that the vortex-induced wake enhances the swept area downstream, effectively increasing the power output through a virtual expansion of the swept area. Additionally, the vortices near the inner and outer turbine blades were found to significantly improve blade–fluid interaction. The analysis determined that for an identical swept area, the power output of the double-Darrieus hybrid VAWT surpasses that of a single rotor turbine, as depicted in Figure 9c [1]. Previous studies (Beri et al. [89], Howell et al. [90]) indicated a maximum C p of up to 0.45 for a single rotor turbine. The velocity contours for the single rotor turbine with the same swept area, shown in Figure 9c, also reflect lower velocity values compared to the proposed double-Darrieus hybrid VAWT.
As a further point, the velocity contours of the baseline hybrid and hybrid with tubercles are depicted in Figure 9d. These contours reveal the distribution and behavior of wind flow as it interacts with the turbine blades. Notable patterns and differences were observed in the velocity contours across various turbine zones. Higher velocities were detected near the leading edge of the blades, indicating the initiation of enhanced airflow due to interaction with the tubercles. The vortices and eddies generated by the tubercles in these accelerated flow regions were found to delay flow separation and improve lift generation. Furthermore, variations in velocity magnitude were observed as the flow moved across the blade surfaces, particularly at the tubercles, where the altered leading edge caused changes in flow direction and strength.

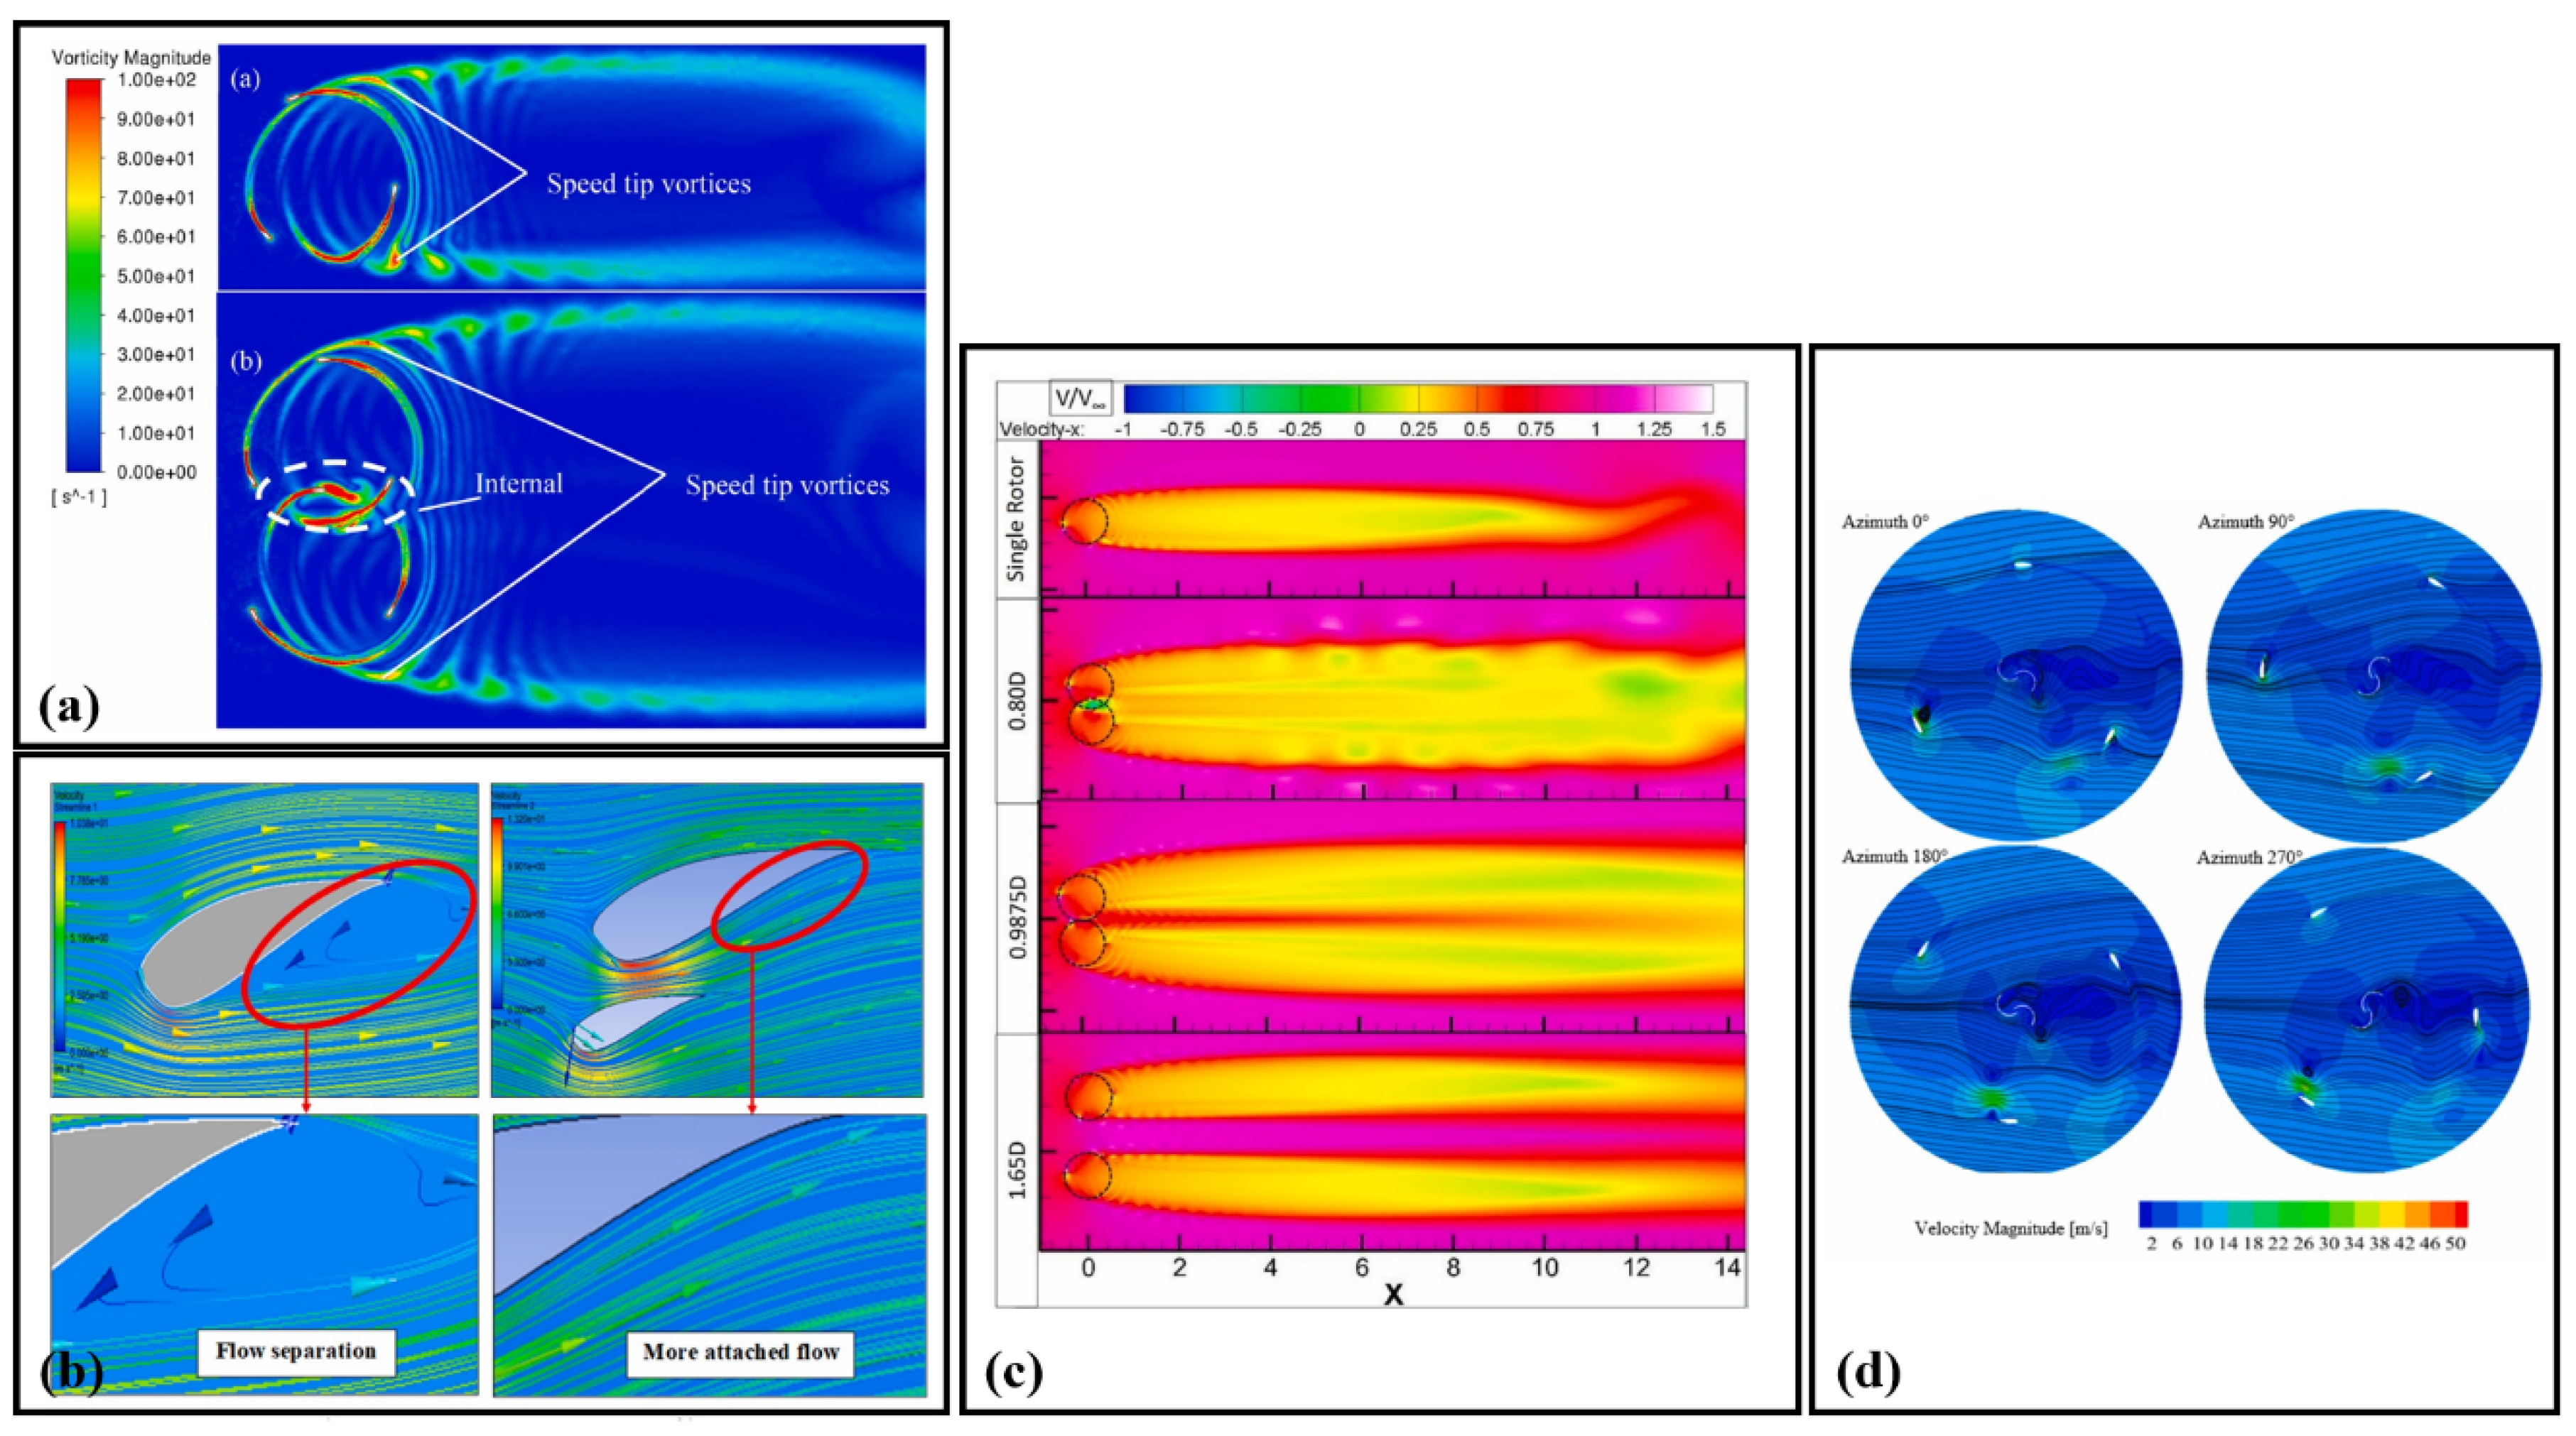
6.2. Influence of Rotor Spacing and Flow Dynamics on Darrieus Performance

To investigate the effect of rotor spacing on the power coefficient, a comparison of the wake structures at different rotor spacing’s was plotted, depicting the Q-criterion (Q = 100) and relative velocity, as shown in Figure 10a [2]. It is demonstrated in Figure 10a that when the upper and lower rotor spacing of the CRVAWT is small, the wake structures of the rotors are very close and overlap each other. A strong interaction is induced by the opposite speeds of the upper and lower rotors as the blades approach. The wakes are absorbed and spread out, and the strongly interacting airflow further influences the wind field around the blades, resulting in a reduced pressure difference on the blade surfaces, thereby diminishing the rotor speed and torque. In scenarios where a large distance exists between the upper and lower rotors, the wake structures of the rotors are farther apart and produce less mutual interference.
In tandem with this, the processed vorticity contour plots for various HDWT-D-DF configurations are presented in Figure 10b [19]. As shown in this figure, the flow around the lower blade of a traditional HDWT exhibits significant turbulence, generating two smaller shed vortices at the front and rear edges of the blade and two larger vortices at the upper left of the blade, resulting in considerable torque generation for the turbine. The contours indicate that the inner disturbed flow blades of the HDWT equipped with DF-NACA0018 can decrease the impact of negative torque when the outer lift blades are at larger AoA. Additionally, these blades themselves contribute specific rotational torque, significantly enhancing the wind turbine’s efficiency.
To further elaborate, in Figure 10c, an upward shift in the wake is observed. This phenomenon can be explained by considering the turbine as a rotating cylinder within a fluid flow, a concept previously examined by Mobini and Niazi [91]. When the cylinder rotates counterclockwise, the tangential velocity of the cylinder surface adds to the flow velocity, which is tangent to the surface but opposes the direction on the upper surface. Consequently, a counter-current flow is produced on the top surface, and a co-current flow occurs on the lower surface. This results in an increase in velocity on the lower surface and a decrease in velocity on the upper surface. The flow pattern, therefore, becomes asymmetrical, causing the stagnation and separation points to shift in the direction of rotation.
Additionally, the flow topology of VAWTs under field conditions, operating at high Reynolds numbers and featuring helical blades, is discussed in [92], with significant emphasis placed on the 3D dynamics and their impact on wake evolution. Theoretical and experimental analyses have suggested a strong correlation between the geometry of the object and vortex dynamics. It should be noted that a series of 2D PIV experiments conducted in an open-jet wind tunnel on an H-shaped rotor, as presented in [93], have demonstrated that the wake profile may exhibit asymmetric behavior, characterized by a skewed velocity profile and a more pronounced expansion in the windward region. As shown in [94], the momentum replenishment downstream of the turbine is enhanced by higher blade solidity values, resulting in larger cross-stream gradients, which promote a faster wake recovery through a form of early destabilization. However, span-wise effects, such as the activation of vertical transport phenomena, were not highlighted in that study. When considering the near-wake topology and its evolution under skewed flow conditions, a combined effect involving increased swept area, induction effects, and flow re-energization from the turbine’s lower half must be accounted for. A qualitative description of the wake evolution is provided in Figure 10d, which illustrates the computed velocity deficit and lateral vorticity contours over the Y R = 0 plane. It is immediately apparent that, at higher flow skewness, the wake shifts upward and possesses a higher energy content.

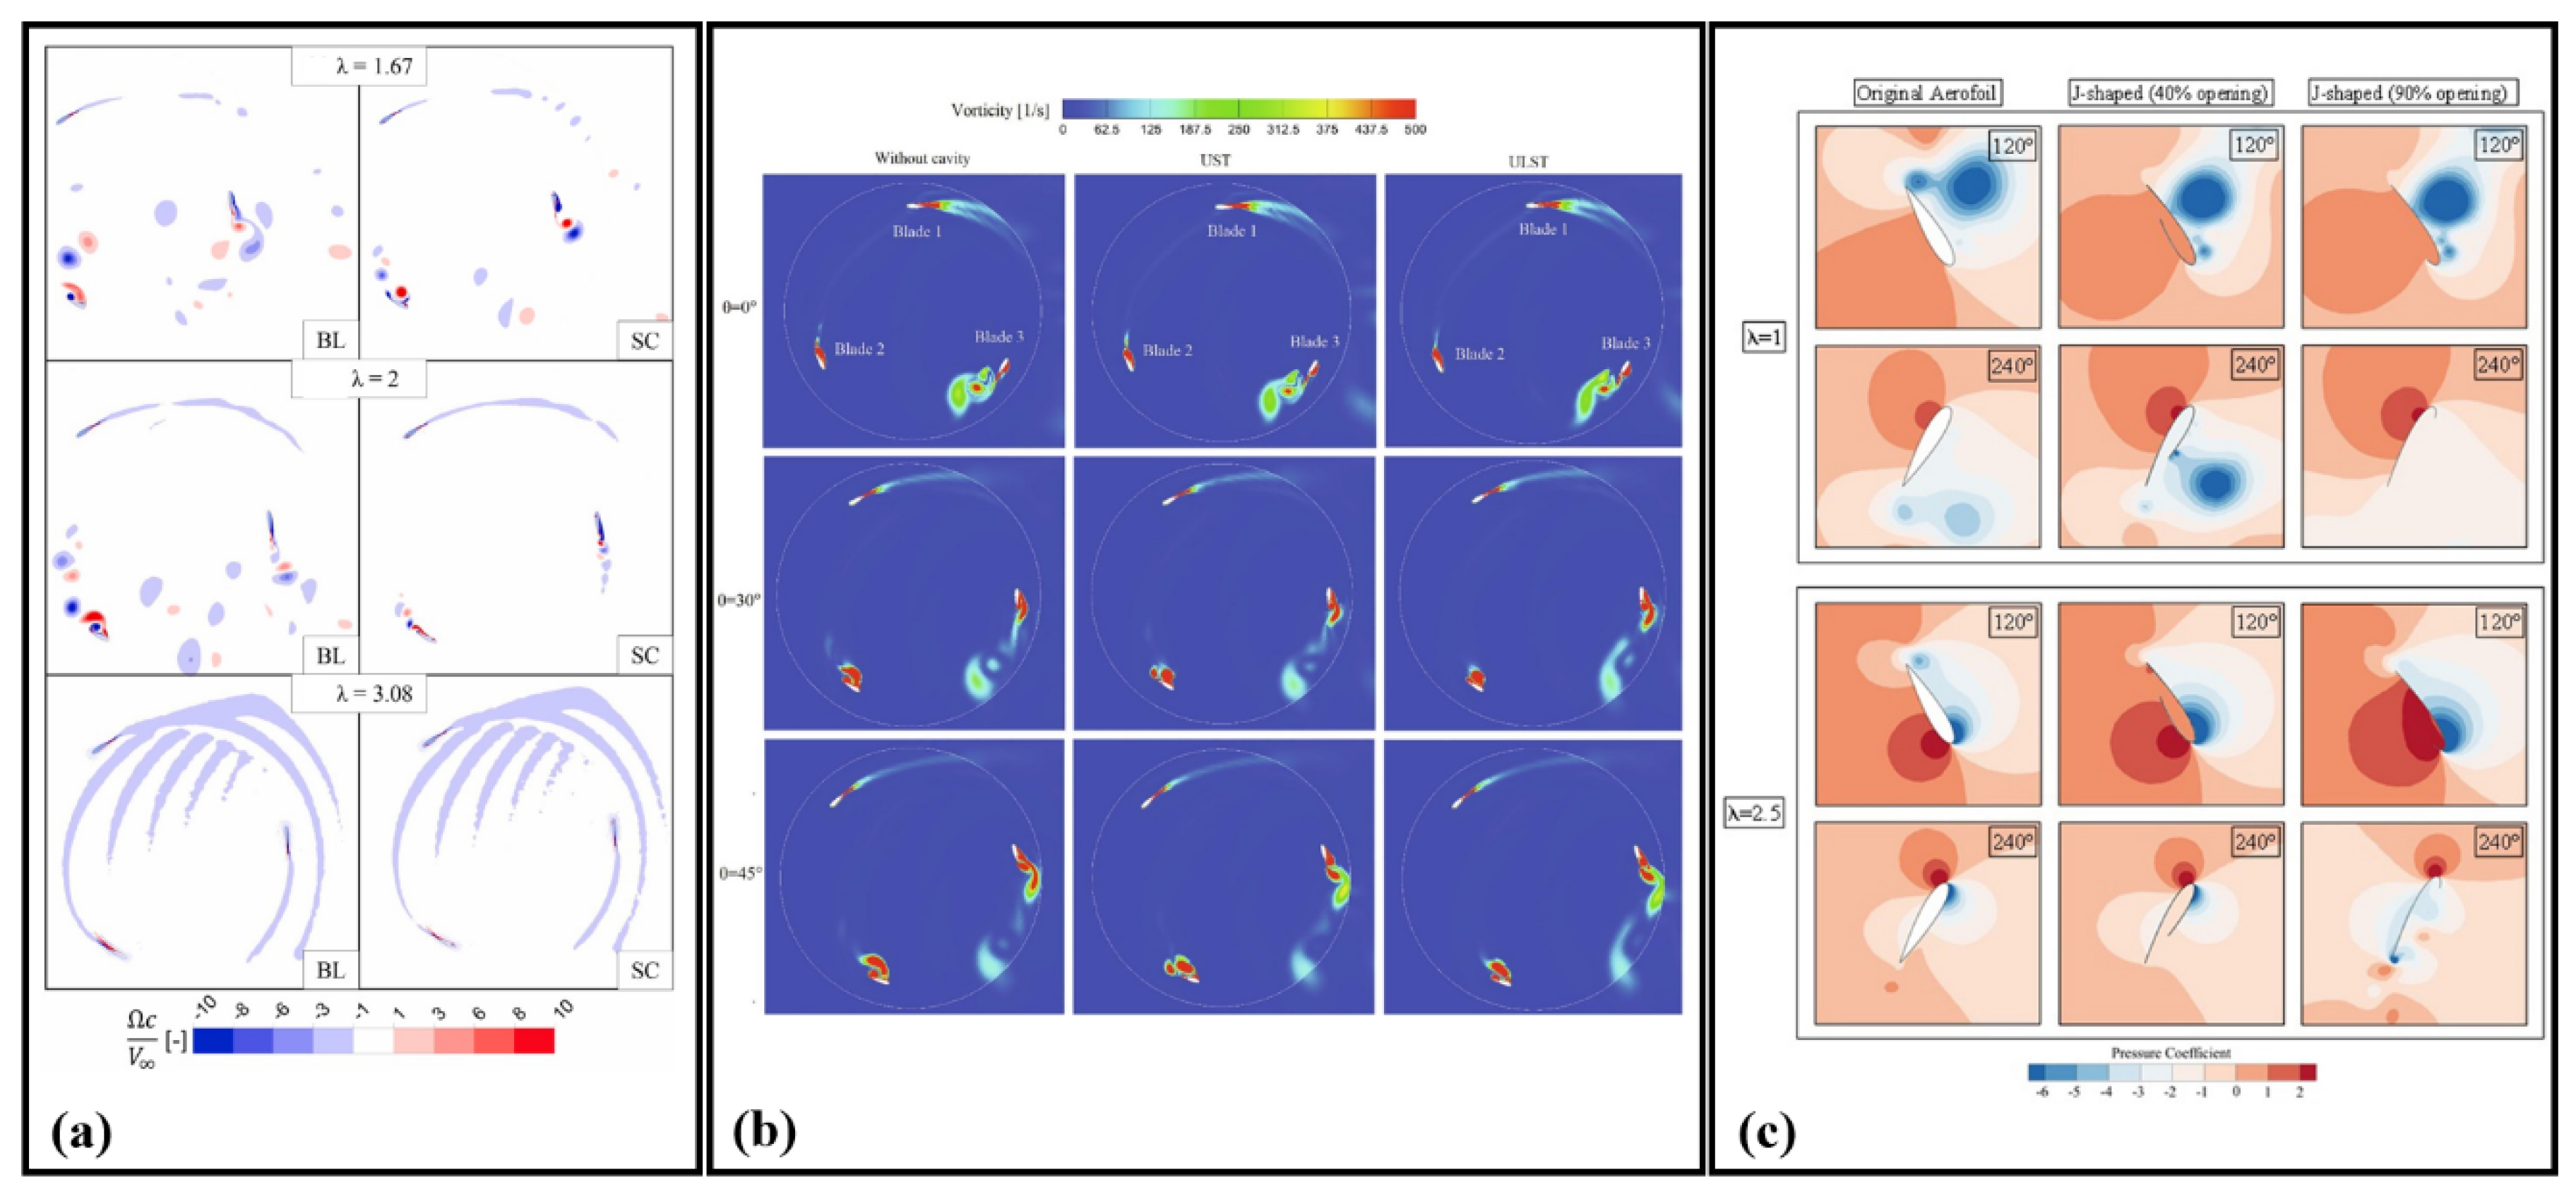
6.3. Vorticity and Flow Dynamics of Darrieus Turbines with Varying Blade Designs

In Figure 11a, a volume rendering of the vorticity vector magnitude surrounding the turbine equipped with a mid-span strut is depicted. The vorticity shed by a lifting blade is proportional to the span-wise and temporal variations in the lifting force acting on the blade. As a result, significant cross-flow vortices, which are perpendicular to the blade’s direction, are shed on both sides of the mid-span strut, indicating a reduction in lift at this specific span-wise location on the turbine blade. Consequently, a localized decrease in lift around the blade–strut junction leads to a corresponding reduction in the section power coefficient [78].
Equally important, to gain further insights into the impact of aspect ratio on performance, vortex contours have been plotted for all five models operating at the optimal λ under a water velocity of 1 (Figure 11b [78]). The blade tip vortex, a fluid dynamics phenomenon, forms at the tip of a blade as it moves through water. When water interacts with the rotor blades, a pressure difference is created between the upper and lower surfaces of the blade profile. This pressure differential causes water to flow from the high-pressure region beneath the blade to the low-pressure region above, leading to a swirling motion (vortex) around the blade’s tip, which can increase drag on the blade as well as generate noise and vibration.
In Figure 11c [12], iso-surfaces of vorticity magnitude are displayed when the left blade’s middle is at ϑ = 79.50 ° . The three gray planes illustrate the relative velocity streamlines at the cross-sections of the middle and H 4 below/above it. The visualized 3D flow structure corroborates the previous discussions; a uniformly separated flow distribution along the span is observed in the straight blade, whereas non-uniform distributions are present in the helical and twisted V-shaped blades. Additionally, the middle section of the twisted V-shaped blade appears clear of vortices, while other sections exhibit large vortical structures. The tip-leakage vortices display similar structure and size, indicating a negligible influence of span-wise flow on them. Furthermore, the suppression effect of the tip-leakage vortex on the dynamic stall vortex is particularly evident for the straight and helical blades.
To provide insight into the complex flow field within and behind the rotor, Figure 11d presents the instantaneous helicity contours for calculations conducted at λ e q = 3.1 for the designs considered in [45]. The helicity distributions are depicted over two orthogonal planes: a xy plane at Z * = 50 % to illustrate the 2D vortical structures detached from the airfoils, and an xz plane at Y R e q = 0.3 to highlight the 3D nature of the flow in the tip region. These contours reveal significant differences between the two designs. The vortices detached by the plane-blade rotor exhibit higher magnitude and lower decay rates compared to those detached by the slanted-blade rotor, which is attributed to the thinner airfoil of the plane-blade rotor.

6.4. Flow Dynamics and Vortex Behavior in Various Darrieus Turbines Configurations

The emergence, progression, and dissolution of the tip vortex are clearly illustrated in Figure 12a [10]. It is observed that two series of tip vortices are generated on both sides of the wake of the isolated turbine. However, in the case of the twin-turbine array, the tip vortices at the center of the array wake disappear, indicating that the new array configuration reduces energy dissipation and allows for more effective utilization of wind energy.
To bolster, the depiction of flows over wind turbine blades is commonly achieved using streamlines, which are graphically represented to illustrate flow behavior. The distribution of these streamlines across the blade surface provides insights into separation or turbulence within the flow, both of which can influence blade performance. Moreover, streamlines serve as a tool to calculate critical quantities, such as the lift and drag forces acting on the blade, which are crucial for the design and optimization of wind turbines. In Figure 12b [22], the interaction between fluid and H-rotor blades is described using streamlines at an azimuthal angle of 30° and a wind velocity of 6 m/s.
Furthermore, the performance of overlapping and non-overlapping cases has been analyzed, with an effort made to elucidate the flow physics by presenting contours of the normalized x-component of the velocity, as shown in Figure 12c [5], for a single-rotor VAWT and configurations of S = 0.80D, S = 0.9875D, and S = 1.65D. It has been shown by this research team that coupling the turbines at S = 0.8D may result in significant flow obstruction, whereas an enhanced flow between the rotors is observed for S = 1.65D. This enhanced flow contributes to improved turbine performance, even in the absence of constructive interference between the wake of one rotor and the airfoils of the other. The configuration at S = 0.9875D also shows evidence of obstructed flow between the rotor discs. However, as reported in [5] a more detailed examination reveals a small region of increased velocity (exceeding the free-stream) within the peak power production region 90 ° < θ < 180 ° , which explains why this configuration approaches optimal performance.
Extending this idea, the analysis of the flow field surrounding the hybrid turbine equipped with outboard dimples, as depicted in Figure 12d [23], indicates that the vortexes generated around the airfoils are smaller and dissipate more rapidly, leading to an increase in the generated C m . However, the hybrid turbine with inboard dimples demonstrates superior performance compared to the other configurations, which is also evident from the velocity streamlines as evidenced in the investigations of [23].

6.5. Vortex Shedding and Performance Analysis of Modified Darrieus Turbines Blades

As reported in the investigations carried out by the authors from [11], at λ = 3.08 , a reduction in the AoA range is observed, narrowing it to between −18° and 18°, with the SC blade exhibiting a slight enhancement in performance in the upwind path compared to the BL blade. The maximum torque coefficients for the SC and BL blades are recorded at 0.22 and 0.175, respectively. However, in the downwind zone, both blades display similar performance, and no torque fluctuations are evident, as significant vortices are not generated during the upwind half of the cycle (Figure 13a [11]). The C T of the BL airfoil is marginally higher than that of the SC airfoil, likely due to the reversed cavity orientation on the pressure side. The effects of vortex shedding and wake interactions have been examined, by this research team, by analyzing the dimensionless vorticity contours of the rotors for the BL and SC turbines at λ = 1.67 , λ = 2 , and λ = 3.08 , with the blades positioned at azimuth angles θ = 30 ° , θ = 150 ° , and θ = 270 ° , as illustrated in Figure 13a [11]. At λ = 1.67 , the BL turbine generates more vortex shedding due to the increased AoA, where flow separation occurs from the blade surface, and the detached separation vortices travel downstream. Numerous vortices are detected within the rotating field of the BL turbine. As θ transitions from 270° to 90° (upper half of the cycle), the blades encounter fewer shed vortices.
What is more, the instantaneous contours of vorticity magnitude around the wind turbine, including configurations without a cavity and with UST and ULST airfoils at a TSR of 2 over one complete revolution, are depicted in Figure 13b [49]. A periodic vortex shedding phenomenon is observed on the surface of blade 1 throughout the entire rotation. Despite the flow remaining attached to the surface of blade 1 at rotation angles between 0° and 45°, the aerodynamic performance of blade 1 is generally poor. This is attributed to the small AoA and the interaction of the shed vortex from the preceding blade with blade 1.
Alongside, the pressure coefficient contours in the vicinity of the airfoils at various positions for the original airfoil and its J-shaped profiles with 40% and 90% opening ratios are shown in Figure 13b [9]. These contours were obtained at TSR of 1 and 2.5. As the pressure distributions over the pressure and suction sides of the investigated airfoils exhibit similar characteristics at λ = 1 , the instantaneous torque coefficients produced by the airfoils in both the upstream and downstream sections of the turbine (at azimuthal angles of θ = 120 ° and θ = 240 ° ) were observed to be similar in value. The overall turbine torque generation was significantly reduced due to the larger amount of negative torque generated in the downstream section of the turbine when the largest opening 90% was employed.

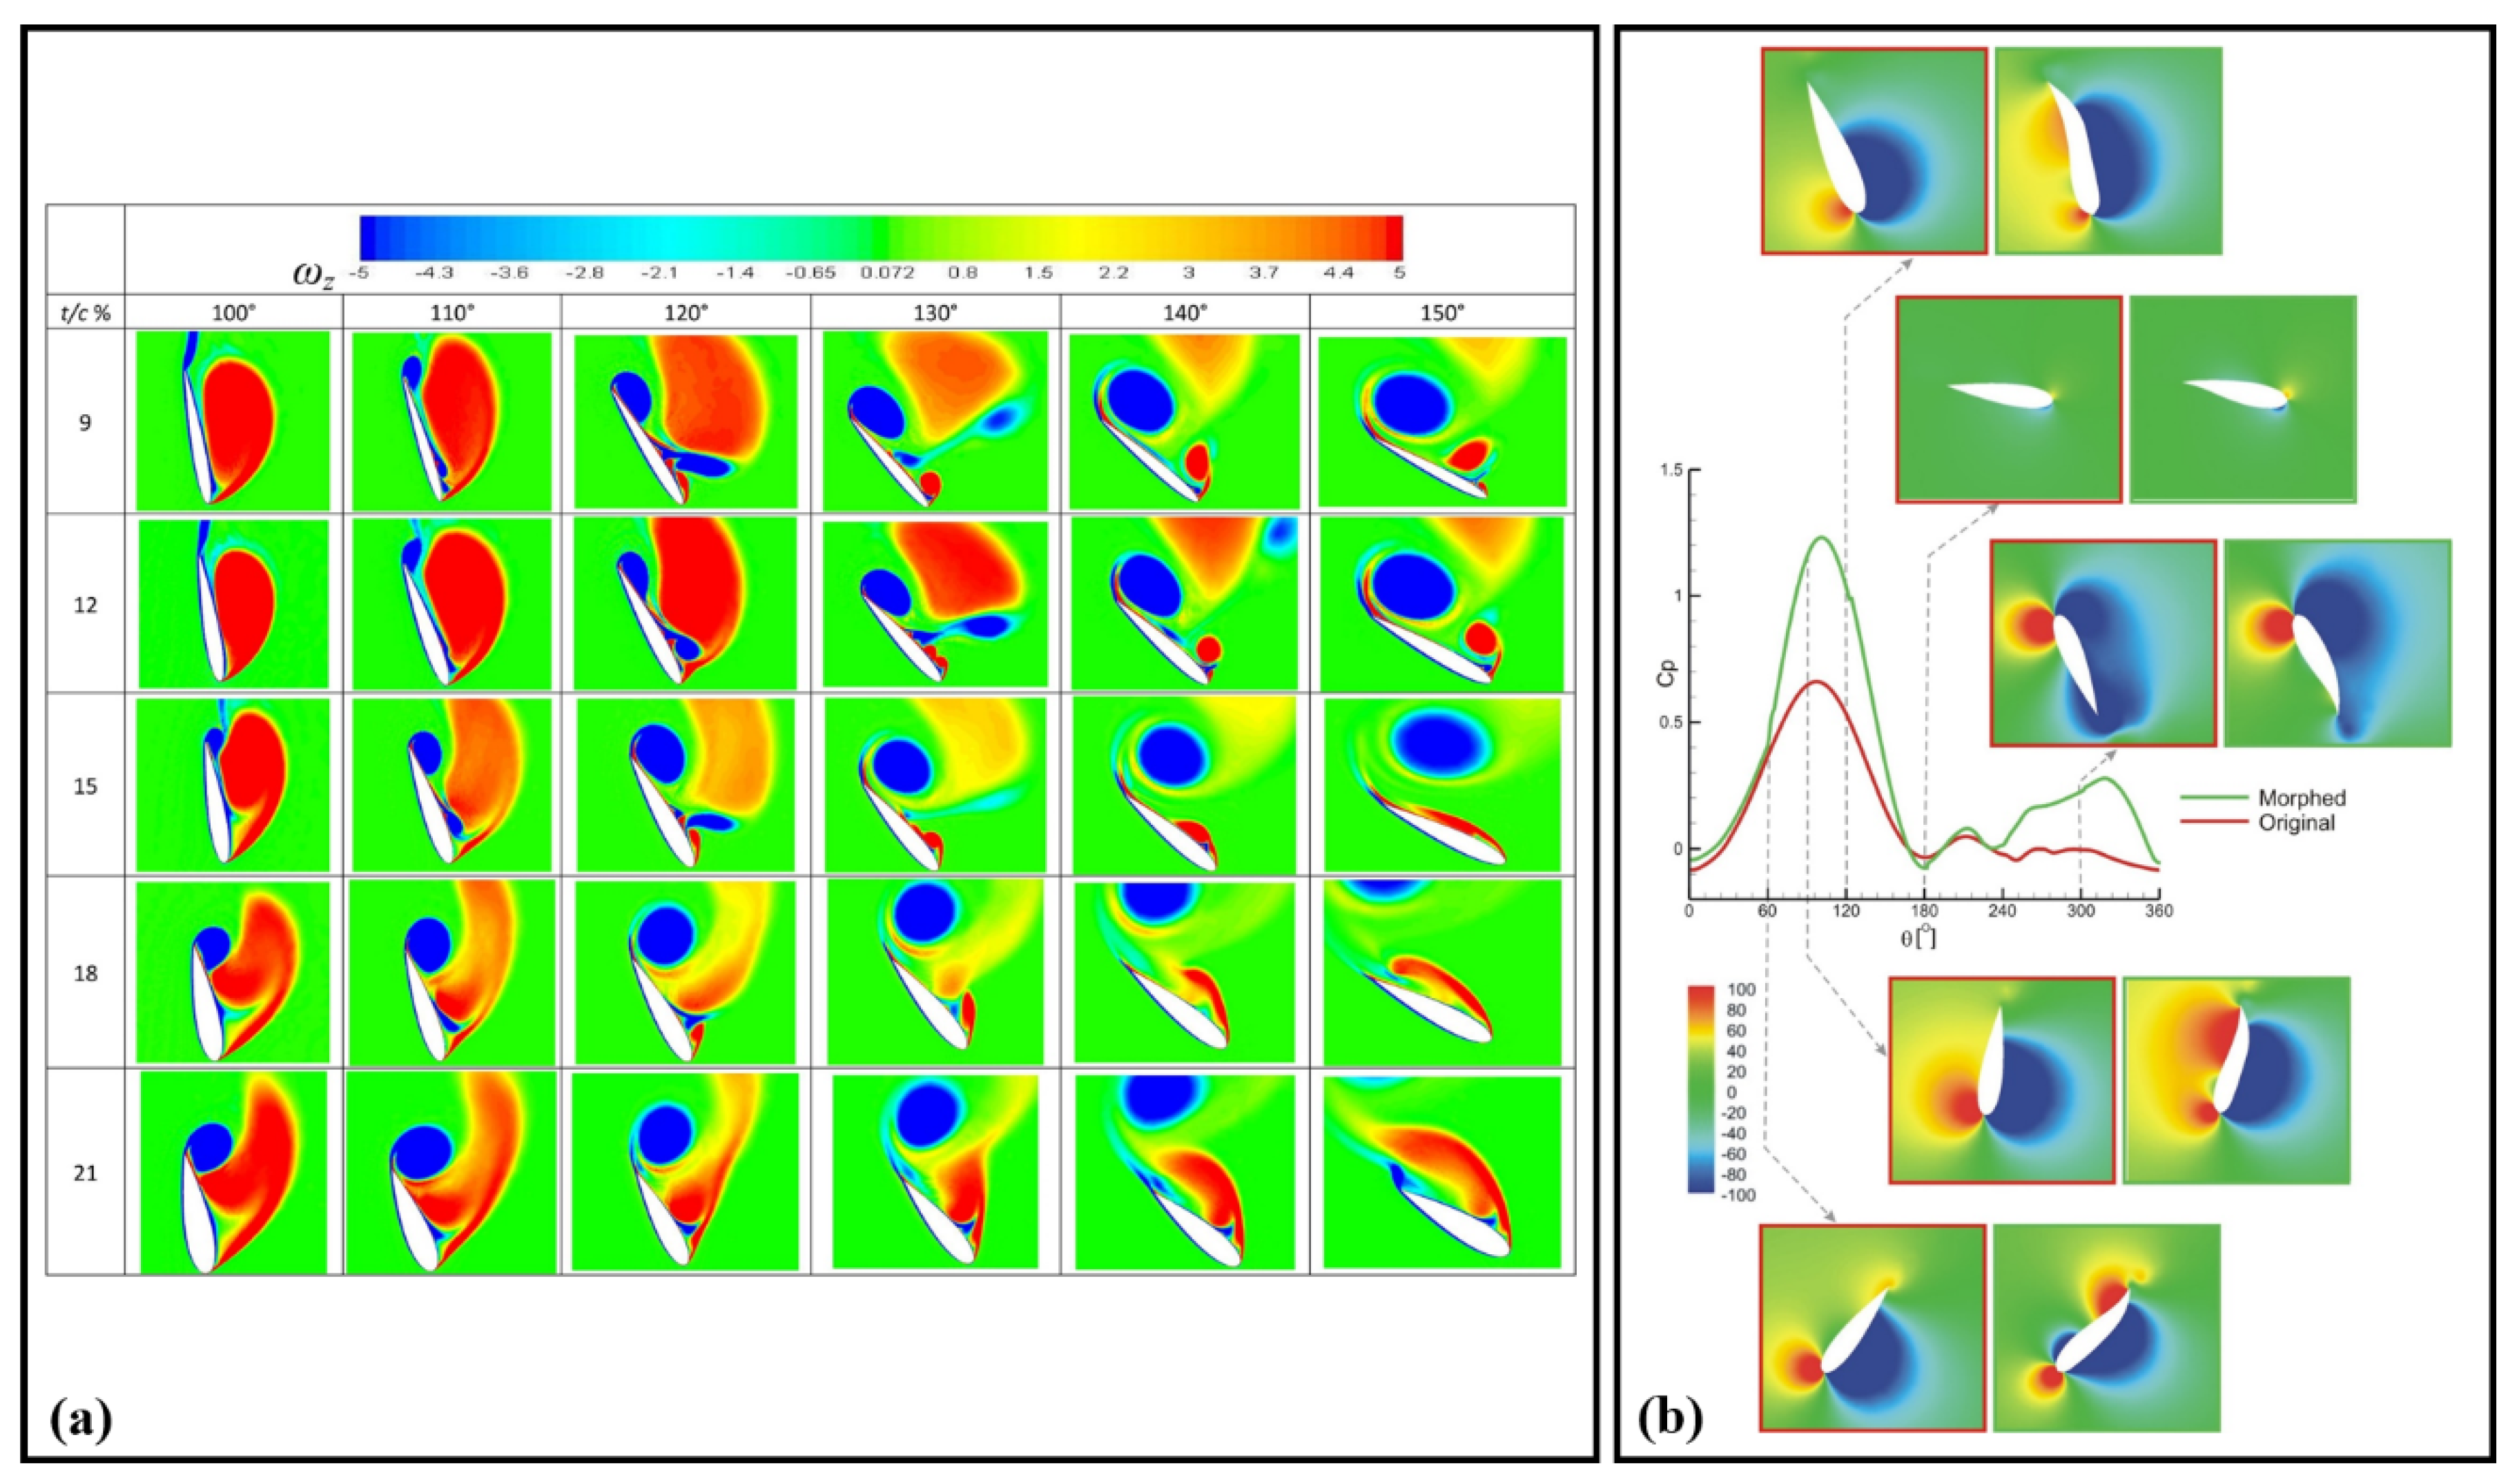
6.6. Impact of Vortex Dynamics and Blade Morphing on Darrieus Turbines Performance

The z vorticity plots presented in Figure 14a [65] indicate that the DSV separates from the LE between ϑ = 110 ° 120 ° . During this interval, two significant phenomena occur: the TEV develops, and secondary vortices form near the LE region. The propagation of the DSV leads to the movement of a pressure wave over the suction surface, inducing a flow roll-up from the pressure side of the blade, which forms the CW rotating TEV. It is evident from Figure 14a (z vorticity for ϑ = 120 ° 130 ° for t / c = 9 % and 12%) that the CW rotating secondary vortex tends to push the DSV, resulting in its separation, and subsequently, it separates itself, creating a negative pressure zone that facilitates the development of a tiny secondary LEV. The TEV is observed to separate between 130°–140°, followed by flow recovery along the blade. The complete separation of the DSV from the LE by ϑ = 120 ° (Figure 14a) occurs in conjunction with the presence of secondary vortices, as observed in previous cases.
Moreover, the number of secondary vortices near the LE region decreases as the t/c increases, as a larger LE radius at higher t/c provides a favorable path for the flow, resulting in a more stable BL near the LE. As reported in [65], this phenomenon can be observed in the partial detachment of the DSV in the case of t/c = 21%, where fewer secondary vortices are present to push the DSV to detach from its root at the LE, leading to a weaker VIS phenomenon.
In conjunction with this, a comparison of the pressure contours between the original and morphed turbines, along with their instantaneous C p values, is presented in Figure 14b [15]. When C p   values versus azimuthal angle for a single blade undergoing a complete rotation are compared, the morphed or optimized turbine outperforms the regular design across almost all azimuthal angles. Notably, kinks in the optimized power coefficient profile are distinctly observed at 60° intervals. The comparison between pressure contours at 60° reveals that a relatively higher pressure is observed on the upwind side of the morphed blade’s trailing edge, while the negative pressure on the downwind side of the blade is reduced, leading to a slight improvement in the C p curve. A substantial improvement in the instantaneous C p is apparent at θ = 90 ° , where a relatively larger positive pressure is observed to build up toward the trailing edge of the optimized blade due to the morphed profile.

6.7. Vortex Dynamics and Velocity Distribution in Darrieus Blades: Effects of AoA and Micro-Cylinder Integration

The vortex structure over blade S1 at various AoA is depicted by the iso-surface of Q = 100, colored according to the vorticity magnitude, as shown in Figure 15a [14]. At the lower AoA, specifically α = 10 ° and α = 13 ° , two distinct vortex structures are observable. One vortex is attached to the suction surface near the trailing edge of the blade, while the other consists of pairs of streamwise counter-rotating vortices located in the wake. At α = 10 ° , the vortex pattern is periodic along the spanwise direction. Behind each protuberance, a pair of streamwise vortices is observed, which corresponds to the streamline structure. As the AoA increases to α = 13 ° , a “bi-periodic” phenomenon emerges, characterized by diverging and converging vortices in adjacent troughs, with a higher vorticity magnitude compared to the lower AoA at α = 10 ° .
As a further point, the velocity distribution with streamlines, along with the separation on the suction and pressure sides of the blade, is illustrated in Figure 15b [16]. A completely different velocity pattern is observed around the conventional blade compared to the new design with the micro-cylinder throughout the entire outer side of the blade. The addition of the micro-cylinder to the conventional turbine results in an increase in velocity, as highlighted in the red rectangle on the suction side.

6.8. Aerodynamic and Structural Analysis of Darrieus Turbines: Effects of Blade Flexibility, Topology Optimization, and Flow Separation

To further analyze the poor performance of the flexible blade model at high TSR values, iso-surfaces of vorticity magnitude 35 1/s were plotted for both the baseline and flexible turbine models at TSR = 2.58 (Figure 16a). The parameters used for the flexible blade, X d c = 0.90 and Y d Y t = 0.50 , yielded a power coefficient of C p = 0.227 , compared to the baseline model, which yielded C p = 0.283 . It was observed that stronger shedding from the trailing edge and more pronounced tip blade vortex shedding from the deformed blade causes the lower aerodynamic performance of the flexible blade model. Additionally, at high TSR values, increased interactions between the blades and the generated wake on the upwind side become more dominant, hence leading to a significant drop in the power coefficient, as shown in Figure 16a [13].
The authors [17] presented the structural topology optimization of the H-rotor wind turbine, combined with a one-way FSI approach, (Figure 16b). The developed methodology integrates the URANS equations with the steady-state linear elasticity equations and a density-based topology optimization method. This approach enabled a reduction in the blade mass while respecting the maximum stress and deformation limits. The pressure profile load from the CFD simulation was applied at the point of rotation where the highest force values on the blade surface were observed. The structural model also considered the centrifugal force. Computations were conducted for a wind speed of V = 30   m / s and a rotational velocity of ω = 90   r a d / s .
In order to evaluate the airflow behavior around the hybrid turbine equipped with a front deflector, the vorticity distributions at θ = 180 ° and θ = 240 ° are presented in Figure 16c [18]. Unlike the bare hybrid wind turbine, blade 1 of the hybrid turbine with a front deflector undergoes boundary layer separation at an azimuth angle of θ = 45 ° , indicating that the airflow near the blade surface loses momentum and comes to a halt, leading to flow separation (Simpson [95,96]). An adverse pressure gradient within the boundary layer slows down the flow and reverses its direction. Simultaneously, at an azimuth angle of θ = 165 ° , blade 2 experiences a vortical disturbance on its surface, causing the airflow to separate from the blade surface, which results in the production of a vortex in the blade’s wake.

7. Investigations on Performance Indicators Enhancement for Improved Energy Efficiency of Darrieus Turbines

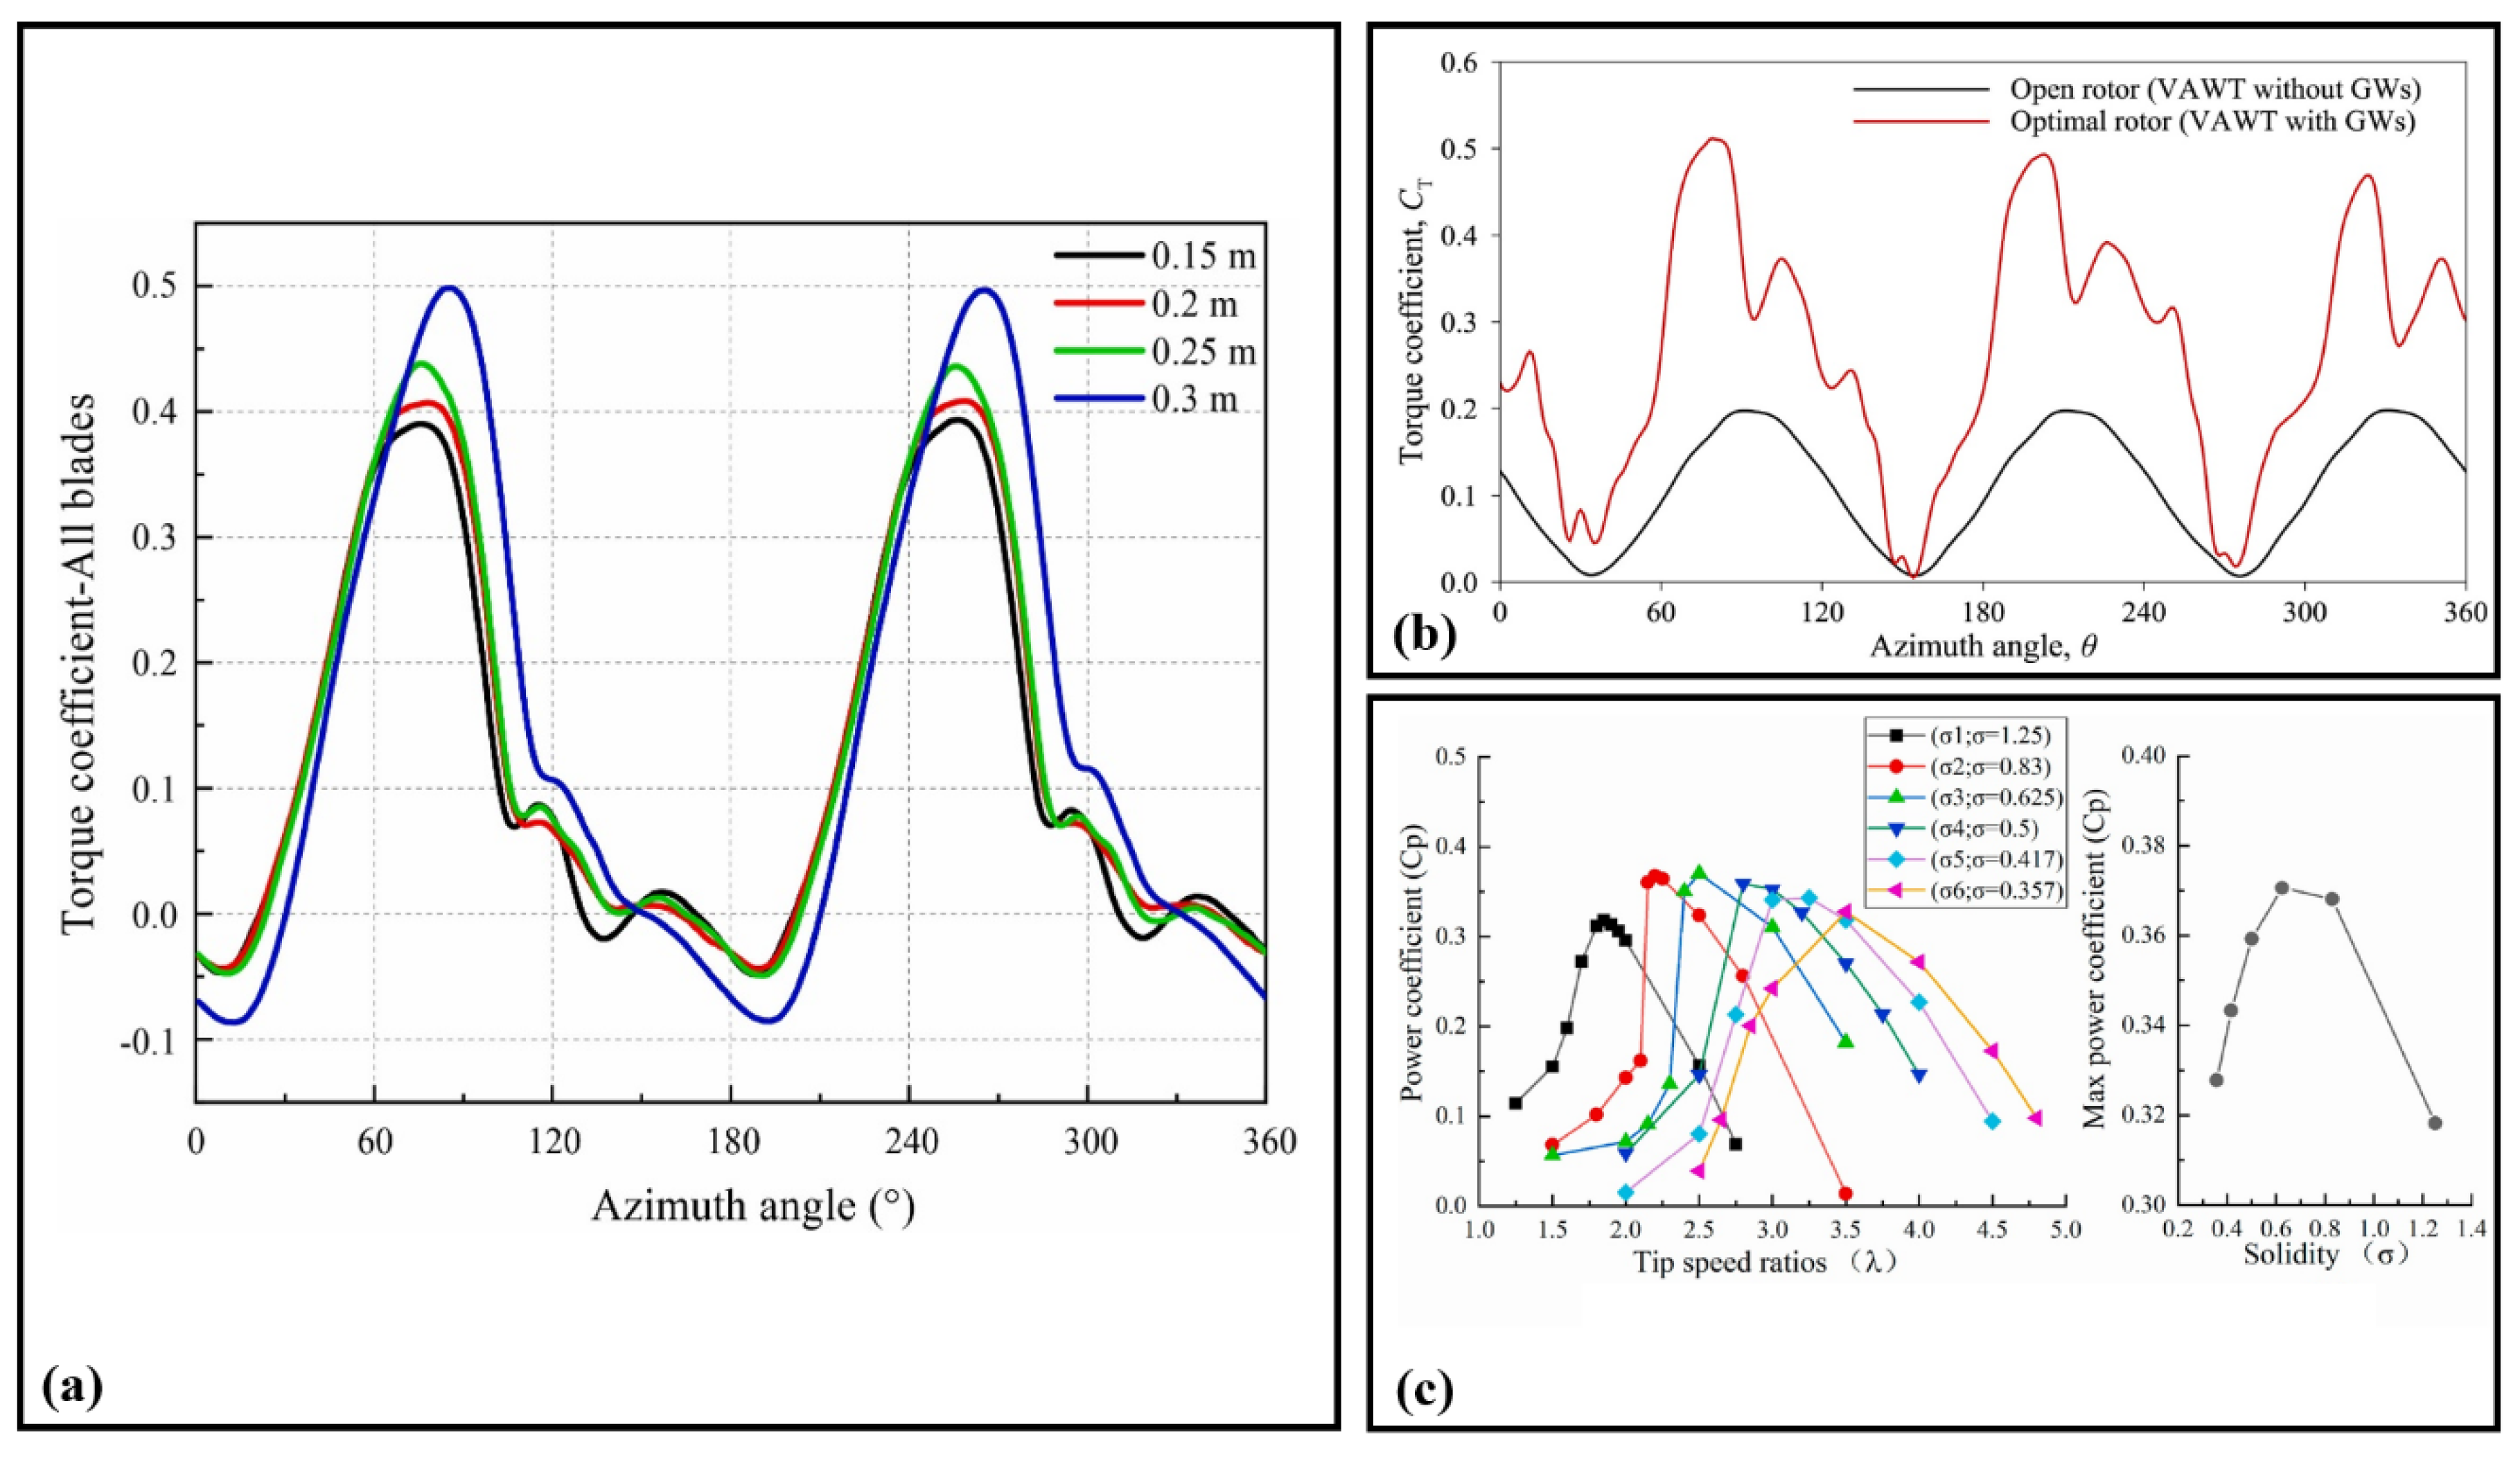
7.1. Effects of Chord Length, Solidity, and Azimuth Angle on Aerodynamic Performance and Torque Coefficients in Darrieus Rotors

The performance results of the wind turbine with varying chord lengths of the inner ring wind turbine blade airfoil are displayed in Figure 17a [4]. During a rotation cycle, the total C m under different chord lengths of the inner ring wind turbine blades exhibits periodic shifts, with all configurations showing two torque maxima. An increase in C m , m a x is observed as the wing chord length of the inner ring wind turbine blade increases.
Beyond this, the fluctuation of the torque coefficient as a function of the azimuth angle, which was obtained at a TSR value of λ = 3 , is illustrated in Figure 17b [6]. However, it must be emphasized that an increase in magnitude of the torque coefficients was observed in the upstream region, reaching their maximum values at an azimuth angle of θ = 90 ° when fixed guiding walls were employed. Additionally, the figure demonstrates the torque coefficient’s dependence on the TSR to rotational velocity. As the TSR increased, a corresponding rise in the magnitude of peak torque coefficients was also observed as reported in [6].
Complementary to this, the aerodynamic performance of the novel variable solidity σ D-VAWT after self-starting and its ability to stabilize power generation during the generation phase are analyzed. The solidity of the D-VAWT is determined during the power generation phase. To evaluate the aerodynamic performance, the variation of C p with λ for D-VAWTs with different solidity values is examined using the active method. The stable generation capability of the D-VAWT is assessed by simulating the generation phase through the addition of M l o a d using a UDF in the passive method. In Figure 17c [8], the variation of C p with λ for different values of σ in D-VAWT, obtained via the active method, is depicted. A peak in C p is initially reached, followed by a decrease as λ increases for D-VAWTs with the same σ . The optimal λ is identified as the value of λ corresponding to the maximum C p . A decrease in σ leads to an increase in the optimal λ for D-VAWTs with varying σ . Moreover, the incoming wind speed in front of the turbine rapidly decreases due to the rotation of the blades. According to Bernoulli’s principle, this causes an increase in pressure in front of the wind turbine. The wind turbine, at this point, behaves similarly to a solid cylinder, resulting in more wind bypassing the turbine and rendering this wind energy unusable. This phenomenon, known as the blocking effect, significantly affects the overall efficiency of the wind turbine.

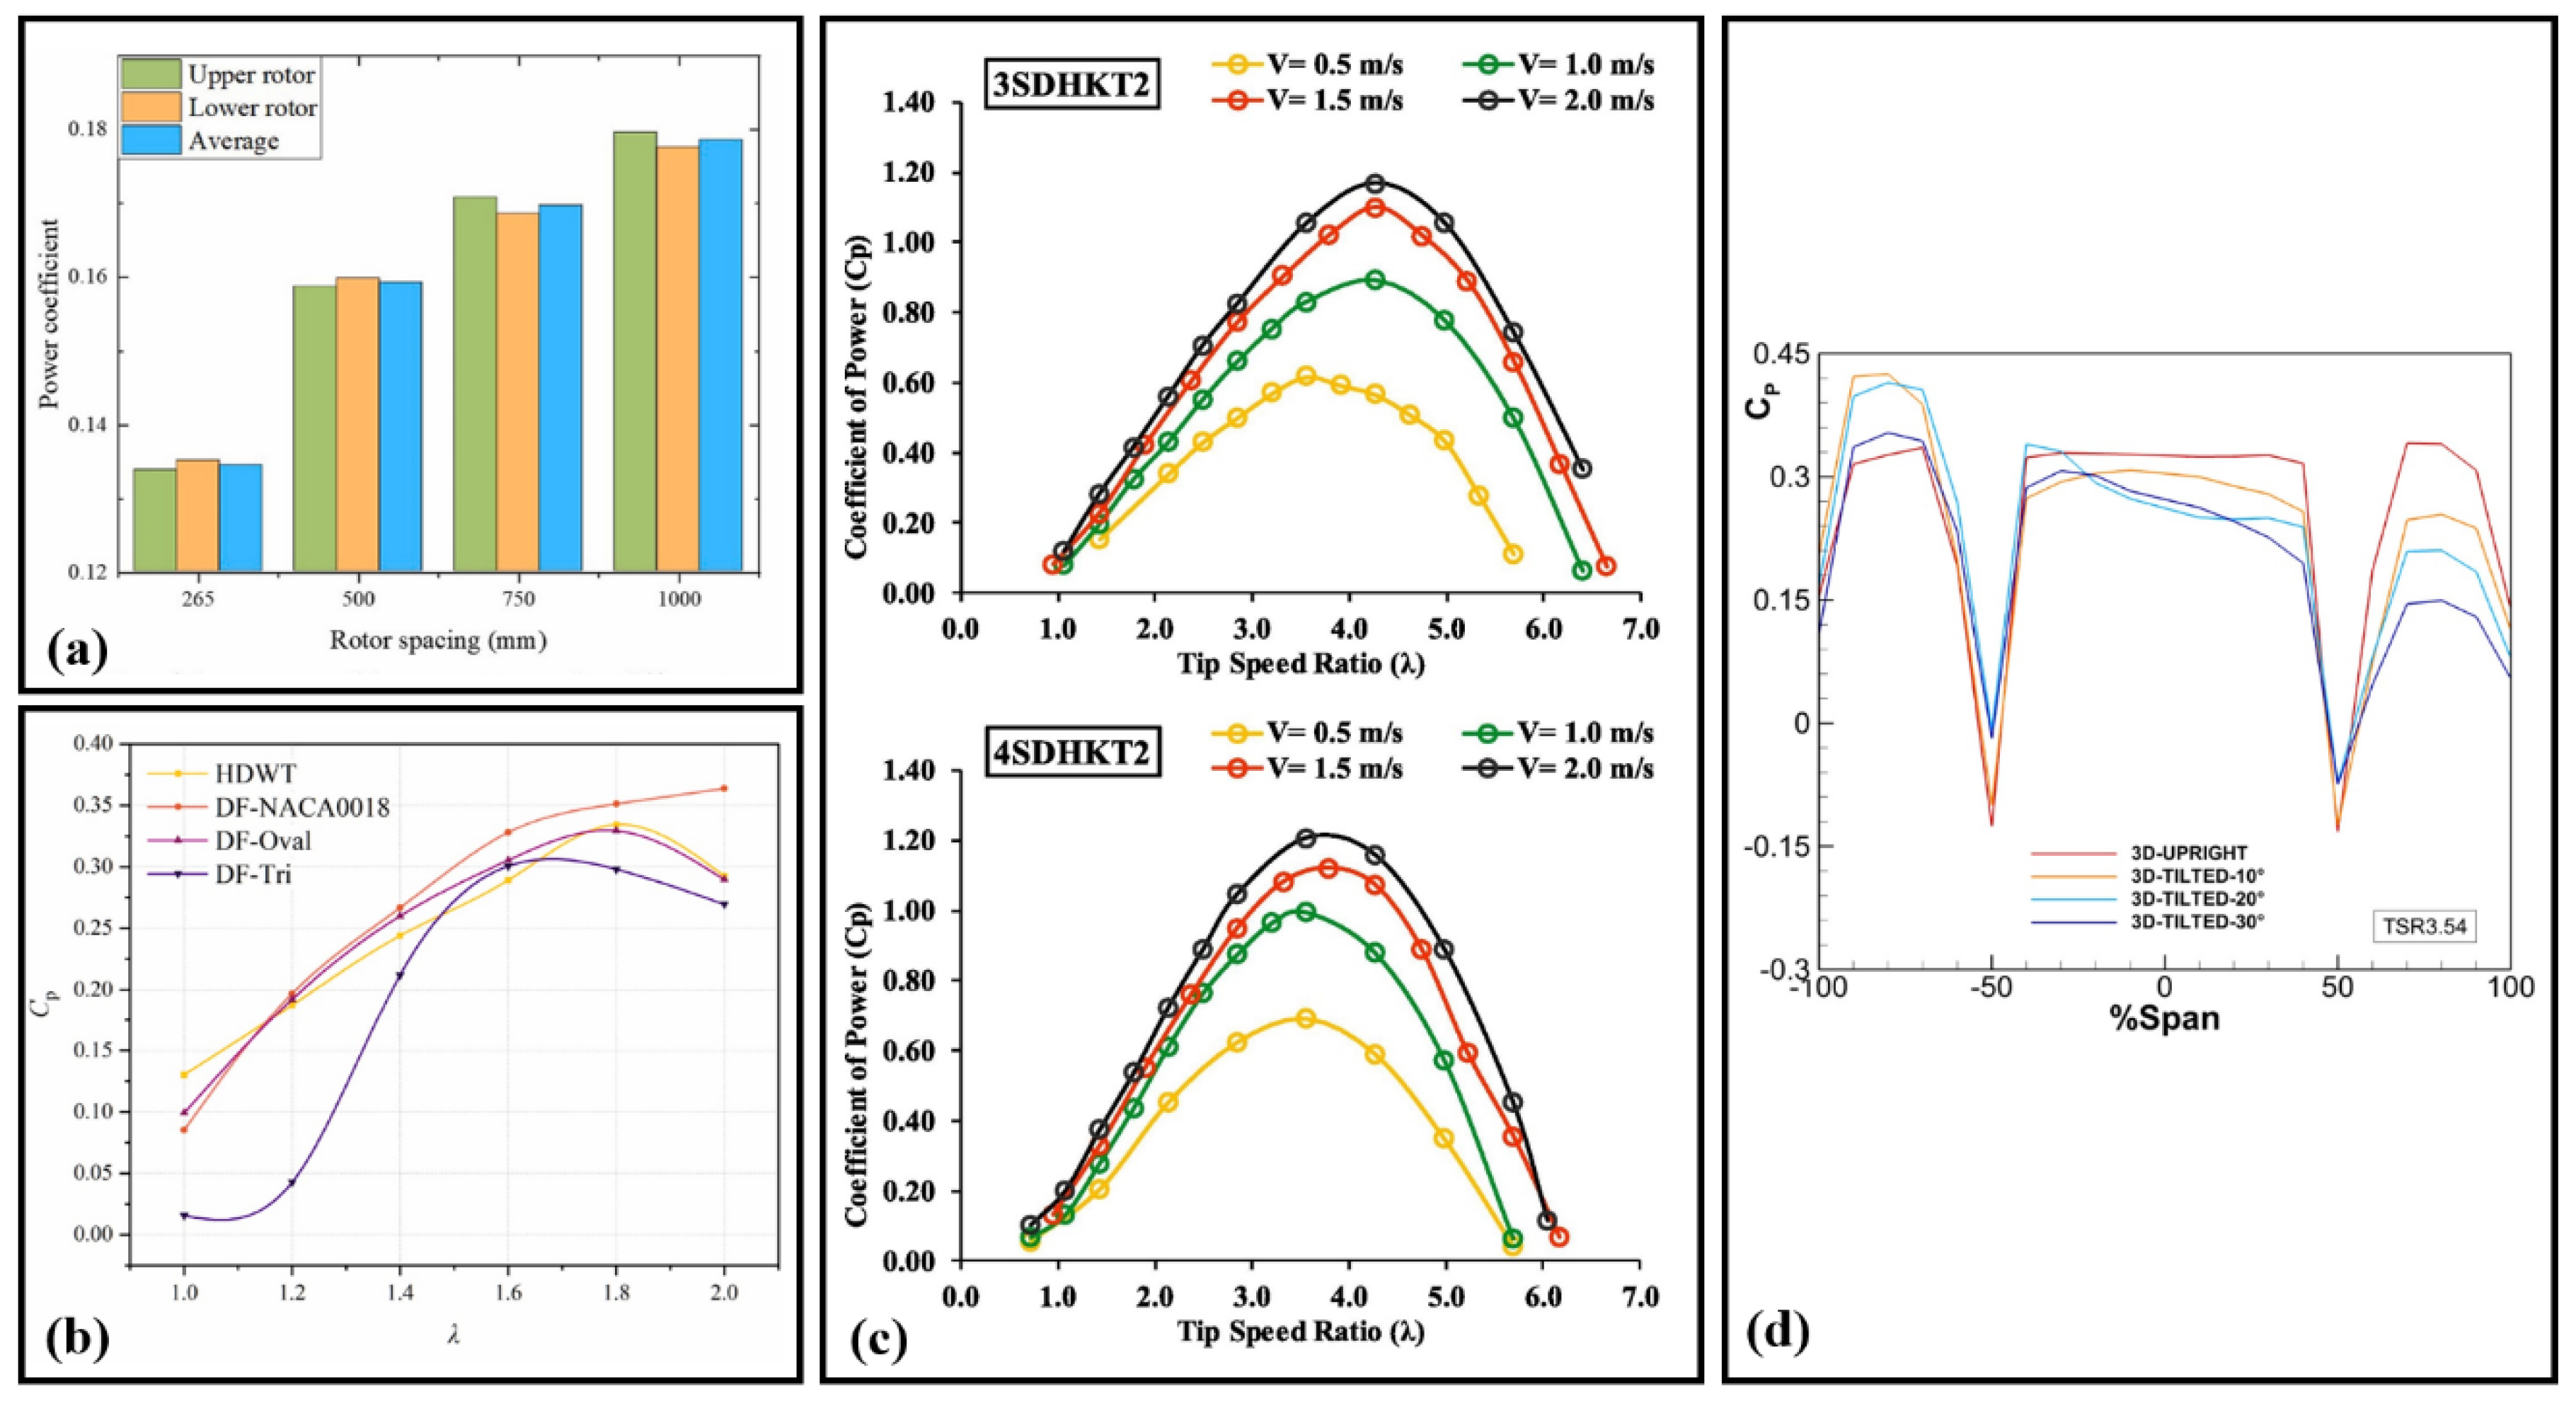
7.2. Impact of Rotor Spacing, Flow Disturbance, Blockage Ratios, and Tilt Angles on Wind and Hydro Darrieus Performance

The aerodynamic performance of a contra-rotating fan can be significantly influenced by the positional relationship between the upper and lower rotors. In their study [2], the impact of rotor spacing on performance was investigated, with the rotor spacing set to the rotor chord length of c = 265   m m . Previous studies have shown that when the upper and lower rotors are positioned too closely, interaction between them can occur, thereby reducing the overall wind energy utilization efficiency of the fan. Consequently, four different rotor spacing scenarios—265 mm, 500 mm, 750 mm, and 1000 mm—were analyzed. For instance, in Figure 18a [2], the relationship between the power coefficient of the CRVAWT and rotor spacing is illustrated. It is shown that as rotor spacing increases, the power coefficient of the CRVAWT gradually rises, approaching that of an isolated VAWT.
On top of that, when λ > 1 , a backward shift of approximately θ = 30 ° in the peak and valley positions of the torque coefficient for traditional HDWTs is observed, with the effective AoA ranging between θ = 60 ° and θ = 85 ° . For HDWTs equipped with D-DF, the peak torque coefficient positions are shifted backward by θ = 25 ° and θ = 15 ° , while the valley positions experience a backward shift of θ = 30 ° and θ = 50 ° . Overall, the disturbed flow device proves effective in enhancing the torque coefficient of HDWTs at high TSRs, thereby leading to an improvement in the power coefficient. The variations in torque coefficient and power coefficient for HDWTs at λ > 1 are depicted in Figure 18b [19].
What is more, the relationships between the power coefficient, torque coefficient, TSR, and blockage are depicted in Figure 18c [21], with a pipe flow velocity set at 1.0 m/s. In their numerical study [21], different blockage ratios (BR = 0.705, 0.796, and 0.893) were considered for both the 3SDHKT and 4SDHKT. As the BR increased, the C p vs. TSR curves shifted to the right and upward. Additionally, maximum C p values were elevated with an increase in BR. At lower TSR values, the blockage had a minimal effect on the performance of both 3SDHKT and 4SDHKT. However, a significant variation in C p was observed at higher TSR values (Figure 18c). The numerical analysis identified a maximum C p value of 0.985 at a TSR of 4.524 in the highest blockage case B R = 0.893 for the 3SDHKT. For the 4SDHKT, a C p value of 1.122 was found at a TSR of 3.770. Besides, the power harvesting capability of the VAWT at various tilt angles is compared to the upright configuration in Figure 18d, which presents the extracted power across different tilt conditions.

7.3. Influence of Blade Geometry, Strut Curvature, Aspect Ratio, and TSR on Darrieus Turbines Power Performance and Flow Dynamics

Figure 19a [78] presents the section power coefficient distribution along the blade span for turbines equipped with non-inclined tip struts, featuring curvature radii of R c = 0 , R c = 0.50 , and R c = 2 at an angular position of θ = 100 ° , as well as for the reference turbine without struts. It is observed that turbines with struts exhibit larger section power coefficient values at the mid-span of the turbine blade compared to the reference turbine. However, significant differences in the section power coefficient values near the blade tips are noted among the turbines with struts. For the turbine equipped with tip struts at R c = 2 (green markers in Figure 19a), the section power coefficient distribution near the blade tips surpasses that of both the reference turbine and the turbine with sharp blade–strut junctions (black and blue markers, respectively). Nonetheless, the section power coefficient values near the blade tips are lower than those for the turbine with R c = 0.5 .
Moreover, Figure 19b provides a comparison of the span-wise evolution of the power coefficient (referred to as “local”) for two configurations, along with the cumulative distributions of this parameter. The cumulative distribution is defined such that, at 100%, the cumulative value corresponds to the overall power coefficient harvested by the rotor. For conciseness, only results obtained using the SA turbulence model are presented, though similar trends are observed with the LR model. The left side of the figure displays the results at T S R e q = 4.0 , indicating that from 20% to 70% of the turbine half-span, the plane-blade turbine outperforms the slanted-blade configuration. However, near the blade tip, a significant reversal of trends is noted. This behavior can be attributed to the different ranges of AoA and blade solidity encountered by the incoming relative flow. As previously highlighted, moving towards the rotor tip reduces the local TSR, which greatly increases the variability of the AoA on the profile, combined with a reduction in Reynolds number and an increase in solidity. This causes the airfoil to enter a cyclic deep-stall regime, characterized by massive flow separations.
To elaborate, the effect of aspect ratio on the power performance of the LHHT rotor is illustrated using C p vs. λ plots at a water velocity of 2.0 m/s (Figure 19c [20]). These plots reveal that the five AR models exhibit a characteristic trend: initially increasing, reaching a maximum, and then declining. The peak power coefficient is shown to be proportional to the aspect ratio, with the optimal TSR remaining consistent at 1.0 across all AR models. The highest C p , recorded as C p = 0.228 for the 1.75 AR model, demonstrates a 32.5% improvement over the 0.75 AR model at a velocity of V = 1.0 m / s .
When the TSR is increased to λ = 1.5 , the intensity of flow separation is reduced across all sample blades. Consequently, the flow structure around each turbine becomes nearly independent of the blade’s geometric configuration. Additionally, the positive and negative effects of the blade pitch angle diminish in both the upstream and downstream regions. These conditions lead to similar performance across all sample turbines at TSR = 1.5 for the entire turbine (Figure 19d [12]). However, the twisted V-shaped blade turbine continues to exhibit inferior performance.

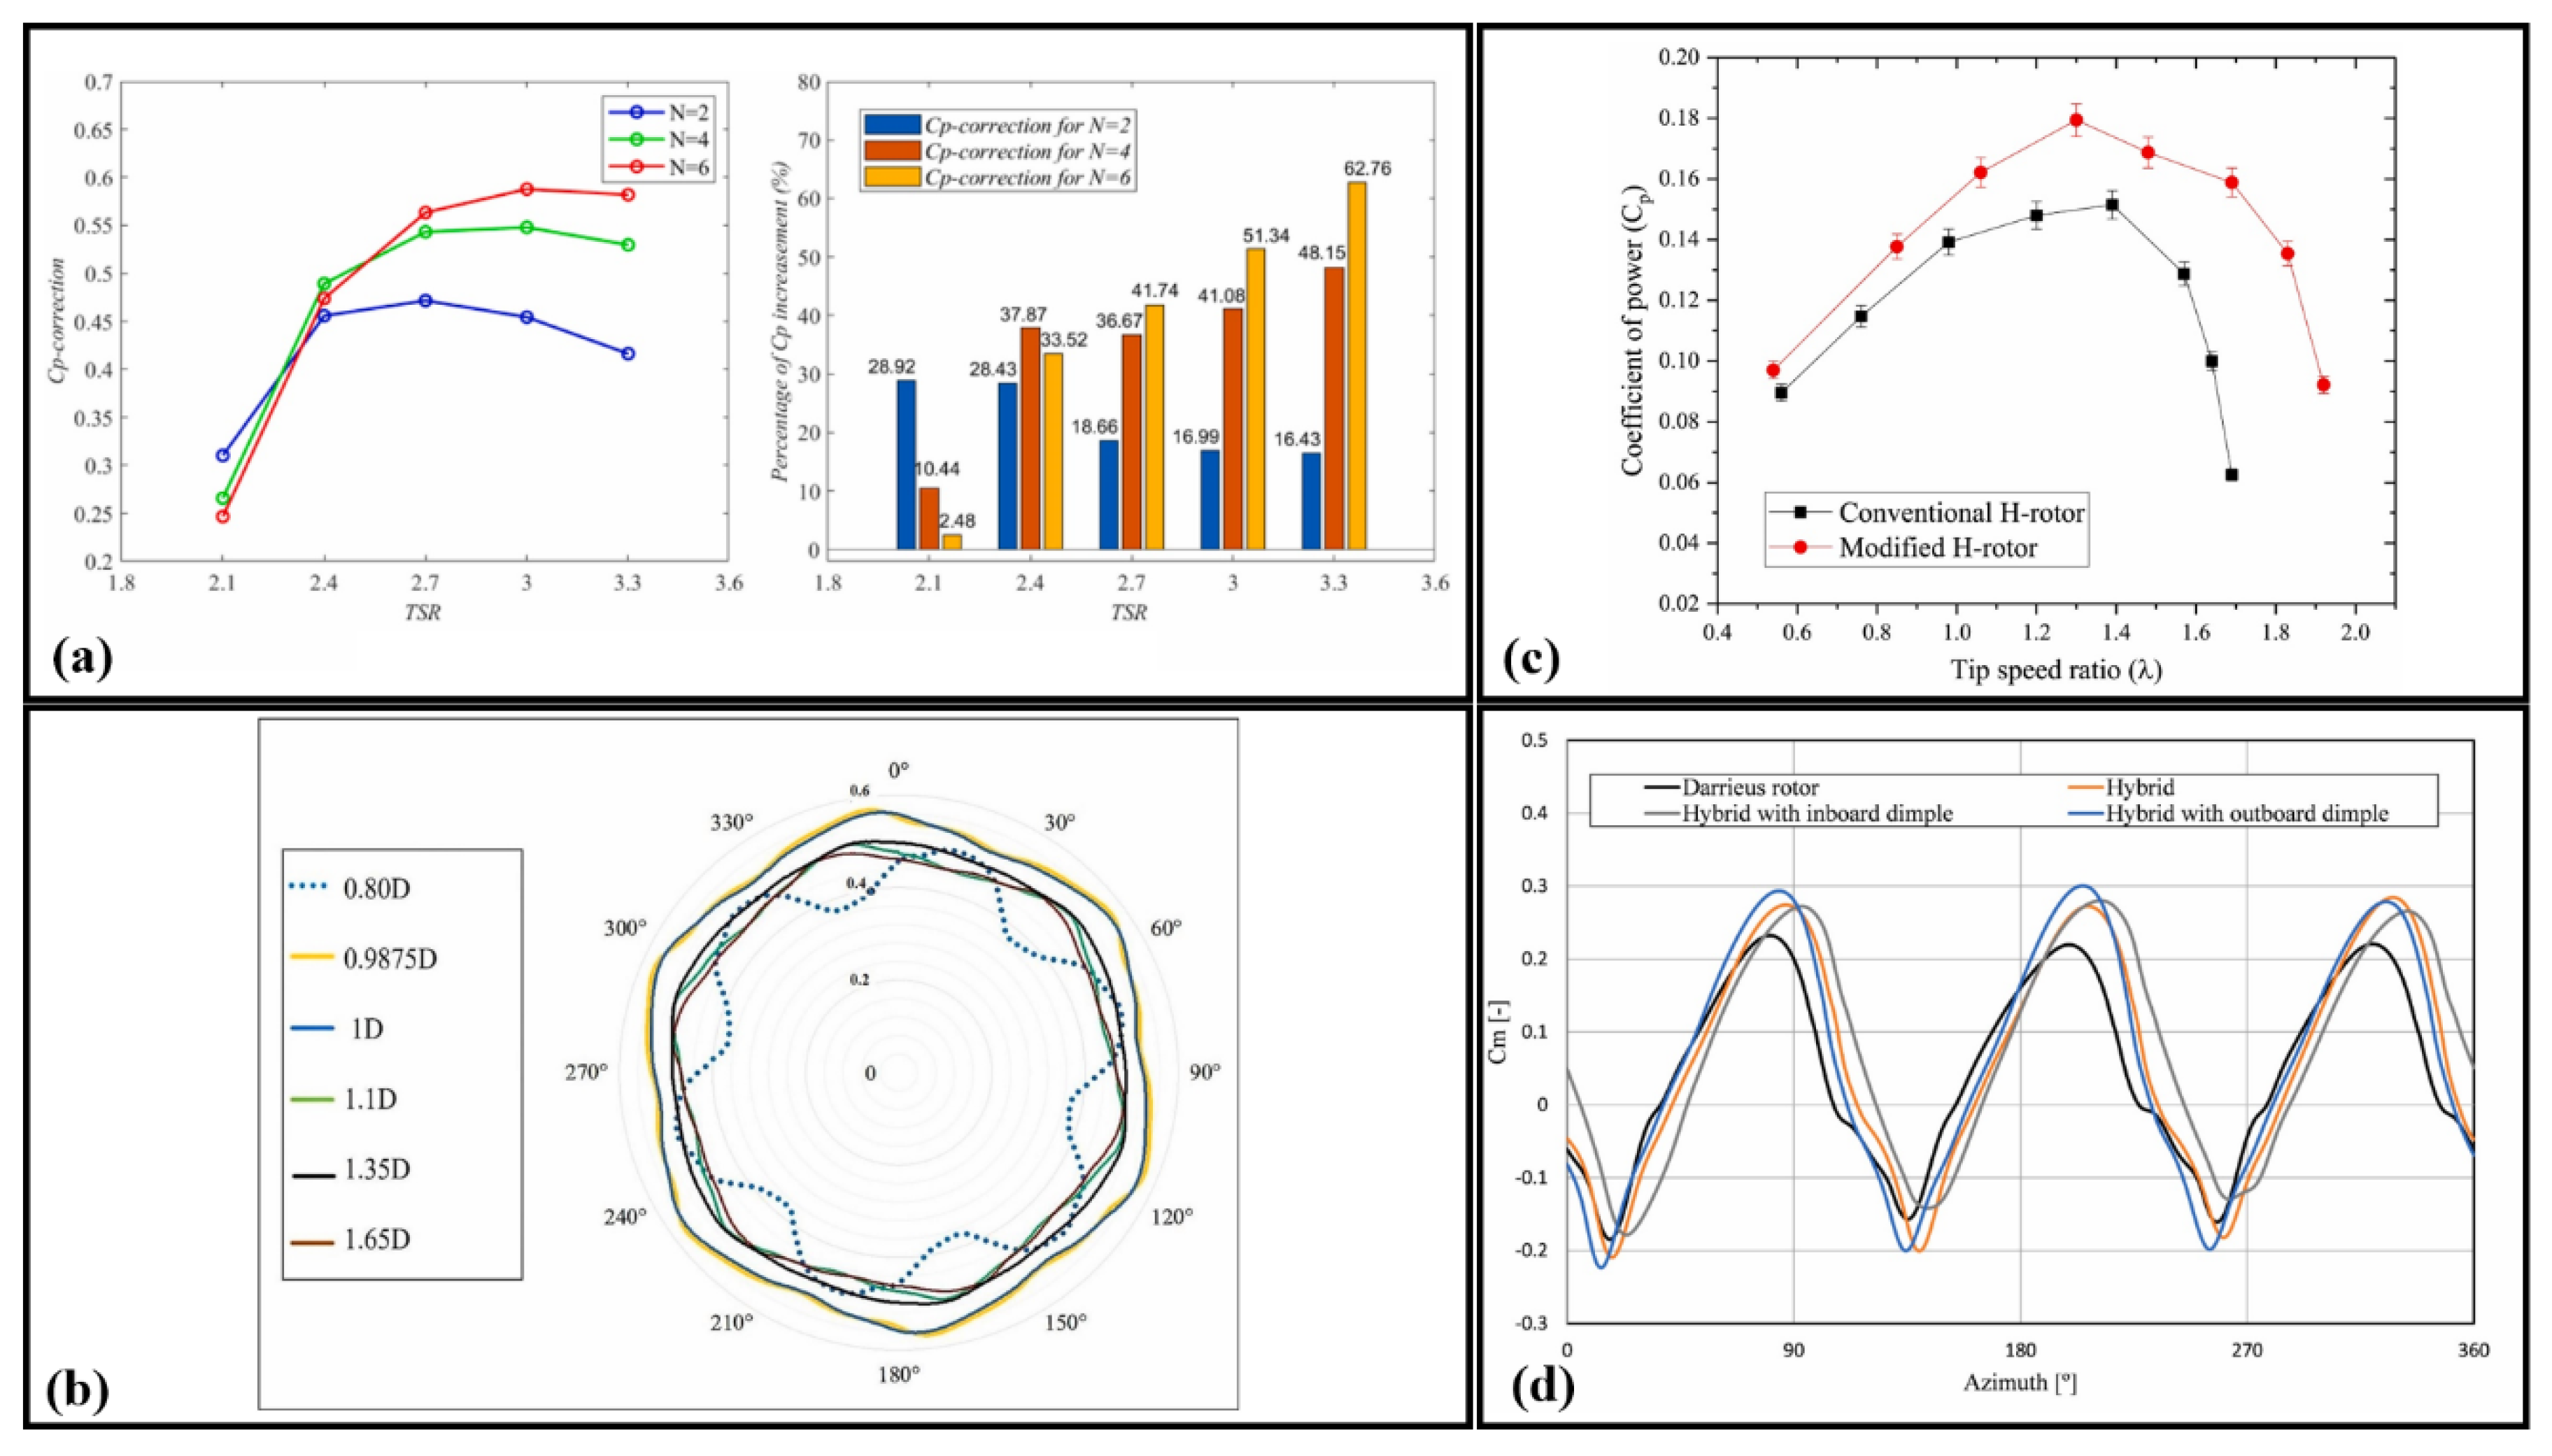
7.4. Performance Enhancement and Flow Dynamics in Multi-Turbine Arrays, H-Rotors, and Hybrid Darrieus Turbines

As depicted in Figure 20a [10], at λ = 2.1 , the lifting effect of the multi-turbine array is minimal, and at λ = 2.4 , it does not show a significant advantage over the twin-turbine array. As TSR increases, the performance of a single turbine within the multi-turbine array surpasses that of the twin-turbine array, leading to a substantial enhancement in the overall device performance. At λ = 3.3 , the C p of the 6-turbine array is observed to increase by 62.67% compared to a single turbine. To investigate the relationship between the performance of VAWT and the number of turbines, simulations have been conducted for VAWTs with 8 and 10 turbines at λ = 3.0 based on the aforementioned calculations.
In parallel, Figure 20c [22] illustrates the performance comparison between conventional and modified H-rotors, as well as the fluctuations in the C p curve relative to λ at a tested wind speed of V = 6.0 m / s . Low C p values were recorded at both low and high TSRs, with similar patterns observed for both the conventional and modified H-rotors. Nevertheless, an enhancement in C p values was noted for the conventional H-rotor following modification (by the addition of the auxiliary blade profile), and the maximum TSR working range increased from λ = 1.7 to λ = 1.9 . Hence, this research team indicated that the modified H-rotor is better suited for various TSR conditions.
Besides, the flow field analysis around the hybrid turbine featuring inboard and outboard dimples reveals that the vortices generated around the airfoils are smaller and dissipate more rapidly. This phenomenon contributes to the increase in the generated C m , as illustrated in Figure 20d [23]. Among the various configurations, the hybrid turbine with inboard dimples exhibits superior performance, a finding that is also corroborated by the velocity streamlines.

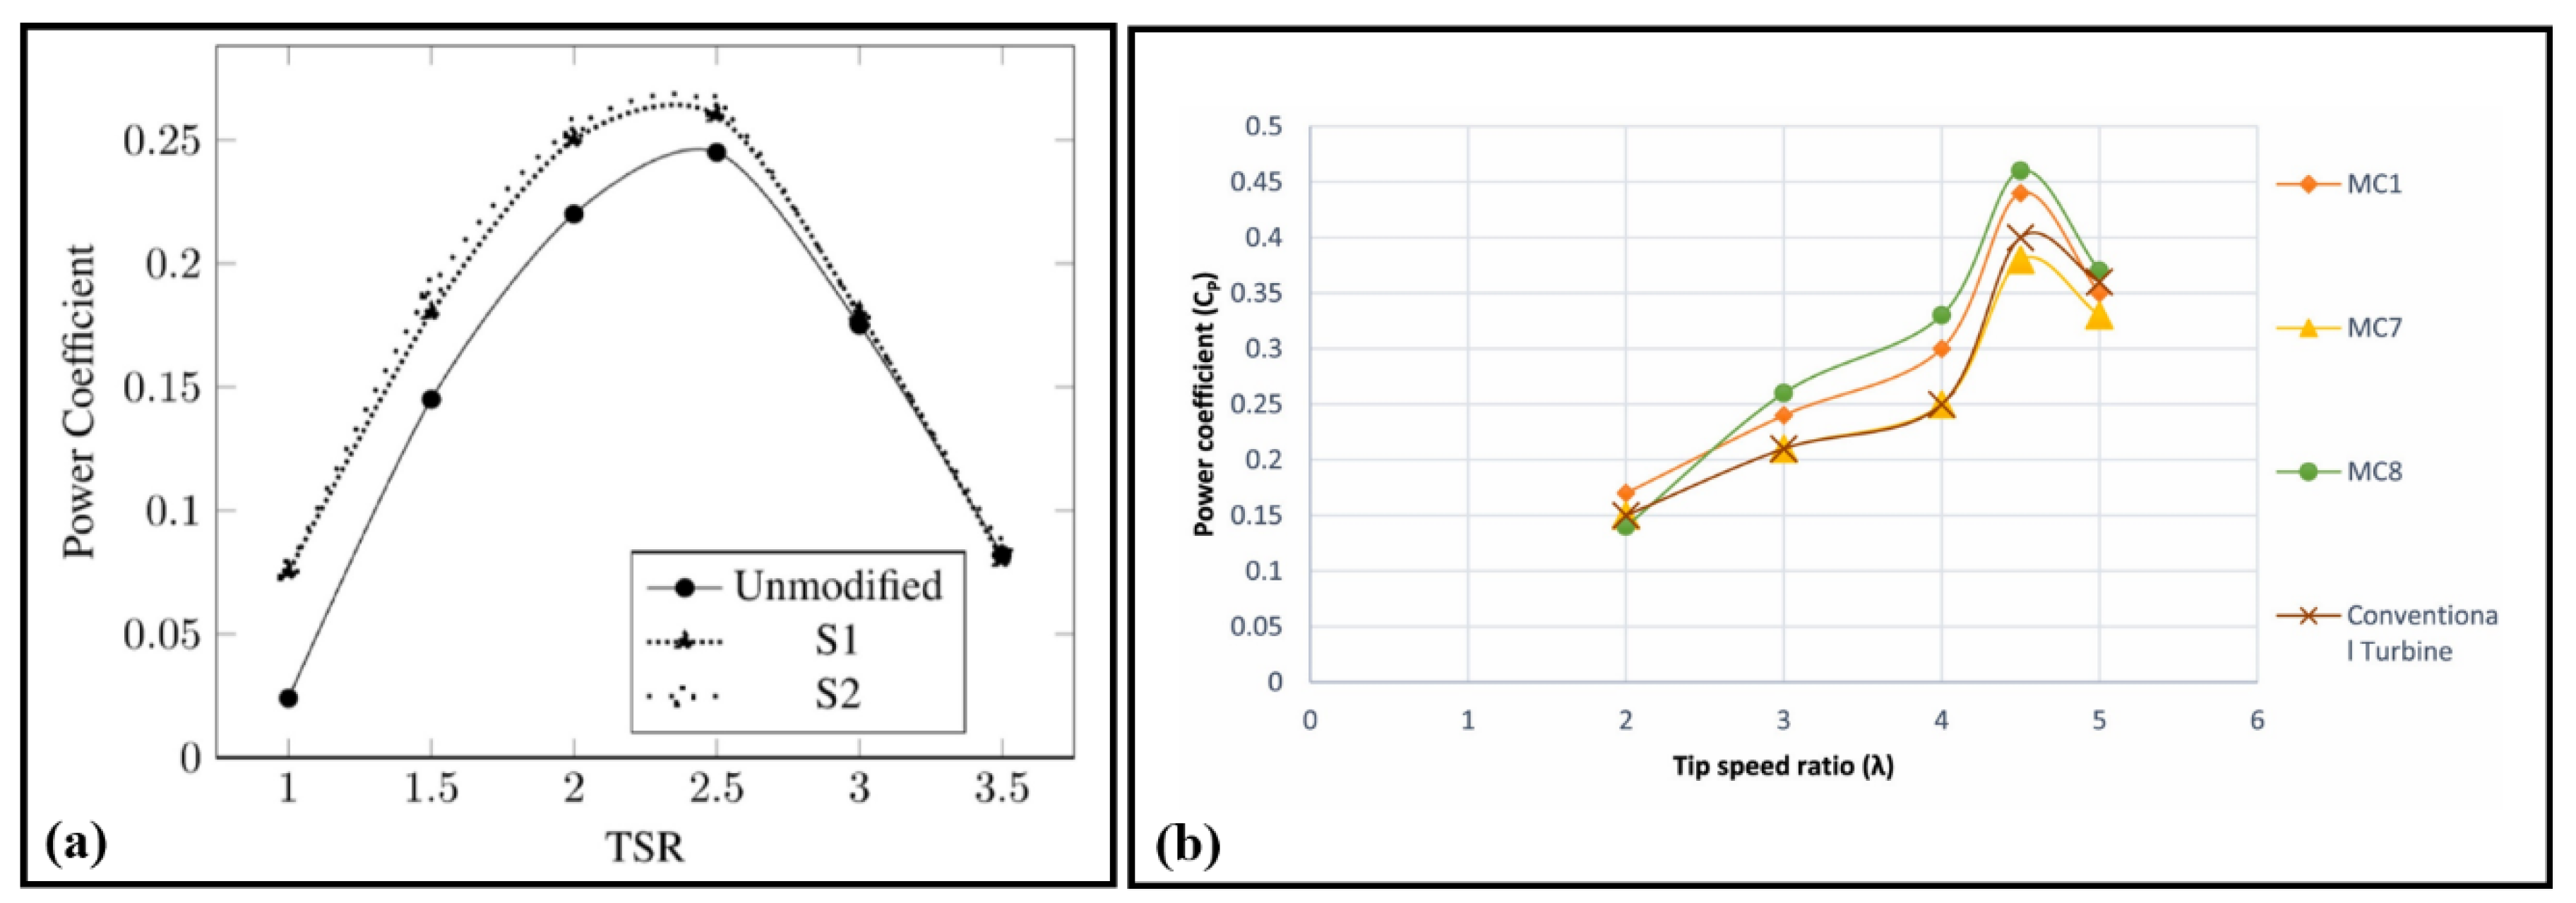
7.5. Impact of Blade Modifications on Aerodynamic Performance and Torque Generation of Darrieus Turbines

The proposed utilization of SC blades has been evaluated across the full operating range of the machine. In Figure 21a [11], a comparison is presented regarding the predicted average power coefficient (purely aerodynamic) for the proposed design with an optimal suction momentum of C µ = 0.0035 , considering various suction blower efficiencies η b of (60%, 70%, and 80%), against the BL turbine at different TSR. This improvement is particularly pronounced at low TSRs. The maximum enhancement in power coefficient is achieved for λ < 2 , with a peak at λ = 2 , where an increase of nearly 100% in C p relative to the BL turbine is observed for the SC turbine with η b = 70 % .
In a similar vein, the impact of cavity shape on wind turbine performance has been examined, as depicted in Figure 21b. The size and position of the cavity were kept constant while only the shape of the cavity was altered. Three distinct cavity shapes were analyzed, as detailed in [49]. The comparison of results indicated that the cavity with a circular shape yielded the highest C p and C m values across all cases, particularly at higher TSRs.
An additional investigation was carried out focusing on the instantaneous torque coefficients for various pitch angles, utilizing the J-shaped airfoil with opening ratios of 90% and 60%, at TSRs of λ = 1.6 and λ = 3.38 , respectively. Positive pitch angles were found to effectively delay stall and enable the blade to generate more torque over a larger azimuthal range. However, it was noted that a significant reduction in blade performance occurred in the downstream region with larger positive pitch angles. Specifically, a pitch angle of β = 8 ° resulted in negative torque between θ = 200 °   and θ = 360 ° , which counterbalanced the positive torque contribution in the upstream region and potentially reduced overall torque production during start-up stages.
What is more, the moment stall for t / c = 18 % and 21% is observed at approximately θ = 60 ° (Figure 21d [65]). In cases where t / c > 12 % , a double peak within the negative C m region is noted during the interval θ = 90 ° 120 ° . This phenomenon occurs when the DSV detaches, leading to the formation of trailing edge vortices (TEVs) and secondary vortices.

7.6. Impact of Leading-Edge Modifications on Power Coefficient of Darrieus Turbines

The plot illustrating the power coefficient of turbines with and without leading-edge protuberances is presented in Figure 22a. In the legend, “unmodified” denotes the baseline configuration lacking protuberances. The labels “S1” and “S2” represent the VAWT models equipped with leading-edge protuberances of profiles S1 and S2, respectively. As depicted in the figure, only minimal variations in power output are evident between the unmodified and the enhanced models when the TSR exceeds 3. The model with protuberances demonstrates a higher maximum power coefficient compared to the unmodified model. Specifically, the power output of the S2 configuration, featuring a protuberance of g = 0.01 c , slightly surpasses that of the S1 configuration, which has a protuberance of g = 0.02 c . An increase of 14.2% in C p is achieved with the S2 protuberance at λ = 2 , while a 15.3% improvement is observed at λ = 1.5 relative to the unmodified model. Overall, the presence of leading-edge protuberances enhances the performance of the isolated blade and boosts the power generation of the VAWT. Among the configurations with protuberances, the S2 design with an amplitude of 0.01c demonstrates the superior performance in terms of power output.
In Figure 22b [16], the power coefficient and torque coefficient of the enhanced wind turbine are illustrated in relation to the λ for three micro-cylinder diameters. The three diameters per chord ratio (d/c) values of 0.029, 0.05, and 0.065 exhibit either a positive or a negative effect on the generated power. The maximum power coefficient is achieved with the smallest micro-cylinder diameter   d / c = 0.029 , reaching a value of C p = 0.443 . This represents a relative increase of 9.5% compared to the conventional design.

7.7. Enhanced Darrieus Turbines Performance Through Flexible Blade Design and Deflector Integration

In Figure 23a [13], the instantaneous moment coefficient for a complete revolution of two VAWT models is presented: the baseline model with the original rigid blade and the optimized model with a flexible blade, both tested at λ = 1.38 . It is observed that the turbine performance is enhanced with the new blade design when utilized on the upwind side. On the downwind side, the moment coefficient curve for the flexible blade initially aligns closely with the original blade’s moment coefficient curve up to an azimuthal position of θ = 270 ° .
Complementary to this, to enhance the power output of the hybrid turbine across the upwind, leeward, and downwind regions, both front and side deflectors are utilized. The front deflector is designed to boost power generation in the upwind region, whereas the side deflector is employed to redirect wind towards the leeward and partial downwind areas, thereby improving performance in these regions. Additionally, the performance of the hybrid turbine is evaluated with the use of both deflectors simultaneously. The power coefficient for the hybrid turbine equipped with side, front, and double deflectors, as well as a bare Darrieus turbine, is depicted in relation to the TSR in Figure 23b [18].
The results indicate that a 30% increase in the maximum C p of the hybrid wind turbine at the optimal TSR was achieved with the implementation of a front deflector. However, it was observed that this deflector reduced the self-starting capability of the hybrid turbine by 40%. It should be noted that the double deflectors, unlike other configurations, achieved their maximum C p at a TSR of 3.07, thus extending the operational range of the turbine (Zidane et al. [47], Pallotta et al. [24]).
In Figure 23c [17], increased values of force, though directed oppositely, are evident at the 360-degree position. This rotor position is excluded from consideration due to the blade’s perpendicular alignment to the wind direction, resulting in a diminished effect of the centrifugal force.

8. Gaps in Current Research and Directions for Future Studies

Despite significant advancements, several research gaps in Darrieus wind turbine design remain. First, the dynamic stall phenomenon and its impact on turbine performance under variable wind conditions require further investigation using high-fidelity turbulence models such as LES and IDDES. Additionally, the aerodynamic interactions in multi-rotor configurations need comprehensive studies to optimize spacing and blockage effects. Moreover, material fatigue and structural integrity under prolonged operation should be addressed through advanced materials and adaptive structures. Furthermore, economic analyses, including life cycle assessments, are necessary to evaluate the cost-effectiveness of design innovations. Environmental impact assessments should also be integrated to ensure sustainable deployment. Consequently, future research should focus on advanced CFD techniques for practical applications, optimization of rotor designs for specific environmental conditions, and development of hybrid turbine configurations. Efficient computational methods to reduce simulation times and the integration of AI with CFD simulations should be explored to enhance optimization strategies. Lastly, understanding the impact of material properties on performance and reducing dependency on physical prototyping through CFD-driven research will be crucial for developing next-generation turbines.

9. Conclusions

This review has thoroughly evaluated the progress made in enhancing the design and performance of Darrieus wind turbines over the past decade, with a special focus on the role of CFD techniques. Throughout this period, 2D and 3D CFD simulations, employing tools such as “Ansys-Fluent” and “STAR-CCM+”, have been extensively used to model and optimize the aerodynamic characteristics of Darrieus rotors. These simulations have allowed for significant insights into the impact of various geometric modifications on turbine performance, particularly in terms of torque and power coefficients. For example, increasing the rotor blade chord length from 0.15 m to 0.3 m resulted in a notable 26.7% improvement in the maximum torque coefficient, which rose to 0.4984, while the power coefficient improved by 20.44%.
Moreover, adjustments to rotor solidity and the incorporation of multiple rotor configurations, either stacked or in parallel, have proven effective in boosting overall efficiency. Specifically, a solidity value of 0.625 was identified as optimal, achieving a maximum power coefficient of 0.37 at a TSR of 2.5, while a reduction in solidity expanded the operational TSR range. Research into rotor spacing and blockage ratios in CRVAWTs has also demonstrated significant improvements, with a blockage ratio of 0.893 yielding a power increase of 37.315% for 3SDHKT turbines.
The influence of blade geometry and aspect ratio (AR) on turbine performance has emerged as a key focus, with a higher AR of 1.75 leading to a 32.5% increase in the power coefficient, mainly due to a reduction in blade tip vortex strength. Aerodynamic innovations, such as leading-edge protuberances and flexible blade designs, have also played an important role in enhancing efficiency. For instance, the S2 blade configuration resulted in a 15.3% increase in the power coefficient at TSR = 1.5, while the integration of a double deflector increased power by 55% at TSR = 2.6. In addition to these quantitative improvements, advanced CFD simulations have provided valuable insights into complex flow structures, including vorticity fields and dynamic pressure contours, shedding light on the intricate aerodynamic interactions at play. Taken together, these findings offer valuable lessons for maximizing energy capture and enhancing efficiency in both wind and hydroturbine applications.

10. Perspectives

Future research efforts should focus on the further integration of advanced CFD techniques in the practical deployment of wind turbines, with particular emphasis on scalability and cost optimization. It is suggested that additional investigations explore the optimization of rotor designs tailored to specific environmental conditions, such as varying wind speeds and turbulence intensities, to enhance the adaptability and efficiency of turbines in diverse locations. Moreover, refining flow deflectors, adaptive control mechanisms, and other aerodynamic enhancements could significantly improve turbine performance in both offshore and onshore settings. Another promising direction is the investigation into hybrid turbine configurations that combine the benefits of Darrieus and HAWTs, which could potentially increase efficiency across a broader range of operating conditions.
Additionally, the development of more efficient computational methods for reducing simulation times while maintaining high accuracy is crucial for speeding up the design process, particularly for large-scale turbine farms. The exploration of AI and machine learning algorithms integrated with CFD simulations could offer novel optimization strategies by automatically adjusting turbine geometries and operational parameters based on real-time environmental data. Furthermore, a deeper understanding of the impact of material properties on turbine performance, such as the integration of lightweight, durable materials and advanced manufacturing techniques, could lead to significant improvements in structural efficiency and cost reduction.
CFD-driven research is also expected to contribute to the reduction of dependency on costly and time-consuming physical prototyping, which would be especially beneficial in the development of next-generation turbines. This will not only accelerate the design phase but also reduce the environmental footprint of turbine manufacturing. It is anticipated that these advancements will play a key role in addressing the challenges associated with the large-scale deployment of wind energy technologies, contributing to the global transition towards sustainable and cost-effective renewable energy sources.

Author Contributions

S.e.-D.F.: Supervision, Conceptualization, Methodology, Investigation, Resources, Writing—Original Draft, Writing—review and editing, Visualization and Project administration. S.R.: Methodology, Investigation, Resources, Writing, Writing—review and editing, Visualization. E.B.: Methodology, Investigation, Resources, Writing, Writing—review and editing, Visualization. K.L.: Methodology, Investigation, Resources, Writing, Writing—review and editing, Visualization. A.S.: Methodology, Investigation, Resources, Writing, Writing—review and editing, Visualization. A.A.: Methodology, Investigation, Resources, Writing, Writing—review and editing, Visualization. I.K.: Methodology, Investigation, Resources, Writing, Writing—review and editing, Visualization. R.A.: Methodology, Investigation, Resources, Writing, Writing—review and editing, Visualization. All authors have read and agreed to the published version of the manuscript.

Funding

This research received no external funding.

Data Availability Statement

No new data were created or analyzed in this study.

Acknowledgments

The partnership with KFUPM has been instrumental in the execution and success of this research. In accordance with good scientific practice, we extend our sincere appreciation to the host unit representatives who have made genuine scientific contributions to this work. Their expertise and support have been invaluable. The corresponding author acknowledges the use of artificial intelligence (AI) via “ChatGPT” solely after the manuscript was fully drafted. The AI was utilized to enhance the clarity and precision, style and tone, grammar and syntax, and overall coherence and cohesion of the text.

Conflicts of Interest

The authors declare no conflict of interest.

Abbreviations

C Chord length of the main blade (mm) λ Tip speed Ratio (-)
C 1 C 2 Chord length ratio between the main blade and the auxiliary blade (-) ϑ Azimuthal angle (degrees)
C 2 Chord length of the auxiliary blade (mm) Blade–strut angle (degrees)
C d Drag coefficient (-) σ Solidity (-)
C l Lift coefficient (-) θ Angular position of turbine blade (degrees)
C m Moment coefficient (-)
C p Power coefficient (-)3SDHKTThree-stage ducted hydrokinetic turbine
C p a v g Average power coefficient across multiple operating conditions (-)4SDHKTFour- stage ducted hydrokinetic turbine
C p , m a x Maximum power coefficient (-)ARAspect ratio
C t s Maximum static torque coefficient (-)AoAAngle of attack
C T Torque coefficient (-)BLBaseline airfoil
C µ Suction momentum ratio (-)BRBlockage ratio
C p c o r r Corrected power coefficient (-)CADComputer-aided design
D Diameter of the turbine rotor (mm)CFDComputational fluid dynamics
d Spacing between rotors H (mm)CRVAWTContra-rotating vertical axis wind turbine
d /   c Diameter-to-chord ratio of the micro-cylinder placed around the airfoil (-)CWClockwise
d c Cavity diameter (mm)DD-VAWTDouble-Darrieus hybrid vertical axis wind turbine
H Rotor height (mm)D-DFDrag-disturbed flow
L Gap between adjacent turbines (mm)DF-TriSpecific type of D-DF device
N Number of turbines in a Darrieus configuration (-)DSVDynamic stall vortex
Q Q-criterion (vorticity-based criterion for identifying vortices) (-)FSIFluid–structure interaction
R Rotor radius (mm)HDWTHorizontal-Darrieus wind turbine
$ R / c Curvature radius to chord length ratio (-)HKTHydrokinetic turbine
r z Cylindrical coordinates of the blade stacking line at mid-chord (mm)IGESInitial graphics exchange specification
R e Reynolds number (-)LELeading edge
S Rotor separation distance (mm)LEVLeading edge vortex
S / D Ratio of relative spacing to rotor diameter (-)LHHTLift-type helical hydrokinetic turbine
t / c Thickness-to-chord ratio (-)LRLow-Reynolds turbulence model
V Freestream wind speed m / s LSBLaminar separation bubble
x Longitudinal distance between the aerodynamic centers of the main and auxiliary blades (mm)MCMicro-cylinder
y Vertical distance between the main and auxiliary blades (mm)SAShear-algebraic turbulence model
X d Axial displacement (in terms of chord length) (-)SCSuction cavity airfoil
Y / R Non-dimensional spanwise distance (-)SDHKTSpherical Darrieus hydrokinetic turbine
Y d Radial displacement (in terms of rotor radius) (-)SLSSelective laser sintering (3D printing technology)
Y t Rotor radius (mm)TETrailing edge
Z * Non-dimensional height above the turbine base (-)TEVTrailing edge vortex
Greek symbols TSRTip speed ratio
α Angle of attack (degrees)TSSTTransitional shear stress transport model
β Pitch angle (degrees)URANSUnsteady Reynolds-averaged Navier–Stokes
α Increment of the angle of attack due to leading-edge deflection (degrees)VAWTVertical axis wind turbine
η b Suction blower efficiency (-)VISVortex-induced separation

References

  1. Ahmad, M.; Shahzad, A.; Akram, F.; Ahmad, F.; Shah, S.I.A. Design optimization of Double-Darrieus hybrid vertical axis wind turbine. Ocean Eng. 2022, 254, 111171. [Google Scholar] [CrossRef]
  2. Zheng, P.; Zhang, H.; Zhang, Z.; Salman, W.; Abdelrahman, M. Parameter optimization method of contra-rotating vertical axis wind turbine: Based on numerical simulation and response surface. J. Clean. Prod. 2024, 435, 140475. [Google Scholar] [CrossRef]
  3. Satrio, D.; Widyawan, H.B.; Ramadhani, M.A.; Muharja, M. Effects of the distance ratio of circular flow disturbance on vertical-axis turbine performance: An experimental and numerical study. Sustain. Energy Technol. Assess. 2024, 63, 103635. [Google Scholar] [CrossRef]
  4. Shen, Z.; Gong, S.; Xie, G.; Lu, H.; Guo, W. Investigation of the effect of critical structural parameters on the aerodynamic performance of the double darrieus vertical axis wind turbine. Energy 2024, 290, 130156. [Google Scholar] [CrossRef]
  5. Yadav, S.; Veeravalli, S.V.; Singh, S.N. Effect of rotor spacing, overlapping and non-overlapping, on the performance of a coupled counter-rotating twin-rotor VAWT using CFD. Renew. Energy 2024, 221, 119811. [Google Scholar] [CrossRef]
  6. Ansaf, R.; Abdelhameed, H.S.; Hashem, I.; Harun, Z. Efficiency-based design optimization of the H-type Darrieus wind turbine with fixed guiding-walls. Energy Rep. 2023, 9, 3576–3592. [Google Scholar] [CrossRef]
  7. Ahmad, M.; Zafar, M.H. Enhancing vertical axis wind turbine efficiency through leading edge tubercles: A multifaceted analysis. Ocean Eng. 2023, 288, 116026. [Google Scholar] [CrossRef]
  8. Huang, H.; Luo, J.; Li, G. Study on the optimal design of vertical axis wind turbine with novel variable solidity type for self-starting capability and aerodynamic performance. Energy 2023, 271, 127031. [Google Scholar] [CrossRef]
  9. Celik, Y.; Ingham, D.; Ma, L.; Pourkashanian, M. Design and aerodynamic performance analyses of the self-starting H-type VAWT having J-shaped aerofoils considering various design parameters using CFD. Energy 2022, 251, 123881. [Google Scholar] [CrossRef]
  10. Tian, W.; Ni, X.; Li, B.; Yang, G.; Mao, Z. Improving the efficiency of Darrieus turbines through a gear-like turbine layout. Energy 2023, 267, 126580. [Google Scholar] [CrossRef]
  11. Ibrahim, A.A.; Elbaz, A.M.; Melani, P.F.; Mohamed, O.S.; Bianchini, A. Power augmentation of Darrieus wind turbine blades using trapped vortex cavity. J. Wind Eng. Ind. Aerodyn. 2022, 223, 104949. [Google Scholar] [CrossRef]
  12. Abdolahifar, A.; Azizi, M.; Zanj, A. Flow structure and performance analysis of Darrieus vertical axis turbines with swept blades: A critical case study on V-shaped blades. Ocean Eng. 2023, 280, 114857. [Google Scholar] [CrossRef]
  13. Hijazi, A.; ElCheikh, A.; Elkhoury, M. Numerical investigation of the use of flexible blades for vertical axis wind turbines. Energy Convers. Manag. 2024, 299, 117867. [Google Scholar] [CrossRef]
  14. Yan, Y.; Avital, E.; Williams, J.; Cui, J. Aerodynamic performance improvements of a vertical axis wind turbine by leading-edge protuberance. J. Wind Eng. Ind. Aerodyn. 2021, 211, 104535. [Google Scholar] [CrossRef]
  15. Baghdadi, M.; Elkoush, S.; Akle, B.; Elkhoury, M. Dynamic shape optimization of a vertical-axis wind turbine via blade morphing technique. Renew. Energy 2020, 154, 239–251. [Google Scholar] [CrossRef]
  16. Bakhumbsh, S.A.; Mohamed, M.H. Effect of micro-cylinder as a passive controller on the Darrieus wind turbine performance. Ocean Eng. 2022, 266, 113118. [Google Scholar] [CrossRef]
  17. Marzec, Ł.; Buliński, Z.; Krysiński, T.; Tumidajski, J. Structural optimisation of H-Rotor wind turbine blade based on one-way Fluid Structure Interaction approach. Renew. Energy 2023, 216, 118957. [Google Scholar] [CrossRef]
  18. Chegini, S.; Asadbeigi, M.; Ghafoorian, F.; Mehrpooya, M. An investigation into the self-starting of Darrieus-Savonius hybrid wind turbine and performance enhancement through innovative deflectors: A CFD approach. Ocean Eng. 2023, 287, 115910. [Google Scholar] [CrossRef]
  19. Jiang, T.; Zhao, Y.; Wang, S.; Zhang, L.; Li, G. Aerodynamic characterization of a H-Darrieus wind turbine with a Drag-Disturbed Flow device installation. Energy 2024, 292, 130522. [Google Scholar] [CrossRef]
  20. Reddy, K.B.; Bhosale, A.C. Influence of aspect ratio on the performance and wake recovery of lift-type helical hydrokinetic turbine. Energy 2024, 289, 129996. [Google Scholar] [CrossRef]
  21. Kumar, R.; Sarkar, S. Performance analysis of spherical-shaped Darrieus hydrokinetic turbine for an in-pipe hydropower system. Energy Convers. Manag. 2023, 294, 117600. [Google Scholar] [CrossRef]
  22. Reddy, K.U.; Deb, B.; Roy, B. A numerical and experimental study on the performance of a conventional H-Darrieus wind rotor with auxiliary blades. Ocean Eng. 2023, 280, 114697. [Google Scholar] [CrossRef]
  23. Eltayesh, A.; Castellani, F.; Natili, F.; Burlando, M.; Khedr, A. Aerodynamic upgrades of a Darrieus vertical axis small wind turbine. Energy Sustain. Dev. 2023, 73, 126–143. [Google Scholar] [CrossRef]
  24. Iddou, H.; Bouda, N.N.; Zereg, K. Computational fluid dynamics study on the efficiency of straight-bladed vertical axis wind turbine. Int. J. Thermofluids 2024, 22, 100672. [Google Scholar] [CrossRef]
  25. Mohamed, O.S.; Melani, P.F.; Soraperra, G.; Brighenti, A.; Ferrara, G.; Betti, V.; Schippa, L.; Guerrero, M.; Balduzzi, F.; Bianchini, A. Three-dimensional CFD-ALM-VOF modeling of hydrokinetic turbines in realistic open-channel conditions. Ocean Eng. 2024, 313, 119411. [Google Scholar] [CrossRef]
  26. Mohamed, O.S.; Melani, P.F.; Papi, F.; Balduzzi, F.; Bianchini, A. Is the Actuator line method able to reproduce the interaction between closely-spaced Darrieus rotors? a critical assessment on wind and hydrokinetic turbines. Energy Convers. Manag. 2023, 293, 117473. [Google Scholar] [CrossRef]
  27. Khedr, A.; Castellani, F. Critical issues in the moving reference frame CFD simulation of small horizontal axis wind turbines. Energy Convers. Manag. X 2024, 22, 100551. [Google Scholar] [CrossRef]
  28. Eltayeb, W.A.; Somlal, J. Performance Enhancement of Darrieus Wind Turbines Using Plain Flap and Gurney Flap Configurations: A CFD Analysis. Results Eng. 2024, 24, 103400. [Google Scholar] [CrossRef]
  29. Sanaye, S.; Farvizi, A. Optimizing a vertical axis wind turbine with helical blades: Application of 3D CFD and Taguchi method. Energy Rep. 2024, 12, 2527–2547. [Google Scholar] [CrossRef]
  30. Chen, W.H.; Wang, Y.S.; Chang, M.H.; Show, P.L.; Hoang, A.T. Operation parameter interaction and optimization of vertical axis wind turbine analyzed by Taguchi method with modified additive model and ANOVA. Energy Rep. 2024, 11, 5189–5200. [Google Scholar] [CrossRef]
  31. Fatahian, E.; Mishra, R.; Jackson, F.F.; Fatahian, H. Optimization and analysis of self-starting capabilities of vertical axis wind turbine pairs: A CFD-Taguchi approach. Ocean Eng. 2024, 302, 117614. [Google Scholar] [CrossRef]
  32. Batista, N.C.; Melício, R.; Mendes, V.M.F.; Calderón, M.; Ramiro, A. On a self-start Darrieus wind turbine: Blade design and field tests. Renew. Sustain. Energy Rev. 2015, 52, 508–522. [Google Scholar] [CrossRef]
  33. Marwa, F.; Wael, B.A.; Malek, A.; Aref, M. Exploring the influence of flexibility on rotor performance in turbulent flow environments. Eur. J. Mech. -B/Fluids 2025, 109, 199–212. [Google Scholar]
  34. Tian, W.; Zhang, C.; Mao, Z.; Li, B.; Zhang, T.; Song, B. Numerical investigation on the suppression of vortex-induced vibration system by assembling different rotors based on quasi-active control method. Ocean Eng. 2024, 311, 119015. [Google Scholar] [CrossRef]
  35. Shen, Z.; Gong, S.; Zuo, Z.; Chen, Y.; Guo, W. Darrieus vertical-axis wind turbine performance enhancement approach and optimized design: A review. Ocean Eng. 2024, 311, 118965. [Google Scholar] [CrossRef]
  36. Chen, J.; Yang, H.; Yang, M.; Xu, H.; Hu, Z. A comprehensive review of the theoretical approaches for the airfoil design of lift-type vertical axis wind turbine. Renew. Sustain. Energy Rev. 2015, 51, 1709–1720. [Google Scholar] [CrossRef]
  37. Tayebi, A.; Torabi, F. Flow control techniques to improve the aerodynamic performance of Darrieus vertical axis wind turbines: A critical review. J. Wind Eng. Ind. Aerodyn. 2024, 252, 105820. [Google Scholar] [CrossRef]
  38. Ghasemian, M.; Ashrafi, Z.N.; Sedaghat, A. A review on computational fluid dynamic simulation techniques for Darrieus vertical axis wind turbines. Energy Convers. Manag. 2017, 149, 87–100. [Google Scholar] [CrossRef]
  39. Li, Y.; Yang, S.; Feng, F.; Tagawa, K. A review on numerical simulation based on CFD technology of aerodynamic characteristics of straight-bladed vertical axis wind turbines. Energy Rep. 2023, 9, 4360–4379. [Google Scholar] [CrossRef]
  40. Reddy, K.B.; Bhosale, A.C.; Saini, R.P. Performance parameters of lift-based vertical axis hydrokinetic turbines-A review. Ocean Eng. 2022, 266, 113089. [Google Scholar] [CrossRef]
  41. Díaz, A.V.; Moya, I.H. Urban wind energy with resilience approach for sustainable cities in tropical regions: A review. Renew. Sustain. Energy Rev. 2024, 199, 114525. [Google Scholar] [CrossRef]
  42. Peng, H.Y.; Liu, H.J.; Yang, J.H. A review on the wake aerodynamics of H-rotor vertical axis wind turbines. Energy 2021, 232, 121003. [Google Scholar] [CrossRef]
  43. Gupta, A.; Abderrahmane, H.A.; Janajreh, I. Flow analysis and sensitivity study of vertical-axis wind turbine under variable pitching. Appl. Energy 2024, 358, 122648. [Google Scholar] [CrossRef]
  44. Anggara, B.; Tjahjana, D.D.D.P.; Budiana, E.P. Numerical Study of Effect of High Efficiency Vortex Addition on Darrieus H Rotor Wind Turbine Performance. Procedia Struct. Integr. 2023, 47, 675–684. [Google Scholar] [CrossRef]
  45. Franchina, N.; Kouaissah, O.; Persico, G.; Savini, M. Three-dimensional modeling and investigation of the flow around a troposkein vertical axis wind turbine at different operating conditions. Renew. Energy 2022, 199, 368–381. [Google Scholar] [CrossRef]
  46. Chen, W.C.; Hsu, Y.Y.; Hsieh, L.F.; Tai, P.H. A systematic optimization approach for assembly sequence planning using Taguchi method, DOE, and BPNN. Expert Syst. Appl. 2010, 37, 716–726. [Google Scholar] [CrossRef]
  47. Zidane, I.F.; Ali, H.M.; Swadener, G.; Eldrainy, Y.A.; Shehata, A.I. Effect of upstream deflector utilization on H-Darrieus wind turbine performance: An optimization study. Alex. Eng. J. 2023, 63, 175–189. [Google Scholar] [CrossRef]
  48. Singh, E.; Roy, S.; San Yam, K.; Law, M.C. Numerical analysis of H-Darrieus vertical axis wind turbines with varying aspect ratios for exhaust energy extractions. Energy 2023, 277, 127739. [Google Scholar] [CrossRef]
  49. Roshan, M.Y.; Khaleghinia, J.; Nimvari, M.E.; Salarian, H. Performance improvement of Darrieus wind turbine using different cavity layouts. Energy Convers. Manag. 2021, 246, 114693. [Google Scholar] [CrossRef]
  50. Rasekh, S.; Aliabadi, S.K. Toward improving the performance of a variable pitch vertical axis wind turbine (VP-VAWT), Part 2: Multi-objective optimization using NSGA-II with CFD in the loop. Ocean Eng. 2023, 278, 114308. [Google Scholar] [CrossRef]
  51. Rasekh, S.; Aliabadi, S.K.; Hansen, M.O. Toward improving the performance of a variable pitch vertical axis wind turbine (VP-VAWT), Part 1: Sensitivity analysis using Taguchi-CFD approach. Ocean Eng. 2023, 279, 114478. [Google Scholar] [CrossRef]
  52. Ghareghani, M.S.M.; Abdolahifar, A.; Karimian, S.M.H. Numerical investigation on the helix angle to smoothen aerodynamic torque output of the 3-PB Darrieus vertical axis wind turbine. J. Wind Eng. Ind. Aerodyn. 2023, 234, 105323. [Google Scholar] [CrossRef]
  53. Franchina, N.; Persico, G.; Savini, M. Three-dimensional unsteady aerodynamics of a H-shaped vertical axis wind turbine over the full operating range. J. Wind Eng. Ind. Aerodyn. 2020, 206, 104273. [Google Scholar] [CrossRef]
  54. Kouaissah, O.; Franchina, N.; Siddiqui, M.S.; Persico, G. A computational study on the performance and wake development of a tilted H-Shaped VAWT rotor. Renew. Energy 2024, 222, 119932. [Google Scholar] [CrossRef]
  55. Reddy, K.U.; Deb, B.; Roy, B. Wind tunnel test and numerical analysis of wooden-bladed Darrieus wind rotor at low wind speed conditions. Mater. Today Proc. 2024, 103, 289–296. [Google Scholar] [CrossRef]
  56. Kong, Z.; Zhou, D.; Sun, X. Improvement of self-starting and power extraction performance of an H-type vertical-axis hydrokinetic turbine by partial deflection of its blades. Ocean Eng. 2024, 296, 116855. [Google Scholar] [CrossRef]
  57. Bundi, J.M.; Ban, X.; Wekesa, D.W.; Ding, S. Pitch control of small H-type Darrieus vertical axis wind turbines using advanced gain scheduling techniques. Renew. Energy 2020, 161, 756–765. [Google Scholar] [CrossRef]
  58. Tirandaz, M.R.; Rezaeiha, A. Effect of airfoil shape on power performance of vertical axis wind turbines in dynamic stall: Symmetric Airfoils. Renew. Energy 2021, 173, 422–441. [Google Scholar] [CrossRef]
  59. Geng, F.; Suiker, A.S.; Rezaeiha, A.; Montazeri, H.; Blocken, B. A computational framework for the lifetime prediction of vertical-axis wind turbines: CFD simulations and high-cycle fatigue modeling. Int. J. Solids Struct. 2023, 284, 112504. [Google Scholar] [CrossRef]
  60. Tunio, I.A.; Shah, M.A.; Hussain, T.; Harijan, K.; Mirjat, N.H.; Memon, A.H. Investigation of duct augmented system effect on the overall performance of straight blade Darrieus hydrokinetic turbine. Renew. Energy 2020, 153, 143–154. [Google Scholar] [CrossRef]
  61. Wilberforce, T.; Olabi, A.G.; Sayed, E.T.; Alalmi, A.H.; Abdelkareem, M.A. Wind turbine concepts for domestic wind power generation at low wind quality sites. J. Clean. Prod. 2023, 394, 136137. [Google Scholar] [CrossRef]
  62. Mohamed, O.S.; Melani, P.F.; Balduzzi, F.; Ferrara, G.; Bianchini, A. An insight on the physical mechanisms responsible of power augmentation in a pair of counter-rotating Darrieus turbines. Energy Convers. Manag. 2023, 284, 116991. [Google Scholar] [CrossRef]
  63. Kamal, M.M.; Saini, R.P. Performance investigations of hybrid hydrokinetic turbine rotor with different system and operating parameters. Energy 2023, 267, 126541. [Google Scholar] [CrossRef]
  64. Durkacz, J.; Islam, S.; Chan, R.; Fong, E.; Gillies, H.; Karnik, A.; Mullan, T. CFD modelling and prototype testing of a Vertical Axis Wind Turbines in planetary cluster formation. Energy Rep. 2021, 7, 119–126. [Google Scholar] [CrossRef]
  65. Jain, S.; Saha, U.K. On the influence of blade thickness-to-chord ratio on dynamic stall phenomenon in H-type Darrieus wind rotors. Energy Convers. Manag. 2020, 218, 113024. [Google Scholar] [CrossRef]
  66. Ortiz-Rodríguez, J.M.; Martínez-Blanco, M.R.; Vega-Carrillo, H.R. Robust design of artificial neural networks applying the Taguchi methodology and DoE. In Proceedings of the Electronics, Robotics and Automotive Mechanics Conference (CERMA’06), Cuernavaca, Mexico, 26–29 September 2006; Volume 2, pp. 131–136. [Google Scholar]
  67. Li, L.; Lu, B.; Xu, W.; Wang, C.; Wu, J.; Tan, D. Dynamic behaviors of multiphase vortex-induced vibration for hydropower energy conversion. Energy 2024, 308, 132897. [Google Scholar] [CrossRef]
  68. Rehman, S.; Rafique, M.M.; Alam, M.M.; Alhems, L.M. Vertical axis wind turbine types, efficiencies, and structural stability-A review. Wind. Struct. 2019, 29, 15–32. [Google Scholar]
  69. Parente, V.; Ferreira, D.; dos Santos, E.M.; Luczynski, E. Offshore decommissioning issues: Deductibility and transferability. Energy Policy 2006, 34, 1992–2001. [Google Scholar] [CrossRef]
  70. Sommer, B.; Fowler, A.M.; Macreadie, P.I.; Palandro, D.A.; Aziz, A.C.; Booth, D.J. Decommissioning of offshore oil and gas structures–Environmental opportunities and challenges. Sci. Total Environ. 2019, 658, 973–981. [Google Scholar] [CrossRef] [PubMed]
  71. Zawawi, N.W.A.; Liew, M.S.; Na, K.L. Decommissioning of offshore platform: A sustainable framework. In Proceedings of the 2012 IEEE Colloquium on Humanities, Science and Engineering (CHUSER), Sabah, Malaysia, 3–4 December 2012; pp. 26–31. [Google Scholar]
  72. Mia, M.J.; Islam, M.A.; Islam, M. Powering Offshore Structure Using Renewable Energy: A Review Study. Bangladesh Marit. J. (BMJ) 2021, 5, 1840–2520. [Google Scholar] [CrossRef]
  73. Zhao, Z.; Wang, D.; Wang, T.; Shen, W.; Liu, H.; Chen, M. A review: Approaches for aerodynamic performance improvement of lift-type vertical axis wind turbine. Sustain. Energy Technol. Assess. 2022, 49, 101789. [Google Scholar]
  74. Maeda, T.; Kamada, Y.; Murata, J.; Yamamoto, M.; Ogasawara, T.; Shimizu, K.; Kogaki, T. Study on power performance for straight-bladed vertical axis wind turbine by field and wind tunnel test. Renew. Energy 2016, 90, 291–300. [Google Scholar]
  75. Kumar, R.; Sarkar, S. Effect of design parameters on the performance of helical Darrieus hydrokinetic turbines. Renew. Sustain. Energy Rev. 2022, 162, 112431. [Google Scholar] [CrossRef]
  76. De Marco, A.; Coiro, D.P.; Cucco, D.; Nicolosi, F. A numerical study on a vertical-axis wind turbine with inclined arms. Int. J. Aerosp. Eng. 2014, 2014, 180498. [Google Scholar] [CrossRef]
  77. Villeneuve, T.; Winckelmans, G.; Dumas, G. Increasing the efficiency of vertical-axis turbines through improved blade support structures. Renew. Energy 2021, 169, 1386–1401. [Google Scholar] [CrossRef]
  78. Talukdar, P.K.; Kulkarni, V.; Saha, U.K. Field-testing of model helical-bladed hydrokinetic turbines for small-scale power generation. Renew. Energy 2018, 127, 158–167. [Google Scholar] [CrossRef]
  79. Battisti, L.; Persico, G.; Dossena, V.; Paradiso, B.; Castelli, M.R.; Brighenti, A.; Benini, E. Experimental benchmark data for H-shaped and troposkien VAWT architectures. Renew. Energy 2018, 125, 425–444. [Google Scholar] [CrossRef]
  80. Castelli, M.R.; Englaro, A.; Benini, E. The Darrieus wind turbine: Proposal for a new performance prediction model based on CFD. Energy 2011, 36, 4919–4934. [Google Scholar] [CrossRef]
  81. Asadi, M.; Hassanzadeh, R. Effects of internal rotor parameters on the performance of a two bladed Darrieus-two bladed Savonius hybrid wind turbine. Energy Convers. Manag. 2021, 238, 114109. [Google Scholar] [CrossRef]
  82. Sobhani, E.; Ghaffari, M.; Maghrebi, M.J. Numerical investigation of dimple effects on darrieus vertical axis wind turbine. Energy 2017, 133, 231–241. [Google Scholar] [CrossRef]
  83. Song, C.; Wu, G.; Zhu, W.; Zhang, X. Study on aerodynamic characteristics of Darrieus vertical axis wind turbines with different airfoil maximum thicknesses through computational fluid dynamics. Arab. J. Sci. Eng. 2020, 45, 689–698. [Google Scholar] [CrossRef]
  84. Mohamed, O.S.; Ibrahim, A.A.; Etman, A.K.; Abdelfatah, A.A.; Elbaz, A.M. Numerical investigation of Darrieus wind turbine with slotted airfoil blades. Energy Convers. Manag. X 2020, 5, 100026. [Google Scholar] [CrossRef]
  85. Syawitri, T.P.; Yao, Y.; Yao, J.; Chandra, B. Optimisation of straight plate upstream deflector for the performance enhancement of vertical axis wind turbine at low, medium and high regimes of tip speed ratios. Wind. Eng. 2022, 46, 1487–1510. [Google Scholar] [CrossRef]
  86. Jin, X.; Wang, Y.; Ju, W.; He, J.; Xie, S. Investigation into parameter influence of upstream deflector on vertical axis wind turbines output power via three-dimensional CFD simulation. Renew. Energy 2018, 115, 41–53. [Google Scholar] [CrossRef]
  87. Chen, W.H.; Wang, J.S.; Chang, M.H.; Mutuku, J.K.; Hoang, A.T. Efficiency improvement of a vertical-axis wind turbine using a deflector optimized by Taguchi approach with modified additive method. Energy Convers. Manag. 2021, 245, 114609. [Google Scholar] [CrossRef]
  88. Beri, H.; Yao, Y.Y. Effect of camber airfoil on self starting of Vertical Axis Wind Turbine. J. Environ. Sci. Technol. 2011, 4, 302–312. [Google Scholar] [CrossRef]
  89. Howell, R.; Qin, N.; Edwards, J.; Durrani, N. Wind tunnel and numerical study of a small vertical axis wind turbine. Renewable energy 2010, 35, 412–422. [Google Scholar] [CrossRef]
  90. Mobini, K.; Niazi, M. Large eddy simulation of the flow across a rotating circular cylinder. Int. J. Fluid Mech. Res. 2014, 41, 1–15. [Google Scholar] [CrossRef]
  91. Wei, N.J.; Brownstein, I.D.; Cardona, J.L.; Howland, M.F.; Dabiri, J.O. Near-wake structure of full-scale vertical-axis wind turbines. J. Fluid Mech. 2021, 914, A17. [Google Scholar] [CrossRef]
  92. Tescione, G.; Ragni, D.; He, C.; Ferreira, C.S.; Van Bussel, G.J.W. Near wake flow analysis of a vertical axis wind turbine by stereoscopic particle image velocimetry. Renew. Energy 2014, 70, 47–61. [Google Scholar] [CrossRef]
  93. Posa, A. Dependence of the wake recovery downstream of a Vertical Axis Wind Turbine on its dynamic solidity. J. Wind Eng. Ind. Aerodyn. 2020, 202, 104212. [Google Scholar] [CrossRef]
  94. Simpson, R.L. Turbulent boundary-layer separation. Annu. Rev. Fluid Mech. 1989, 21, 205–232. [Google Scholar] [CrossRef]
  95. Simpson, R.L. Aspects of turbulent boundary-layer separation. Prog. Aerosp. Sci. 1996, 32, 457–521. [Google Scholar] [CrossRef]
  96. Pallotta, A.; Pietrogiacomi, D.; Romano, G.P. HYBRI–A combined Savonius-Darrieus wind turbine: Performances and flow fields. Energy 2020, 191, 116433. [Google Scholar] [CrossRef]
Figure 1. (a) Schematic representation and operational principle of the proposed hybrid VAWT. The double-Darrieus hybrid wind turbine, featuring symmetric (outer) and cambered airfoil blades (inner), converts kinetic wind energy into electrical power, which is subsequently stored in an energy storage system (reproduced with permission from Ahmad et al. [1], Ocean Engineering, published by ELSEVIER, Amsterdam, The Netherlands, 2022). (b) Illustration of the vertical-axis turbine deployed on a jacket leg platform, generating a circular flow disturbance (reproduced with permission from Satrio et al. [3], Sustainable Energy Technologies and Assessments, published by ELSEVIER, 2024).
Processes 13 00370 g001
Figure 2. (a) Structural schematic of the double-Darrieus vertical-axis wind turbine (DD-VAWT) (reproduced with permission from Shen et al. [4], Energy, published by ELSEVIER, 2024). (b) Isometric view of the double-Darrieus hybrid VAWT CAD model. All dimensions are provided in meters (reproduced with permission from Ahmad et al. [1], Ocean Engineering, published by ELSEVIER, 2022). (c) Darrieus VAWT integrated with flat-type guiding walls (reproduced with permission from Ansaf et al. [6], Energy Reports, published by ELSEVIER, 2023). (d) Conceptual schematic of a novel variable solidity vertical-axis wind turbine (reproduced with permission from Huang et al. [8], Energy, published by ELSEVIER, 2023). (e) Baseline model of the hybrid VAWT without tubercles (reproduced with permission from Ahmad et al. [7], Ocean Engineering, published by ELSEVIER, 2023). (f) Scaled-down prototype model of the hybrid VAWT (reproduced with permission from Ahmad et al. [7], Ocean Engineering, published by ELSEVIER, 2023). h: the length of the inner Darrieus blade (in nested configuration), and H: the length of the outer Darrieus blade.
Processes 13 00370 g002
Figure 3. (a) Model configuration and parameters for contra-rotating vertical-axis wind turbines (CRVAWT) (reproduced with permission from Zheng et al. [2], Journal of Cleaner Production, published by ELSEVIER, 2024). (b) Operational principle of the drag-disturbed flow (D-DF) device (reproduced with permission from Jiang et al. [19], Energy, published by ELSEVIER, 2024). (c) Sequential stages of the 3D spherical-shaped Darrieus hydrokinetic turbine (SDHKT) model and final products (reproduced with permission from Kumar et al. [21], Energy Conversion and Management, published by ELSEVIER, 2023). (d) Geometric configuration and reference system for a tilted H-shaped rotor in a VAWT (reproduced with permission from Kouaissah et al. [54], Renewable Energy, published by ELSEVIER, 2024).
Processes 13 00370 g003
Figure 4. (a) 3D (top) and front (bottom) views of turbine geometries with varying blade–strut angles: 90°, 80°, 67.50°, and 45° (reproduced with permission from Villeneuve et al. [78], Renewable Energy, published by ELSEVIER, 2021). (b) Computational modeling of a lift-type helical hydrokinetic turbine (LHHT) rotor, including a helical blade (reproduced with permission from Reddy et al. [20], Energy, published by ELSEVIER, 2024). (c) 3D model of a troposkein VAWT (left) and its blade radial profile r z (right) (reproduced with permission from Franchina et al. [45], Renewable Energy, published by ELSEVIER, 2022). (d) V-shaped blades in Darrieus vertical-axis turbines (reproduced with permission from Abdolahifar et al. [12], Ocean Engineering, published by ELSEVIER, 2023).
Processes 13 00370 g004
Figure 5. (a) Geometric layout of a twin-turbine Darrieus configuration: stereogram and vertical view (reproduced with permission from Tian et al. [10], Energy, published by ELSEVIER, 2023). (b) Model view of a modified conventional H-Darrieus wind rotor incorporating auxiliary blades (reproduced with permission from Reddy et al. [22], Ocean Engineering, published by ELSEVIER, 2023). (c) Schematic representation of a Counter-rotating Twin Rotor VAWT, detailing the relative spacing (S) (reproduced with permission from Yadav et al. [5], Renewable Energy, published by ELSEVIER, 2024). (d) Schematic of hybrid VAWTs: 2-bladed Savonius and 3-bladed Darrieus (left) and 2-bladed Savonius with 2-bladed Darrieus (right) (reproduced with permission from Eltayesh et al. [23], Energy for Sustainable Development, published by ELSEVIER, 2023).
Processes 13 00370 g005
Figure 6. (a) Geometric parameters of the suction cavity airfoil and a diagram illustrating the velocity triangle for a Darrieus turbine blade at an arbitrary position (reproduced with permission from Ibrahim et al. [11], Journal of Wind Engineering and Industrial Aerodynamics, published by ELSEVIER, 2022). (b) Impact of dual cavity design on the power coefficient across various TSRs (reproduced with permission from Roshan et al. [49], Energy Conversion and Management, published by ELSEVIER, 2021). (c) Schematic of the turbine and airfoils, showing six different opening ratios (10%, 20%, 30%, 40%, 60%, 90%) (reproduced with permission from Celik et al. [9], Energy, published by ELSEVIER, 2022). (d) Vector diagram of velocities and forces around a rotating airfoil of an H-type Darrieus rotor, including the blade profiles considered in the analysis (reproduced with permission from Jain et al. [65], Energy Conversion and Management, published by ELSEVIER, 2020). (e) Schematic of an airfoil with a deflected morphing leading edge (reproduced with permission from Kong et al. [56], Ocean Engineering, published by ELSEVIER, 2024).
Processes 13 00370 g006
Figure 7. (a) Hypothetical schematic of airflow over an airfoil, detailing the slot and its geometric parameters (reproduced with permission from Mohamed et al. [85], Energy Conversion and Management: X, published by ELSEVIER, 2020). (b) Comparison between the unaltered NACA 0021 profile and the morphed NACA 0021 profile (reproduced with permission from Baghdadi et al. [15], Renewable Energy, published by ELSEVIER, 2020). (c) Schematic view of a blade based on the NACA 0018 airfoil with a leading-edge protuberance (reproduced with permission from Yan et al. [14], Journal of Wind Engineering and Industrial Aerodynamics, published by ELSEVIER, 2021). (d) Schematic of different micro-cylinder locations around airfoils (reproduced with permission from Bakhumbsh et al. [16], Ocean Engineering, published by ELSEVIER, 2022).
Processes 13 00370 g007
Figure 8. (a) Definition of dynamic mesh zones for the investigation of flexible blades in vertical-axis wind turbines (reproduced with permission from Hijazi et al. [13], Energy Conversion and Management, published by ELSEVIER, 2024). (b) Optimized geometry and material retention achieved through structural optimization of an H-rotor wind turbine blade using a one-way Fluid-Structure Interaction approach (reproduced with permission from Marzec et al. [17], Renewable Energy, published by ELSEVIER, 2023). (c) Schematic of a hybrid wind turbine featuring a double deflector (reproduced with permission from Chegini et al. [18], Ocean Engineering, published by ELSEVIER, 2023).
Processes 13 00370 g008
Figure 9. (a) Vortex contours in the top plane of the inner ring turbine for varying inner ring turbine heights, along with Q-criterion iso-surfaces distinguished by air velocity Q = 250 (reproduced with permission from Shen et al. [4], Energy, published by ELSEVIER, 2024). (b) Axial vorticity ω z contours at λ = 3.3 for an open Darrieus VAWT (top view) and an optimal Darrieus VAWT with guiding walls (bottom view) (reproduced with permission from Ansaf et al. [6], Energy Reports, published by ELSEVIER, 2023). (c) Variations in relative velocity along horizontal iso-planes; the left subfigure depicts velocity changes along the xz-plane generated at y = 1.5   m . The middle subfigure shows velocity contours for a single rotor turbine with the same swept area as the hybrid VAWT. The right subfigure illustrates the inner cambered airfoil blades attached at a specific pitch angle, causing partial reattachment of the separated shear layer, thereby enhancing the overall lift force (reproduced with permission from Ahmad et al. [1], Ocean Engineering, published by ELSEVIER, 2022). (d) Velocity contours of the baseline hybrid and hybrid with tubercles, revealing wind flow distribution and interaction with turbine blades (reproduced with permission from Ahmad et al. [7], Ocean Engineering, published by ELSEVIER, 2023).
Processes 13 00370 g009
Figure 10. (a) Simulation results and rotor spacing analysis: wake structure comparison using the Q-criterion Q = 100 and velocity profiles at varying rotor spacings (reproduced with permission from Zheng et al. [2], Journal of Cleaner Production, published by ELSEVIER, 2024). (b) Vorticity contour plot at λ = 2 (reproduced with permission from Jiang et al. [19], Energy, published by ELSEVIER, 2024). (c) Velocity contours of a spherical-shaped Darrieus hydrokinetic turbine (4SDHKT2) corresponding to C p , m a x at different velocities (reproduced with permission from Kumar et al. [21], Energy Conversion and Management, published by ELSEVIER, 2023). (d) Non-dimensional streamwise and spanwise velocity (left, middle) and lateral vorticity (right) at Y / R = 0 plane; at a λ = 3.54 and tilting angles of 0–30 degrees (top-bottom) (reproduced with permission from Kouaissah et al. [54], Renewable Energy, published by ELSEVIER, 2024).
Processes 13 00370 g010
Figure 11. (a) Volume rendering of vorticity vector magnitude around a turbine with a mid-span strut. For accurate visualization, the turbine blade is located at the angular position θ = 125 ° (reproduced with permission from Villeneuve et al. [78], Renewable Energy, published by ELSEVIER, 2021). (b) Vortex contours for aspect ratio models at the rotor’s mid-height plane (reproduced with permission from Reddy et al. [20], Energy, published by ELSEVIER, 2024). (c) Iso-surfaces of vorticity magnitude 102.2   1 / s and relative velocity streamlines for case I blades, with the middle of the left blade positioned at an azimuth of 79.5° (reproduced with permission from Abdolahifar et al. [12], Ocean Engineering, published by ELSEVIER, 2023). (d) Helicity contours for 10Ms grid of slanted and planar blade designs (left/right) at a λ = 3.1 (reproduced with permission from Franchina et al. [45], Renewable Energy, published by ELSEVIER, 2022).
Processes 13 00370 g011
Figure 12. (a) Comparison of vorticity contours in the wake of an isolated turbine versus a twin-turbine array L = 0.8 D (reproduced with permission from Tian et al. [10], Energy, published by ELSEVIER, 2023). (b) Streamlines over the H-rotor blades for a conventional H-rotor and a modified H-rotor (reproduced with permission from Reddy et al. [22], Ocean Engineering, published by ELSEVIER, 2023). (c) Normalized downstream velocity for single-rotor and twin-rotor configurations ( S = 0.80 D , S = 0.9875 D , and S = 1.65 D ) (reproduced with permission from Yadav et al. [5], Renewable Energy, published by ELSEVIER, 2024). (d) Velocity contours and streamlines of a hybrid wind turbine with outboard dimples, at a diameter ratio of 0.2, attachment angle of 45°, and λ = 2   R e = 4.3 × 10 5 (reproduced with permission from Eltayesh et al. [23], Energy for Sustainable Development, published by ELSEVIER, 2023).
Processes 13 00370 g012
Figure 13. (a) Dimensionless vorticity contours at = 1.67 , 2, and 3.08 for baseline airfoil (BL) and suction cavity (SC) turbines, with blades at θ = 30 ° , 150°, and 270° (reproduced with permission from Ibrahim et al. [11], Journal of Wind Engineering and Industrial Aerodynamics, published by ELSEVIER, 2022). (b) Instantaneous vorticity magnitude contours around blades at various rotation angles (reproduced with permission from Roshan et al. [49], Energy Conversion and Management, published by ELSEVIER, 2021). (c) Pressure coefficient contours at λ = 1 and 2.5   for the original airfoil and its J-shaped profiles with 40% and 90% opening ratios (reproduced with permission from Celik et al. [9], Energy, published by ELSEVIER, 2022).
Processes 13 00370 g013
Figure 14. (a) Normalized z vorticity contours within the range of θ = 100 ° 150 ° (reproduced with permission from Jain et al. [65], Energy Conversion and Management, published by ELSEVIER, 2020). (b) Instantaneous pressure contours (Pa) and power coefficients for a single blade original versus optimized rotor at various azimuthal angles (reproduced with permission from Baghdadi et al. [15], Renewable Energy, published by ELSEVIER, 2020).
Processes 13 00370 g014
Figure 15. (a) Iso-surface Q = 100 , colored by normalized vorticity magnitude at α = 18 ° for blade S1 (reproduced with permission from Yan et al. [14], Journal of Wind Engineering and Industrial Aerodynamics, published by ELSEVIER, 2021). (b) Pressure distribution comparison between a conventional turbine and an improved turbine featuring micro-cylinders (MC8) (reproduced with permission from Bakhumbsh et al. [16], Ocean Engineering, published by ELSEVIER, 2022).
Processes 13 00370 g015
Figure 16. (a) Iso-surfaces of vorticity = 35 1 / s , colored by velocity magnitude for the baseline model (left) and the flexible blade model (right) at a λ = 2.58 (reproduced with permission from Hijazi et al. [13], Energy Conversion and Management, published by ELSEVIER, 2024). (b) Contours of the exported pressure profile on the blade (reproduced with permission from Marzec et al. [17], Renewable Energy, published by ELSEVIER, 2023). (c) Vorticity field surrounding the hybrid turbine without a deflector and the hybrid turbine with a front deflector at θ = 180 ° and 240° (reproduced with permission from Chegini et al. [18], Ocean Engineering, published by ELSEVIER, 2023).
Processes 13 00370 g016
Figure 17. (a) Total torque coefficient curves for varying chord lengths of wind turbine blade airfoils with different inner rings (reproduced with permission from Shen et al. [4], Energy, published by ELSEVIER, 2024). (b) Torque coefficient versus azimuth angle for guiding walls and an open Darrieus VAWT (without guiding walls) (reproduced with permission from Ansaf et al. [6], Energy Reports, published by ELSEVIER, 2023). (c) Variations in the power coefficient with TSR for D-VAWT with different solidities (left) and the maximum power coefficient variations with solidity (reproduced with permission from Huang et al. [8], Energy, published by ELSEVIER, 2023).
Processes 13 00370 g017
Figure 18. (a) Power coefficient diagram for upper and lower rotors at different rotor spacing’s (reproduced with permission from Zheng et al. [2], Journal of Cleaner Production, published by ELSEVIER, 2024). (b) Power coefficient for different conditions at a TSR ranging from 1 to 2 (reproduced with permission from Jiang et al. [19], Energy, published by ELSEVIER, 2024). (c) Effects of velocity variations on the performance of 3SDHKT2 and 4SDHKT2 (reproduced with permission from Kumar et al. [21], Energy Conversion and Management, published by ELSEVIER, 2023). (d) Power coefficient at λ = 3.54 for inclined operation at 10, 20, and 30 degrees (reproduced with permission from Kouaissah et al. [54], Renewable Energy, published by ELSEVIER, 2024).
Processes 13 00370 g018
Figure 19. (a) Distribution of the power coefficient along the span of the blade at an angular position of 100° for hybrid VAWT with different attachment angles (reproduced with permission from Villeneuve et al. [78], Renewable Energy, published by ELSEVIER, 2021). (b) Phase-averaged power coefficient over one complete cycle (reproduced with permission from Franchina et al. [45], Renewable Energy, published by ELSEVIER, 2022). (c) Evolution of power coefficient versus time during one cycle for different prototypes of wind turbines (reproduced with permission from Reddy et al. [20], Energy, published by ELSEVIER, 2024). (d) Power coefficient curves as a function of TSR for 10Ms grid of a slanted and planar blade (reproduced with permission from Abdolahifar et al. [12], Ocean Engineering, published by ELSEVIER, 2023).
Processes 13 00370 g019
Figure 20. (a) Corrected power coefficient ( C p c o r r ) at various TSRs for different turbine quantities (left). Percentage improvement in C p across different TSRs relative to turbine count (right) (reproduced with permission from Tian et al. [10], Energy, published by ELSEVIER, 2023). (b) Comparative analysis of overall phase-averaged power coefficient as a function of azimuthal position at λ = 2.33 , considering both overlapping and non-overlapping configurations (reproduced with permission from Yadav et al. [5], Renewable Energy, published by ELSEVIER, 2024). (c) Performance evaluation of the tested H-rotor, represented by C p versus TSR (reproduced with permission from Reddy et al. [22], Ocean Engineering, published by ELSEVIER, 2023). (d) Analysis of the moment coefficient for standalone Darrieus and hybrid wind turbine rotors with a diameter ratio of 0.2, attachment angle of 45°, and λ = 2 (reproduced with permission from Eltayesh et al. [23], Energy for Sustainable Development, published by ELSEVIER, 2023).
Processes 13 00370 g020
Figure 21. (a) Predicted power coefficient for a suction cavity (SC) turbine with a C µ value of 0.0035 (reproduced with permission from Ibrahim et al. [11], Journal of Wind Engineering and Industrial Aerodynamics, published by ELSEVIER, 2022). (b) Influence of cavity diameter d c on the C p across varying TSR values (reproduced with permission from Roshan et al. [49], Energy Conversion and Management, published by ELSEVIER, 2021). (c) Instantaneous torque coefficient variation as a function of azimuthal angle for different pitch angles, utilizing a J-shaped airfoil with a 90% opening ratio at a λ = 1.6 (reproduced with permission from Celik et al. [9], Energy, published by ELSEVIER, 2022). (d) Variation in the moment coefficient C m with azimuthal angle θ for thickness-to-chord ratios t / c of 18% and 21% (reproduced with permission from Jain et al. [65], Energy Conversion and Management, published by ELSEVIER, 2020).
Processes 13 00370 g021
Figure 22. (a) Power coefficient as a function of TSR for VAWTs with and without leading-edge protuberances (reproduced with permission from Yan et al. [14], Journal of Wind Engineering and Industrial Aerodynamics, published by ELSEVIER, 2021). (b) Power coefficient as a function of TSR for varying angular positions of micro-cylinders around the airfoil (reproduced with permission from Bakhumbsh et al. [16], Ocean Engineering, published by ELSEVIER, 2022).
Processes 13 00370 g022
Figure 23. (a) Instantaneous moment coefficient of a single blade in 3D for two models at a λ = 1.38 (reproduced with permission from Hijazi et al. [13], Energy Conversion and Management, published by ELSEVIER, 2024). (b) Power coefficient variation as a function of TSR for a bare Darrieus turbine, a bare hybrid turbine, and a hybrid turbine equipped with front, side, and double deflectors (reproduced with permission from Chegini et al. [18], Ocean Engineering, published by ELSEVIER, 2023). (c) Instantaneous force profiles acting on the turbine blade as a function of rotor angle during the final revolution (reproduced with permission from Marzec et al. [17], Renewable Energy, published by ELSEVIER, 2023).
Processes 13 00370 g023
Disclaimer/Publisher’s Note: The statements, opinions and data contained in all publications are solely those of the individual author(s) and contributor(s) and not of MDPI and/or the editor(s). MDPI and/or the editor(s) disclaim responsibility for any injury to people or property resulting from any ideas, methods, instructions or products referred to in the content.

