Article

Optimizing Reactive Compensation for Enhanced Voltage Stability in Renewable-Integrated Stochastic Distribution Networks

1
Economic & Technology Research Institute, State Grid Shandong Electric Power Company, Jinan 250021, China
2
Shandong Zhiyuan Electric Power Design Consulting Co., Ltd., Jinan 250021, China
3
School of Electrical and Electronic Engineering, Shandong University of Technology, Zibo 255000, China
*
Author to whom correspondence should be addressed.
Processes 2025, 13(2), 303; https://doi.org/10.3390/pr13020303
Submission received: 16 December 2024 / Revised: 7 January 2025 / Accepted: 21 January 2025 / Published: 22 January 2025

Abstract

:
The rapid expansion of renewable energy sources and the increasing electrical load demand are complicating the operational dynamics of power grids, leading to significant voltage fluctuations and elevated line losses. To address these challenges, we propose an information gap decision-theory-based robust optimization method for the siting and operation of reactive compensation equipment, utilizing static var generators (SVGs) to mitigate voltage fluctuations and reduce losses. Our approach begins by projecting the scale of renewable energy integration and load growth, establishing scenarios with varying renewable-to-load growth ratios. We then develop a multi-objective optimization model that incorporates voltage–loss sensitivity, accounting for the uncertainties in renewable energy production. A case study demonstrates that our method reduces grid voltage fluctuations and losses by 29.53% and 7.75%, respectively, compared to non-intervention scenarios, highlighting its effectiveness in stabilizing distribution networks.

1. Introduction

Amid the challenges of the fossil energy crisis and climate change, the integration of distributed renewable energy in distribution networks is increasing. However, the inherent randomness and volatility of these sources can cause voltage over-limit conditions and increased network losses. Additionally, the growing presence of electric vehicles and other loads further impacts grid stability. Relying solely on electricity pricing to enhance power quality can significantly reduce customer satisfaction [1]. To address these issues, static var generators (SVGs) offer an effective solution for mitigating voltage fluctuations and reducing losses. By strategically siting and optimizing SVG operations, we can ensure more stable and reliable grid performance. However, the inherent randomness and volatility of this output can lead to issues such as voltage over-limit conditions and elevated network losses [2,3]. Additionally, the rising presence of electric vehicles and other loads further impacts the stable operation of the power grid [4]. Only electricity price guidance to improve power quality will greatly reduce customer satisfaction [5]. To address these challenges, static var generators (SVGs) serve as an effective solution for mitigating voltage fluctuations and reducing losses within the system. By strategically configuring the siting of SVGs and optimizing their operation, we can ensure a more stable and reliable operation of the power grid [6].
Regarding the siting of reactive compensation equipment, reference [7] proposed a method for the siting and selection of synchronous compensators based on voltage sensitivity. The voltage sensitivity of different buses in the system is calculated by injecting reactivity into each bus, and the appropriate bus candidate position of the compensator is obtained. In reference [8], a configuration model of voltage detection active power filters and SVG based on distribution network partition considering reactive capacity and active abandonment is proposed, in which the siting buses are obtained according to the single and integrated voltage sensitivity in all partition networks. In [9], aiming at minimizing the investment cost of reactive compensation equipment and the voltage deviation of the whole network, a collaborative optimal configuration model of grid-connected and grid-connected reactive equipment is established. However, the existing research mainly focuses on voltage control, ignoring the influence of power grid loss. There are few studies on the siting of reactive compensation equipment for multi-objective voltage and loss.
Currently, comprehensive evaluation methods for multi-objective optimization include the Fuzzy Analytic Hierarchy Process [10], the Pros and Cons Solution Distance Method [11], Data Envelopment Analysis [12], the Entropy Weight Method [13], and Grey Correlation Analysis [14], among others. The Entropy Weight Method falls under the category of objective weighting methods. It provides an objective and precise means to evaluate the weights of each index involved in multi-objective optimization problems. This method operates by determining the weight of each index through the calculation of its information entropy, thereby addressing complex multi-factor decision-making scenarios. The entropy value associated with each index reflects the volume and significance of the information it conveys; specifically, a higher entropy value corresponds to a lower weight, indicating that the index exerts less influence on the decision-making process. The Entropy Weight Method is particularly advantageous as it minimizes the impact of subjective biases.
The complex and dynamic operating conditions of the power grid pose challenges for deterministic planning methods, particularly in accurately assessing the impacts of operational uncertainty on the planning of reactive compensation equipment within distribution networks. This limitation diminishes the engineering applicability of the resultant planning [15]. Thus, it is crucial to investigate reactive planning that accounts for the uncertainties associated with renewable energy. Reference [16] addresses the inherent randomness and intermittence in the output of distributed generation systems, as well as their reactive regulation capabilities. To effectively tackle the correlations among random variables, the study employs the Latin hypercube sampling method, coupled with the Monte Carlo probabilistic power flow approach to evaluate the power flow in distribution networks featuring intermittent DG systems. In [17], a three-stage robust optimization strategy for voltage/reactive power control in wind farms is presented. This strategy introduces a robust optimization model designed to address the voltage and reactive power control challenges arising from the uncertainties linked to wind power generation. Furthermore, References [18,19] also explore the implications of renewable energy uncertainty on reactive power planning by employing robust optimization models.
In the literature addressing uncertainty in renewable energy, two primary approaches are prominent: stochastic optimization and robust optimization. Stochastic optimization generates multiple scenarios to assess risks associated with uncertain factors, evaluating various potential states and corresponding optimal decisions. However, this approach heavily relies on probability distributions and necessitates extensive amounts of uncertain data. Conversely, robust optimization focuses on formulating solutions capable of withstanding the most unfavorable scenarios, often operating independently of large datasets. Despite its advantages, robust optimization is frequently criticized for being overly conservative. In comparison, Information Gap Decision Theory (IGDT) presents a unique methodology that is less dependent on extensive uncertain data. The IGDT emphasizes the resilience of the decision-making process while integrating decision-makers’ preferences to enhance economic outcomes [20,21]. However, there remains a notable deficiency in research concerning the application of IGDT as a method for uncertainty management in reactive power siting planning within distribution networks that incorporate multiple renewable energy stations.
This study addresses this gap by considering various future scenarios involving changes in renewable energy and load scales. We establish a multi-objective optimization model for voltage–loss sensitivity SVG siting and operation based on robust IGDT. The effectiveness of our proposed strategy is validated using the IEEE-33 bus distribution network. The main contributions of this study are as follows:
(1)
Considering the possible new renewable energy scale in the distribution network in the future and the load growth rate, the optimization scenario of reactive compensation equipment under different ratios of the two is established, and the corresponding SVG siting and operation strategies are obtained.
(2)
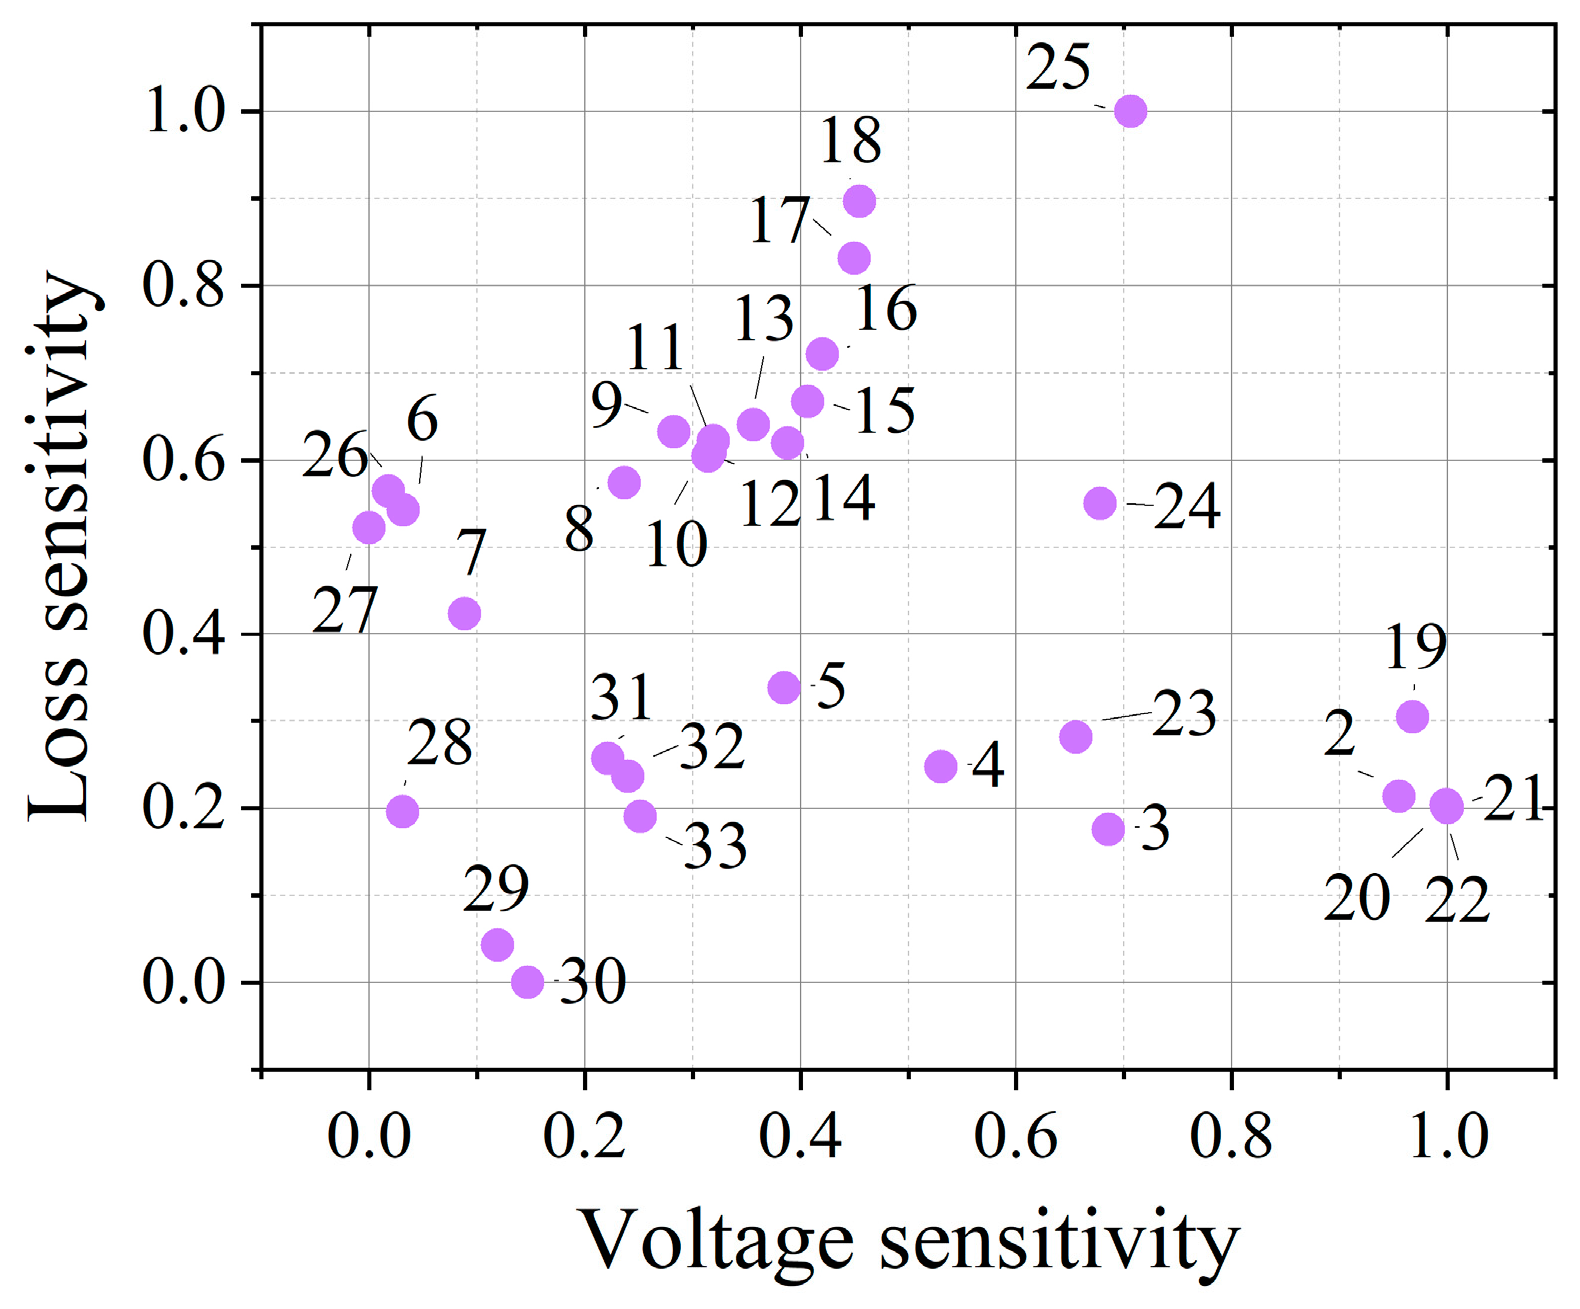
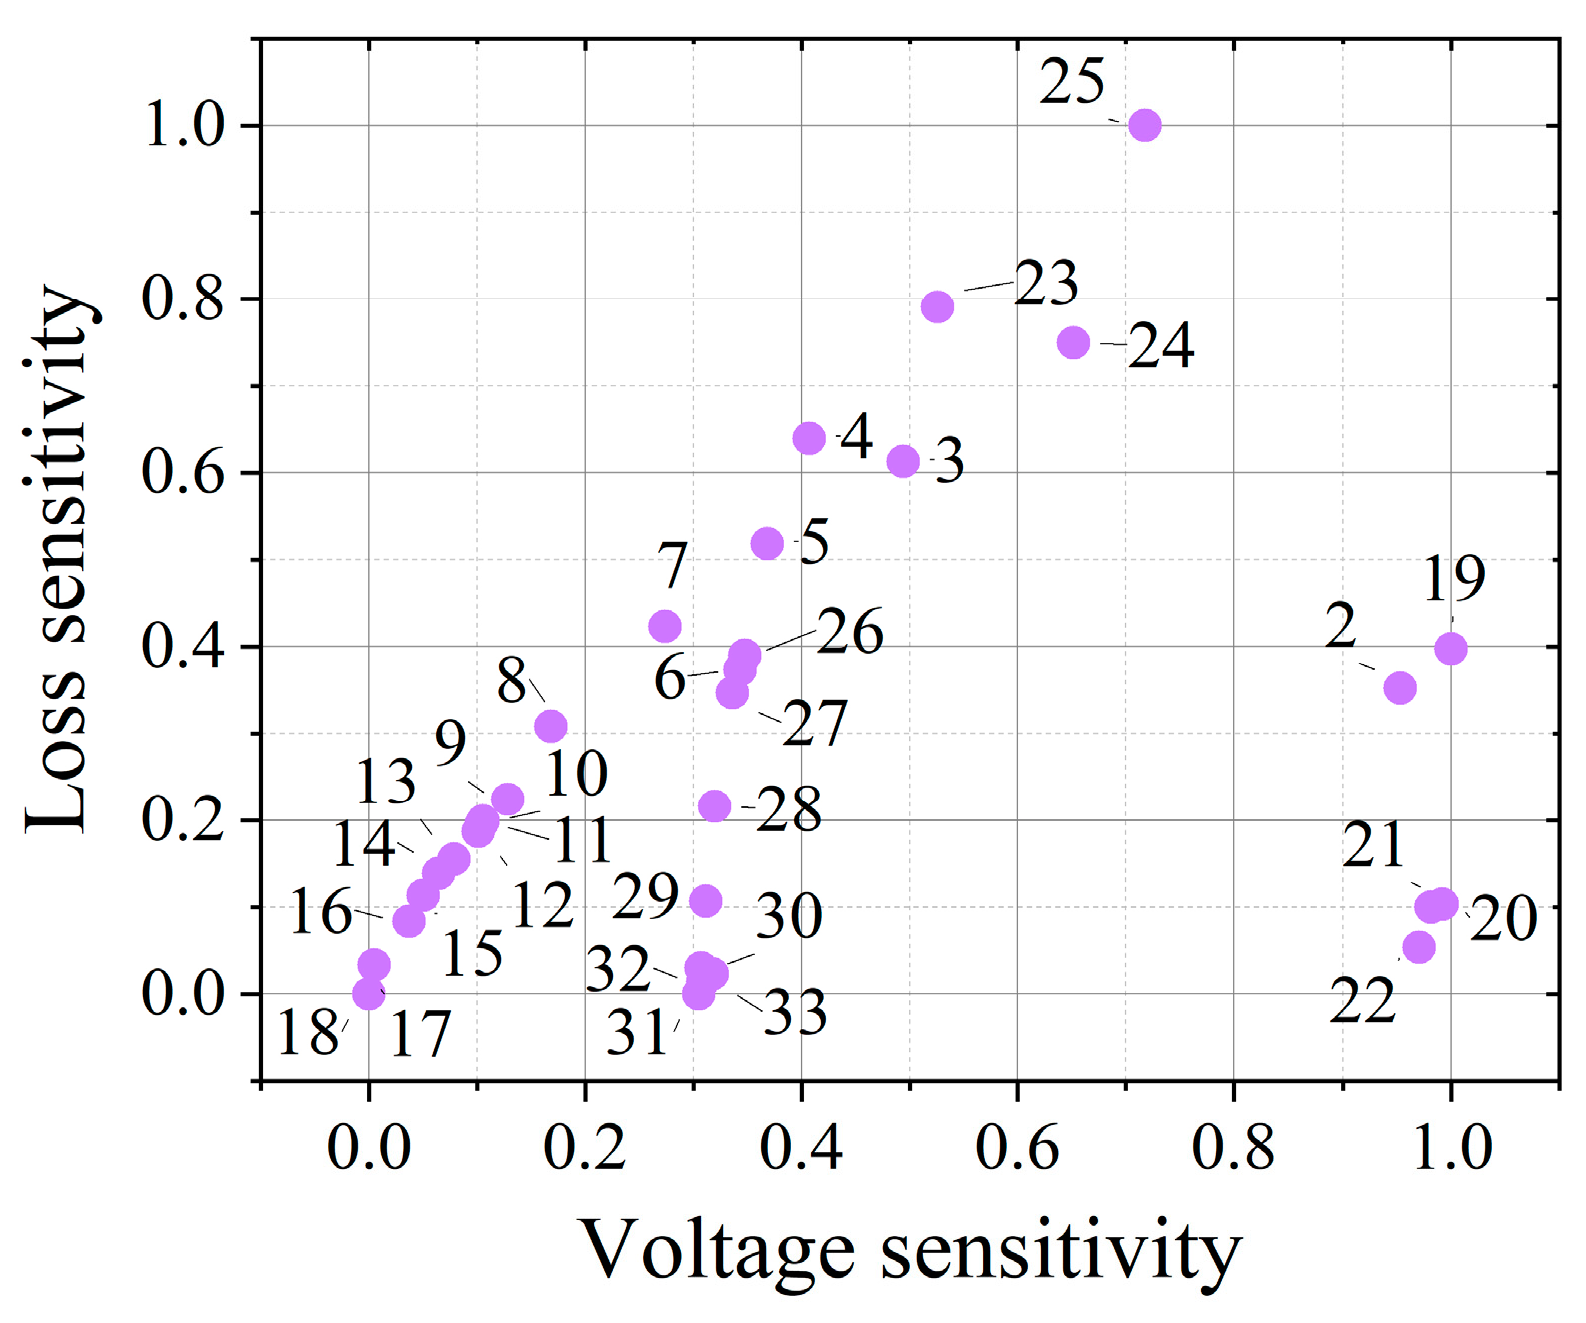
A multi-objective siting strategy for SVG has been developed, focusing on voltage–loss sensitivity. The entropy weight method is employed to mitigate the influence of subjective factors in multi-objective planning. This approach aims to minimize both voltage fluctuations and line loss, effectively addressing the limitations associated with single-objective siting methodologies.
(3)
To address the challenge of output uncertainty in multiple renewable energy sources, we propose the robust IGDT. This approach effectively quantifies the uncertainties associated with renewable energy generation and aligns more closely with the actual assessment of system configuration.
The rest of this article is organized as follows: Section 2 describes the calculation method of voltage sensitivity and loss sensitivity and establishes a multi-objective SVG siting model. In Section 3, the robust IGDT is used to quantify the uncertainty of renewable energy, and the SVG output planning model is established. In Section 4, the numerical study evaluates the performance of the siting and capacity method. Section 5 is the conclusion.

2. SVG Siting Strategy Considering Multi-Objective Voltage and Loss Sensitivity

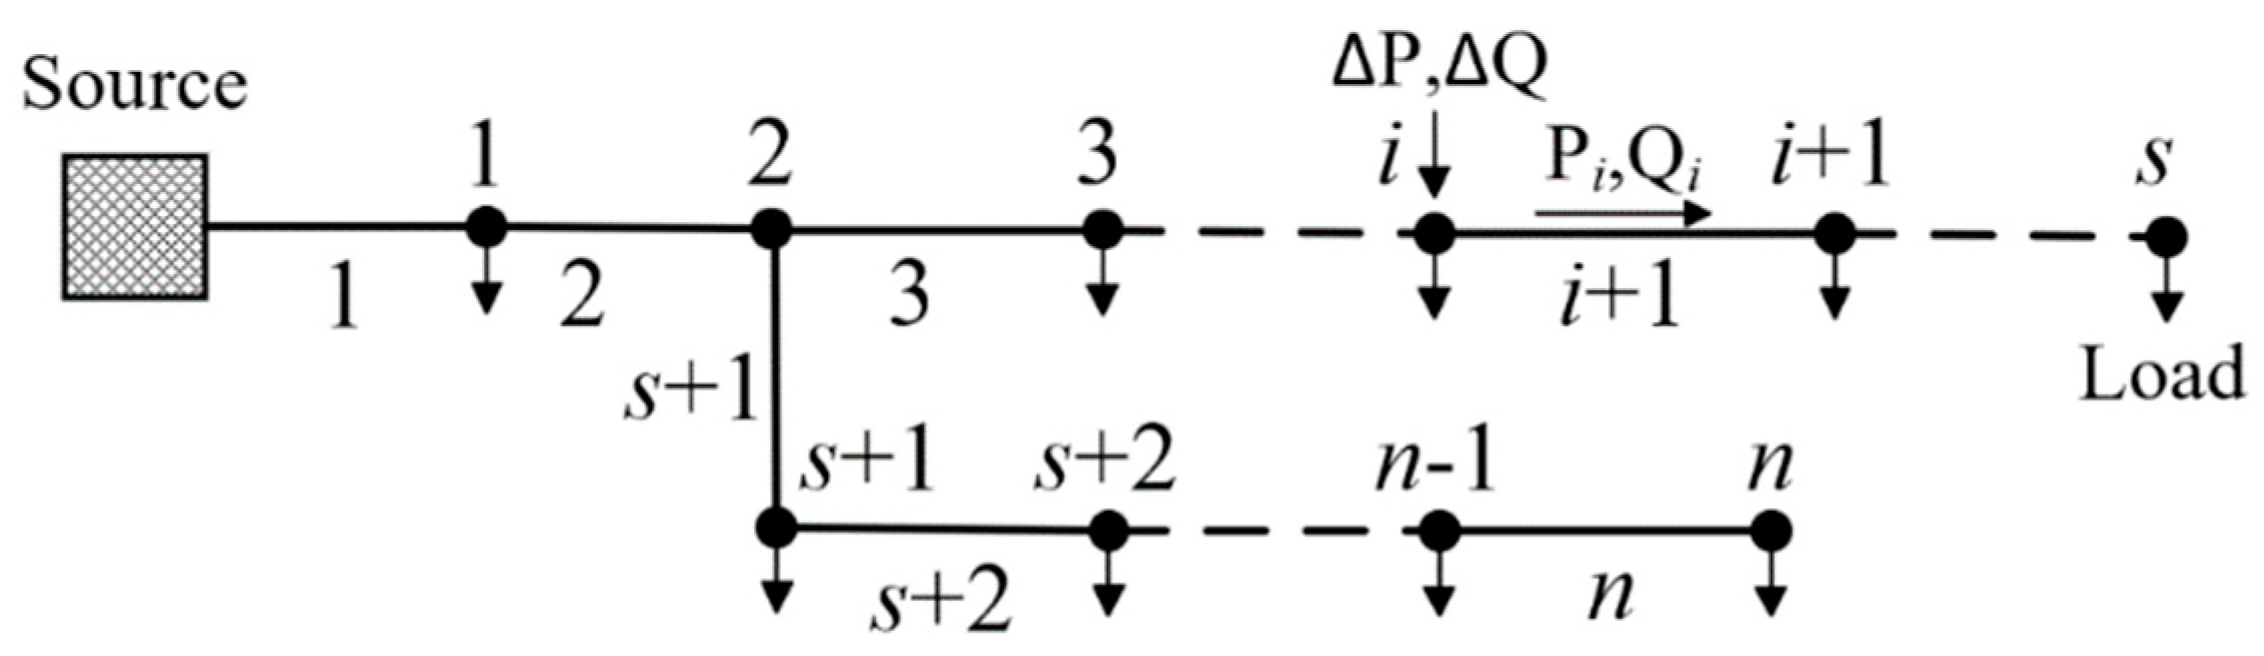
2.1. Voltage–Loss Sensitivity Calculation

The voltage and loss sensitivity of power system can accurately reflect the sensitivity of grid voltage and line loss to the change of bus injection power. Aiming at the SVG siting problem of distribution network, this section applies the voltage–loss sensitivity method to analyze and determine the appropriate access siting. The modeling process is as follows:
The power loss of the distribution network can be expressed as
P loss = s Ω line R s P s 2 + Q s 2 / U s 2
where R s denotes the resistance of the line s , Ω line represents the set of all lines, and P s , Q s , U s are the active power, reactive power, and voltage amplitude of the line s , respectively.
Compared with the branch power, the smaller line loss can be ignored, and the bus voltage is assumed to be the rated voltage. Taking Figure 1 PDN as an example, when the amounts of Δ P and Δ Q at bus i change, the line loss change Δ P loss i can be expressed as
Δ P loss i = s = 1 i R s P s + Δ P 2 + Q s + Δ Q 2 U s 2 + s = i + 1 n R s P s 2 + Q s 2 U s 2 s = 1 n R s P s 2 + Q s 2 U s 2 = s = 1 i R s 2 Δ P P s + Δ P 2 + 2 Δ Q Q s + Δ Q 2 / U s 2 = Δ P 2 s Ω lpath i R s U s 2 + 2 Δ P s Ω lpath i P s R s U s 2 + Δ Q 2 s Ω lpath i R s U s 2 + 2 Δ Q s Ω lpath i Q s R s U s 2
where Ω lpath i is the line set from bus i to the source bus of the distribution network.
When the active and reactive injected at bus i of the distribution network change, the voltage change Δ U m i of bus m can be calculated:
Δ U m i = L m , P i Δ P + L m , Q i Δ Q
Equation (3) describes the linear sensitivity model of load power to bus voltage, where L m , P i and L m , Q i can be expressed as
L m , P i = s Ω bpath m R s / U 0 , m Ω npath i s Ω bpath i R s / U 0 , i Ω npath m L B m , P i , m Ω npath i i Ω npath m L m , Q i = s Ω bpath m X s / U 0 , m Ω npath i s Ω bpath i X s / U 0 , i Ω npath m L B m , Q i , m Ω npath i i Ω npath m
where Ω npath i is the bus set from bus i to the source bus of the distribution network.
The differing dimensions of voltage sensitivity and loss sensitivity complicate model resolution. To address this, the calculation results for both voltage sensitivity and loss sensitivity have been normalized, as depicted in Equations (5) and (6).
Δ U ^ i = m = 1 N bus t = 1 T Δ U m , t i Δ U min Δ U max Δ U min ,       i Ω sit Δ U max = max ( m = 1 N bus t = 1 T Δ U m , t 1 , m = 1 N bus t = 1 T Δ U m , t 2 , , m = 1 N bus t = 1 T Δ U m , t N sit ) Δ U min = min ( m = 1 N bus t = 1 T Δ U m , t 1 , m = 1 N bus t = 1 T Δ U m , t 2 , , k = 1 N bus t = 1 T Δ U m , t N sit )
Δ P ^ loss i = Δ P loss i Δ P min Δ P max Δ P min , i Ω sit Δ P max = max ( Δ P loss 1 , Δ P loss 2 , , Δ P loss N sit ) Δ P min = min ( Δ P loss 1 , Δ P l o s s 2 , , Δ P loss N sit )
where Δ U m , t i is the voltage change at the bus m caused by the power change of the load at the bus i at time t and N bus is the number of distribution network buses. Ω sit is the set of siting buses N sit is the number of buses that can be selected.
The multi-objective problem cannot be solved directly. There are many algorithms for solving multi-objective optimization problems [22], but the efficiency and accuracy of the solution are different. The entropy weight method judges the degree of dispersion by calculating the entropy value of each index, and then determines its weight in the comprehensive evaluation so as to objectively and accurately evaluate the weight of each index of the multi-objective optimization problem, so as to convert it into a single-objective problem, which is more accurate and efficient.
Voltage sensitivity weight:
J u = 1 ln K i = 1 N s i t Δ U ^ i i = 1 N s i t Δ U ^ i ln Δ U ^ i i = 1 N s i t Δ U ^ i α u = 1 J u K d = 1 D J d
Loss sensitivity weight:
J loss = 1 ln K i = 1 N s i t Δ P ^ loss i i = 1 N s i t Δ P ^ loss i ln Δ P ^ loss i i = 1 N s i t Δ P ^ loss i α loss = 1 J loss K d = 1 D J d
where J u is the information entropy of voltage sensitivity index K is the number of evaluation objects J d is the information entropy of the dth evaluation index D is the number of evaluation indicators.
It is calculated that the bus voltage sensitivity weight is α u , and the line loss sensitivity weight is α loss The objective function of SVG siting is as follows
min ( α u Δ U ^ i + α loss Δ P ^ loss i )

2.2. Constraint Conditions

The equality constraints of the SVG siting planning established in this paper are the active power balance equation and reactive power balance equation of each bus:
i , j Ω bus P i j , t = k , i Ω bus P k i , t r k i l k i , t P i , t + x Ω up ( i ) P x , t + w t Ω win i P w t , t + p v Ω pv ( i ) P p v , t
i , j Ω bus Q i j , t = k , i Ω bus Q k i , t Q i , t + x Ω up i Q x , t + s v g Ω svg i Q s v g , t + w t Ω win i Q w t , t + p v Ω pv ( i ) Q p v , t
where Ω bus denotes the set of all buses in the distribution network; P k i , t , Q k i , t represent the active power and reactive power flowing from bus k to bus i at time t, respectively; r k i signifies the resistance of the line ki; l k i , t stands for the square of the ki current flowing through the line at time t; P i , t , Q i , t are the active load and reactive load at bus i at time t, respectively; Ω up ( i ) ,   Ω win ( i ) ,   Ω pv ( i ) , Ω svg ( i ) , respectively, represent the collection of superior PDN buses, WTs, PVs, and SVGs connected to bus i; P x , t , P w t , t , P p v , t indicate the active injected by the superior bus x, WT and PV to bus i at time t, respectively; and Q x , t , Q w t , t , Q p v , t denote the reactive power injected by the superior bus x, WT and PV to bus i at time t, respectively.
The inequality constraints include line transmission power constraints, distribution network bus voltage constraints, SVG reactive power constraints, and new energy reactive power constraints. The expressions are
P x , t min P x , t P x , t max
Q x , t min Q x , t Q x , t max
U j min U j , t U j max
Q s v g , t min Q s v g , t Q s v g , t max
Q p v , t min Q p v , t Q p v , t max
Q w t , t min Q w t , t Q w t , t max
where P x , t max , P x , t min are the maximum and minimum limits of active power transmitted by the superior power grid at time t, respectively; Q x , t max , Q x , t min denote the maximum and minimum limits of reactive power transmitted by the superior power grid at time t, respectively; U j , t and U j max / U j min represent the voltage amplitude and its upper/lower limit of bus i at time t, respectively; and Q s v g , t max , Q s v g , t min indicate the upper and lower limits of reactive power that SVG devices can emit at time t, respectively.

3. Uncertainty Quantification Model of Renewable Energy Based on Robust IGDT

The active and reactive generated by renewable energy show a certain proportion. Therefore, the reactive power can be indirectly described by the system power cost. The electricity cost of the system can be expressed as follows:
C = t = 1 T c t ( P load , t P w t , t P p v , t )
where c t represents the time-of-use electricity price, P load , t indicates the total load of the distribution network at the moment t, P wt , t symbolizes the total active power of the fan in the distribution network at the moment t, and P pv , t denotes the total active power of the photovoltaic in the distribution network at the moment t.
Due to the strong instability of renewable energy power generation, this brings greater uncertainty to the operation of the power grid. Therefore, it is very important to consider and model the uncertain factors in the process of new energy power generation and to carry out the research on the planning of reactive compensation equipment under the uncertainty of renewable energy output.
IGDT is an analytical method used to deal with uncertain problems. It is a non-probabilistic non-fuzzy optimization method developed from non-probabilistic models. The function of IGDT theory is to construct the maximum uncertainty fluctuation interval under the condition that the optimization result satisfies the preset value and study the influence of uncertainty on the optimization result. IGDT provides decision-makers with more choice space. The purpose of this paper is to maximize the impact of avoiding the uncertainty of wind and solar on the optimization results, so IGDT is selected to construct the corresponding uncertain model.
The uncertainty of renewable energy output can be expressed as
ρ U ( , ρ ˜ ) s . t . ρ = P w t , t , P p v , t w t Ω win , p v Ω pv U ( , ρ ˜ ) = { ρ : ( ρ ρ ˜ ) / ρ ˜ }
where ρ% is the predicted value of new energy output and is an uncertainty coefficient that reflects the difference between the actual value and the predicted value.
The expected cost can be expressed as
f c ( ρ , q ) = ( 1 + ζ c ) C 0
where ζ c is the expected deviation coefficient of cost and C 0 is the reference value of income under deterministic conditions.
The decision maker sets the maximum acceptable cost through the cost deviation coefficient and IGDT based on this to find the maximum value of the uncertain parameters of the new energy output:
^ ( q , C c ) = max { : ρ U ( , ρ ˜ ) , f c ( ρ , q ) ( 1 + ζ c ) C 0 }
where ρ is the actual value of new energy output; q is the decision variable of the system model; and f c ( ρ , q ) is the total cost of the system under the actual value.
Since there are generally multiple new energy power plants in the distribution network, the scenario of applying IGDT to multiple renewable energy plants should be considered, which can be expressed as
max 1 , 2 , 3 , , N max f c ( ρ , q ) ( 1 + ζ c ) C 0
where N is the number of renewable energy stations.
The multi-objective model described in the formula is difficult to solve directly. Therefore, a robust IGDT is proposed to solve such problems. Considering that when the renewable energy output in the system is less and the cost of purchasing electricity is higher, the objective function of Equation (22) can be transformed into max ( min 1 , 2 , 3 , , N ) , and the lower objective max f c ( ρ , q ) ( 1 + ζ c ) C 0 can be transformed into constraint f c ( ρ , q ) ( 1 + ζ c ) C 0 . The robust IGDT model is obtained as shown in Equation (23).
max ( min 1 , 2 , 3 , , N ) s . t . f c ( ρ , q ) ( 1 + ζ c ) C 0
The pseudo-code of the proposed robust IGDT can be described as follows (Algorithm 1):
Algorithm 1. The pseudocode of proposed robust IGDT
1:Input new energy output and load data;
2:for  t = 1   :   T  do
3:  Establishing an SVG siting and operation planning model in a deterministic environment;
4:end for
5: Optimize   the   deterministic   model   to   obtain   the   optimal   solution ,   denoted   as   C 0 ;
6:Initialize   and define variables  ζ c ;
7:for  t = 1   :   T  do
8:  Establish a robust IGDT based SVG siting and operation planning using Equation (23);
9:end for
10:Solving a robust IGDT model to obtain SVG siting and operation planning under uncertain new energy output scenarios;

4. Simulation and Discussion

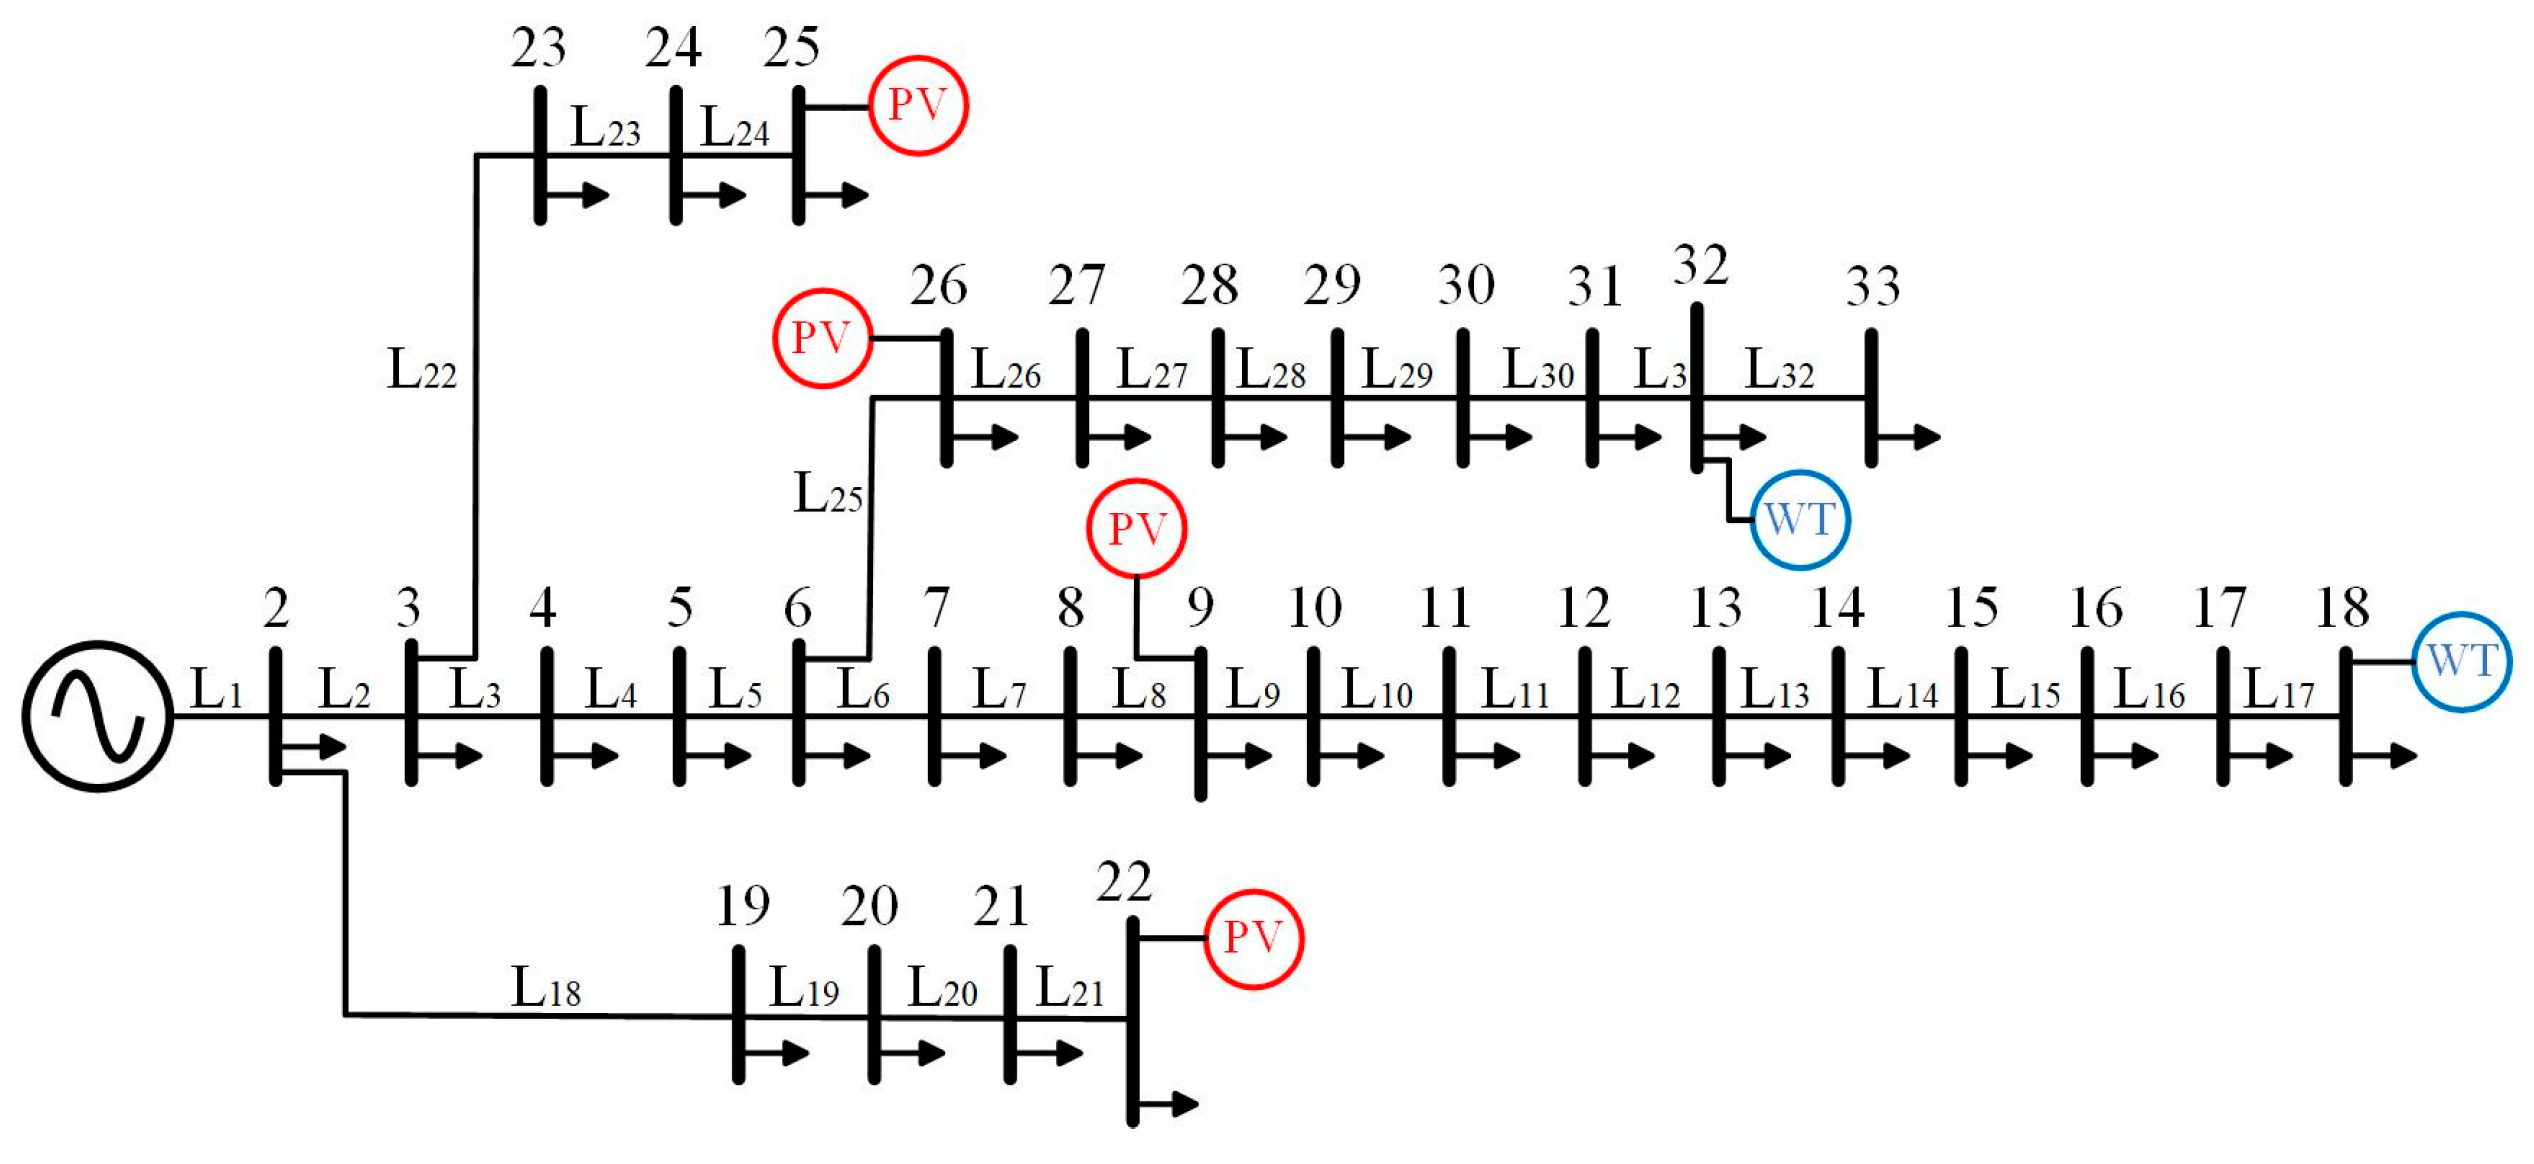
4.1. Parameter Settings

The simulations were conducted on an experimental computer using the MATLAB2020 platform. The computer is equipped with an Intel Core i9-14900K processor and 96 GB of RAM used in this study were sourced from Intel Corporation, headquartered in Santa Clara, CA, USA, and a clock frequency of 3.20 GHz. We analyze various renewable energy sources, highlighting solar energy’s regional flexibility and low costs, and wind energy’s stability and high output. These characteristics make solar and wind energy ideal for our simulation modeling.
In order to verify the effectiveness of optimization for siting and operation of reactive equipment in the distribution network proposed in this paper, simulation verification is carried out based on the IEEE-33 bus example. As shown in Figure 2, the network topology and equipment are as follows: four photovoltaic power plants are connected to buses 9, 22, 25 and 26, and the photovoltaic capacity is 0.2 MW. The two wind farms are connected at buses 18 and 32, with a capacity of 0.3 MW. The reactive power compensation range of each SVC device is [−200,200] kvar [23], and each bus is connected to up to four groups of SVGs. Due to the time series correlation between renewable energy and load output, reductions in renewable energy and increases in load similarly affect the system’s reactive power location and capacity. Consequently, we have established three scenarios with varying growth rates for renewable energy and load [24,25]. Scenario 1: renewable energy increases by 8% and load by 5%. Scenario 2: renewable energy increases by 5% and load by 8%. Scenario 3: both renewable energy and load increase by 5% [26].

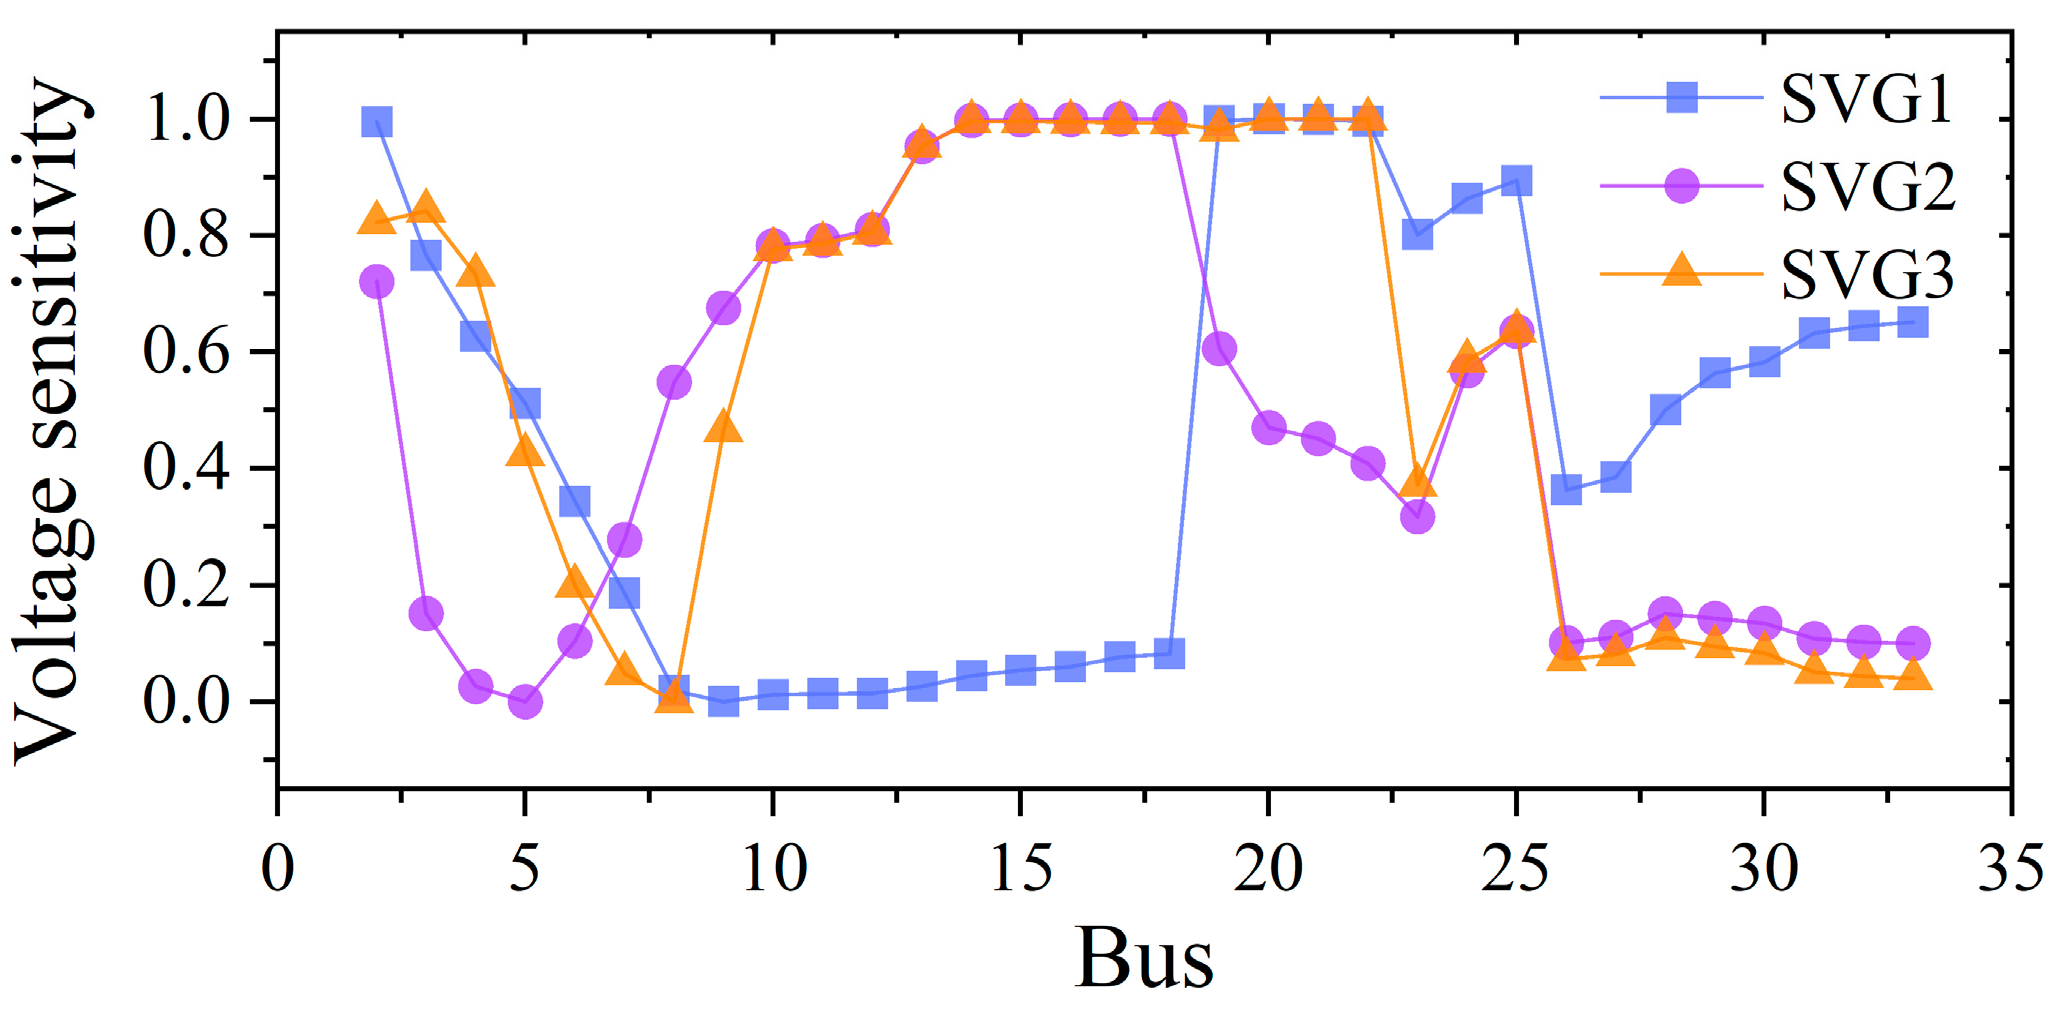
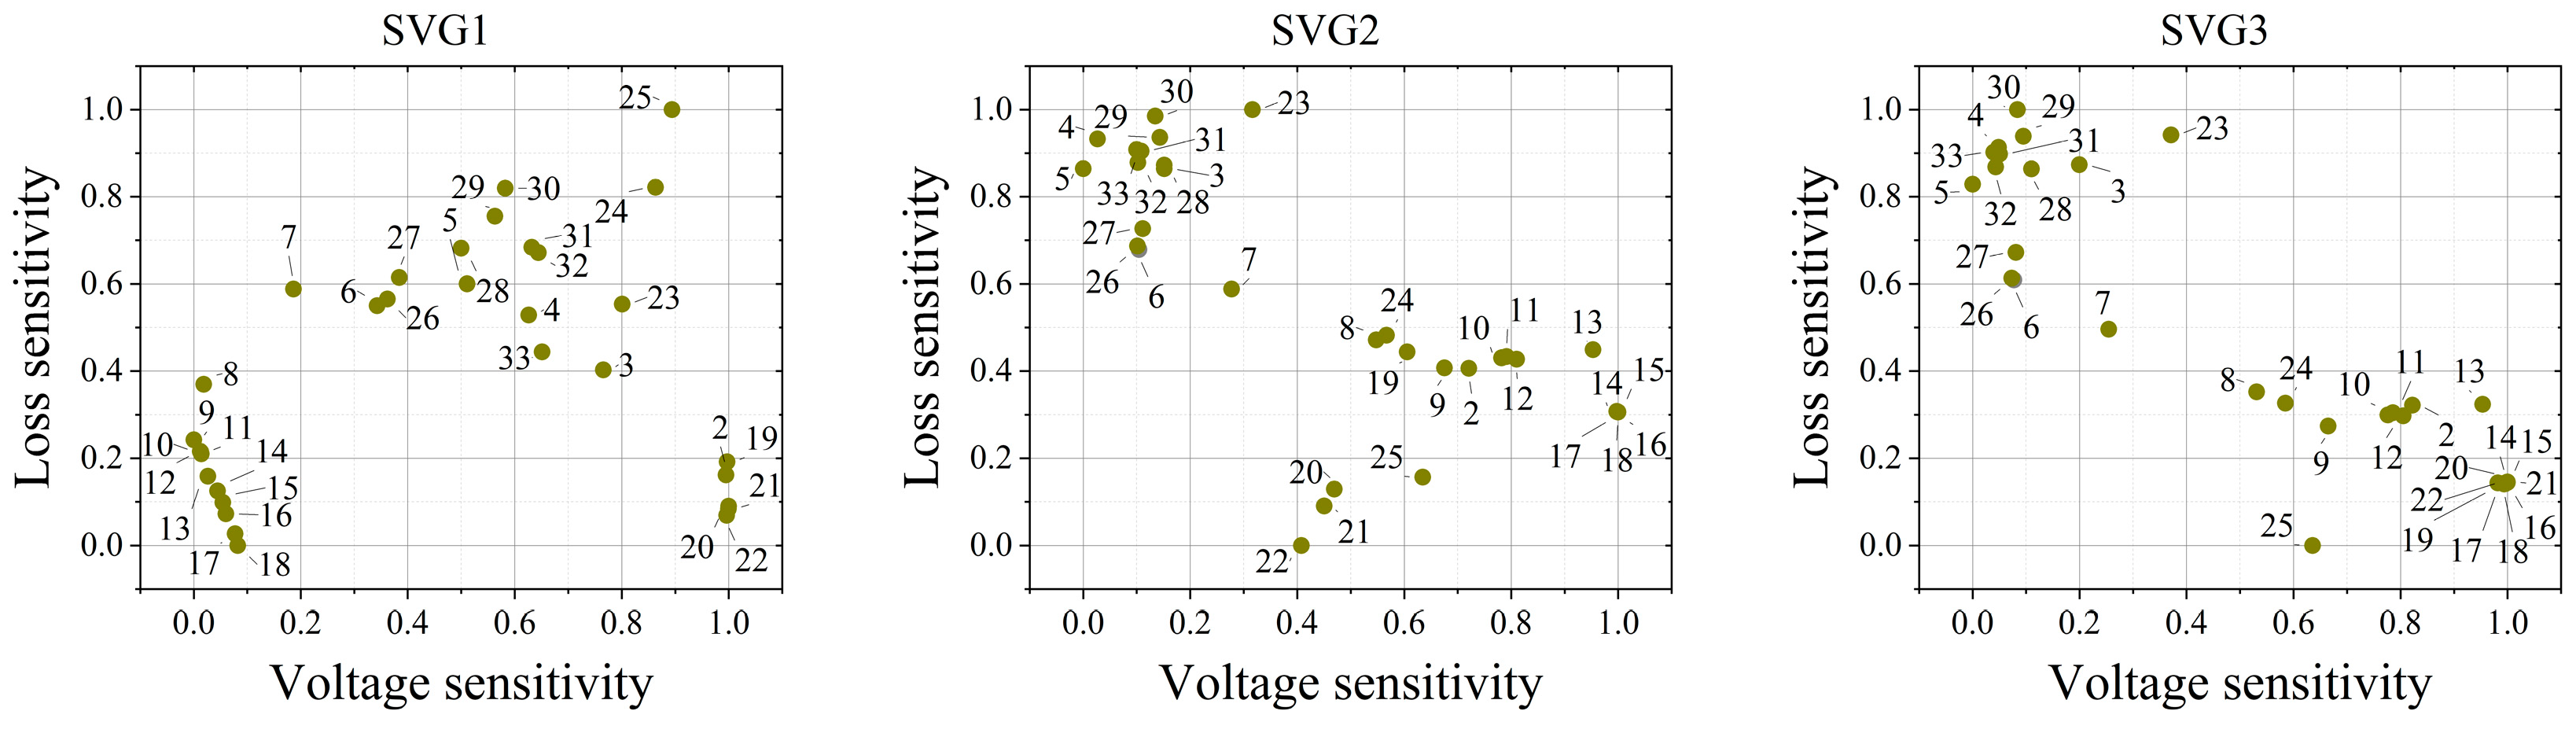
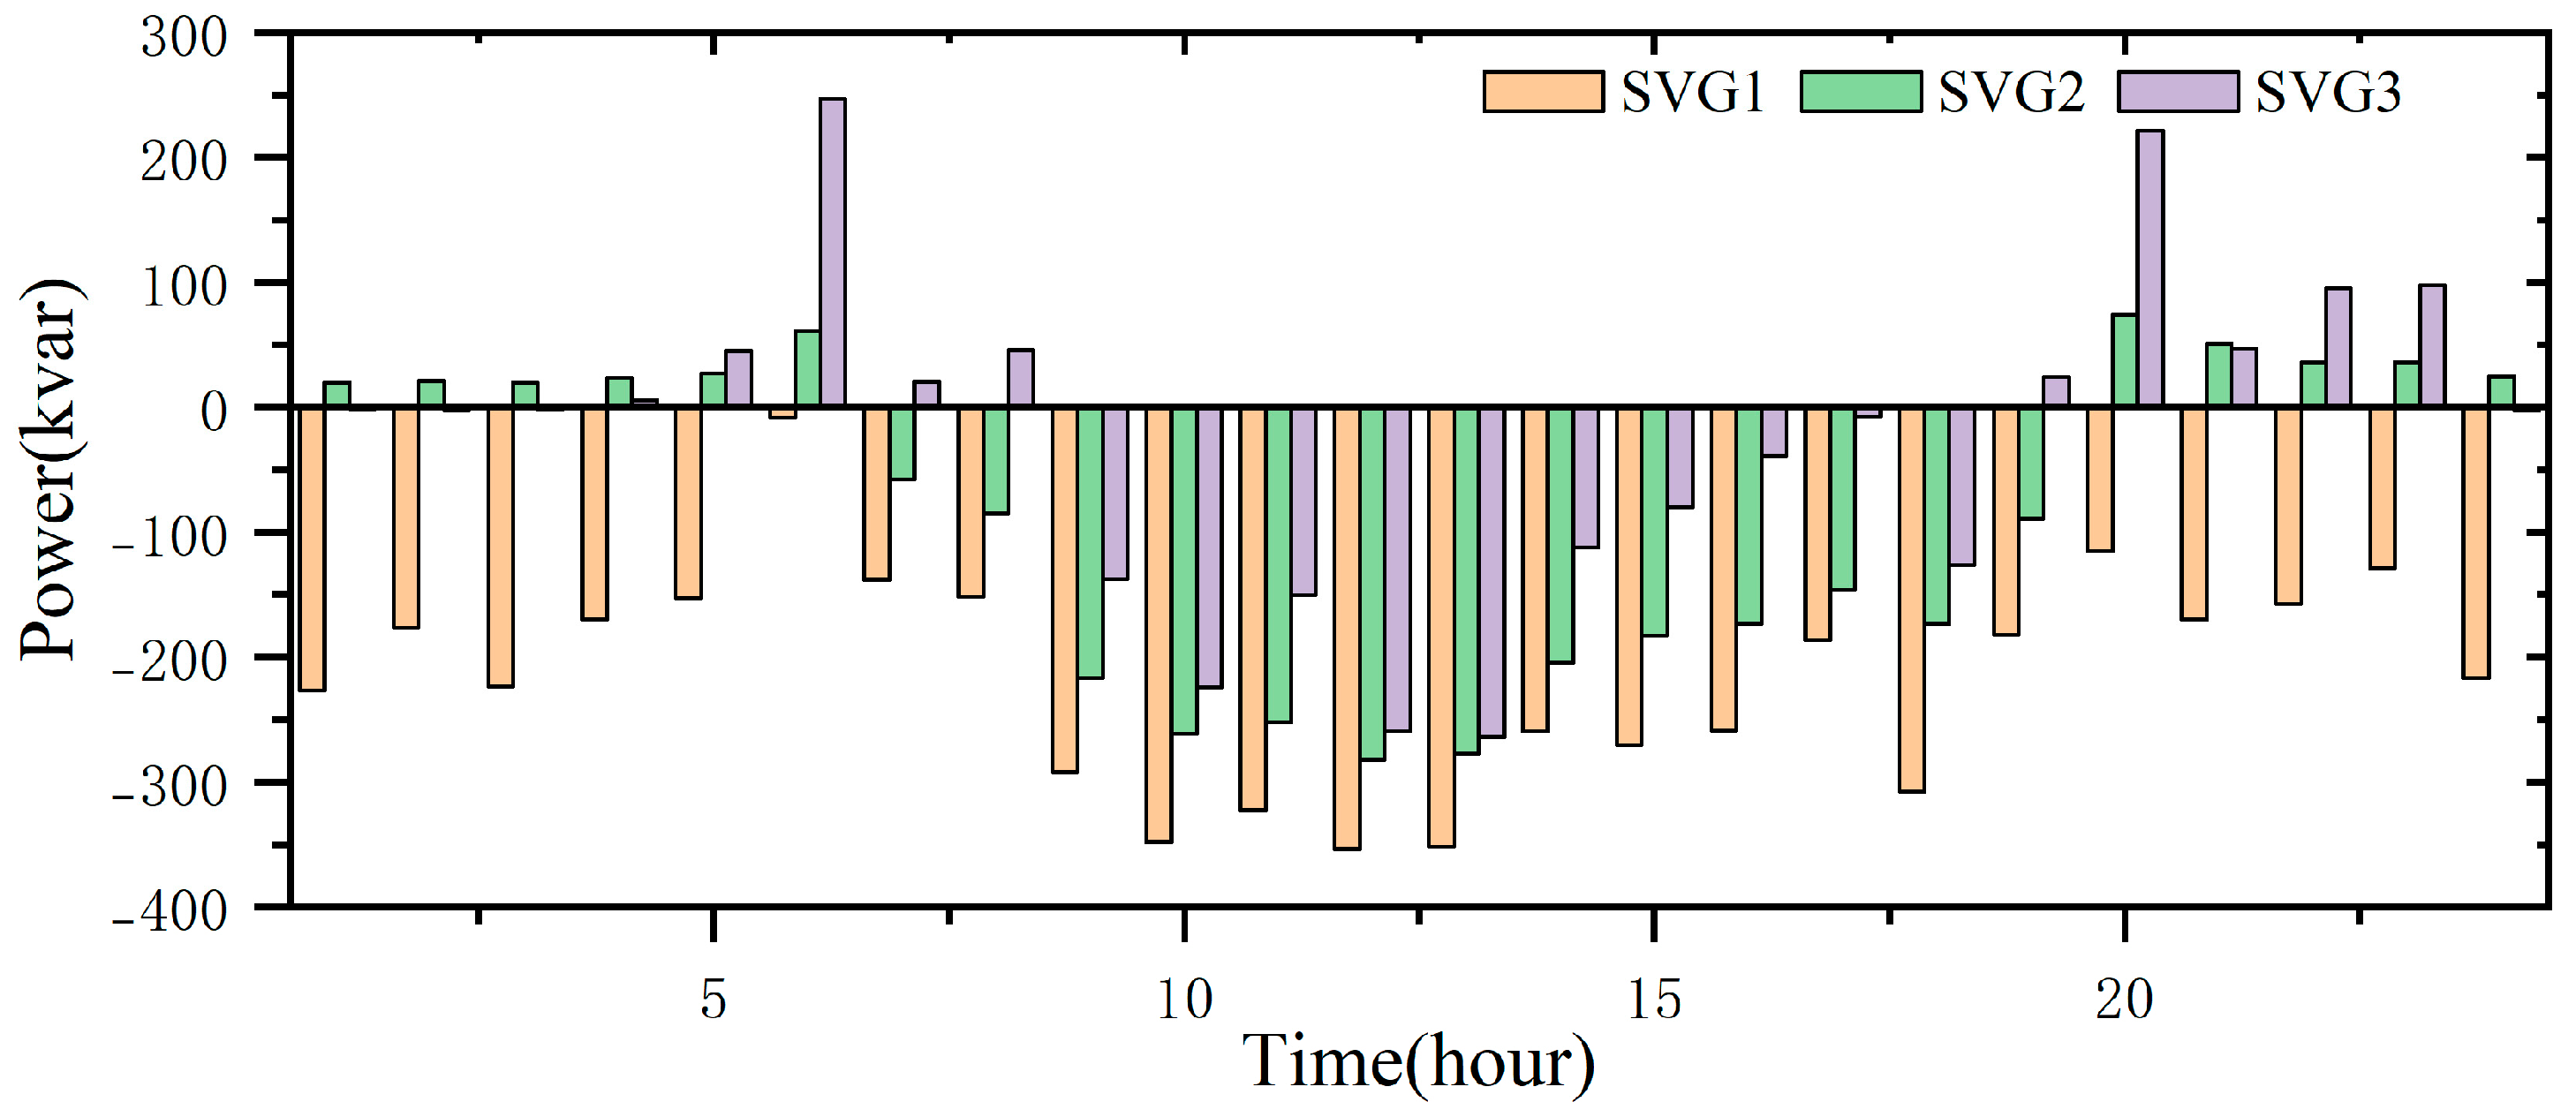
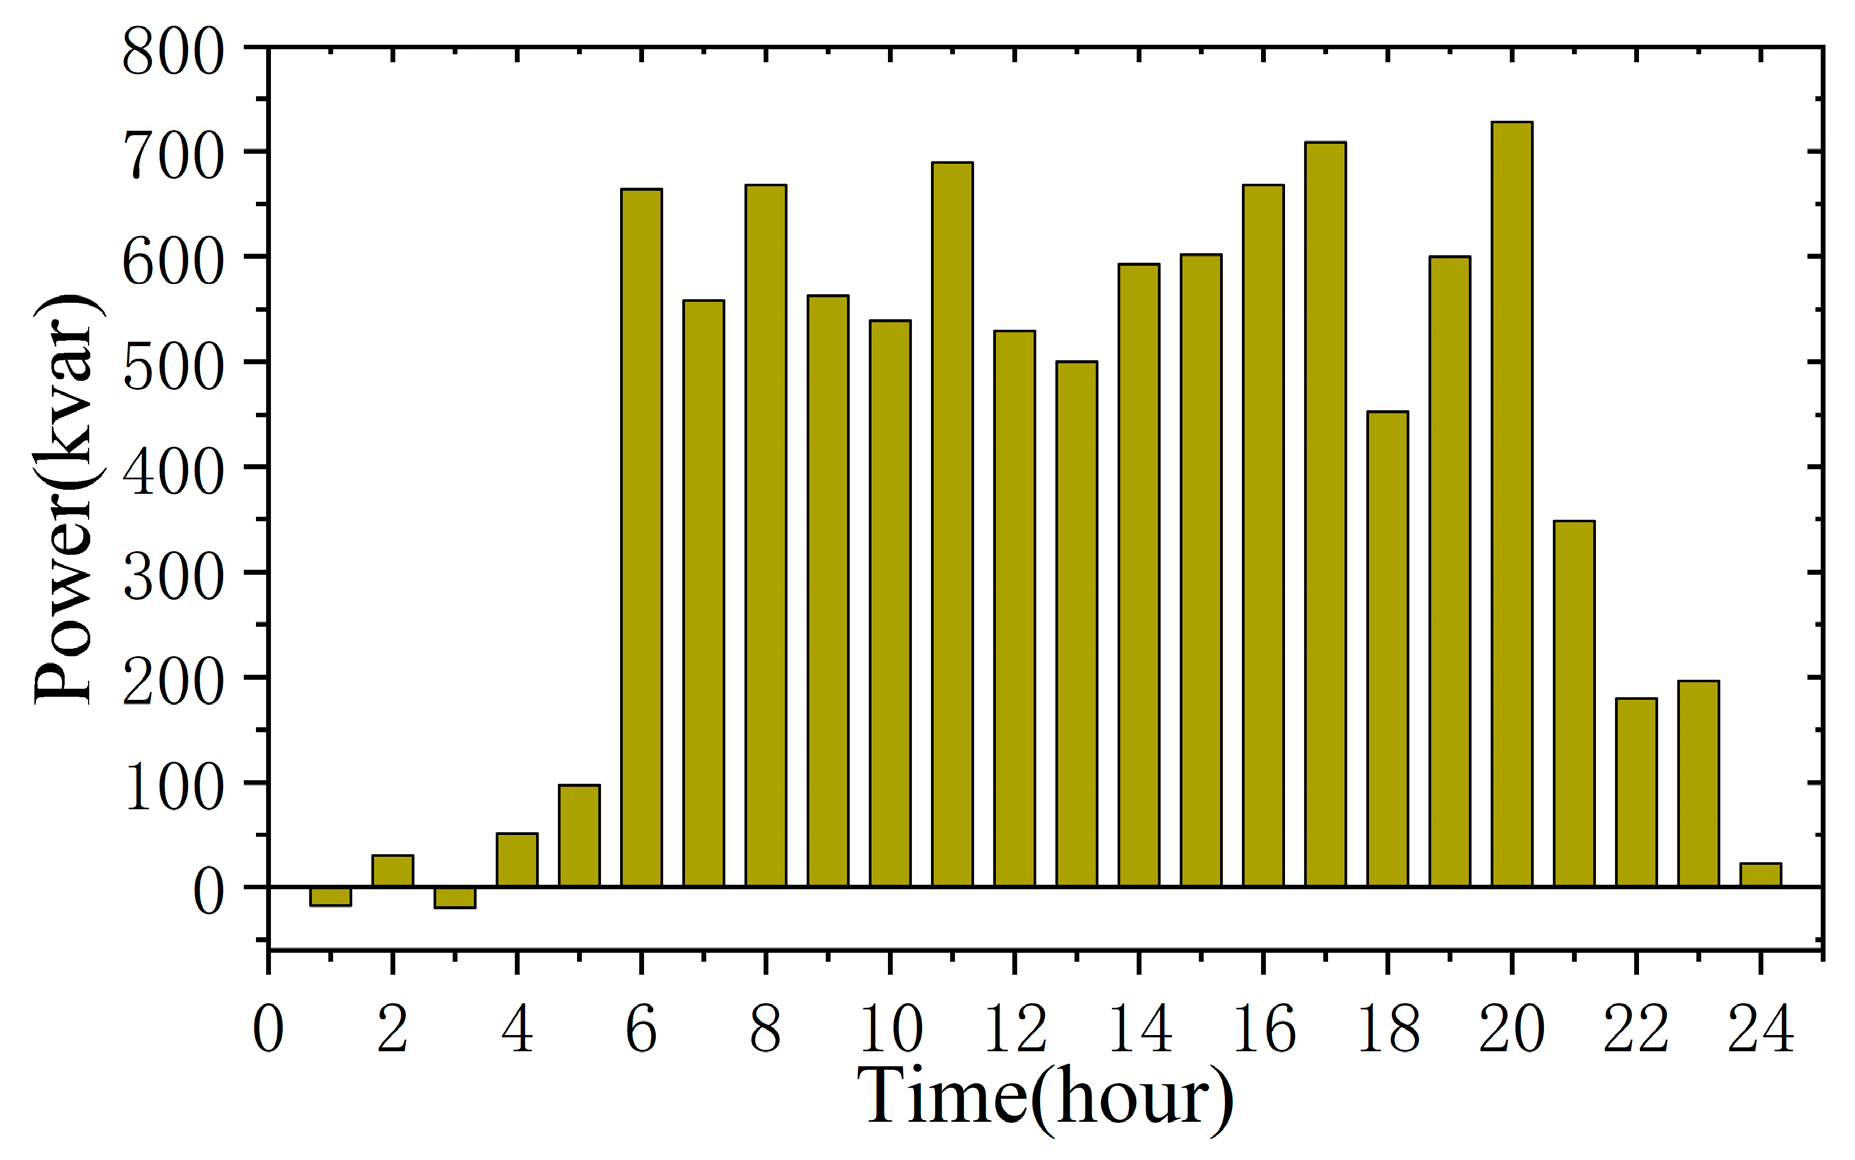
4.2. The Influence of Voltage–Loss Sensitivity Siting Strategy on SVG Siting and Operation Planning

In order to verify the feasibility of the voltage–loss sensitivity siting strategy proposed in this paper, two single-objective siting strategies of voltage sensitivity and loss sensitivity are compared with the proposed method. In the single-objective siting strategy of voltage sensitivity and loss sensitivity, the minimum sum of voltage fluctuation amplitudes of each bus and the minimum sum of line losses at 24 moments after SVGs is connected to the power grid are taken as the objectives, the siting is selected, and three SVGs access points are set. Comparative analysis is performed based on Scenario 1.
As shown in Figure 3, the sensitivity of the voltage sensitivity siting strategy is shown. The siting results of the three SVGs are buses 9, 5, and 8, respectively. This is because the growth rate of the renewable energy scale is greater than the load growth rate. In order to maintain voltage stability, SVG will be the first choice to absorb the excess reactive power near the renewable energy station to prevent the line voltage difference caused by the simultaneous increase in active and reactive power. For the radial distribution network, the closer to the source bus, the smaller the impact of the injection power change on the system voltage, so the siting bus of the voltage sensitivity siting strategy is located between the source bus and the renewable energy station.
Figure 4 shows the siting results of loss sensitivity. It can be seen that the buses with the smallest loss sensitivity are 18, 22, 26, respectively. This is because with the increase in the scale of renewable energy, the reactive power emitted by the station increases, resulting in the return of power on the line, which leads to an increase in line loss. The loss sensitivity siting strategy is based on the minimum line loss, and the renewable energy station at the end of the line is selected as the SVG siting point to absorb excess reactive power, thereby reducing the loss.
The voltage–loss sensitivity siting strategy is based on the entropy weight method to determine the respective weights for the voltage sensitivity and loss sensitivity after SVG access and selects the bus with the smallest target value as the access siting. Figure 5 is the voltage–loss sensitivity scatter diagram, and the SVG siting buses are determined to be 18, 22 and 26. In the voltage–loss sensitivity siting strategy, the voltage and loss problems brought by the scale of renewable energy and load growth to the distribution network are taken into account, and the optimal equilibrium solution can be sought between the two. In order to reduce the loss, the siting target is set at the new energy station bus; in order to solve the problem of voltage fluctuation, the siting bus is closer to the source bus than the loss sensitivity siting strategy.
Table 1 shows the comparison results of voltage and loss indicators of the three siting methods. It can be seen that the single-objective siting strategy of voltage sensitivity and loss sensitivity shows the pertinence to voltage or loss. In the voltage siting strategy, the voltage fluctuation is reduced by 55.19% compared with that without SVG. Although the result ensures the minimum grid voltage fluctuation, the grid loss phase is 5.53% higher. Similarly, in the voltage siting strategy, although the results ensure the minimum network loss, the voltage fluctuation is 48.98% higher than that when SVG is not connected.
Compared to the above two, the voltage–loss sensitivity multi-objective siting strategy balances the two objectives. The two-objective weights determined by the entropy weight method are shown in Table 2. Compared with no SVG, the voltage fluctuation and line loss are reduced by 29.53% and 7.75%, respectively. Figure 6 is a histogram of the reactive power compensation capacity of three groups of SVG equipment. Affected by photovoltaic power generation, the compensation capacity is high in the daytime and low in the evening.

4.3. Optimization for SVG Siting and Operation Under Different Renewable and Load Scales in the Future

Considering the different renewable energy and load scales in the future, based on Scenario 2 and Scenario 3, the siting and operation of SVG equipment are compared and analyzed. In order to highlight the key points and simplify the calculation, this section analyzes the access to one SVG device in the distribution network. As shown in Figure 7 and Figure 8, the voltage–loss sensitivity scatter plot and SVG operation state diagram based on Scenario 2 siting are shown. As shown in Figure 9 and Figure 10, the voltage–loss sensitivity scatter plot and SVG operation state diagram based on Scenario 3 siting are shown.
When the future load growth rate is greater than the renewable energy growth rate, the siting bus is 30 buses. At this time, the siting result is no longer dominated by the renewable energy station but is allocated according to the load size. Table 3 is the 24 h average load of each bus in the distribution network. From Table 3, it can be concluded that the active and reactive loads of bus 30 are 200 kW and 600 kvar, respectively, which are much higher than those of other buses. As a result, the grid voltage fluctuates violently after the load of the bus rises, and the loss increases significantly. Figure 8 shows the operation state diagram of SVG equipment. In order to solve this problem, SVG equipment compensates a large amount of reactive power to alleviate voltage fluctuation and reduce line loss.
When the future load growth rate is equal to the growth rate of renewable energy, the siting bus is 18 buses. Affected by the power generation of 18 buses wind farm station, the load decreases in the evening, while the wind power increases. At this time, the SVG equipment absorbs reactive power. Similarly, at the time of 9–15, the photovoltaic output is high, and the excess reactive power is absorbed by SVG. At the remaining time, the load is shown compared with the increase in renewable energy output, and the SVG device performs reactive power compensation.

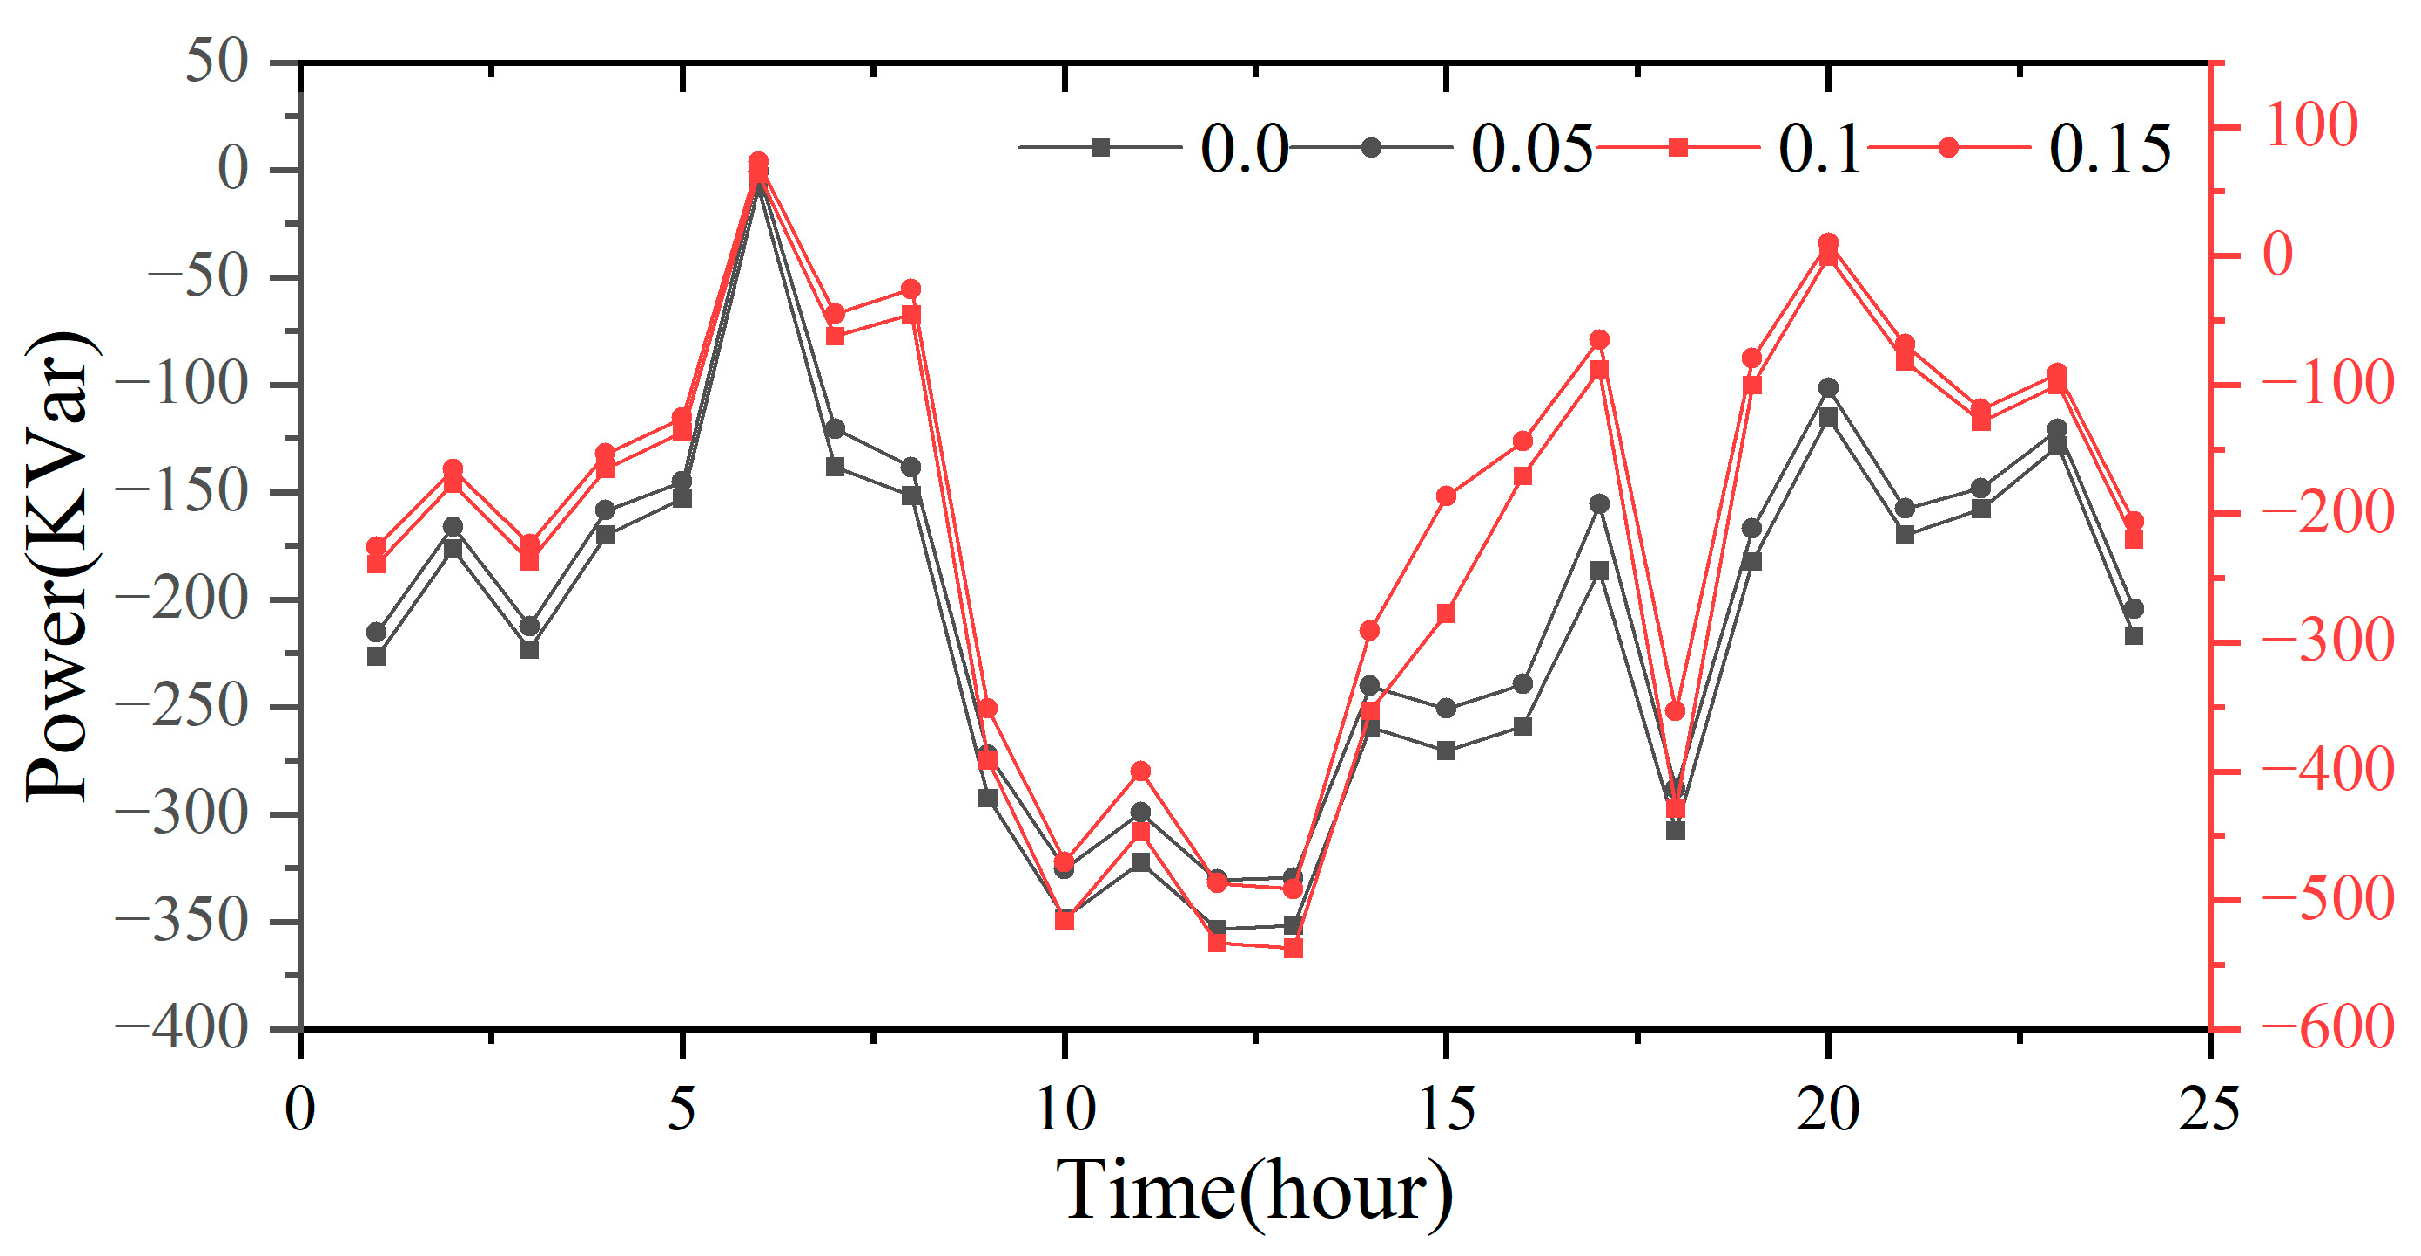
4.4. Optimization for SVG Siting and Operation Under Different Risk Preferences

In order to consider the impact of renewable energy generation uncertainty, this section uses robust IGDT model to quantify the uncertainty based on scenario 1. Different cost expectation deviation coefficients are used for comparative analysis and are 0.05, 0.10 and 0.15, respectively. The siting results under different deviation coefficients are shown in Table 4, and the SVG operation curves under different deviation coefficients are shown in Figure 11.
When the increase in the operating cost of the system is increasing, and the power shortage of renewable energy is gradually increasing. The corresponding siting bus has also changed from bus 18 to bus 32. This is because as the output of renewable energy decreases, the increase in load gradually emerges. As shown in Table 3, the load of 29–32 buses is generally high. Such a siting can ensure that the system still maintains voltage stability and good loss level under extreme conditions.
It can be seen from Figure 11 that when the siting is located at bus 18, the maximum compensation capacity of SVG is about 350 kvar. When the siting is located at bus 32, the maximum compensation capacity of SVG is about 530 kvar, which is mainly affected by the renewable energy output and load ratio of the siting. Based on the above content, decision-makers can freely choose the access siting of SVG according to their own decision preferences, based on the investment cost and the voltage quality and loss level of the power grid.

5. Conclusions

In this study, multi-objective voltage–loss sensitivity SVG siting and operation planning based on robust IGDT is established and verified on the IEEE-33 bus distribution network. The results are summarized as follows:
(1)
In this paper, considering the possible renewable energy scale in the distribution network in the future and the load growth rate, the scenarios of reactive compensation equipment under different ratios of the two are established, and the siting and operation strategy of SVG under the corresponding scenarios is given.
(2)
A multi-objective SVG siting planning based on voltage–loss sensitivity is established. Compared with the non-interference power network, the proposed method can reduce the voltage fluctuation and loss of the distribution network by 29.53% and 7.75%, respectively.
(3)
The robust IGDT is used to effectively quantify the uncertainty of multiple renewable energy power plants, which solves the problem that the model is difficult to solve due to the uncertainty of multiple renewable energy outputs. The operation schemes of decision-makers in various scenarios are given, which is convenient for decision makers to choose.

Author Contributions

Y.G.: conceptualization, funding acquisition, and writing—original draft. Y.F.: methodology, and writing—original draft. J.L.: investigation, and writing—original draft. J.C.: investigation, and writing—original draft. All authors have read and agreed to the published version of the manuscript.

Funding

This work was supported by the Science and Technology Project of Shandong Zhiyuan Electric Power Design Consulting Co., Ltd. (No. ZY-2024-04).

Data Availability Statement

Data will be available on request.

Conflicts of Interest

Authors Yiguo Guo, Yimu Fu, and Jingxuan Li were employed by the company State Grid Shandong Electric Power Company and Shandong Zhiyuan Electric Power Design Consulting Co., Ltd. The remaining authors declare that the research was conducted in the absence of any commercial or financial relationships that could be construed as a potential conflict of interest. The State Grid Shandong Electric Power Company and Shandong Zhiyuan Electric Power Design Consulting Co., Ltd. had no role in the design of the study; in the collection, analyses, or interpretation of data; in the writing of the manuscript; or in the decision to publish the results.

Abbreviations

The following abbreviations are used in this manuscript:
Nomenclature
Acronyms
PVPhotovoltaic
WTWind turbine
SVGStatic var generator
PDNPower distribution network
IGDTInformation gap decision theory
Variables
Δ U m , t i The voltage change at bus m caused by the power change of the load at bus i at the time of t
α u Voltage sensitivity weight
α loss Voss sensitivity weight
c t Time-of-use price
P load , t The total load of the distribution network at the moment t
P wt , t , P pv , t The total active power of WT and PV in the distribution network at the moment t
ρ ˜ Predicted value of new energy output
ρ Actual value of new energy output
Uncertainty coefficient of IGDT
ζ c The expected deviation coefficient of cost
C 0 The reference value of income under deterministic conditions
N The number of renewable energy stations

References

  1. Zhang, Y.Q.; Chen, J.J.; Wang, Y.X.; Feng, L. Enhancing resilience of agricultural microgrid through electricity–heat–water based multi-energy hub considering irradiation intensity uncertainty. Renew. Energy 2024, 220, 119739. [Google Scholar] [CrossRef]
  2. Liu, J.; Chen, J.; Yan, G.; Chen, W.; Xu, B. Clustering and dynamic recognition based auto-reservoir neural network: A wait-and-see approach for short-term park power load forecasting. iScience 2023, 26, 107456. [Google Scholar] [CrossRef] [PubMed]
  3. Ruan, H.; Gao, H.; Liu, Y.; Wang, L.; Liu, J. Distributed voltage control in active distribution network considering renewable energy: A novel network partitioning method. IEEE Trans. Power Syst. 2020, 35, 4220–4231. [Google Scholar] [CrossRef]
  4. Brinkel, N.B.G.; Gerritsma, M.K.; AlSkaif, T.A.; Lampropoulos, I.; Van Voorden, A.M.; Fidder, H.A.; Van Srark, W.G.J.H.M. Impact of rapid PV fluctuations on power quality in the low-voltage grid and mitigation strategies using electric vehicles. Int. J. Electr. Power Energy Syst. 2020, 118, 105741. [Google Scholar] [CrossRef]
  5. Drosos, D.; Kyriakopoulos, G.L.; Arabatzis, G.; Tsotsolas, N. Evaluating customer satisfaction in energy markets using a multicriteria method: The case of electricity market in Greece. Sustainability 2020, 12, 3862. [Google Scholar] [CrossRef]
  6. Zhou, Z.; Mastoi, M.S.; Wang, D.; Haris, M. Control strategy of DFIG and SVG cooperating to regulate grid voltage of wind power integration point. Electr. Power Syst. Res. 2023, 214, 108862. [Google Scholar] [CrossRef]
  7. Li, Y.; Gesang, J.; Long, D.; Xu, Z.; Tan, Z.; Huang, Z.; Song, Y.; Chen, Y. Siting and sizing of synchronous compensator based on electromagnetic transient simulation. Energy Rep. 2022, 8, 1350–1357. [Google Scholar] [CrossRef]
  8. Tian, S.; Jia, Q.; Xue, S.; Shi, L.; Lv, C.; Bu, L.; Zhou, W. Two-layer model of siting and sizing for active power filters and static var generators considering reactive power capability and active power curtailment of DGs. IET Gener. Transm. Distrib. 2022, 16, 2913–2927. [Google Scholar] [CrossRef]
  9. Xue, S.; Zeng, S.; Jia, Q.; Hu, X.; Luo, P.; Liang, J. Collaborative Optimization Allocation of Grid-Forming and Grid-Following Reactive Power Resources Considering Auxiliary Equipment Services. IEEE Access 2023, 11, 95840–95857. [Google Scholar] [CrossRef]
  10. Ransikarbum, K.; Pitakaso, R. Multi-objective optimization design of sustainable biofuel network with integrated fuzzy analytic hierarchy process. Expert Syst. Appl. 2024, 240, 122586. [Google Scholar] [CrossRef]
  11. Zhou, X.; Tan, W.; Sun, Y.; Huang, T.; Yang, C. Multi-objective optimization and decision making for integrated energy system using STA and fuzzy TOPSIS. Expert Syst. Appl. 2024, 240, 122539. [Google Scholar] [CrossRef]
  12. Wang, Z.; Liu, Q.; Zhang, B. What kinds of building energy-saving retrofit projects should be preferred? Efficiency evaluation with three-stage data envelopment analysis (DEA). Renew. Sustain. Energy Rev. 2022, 161, 112392. [Google Scholar] [CrossRef]
  13. Banadkouki, M.R.Z. Selection of strategies to improve energy efficiency in industry: A hybrid approach using entropy weight method and fuzzy TOPSIS. Energy 2023, 279, 128070. [Google Scholar] [CrossRef]
  14. Wang, C.; Shuai, J.; Ding, L.; Lu, Y.; Chen, J. Comprehensive benefit evaluation of solar PV projects based on multi-criteria decision grey relation projection method: Evidence from 5 counties in China. Energy 2022, 238, 121654. [Google Scholar] [CrossRef]
  15. Mohseni, S.; Brent, A.C. Quantifying the effects of forecast uncertainty on the role of different battery technologies in grid-connected solar photovoltaic/wind/micro-hydro micro-grids: An optimal planning study. J. Energy Storage 2022, 51, 104412. [Google Scholar] [CrossRef]
  16. Fan, W.; Changyuan, W.; Jiekang, W.; Huiling, T.; Chen, L. Collaborative management of multi-type energy for optimal control of voltage and loss of distribution systems with DGs and SVCs. Electr. Power Compon. Syst. 2022, 50, 194–205. [Google Scholar] [CrossRef]
  17. Wang, M.; Liao, K.; Yang, J.; Zheng, S.; Lu, D. Three-stage robust voltage/var optimal control of wind farms at multiple time scales. IET Renew. Power Gener. 2022, 16, 594–606. [Google Scholar] [CrossRef]
  18. Li, J.Y.; Chen, J.J.; Wang, Y.X.; Chen, W.G. Combining multi-step reconfiguration with many-objective reduction as iterative bi-level scheduling for stochastic distribution network. Energy 2024, 290, 130198. [Google Scholar] [CrossRef]
  19. Ding, T.; Liu, S.; Yuan, W.; Bie, Z.; Zeng, B. A two-stage robust reactive power optimization considering uncertain wind power integration in active distribution networks. IEEE Trans. Sustain. Energy 2015, 7, 301–311. [Google Scholar] [CrossRef]
  20. Shi, Y.; Zhao, Q.; Jiao, L. Optimum exploitation of multiple energy system using IGDT approach and risk aversion strategy and considering compressed air storage with solar energy. Energy 2024, 291, 130369. [Google Scholar] [CrossRef]
  21. Wang, Y.X.; Chen, J.J.; Zhao, Y.L.; Xu, B.Y. Incorporate robust optimization and demand defense for optimal planning of shared rental energy storage in multi-user industrial park. Energy 2024, 301, 131721. [Google Scholar] [CrossRef]
  22. Chen, J.; Zheng, J.; Wu, P.; Zhang, L.; Wu, Q. Dynamic particle swarm optimizer with escaping prey for solving constrained non-convex and piecewise optimization problems. Expert Syst. Appl. 2017, 86, 208–223. [Google Scholar] [CrossRef]
  23. Téllez, A.Á.; López, G.; Isaac, I.; González, J.W. Optimal reactive power compensation in electrical distribution systems with distributed resources. Review. Heliyon 2018, 4, e00746. [Google Scholar] [CrossRef] [PubMed]
  24. Ellabban, O.; Abu-Rub, H.; Blaabjerg, F. Renewable energy resources: Current status, future prospects and their enabling technology. Renew. Sustain. Energy Rev. 2014, 39, 748–764. [Google Scholar] [CrossRef]
  25. Lindberg, K.B.; Seljom, P.; Madsen, H.; Fischer, D.; Korpås, M. Long-term electricity load forecasting: Current and future trends. Util. Policy 2019, 58, 102–119. [Google Scholar] [CrossRef]
  26. Wang, J.; Gao, J.; Wei, D. Electric load prediction based on a novel combined interval forecasting system. Appl. Energy 2022, 322, 119420. [Google Scholar] [CrossRef]
Figure 1. Simple distribution network diagram.
Processes 13 00303 g001
Figure 2. IEEE-33 bus distribution network diagram.
Processes 13 00303 g002
Figure 3. Voltage sensitivity siting results.
Processes 13 00303 g003
Figure 4. Loss sensitivity siting results.
Processes 13 00303 g004
Figure 5. Multi-objective voltage–loss sensitivity siting results.
Processes 13 00303 g005
Figure 6. SVG operation of scenario 1.
Processes 13 00303 g006
Figure 7. Voltage and loss sensitivity under Scenario 2.
Processes 13 00303 g007
Figure 8. SVG operation under Scenario 2.
Processes 13 00303 g008
Figure 9. Voltage and loss sensitivity under Scenario 3.
Processes 13 00303 g009
Figure 10. SVG operation under Scenario 3.
Processes 13 00303 g010
Figure 11. SVG operation status under different deviation coefficients.
Processes 13 00303 g011
Table 1. Weight coefficient of voltage–loss sensitivity.
SVG1SVG2SVG3
Siting bus182226
Sensitivity
coefficient
Voltage0.57450.52810.5057
Loss0.42550.47190.4943
Table 2. Comparison of results under different siting strategies.
No SVGVoltage SensitivityLoss
Sensitivity
Voltage–loss Sensitivity
Access positionSVG 1×91818
SVG 1×53222
SVG 1×82526
Voltage p.u.
(10−2)
Maximum1.2431.1423.5351.322
Minimum0.0450.0460.0410.043
Mean0.9820.4401.4630.692
Loss p.u. (10−2)Mean0.7230.7630.5530.667
Table 3. Load of each bus in the distribution network.
BusLoad
(kW/kvar)
BusLoad
(kW/kvar)
BusLoad
(kW/kvar)
10/01260/352390/50
2100/601360/3524420/200
390/4014120/8025420/200
4120/801560/102660/25
560/301660/202760/25
660/201760/202860/20
7200/1001890/4029120/70
8200/1001990/4030200/600
960/202090/4031150/70
1060/202190/4032210/100
1145/302290/403360/40
Table 4. Siting results under different deviation coefficients.
0.00.050.10.15
Risk factor0.00.0130.0260.039
Siting bus18183232
Average voltage deviation0.8630.8820.8720.879
Power loss0.7870.7320.7450.794
Disclaimer/Publisher’s Note: The statements, opinions and data contained in all publications are solely those of the individual author(s) and contributor(s) and not of MDPI and/or the editor(s). MDPI and/or the editor(s) disclaim responsibility for any injury to people or property resulting from any ideas, methods, instructions or products referred to in the content.

