Abstract
Accurate porosity evaluation is critical for the assessment of continental shale oil reservoirs, yet remains challenging due to complex lithology and significant burial depth variations, as exemplified by the Lianggaoshan Formation in the Sichuan Basin. Conventional fixed-matrix-density models often yield unsatisfactory accuracy in porosity estimation from density logs. This study proposes a variable matrix-density logging method to improve porosity calculation. The approach integrates core X-ray diffraction and lithology scanning logs to convert mineral mass fractions into volumes, constructing a petrophysical model that accounts for crystalline minerals, clay minerals, kerogen, and fluids. A depth-dependent dynamic matrix density model was established by analyzing compaction effects across varying depths. By incorporating this model into the density-log response equation, shale porosity was quantitatively derived. Application to the Lianggaoshan Formation demonstrates that the method reduces the absolute error in porosity estimation by 2.55 porosity units compared to conventional approaches, while also addressing the limitations of NMR-based porosity evaluation in shales. The proposed method provides a reliable, applicable technique for porosity assessment in continental shale reservoirs with similar geological conditions.
1. Introduction
With the continuous advancement of unconventional oil and gas exploration and development, shale oil and gas have garnered significant attention and have become a valuable supplement in the energy sector [1,2,3]. Breakthroughs in long-reach horizontal drilling and fracturing technologies for shale oil and gas reservoirs have recently led to substantial production increases, reaching economically viable development levels. While evaluation techniques for marine shale oil and gas reservoirs have matured, those for continental shale oil reservoirs remain exploratory, particularly regarding porosity evaluation accuracy.
Previous researchers have conducted extensive work on petrophysical volumetric models for shale reservoirs and porosity evaluation using conventional and nuclear magnetic resonance (NMR) logging data. Sondergeld et al. summarized prior studies and proposed a formula combining fluid saturation, density, and organic matter content with bulk density measurements to calculate shale porosity [4]. However, its applicability to shales with highly variable mineral compositions, kerogen content, and complex nano- to micron-scale pore volumes remains debatable. Ramirez et al. introduced a petrophysical model suitable for scenarios with only resistivity and two porosity logs, assuming the rock comprises two components: a porous mineral matrix and porous kerogen [5]. The porous mineral matrix contains minerals and associated pore space, which can be gas-filled up to their bound state, While the validity of using Archie’s equation for saturation calculation in unconventional shale gas fields is contested, their model still relies on it. Alfred et al. introduced a new physically consistent solution that divides the system into kerogen and non-kerogen domains and their associated porosities [6]. However, this model tends to generate significant uncertainties at lower total organic carbon (TOC) values, and the choice of fluid parameters greatly affects the model’s accuracy. Piedrahita proposed that by integrating elemental capture spectroscopy (ECS) logging and NMR logging data, organic porosity can be readily converted either based on the volume of organic matter alone (intrinsic organic porosity) or the total volume of the entire system (total organic porosity) [7]. In addition to organic porosity, their model also calculates kerogen volume and its corresponding solid fraction, enabling estimation of the solid material and porosity within kerogen. However, in the process of calculating shale porosity, there are three methods for converting the weight percentage of total organic carbon (TOC) into volume percentage, and these three methods must be applied with caution. Since organic porosity is highly sensitive to TOC conversion, the arbitrary use of these methods may lead to errors. Additionally, numerous parameters need to be determined during the calculation process, and the resulting porosity may also be inaccurate due to the reduction in organic matter content. The aforementioned studies primarily focus on marine shales, with a lack of research on continental shales.
Compared to argillaceous sandstones, continental shale oil reservoirs contain additional mineral components such as kerogen and pyrite. In argillaceous sandstones, clay, quartz, feldspar, calcite, and other clay-sized particles exist in dispersed, laminated, and structural shale distribution patterns. In continental shales, where clay minerals constitute the framework, they are closely associated with interlayer water. Foscolos posited that shales undergo two dehydration stages during diagenesis, termed first and second stages [8]. The first stage dehydration is attributed to the dehydration of smectite under temperature control and compaction in a potassium-rich aqueous environment, transforming into illite and chlorite under the influence of K+, Fe2+, and Mg2+, occurring before hydrocarbon generation and corresponding to a vitrinite reflectance (Ro) of 0.5%. The second stage dehydration occurs after oil cracks to gas, corresponding to Ro > 1.5%. The reduction in clay interlayer water affects the changes in shale framework density, resulting in lower shale porosity.
This study establishes a shale petrophysical model considering crystalline minerals, clay minerals, kerogen, and fluids, based on core experimental data, lithology scanning logs, and conventional logging curves. The lithology scanning logging is used to convert the mass percentages of crystalline minerals, clay minerals, and organic matter into volume percentages and perform normalization. Utilizing porosity values from core analysis samples, the matrix density parameters and the density values of various clay minerals are back-calculated using the least squares method. A model describing the variation in clay mineral matrix values with depth is established by analyzing clay mineral matrix values at different depositional depths. This established petrophysical volumetric model is applied to the shales of the Lianggaoshan Formation in the Sichuan Basin and compared with NMR-derived porosity. The shale in this formation is a medium to high maturity continental shale with significant burial depth variations, and thus the compaction effect on clay mineral skeleton values is substantial. The proposed logging evaluation method for shale porosity demonstrates successful application.
2. Methodology
2.1. Petrophysical Volumetric Model
The target interval in this study primarily consists of laminated and massive shales. Laminated shales average 45.8% quartz, 47.4% clay, 4.3% feldspar, 2.0% calcite, and 0.5% siderite. Massive shales average 37.7% quartz, 53.3% clay, 5.8% feldspar, 1.2% calcite, and 1.5% siderite. Quartz content is slightly higher in laminated shales, while clay content is slightly lower. The clay minerals are predominantly mixed-layer illite/smectite (I/S), illite, kaolinite, and chlorite, with relative contents of 51.7% I/S, 21.5% illite, 10% kaolinite, and 17% chlorite, indicating the highest proportion of I/S. The laminated shale was examined using a Leica DM4P polarizing microscope from Germany. Light-colored laminae on a millimeter scale were observed distributed within the dark shale (Figure 1a). Meanwhile, interlayer fractures and well-developed bedding fractures are visible (Figure 1b,c). The thin-section photographs clearly reveal the presence of bedding fractures.
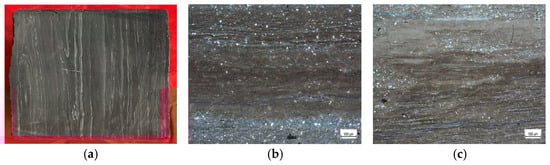
Figure 1.
Core photographs and thin-section images of laminated shale. (a) Shale Core Lamination Diagram; (b) Shale Bedded Fracture Development Map; (c) Shale Bedded Fracture Development Map.
Clay minerals are primarily illite, chlorite, smectite, and kaolinite. The general chemical formula for illite is K0.65Al2(Si3.35Al0.65)O10(OH)2·mH2O, for chlorite it is (Mg,Fe,Al)6(Al,Si)4O10(OH)8, for smectite it is (Al, Mg)2(Si4O10)(OH)2·4H2O, and for kaolinite it is Al4(Si4O10)(OH)8 [9]. The chemical formulas indicate that silicates in clay minerals contain hydroxyl groups (OH), and the number of interlayer water molecules (m) in illite is controlled by burial depth-induced compaction and associated pore fluid expulsion processes, evolving dynamically. The increase in mudstone density is a continuous process, transitioning from predominantly physical compaction to chemical compaction. During physical compaction, mechanical pressure from overlying strata rearranges and packs sedimentary particles, significantly increasing rock density by directly reducing pore space. Chemical compaction, on one hand, increases rock mass per unit volume by transforming low-density minerals like smectite into high-density illite and chlorite. On the other hand, this transformation process itself expels interlayer water and causes mineral volume contraction, further reducing the total volume. Additionally, silica and other substances released during transformation precipitates in residual pores forming authigenic cements, eventually filling the pores completely. Physical and chemical compaction work synergistically, driving mudstones to become increasingly dense and hard [8,10]. Consequently, the clay fraction in shale needs to be divided into dry clay, hydroxyl groups and bound water, and clay interlayer pores. The shale inorganic pores, including clay interlayer pores, pyrite intercrystalline pores, bedding fractures, and micro-fractures, were observed using a Quanta 450 field-emission scanning electron microscope from FEI, the Netherlands (Figure 2a). Kerogen mainly consists of solid hydrocarbon compounds containing organic pores. These organic pores span a range of scales from nanometers to micrometers (Figure 2b), and kerogen is often associated with clay minerals (Figure 2c). Organic pores are generally considered oil-wet and contain adsorbed oil that is difficult to mobilize; thus, the kerogen fraction is divided into solid kerogen and organic pores.
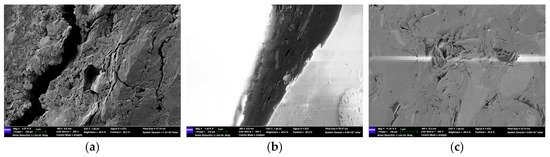
Figure 2.
Scanning electron microscope (SEM) images of shale. (a) Inorganic matrix pores; (b) Kerogen-hosted organic pores; (c) Organic-clay composite pores.
Argillaceous sandstone porosity models consider bound and movable fluids. In contrast, continental shales differ in that crystalline minerals like quartz and feldspar are clay-sized particles, clay content is high, and clays contain substantial hydroxyl groups and bound water. Furthermore, inorganic and organic pores contain both adsorbed and free fluids, characterizing the fluid occurrence state in continental shales. Shale pores are classified by pore diameter into micropores (<2 nm), mesopores (2–50 nm), and macropores (>50 nm). Previous shale porosity models were modeled based on bound water, bound fluids, organic pores, and movable fluids without considering the pore diameter of organic and inorganic pores and the occurrence state of shale oil [4]. Therefore, this study establishes a rock physics volume model for shale considering the shale framework (dry clay, crystalline minerals, kerogen) and fluid components (surface-adsorbed fluids, bound fluids, and free fluids) (Figure 3), where crystalline minerals include quartz, feldspar, calcite, and dolomite.
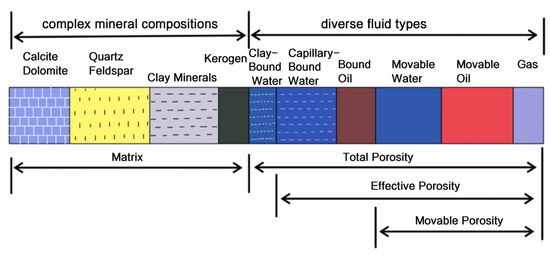
Figure 3.
Rock physics volume model of shale reservoir.
Crystalline minerals, clay, and kerogen in shale possess distinct density and neutron matrix values. Different literature sources provide varying density and neutron values for clay and kerogen, showing slight differences for specific study areas and target intervals [11,12].
2.2. Review of Shale Porosity Logging Evaluation
Compensation neutron logging utilizes an isotope neutron source (americium-beryllium source) to emit fast neutrons into the formation in the wellbore, then employs two thermal neutron detectors at different source distances (long and short). Since hydrogen atoms have the largest scattering cross-section for neutrons, elastic scattering between hydrogen atoms and neutrons significantly slows the neutrons, converting them to low-energy thermal neutrons. These thermal neutrons are detected and used to analyze hydrogen atom abundance, which is proportional to the number of scattered thermal neutrons received. In shale formations, hydrogen atoms are present not only in pore fluids (oil/water) but also in kerogen, clay minerals, and bound water. Consequently, kerogen, clay minerals, and bound water contribute to the compensated neutron log value. The neutron log reading in shale oil reservoirs is thus greater than the effective porosity and does not reflect the total porosity value.
Shale oil reservoirs are typically undercompacted and characterized by high formation pressure. This condition leads to an increase in the compressional wave (P-wave) slowness reading from acoustic logs. Therefore, when using P-wave slowness for porosity evaluation in shale oil reservoirs, formation pressure corrections must be applied. However, due to the inherently low porosity of shale reservoirs (usually less than 10%), this correction can introduce significant errors into the corrected acoustic log data. For this reason, this paper investigates the use of density logs and nuclear magnetic resonance (NMR) logs for porosity assessment.
Density logging is a porosity log that measures the intensity of gamma rays Compton-scattered by formation elements from a gamma source to investigate the density properties of the formation. Different elements (e.g., oxygen, silicon, calcium) in the rock scatter gamma rays with varying intensities; higher atomic number elements absorb gamma rays more strongly, resulting in higher measured density values. Using density logs to evaluate porosity in shale oil reservoirs requires determining the matrix mineral density values. However, unlike sandstone reservoirs, shale oil reservoirs include kerogen and clay minerals as part of the rock matrix. The key challenge lies in the variable amount of bound water associated with clay minerals, causing the matrix density values of clay minerals to change with differences in burial depth and compaction.
Nuclear magnetic resonance (NMR) logging involves polarizing the atomic nuclei (primarily hydrogen nuclei) of formation media using a magnetic field, followed by the application of pulsed high-frequency electromagnetic waves to induce resonance absorption. The energy released from the resonance absorption of the formation media is then measured to identify the pore spaces and occurrence states of hydrogen nuclei. This technique can distinguish hydrogen nuclei in different pore spaces, such as clay-bound water, capillary-bound water, and free water. Additionally, due to the differences in NMR characteristics of hydrogen nuclei in oil, gas, and water, fluid types can be identified. In contrast, neutron logging measures the hydrogen index of all hydrogen nuclei in the formation and cannot differentiate the occurrence states of fluids. In shale oil reservoirs, two-dimensional NMR (T1–T2) logging is typically applied with a minimum echo spacing (TE) of 0.2 ms, enabling the measurement of fluids in clay interlayer pores, organically adsorbed oil, and large organic/inorganic pores. However, it cannot detect signals from kerogen, clay-bound water, and hydroxyl groups.
In summary, among conventional logs, density logging is suitable for total porosity evaluation in shale oil reservoirs. Two-dimensional NMR logging not only evaluates porosity but also identifies the occurrence states of fluids in different pore spaces [12] (Figure 4).
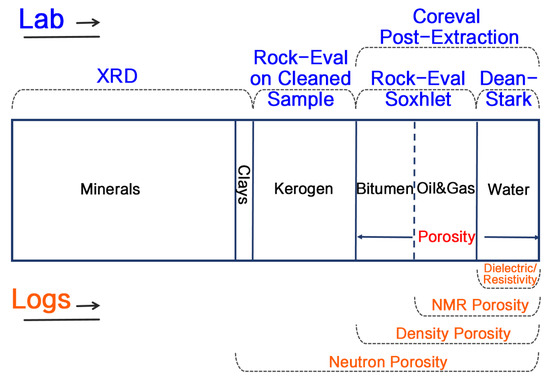
Figure 4.
Measurement ranges of Neutron, Density, and NMR logs in shale [6].
2.3. Shale Porosity Evaluation Method Using Density Logs
For the evaluation of shale porosity using density logs, the process begins by calculating the shale matrix using the crystalline mineral content and clay mineral content obtained from lithoscopic logging. Then, the dry weight organic carbon content derived from lithoscopic logging is converted into kerogen volume. Finally, a petrophysical volumetric model is applied to establish the density log response equation, thereby determining the shale porosity.
The measurement signals of lithoscopic logging are gamma rays induced by neutrons interacting with different elements in the formation. Through spectrum analysis and the oxygen closure technique, the dry-weight fractions of matrix elements are obtained. Based on this, an optimization program is used to derive the mineral content and the (dry-weight) total organic carbon content in the formation from the elemental concentrations.
The density matrix value of the inorganic matrix is calculated as follows:
where
represents the matrix density (g/cm3);
represents the number of crystalline mineral types;
represents the number of clay mineral types;
represents the mass percentage of the i-th crystalline mineral (%);
represents the mass percentage of the j-th clay mineral (%);
represents the density log matrix parameter for the i-th crystalline mineral (g/cm3);
represents the density log matrix parameter for the j-th clay mineral (g/cm3).
The conversion of total organic carbon (TOC) from weight percentage to kerogen volume is a critical step in the petrophysical evaluation of shale reservoirs, as it enables the accurate quantification of kerogen content required for logging analysis. The formula for converting TOC mass percentage to kerogen volume is [4]:
where
represents the kerogen density parameter (g/cm3);
k represents the conversion coefficient, k = 1.2;
represents the logged density value (g/cm3);
represents the kerogen volume content (%).
Since kerogen density increases with thermal maturity (Ro) and can be determined accordingly [6], and given the lack of locally derived kerogen volume parameters, a constant conversion factor (k = 1.2) was adopted from the literature [4].
Based on the shale petrophysical volumetric model (Figure 3), the shale is divided into inorganic mineral matrix, kerogen volume, and porosity, yielding the density log response equation:
where
represents the matrix density (g/cm3);
represents the logged density value (g/cm3);
represents the kerogen volume content (%);
represents the kerogen density parameter (g/cm3);
represents the complex fluid density parameter (g/cm3);
represents the porosity (%).
The study area is located in the Sichuan Basin, China, and targets the Lianggaoshan Formation. The organic-rich shale in the Lianggaoshan Formation is widely distributed, thick, highly mature, and possesses strong hydrocarbon generation capacity, indicating significant exploration potential (Figure 5). As burial depth increases, the matrix values of clay minerals increase due to compaction. If a constant matrix value is used for clay when calculating porosity from density logs, the low porosity values of shale may lead to significant errors in the derived porosity.
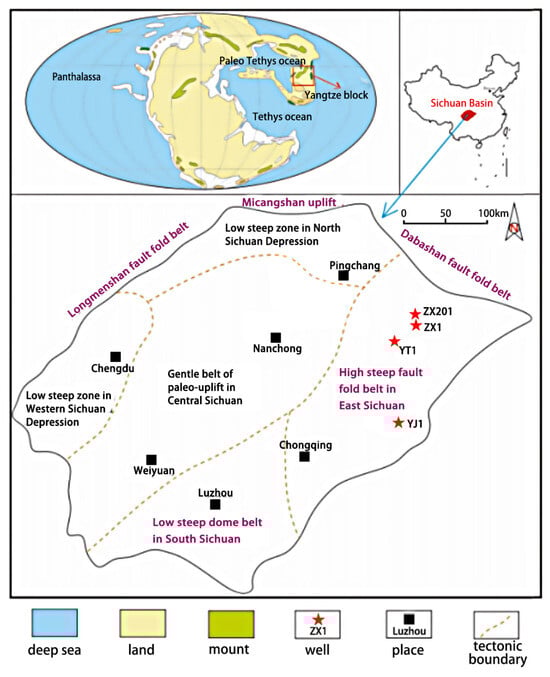
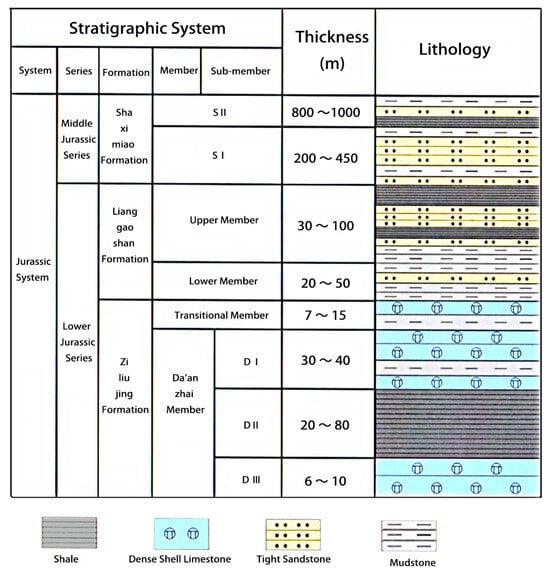
Figure 5.
Stratigraphic overview of the study area.
The entire rock system was treated as a multi-component mixture consisting of crystalline minerals, clay minerals, kerogen, and pores. First, the total organic carbon (TOC) was converted into kerogen content using Equation (2). Next, the shale porosity derived from core analysis was integrated with the weight fractions of crystalline and clay minerals obtained from lithology scanning logs, while the density log reading was used as the observed measurement. Subsequently, a constrained optimization algorithm was applied to Equation (3) to determine the matrix density of the clay minerals. Finally, the total shale porosity was calculated using Equation (5).
In addition to conventional logging, Well ZX1 was also logged with lithology scanning and 2D T1-T2 NMR (CMR-NG) tools. The cored interval spans 1885.5–1912.6 m. Porosity data were obtained from six plug samples using helium porosity measurements combined with 2D NMR (Table 1, where mineral contents are presented as weight percentages). The thermal maturity (Ro) of the Lianggaoshan Formation in this well is 1.19. Based on the thermal maturity–kerogen density model [6], the kerogen density was determined to be 1.339 g/cm3. Substituting TOC, log density, and kerogen density into Equation (2) yields the kerogen volume (Vker). Core analysis of shale from this interval provided 11 water saturation (Sw) measurements, ranging from 32.83% to 56.56%, with an average of 46.43%. In the target zone of this block, the oil density is 0.86 g/cm3 and the formation water density is 1.02 g/cm3. Using Equation (4), the average fluid density for the block is calculated as 0.9343 g/cm3. Substituting this value into Equation (3) allows the equation to be simplified as follows:

Table 1.
Mineral Weight Percentages from Lithoscopy Logging and Porosity-Related Parameters for Well ZX1.
The primary mechanism for the increase in clay mineral density with depth is diagenetic evolution, particularly the transformation of smectite to illite. During this process, exchangeable cations and significant amounts of adsorbed water are expelled from the interlayers of the smectite structure. Concurrently, elements such as silicon, aluminum, and potassium undergo reorganization to form illite, which exhibits higher density and greater structural stability. This mineralogical transformation results in a marked increase in the intrinsic density of the clay minerals.
The dominant clay minerals in the target interval of the study area are illite and chlorite. Their weight percentages can be derived from lithology scanning logs (Table 1). Since the matrix density of clay minerals is variable, it is necessary to determine the density matrix values for these two clay types. Although compaction occurs simultaneously, it primarily reduces the total rock volume and porosity, with limited contribution to altering the intrinsic density of the mineral crystals themselves. Therefore, the density matrix values of crystalline minerals remain essentially constant. The density values for different crystalline minerals are listed in Table 2.
Table 2.
Density Values of Different Crystalline Minerals.
The weight percentage of each crystalline mineral was obtained from lithology scanning logs, and its corresponding density matrix value is known. The total weight percentage of crystalline minerals in the rock was calculated by summing the weight percentages of individual minerals. Using Equation (7), the average density of the crystalline minerals was then determined (Table 3).
Table 3.
Parameters for Calculating Shale Porosity in Well ZX1.
The sum of the weight percentages of the clay minerals chlorite and illite from Table 1 was substituted into Equation (1) to calculate the average clay matrix density (ρcl), yielding values in the range of 2.812–2.941 g/cm3 (Table 3). Although Equation (8) can be used to determine the matrix density values of chlorite (ρchlorite) and illite (ρillite), both parameters remain unknown, resulting in a nonlinear optimization problem. Given that the matrix density values of chlorite and illite in the target interval of the study area are known to exceed 2.67 g/cm3, a constrained grid search method was employed to solve the problem.
The target interval of the study area, ranging from 1500 to 2500 m in depth, lies within the mesodiagenetic stage. The intrinsic mineral densities of illite and chlorite are not consistently distinct; their ranges overlap depending on chemical composition. Chlorite density is primarily controlled by the Fe/(Fe + Mg) ratio. Mg-rich chlorite exhibits densities close to or slightly below 2.67 g/cm3 (typically 2.65–2.70 g/cm3). In continental shales, pyrite formation during diagenesis favors the development of Fe-rich chlorite, whose density can rise significantly to 2.75–3.00 g/cm3; under normal (non-iron-enriched) conditions, chlorite density typically fluctuates between 2.67 and 2.75 g/cm3. Illite density is governed by crystallographic ordering and interlayer potassium occupancy. At these depths, smectite-to-illite transformation is active, and newly formed illite evolves from disordered to ordered stacking, resulting in a gradual density increase from about 2.75 g/cm3 to 2.82 g/cm3, commonly ranging from 2.75 to 2.82 g/cm3. Consequently, the two minerals share an overlapping density interval (e.g., 2.75–2.78 g/cm3).
The observed increase in clay-mineral density with depth mainly results from the reduction in interlayer porosity. Compaction and cementation decrease the total rock porosity, thereby raising the bulk density—this is not caused by a change in the intrinsic density of the minerals. Mineralogical transformations also contribute; for example, the conversion of smectite to denser illite or the development of chlorite coatings increases the volumetric proportion of higher-density phases, which likewise elevates the bulk density.
To address the parameter estimation problem for the nonlinear Equation (8), a constrained grid-search method was applied using six observational datasets. The multi-mineral rock model, when applied to a combination of well logs, allows the solution for the volumes of minerals and fluids in the formation [13]. Conventionally, default clay-matrix density values of ρchlorite = 2.67 g/cm3 and ρillite = 2.78 g/cm3 are used. However, because the goal here is to determine the matrix density values of clay minerals excluding interlayer pore fluids, the core objective is to identify the optimal parameter combination that minimizes the model-fitting error within the specified parameter range of 2.67–3.5 g/cm3 for both minerals, subject to the constraint (ρillite − ρchlorite) < 0.11 g/cm3.
Constraints are crucial for the solution. In the algorithm, the limitation on the separation between the matrix densities of illite and chlorite serves as the constraint condition. This constraint is directly enforced via conditional statements at each computational step, ensuring that only parameter combinations fully satisfying all conditions are evaluated and compared. Consequently, the optimization search is strictly confined to the feasible parameter space. The grid-search approach is intuitive and systematic. First, the continuous parameter range is discretized with a step size of 0.01, generating a grid that covers all possible ρillite and ρchlorite values. Subsequently, each point in the grid is traversed. For points that satisfy both the bound constraints and the relative constraint, the corresponding model predictions are computed and compared with observational data, yielding the five best-fitting solutions along with their errors (Figure 6).
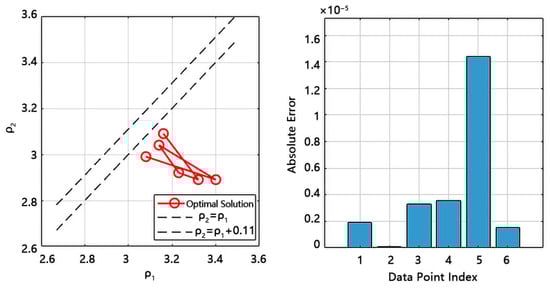
Figure 6.
Distribution of optimal ρ1 and ρ2 values and their absolute errors (ρ1 represents ρchlorite; ρ2 represents ρillite).
This algorithm offers several advantages. First, it guarantees global optimality within the discretized space, avoiding the risk of local minima inherent in gradient-based methods. Second, the logic is transparent and easy to verify, providing stable and reliable computations. Third, constraints are handled directly and flexibly, clearly illustrating how they shape the feasible solution space. Furthermore, the method yields rich information beyond a single optimum, such as the error topography over the entire parameter space, ranking of sub-optimal solutions, and quantitative analysis of how constraint strictness affects the results—all of which support a deeper understanding of the problem and robust decision-making.
Five sets of dry-clay matrix parameter combinations were obtained, with a maximum absolute error of 1.4 × 10⁻⁵, mean absolute error of 4.0 × 10⁻⁶, and root-mean-square error (RMSE) of 6.0 × 10⁻⁶. All five sets are of acceptable quality. Based on the diagenetic trends of chlorite and illite described above, the parameter pair ρchlorite = 3.32 g/cm3 and ρillite = 2.89 g/cm3 was selected and substituted into Equation (5) to compute porosity using the variable-matrix-density approach.
2.4. NMR Logging Evaluation Method
Using two-dimensional NMR spectra, a unique “fingerprint” for each fluid type (oil and water) can be “translated”, enabling efficient and accurate separation of fluid properties [14]. The 2D NMR tool used in this study area was the CMR-NG, operating at a frequency of 2MHz with an echo spacing (TE) of 0.2 ms. To determine the fluid component distribution from downhole 2D NMR measurements, 2D NMR spectra from original samples measured in the laboratory at 2MHz with TE = 0.1 ms and TE = 0.2 ms were compared. It was observed that signals from kerogen, hydroxyl groups, and bound water (T2 ≤ 0.1 ms) were detectable at TE = 0.1 ms but not at TE = 0.2 ms (Figure 7a,b). Differences exist between logging and laboratory NMR measurements. The CMR log has a relatively shallow depth of investigation (approximately 3 cm), making it susceptible to poor borehole conditions. The influence of a poor borehole is significant, as the log can detect borehole mud with very high amplitude and relaxation times concentrated around 500 ms, preventing the log signal from achieving laboratory conditions (Figure 7c).
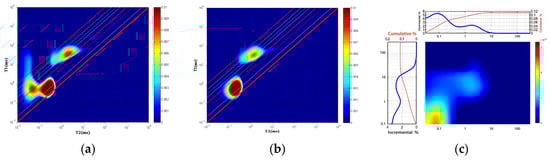
Figure 7.
Comparison of laboratory and downhole 2D NMR measurements. (a) Shale Core 2D NMR (Te = 0.1 ms); (b) Shale Core 2D NMR (Te = 0.2 ms); (c) 2D NMR Log of Shale Formation.
Nuclear magnetic resonance (NMR) logging can finely characterize the pore structure and fluid occurrence states in shale reservoirs by measuring the transverse relaxation time (T2) distribution of hydrogen nuclei in the formation. The core principle is that hydrogen nuclei in pores are subject to the combined effects of surface relaxation, diffusion relaxation, and bulk relaxation, with distinct relaxation characteristics for fluids in pores of different sizes.
In micropores (<2 nm), fluids are strongly bound by the pore surfaces and dominated by surface relaxation, resulting in short T2 values (T2 < 1 ms), which correspond to adsorbed fluids (such as interlayer water in clay or oil adsorbed by organic matter). In mesopores (2–50 nm), fluids are primarily capillary-bound, exhibiting moderate T2 values (T2: 1–10 ms) and relatively poor mobility. In macropores (>50 nm), fluids approach a free state, the influence of diffusion relaxation diminishes, and T2 values are longer (T2 > 10 ms), indicating predominantly free fluids with high mobility.
3. Shale Porosity Logging Evaluation
Based on the established logging evaluation method for shale oil reservoir porosity described above, conventional logging data and lithoscopic logging data from the target formation in the study area were utilized to calculate the total porosity. The results were then compared with the porosity curve derived from two-dimensional nuclear magnetic resonance (2D NMR) logging processing, ultimately forming a comprehensive logging evaluation results chart (Figure 8). The tracks are as follows: Track 1: Gamma Ray (GR), Uranium-free Gamma Ray (SGR), Caliper; Track 2: Density, Matrix Density, Compensated Neutron, Acoustic Slowness (Δtc); Track 3: Uranium (U), Thorium (Th), Potassium (K); Track 4: Deep Laterolog Resistivity (LLD), Shallow Laterolog Resistivity (LLS); Track 5: Lithology; Track 6: Mineral Volume Curves; Track 7: NMR Fluid Component Curves; Track 8: Dry-weight TOC curve from Lithology Scanning Log; Track 9 displays the NMR porosity curve (POR_NMR), the porosity curve from the variable-matrix-density method (POR), the porosity curve from the fixed-matrix-density method (POR1), and the core-analysis porosity (POR_CORE) values.
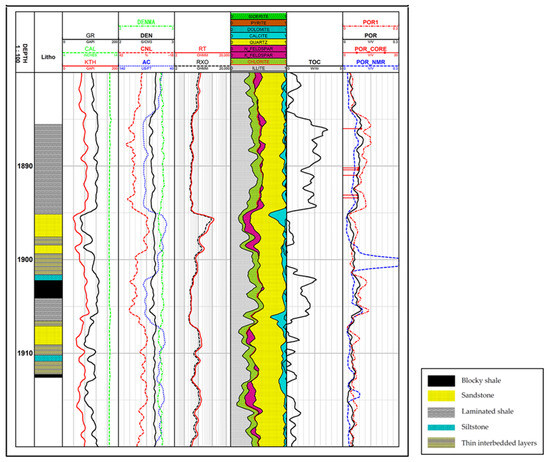
Figure 8.
Porosity calculation results for Well ZX1.
Applying the above research method, the calculated matrix density values for Well ZX1 range from 2.701 to 2.820 g/cm3, with an average of 2.767 g/cm3—significantly higher than the matrix density of quartz (2.65 g/cm3) (Figure 9a). Among these, the matrix density of sandstone intervals ranges from 2.668 to 2.771 g/cm3, averaging 2.712 g/cm3 (Figure 9b), while that of laminated shale ranges from 2.727 to 2.820 g/cm3, averaging 2.787 g/cm3 (Figure 9c). The average matrix density of laminated shale is 0.075 g/cm3 higher than that of sandstone. Variations in mineral composition within the thick laminated shale section (1884.3–1895.1 m) lead to corresponding changes in matrix density, indicating that laminated shale also exhibits certain heterogeneity (Figure 8).
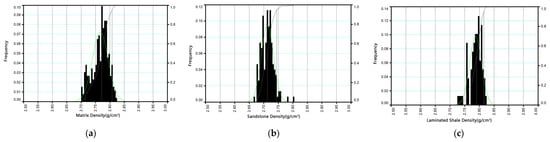
Figure 9.
Histograms of matrix density, sandstone density, and laminated shale density in Well ZX1. (a) Whole-Interval Bulk Density Distribution; (b) Sandstone Bulk Density Distribution; (c) Laminated Shale Bulk Density Distribution.
A comparative analysis of the errors between the three porosity calculation methods and core porosity was conducted. The variable-matrix method (Por) shows the closest agreement with core porosity (por_core), with a mean absolute error of only 0.4 pu (porosity unit), indicating the highest accuracy. The fixed-matrix method (Por1) yields the largest mean absolute error of 2.95 pu and systematically overestimates porosity. The NMR-based method (NMR) has an intermediate mean absolute error of 2.18 pu, but consistently and significantly underestimates porosity, which is attributable to its measurement principle as explained earlier. These results demonstrate that the variable-matrix density-log approach provides more reliable porosity estimates in this formation and meets the required accuracy for porosity evaluation in terms of absolute error (Figure 10, Table 4).
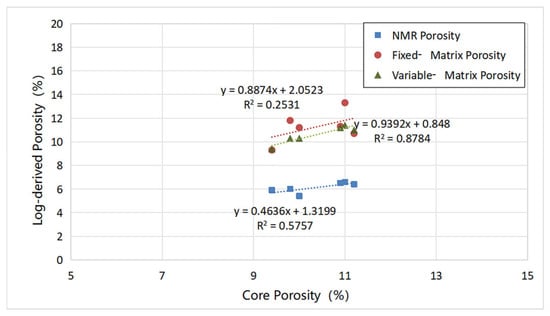
Figure 10.
Cross-plot of core porosity versus log-derived porosity.
Table 4.
Table of comparison errors between log-derived porosity and core porosity.
In terms of scatter distribution, the data points from the variable-matrix method align most closely with the 1:1 line, whereas points from the fixed-matrix method deviate noticeably and lie predominantly above the diagonal, confirming the systematic overestimation trend. Therefore, parameter optimization through the variable-matrix approach effectively reduces bias in shale porosity calculation compared to the fixed-matrix model.
Zhao Xiaoqing et al. suggested that shale consists of non-conductive components (e.g., quartz, feldspar) and conductive components (e.g., clay, pyrite, and pore fluids) [15]. Kethireddy et al. verified that the influence of bitumen (kerogen) on the resistivity of organic-rich source rocks cannot be neglected [16]. For the reservoirs corresponding to the 2D NMR measurement points a–c in Figure 11 (interval 1884.3–1895.1 m), which are composed of laminated shale, the resistivity difference between the upper and lower sections is jointly determined by clay content and bitumen volume. NMR logging indicates higher bitumen content in the lower part. Analysis of the single-point 2D NMR spectra shows that the upper points (a–d) have low bitumen content and high movable-fluid volume, while the lower point (d) exhibits high bitumen content and low movable-fluid volume, causing the resistivity to drop from about 40 Ω·m to 30 Ω·m. Because NMR logging does not fully capture signals from bitumen and kerogen, the porosity derived from density logs is significantly higher than that from NMR logs, and the porosity calculated using the fixed-matrix method is even larger, markedly exceeding the core-analysis values. Overall, this reservoir interval is thick, exhibits high porosity and abundant movable fluid, and is classified as a high-quality reservoir. The reservoir at 2D NMR point e (interval 1902.2–1904.0 m) consists of massive shale, with high bitumen content and poor fluid mobility, resulting in lower reservoir quality. The reservoir at point f (interval 1904.0–1906.2 m) is also laminated shale with high movable-fluid content, but its thin thickness makes it inferior in quality to the first reservoir.
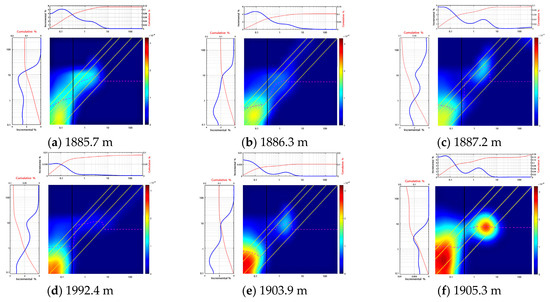
Figure 11.
Two-dimensional NMR logging results for Well ZX1.
4. Conclusions
This study systematically addresses the challenges of porosity evaluation for continental shale in the Lianggaoshan Formation of the Sichuan Basin, yielding the following key conclusions:
(1) Based on the geological reality that continental shale exhibits complex mineralogy and that clay-matrix density varies dynamically with burial compaction and diagenesis (e.g., smectite-to-illite transformation), a “variable-matrix-parameter” petrophysical volumetric model and interpretation workflow were established using lithology-scanning logs. The method dynamically converts mineral mass fractions into volume fractions and quantifies the depth-dependent evolution of rock matrix density, thereby aligning the log interpretation model with actual geological processes.
(2) Applied to the Lianggaoshan shale, the variable-matrix method yields porosity values that best match core-analysis results, significantly reducing the mean absolute error (from about 2.95 PU with the fixed-matrix method to about 0.4 PU). This performance is notably superior to both the fixed-matrix approach and NMR-derived porosity. The study clarifies that the fixed-matrix method systematically overestimates porosity, while 2D NMR logging tends to underestimate total porosity due to inherent measurement limitations (incomplete detection of clay-bound water and kerogen-associated hydrogen signals).
(3) The proposed method represents not only a mathematical inversion model but also achieves quantitative coupling between log responses and key diagenetic processes (compaction, clay-mineral transformation). It provides a reliable new solution for evaluating continental shale reservoirs with medium-to-high maturity and substantial depth variations, offering good potential for broader application. Future work may integrate regional geothermal history and diagenetic sequences to further constrain the model mechanistically and promote its refined application under analogous geological conditions.
In summary, by developing a “dynamic” log-interpretation model, this study effectively resolves a key technical bottleneck in porosity evaluation for continental shale. The conclusions offer significant value in terms of methodology, practical application, and technical insight.
Author Contributions
Conceptualization, B.X.; Methodology, X.Z.; Investigation, X.Z.; Writing—original draft, L.B. and Y.G.; Writing—review and editing, X.H.; Supervision, L.B.; Resources, Y.W.; Data Curation, Y.W.; Visualization, Y.L.; Funding acquisition, Y.L. All authors have read and agreed to the published version of the manuscript.
Funding
This research was funded by Heilongjiang Provincial Natural Science Foundation Project, grant number LH2024G011 (Nuclear Magnetic Resonance Evaluation of Recovery Degree of Continental Shale Oil Reservoirs: A Case Study of the GuLong Shale in Daqing).
Data Availability Statement
The original contributions presented in this study are included in the article. Further inquiries can be directed to the corresponding authors.
Conflicts of Interest
Authors Bing Xie, Li Bai, Xuquan He, Yuexiang Wang and Yan Lv were employed by Research Institute of Exploration and Development, Southwest Oil and Gas Company, Chengdu, China. The remaining authors declare that the research was conducted in the absence of any commercial or financial relationships that could be construed as a potential conflict of interest.
References
- Chew, K.J. The future of oil: Unconventional fossil fuels. Philos. Trans. R. Soc. A 2014, 372, 20120324. [Google Scholar] [CrossRef] [PubMed]
- Mehrabi, K.; Jafari, A. Pyrolysis of Oils from Unconventional Resources. Energies 2023, 16, 3455. [Google Scholar] [CrossRef]
- Vengosh, A.; Jackson, R.B. (Eds.) Environmental Impacts from the Development of Unconventional Oil and Gas Reserves; Cambridge University Press: Cambridge, UK, 2022. [Google Scholar] [CrossRef]
- Sondergeld, C.H.; Newsham, K.E.; Comisky, J.T.; Rice, M.C.; Rai, C.S. Petrophysical considerations in evaluating and producing shale gas resources. In Proceedings of the SPE Unconventional Gas Conference, Pittsburgh, PA, USA, 23–25 February 2010; pp. 1–12. [Google Scholar] [CrossRef]
- Ramirez, T.R.; Klein, J.D.; Bonnie, R.J.; Howard, J.J. Comparative study of formation evaluation methods for unconventional shale gas reservoirs: Application to the Haynesville Shale (Texas). In Proceedings of the SPE North American Unconventional Gas Conference and Exhibition, The Woodlands, TX, USA, 14–16 June 2011. [Google Scholar] [CrossRef]
- Alfred, D.; Vernik, L. A new petrophysical model for organic shales. In Proceedings of the SPWLA 53rd Annual Logging Symposium, Cartagena, Colombia, 16–20 June 2012; pp. 1–15. [Google Scholar]
- Piedrahita, J.A.; Aguilera, R. Models for calculating organic and inorganic porosities in shale oil reservoirs. In Proceedings of the SPE Latin America and Caribbean Petroleum Engineering Conference, Buenos Aires, Argentina, 17–19 May 2017. [Google Scholar] [CrossRef]
- Foscolos, A.E. Diagenesis 7. Catagenesis of argillaceous sedimentary rocks. Geosci. Can. 1984, 11, 67–86. [Google Scholar]
- Rieder, M.; Cavazzini, G.; D’yakonov, Y.S.; Frank-Kamenetskii, V.A.; Gottardi, G.; Guggenheim, S.; Koval’, P.V.; Müller, G.; Neiva, A.M.R.; Radoslovich, E.W.; et al. Nomenclature of micas. Can. Mineral. 1998, 36, 905–912. [Google Scholar] [CrossRef]
- Xian, Y. Transformation of clay minerals and its impact on shale reservoirs. Acta Geol. Sichuan 2019, 39, 244–247. [Google Scholar] [CrossRef]
- Zhang, C.; Wang, X.; Zhu, L. Estimation of total porosity in shale formations from element capture logging and conventional logging data. Arab. J. Geosci. 2018, 11, 261. [Google Scholar] [CrossRef]
- Rick, L.; Ingraham, D. New Evaluation Techniques for Gas Shale Reservoirs. In Proceedings of the Schlumberger Reservoir Symposium, Houston, TX, USA, 21–22 June 2004. [Google Scholar]
- Saffari, M.; Kianoush, P. Integrated petrophysical evaluation of Sarvak, Gadvan, and Fahliyan formations in the Zagros Area: Insights into reservoir characterization and hydrocarbon potential. J. Pet. Explor. Prod. Technol. 2025, 15, 54. [Google Scholar] [CrossRef]
- Wang, J.; Lu, S.; Zhang, P.; Li, Q.; Yin, Y.; Li, W.; Zhou, N.; Chen, G.; Yi, Y.; Wu, C. Characterization of shale oil and water micro-occurrence based on a novel method for fluid identification by NMR T2 spectrum. Fuel 2024, 374, 132426. [Google Scholar] [CrossRef]
- Zhao, X.; Jin, Y.; Yu, X.; Peng, G.; Yan, X. Shale conductivity model based on two-dimensional nuclear magnetic resonance pore fluid distribution. Well Logging Technol. 2023, 47, 29–35. [Google Scholar] [CrossRef]
- Firdaus, G.; Heidari, Z. Quantifying Electrical Resistivity of Isolated Kerogen from Organic-Rich Mudrocks using Laboratory Experiments. In Proceedings of the SPE Annual Technical Conference and Exhibition, Houston, TX, USA, 28–30 September 2015. [Google Scholar] [CrossRef]


Disclaimer/Publisher’s Note: The statements, opinions and data contained in all publications are solely those of the individual author(s) and contributor(s) and not of MDPI and/or the editor(s). MDPI and/or the editor(s) disclaim responsibility for any injury to people or property resulting from any ideas, methods, instructions or products referred to in the content. |
© 2025 by the authors. Licensee MDPI, Basel, Switzerland. This article is an open access article distributed under the terms and conditions of the Creative Commons Attribution (CC BY) license (https://creativecommons.org/licenses/by/4.0/).