Abstract
The problem of global climate change is becoming increasingly serious, drawing worldwide attention to the need for carbon emissions reduction. As a primary mode of transport, maritime shipping accounts for 2% of global carbon emissions. Therefore, researchers have turned their attention to marine carbon emissions. Specifically, lifecycle assessment (LCA) has attracted wide attention due to its comprehensiveness and objectivity. This article reviews alternate fuels like biodiesel, liquefied natural gas (LNG), methanol, ammonia, and hydrogen. These fuels generate fewer Tank-to-Wake (TTW) carbon emissions than conventional diesel but higher emissions in the Well-to-Tank (WTT) stage owing to production-related emissions, resulting in varying overall carbon footprints. Most carbon emissions in marine transportation come from fuel consumption. Selecting the shortest route can cut fuel use and emissions. Port greening and electrification are vital for emission cuts. Current marine LCA research exhibits key gaps, including fragmented case studies, a lack of methodological standardization, and insufficient dynamic predictive capacity, severely constraining its guiding value for industry decarbonization pathways. This study systematically reviews and categorizes marine LCA research from the past decade in both Chinese and English from the Web of Science and CNKI databases through a Ship-Route-Port framework. Specifically, 34 papers underwent quantitative or qualitative analysis, comprehensively comparing the full lifecycles of six mainstream marine alternative fuels: biodiesel, LNG, methanol, ammonia, hydrogen, and electricity. This study also underscores the need for unified standards to boost low-carbon fuel use and explores the unique challenges and uncertainties involved in applying LCA to the marine sector. LCA applied to the maritime sector shows promise as a valuable tool for guiding low-carbon transition strategies.
1. Introduction
The Earth is experiencing major warming-related climate shifts, and the various disasters events brought about by climate change have caused enormous losses and damage to people’s lives and property around the world [1]. Therefore, governments have elevated climate action to the highest national strategic priority. They are vigorously mitigating and adapting to climate change. Measures include setting carbon neutrality targets and promoting clean energy transition. The international community is also strengthening cooperation under the Paris Agreement and substantially scaling up Green Climate Fund investment. Countries are sharing responsibilities collectively to address this common crisis of human sustainability.
The greenhouse gas (GHG) emissions caused by human social production and life are the leading cause of global warming. Figure 1 shows that China, the United States, and India account for over 40% of global carbon emissions, with 25.1%, 11.4%, and 7.4%, respectively. The EU accounts for 6.3%, Russia for 5%, Brazil for 4.6%, and Japan for 2%, making these the main carbon-emitting countries. However, developed nations like Australia, Canada, Australia, and Britain make up relatively low percentages, with 1.5%, 1.1%, and 0.8%, respectively. Figure 2 shows the GHG emissions and per capita emissions of significant countries in 2022. The unit of GHG emissions in the figure is billions of tons, and the unit of per capita GHG emissions is tons per person. These diagrams illustrate that countries worldwide generate billions of tons of GHG emissions. Although China is the largest emitter of GHGs, its per capita carbon emissions are nearly half of those of America. Furthermore, developed countries such as Canada and Australia are the largest emitters of GHG emissions per capita in the world. Carbon emissions are a common global environmental problem, and solving this issue requires joint efforts from the entire world.
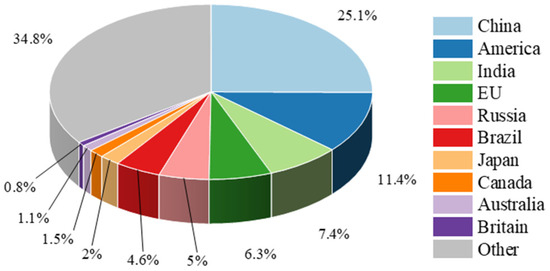
Figure 1.
Proportions of GHG emissions in 2022. The data comes from Reference [2].
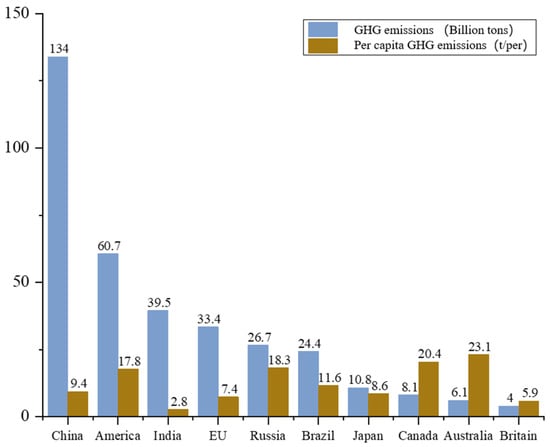
Figure 2.
GHG emissions and per capita GHG emissions in 2022. Note: Measured as CO2 equivalent (CO2-eq). Non-CO2 GHGs are converted to CO2 equivalents by multiplying their emission quantities by the respective GWP values. The data comes from Reference [2].
With climate change gaining urgency, global cooperation to combat it is accelerating [3]. To address climate concern, the United Nations Framework Convention on Climate Change (UNFCCC) was signed in 1992. The UNFCCC aims to keep GHG levels within a range that stops human disruption of the climate system [4]. In 1997, the Kyoto Protocol was passed to strengthen the implementation of the convention. It explicitly designates CO2, CH4, N2O, HFCS, PFCS, and SF6 as controlled global GHGs. It also encourages developed countries to transfer low-carbon energy and carbon reduction technologies to developing countries to obtain carbon reduction quotas and achieve their emission reduction goals and commitments [5]. The Paris Agreement established an international framework for climate action post-2020, ushering in a new era of global climate response [6]. The UNFCC process in details are shown in Table 1 [7].

Table 1.
UNFCCC process.
As a significant carbon emitter and environmental protection country, the Chinese government set the goal of peaking carbon emissions by 2030 and achieving carbon neutrality by 2060. Figure 3 presents 2021 CO2 emissions across 30 Chinese provinces, with data from the Carbon Emission Accounts and Datasets (CEADs). Among all provinces in China, Shandong, Hebei, Jiangsu, Shanxi, and Guangdong account for as much as 32.5% of all emissions. Shandong has remained the top emitting province since 2003, representing about 9% of China’s total emissions as of 2021. Shandong and Hebei provinces have a relatively high concentration of heavy industry, with industries such as steel, building materials, petrochemicals, and electricity leading to high GHG emissions. As strong economic provinces in China, the economic level and developed industries of Jiangsu and Guangdong provinces are the reasons for their high carbon emissions. Shanxi province is a vital resource-rich province and energy base in China, and its energy extraction and conversion can generate a large amount of carbon emissions. If the above-mentioned advanced provinces can peak as soon as possible and list clear timelines and action plans in the 14th Five-Year Plan for local and specific industries, it will significantly contribute to achieving China’s Dual Carbon Strategy and mitigating global climate change.
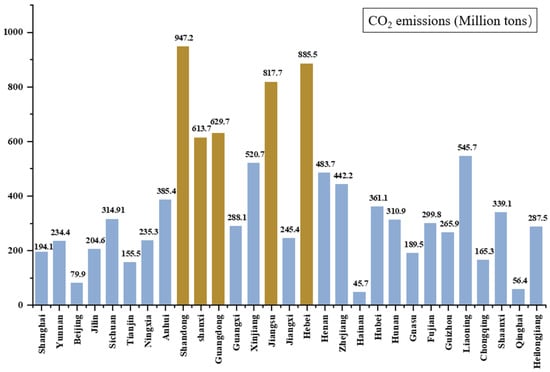
Figure 3.
CO2 emissions of 30 provinces in China, 2021 (Million tons). (Brown bars indicate the top five provinces in terms of CO2 emissions; blue bars indicate all other provinces). The data comes from the CEADs.
Oceans cover about 71% of the Earth’s surface, with coastal states claiming vast exclusive economic zones. International shipping accounts for over 85% of the world’s international trade transportation volume [8]. The International Maritime Organization (IMO) defined the “2023 IMO Strategy on Reduction of GHG Emissions from Ships”. The strategy points out that by 2030, the carbon dioxide emissions per unit of international shipping volume should be reduced by at least 40% compared to 2008, and the long-term goal of carbon neutrality should be achieved by 2050 [9]. Hence, quantifying oceanic carbon emissions becomes essential.
Governments and various sectors of society are paying increasing attention. Environmental legislation is gradually improving, and related research is deepening. People have begun to study the environmental issues of products throughout their entire lifecycle, as well as how to avoid and reduce environmental pollution in product design. Among these approaches, LCA is the most prominent and extensively applied method in current research. [10]. The concept of LCA was first brought up in the late 1960s, but the LCA method began to be widely promoted and applied in the late 1980s [11].
Driven by sustained policy backing, technological breakthroughs, and expanding market adoption, quantifying oceanic carbon footprints is gaining traction [12]. As methodologies advance and market demand grows, LCA is poised to become a cornerstone of global marine decarbonization efforts.
This study conducts a systematic literature review to assess the implications of applying LCA in marine environments. It also focuses on the marine carbon footprint, an approach that is extensively used in the maritime sector, and reviews the carbon footprint of different shipping routes and ports. The reviewed studies classify fuels based on their types, particularly alternative fuels, and analyze their carbon footprint.
2. Technology Introduction
2.1. Greenhouse Gas
Mitchell et al. [13] found that GHGs in the atmosphere can strongly absorb long-wave radiation from the Earth and emit more prolonged wavelength radiation towards the surface, providing insulation. Currently, the GHGs calculated by various countries mainly include the six GHGs specified in the Kyoto Protocol and the newly added NF3 in the Doha Amendment. The most internationally recognized among them are CO2, CH4, and N2O. Figure 4 shows the 2018–2022 proportions of primary GHG emissions. It shows that although CO2 is the largest source, CH4 and N2O are also driving factors of global warming. The proportions of GHG emissions have tended to stabilize.
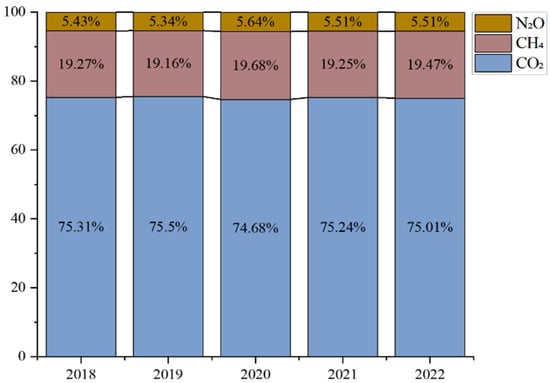
Figure 4.
Proportions of main GHG emissions, 2018–2022. Note: Measured in CO2-eq. The data comes from Reference [2].
In the context of global warming, increases in GHG content in the atmospheric environment will significantly impact surface energy balance and the global climate. Liu et al. [14] noted that due to the different radiation characteristics of each GHG, there are specific differences in the strength of the warming effect produced by the same quality of different categories of GHGs. In 1995, the Intergovernmental Panel on Climate Change (IPCC) stated in outcome statements that GHGs other than carbon dioxide should be converted into carbon dioxide equivalents based on their 100-year Global Warming Potential (GWP) and provided a specific calculation method [15]. Ma [16] noted that, although the emissions of GHGs such as CH4, N2O, and SF6 are much lower than CO2, their potential to cause greenhouse effects is much greater than that of CO2 at the same mass. The GWP of common GHGs is given in the sixth assessment report of the IPCC, as shown in Table 2 [8]. It can be seen that the GWP of CH4 is 28 times higher than that of CO2, while N2O has a GWP that is 273 times higher than that of CO2.
Table 2.
The GWP of common GHGs given is in the sixth assessment report of IPCC. Note: Values are based on 100 years.
2.2. Green Marine Fuel
Ding et al. [17] stated that, as international organizations and governments worldwide have continuously raised higher requirements for low-carbon environmental standards, marine fuel power has gradually developed towards a trend of cleanliness, low carbonization, zero carbonization, and diversification. Xu et al. [18] stated that the landscape of marine alternative fuels is structured around three categories. Biodiesel, derived from animal fats and vegetable oils, stands out for its high cetane rating and near-zero sulfur content. Low-carbon options, such as LNG and methanol, deliver substantial emissions reductions compared to conventional fuels. At the forefront are zero-carbon solutions, such as ammonia and hydrogen, which offer complete lifecycle decarbonization, positioning them as the ultimate clean energy pathways for sustainable maritime operations.
There has been a shift in vessels from dependence on heavy fuel oil to the utilization of alternative clean fuels. As this is not the main focus of the paper, only a brief introduction to several alternative fuels is provided. Table 3 shows the characteristics of five alternative fuels [19,20,21,22,23,24,25,26,27,28]. The technology of biodiesel is well-developed, but its price and output cannot meet the demands of the marine industry. LNG has high energy but a high price. Methanol has excellent characteristics, but its technology is still not perfect. Ammonia and hydrogen, as zero-carbon fuels, have no carbon emissions after combustion, but their preparation and transportation costs are very high. In recent years, marine fuels were mainly made from traditional fossil fuels. Nowadays, LNG and biodiesel are suitable transitional energy sources for reducing carbon emissions. As mature low-carbon energy types in the industry chain, they have relatively controllable costs, relatively complete refueling infrastructure, and certain emission reduction capabilities, making them more suitable for short-term carbon reduction tasks. Chen [29] reported that green methanol and green ammonia have greater advantages in the medium to long term, while ammonia as a zero-carbon fuel has a broader long-term prospect. In the near future, the production of green methanol may face bottlenecks, making it difficult to support the huge demand of the shipping industry alone. Walker et al. [30] stated that the utilization of hydrogen energy is an inevitable trend for global sustainable development in the future.
Table 3.
Characteristics of five alternative fuels.
2.3. Carbon Emission
2.3.1. Definition of Carbon Emissions and Carbon Footprint
Academic consensus holds that carbon emissions (CEs) are the total carbon dioxide emitted into the atmosphere due to human activities or natural processes during a certain time and space [31]. Chen [7] stated in his article that carbon emissions are divided into direct and indirect emissions. Direct emissions are defined as carbon dioxide emissions coming directly from burned fossil fuels, biomass, or industrial processes. Indirect emissions are carbon dioxide emissions created indirectly due to the usage of energy services such as electricity, heat, and steam. To better quantify carbon emissions, William Rees introduced the “ecological footprint” concept in 1992 [32]. In 2013, the ISO formally defined the carbon footprint as the total CO2 emissions attributable to an individual, organization, product, or nation during a specified timeframe, encompassing both direct and indirect sources. The carbon footprint standards provide a framework for categorizing emissions as either direct or indirect, offering a systematic approach to disaggregate supply-chain carbon impacts [33]. As shown in Figure 5, carbon emissions are divided into three parts. Scope 1 includes direct carbon emissions from sources of GHGs, such as direct combustion of fuels, LNG leakage, and the production process of quicklime. Scope 2 includes indirect carbon emissions from energy sources in facilities that generate electricity, steam, and cooling or heating. Scope 3 also includes indirect carbon emissions, covering the energy lost across the raw-material and sales chains. Zhou [33] noted that carbon footprint standards classify emissions into “direct” and “indirect” categories, offering a unified framework for systematically disaggregating carbon impacts across the supply chain.
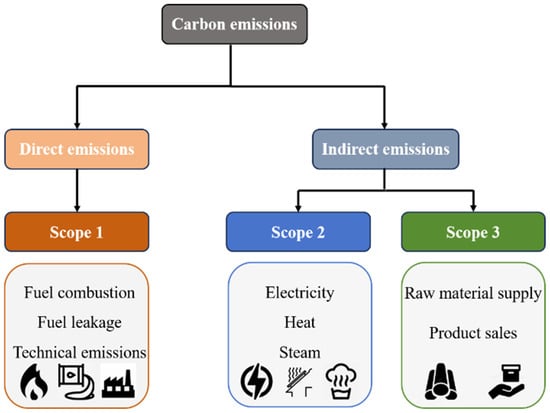
Figure 5.
Infographic presenting three scopes of direct and indirect emissions.
2.3.2. Accounting Methods
In Ma’s [16] book, she further noted that “carbon emissions” are not limited to carbon dioxide alone but encompass all GHG emissions. There are four calculation methods for carbon accounting, as shown in Figure 6, which can be divided into two types, calculation methods and monitoring methods. The calculation methods include the emission factor method and the mass balance method. The monitoring methods include the continuous emission monitoring system (CEMS) and the atmospheric concentration monitoring and emission inversion method. The emission factor method, the mass balance method, and the CEMS calculate carbon emissions from the source of emissions, also known as the bottom-up approach. The atmospheric inversion method calculates carbon emissions from the atmosphere and is a top-down approach. The characteristics and applicable objects of the four accounting methods are shown in Table 4.
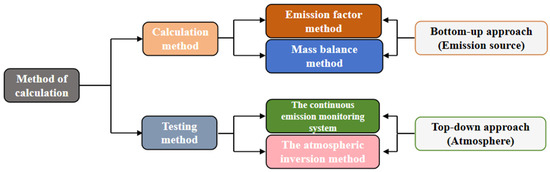
Figure 6.
Carbon accounting method.
Table 4.
Characteristics and applicable objects of the four accounting methods.
The emission factor method, developed by the IPCC of the United Nations, serves as a globally recognized approach for estimating GHG emissions. Its methodology hinges on multiplying activity data (AD), which represents the scale of human activities, by the corresponding emission factors (EFs), which quantify emissions or removals per unit of activity, thereby deriving total GHG outputs [16]. Specifically it is expressed as
CE = AD × EF
Dong et al. [34] stated that the mass-balance method quantifies the number of materials used in the production process in accordance with the law of conservation of mass.
The CEMS is a technique for sensing GHG flow and concentration at the GHG emission outlet or component connection outlet and automatically computing the carbon emissions using monitoring equipment. The atmospheric inversion method is based on atmospheric GHG concentration monitoring data, combined with atmospheric chemical transport models and assimilation inversion operations, to calculate carbon emissions and absorption [16]. Both methods directly measure the concentration of GHGs to detect carbon emissions.
2.4. Lifecycle and LCA
2.4.1. Marine Lifecycle
For the purpose of calculating emissions of an object and conducting research on it, it is necessary to study the entire lifecycle of the object. The lifecycle refers to the entire process of an object from its creation to its disposal. As a large and complex product, the marine lifecycle was divided by Mei [35] into the phases shown in Figure 7: process design, shipyard construction, offshore operations, shipyard maintenance, and dismantling and recycling. As shown in Figure 8, Fan et al. [36] divided the marine lifecycle into four parts: marine production and manufacturing, marine fuel transportation, marine operation, and marine scrapping and recycling. Both classification approaches effectively capture the complete marine lifecycle.
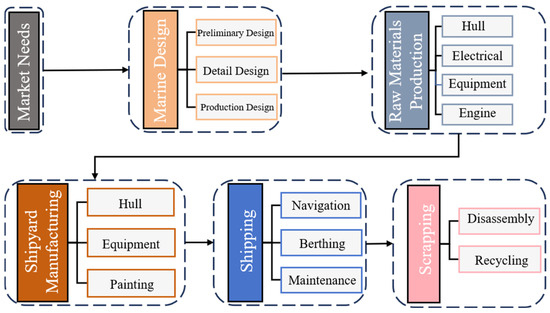
Figure 7.
Marine lifecycle process.
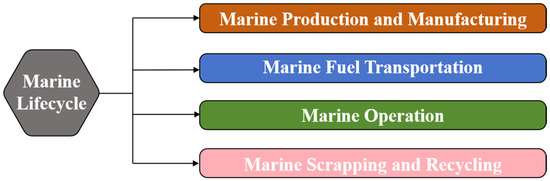
Figure 8.
The marine lifecycle mainly consists of four parts.
To simplify their study, Xu et al. [37] focused solely on the marine power system and divided its lifecycle into three stages: Engine Manufacturing (EM), WTT, and TTW, as shown in Figure 9. Nguyen et al. [38] showed that the WTT, also known as upstream, depicts the life phases that occur between the extraction of raw materials, fuel processing, and the supply chain to their ultimate arrival onboard. Fan et al. [39] reported that the TTW, also known as downstream, mainly includes carbon emissions generated during marine operations.
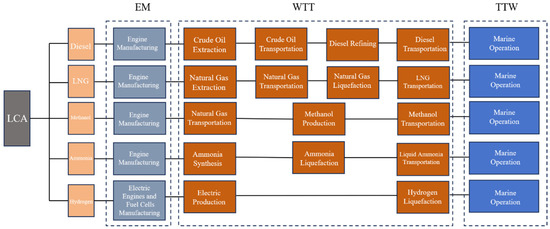
Figure 9.
LCA for marine alternative fuel power systems. The figure was sourced from Reference [40].
Ait et al. [41] found that carbon emissions stem from the use of high-carbon fuels during maritime navigation. Fan et al. [39] similarly emphasized that marine carbon footprints arise not only from operation but also from construction, fuel production and transportation, fuel consumption, and eventual dismantling and recycling. Therefore, marine carbon emissions cannot be considered solely from the perspective of maritime navigation. Carbon emissions from marine fuel production and delivery cannot be overlooked.
2.4.2. LCA
In 1997, the ISO established the four fundamental steps of LCA as a globally unified framework, as shown in Figure 10 [42]. Goal and Scope Definition includes identifying the research objectives, research boundaries, functional units, and hypothetical conditions. This directly affects the accuracy of subsequent evaluation results. Inventory Analysis involves collecting, organizing, and analyzing relevant data within the research boundary. Impact Assessment is based on the results of Inventory Analysis. It conducts a quantitative assessment of the environmental impacts of products (or services). Result Interpretation explores potential ways to reduce environmental impacts and proposes corresponding improvement measures [43]. Aziz [44] reported that this method can cover the entire lifecycle of a product. This includes upstream activities, such as raw material mining, processing, and transportation, as well as downstream phases like sales, use, maintenance, and waste disposal. This prevents the transfer of environmental impacts between different lifecycle stages.
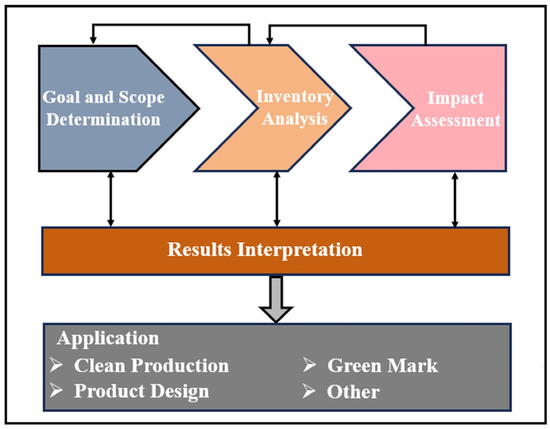
Figure 10.
The LCA framework.
Fan et al. [39] showed that the LCA carbon footprint evaluation methods can be categorized into Process-Based LCA (P-LCA), Input–Output LCA (I-O LCA), and Hybrid LCA (H-LCA). Mei et al. [35] reported that the P-LCA is the most traditional and classic method of LCA. It is usually used to calculate the carbon footprint of specific products or services. It is commonly used for carbon footprint accounting at the micro level (specific products or services). For example, it can be used to account for the carbon emissions of green hydrogen production pathways in western China. However, Fan et al. [39] commented that due to the subjectivity in its boundary setting, the evaluation results may not be sufficiently accurate. The I-O LCA can comprehensively reflect the direct and indirect carbon emission relationships among various sectors. I-O LCA is applicable to carbon emission accounting for a country or a region [45]. For instance, it can be employed to quantify the full lifecycle carbon emissions of the Tianjin Port. Zhang et al. [46] reported that the I-O LCA can solve the problem of duplicate or omitted calculations caused by complex production relationships, and has high economic efficiency. This method is insufficient to calculate the marine lifecycle emissions [47]. Because I-O LCA cannot disaggregate marine type, fuel, route, and operating-condition differences. H-LCA combines the strengths of the two preceding accounting approaches. The H-LCA features a comprehensive boundary scope and can yield reliable results. It is well suited for accounting the full lifecycle carbon emissions of an individual vessel. However, this method requires substantial data support and complex calculations [48].
Overall, although different LCA methods have their advantages and disadvantages, they are still the most suitable for marine carbon footprint calculations [39]. This study will offer a detailed analysis and evidence based on the relevant literature over the past decade in the next section, focusing on the lifecycle carbon footprint assessment of ships, routes, and ports. This approach will facilitate the identification of disparities in marine carbon footprints among various alternative fuels and enable an in-depth examination of the underlying causes of these disparities.
3. Research Hotspots and Trends in the Last Decade
Marine carbon footprints are generally evaluated by certain GHG emission quotas of ships, routes, and ports. These quotas are all influenced by the usage of different fuels and marine fuels, reflecting the emission processes within the shipping industry. In this study, the emission situation is presented according to the alternative fuels used in ships, routes, and ports in each section. The characteristics of fuels, as well as their production, transportation, and utilization processes, are sources of GHG emissions.
3.1. Marine LCA
Marine LCA involves analyzing the carbon footprint of ships or fleets, estimating the impact of alternative fuels on marine carbon emissions, and obtaining carbon emissions at various stages. This is conducive to applying diverse decarbonization strategies across various phases of the marine lifecycle.
3.1.1. Definition, Function of Marine LCA and Basic Characteristics of Maritime Carbon Emissions
In the context of international trade, marine transport remains a dominant contributor to the supply chain’s carbon emissions [49]. Alexandros et al. [50] studied six ships operating between Mytilini and Ayvalik, which have an average fuel consumption of 60 liters per 100 horsepower per hour. They found that cruising is the maritime activity with the largest energy footprint, reaching 695 MWh. Cruising consumption accounts for 78.9% of the total energy consumption (881 MWh) of all shipping activities. This energy consumption makes it the highest contributing source of carbon emissions. Moreover, hoteling also has a significant impact on energy consumption and emissions, with energy consumption of 152 MWh. This finding was also supported by Ye et al. [51]. They found that the carbon emissions from cruises related to solid waste and sewage were far higher than those from other types of ships. However, the carbon emissions generated by cruises’ fuel combustion were still much higher than those related to solid waste and sewage, accounting for more than 50% of the total carbon emissions from cruises. In addition, Robert et al. [52] analyzed the fuel consumption data of 93 tuna fishing vessels spanning the Atlantic, Indian Ocean, and Pacific Ocean. For fishing vessels, high-range vessels correspond to higher catch levels, which makes fishing volume closely related to fuel consumption. They found that capturing one ton of tuna results in 1.1 tons of carbon dioxide emissions due to marine fuel combustion. To meet the requirements of global carbon reduction goals, reducing fuel emissions has become an indispensable part of the future environmental and economic strategies for the tuna industry and other fisheries.
3.1.2. LCA and Lifecycle Cost Assessment (LCCA) of Biodiesel as Marine Fuel
All alternative fuels, except electricity, are synthesized or refined from primary energy carriers. Biodiesel has a very wide range of uses, and its application does not require extensive modifications to existing marine engines [53]. Li et al. [54] conducted LCA and LCCA to evaluate the environmental and economic impacts of bio-oil as fuel for container vessels. These vessels are powered by newly upgraded diesel engine systems. The main engine(s) power of the vessels is 2940 kW, and the net weight of one ship is 1773 tons. Figure 11a shows that the exhaust emission of diesel fuel is only 7522.9461t (CO2-eq) in the WTT stage, accounting for only about 11.53% of the whole lifecycle emission. The emissions of biodiesel fuels in the WTT stage are almost two times higher than those of diesel fuels. As shown in Figure 11b, the cost of biofuel is higher than diesel. Although the price of bio-oil is slightly lower than diesel, its fuel consumption per unit distance is higher. The total emissions of bio-oil fuels are 34.58% lower than diesel, and the total cost is 8.22% higher than diesel. Most lifecycle studies agree that waste oil or algal feedstocks cut greenhouse gas emissions markedly. However, when land use change is brought into the equation, the results diverge immediately. Analyses that leave this out usually overstate the mitigation benefit.
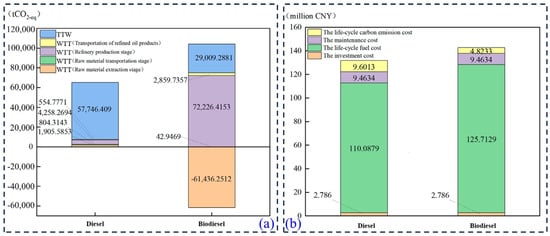
Figure 11.
(a) LCA results of diesel and bio-oil. (b) Specific LCCA results of diesel and bio-oil. The figure was sourced from Reference [54].
3.1.3. Lifecycle Carbon Emissions and Application Challenges of LNG as Marine Fuel
LNG-powered vessels will inevitably become the mainstream of the global shipping industry due to their fuel cost advantages, a gradually improving supply chain, and related refueling station infrastructure supporting equipment technology [27]. Fan et al. [36] focused their research on a carrier in the Yangtze River. The carrier is powered by a diesel engine with a rated power of 600 kW and has a loading capacity of 2200 tons. Fan et al. reported that the CO2 emissions of the LNG power system in the WTT stage accounted for 14.96%. This is caused by the fact that a large amount of energy is consumed in the natural gas liquefaction process. The CO2 emissions from the natural gas liquefaction process account for 61.22% of the total CO2 emissions in this stage. If renewable electricity is used to produce LNG, the emissions in the WTT stage can be reduced by 40%. However, since LNG is still a carbon-containing fuel, its CO2 emissions during the TTW stage account for 84.76% of the total emissions. Therefore, the carbon emissions of the LNG-powered system in the TTW stage account for the highest proportion. Ahmad et al. [55] synthesized previous studies and presented the corresponding emission ranges for LNG as a marine fuel. They reported the emissions ranged between 14 and 30 g (CO2-eq)/MJ, with a mean value of 18 g (CO2-eq)/MJ in the WTT phase. This implies that for every 1 MJ of power generated by the vessel, 18 g of CO2 are emitted solely due to the fuel processing and transportation processes. The emissions ranged between 56 and 80 g (CO2-eq)/MJ, with an average of 68 g (CO2-eq)/MJ in the TTW phase. Based on these ranges, the overall Well-to-Wake (WTW) emissions are between 74 and 109 g (CO2-eq)/MJ, with a mean value of 86 g (CO2-eq)/MJ. From a WTW perspective, switching from heavy fuel oil to LNG was expected to deliver a 5–10% reduction in GHG emissions. Murat et al. [56] conducted research on five different types of ships (bulk carriers, gas carriers, tankers, general cargo ships, and container ships) in accordance with the regulations related to the Energy Efficiency Existing Ship Index (EEXI) and Carbon Intensity Indicator (CII). They found that due to its higher lower calorific value (LCV) and lower carbon emission factor, LNG can result in more ideal EEXI and CII scores. However, there are still many practical issues that need to be addressed regarding the application of LNG.
Although LNG is considered the optimal short-term transitional fuel due to its cost advantages, mature infrastructure, and 5–10% lifecycle emission reduction potential, this assessment must be examined under the critical constraint of methane slip. Current LCA studies widely overlook this factor. The root causes are manufacturers’ refusal to release marine data under dynamic engine loads and the severe scarcity of high-frequency methane monitoring data from actual vessels [57]. This methodological deficiency leads many assessments to overestimate LNG’s climate benefits by 15–30%. This directly weakens the environmental credibility of the EEXI rating system for LNG-powered ships. It may also result in misguided green financing decisions. Such decisions could delay investment in truly zero-carbon fuels like green ammonia and hydrogen.
All studies have agreed that LNG cuts about 20% of CO2 at the stack. However, GHG values range from +5% to −20% at the WTW stage because methane slip assumptions differ. High-slip data from LNG engines are often excluded, weakening the bridge-fuel claim. If the 20-year global warming potential is used, LNG loses its carbon edge over heavy fuel oil in some cases. This highlights the key role of engine choice and methane monitoring in shipping policy.
3.1.4. Consumption Trend, Lifecycle Emission Reduction Effect, and Infrastructure Requirements of Methanol as Marine Fuel
From 2019 to 2021, the annual consumption of methanol fuel on marine was approximately 30.000 tons, 77,000 tons, and 130,000 tons, respectively [24]. Although methanol fuel accounts for a small proportion of total fuel consumption, its consumption proportion has been increasing year by year. Maja et al. [58] obtained the diesel vessel Kornati from the Croatian Register of Shipping. The Kornati has main engines with a power output of 1764 kW, auxiliary engines with a power output of 840 kW, and a passenger capacity of 616 people. Based on these parameters of the vessel, its fuel was converted to methanol. They found that the fuel consumption of methanol-powered systems was higher than that of diesel-powered systems, which is due to the low LCV of methanol. However, the marine carbon footprint of methanol-powered systems is approximately 32% to 33% lower than diesel-powered systems because methanol has a lower carbon content. Yan et al. [40] took a 7500-ton bulk carrier from Shanghai to Chongqing as an example. This carrier has a loading capacity of 9600 tons at maximum draft and is equipped with two 35 kW diesel engines, serving as the main engines. As shown in Figure 12a, Yan also obtained similar results by studying different cases and reported that the application of methanol can reduce carbon emissions by 31.5–38.1% compared with diesel. Murat et al. [56] reported that retrofitting a conventional engine into a methanol engine can provide a significant decrease in EEXI values and CII ratings. In addition, the application of methanol requires further improvement of methanol’s bunkering infrastructure and distribution chains [59]. Bellot et al. [60] studied a generic New Panamax Containership using methanol as an alternative fuel. The output power of the containership’s main engines was 55,835 kW. They found that methanol, which needs to be applied to promote the decarbonization of the shipping fleet, may disrupt the existing onshore infrastructure and incur high costs. As shown in Figure 12b, methanol-b (manufactured by coal) produces less CO2 during the WTT stage compared to methanol-a (manufactured by LNG), due to the current preparation process. However, using methanol as fuel clearly generates more emissions than diesel and LNG [39]. Elin et al. [61] studied a concept that aims for an almost closed CO2 loop by installing CO2 capture onboard. In this concept, the CO2 is unloaded at the port and then converted into electro-methanol, which is reused as marine fuel. The main emission source is the carbon dioxide emissions generated during electricity production when using this methanol as fuel. This concept can reduce GHG emissions by 98% compared with engines using marine gas oil. It can also reduce emissions compared with engines that use methanol directly. Green methanol often cuts greenhouse gas emissions by about 30%, whereas grey methanol can emit more than heavy fuel oil. Many studies have ignored the energy-density penalty, so they understate the extra emissions from larger tanks and lost cargo. The variation in results mainly comes from the carbon intensity of the electricity used to make the hydrogen.
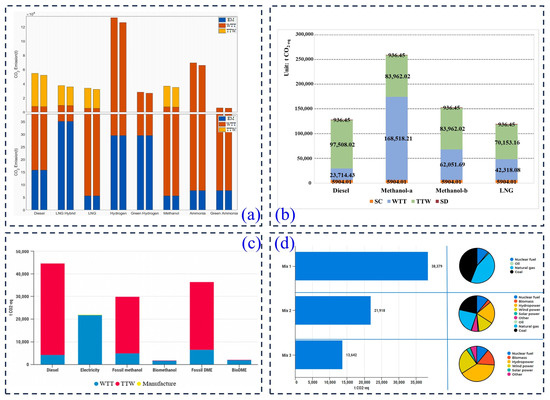
Figure 12.
Previous research on the carbon footprint of marine fuels. (a) Lifecycle emissions of alternative solutions (including 5% energy efficiency measures). (b) Emissions of CO2 from different fuels. (c) Comparative LCA of different power options implemented. (d) CF of an electricity-powered ship with different electricity mixes. The figure was sourced from References [39,40,58].
3.1.5. Lifecycle Carbon Emissions of Ammonia Fuel and Comparison of Production Methods
Fan et al. [36] and Yan et al. [40] reported that fossil ammonia has higher carbon emissions than diesel throughout their lifecycles, and the carbon footprint of fossil ammonia fuel power systems is 72.76% higher than that of traditional diesel power systems. The main reason is that these fuels are mainly produced from coal, which leads to high carbon emissions in the WTT. Additionally, the synthetic ammonia process and technology make ammonia’s carbon footprint much larger than diesel’s carbon footprint [62]. Green ammonia is defined as ammonia synthesized from renewable hydrogen using clean electricity. It achieves near-zero carbon emissions during the production phase. This pathway offers a substantially lower carbon footprint compared to fossil ammonia derived from coal or natural gas. However, a complete lifecycle assessment must account for the renewable energy source used in hydrogen production. It must also include transportation and storage emissions. The carbon footprint of green ammonia fuel power systems is 91.3% lower than that of traditional diesel power systems. Chalaris et al. [63] combined a comprehensive dataset of over 2061 bulk carriers and eight different ammonia production methods. These methods include steam methane reforming, photovoltaics, electrolysis via wind, biomass downdraft gasifiers, a biomass circulating fluidized bed gasifier (CFBG) system, underground coal gasification (UCG) with carbon capture and storage (CCS), UCG without CCS, and the 3-step Cu-Cl cycle, as shown in Figure 13. It demonstrates that the 3-step Cu-Cl cycle is the production pathway with the lowest GWP. Ammonia combustion is nearly carbon-free at the stack. However, slow burning and nitrous oxide formation are often neglected. Only a few papers quantify nitrous oxide. Once included, total greenhouse gases can equal those of diesel. Data on ammonia engines are scarce, so current lifecycle assessments still rely on theoretical values. Bench results have not entered public databases. This may cause existing assessments to systematically underestimate the real climate impact of ammonia fuel.
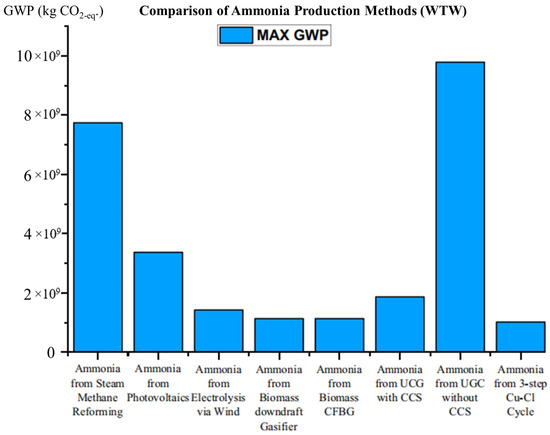
Figure 13.
Comparison between ammonia production methods regarding WTW emissions. The figure was sourced from Reference [63].
3.1.6. Lifecycle Carbon Emissions, Cost, and Renewable Energy Dependence of Hydrogen and Hydrogen–Electric Hybrid Marines
Ibrahim et al. [64] inspected three ships sailing in the Red Sea region to compare diesel and renewable hydrogen-powered ships using LCA and LCCA. They reported that producing hydrogen fuel onboard ships can increase the total carbon footprint by 10–28% compared with using diesel fuels. Most hydrogen-powered marine carbon footprint emissions are released during the electricity generation process and storage on board. Economically, the cost-effective target can be achieved if the cost of hydrogen production by electrolysis remains below 5.15 USD/kg. Zhu et al. [65] reported that the electricity and hydrogen used in hydrogen–electric hybrid ships are both produced from non-renewable energy sources, such as thermal power generation. A hydrogen–electric hybrid power system can increase carbon emissions by 32.4% compared to a diesel power system. However, if the electricity and hydrogen are both produced from renewable energy sources, such as wind power, nuclear power, and hydropower, it can reduce carbon emissions by up to 94.2% compared to diesel power systems. This finding was also supported by Evers et al. [66]. They found that only hydrogen power systems using renewable energy-based electrolysis for production can achieve carbon footprint reduction. Without strictly renewable electricity, hydrogen loses its climate benefit. Carbon fiber production for high-pressure tanks is energy-intensive. If tank manufacturing is included, total emissions rise further and reduce hydrogen’s mitigation potential.
3.1.7. Lifecycle Carbon Emissions, Economy, and Impact of Power Source for Electric Ships
The carbon footprint of the electrified system under study is approximately 50% lower than that of diesel-powered systems because carbon emissions of the electrified system come solely from the power generation stage and the battery production stage. As shown in Figure 12c, bio-methanol and bio-DME (Dimethyl Ether) are more environmentally friendly than electric ships, but this conclusion does not take into account the TTW stage of these two biofuels [58]. Alexandros et al. [50] reported that electric ships lead to a decrease in working expenses by up to 80% compared with diesel ships. Maja et al. [67] investigated 38 vessels powered by high-speed four-stroke diesel engines, including encompassing dredgers, tugboats, passenger ships, and cargo ships. They also reported that photovoltaic cell battery-powered ships are the most cost-effective option for passenger ships. Due to their smaller size and relatively low requirements regarding autonomy, their battery capacity is quite low, and the installation area for photovoltaic cells is smaller. Hence, both the investment and maintenance costs are low. Figure 12d shows the impact of electricity sources (fossil or renewable energy) on the total carbon footprint under three different combinations of electricity [58]. Mix 1 refers to Croatia’s electricity structure without renewable energy sources. Mix 2 corresponds to Croatia’s initial electricity structure. Mix 3 represents Croatia’s electricity structure without fossil fuels for electricity production. By reducing the use of fossil fuels and increasing the proportion of renewable energy, the carbon emissions from producing electricity can be significantly reduced, thereby lowering the carbon emissions of electric power systems. The production of shipboard electricity using renewable fuels can significantly reduce lifecycle GHG emissions. Conversely, using electricity generated from fossil fuels may substantially diminish the environmental benefits. This highlights the critical importance of prioritizing the development and utilization of low-carbon electricity sources. Battery ferries emit no carbon on site. Their lifecycle greenhouse gases depend on the regional grid. In coal-based grids, total emissions can exceed those of diesel. Battery manufacturing and replacement add 10–25% more carbon dioxide [68]. However, many studies still omit this stage. Recent papers have shown that fast charge cycles at sea shorten battery life by thirty percent compared with land use. If the real replacement rate is applied, the emission disadvantage of battery ferries in high-carbon grids increases further.
3.1.8. Comprehensive Comparison of Alternative Marine Fuels and Lifecycle Selection Strategy
Although many studies have assessed the lifecycle environmental performance of marine alternative fuels, most have focused on summarizing the emission-reduction potential of a single fuel pathway. Few have offered a systematic comparison of the consistency and divergence of these results. As shown in Table 5, the assessment unit for carbon emission intensity is g (CO2-eq)/MJ. This unit quantifies the carbon dioxide equivalent emissions corresponding to each megajoule of energy consumed throughout the lifecycle of marine fuels. Technology readiness level (TRL) is a technology maturity assessment standard recognized by the European Union. It is widely used for maturity grading and feasibility evaluation of technologies related to marine alternative fuels. With the large number of results related to marine LCA, it is evident that utilizing CO2 as a feedstock for biodiesel production can effectively reduce the carbon footprint of biodiesel below that of conventional diesel. But it has complex technology and a high cost. Biodiesel’s lower calorific value can slightly reduce engine performance and lead to higher NOX emissions during combustion, imposing stricter requirements on ship exhaust treatment. LNG is a better alternative fuel than others considering the cost and technology. While LNG has a lower energy density than conventional diesel, storing less energy per unit volume and thus restricting vessel range, it also faces evaporation losses during storage and transport, leading to economic loss and safety risks. Methanol can reduce marine carbon footprints by about one-third, but it requires improved infrastructure. Methanol’s low energy density means ships need to carry more fuel to meet navigation demands. Although ammonia and hydrogen can reduce most carbon emissions in the TTW stage, their cost-effectiveness is poor without green preparation. Ammonia burns slowly and is prone to generating nitrogen oxides, necessitating advanced combustion control technologies to curb emissions. Only fuel systems using renewable energy for hydrogen electrolysis can significantly cut carbon emissions. However, hydrogen production is not fully mature yet. The cost of producing green hydrogen is high, and the energy efficiency of the production process still needs to be enhanced. Hydrogen’s high burning velocity can cause rapid flame propagation, leading to pre-ignition or knocking in internal combustion engines. This may result in engine damage and a shortened service life. Electricity, as a convenient energy source that produces no emissions during marine operation, will become increasingly vital as the marine sector transitions towards electrification. The environmental benefits of this transition largely hinge on the source of electricity used for production and the energy storage solutions employed. Overall, the selection of various fuels needs to be combined with appropriate circumstances to reduce carbon emissions from the perspective of the marine lifecycle.
Table 5.
Emission status of marine fuel at each stage.
3.2. Route LCA
3.2.1. Route LCA: Definition, Purpose, and Fuel Studies
Route LCA assesses carbon emissions from various alternative fuels along identical routes and evaluates marine carbon footprints across diverse routes. This analysis aims to identify suitable alternative fuels and marine transportation routes. It also analyzes the emissions of different ships on the route to facilitate targeted measures to reduce carbon emissions.
Fan et al. [36] studied the carbon footprint of three alternative fuel power systems for the Yangtze River internal flow route. They reported that although the carbon footprint of the green ammonia fuel power system was the smallest, the carbon footprint of LNG power systems was better than that of traditional diesel power systems and ammonia fuel power systems. Nikoletta et al. [69] reported that engines using both diesel and LNG, as dual fuels, were the most cost-effective option. Meanwhile, the combination of fuel cells and carbon capture technology was found to be the most effective configuration in achieving significant reductions in CO2 emissions. Chen et al. [70] reported that passenger ships using very low sulfur fuel oil (VLSFO) in the Arctic would be the more viable and environmentally friendly option in the short term. But in the long term, passenger ships using LNG fuel would be a better choice.
3.2.2. Carbon Emissions of Different Marine Types
This paragraph mainly compares the carbon emissions of different types of marines. Li et al. [71] discovered that within China’s emission control areas, container ships, oil tankers, and bulk carriers are the three marine vessel types with the highest emissions. Unlike the global scenario, the proportion of emissions from engines and boilers for oil tankers, chemical tankers, and liquefied gas tankers is higher within China’s emission control areas. This finding was also supported by Wang et al. [72]. They reported that carbon emissions of container vessels and dry bulk carriers were relatively higher than other types of ships. As shown in Figure 14a, these ship types are the mainstay of current shipping, with dry bulk carriers producing the highest GHGs emissions, at 32.64%, followed by container vessels (24.48%), and oil product carriers (12.3%). As shown in Figure 14b, Zhou et al. [73] also reported that cargo ships arriving at Wuhan are the primary source of carbon emissions, accounting for 79% of the total emissions. These cargo ships consist of bulk carriers, general cargo ships, roll-on/roll-off (ro-ro) vessels, and container ships. Oil tankers contribute the second-highest share at 14%, while passenger ships, tugs, and other types of ships account for a smaller proportion of approximately 2%. Figure 14c shows that carbon emissions from bulk carriers and container ships in 2020 were lower than in 2019 because of the pandemic, but carbon emissions from oil tankers still increased [71]. To effectively control carbon dioxide emissions, it is imperative to prioritize the implementation of emission reduction strategies specifically tailored to these three ship types. This approach is likely to yield more significant emission reduction outcomes than those achievable through strategies targeting other marine categories.
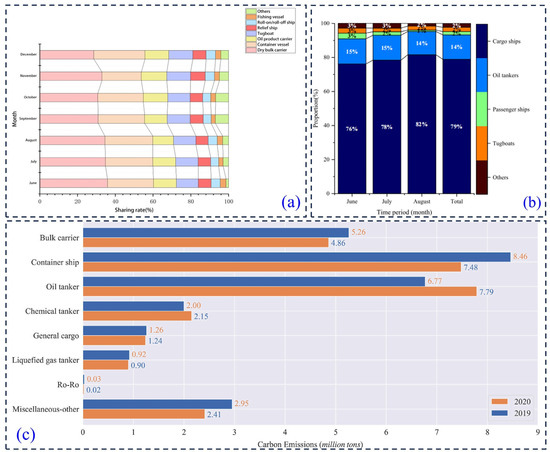
Figure 14.
Previous research on emissions from various engines of different types of ships. (a) Pollutant proportion of each ship type in Tianjin Port. (b) Carbon emission proportions of different types of ships in Wuhan Port. (c) Carbon dioxide emissions of different ship types. The figure was sourced from References [71,72,73].
3.2.3. Route Selection to Cut Emissions and Fuel Use
Appropriate route selection can reduce carbon emissions and fuel consumption. Tian et al. [74] focused on ports situated within the northeastern, northern, and Shandong regions of China, which are integrated into its domestic trade circuits. The selected ports included Yingkou (YIK), Qinhuangdao (QHD), Tianjin (TSN), Yantai (YNT), Weihai (WEH), and Dalian (DLC). They reported that the profit-maximizing route is “YIK → QHD → YNT → WEH → TSN → DLC”, with total carbon emissions of 444.63 tons. But when the maximum allowable carbon emissions per twenty-foot equivalent unit (TEU) per origin–destination pair is 0.2 tons, the optimal route is “YIK → QHD → WEH → YNT → TSN → DLC”. Patrick et al. [49] examined various alternative realistic routes to the UK and tested the optimal route for minimizing total carbon emissions under real-world conditions, based on real-life UK industrial cases. The findings indicated that logistics-related carbon emissions can be reduced by 16–21% through direct delivery to the UK, as opposed to transshipment via a continental European port.
3.2.4. Key Conclusions of Routes LCA Research
The route LCA shows some results. First, the dual-fuel engine power system using LNG and diesel is currently the most suitable choice. Second, it is necessary to reduce the carbon emissions of cargo ships, which account for the largest proportion of emissions. Finally, choosing the route with the shortest voyage is a suitable choice for shipping in accordance with policies.
3.3. Ports LCA
Port LCA refers to the accounting of a specific port, aiming to address the current situation of high carbon emissions in ports. This section reviews the findings of studies focused on different ports LCA, classified by time and location.
3.3.1. Domestic Port Marine Carbon Emission Studies
In China, Yang [75] examined the CO2 emissions from two container terminal operating models (tire transshipment terminals (TTs) and rail transshipment terminals) using Kaohsiung Port in China as the case study. He found that rail transshipment terminals and electric tire transshipment terminals (E-TTs) are the most environmentally friendly cargo handling equipment. Their notable contributions to operational efficiency, energy conservation, and CO2 reduction make them a sustainable choice. Specifically, the conversion of diesel-powered TTs to E-TTs would eliminate GHG emissions and diesel engine noise pollution. This change would also enhance air quality and decrease equipment idling time. As a result, CO2 emissions were projected to decrease by approximately 20%, and operational efficiency was expected to increase by around 20%.
Wang et al. [72] took Tianjin Port as an example. Drawing on massive Automatic Identification System (AIS) data, they carried out a multi-dimensional analysis of GHG emissions to uncover the causes and impacts of GHGs. Atmospheric carbon emissions from vessels are mainly concentrated near the land port area of Tianjin Port and along the channels. They reported that the GHG emissions in this region are mainly concentrated in the vicinity of the Tianjin Port land port area, the Dagusha Channel, and the Main Shipping Channel of Tianjin Xingang Fairway. As can be seen in Figure 15a, carbon emissions peak in September and are lower in June and December. In terms of sailing conditions, vessels emit the most carbon when traveling at low speeds. The carbon emissions are the lowest when ships are in the berthing and mooring states. When ships are in the cruising state, carbon emissions fall between the two aforementioned scenarios. Figure 15b reveals that ships registered in China contribute the most significantly to carbon emissions within China, accounting for 60.7% of total emissions. This is followed by ships registered in Hong Kong, China, which represents 7.2% of emissions. Vessels registered in Liberia and Singapore rank third and fourth, respectively, in terms of their contribution to carbon emissions in China. These data underscore the dominant role of ships from the Chinese mainland while highlighting the comparatively smaller but still notable contributions from Hong Kong, Liberia, and Singapore.
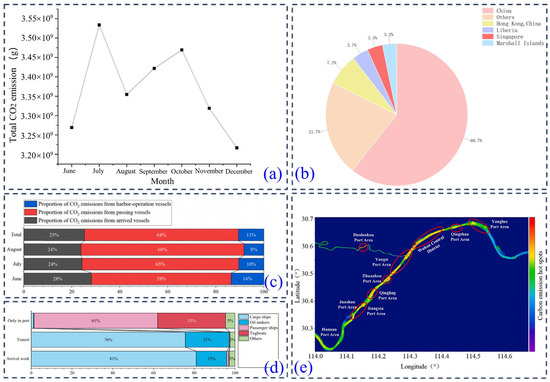
Figure 15.
Previous research on the carbon footprint of Tianjin Port and Wuhan Port. (a) CO2 emissions from ships in the waters near Tianjin Port from June 2018 to December 2018. (b) Carbon emissions from ships of different nationalities. (c) Proportion of carbon emissions from ships with different ranges of activity in Wuhan Port. (d) Distribution of ship types with different activity ranges in Wuhan Port. (e) Distribution of carbon emission hotspots of ships in Wuhan Port. The figure was sourced from References [72,73].
Zhou et al. [73] analyzed the spatial and temporal dynamics of the marine carbon emission hotspot in Wuhan Port from several perspectives. As shown in Figure 15c, the main carbon emissions in the region come from the passing ships (about 64% on average). The carbon emission shares of arriving vessels and harbor operation vessels are approximately 25% and 11%, respectively. Figure 15d reports that carbon emissions from vessels operating within the port are dominated by passenger ships and tugboats, accounting for 61% and 33%, respectively. The emissions from transit and arriving vessels stem mainly from cargo ships and oil tankers. Figure 15e shows the distribution of carbon emission hotspots of ships in Wuhan Port. The Han River section exhibits a lower overall carbon emission intensity compared to the Yangtze River section. Additionally, the carbon emission intensity of marine traffic in the downstream area of Yangluo Port and the upstream area of Junshan Port is relatively lower than that in other regions. The cause of the regional differences in carbon emission intensity is attributed to the varying distribution of vessels. This finding underscores that an effective strategy for mitigating port-related carbon emissions lies in prioritizing the reduction of emissions from vessels in the proximity of ports.
Collins et al. [76] analyzed the impact of the decarbonization strategies adopted in Ningbo-Zhoushan Port in an operation-based scenario. They reported that the total savings were 2645.36 tons (standard coal equivalents), 3047.46 tons, and 3703.52 tons of energy in 2013, 2014, and 2015, with the operational measures contributing about 2%, 4%, and 9%, respectively. Given that the port’s annual fuel consumption was 13,015.20 tons (2013), 14,099.60 tons (2014), and 14,296.40 tons (2015), achieving these aggregate savings is a commendable accomplishment. The share of alternative fuels (wind, solar, LNG, electricity, and batteries) has increased annually, accounting for 0.24%, 0.32%, and 0.45% of the total energy consumption for 2013, 2014, and 2015, respectively. The emission control measures were effective, and the annual CO2 emissions (direct and indirect) for 2014 and 2015 were reduced by 15% and 21% per throughput, compared with 2013.
Wang et al. [77] took Shenzhen Port as an example to study shore power systems. If Shenzhen Port had purchased electricity from Hong Kong in 2020, it would have achieved reductions of 88% in SO2, 94% in NOX, 95% in particulate matter, and 37% in CO2. Compared to fuel switching, the cost of shore power is relatively high. The cost per ton of reducing NO2, PM, SO2, and CO2 is approximately USD 56,000, 1.4 million, 290,000, and 2300, respectively. The shore power alternative should only be prioritized when there is a guaranteed supply of low-sulfur fuel, and nitrogen oxide emissions are controlled. In 2012, the carbon dioxide emissions intensity of marine diesel was relatively low due to the higher thermal efficiency of diesel at that time. In 2020, SOX emissions were cut by 88%, NOX by 94%, particulate matter by 95%, and COX by 37%. It is evident that with the advancement of technology, the emissions from shore power technology are superior to those of traditional diesel engines.
3.3.2. Foreign Port Marine Carbon Emission Studies
In other countries, Kwon et al. [78] estimated the emissions of seven air pollutants (NOX, SOX, CO2, CO, PM2.5, PM10, and non-methane volatile organic compounds (NMVOCs)) from marine sources for 2020 in the Busan Port in Korea. The total estimated fuel consumption from 44,315 entry and departure cases in Busan Port for one year in 2020 was 252,519 t, and the emissions of the seven air pollutants, converted to CO2 equivalents, were as follows: NOX, 18,323 t; SOX, 16,924 t; CO2, 790,383 t; CO, 714 t; PM2.5, 1484 t; PM10, 1614 t; NMVOC, 772 t.
Erdas et al. [79] studied Limassol Seaport. As a major hub port for cargo and cruise ships in the Mediterranean region, Limassol Seaport is also home to one of the world’s largest shipping fleets. They found that the carbon footprint of Limassol Seaport was twice the national average carbon footprint of the country where the port is located. The primary sources of carbon emissions in this port are associated with electricity usage, fuel consumption, waste management, and water use.
Víctor et al. [80] found that container and cruise ship traffic within the Valencia port significantly influenced its carbon footprint. Despite a 24% rise in port traffic from 2008 to 2016, the carbon footprint remained stable. When using the base year’s emission factors to account for external influences, the port saw a 17% drop in emissions. Indirect emissions from machinery, vehicles, and maritime activities, including electricity usage, accounted for 97% of the total. Within this scope, container and cruise traffic contributed nearly 40% of indirect emissions.
Finally, the proportion of alternative fuels in ports is increasing, and the indirect emissions caused by port electricity consumption are an important part of a port’s carbon footprint that cannot be ignored. Improving the shore power facilities in ports and adopting renewable energy to generate electricity can help to improve the current situation of high carbon emissions in port areas.
4. Sensitivity Analysis and Challenges
4.1. Sensitivity Analysis
The research incorporates diverse data sources, such as vessel fuel consumption data, port operational data, and lifecycle emission data for various fuels. As shown in Table 6, the lifecycle emission assessment of different fuels in the WTT stage requires consideration of all stages from production through transportation to utilization. Data from any of these stages can impact the overall carbon footprint assessment, making this stage particularly susceptible to data deviations. In the TTW stage, carbon emissions from alternative fuels are typically calculated using parameters of diesel engines, thus necessitating the selection of appropriate parameters for accurate emission assessment. When conducting a carbon footprint assessment, certain assumptions are usually made to construct the model. Discrepancies between these assumptions and actual conditions may lead to deviations in the calculation results. When applying LCA to the marine sector, unique methodological challenges and uncertainties arise due to the complexity of marine operations, the diversity of fuel types, and the global scope of marine activities.
Table 6.
Uncertainty analysis summary.
The current methods for calculating the carbon footprint of ships throughout their lifecycle are not standardized. The use of different calculation methods can lead to significant variations in results, which in turn makes it difficult to compare findings across different studies. There is a lack of accurate, comprehensive, and up-to-date data to support the determination of key parameters in the carbon footprint calculation of ships. These key parameters include data on the carbon emissions associated with shipbuilding materials and supporting equipment. Additionally, the selection of key factors influencing the carbon footprint of ships is not yet sufficient. Existing research has mainly focused on some common factors, but there has been less research on potential and complex interactive factors. There is also a lack of in-depth and systematic analysis on the long-term combined impact of economic, policy, technical, and market factors on the carbon footprint of ships. Characterized by its international dimension, the shipping industry’s carbon footprint reduction hinges on collaborative and coordinated efforts across nations. International organizations and governments worldwide are actively establishing carbon trading markets and implementing carbon taxes. These actions are instrumental in driving the development of unified standards and regulations for the calculation of marine carbon footprints, facilitating comparison and oversight among various entities.
4.2. Analysis of Marine Drive Systems
Current marine LCA research mainly focuses on fuel combustion emissions. However, the mechanical efficiency of drive systems is a critical yet often overlooked parameter affecting full lifecycle carbon footprints. Hydraulic drive systems are widely used in engineering vessels with complex load demands, such as dredgers and offshore support vessels. Their transmission losses can reach 15–20% of total energy consumption. These systems generate significant carbon emissions from idling operations under zero-load conditions. In contrast, electric drive systems can achieve over 90% energy conversion efficiency. This is far higher than the 35–45% efficiency of conventional mechanical transmission and internal combustion engine combinations. This efficiency difference directly impacts WTT stage emissions. Inefficient drive systems increase fuel demand per unit of propulsion work, thereby amplifying carbon footprints from fuel production. For hydrogen–electric hybrid vessels, LCA calculations must account for both fuel cell efficiency and motor losses. Otherwise, total carbon emissions will be underestimated.
Incorporating drive system selection into the marine LCA framework enhances assessment accuracy and supports refined policy design. Ignoring these mechanical-level impacts continuously widens the gap between LCA’s theoretical potential and real-world operational performance. This further exacerbates the core limitations identified in this review, namely research fragmentation and lack of methodological standardization.
4.3. Policy and Investment
LCA results quantify environmental hotspots in the ship lifecycle. This provides scientific evidence for maritime policy-making. This evidence drives the IMO to shift from voluntary guidelines to mandatory standards. Key examples include EEXI and CII. These standards directly penalize high-emission vessels. Shipowners can incorporate LCA-identified high-impact stages into regulatory frameworks. They can also establish green shipping finance rating systems based on full-lifecycle footprints. Following the SETAC pathway, policy designs incorporate incentive-compatible mechanisms. China provides CNY 1–3 million subsidies per ship for LNG or battery retrofits. The EU emissions trading system, with a carbon price of EUR 60–80 per ton of CO2, helps narrow the cost gap between fossil fuels and green methanol/ammonia. Dynamic assessment mechanisms should require shipping companies to regularly disclose LCA data through the IMO Data Collection System. This supports continuous auditing of policy effectiveness.
At the investment decision level, LCA results reshape traditional cost–benefit analysis frameworks. They internalize environmental externalities as quantifiable financial risks. Investors should adopt lifecycle cost assessment methods. These methods incorporate energy consumption costs during use, environmental compliance fees during maintenance, and waste disposal premiums at end-of-life into investment models. This avoids underestimating long-term returns from focusing only on initial purchase costs. Multi-criteria decision analysis can support fuel pathway selection. It constructs decision matrices covering environmental benefits, incremental investment costs, and policy compliance risks. Procurement contracts should embed EEXI/CII performance guarantee clauses. They should prioritize ships equipped with real-time AIS/CEMS monitoring systems. This will establish traceable accountability mechanisms and mitigate financial risks from increasingly stringent IMO decarbonization targets.
Future marine LCA should assess existing policies, analyzing their effectiveness and any issues that arise. Concurrently, collaborative research on marine carbon footprints should be conducted at both regional and global levels, examining the characteristics and differences of marine carbon footprints among various regions and exploring mechanisms for coordinated emission reductions and international cooperation models to jointly tackle the global climate change challenge.
5. Conclusions
This study conducted a comprehensive review of the pertinent literature to identify the carbon footprint of the marine lifecycle. The reviewed experimental and numerical study results were discussed, considering the methods of fuel production and transportation, as well as marine navigation routes. The LCA of available routes and ports was reported, and emission and parametric studies were discussed. The previous research concludes that while the same type of fuel prepared from different sources exhibits some similarities in combustion and emission characteristics, they generally generate different carbon footprints due to the discrepancy in preparation methods and transport processes. The main research goals and needs are summarized, and recommendations for future research pathways are provided below.
- The TTW stage dominates emissions. Alternative fuels substantially reduce GHGs during this stage, yet exhibit higher upstream burdens. Green hydrogen or ammonia produced with renewable electricity is required to realize net savings.
- LNG currently offers the most favorable carbon abatement cost among transitional fuels. Methanol, ammonia, and hydrogen are essential for 2050 carbon neutrality but remain constrained by production, transport emissions, and costs.
- Ocean shipping generates the largest footprint. Within emission control areas, selecting the shortest compliant route decreases fuel use, saves energy, and improves transport efficiency.
- Shore power coverage and electrification are critical for port-based mitigation. Coordinated port planning and expanded shore power infrastructure significantly reduce berthing emissions.
Future studies should embed policy evaluation into the LCA framework. The performance of EEXI and CII should be tracked in real time, quantifying how these instruments drive fleet renewal and green finance. A regional global database that harmonizes methane-slip factors, shore-power carbon intensities, and battery production emissions should be developed. This will support mutual recognition of carbon quotas and negotiations on green shipping corridors. LCA must connect to policy outcomes, grid decarbonization pathways, and real-time marine operational data. Only then can it shift from static accounting to a dynamic governance system that supports shipping’s 2050 carbon neutrality goals.
Author Contributions
Y.C.: Data curation, Investigation, Writing—original draft. D.L.: Validation. F.C.: Formal analysis. C.Z.: Visualization. L.L.: Conceptualization, Funding acquisition. H.L.: Conceptualization, Supervision. M.Y.: Methodology. J.G.: Resources. K.N.: Writing—review and editing. All authors have read and agreed to the published version of the manuscript.
Funding
This study was financially supported by the Heilongjiang Provincial Key R & D Program (Grant No. 2024ZX03B07), the Fundamental Research Funds for the Central Universities (30720205GH0302 and 3072025CFJ0703), and the Natural Science Foundation of Jiangsu Province (BK20251000).
Data Availability Statement
No new data were created or analyzed in this study.
Conflicts of Interest
The authors declare no conflicts of interest.
Abbreviations
| AD | Activity data |
| AIS | Automatic identification system |
| CE | Carbon emission |
| CEADs | Carbon emission accounts and datasets |
| CEMs | Continuous emission monitoring system |
| CFBG | Circulating fluidized bed gasifier |
| CII | Carbon intensity indicator |
| CO2-eq | CO2-eq CO2 equivalent |
| DME | Dimethyl ether |
| DLC | Dalian |
| EEXI | Energy efficiency existing ship index |
| EF | Emission factors |
| EM | Engine manufacturing |
| EPA | Environmental Protection Agency |
| E-TTs | Electric tire transtainers |
| GHG | Greenhouse gas |
| GWP | Global warming potential |
| H-LCA | Hybrid LCA |
| IPCC | Intergovernmental Panel on Climate Change |
| IMO | International Maritime Organization |
| IOS | International Organization for Standardization |
| I-O LCA | Input-output LCA |
| LCA | Lifecycle assessment |
| LCCA | Lifecycle cost assessment |
| LCV | Lower calorific value |
| LNG | Liquefied natural gas |
| NMVOC | Non-methane volatile organic compounds |
| P-LCA | Process-based LCA |
| QHD | Qinhuangdao |
| SETAC | Society of Environmental Toxicology and Chemistry |
| TRL | Technology readiness level |
| TTW | Tank-to-Wake |
| TTs | Tire transtainers |
| TSN | Tianjin |
| UCG | Underground coal gasification |
| UNFCCC | United Nations Framework Convention on Climate Change |
| VLSFO | Very low sulfur fuel oil |
| WEH | Weihai |
| WTT | Well-to-Tank |
| WTW | Well-to-Wake |
| YIK | Yingkou |
| YNT | Yantai |
References
- Dawsona, J.; Cartera, N.; Luijk, N.; Parker, C.; Weber, M.; Cook, A.; Grey, K.; Provebcher, J. Infusing Inuit and local knowledge into the Low Impact Shipping Corridors: An adaptation to increased shipping activity and climate change in Arctic Canada. Environ. Sci. Policy 2020, 105, 19–36. [Google Scholar] [CrossRef]
- Ritchie, H.; Rosado, P.; Roser, M. Greenhouse Gas Emissions. Published Online at OurWorldinData.org. 2020. Available online: https://ourworldindata.org/greenhouse-gas-emissions (accessed on 27 November 2025).
- Zhang, Y.M.; Hu, C.S.; Zhang, J.B.; Dong, W.X.; Wang, Y.Y.; Song, L.N. Research advances on source/sink intensities and greenhouse effects of CO2, CH4, and N2O in agricultural soils. Chin. J. Eco-Agric. 2011, 19, 966–975. [Google Scholar] [CrossRef]
- Tu, R.H. Introduction to United Nations Framework Convention on Climate Change and Its Kyoto Protocol and Their Negotiation Process. Environ. Prot. 2005, 3, 65–71. [Google Scholar] [CrossRef]
- Bao, J.Q.; Yang, M.; Chen, F. Low Carbon Economy: Revolution in the Way of Human Economic Development. China Ind. Econ. 2008, 4, 153–160. [Google Scholar] [CrossRef]
- Streck, C.; Keenlyside, P.; Von Unger, M. The Paris Agreement: A new beginning. J. Eur. Environ. Plan. Law 2016, 13, 3–29. Available online: https://climatefocus.com/wp-content/uploads/2022/06/The-Paris-Agreement-A-New-Beginning.pdf (accessed on 27 November 2025). [CrossRef]
- Chen, M.P. Progress and outlook of adaptation negotiation under the United Nations Framework Convention on Climate Change. Clim. Change Res. 2020, 16, 105–106. [Google Scholar] [CrossRef]
- Faber, J.; Hanayama, S.; Zhang, S. Fourth IMO GHG Study 2020; International Maritime Organization: London, UK, 2020; Available online: https://www.imo.org/en/ourwork/environment/pages/fourth-imo-greenhouse-gas-study-2020.aspx (accessed on 27 November 2025).
- Su, P.H. Interpretation of the 2023 International Maritime Organization Ship Greenhouse Gas Reduction Strategy. Shipp. Manag. 2023, 45, 5–8. [Google Scholar] [CrossRef]
- Qian, J. Hybrid Life Cycle Assessment of GHG Emission and Methane Slip from LNG Power River-Sea-Going Ship. Master’s Thesis, Wuhan University of Technology, Wuhan, China, 2022. Available online: https://kns.cnki.net/kcms2/article/abstract?v=tsj_6yYi9c6ibYB0F5HZHPXRUJVTRDuJJdKHdFJ2KpWFA1zr-By3iuOrTxc5OQ39IHZAKuuiTCg8N24FD3di39_aPfb60JvtoePJ-C6_ZU9Tda1merde0JNqRe1HiJl4rDBiQgGfqjHU-hTdfUsBJR5toGT-_awxcYKghhrS36bnaChvk8NETnIrqa4QqNKmJF3UW4Hchak=&uniplatform=NZKPT (accessed on 27 November 2025).
- Zhang, Y.Z.; Luo, X.F.; Buis, J.J. LCA-oriented semantic representation for the product life cycle. J. Clean. Prod. 2015, 86, 146–162. (accessed on 27 November 2025). [Google Scholar] [CrossRef]
- Deng, Y.Y.; Xu, T.T.; Liu, H. Research status and prospect of Life Cycle Assessment—On the application of coal industry. Coal Econ. Res. 2024, 44, 160–167. [Google Scholar] [CrossRef]
- Mitchell, J.F. The “greenhouse” effect and climate change. Rev. Geophys. 1989, 27, 115–139. [Google Scholar] [CrossRef]
- Liu, Z.H.; Hu, R.; Zhang, J.F.; Chen, Y.Y.; Sun, J.J. A review of research on greenhouse effect assessment caused by fuel consumption during aircraft cruising phase. Environ. Prot. Sci. 2024, 50, 1–8. [Google Scholar] [CrossRef]
- Wang, C.K.; Luo, X.Z.; Zhang, H. Shares differences of greenhouse gas emissions calculated with GTP and GWP for major countries. Adv. Clim. Change Res. 2013, 4, 127–132. [Google Scholar] [CrossRef]
- Ma, C.M. Carbon Accounting Theory and Practice; China Environment Publishing Group: Beijing, China, 2022; ISBN 9787511152831. [Google Scholar]
- Ding, K.; Liu, M.R.; Wang, P.X.; Li, Z.Z.; Xue, Q. Analysis on Current Situation and Future Development of Marine Fuel Oil. Contemp. Chem. Ind. 2023, 52, 1453–1457. [Google Scholar] [CrossRef]
- Peng, X.; Liang, J.; You, P. Opportunities in crisis to decarbonize the energy system. Innov. Energy 2025, 2, 100069. [Google Scholar] [CrossRef]
- Wang, Y.G.; Zhou, M.; Wang, Z.L.; Zheng, S.S. Life-cycle energy efficiency estimation of large-scale ammonia fuel energy storage system. Energy Storage Sci. Technol. 2018, 7, 301. Available online: https://kns.cnki.net/kcms2/article/abstract?v=tsj_6yYi9c4OHQNxeurBE2-xUA8bWGgpHmJFvTY5rvBF2A8ldBOvPO14iGF8JNQxwai7_ZfF-vsAH5-pbpLnAWbVnCOG2qm2ve15o4i4IYTCnzZ-zUmPKryWMgTlLObZjcf3la4SNhvUBnpKHKIMKh1BBR0e1ko-3GyXmHoPaxrNpKXgM9xmZCLAnXCTICxMCol4cebOico=&uniplatform=NZKPT (accessed on 27 November 2025).
- Fullonton, A.; Lea-Langton, A.R.; Madugu, F. Green ammonia adoption in shipping: Opportunities and challenges across the fuel supply chain. Mar. Policy 2025, 171, 106444. [Google Scholar] [CrossRef]
- Liu, P.; Liu, L. Japan’s Green Industrial Development Strategy towards Carbon Neutral: Based on the Review of “Green Growth Strategy through Achieving Carbon Neutrality in 2050”. Contemp. Econ. Jpn. 2021, 4, 14–27. [Google Scholar] [CrossRef]
- Aydın, S. Comprehensive analysis of combustion, performance and emissions of power generator diesel engine fueled with different source of biodiesel blends. Energy 2020, 205, 118074. [Google Scholar] [CrossRef]
- Ampah, J.D.; Yusuf, A.A.; Afrane, S.; Jin, C.; Liu, H.F. Reviewing two decades of cleaner alternative marine fuels: Towards IMO’s decarbonization of the maritime transport sector. J. Clean. Prod. 2021, 320, 128871. [Google Scholar] [CrossRef]
- Wang, S.; Li, C.J.; Hu, Y.J.; Wang, H.L.; Xu, G.T.; Zhao, G.; Wang, S.Y. Assessing the prospect of bio-methanol fuel in China from a life cycle perspective. Fuel 2024, 358, 130255. [Google Scholar] [CrossRef]
- Li, C.J.; Wang, Z.X.; Liu, H.; Guo, F.F.; Li, C.H.; Xiu, X.Y.; Wang, C.; Qin, J.; Wei, L.Q. Integrated analysis and performance optimization of fuel cell engine cogeneration system with methanol for marine application. Renew. Sustain. Energy Rev. 2024, 199, 114564. [Google Scholar] [CrossRef]
- Jia, H.B. Study on Quality Control during Construction of LNG Gas Supply System for Inland Ships. Master’s Thesis, Dalian Ocean University, Dalian City, China, 2024. [Google Scholar] [CrossRef]
- Taghavifar, H. Projecting carbon capture and electricity share in LNG lifecycle: GHG economics via regression and stochastic analysis. Energy 2025, 327, 136358. [Google Scholar] [CrossRef]
- Hu, Q.; Chen, T.Y.; Yue, J.J. Changes and Impact Analysis of IMO Ship Greenhouse Gas Emission Reduction Strategy. Mar. Equip. Mater. Mark. 2024, 32, 91–95. [Google Scholar] [CrossRef]
- Chen, X. Green and low-carbon energy-use. Innov. Energy 2024, 1, 100003. [Google Scholar] [CrossRef]
- Walker, S.B.; Mukherjee, U.; Fowler, M.; Elkamel, A. Benchmarking and selection of Power-to-Gas utilizing electrolytic hydrogen as an energy storage alternative. Int. J. Hydrogen Energy 2016, 41, 7717–7731. [Google Scholar] [CrossRef]
- Huang, Y.; Shen, H.; Chen, Y.; Zhong, Q.R.; Chen, H.; Wang, R.; Shen, G.F.; Liu, J.F.; Li, B.G.; Tao, S. Global organic carbon emissions from primary sources from 1960 to 2009. Atmos. Environ. 2015, 122, 505–512. [Google Scholar] [CrossRef]
- Hertwich, E.G.; Pease, W.S.; Koshland, C.P. Evaluating the environmental impact of products and production processes: A comparison of six methods. Sci. Total Environ. 1997, 196, 13–19. [Google Scholar] [CrossRef]
- Zhou, Z.P. Carbon Footprint Measurement and Optimization of Shipbuilding Supply Chain. Master’s Thesis, Jiangsu University of Science and Technology, Zhenjiang, China, 2023. [Google Scholar] [CrossRef]
- Dong, G.X.; Zhou, J.; Wang, J.X.; Jing, L.X. Exploration of Accounting Methods for Industrial Pollution Sources. Environ. Prot. 2013, 41, 57–59. [Google Scholar] [CrossRef]
- Mei, M.L. Study on Ship Environmental Impact and Energy Efficiency Evaluation System Based on LCA. Master’s Thesis, Wuhan University of Technology, Wuhan, China, 2018. Available online: https://kns.cnki.net (accessed on 27 November 2025).
- Fan, A.L.; Xiong, Y.Q.; He, Y.P.; Yang, L.; Yin, Q.Z. Lifecycle carbon footprint study for alternative fuel power of Yangtze river ships. Ship Eng. 2022, 44, 70–75. [Google Scholar] [CrossRef]
- Xu, S.Y.; Ju, K.Y.; Wang, Y.; Liu, H.L. Comprehensive evaluation and selection strategy of alternative fuel power systems in ships. J. Shanghai Marit. Univ. 2024, 45, 81–88. [Google Scholar] [CrossRef]
- Nguyen, D.; Fernandes, R.J.; Turner, J.W.; Emberson, D.R. Life cycle assessment of ammonia and hydrogen as alternative fuels for marine internal combustion engines. Int. J. Hydrogen Energy 2025, 112, 15–30. [Google Scholar] [CrossRef]
- Fan, A.L.; Xiong, Y.Q.; Yang, L.; Zhang, H.Y.; He, Y.P. Carbon footprint model and low–carbon pathway of inland shipping based on micro–macro analysis. Energy 2023, 263, 126150. [Google Scholar] [CrossRef]
- Yan, X.; He, Y.; Fan, A. Carbon footprint prediction considering the evolution of alternative fuels and cargo: A case study of Yangtze river ships. Renew. Sustain. Energy Rev. 2023, 173, 113068. [Google Scholar] [CrossRef]
- Ait Allal, A.; Mansouri, K.; Youssfi, M.; Qbadou, M. Toward an evaluation of marine fuels for a clean and efficient autonomous ship propulsion energy. Mater. Today Proc. 2019, 13, 486–495. [Google Scholar] [CrossRef]
- ISO 14040:2006; Environmental Management—Life Cycle Assessment—Principles and Framework. International Organization for Standardization: Geneva, Switzerland, 2006. Available online: https://www.iso.org/obp/ui/#iso:std:iso:14040:ed-2:v1:en (accessed on 27 November 2025).
- Zhu, G.Z. Analysis of Building Carbon Emissions Based on Hybrid LCA and Case Study. Master’s Thesis, Hefei University of Technology, Hefei, China, 2022. [Google Scholar] [CrossRef]
- Aziz, N.; Hanafiah, M. Application of life cycle assessment for desalination: Progress, challenges and future directions. Environ. Pollut. 2021, 268, 115948. [Google Scholar] [CrossRef] [PubMed]
- Ren, J.L.; Qin, Y.; Ouyang, C.Y.; Li, W.Q. Study of carbon emissions from a certain inland port project in the upper reaches of the Yangtze River based on LCA. Port Waterw. Eng. 2024, 2, 53–59. [Google Scholar] [CrossRef]
- Zhang, Q.F.; Fang, K.; Xu, M.; Liu, Q.Y. Review of carbon footprint research based on input-output analysis. J. Nat. Resour. 2018, 33, 696–708. [Google Scholar] [CrossRef]
- Castellani, V.; Beylot, A.; Sala, S. Environmental impacts of household consumption in Europe: Comparing process-based LCA and environmentally extended input-output analysis. J. Clean. Prod. 2019, 240, 117966. [Google Scholar] [CrossRef]
- Bakindi, A.; Wiberg, A.H.; Norman, J.; Marsh, E.; Allen, S. Hybrid Life Cycle Assessment (H-LCA) for Buildings and Construction Materials: A Systematic Review and Meta-Analysis. Build. Environ. 2025, 272, 112630. [Google Scholar] [CrossRef]
- Rigot Muller, P.; Lalwani, C.; Mangan, J.; Gregory, O.; Gibbs, D. Optimising end-to-end maritime supply chains: A carbon footprint perspective. Int. J. Logist. Manag. 2013, 24, 407–425. [Google Scholar] [CrossRef]
- Kelmalis, A.; Lekkas, D.F.; Moustakas, K.; Vakalis, S. Assessing the emissions of short sea international shipping: A case study of the Mytilini–Ayvalik route. Environ. Sci. Pollut. Res. 2023, 30, 115496–115505. [Google Scholar] [CrossRef]
- Ye, X.; Wang, L.; Du, J.; Sun, R.H. Study on the ecological efficiency and its temporal dynamic evolution of China’s cruise tourism from the perspective of carbon footprint. Appl. Ecol. Environ. Res. 2019, 17, 13001–13013. [Google Scholar] [CrossRef]
- Parker, R.W.; Vázquez-Rowe, I.; Tyedmers, P.H. Fuel performance and carbon footprint of the global purse seine tuna fleet. J. Clean. Prod. 2015, 103, 517–524. [Google Scholar] [CrossRef]
- Xiong, Q.; Duan, Y.; Liang, D.; Li, T.; Luo, H.L.; Chen, R. Biofuels and Their Blends—A Review of the Effect of Low Carbon Fuels on Engine Performance. Sustainability 2024, 16, 10300. [Google Scholar] [CrossRef]
- Li, C.R.; Zhu, Y.Y.; Zhu, J.Y.; Zhao, Y.F.; Chen, G. Life Cycle Assessment of Utilizing Bio-Oil to Reduce the Carbon Footprint on the Yangtze River Mainline: A Case Study of Container Ships. J. Mar. Sci. Eng. 2024, 12, 226. [Google Scholar] [CrossRef]
- Al Douri, A.; Alsuhaibani, A.S.; Moore, M.; Nielsen, R.B.; EI-Baz, A.A.; EI-Halwagi, M.M. Greenhouse gases emissions in liquified natural gas as a marine fuel: Life cycle analysis and reduction potential. Can. J. Chem. Eng. 2022, 100, 1178–1186. [Google Scholar] [CrossRef]
- Bayraktar, M.; Yuksel, O. A scenario-based assessment of the energy efficiency existing ship index (EEXI) and carbon intensity indicator (CII) regulations. Ocean. Eng. 2023, 278, 114295. [Google Scholar] [CrossRef]
- Pavlenko, N.; Comer, B.; Zhou, Y.R. The Climate Implications of Using LNG as a Marine Fuel; Swedish Environmental Protection Agency: Stockholm, Sweden, 2020; Available online: https://theicct.org/sites/default/files/publications/Climate_implications_LNG_marinefuel_01282020.pdf (accessed on 27 November 2025).
- Perčić, M.; Vladimir, N.; Fan, A.L. Life-cycle cost assessment of alternative marine fuels to reduce the carbon footprint in short-sea shipping: A case study of Croatia. Appl. Energy 2020, 279, 115848. [Google Scholar] [CrossRef]
- Perčić, M.; Vladimir, N.; Fan, A.L. Techno-economic assessment of alternative marine fuels for inland shipping in Croatia. Renew. Sustain. Energy Rev. 2021, 148, 111363. [Google Scholar] [CrossRef]
- Bellot, A.; Baumler, R.; Bouallou, C.; Nemer, M.; Ölcer, A. A cradle-to-grave assessment of carbon and energy footprints of ships using synthetic fuel for net-zeros operations. Ocean. Eng. 2024, 310, 118392. [Google Scholar] [CrossRef]
- Malmgren, E.; Brynolf, S.; Fridell, E.; Grahn, M.; Andersson, K. The environmental performance of a fossil-free ship propulsion system with onboard carbon capture–a life cycle assessment of the HyMethShip concept. Sustain. Energy Fuels 2021, 5, 2753–2770. [Google Scholar] [CrossRef]
- Erdemir, D.; Ibrahim, D. A perspective on the use of ammonia as a clean fuel: Challenges and solutions. Int. J. Energy Res. 2021, 45, 4. [Google Scholar] [CrossRef]
- Chalaris, I.; Jeong, B.; Jang, H. Application of parametric trend life cycle assessment for investigating the carbon footprint of ammonia as marine fuel. Int. J. Life Cycle Assess. 2022, 27, 1145–1163. [Google Scholar] [CrossRef]
- Seddiek, I.S.; Ammar, N.R. Carbon footprint and cost analysis of renewable hydrogen-fuelled ships. Ships Offshore Struct. 2023, 18, 960–969. [Google Scholar] [CrossRef]
- Chu, Y.; Chen, L.; Guan, C. Modeling and full lifecycle carbon emission assessment of ship hydrogen electric hybrid power system. Chin. J. Ship Res. 2024, 19, 122–130. [Google Scholar] [CrossRef]
- Evers, V.H.M.; Kirkels, A.F.; Godjevac, M. Carbon footprint of hydrogen-powered inland shipping: Impacts and hotspots. Renew. Sustain. Energy Rev. 2023, 185, 113629. [Google Scholar] [CrossRef]
- Perčić, M.; Vladimir, N.; Koričan, M. Electrification of inland waterway ships considering power system lifetime emissions and costs. Energies 2021, 14, 7046. [Google Scholar] [CrossRef]
- Ma, C.J.; Dasenbrock, J.; Christian, J. A novel indicator for evaluation of the impact of distributed generations on the energy losses of low voltage distribution grids. Appl. Energy 2019, 242, 674–683. [Google Scholar] [CrossRef]
- Trivyza, N.L.; Rentizelas, A.; Theotokatos, G. Impact of carbon pricing on the cruise ship energy systems optimal configuration. Energy 2019, 175, 952–966. [Google Scholar] [CrossRef]
- Chen, Q.; Lau, Y.Y.; Ge, Y.E.; Dulebenet, M.A.; Kawasaki, T.; Adolf, K.Y.N. Interactions between Arctic passenger ship activities and emissions. Transp. Res. Part D Transp. Environ. 2021, 97, 102925. [Google Scholar] [CrossRef]
- Li, H.J.; Jia, P.; Wang, X.J.; Yang, Z.L.; Wang, J.; Kuang, H.B. Ship carbon dioxide emission estimation in coastal domestic emission control areas using high spatial-temporal resolution data: A China case. Ocean. Coast. Manag. 2023, 232, 106419. [Google Scholar] [CrossRef]
- Wang, P.; Hu, Q.Y.; Xie, W.X.; Wu, L.; Wang, F.; Mei, Q. Big data-driven carbon emission traceability list and characteristics of ships in maritime transportation—A case study of Tianjin Port. Environ. Sci. Pollut. Res. 2023, 30, 71103–71119. [Google Scholar] [CrossRef]
- Zhou, C.; Huang, H.; Liu, Z.; Ding, Y.; Xiao, J.; Shu, Y. Identification and analysis of ship carbon emission hotspots based on data field theory: A case study in Wuhan Port. Ocean. Coast. Manag. 2023, 235, 106479. [Google Scholar] [CrossRef]
- Tian, X.; Shangguan, Y.; Pang, K.; Guo, Y.; Lyu, M.; Wang, S.; Huang, G. Carbon emission allocation policy making in liner shipping: A novel approach toward equitable and efficient maritime sustainability. Ocean. Coast. Manag. 2024, 256, 107270. [Google Scholar] [CrossRef]
- Yang, Y.C. Operating strategies of CO2 reduction for a container terminal based on carbon footprint perspective. J. Clean. Prod. 2017, 141, 472–480. [Google Scholar] [CrossRef]
- Ezeh, C.I.; Richter, U.H.; Seufert, J.H.; Peng, C.S. Operational-based decarbonization of container ports: The case of Ningbo-Zhoushan Port. Int. J. Sustain. Transp. 2024, 18, 34–45. [Google Scholar] [CrossRef]
- Wang, H.; Mao, X.; Rutherford, D. Costs and Benefits of Shore Power at the Port of Shenzhen; The International Council on Clean Transportation: Washington, DC, USA, 2015. [Google Scholar]
- Kwon, J.W.; Yeo, S.; Lee, W.J. Assessment of shipping emissions on Busan port of South Korea. J. Mar. Sci. Eng. 2023, 11, 716. [Google Scholar] [CrossRef]
- Erdas, C.; Fokaides, P.A.; Charalambous, C. Ecological footprint analysis based awareness creation for energy efficiency and climate change mitigation measures enhancing the environmental management system of Limassol port. J. Clean. Prod. 2015, 108, 716–724. [Google Scholar] [CrossRef]
- Cloquell Ballester, V.; Lo-Iacono-Ferreira, V.G.; Artacho-Ramírez, M.Á.; Capuz-Rizo, S.F. The carbon footprint of Valencia port: A case study of the port authority of Valencia (Spain). Int. J. Environ. Res. Public Health 2020, 17, 8157. [Google Scholar] [CrossRef]


Disclaimer/Publisher’s Note: The statements, opinions and data contained in all publications are solely those of the individual author(s) and contributor(s) and not of MDPI and/or the editor(s). MDPI and/or the editor(s) disclaim responsibility for any injury to people or property resulting from any ideas, methods, instructions or products referred to in the content. |
© 2025 by the authors. Licensee MDPI, Basel, Switzerland. This article is an open access article distributed under the terms and conditions of the Creative Commons Attribution (CC BY) license (https://creativecommons.org/licenses/by/4.0/).