


Abstract
This study investigates a shielded reactor coolant pump (RCP) using a thermo-fluid–structure interaction approach to numerically simulate the internal flow characteristics, impeller forces, and rotor vibration modes during rapid start-up following a loss of power accident under high-temperature and high-pressure conditions. A three-dimensional fluid–structure coupling model was established, employing the SST k-ω turbulence model and a one-way fluid–structure interaction method. The effects of three different start-up acceleration rates on pump head, pressure pulsation, vortex structures, turbulent kinetic energy distribution, and dynamic stress on the impeller were systematically analyzed. The results indicate that the medium-acceleration scenario (4.5 s start-up time) exhibits the most favorable performance in terms of pressure pulsation control, vorticity suppression, and stress distribution, effectively avoiding cavitation and structural resonance while ensuring a smooth and reliable start-up process. Modal analysis reveals that the rotor system is predominantly characterized by bending vibrations with satisfactory torsional stiffness and appropriately set critical speeds, presenting no resonance risks. This research provides theoretical foundations and engineering references for the safe restart of RCPs under extreme operational conditions.
1. Introduction
Nuclear energy, as a highly efficient and clean energy source, is attracting increasing global attention due to its significant potential to improve environmental quality and protect the ecological environment on which human survival depends [1]. The Reactor Coolant Pump (RCP), the only rotating equipment within the nuclear island of a reactor, is crucial for continuously and safely cooling the reactor core and preventing the occurrence or escalation of nuclear power plant accidents [2]. As such, the RCP is often referred to as the “heart” of a nuclear power plant [3].
The primary distinction between an RCP and a conventional pump lies in its emphasis on pressure boundary integrity and operational capability under special conditions, imposing stringent requirements on its reliability and safety [4]. With a complex structure, the RCP must operate safely and reliably for extended periods under harsh conditions involving high temperature, high pressure, and strong radiation, while subjected to multiple coupled physical fields. It performs the critical function of maintaining coolant circulation through the core and ensuring efficient heat removal [5].
Under extreme conditions, such as station blackouts or equipment failures, the pump’s rotational speed drops sharply, leading to a sudden reduction in coolant flow through the core. This deteriorates heat transfer, raises the temperature of the fuel rods, and increases the temperature and pressure of the coolant. Without effective countermeasures, these conditions may result in fuel cladding damage and core meltdown [6]. Furthermore, the rapid change in fluid flow within the pressure piping can cause significant pressure fluctuations and oscillations, highly likely inducing water hammer phenomena. The presence of water hammer imposes drastic load variations on the piping system, potentially causing minor issues like noise and vibration, or severe damage to system equipment such as the main pump and pipelines [7]. In these scenarios, rapidly restarting the RCP is crucial. The success of this restart operation, which must avoid issues like material deformation and bearing resonance, is directly tied to the ability to remove residual heat from the reactor and mitigate the risk of a core meltdown.
Regarding the operational characteristics of RCPs under extreme conditions, researchers domestically and internationally have conducted extensive studies using numerical simulations and experimental methods. Among them, Liu [8] combined numerical simulation with experimental measurements to fully simulate the emergency start-up process of an RCP, confirming its compliance with nuclear power plant safety regulations. Gao [9] conducted numerical and experimental studies on the transient process during RCP shutdown. Liu Xiajie [10] experimentally investigated the transient hydraulic characteristics during the coast-down process after a power loss. Ye [11] studied the transitional performance of an RCP during a shutdown following a power loss. Ze [12] analyzed the hydraulic transition process and hydraulic performance of an RCP during a station blackout using experimental data. Deng [13] employed internationally conventional transient calculation methods for main pumps to analyze three transients for the Qin Shan Nuclear Power Phase II project: simultaneous loss of AC power for two main pumps, single pump coast-down, and pump rotor seizure. The calculation results showed good agreement with those from Framatome ANP. Zhang [14] used a pressurized water reactor thermal-hydraulic transient analysis program to quantitatively study the transient characteristics of a marine nuclear power main pump under three different moments of inertia after a power loss accident, concluding that a larger pump moment of inertia can mitigate post-accident consequences and improve reactor safety. Xu [15] simplified the RCP coast-down model reasonably using the transient momentum conservation equation for RCPs, deriving a new rotational speed model.
Based on currently published literature, research on RCP operation under extreme conditions, particularly during loss-of-power accidents, has primarily focused on the hydraulic performance during coast-down shutdown. Studies on the rapid restart of an RCP after a power loss and the safety characteristics of this restart process are relatively scarce.
This paper aims to address this gap in the field. Taking a shielded reactor coolant pump as the research object, it employs numerical simulation methods to model the internal flow during restart after a shutdown under high temperature and pressure conditions following a power loss, along with an analysis of impeller forces and rotor resonance modes.
2. Establishment and Methodology of the Numerical Model
2.1. Establishment of the 3D and Mesh Models
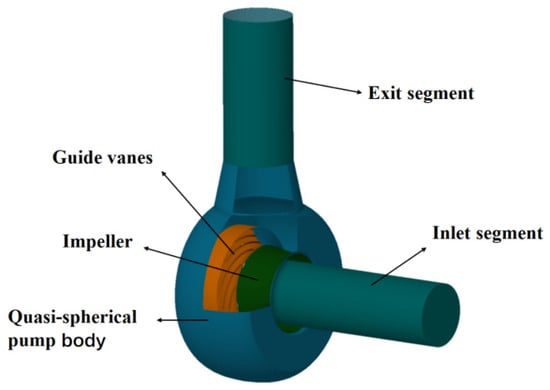
This study employs a shielded reactor coolant pump (RCP) as the prototypical research object, with a rated flow rate of Q = 21,642 m3/h, a head of H = 111.3 m, and a rotational speed of n = 1480 r/min. The three-dimensional model of the RCP fluid domain was created using NX software, as shown in Figure 1. The model encompasses the inlet and outlet sections, a spherical-like pump casing, the impeller, and the diffuser.
Figure 1.
Three-dimensional model of the fluid domain.
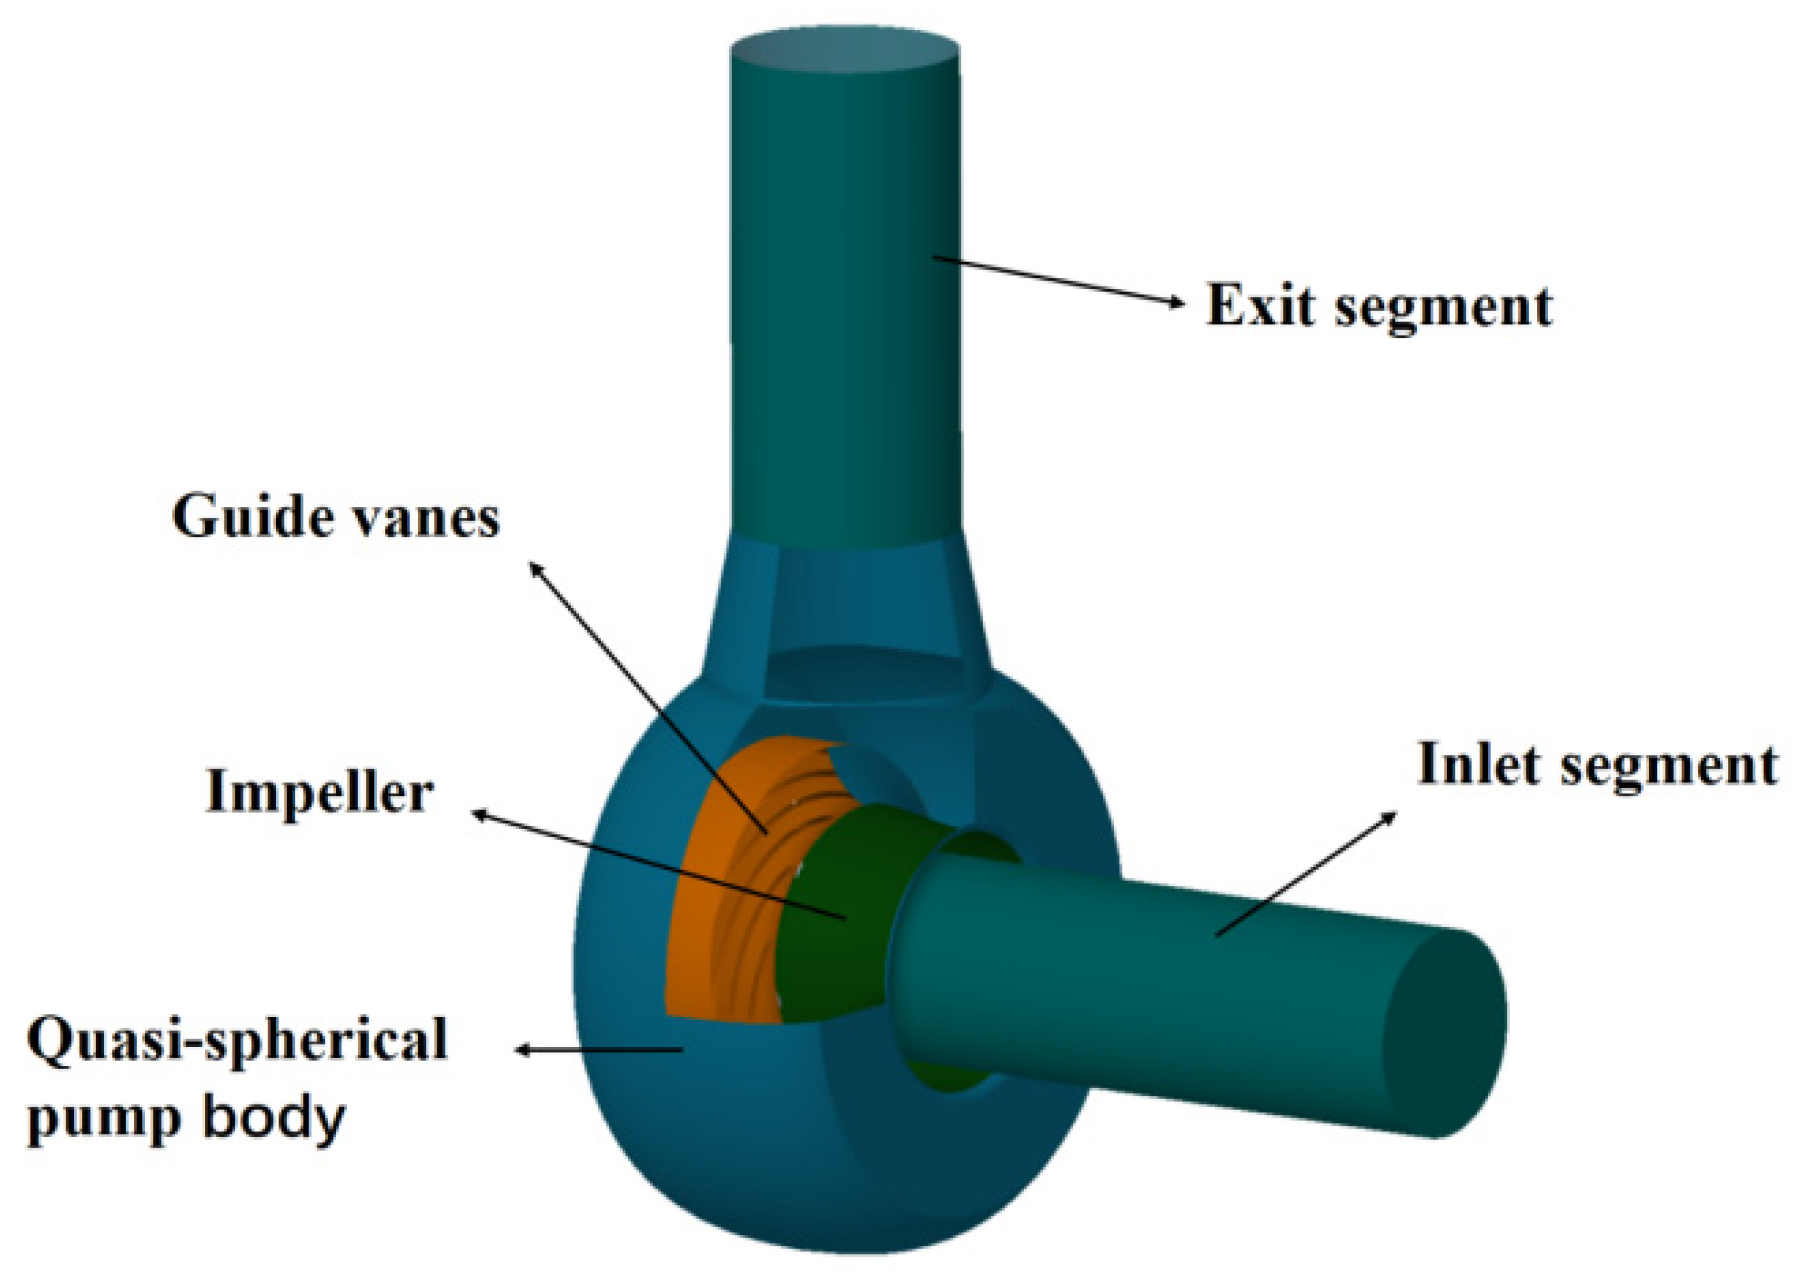
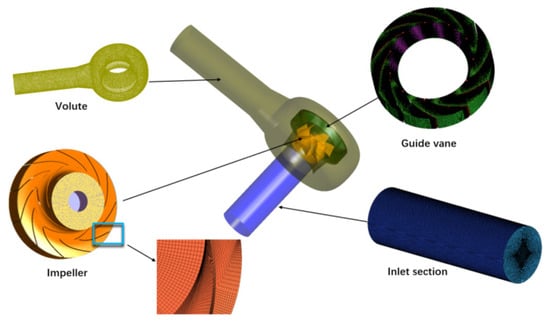
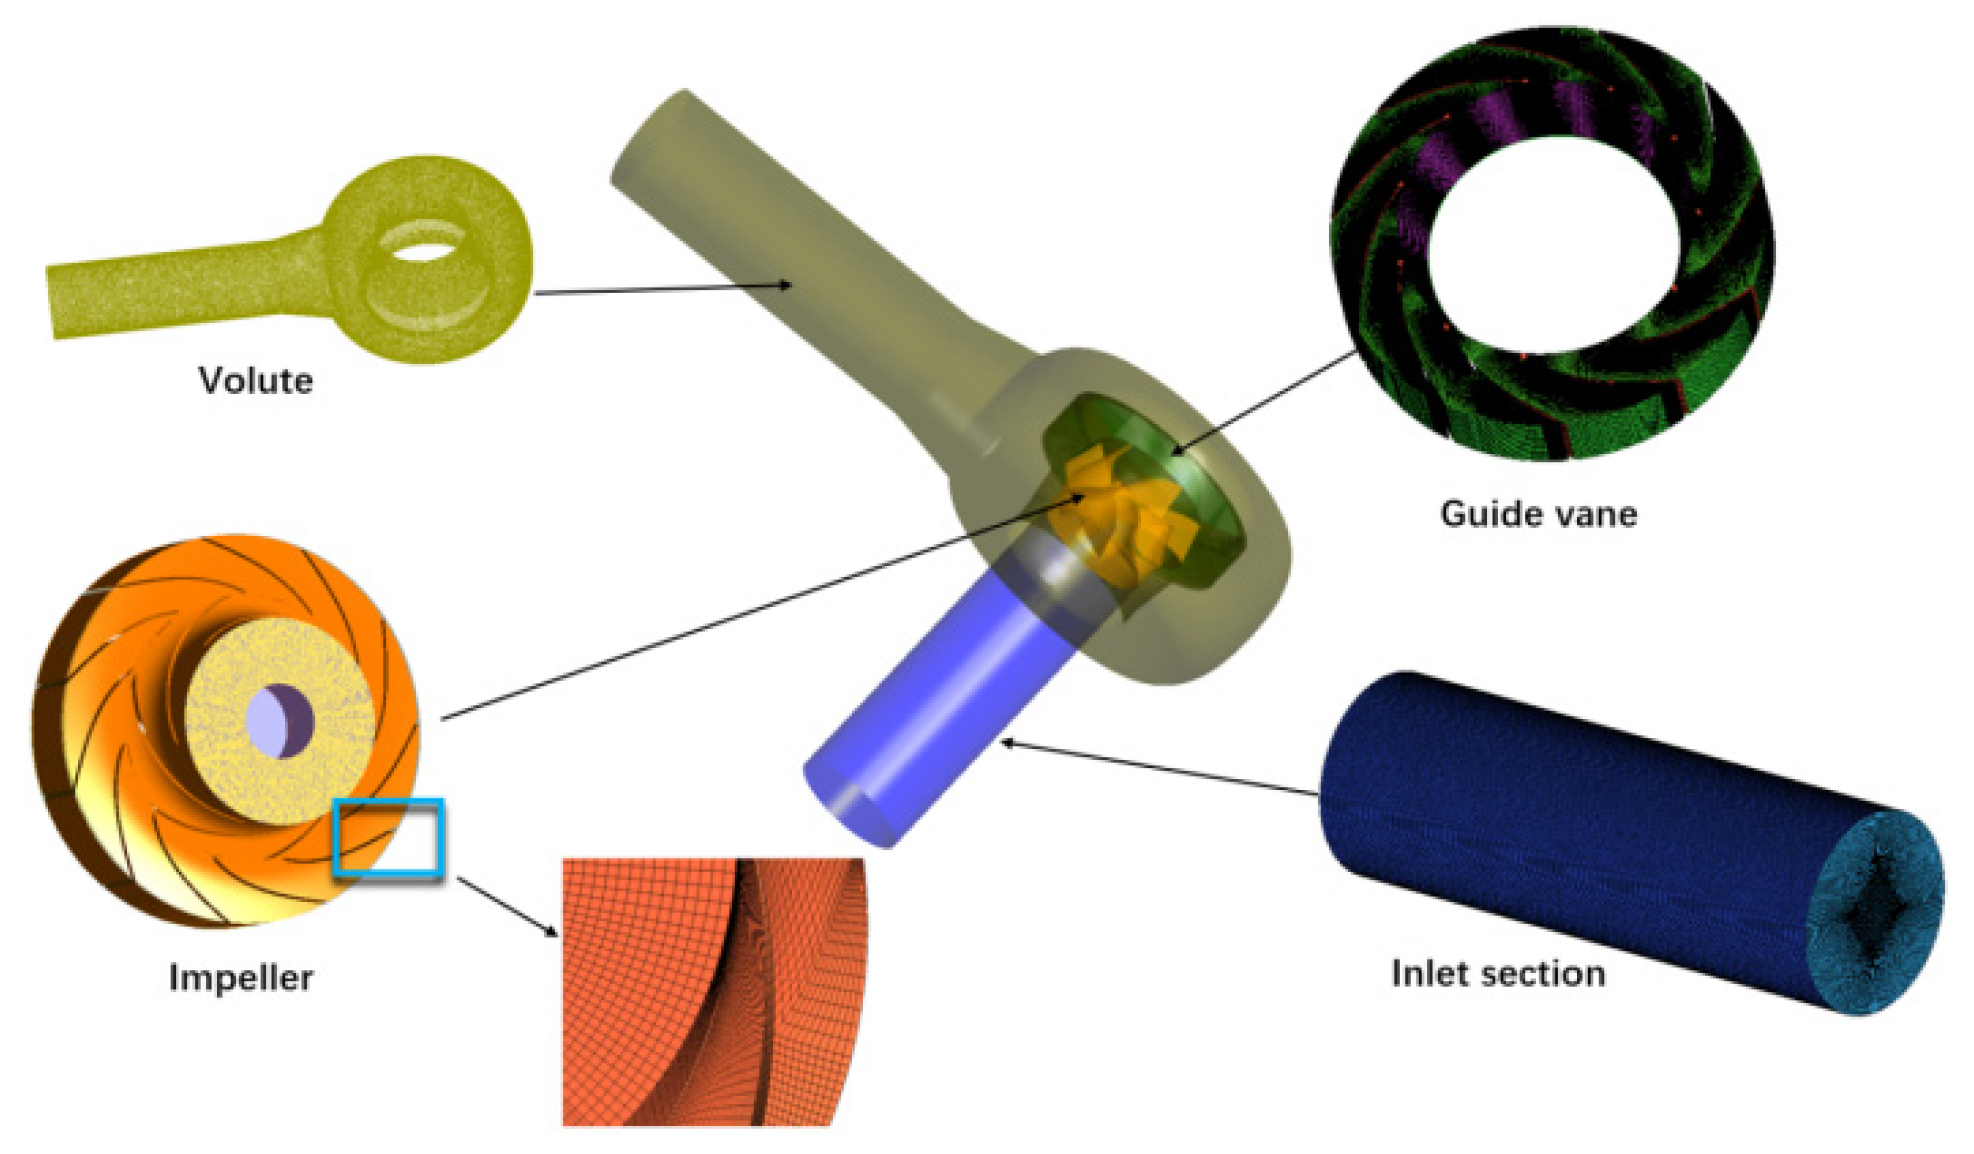
The fluid domain was meshed using ANSYS ICEM, with the entire domain discretized using hexahedral structured grids as illustrated in Figure 2. Given the primary focus on analyzing the impeller, localized mesh refinement was specifically applied to this region.
Figure 2.
Mesh Generation.
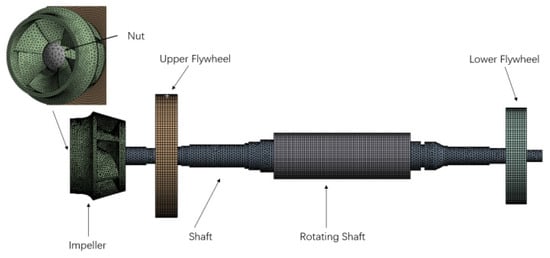
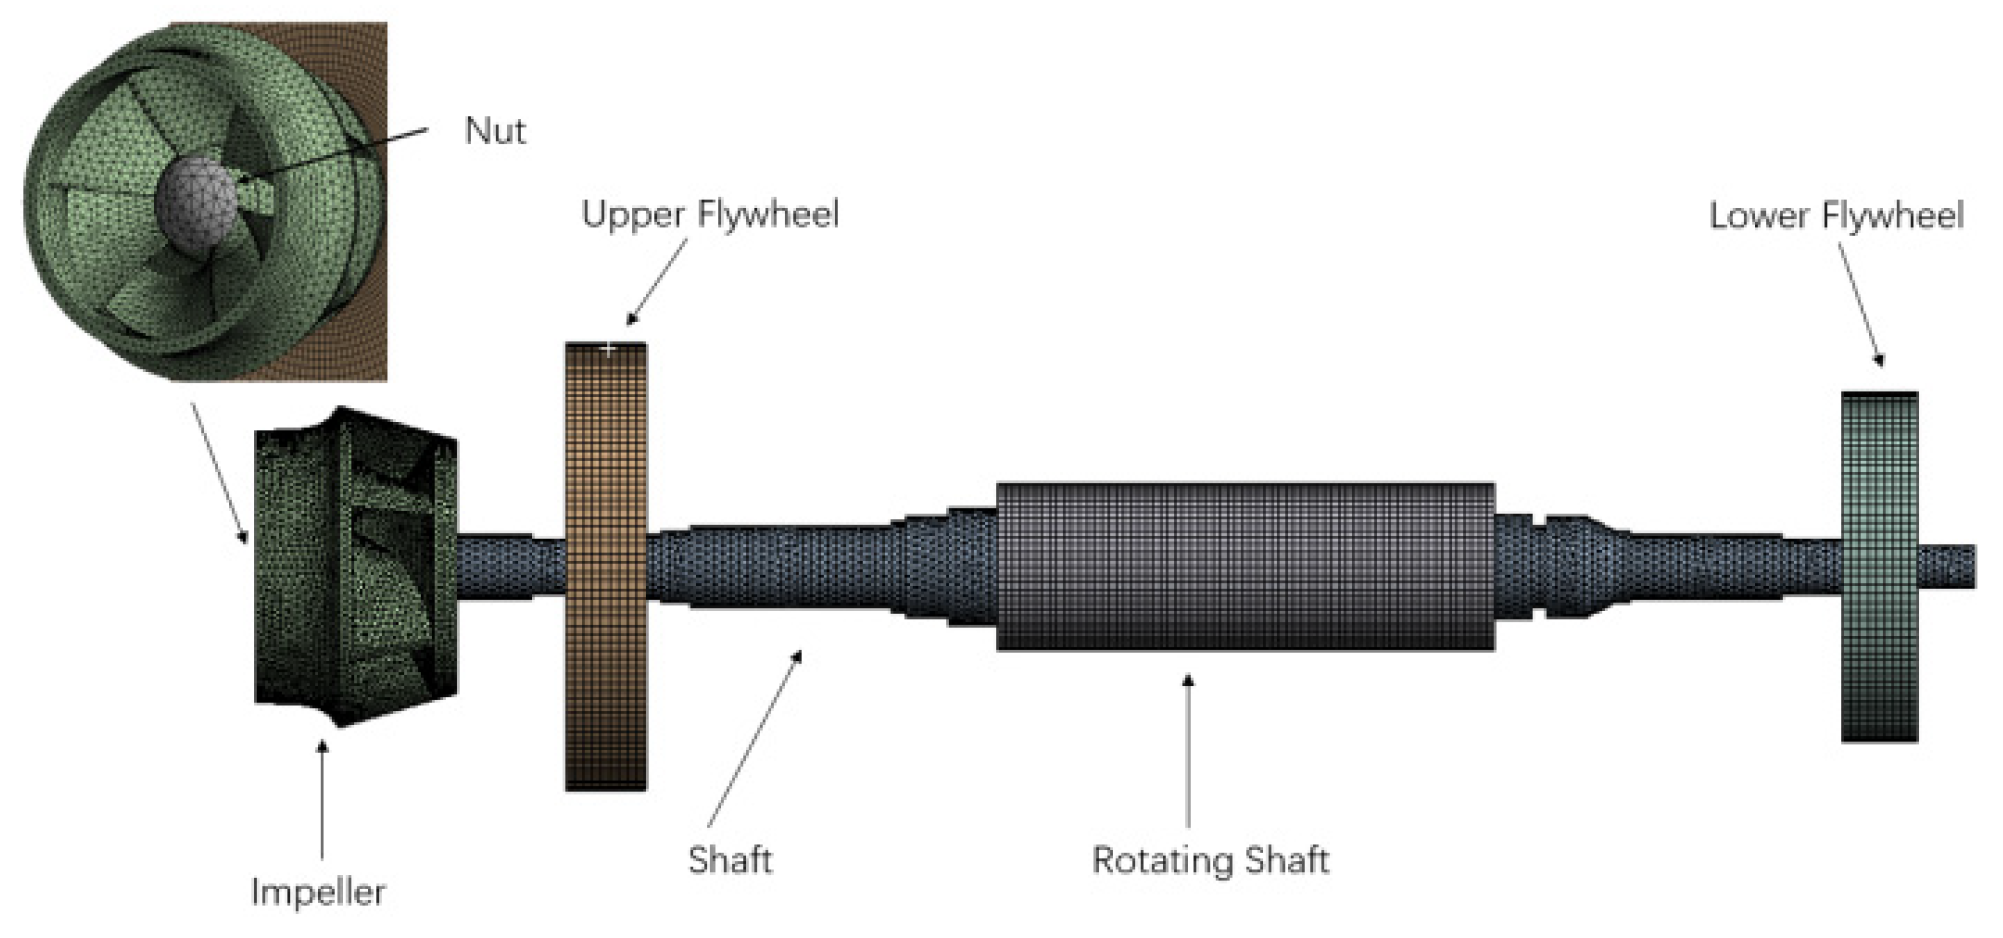
The solid domain of the impeller assembly consists of a rotating shaft, rotor core, impeller nut, upper and lower flywheels, and the impeller itself. The model was constructed using UG NX, as illustrated in Figure 3.
Figure 3.
Solid Domain Modeling.
2.2. Grid Independence Verification
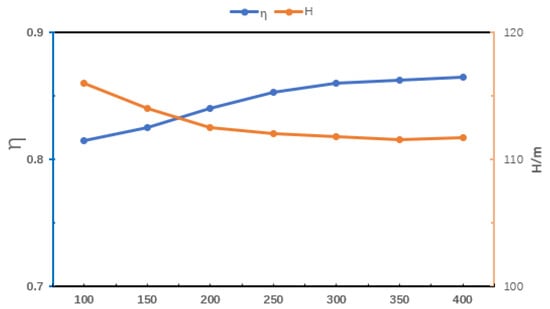
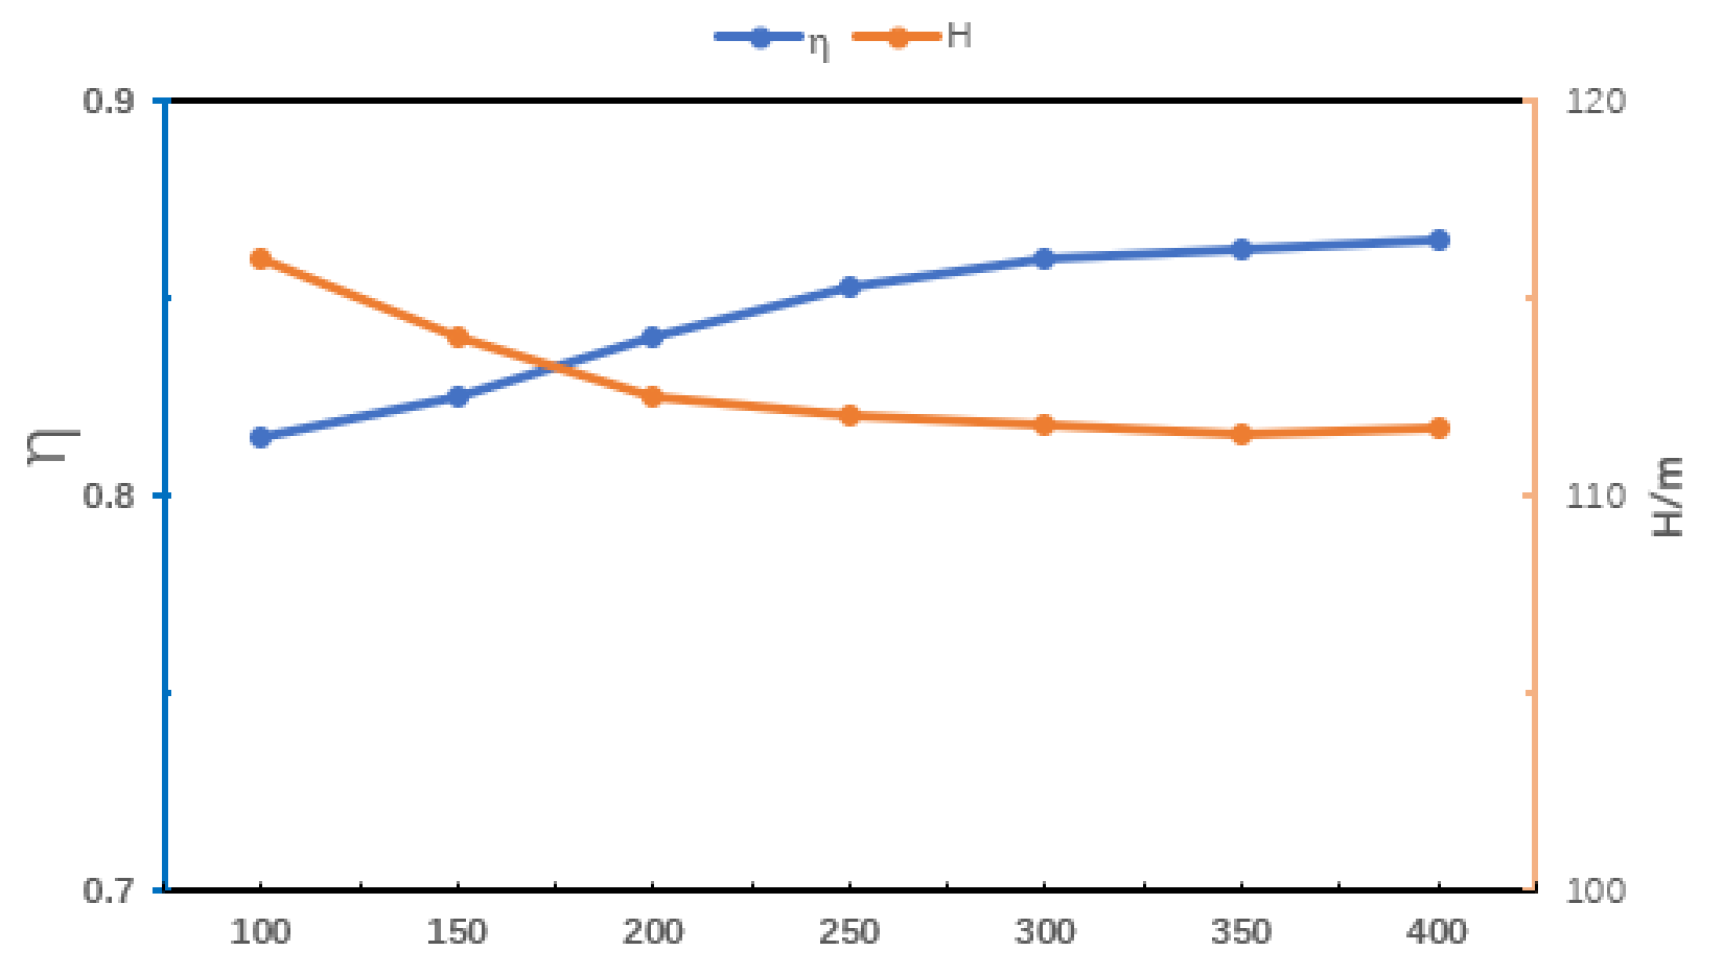
Within the cover letter, the corresponding author should declare that the manuscript is original and has not been published, nor is it currently under consideration for publication elsewhere. It should also be declared that the final version of the manuscript is confirmed by all the authors and they are all aware of this submission. Do not include cover letter heading or content anywhere on your paper. To validate the mesh independence of the numerical model for the reactor coolant pump (RCP), a comprehensive evaluation was conducted by analyzing the variations in impeller efficiency (η) and head (H) across seven distinct grid density configurations, as illustrated in Figure 4.
Figure 4.
Grid Independence Verification.
When the grid density reached approximately 3.6 million elements, the fluctuations in both efficiency and head exhibited minimal variations (less than 0.5%), indicating convergence. Balancing computational accuracy and cost, the model with 3.6 million elements was selected for flow field calculations. This approach ensures computational precision while significantly reducing computational overhead, and simultaneously satisfies the mesh independence requirements for transient fluid–structure interaction analysis of the reactor coolant pump.
2.3. Theoretical Foundation and Governing Equations
In the CFD numerical simulations conducted in this study, the analyzed reactor coolant pump (RCP) must adhere to the governing equations of fluid motion [16], including the continuity equation, momentum equation, and energy equation. These equations comply with the three fundamental conservation laws of physics: mass conservation, momentum conservation, and energy conservation [17].
- (1)
- Continuity Equation
In the equation:
ρ denotes the time-averaged density; u represents the time-averaged velocity vector.
- (2)
- Momentum Equation
In the equation:
p denotes the time-averaged pressure; τ represents the stress tensor; f signifies the body force density.
- (3)
- Energy Equation
2.4. Selection of Turbulence Model
The primary function of a turbulence model is to simulate and approximate the Reynolds stress term in the fluid momentum equations, thereby accurately describing turbulent effects. Common turbulence models include the standard k-ε model [18], the RNG k-ε model [19], the realizable k-ε model [20], and the SST k-ω model [21]. These models simplify the solution of the fluid momentum equations by assuming turbulent vortex structures of different scales and representing their effects through a set of formulated equations.
The SST k-ω model has been widely applied across various fields in CFD fluid simulations and has demonstrated outstanding performance in the analysis of RCPs (Reactor Coolant Pumps). In numerous studies involving hydraulic performance simulations and experimental validations of RCPs, results obtained using this model have shown excellent agreement with experimental data. The SST k-ω model combines the accuracy of the k-ω model in resolving near-wall viscous flows with the robustness of the k-ε model in handling free-shear flows in the far field. Given that the numerical calculations in this study involve water as the fluid medium, the SST k-ω model was selected for simulating turbulence in the RCP.
In the equations: represents the production term of specific dissipation rate ω; and denote the destruction of turbulent kinetic energy. ; ; ; ; In the high-Reynolds-number k-ε model, α* = 1.
The SST k-ω model integrates the k-ε and k-ω models, combining the advantages of both approaches. Its governing equations are consistent with those presented in Equations (5) and (6): , S represents the magnitude of the strain rate tensor., ; ; ; ; ; ; ; ; y represents the distance to the nearest wall; ; ; ; ; ; .
2.5. Governing Equations for Thermo-Fluid–Structure Interaction
The governing equations for thermo-fluid–structure interaction describe the coupled physical processes of fluid flow, solid structural deformation, and heat transfer. The fundamental formulation of these equations incorporates the coupling of CFD governing equations, the heat conduction equation, and the structural dynamics equation. The CFD governing equations are shown in (7)–(9), while the mathematical expressions for the heat conduction equation [22] and structural dynamics equation [23] are as follows:
In the equations, k represents the heat transfer coefficient, A denotes the heat transfer area, and ΔTm indicates the mean temperature difference. Additionally, ẍ and ẋ represent the acceleration vector and velocity vector, respectively, while [M], [C], [K], and F(t) correspond to the mass matrix, damping matrix, stiffness matrix, and force vector, respectively. These parameters collectively define the coupled thermo-mechanical behavior in the fluid–structure interaction analysis.
The interaction between the fluid and solid domains is achieved through interface coupling technology. At the fluid-solid interface, variables including displacement, heat flux, temperature, and stress remain consistent between the liquid and solid phases. The mathematical representation of these conditions is as follows:
In the equations, n denotes the normal direction, τ represents stress, d indicates displacement, q signifies heat flux, and T represents temperature. The subscripts f and s refer to the fluid and solid domains, respectively. These variables define the boundary conditions and coupling mechanisms at the fluid-solid interface, ensuring physical continuity in multiphysics simulations.
2.6. Modal Analysis Theory
Modal analysis is an analytical method used to address vibration problems in multi-degree-of-freedom systems. It typically decomposes a multi-degree-of-freedom system into multiple single-degree-of-freedom systems, then combines their solutions to resolve the behavior of the original system [24]. The following assumptions are generally adopted in modal analysis [25].
- (1)
- The stiffness and mass properties of the structure remain unchanged;
- (2)
- The structure is only subjected to initial excitation, and damping effects are neglected unless explicitly specified;
- (3)
- The structural loads remain constant over time.
Modal analysis is also a structural mechanics analysis method. Therefore, its vibration equation is consistent with Equation (8). When damping is neglected, the structural vibration equation can be expressed as follows [26]:
The free vibration of a linear system can be expressed as a linear combination of the system’s state vector along modal vibration patterns, as given by the following equation:
In the equation: represents the eigenvector of the i-th modal shape; denotes the i-th natural vibration frequency; t indicates time.
By combining Equations (10) and (11), we obtain:
Since ≠ 0, it follows that:
2.7. Numerical Methods and Boundary Conditions
Numerical simulations of the internal flow field were conducted using ANSYS CFX software (version 2022). The widely adopted engineering turbulence model, RNG k-ε, was selected for this study as an improvement over the standard k-ε model. It is particularly suitable for simulating the transient processes during the startup of a reactor coolant pump (RCP).
The boundary conditions were set as a pressure inlet and a flow rate outlet. Since both the rotational speed and flow rate vary as functions of time during the pump startup process, the relationship between rotational speed, flow rate, and time was derived by fitting curves based on the three sets of startup acceleration data and their corresponding flow rate and rotational speed values [27]. This approach simplifies the computational process while accurately capturing the transient behavior.
The relationship expressions were then compiled using the CFX Expression Language (CEL), after which the rotational speed-time function was applied to the impeller’s boundary conditions, and the flow rate-time function was assigned to the outlet boundary condition of the pump. After setting the inlet and outlet boundary conditions, and considering that some fluid remains in the pump during the startup process after a power loss while the impeller rotates at a low inertial speed, a steady-state simulation of the pump at t = 0.076 s was conducted and used as the initial condition for the transient simulation. Given that smaller startup accelerations result in longer stabilization times for flow rate and rotational speed, and due to the continuously varying rotational speed during startup, a conventional fixed time-step approach was deemed unsuitable. To balance computational efficiency with accuracy, a variable time-step strategy was employed: for a total startup time of 2.000 s, a time step of 0.000960 s was used (corresponding to 8° of impeller rotation per step); for a total time of 4.500 s, a time step of 0.001400 s was applied for the first 1.500 s (6° per step); for a total startup time of 8.500 s, the time step was divided into three segments: 0.001100 s (5° per step) for the first 2.000 s, and 0.000789 s (6° per step) for the subsequent 2.500 s. Transient simulations were then conducted using a second-order upwind scheme. The residual is 10−5, and each scheme design calculates about 8000 steps.
For the prestressed modal analysis under fluid–structure interaction conditions, steady-state flow field results were utilized. The flow fields for three acceleration scenarios were computed, and the most suitable case was selected for modal analysis based on pressure pulsation characteristics. Pressure results from the flow field were imported as structural pressure loads, and temperature loads from the thermal field were applied. Radial and thrust bearing constraints were imposed at the bearing locations, while fixed support was applied at the shaft end to restrict rotational degrees of freedom. Temperature loads were simultaneously applied. The prestress results were transferred to the modal analysis module to compute natural frequencies and mode shapes, evaluating the potential for resonance during extreme operational conditions when both flow rate and rotational speed are increasing.
A one-way fluid–structure coupling approach was employed to compute the dynamic stress of the RCP. The temperature field calculated by CFD was introduced as a boundary condition for the transient thermal analysis. Given the complexity of the acceleration process, impeller stress was analyzed at different flow points to clarify the dynamic stress behavior during power-loss acceleration. The impeller experiences multiple loads during acceleration: pressure loads from CFD were applied as boundary conditions on the fluid-impeller interface; temperature loads were applied via the transient thermal field; centrifugal force, gravity, and acceleration were applied through the transient structural field. Fixed support was applied at two radial bearings and one thrust bearing constraint. The results were evaluated based on the von Mises stress (derived from the fourth strength theory [28]), which provides a comprehensive measure of equivalent stress under multiaxial loading conditions.
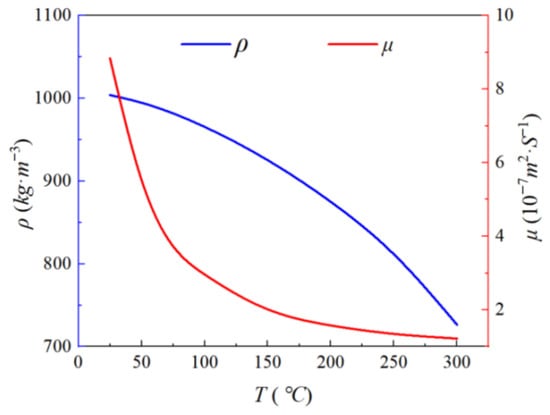
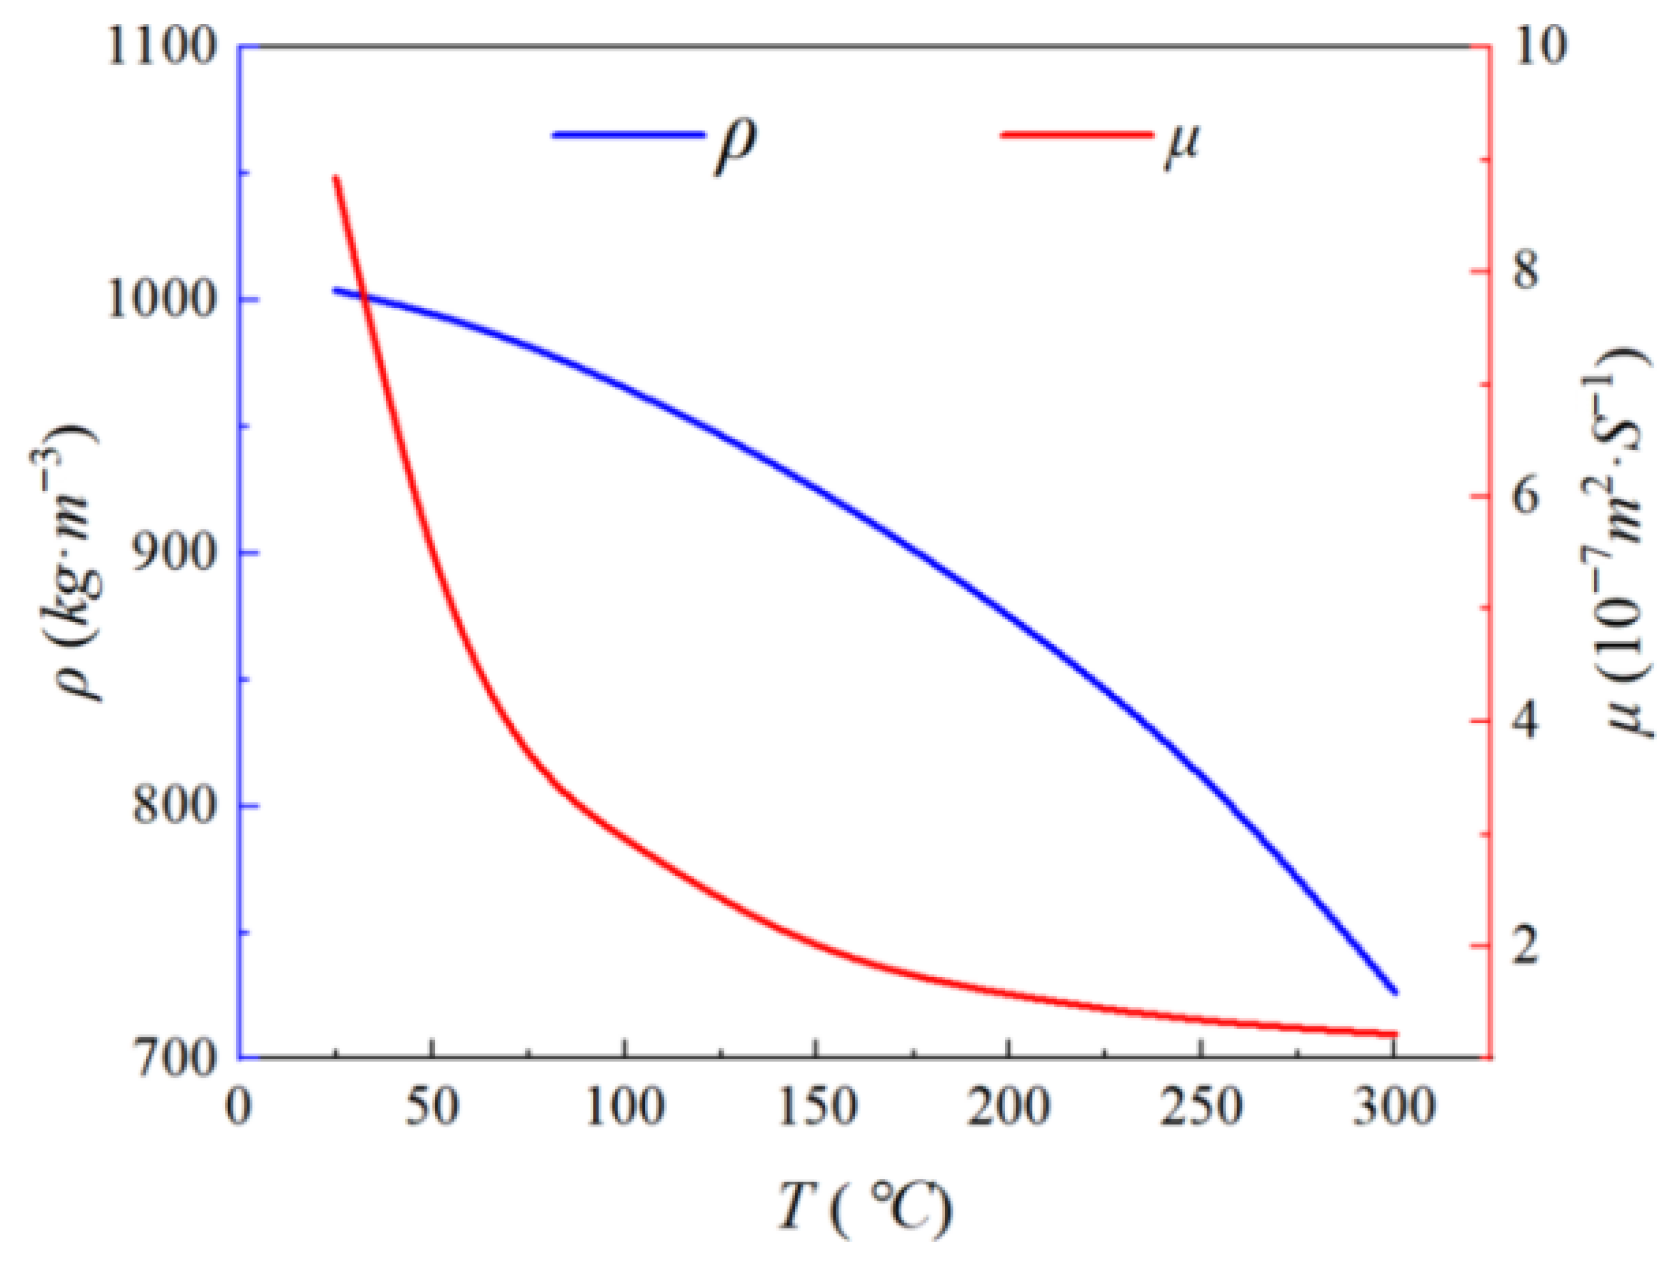
Considering that the coolant flowing through the impeller is a borated solution, its impact on the impeller is negligible [29]. Both the solid and fluid domains use water as the medium. Through calculation and referencing relevant standards, the trends of density (ρ) and kinematic viscosity (μ) of water at 15.5 MPa varying with temperature are shown in Figure 5.
Figure 5.
The variation in density ρ and kinematic viscosity μ of clear water at 15.5 MPa as a function of temperature.
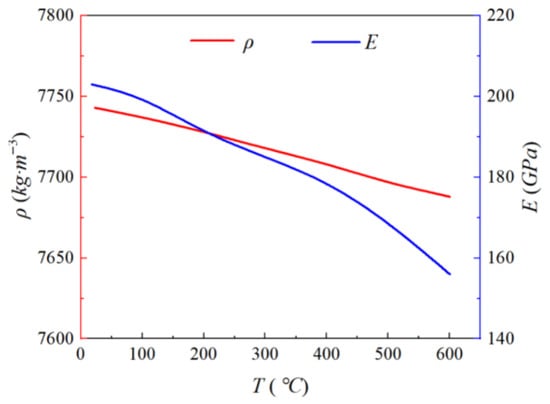
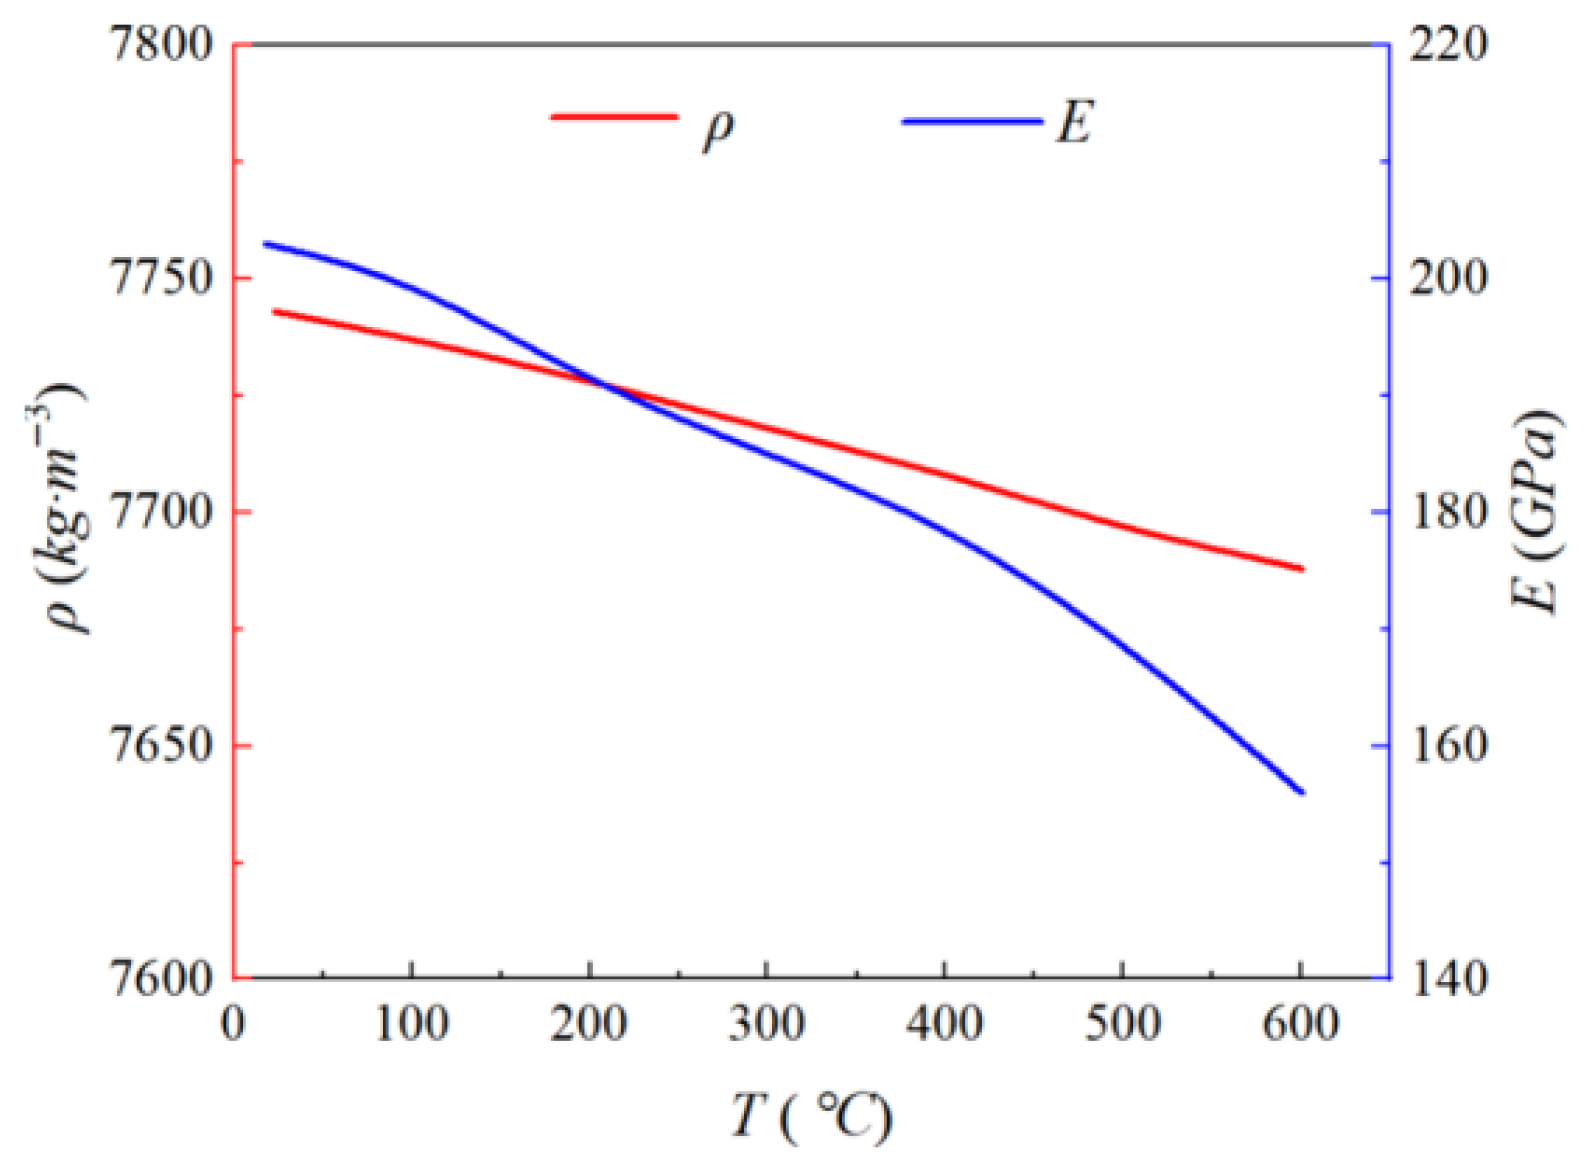
ASME 182F6NM (13Cr4Ni) was selected as the solid material. The variation in its fundamental physical properties, density and Young’s module, with temperature in shown in Figure 6.
Figure 6.
The variation in density and Young’s modulus of 13Cr4Ni with temperature.
2.8. Room-Temperature Experimental Validation
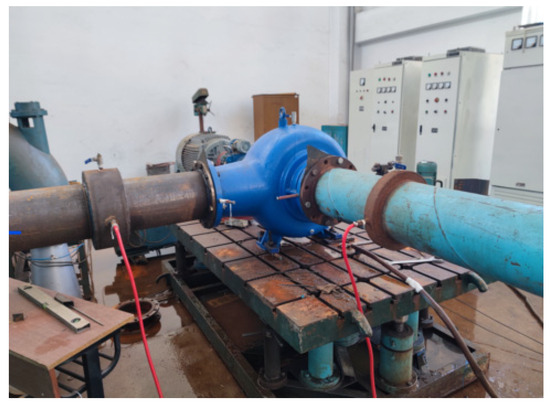
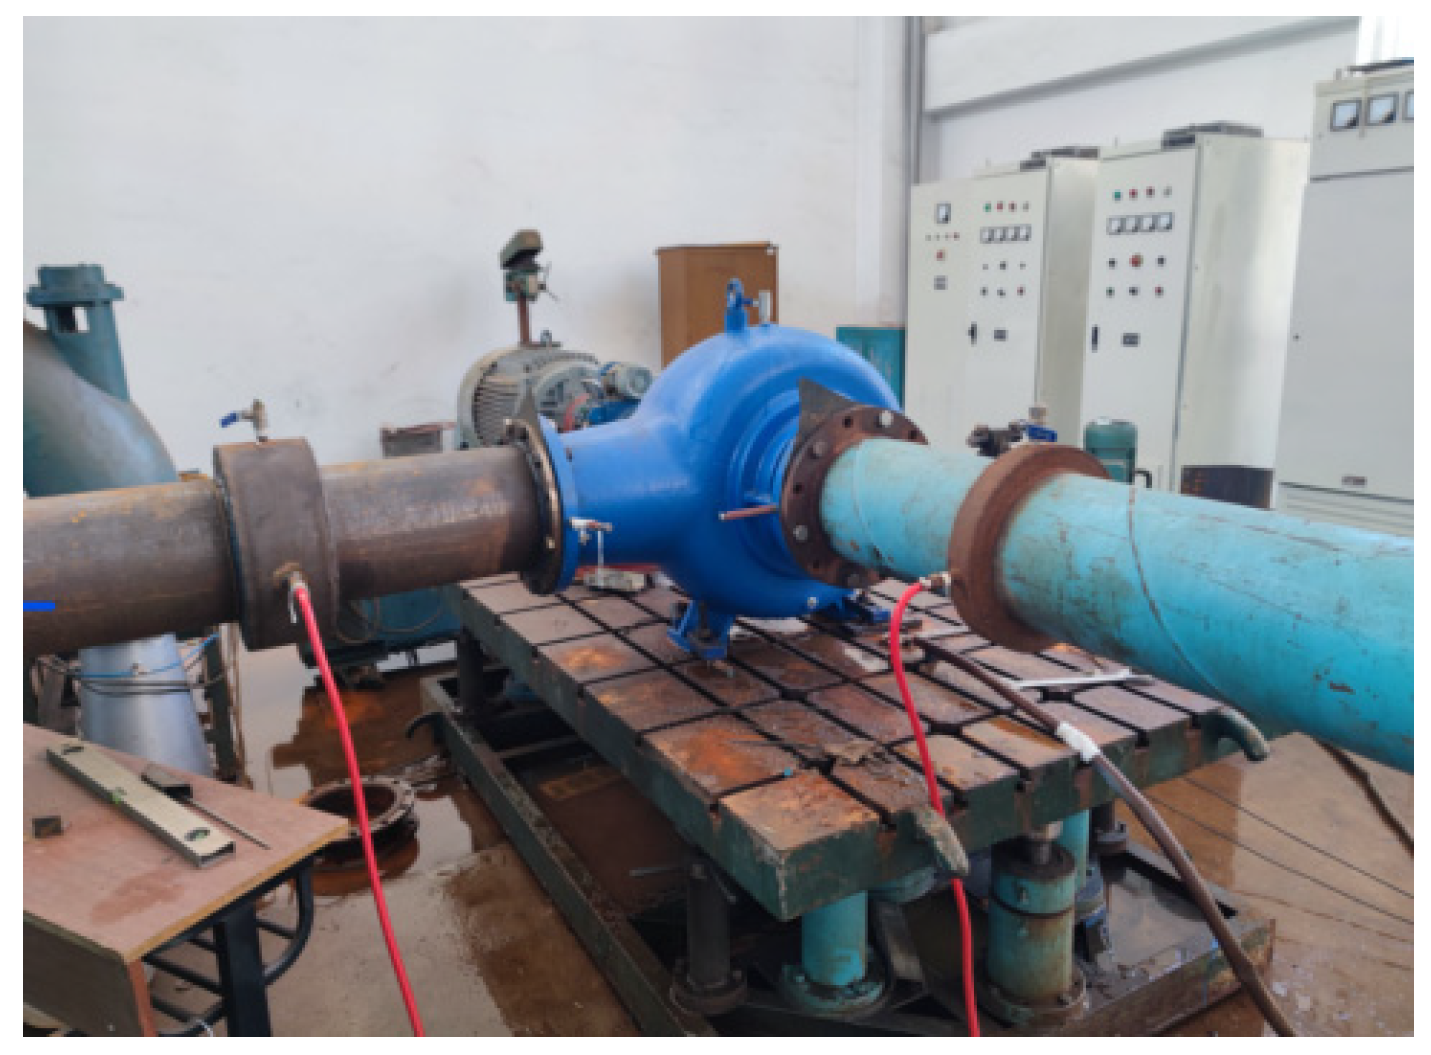
To validate the reliability of the numerical simulation results, a scaled-down prototype of the RCP was manufactured using a similarity transformation algorithm [30], and its performance was tested on a room-temperature test rig. The scale ratio between the model pump and the prototype pump is 1:2.72. Although the CAP1400 RCP is a vertical pump, the external characteristics of the model pump were not affected by its orientation (horizontal or vertical) during testing. The test rig is shown in Figure 7.
Figure 7.
Test Rig.
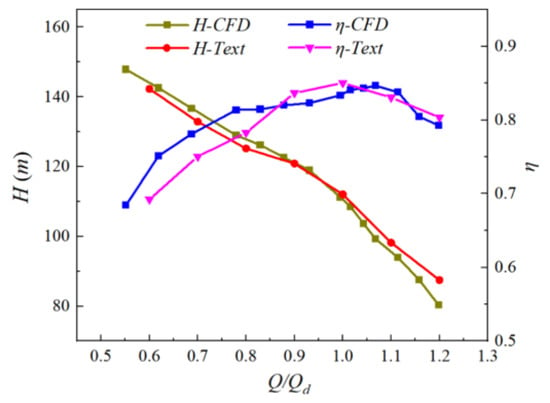
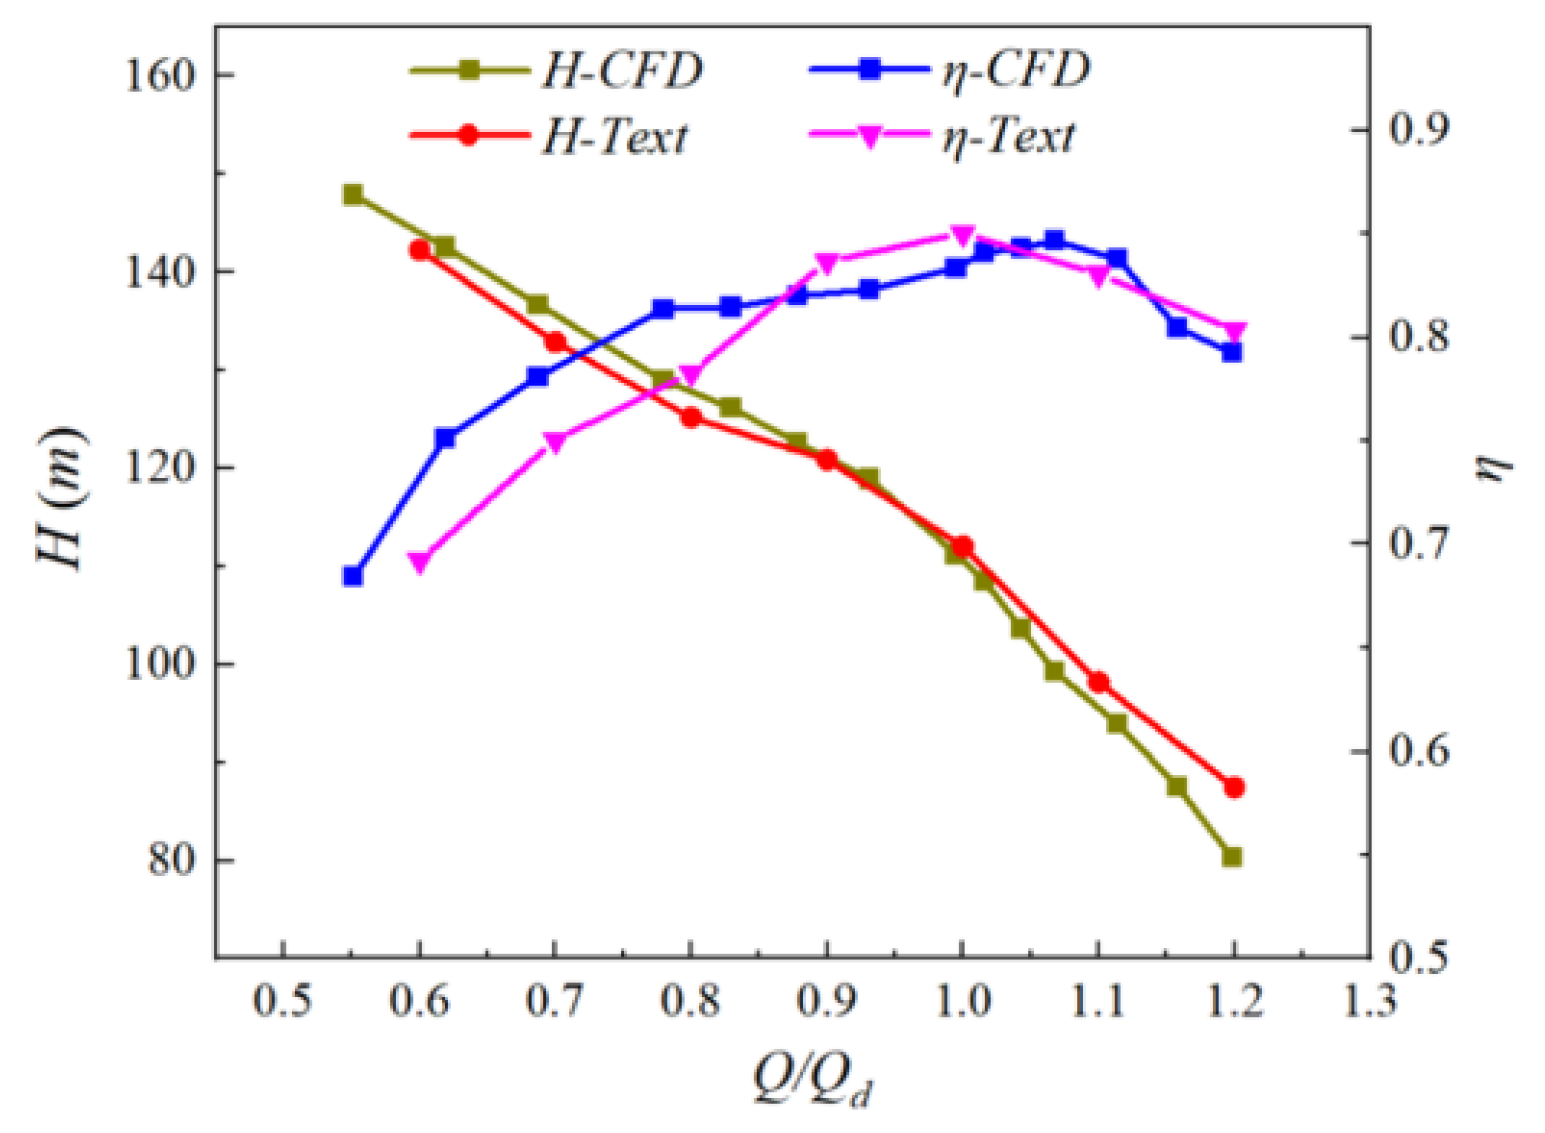
As observed from the test results (Figure 8), the numerical simulation trends show no significant discrepancies from the experimental data. Within the flow rate range of 0.6Qd to 1.2Qd, the relative deviation of the head remains within 2%, while the efficiency deviation does not exceed 5%. At the rated operating point, the relative deviations of head and efficiency are 1.6% and 2.2%, respectively. This demonstrates that the numerical simulation method employed in this study achieves high computational accuracy and can be reliably applied to CFD simulations of internal flow in the RCP.
Figure 8.
Numerical Simulation and Experimental Validation.
3. Analysis of Results
3.1. Analysis of Impeller Performance Curves
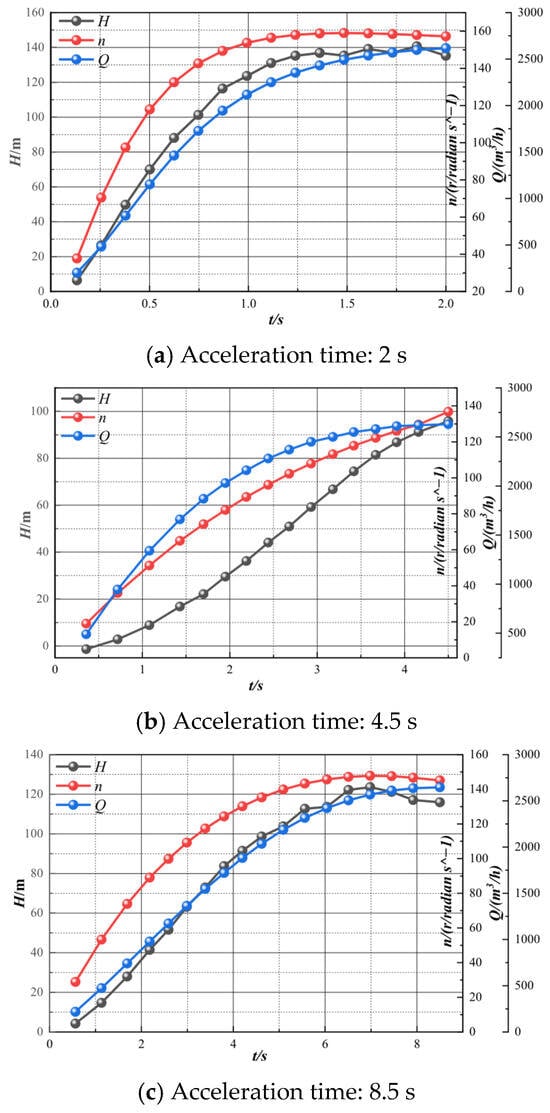
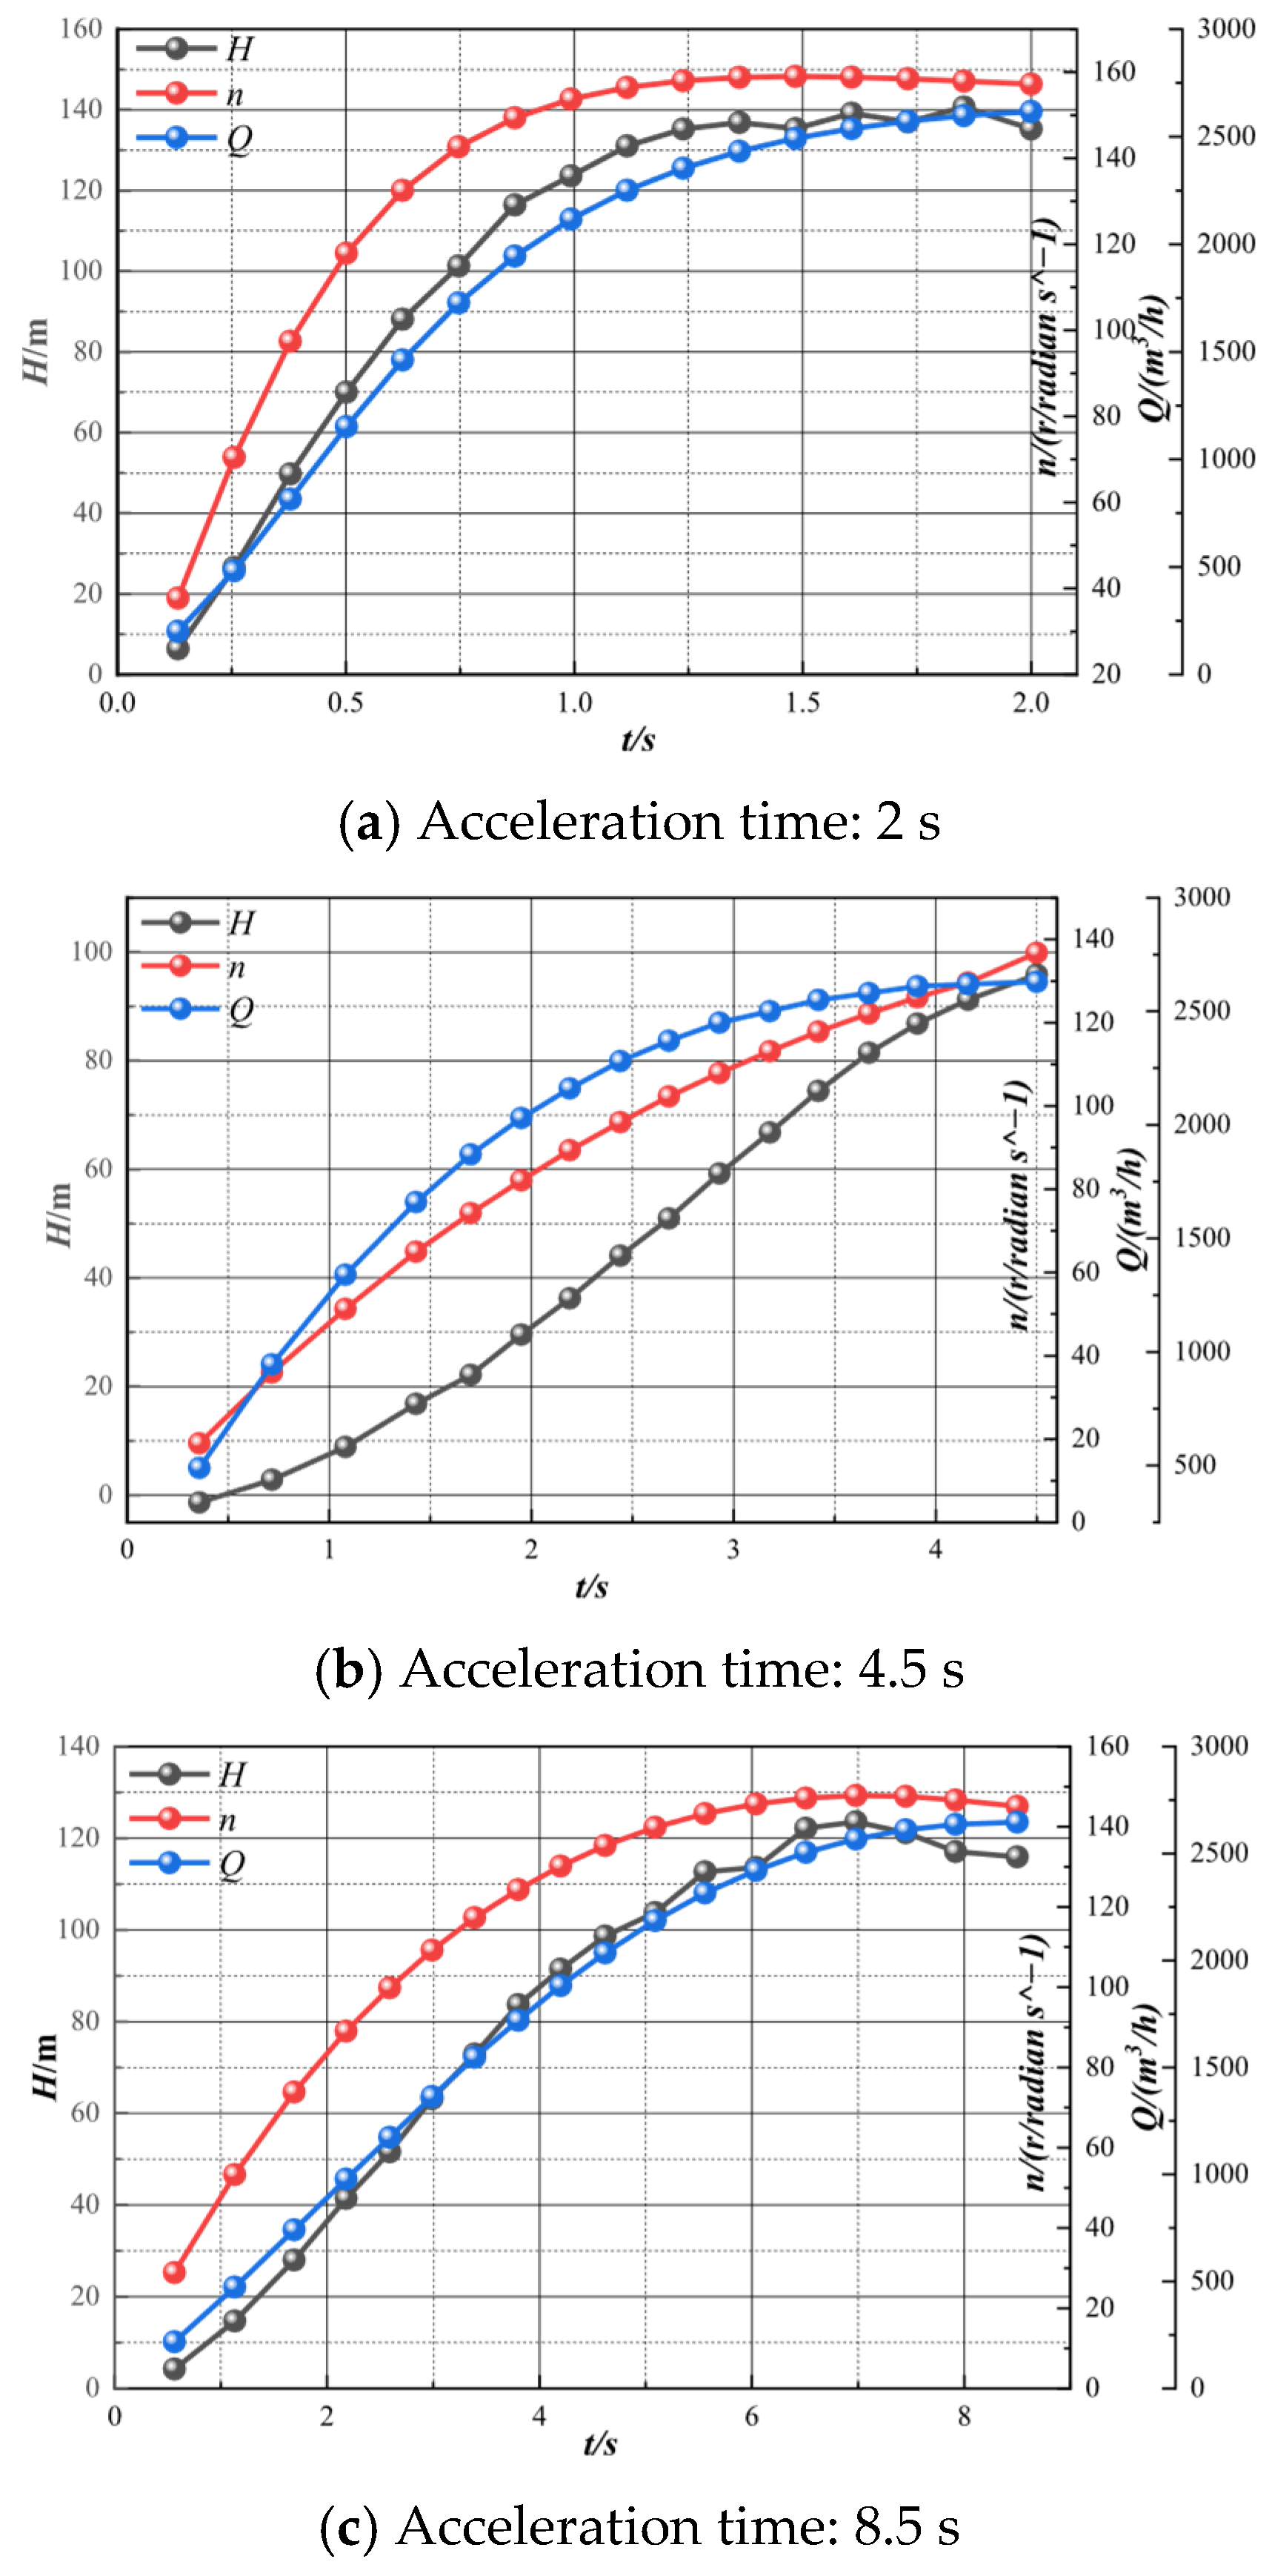
Based on the defined transient external characteristic conditions during the startup process, transient simulations were performed for the three acceleration cases to analyze the evolution of head, rotational speed, and flow rate. The simulation results are shown in the accompanying Figure 9.
Figure 9.
Performance Characteristics Curves.
As shown in Figure 9a, which represents the shortest acceleration time and largest acceleration magnitude among the three cases, both the head and efficiency rise rapidly during the initial acceleration phase along with the increasing rotational speed. The acceleration process is essentially completed within 1 s, followed by a gradual transition to steady-state operation. While this case achieves the shortest stabilization time, the transition process exhibits instability, leading to complex and disordered internal flow patterns during acceleration.
In contrast to Figure 9a, the external characteristic curves in Figure 9b,c demonstrate more gradual changes. Although Figure 9c shows a slow initial rise, some fluctuations occur during the mid-phase; however, the flow gradually stabilizes as the process continues. Notably, Figure 9b demonstrates no significant sudden changes in flow rate or head during acceleration—both parameters increase almost monotonically and eventually converge toward the rated head as the fluid flow becomes fully developed.
The following section will analyze this acceleration process from the perspective of pressure pulsation characteristics.
3.2. Pressure Pulsation Analysis
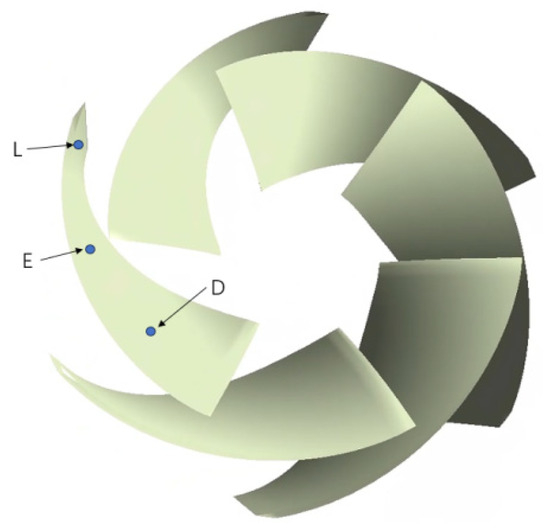
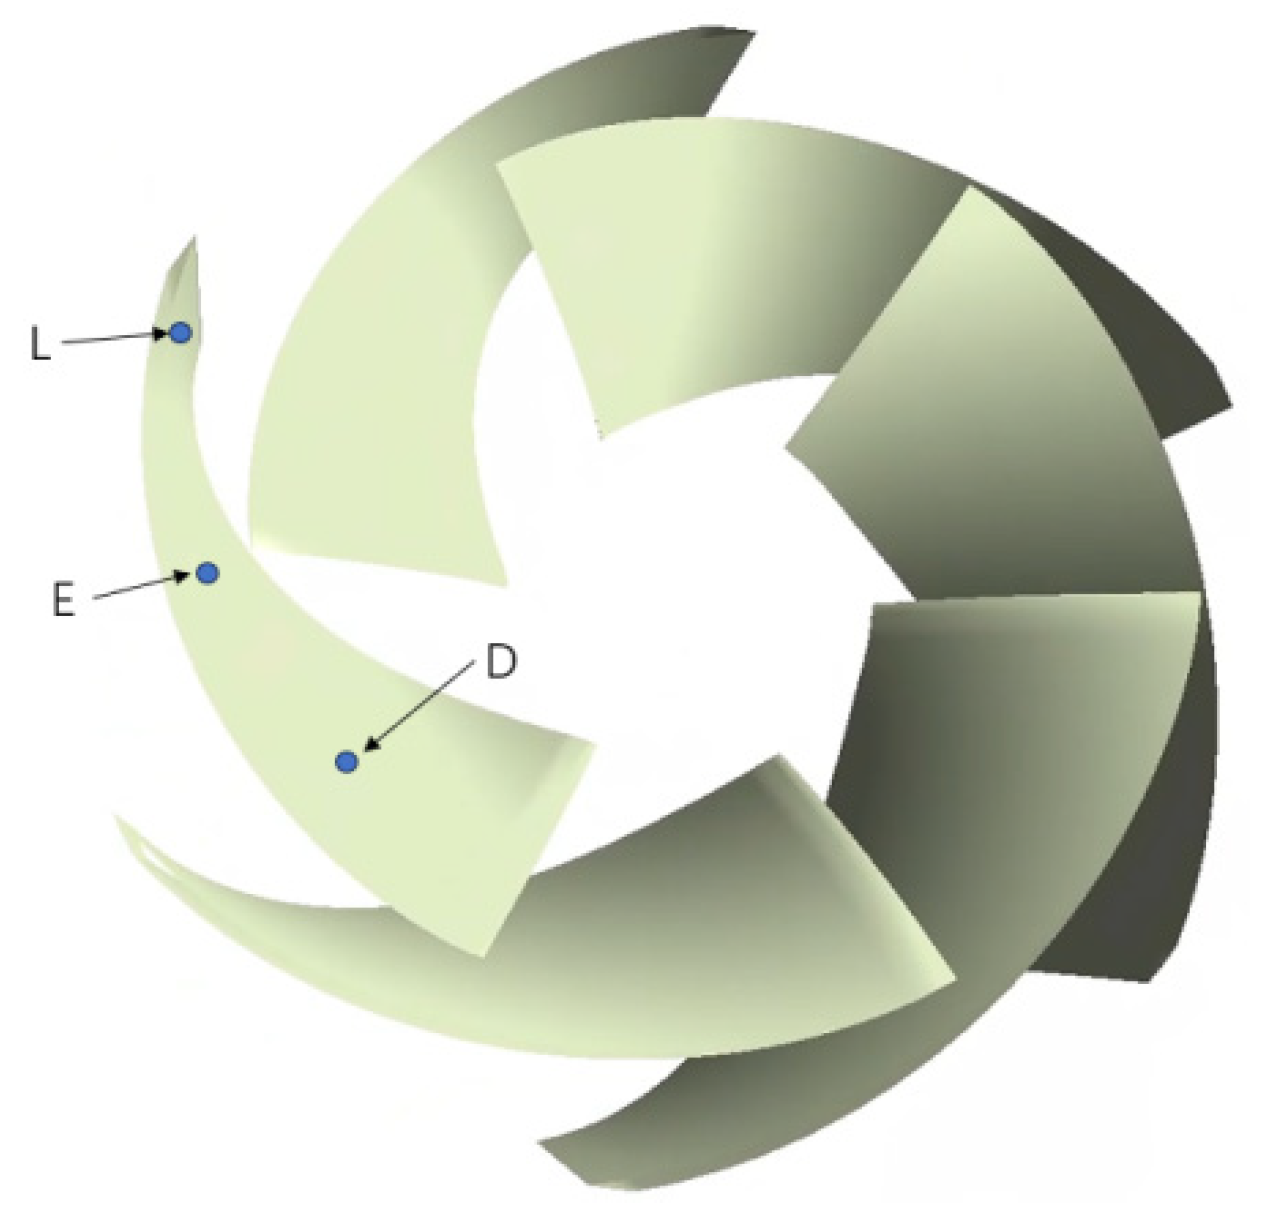
To better evaluate and visually compare the performance of the three acceleration scenarios for the reactor coolant pump (RCP), and to gain deeper insight into the flow behavior within the impeller region, three monitoring points were positioned on the impeller blades: at the blade trailing edge, the mid-chord location, and the blade root section, as illustrated in the accompanying Figure 10.
Figure 10.
Distribution of Pressure Pulsation Monitoring Points.
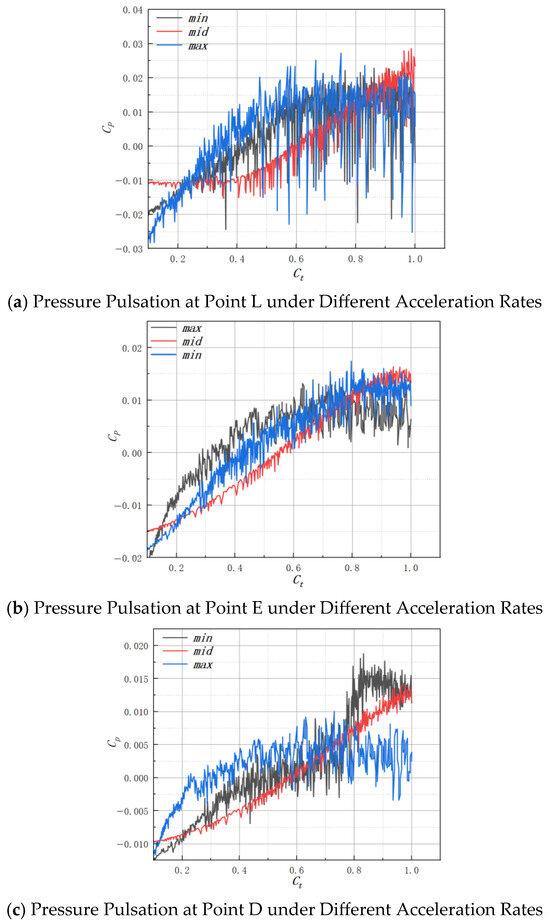
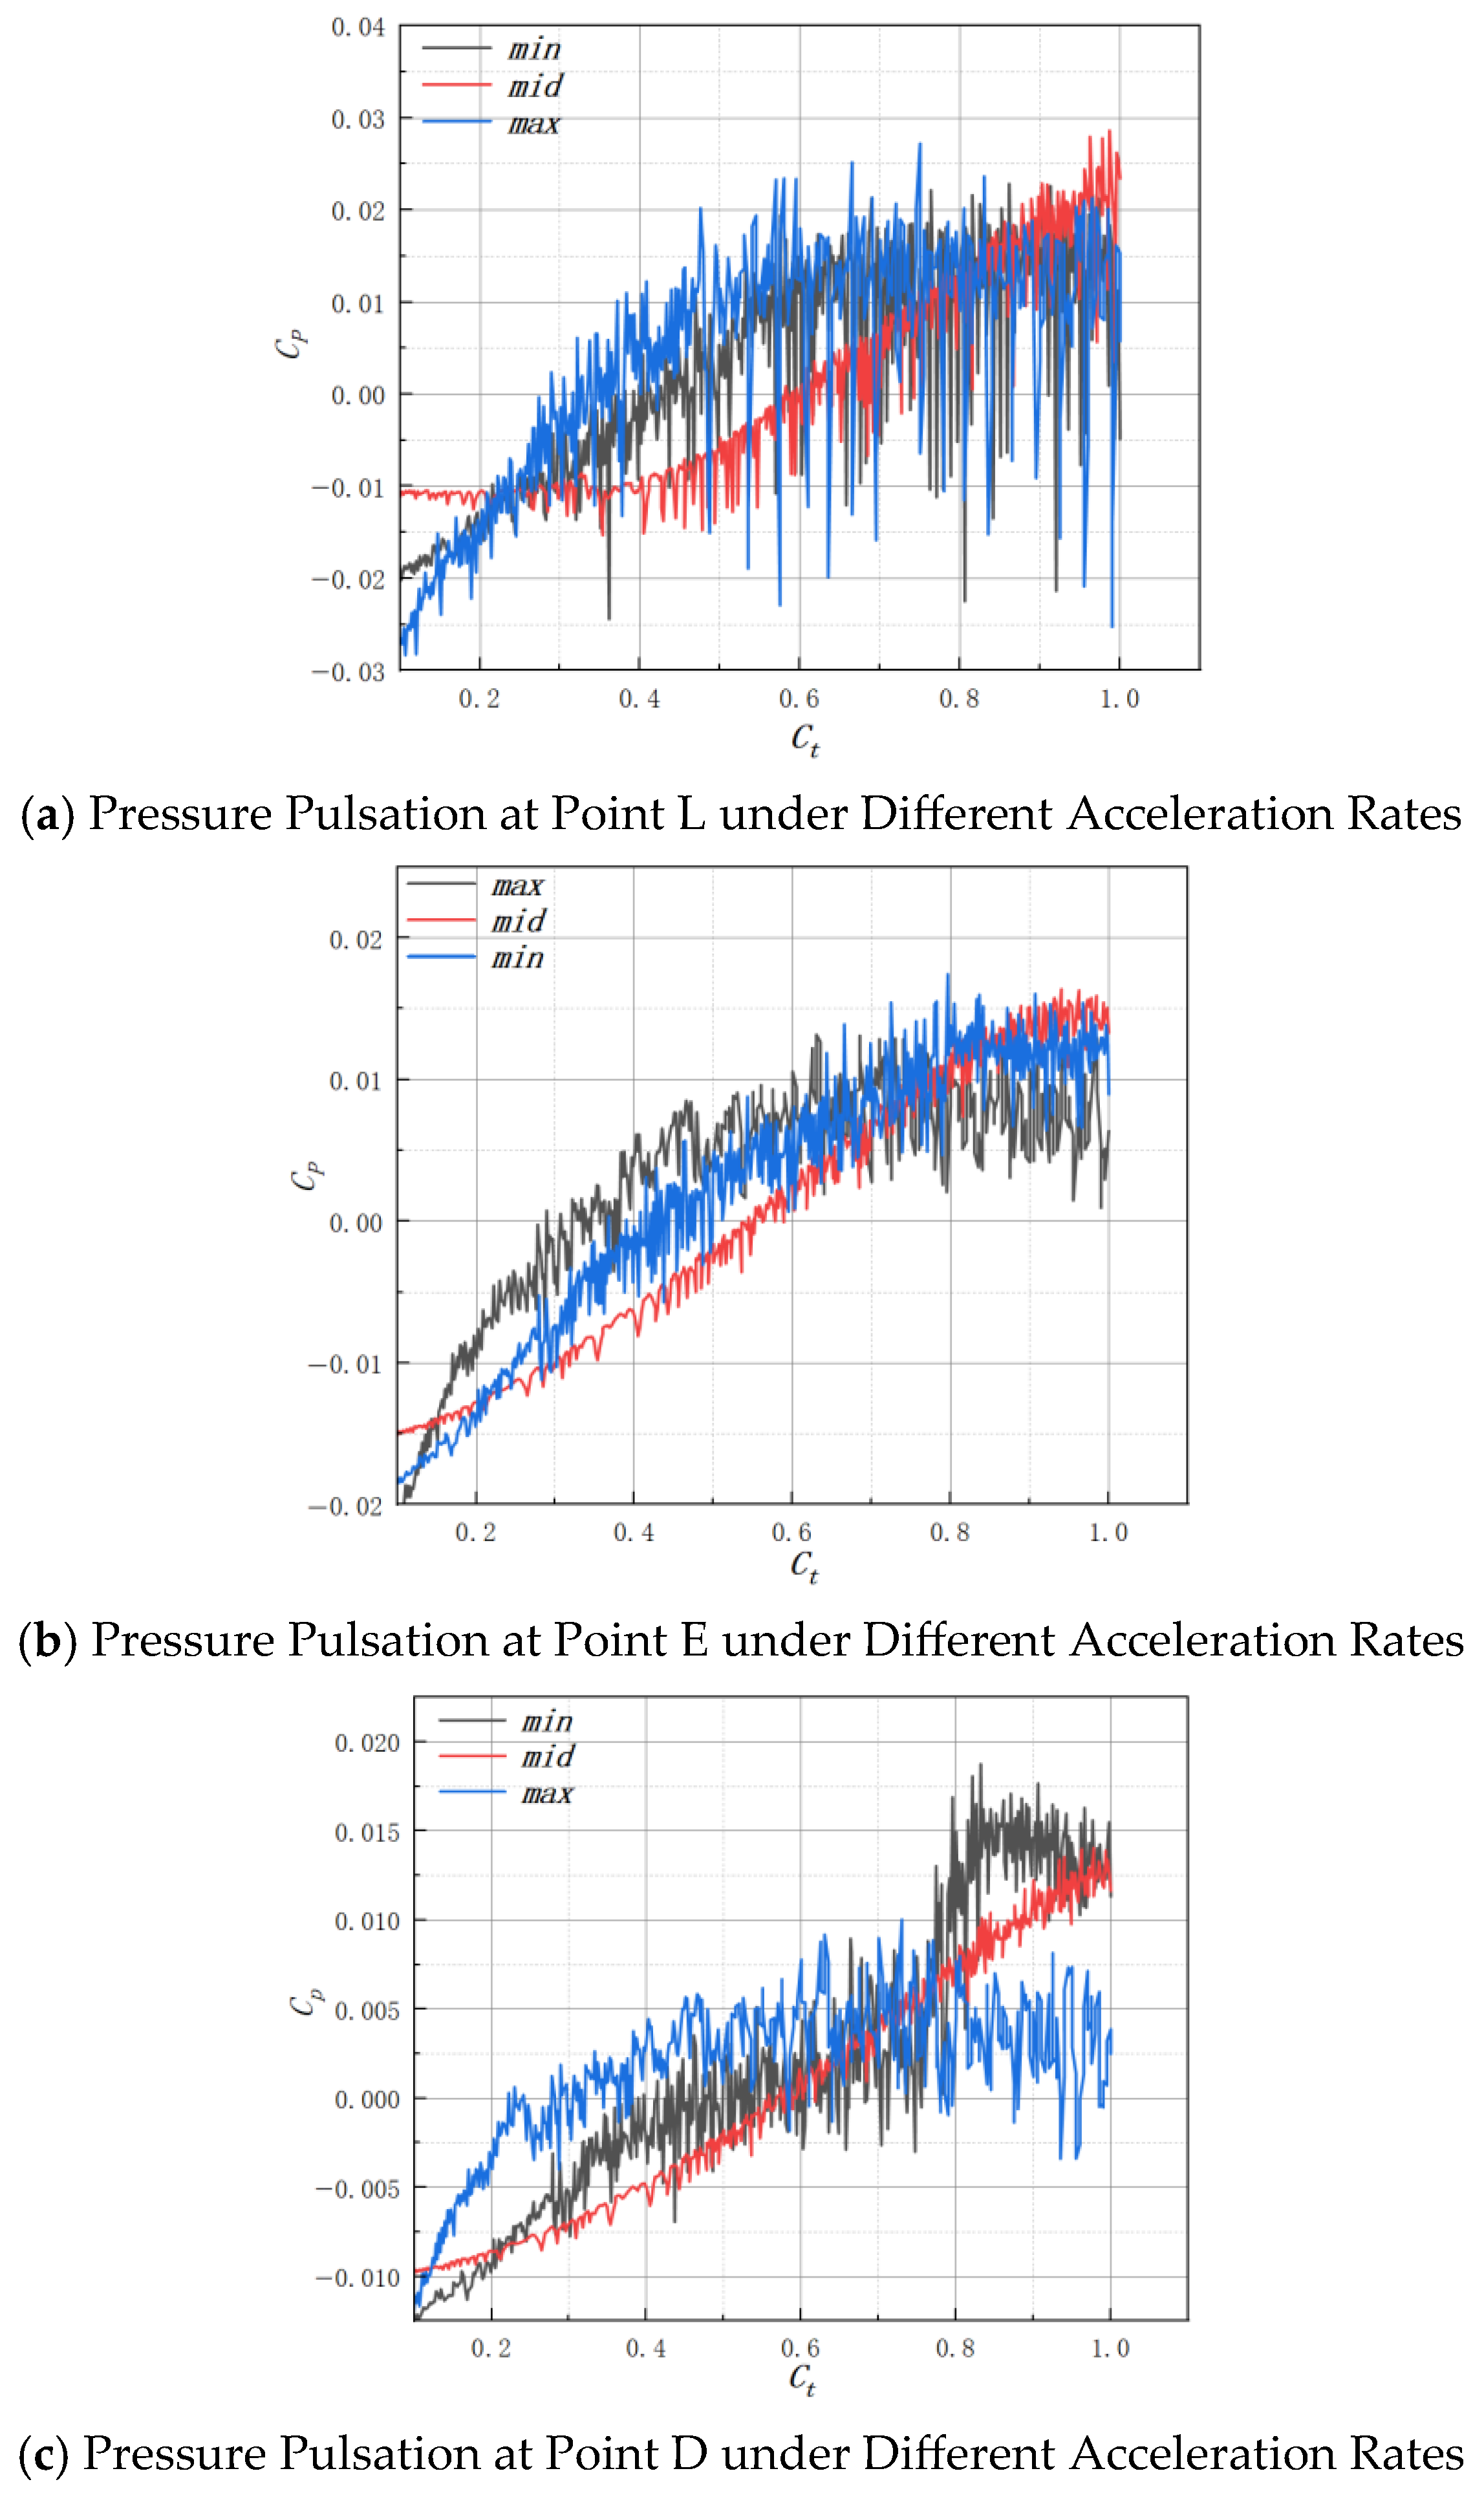
The pressure pulsation monitoring captures the total pressure of the fluid flow. As these values are generally large, the pressure coefficient (Cp) is adopted to amplify the characteristic features of the pressure fluctuations, while the time coefficient (Ct) is used to normalize the temporal dimension. This non-dimensionalization approach enhances the clarity of pulsation patterns and facilitates comparative analysis across different operating conditions.
Based on the comprehensive analysis of the three figures (Figure 11), pressure pulsations at all monitoring points under different acceleration rates exhibit a consistent trend: pressure increases rapidly initially and then stabilizes over time. This pattern reflects the increase in fluid kinetic energy within the reactor coolant pump (RCP) and the system’s gradual progression toward dynamic equilibrium.
Figure 11.
Pressure Pulsation at Monitoring Points under Different Acceleration Rates.
For the case with the shortest acceleration time and largest acceleration (denoted as max), pressure pulsations demonstrate significant fluctuations throughout the entire acceleration process. This phenomenon primarily occurs because the short acceleration duration, excessive acceleration rate, and rapid flow increase collectively lead to disordered internal flow distribution. Consequently, local pressure drops below the saturation vapor pressure, resulting in severe localized cavitation. Under high-temperature conditions, the critical pressure for fluid phase change decreases significantly, which may lead to intensified cavitation in the transient low-pressure region. This type of phase change process not only affects hydraulic stability but may also amplify impeller dynamic stress through microjet impact.
For the case with the longest acceleration time of 8.5 s (denoted as min), although the pressure fluctuations are less intense than those in the max case, substantial oscillations still occur during acceleration. As referenced in Figure 11c, this is attributed to the prolonged acceleration time, which causes slow accumulation of fluid kinetic energy and promotes sustained, large-scale flow separation in regions such as the blade suction side. This separation leads to fluctuations in head and instability in pressure pulsations. Additionally, the excessively gradual change in fluid velocity gradients facilitates the generation of vortices, creating alternating local high- and low-pressure zones that exacerbate pressure fluctuations.
In contrast to the aforementioned cases, the scenario with a 4.5 s acceleration time (denoted as mid) demonstrates a more balanced approach. This acceleration process avoids the excessive bubble formation and cavitation caused by overly rapid acceleration, while also preventing potential resonance issues associated with excessively slow acceleration. Consequently, it minimizes adverse impacts on the structural integrity of the system.
3.3. Vortex Structure and Turbulent Kinetic Energy Distribution in the Impeller
During the transient startup process of the reactor coolant pump (RCP), rapid rotational speed changes trigger complex vortex structures and turbulent dissipation. To investigate the internal flow patterns of the prototype RCP at different moments during startup, this study analyzes the internal vortex structures and turbulent kinetic energy distribution at multiple flow rate points extracted from the transient startup simulation.
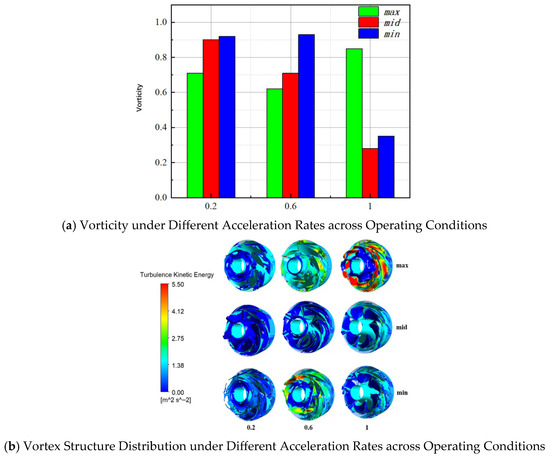
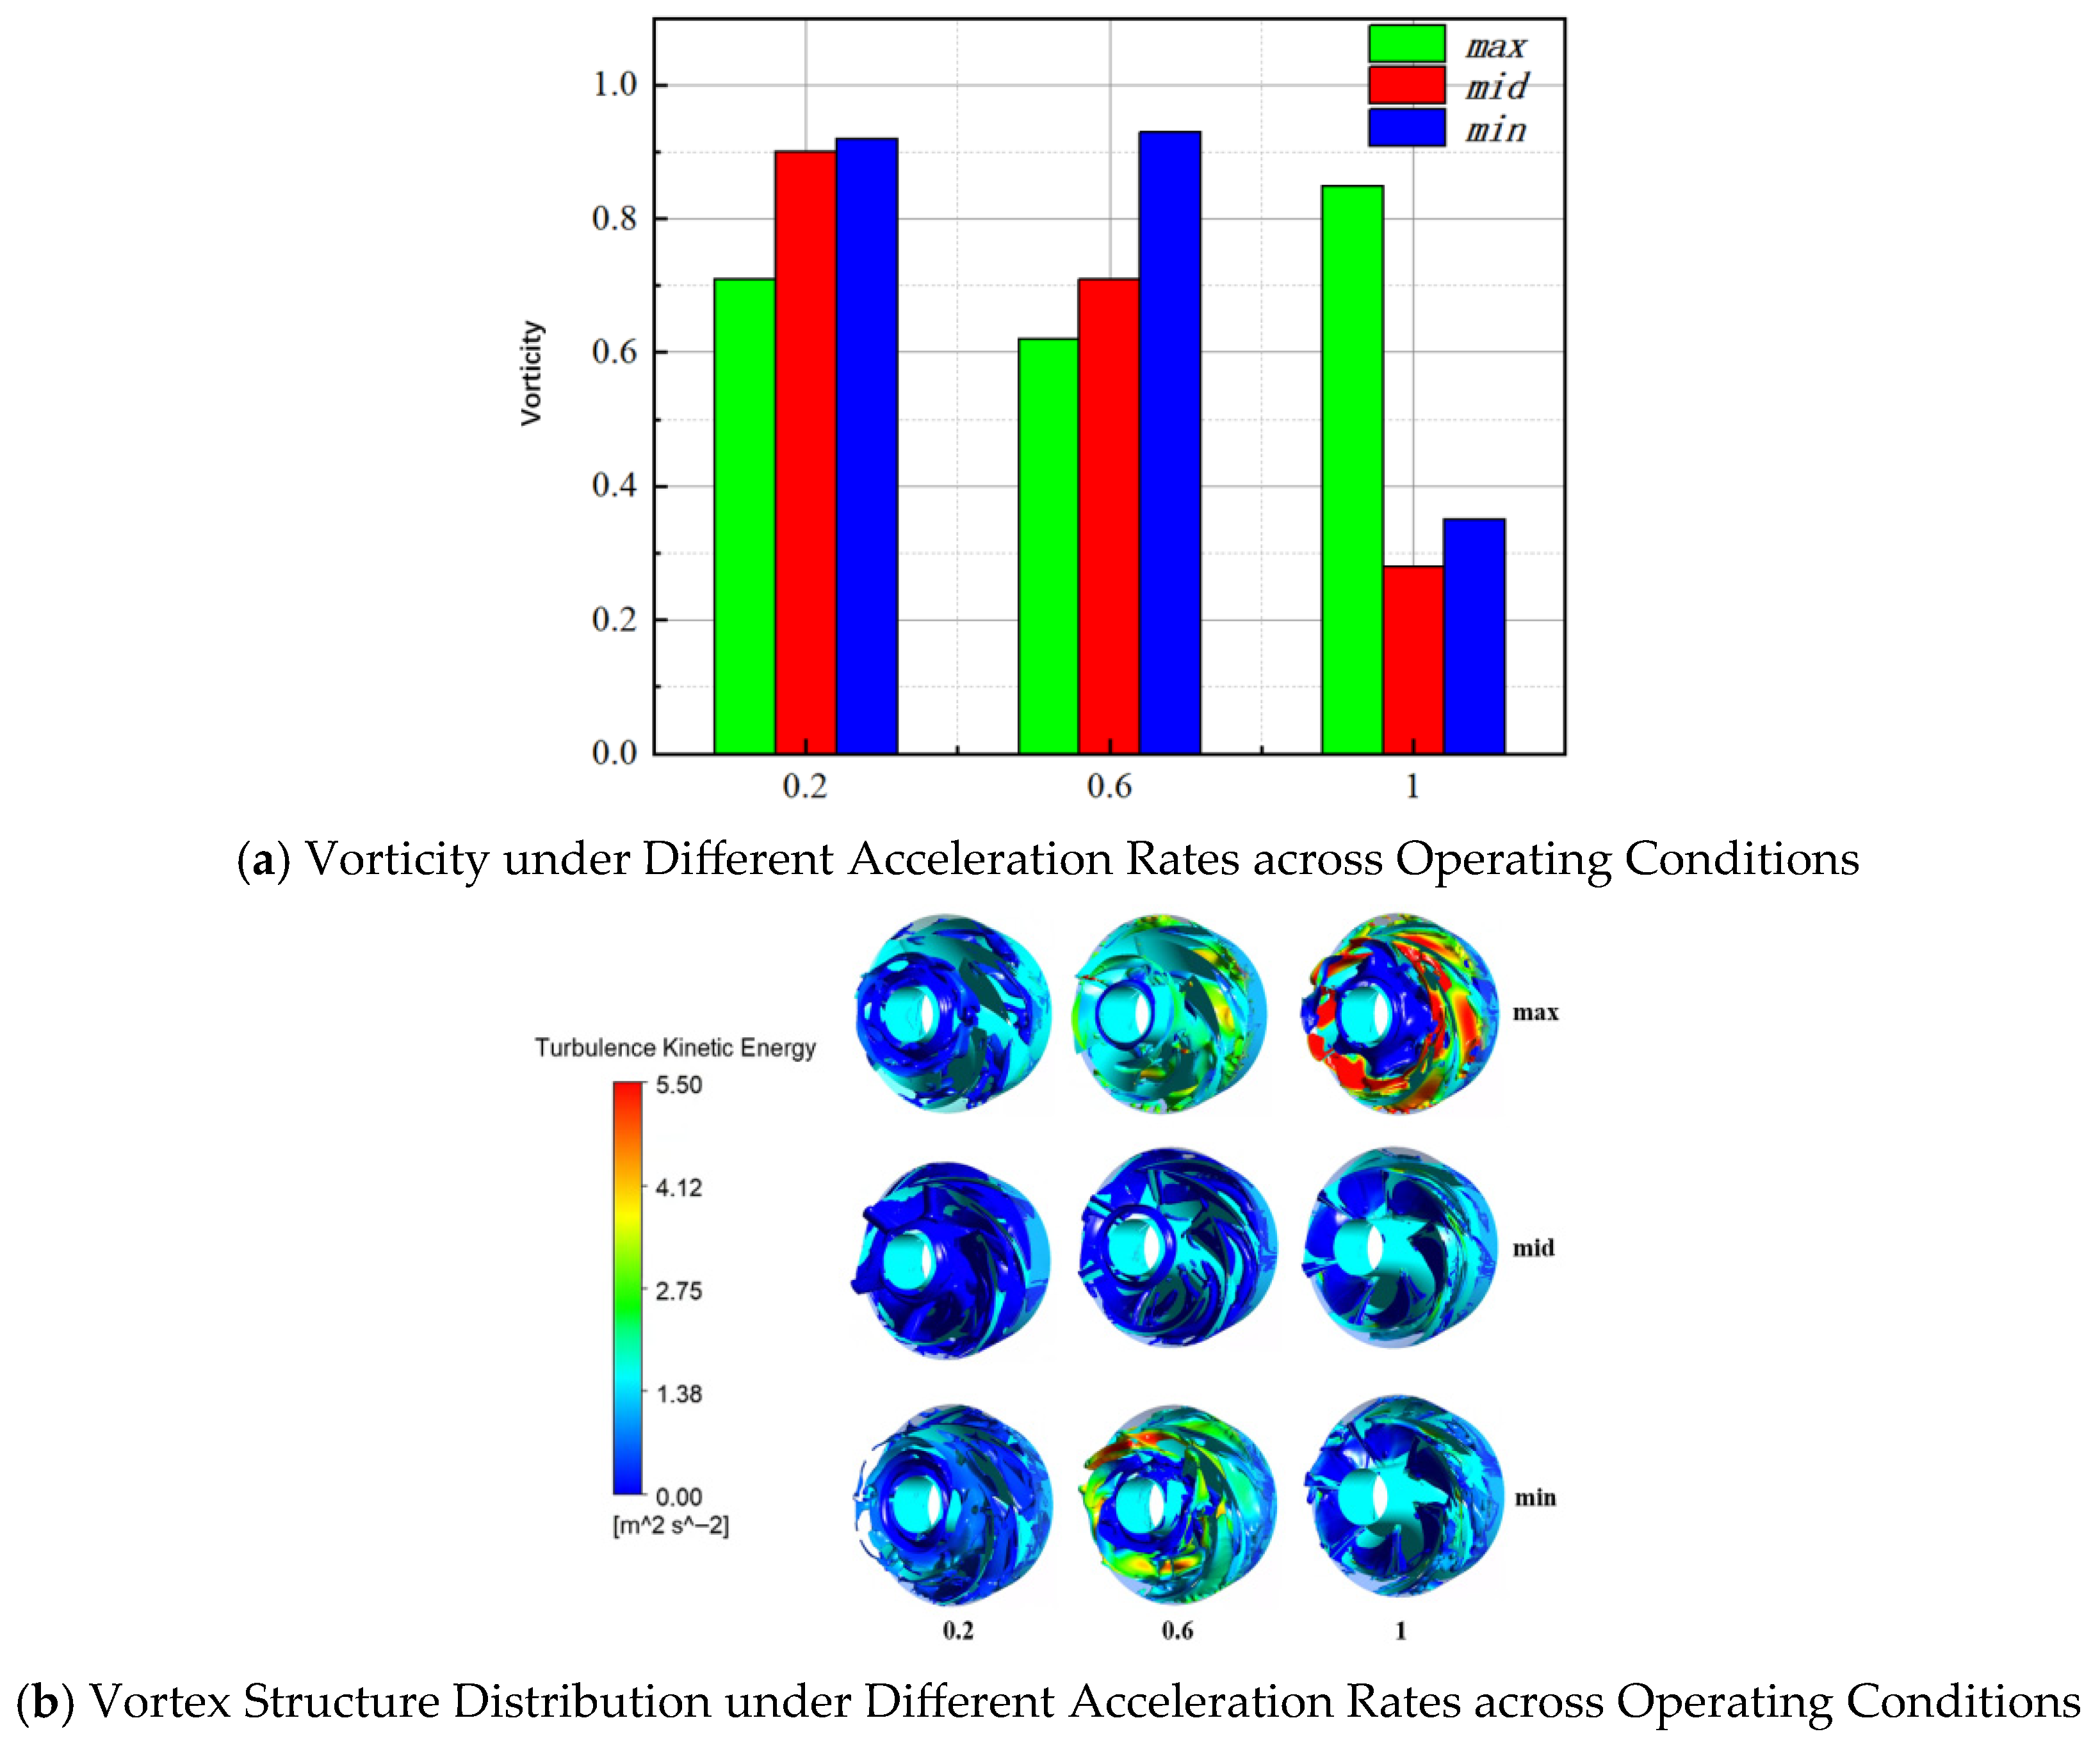
Based on the analysis of Figure 12a,b, the vortex structures tend to be more numerous during the initial startup phase. However, as acceleration progresses and the flow fully develops, the flow gradually stabilizes, and vortices significantly diminish—though notable differences exist among cases.
Figure 12.
Vortex Structure and Turbulent Kinetic Energy Distribution in the Impeller.
For the max case (shortest acceleration time), at the initial 0.2Q stage, vortices are primarily concentrated at the impeller inlet and along the blades, with relatively low turbulent kinetic energy (TKE) indicating underdeveloped flow. As acceleration continues to 0.6Q, the overall number of vortices decreases slightly, but TKE intensifies, and vortex structures shift toward the flow passage and impeller outlet. At 1Q, TKE surges across the entire domain, and vorticity increases sharply at the impeller inlet and within the flow passage—particularly near the blade root. This occurs primarily because the excessively rapid acceleration in the max case destabilizes the boundary layer, leading to large-scale vortex generation. The fluid energy is released through intense turbulent dissipation, and the overly short acceleration time prevents full flow development, resulting in persistent high vorticity even after acceleration concludes.
In contrast, for the mid case (moderate acceleration time), TKE remains consistently low throughout the acceleration process. Vorticity decreases from approximately 0.9 initially to around 0.2 by the end. At 0.2Q, vortices are stably distributed at the impeller inlet and along the blade suction surface, representing controllable separation vortices. By 0.6Q, vorticity gradually diminishes due to the moderate acceleration rate avoiding large-scale flow separation. At 1Q, the flow is fully developed with further reduced vorticity, and TKE shows no significant fluctuations. The key reason is that the appropriate acceleration rate prevents sharp velocity gradients, thereby inhibiting significant turbulence generation. Viscous diffusion effectively balances pressure gradient variations, suppressing the expansion of flow separation and maintaining laminar or low-turbulence states within the impeller.
Finally, for the min case (longest acceleration time), at the initial 0.2Q stage, weak backflow caused by insufficient acceleration forms faint vortices at the impeller inlet and blade root, resulting in relatively high initial vorticity. As acceleration progresses to 0.6Q, a sharp chang occurs: vortices massively generate along the blade suction surface and other regions, while TKE increases globally—especially near the blade root and suction surface, which become high-dissipation zones. This chang is fundamentally attributed to the prolonged acceleration extending the formation time of separation vortices, allowing them to evolve into large-scale vortices that cause instability. Additionally, the excessively slow acceleration process makes the system more prone to entering resonance frequency bands. Under resonance conditions, periodic severe fluctuations in the pressure field within the impeller blades and flow passage destabilize the boundary layer and induce large-scale flow separation. By the end of acceleration at 1Q, similar to the mid case, vortices within the impeller significantly decrease as the flow fully develops, and TKE also reduces considerably. However, the prolonged acceleration duration exaggerates flow uncertainty due to overly gentle velocity and pressure gradients, leading to substantial vortex formation and high TKE dissipation. These large-scale vortices exhibit low internal pressure but are surrounded by relatively high pressure. As the impeller rotates, these vortex structures cause low-frequency, high-amplitude pressure fluctuations—consistent with the pressure pulsation analysis discussed earlier.
3.4. Dynamic Stress Characteristics of the Impeller
To better evaluate the performance of the three acceleration transition scenarios, the temperature and pressure fields were transferred to the static structural module via thermo-fluid–structure coupling. This enabled the determination of dynamic stress distribution patterns in the impeller at different flow points under each operational condition. Methods such as Dynamic Mode Decomposition (DMD) can effectively capture the evolutionary characteristics of unsteady cavitation flow regimes, as reported in ‘dynamic mode decomposition to classify cavitating flow’. In future work, such algorithms can be used to identify the frequency modes of the dominant vortex structure during restart, and then correlate them with the stress load spectrum.
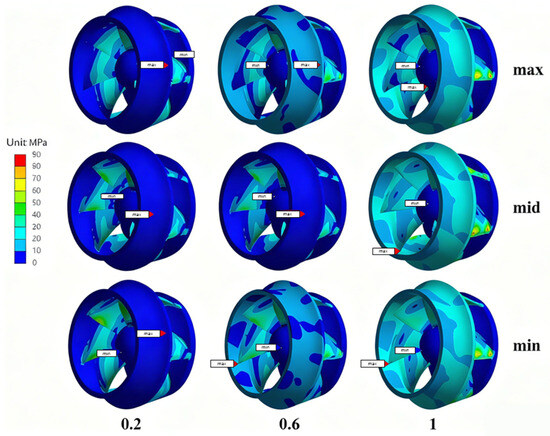
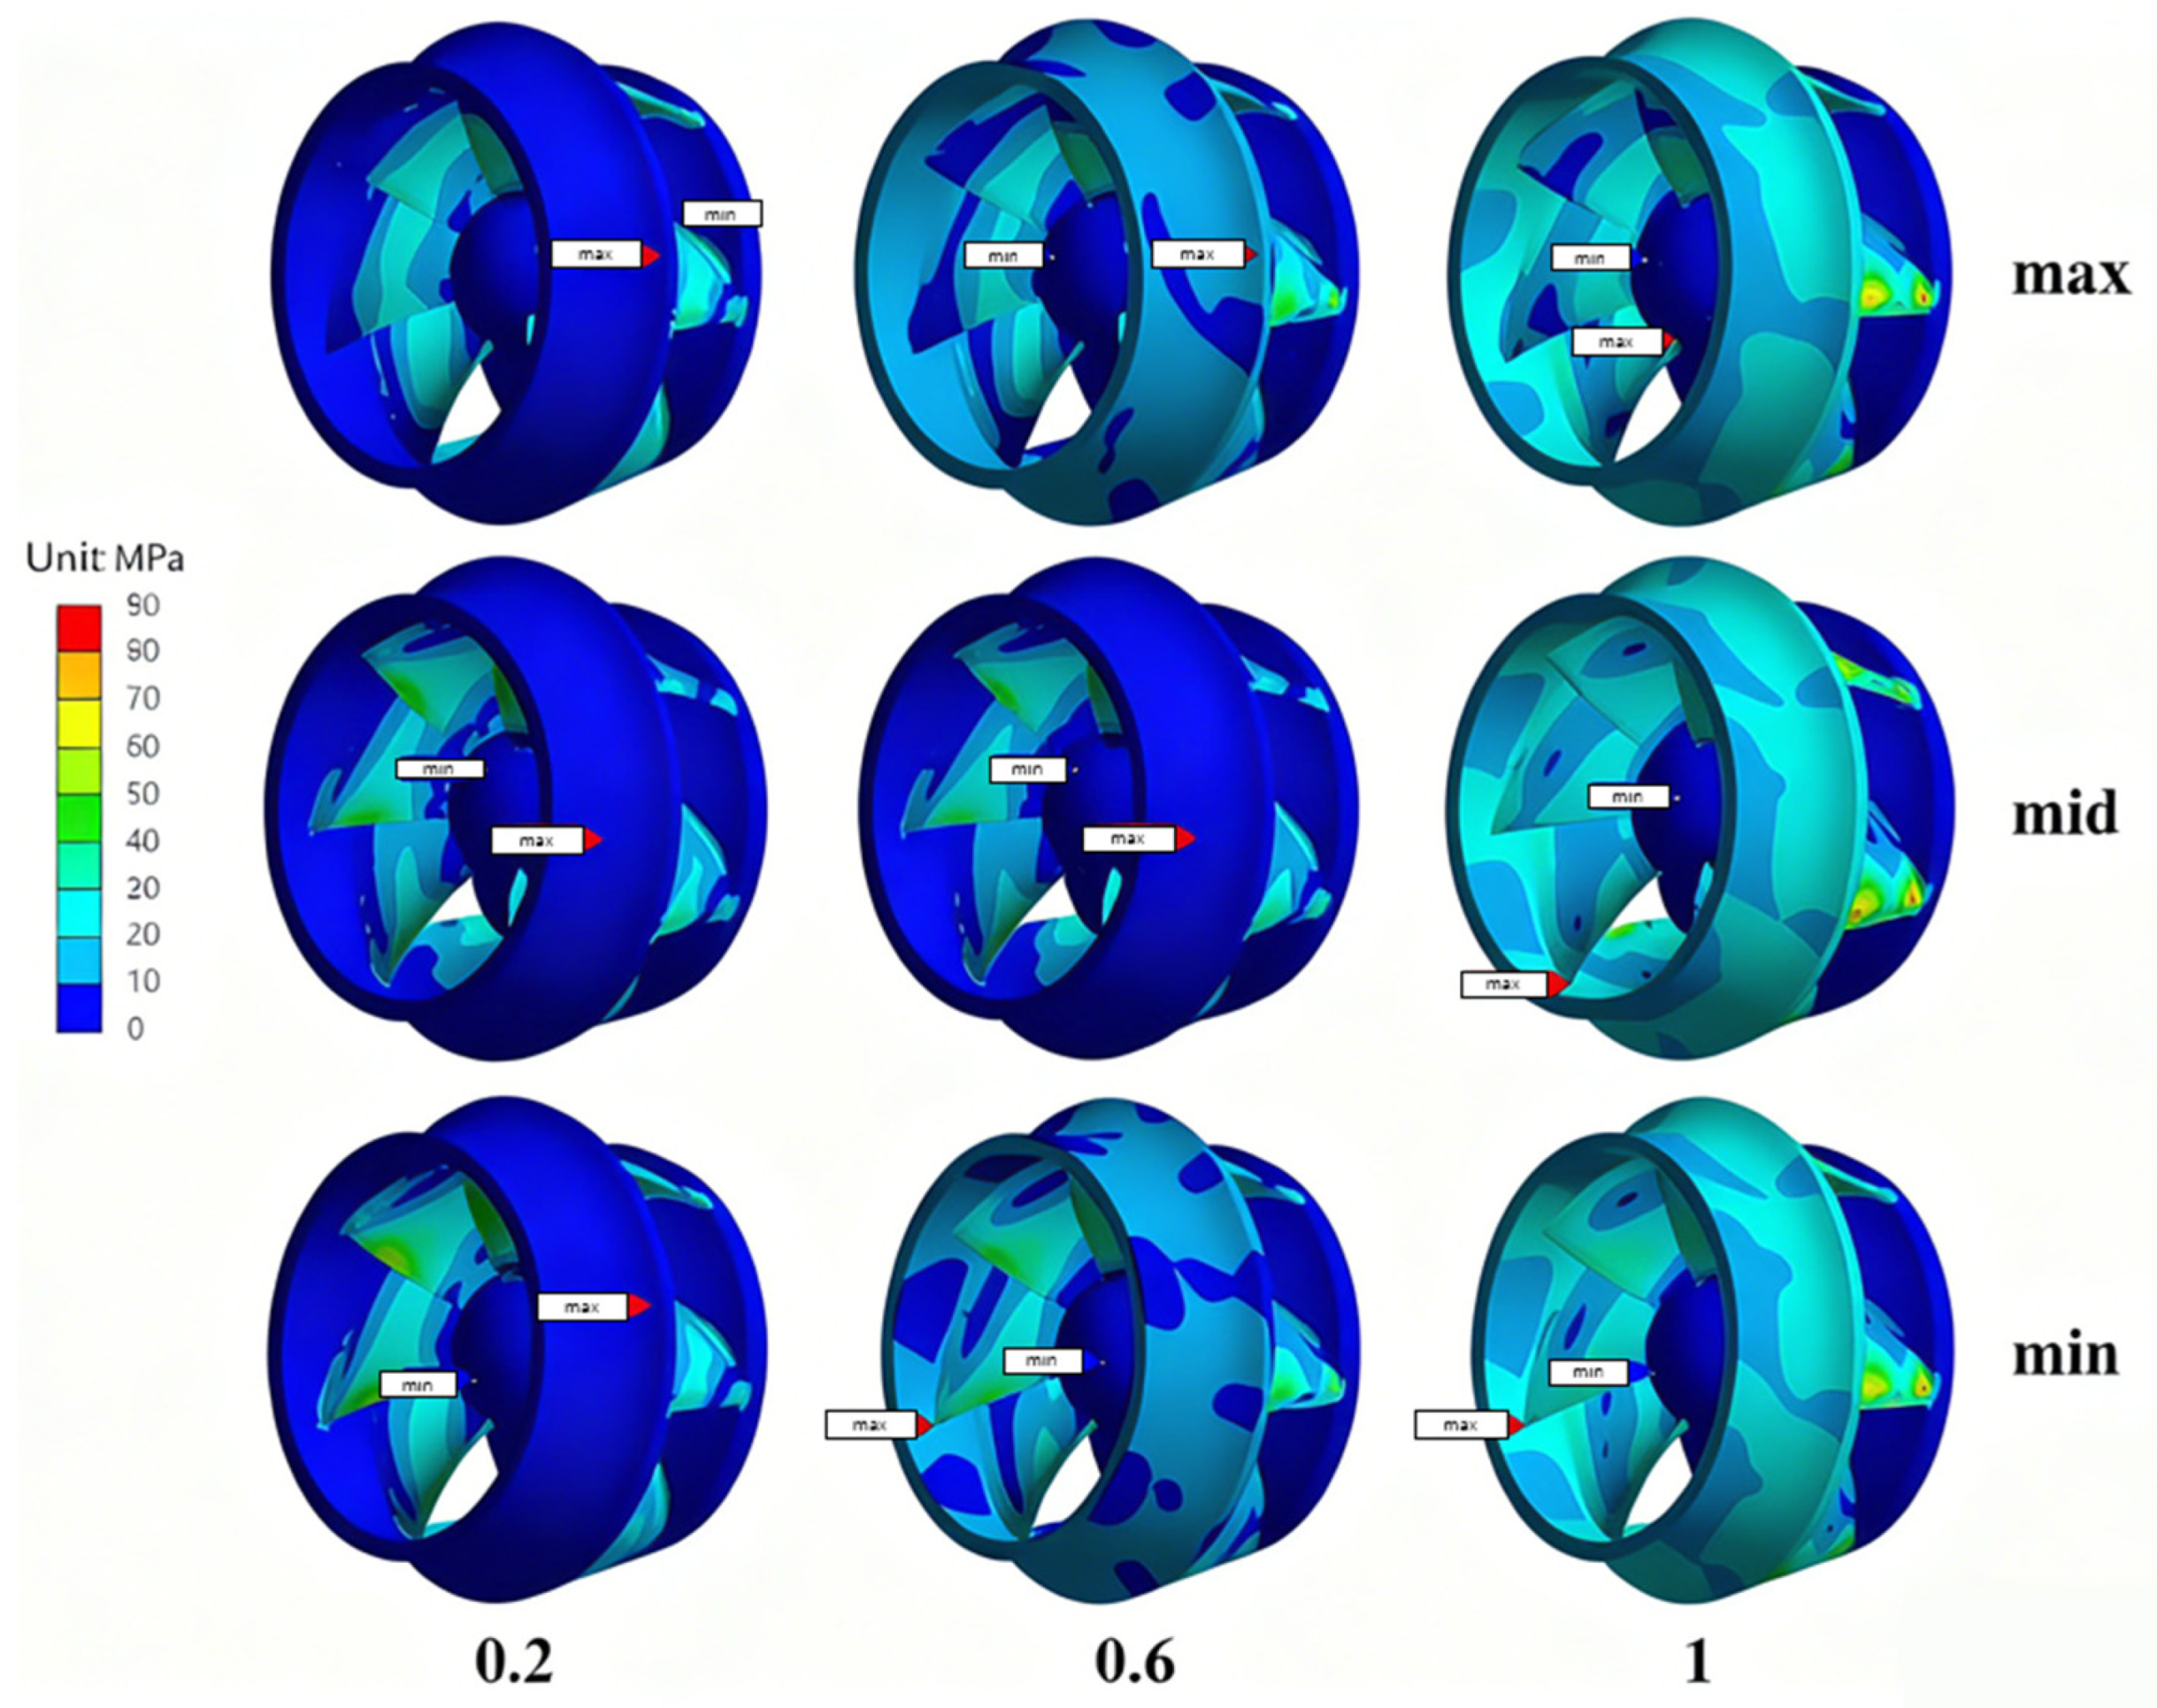
As shown in the Figure 13, the dynamic stress within the impeller increases during acceleration across all three scenarios.
Figure 13.
Impeller Dynamic Stress at Various Flow Points under Different Operating Conditions.
As illustrated in the Figure 13, under the condition of maximum acceleration, the highest stress on the impeller is concentrated near the hub and blade roots. This is primarily attributed to the excessive centrifugal forces induced by the extreme acceleration and the rapid increase in flow rate within a short period, which collectively cause a sharp rise in fluid-induced excitation forces. Consequently, the stress levels significantly exceed those observed in the other two acceleration scenarios. The minimum stress occurs at the nut, mainly because the coolant entering the impeller inlet leads to cavitation, resulting in a low-pressure zone and thus relatively lower stress. The overly high acceleration causes uneven internal flow within the impeller during the process, resulting in an irregular stress distribution. As acceleration progresses, the coolant flow gradually reaches the rated rate, stabilizing the internal flow. However, localized stress concentrations persist at the impeller outlet and blade roots due to the combined effects of excessive centrifugal forces and fluid-induced excitation forces.
For the case with an acceleration time of 4.5 s, the overall stress distribution within the impeller exhibits central symmetry. This is mainly due to the lower rotational speed and the reasonable increase in flow rate, which promote smoother flow dynamics. The minimum stress is observed at the connection between the boss and the impeller root, while the maximum stress occurs at two locations: the junction of the blade root and the hub, and the connection between the blade inlet and the front shroud. These stress concentrations are caused by centrifugal forces from accelerated rotation and excitation forces resulting from the increased flow rate. Compared to the other two acceleration conditions, the average stress within the impeller increases more gradually in this scenario. As concluded from the pressure pulsation analysis in the previous section, the flow-induced vibrations avoid the resonance frequency, resulting in minimal impeller vibration during acceleration. This leads to a slower rise in average stress, which significantly benefits the impeller’s operational lifespan.
For the case with an acceleration time of 8.5 s, the average dynamic stress within the impeller increases over time. The minimum stress generally occurs at the junctions between the blade root and the impeller nut or hub, primarily because the gradually increasing coolant flow induces significant cavitation and low-pressure zones at the interface between the inlet and the nut during acceleration, resulting in relatively lower stress. The maximum stress is consistently observed at the junction between the blade inlet and the pump body, and it gradually rises with increasing flow rate and rotational speed. This is mainly because, during acceleration, the increased inlet flow rate leads to greater coolant impact forces on the impeller. The combined effects of fluid inertial forces from coolant impact and centrifugal forces from impeller rotation cause the highest stress at the blade inlet. As rotational speed and flow rate continue to rise, these forces intensify, further increasing the stress. The overall stress distribution within the impeller changes gradually and exhibits approximate central symmetry, primarily due to the uniform flow field achieved under low acceleration startup conditions. As the startup process advances, the stress at the blade root and outlet stabilizes, while the highest stress remains concentrated at the impeller inlet and blade root.
3.5. Campbell Diagram Analysis
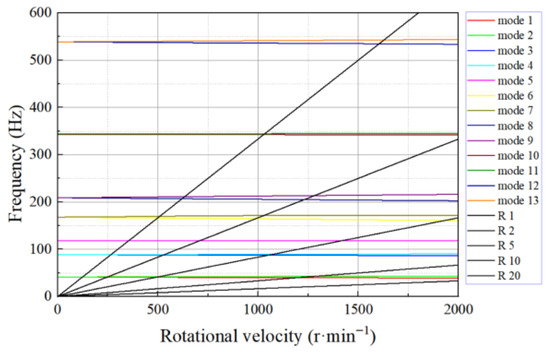
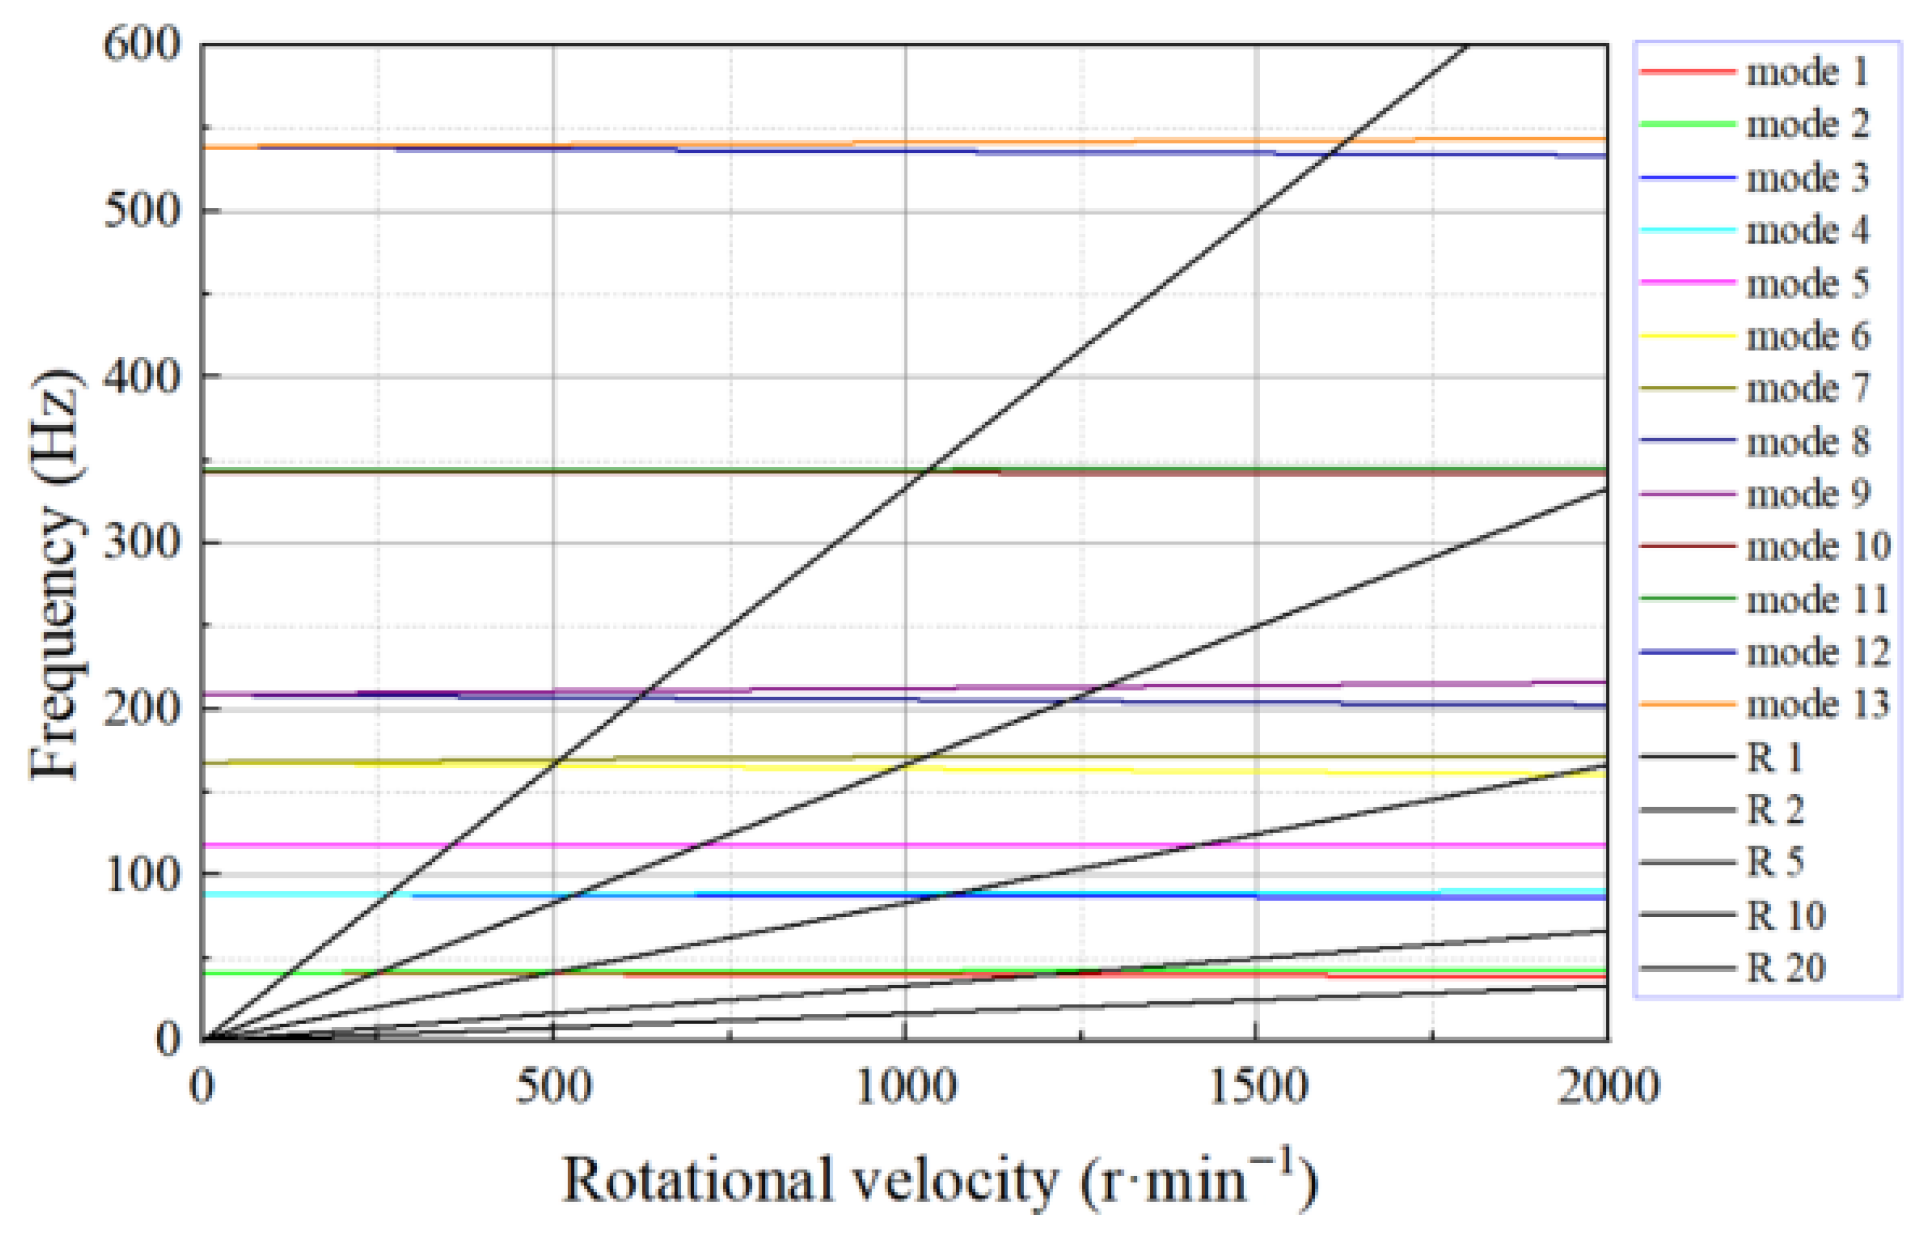
To further investigate whether the reactor coolant pump (RCP) structure remains stable during acceleration and whether the pressure pulsation-induced vibrations and flow vortex instability are related to resonance, this study conducted a Campbell diagram analysis based on the fluid-thermal-structural coupled pre-stressed modal analysis at 300°. During the modal analysis setup, the Campbell diagram option was activated. The natural frequencies of the rotor structure were captured at specified speed nodes, and the Campbell diagram was generated accordingly, as illustrated in the accompanying Figure 14.
Figure 14.
Campbell Diagram.
The horizontal axis of the Campbell diagram represents the rotational speed, while the vertical axis denotes the natural frequencies. The differently colored horizontal lines in the diagram indicate the natural frequencies captured at different speed nodes, and the black diagonal lines represent external excitation forces. If a diagonal excitation line intersects with a horizontal natural frequency line, it indicates a potential resonance condition at that point. The horizontal coordinate of the intersection represents the critical speed at which resonance may occur. To comprehensively prevent potential resonance phenomena, this study configured five orders of excitation forces, with ratios set at 1, 2, 5, 10, and 20.
Based on the above analysis, the inferior performance of the 8.5 s acceleration case compared to the 4.5 s case is primarily attributed to the prolonged acceleration duration, which causes the system to operate near multiple critical speeds for extended periods, thereby increasing the risk of resonance. As observed in the Campbell diagram, intersections between excitation lines and natural frequency curves occur at R2, R5, R10, and R20, indicating resonance warning points. Under prolonged acceleration, the impeller’s rotational speed increases slowly, making it more likely for the system to sustain operation near these critical speeds. This can induce structural resonance, leading to intensified pressure pulsations, unstable vortex structures, and concentrated dynamic stresses.
In contrast, the 4.5 s acceleration process features a moderate acceleration rate that allows the system to rapidly pass through critical speed regions, avoiding prolonged operation within resonance frequency bands. This effectively suppresses vibration amplification and stress concentration. Additionally, the flow development under this condition is more stable, with lower levels of pressure pulsations and turbulent kinetic energy, further ensuring the structural integrity and operational stability of the impeller.
3.6. Modal Analysis
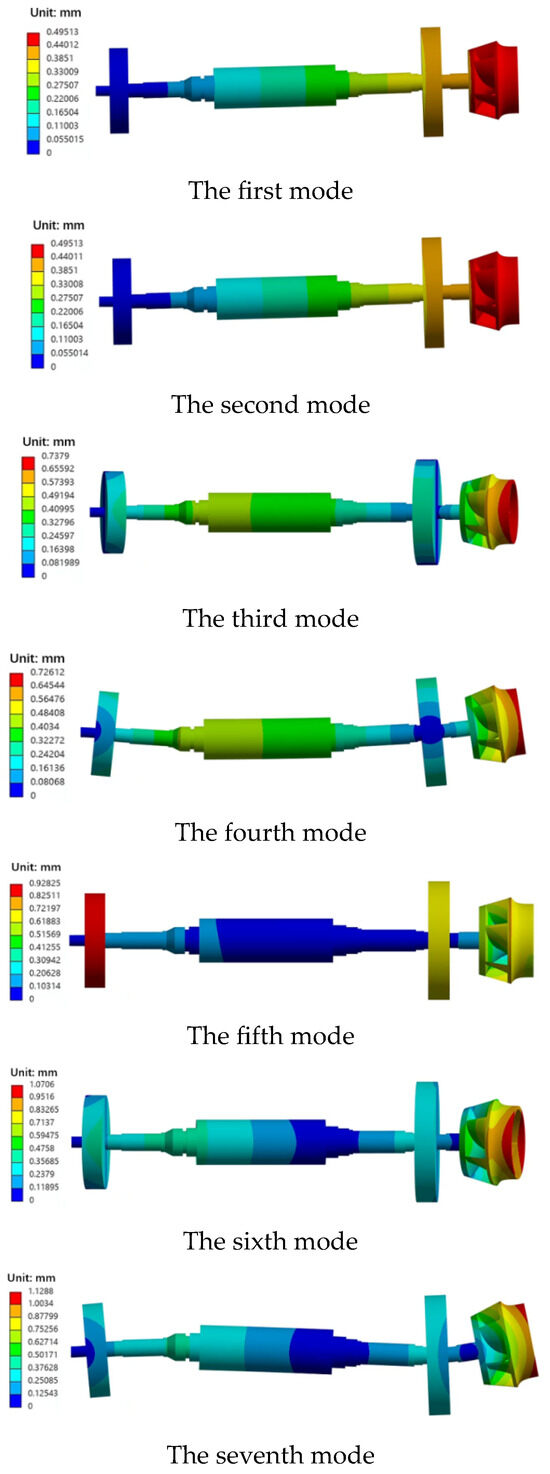
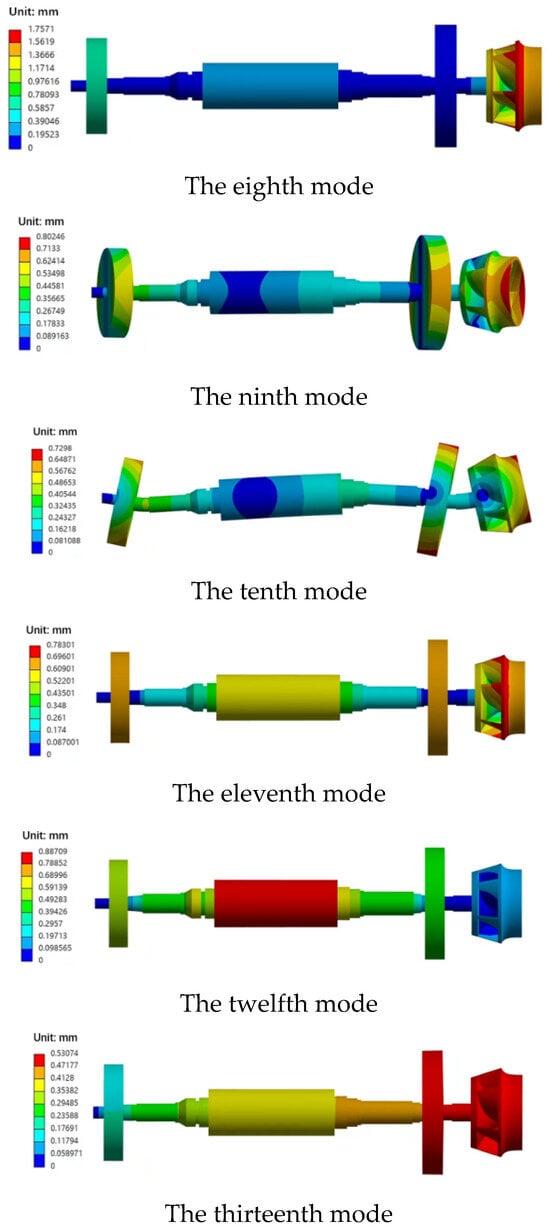
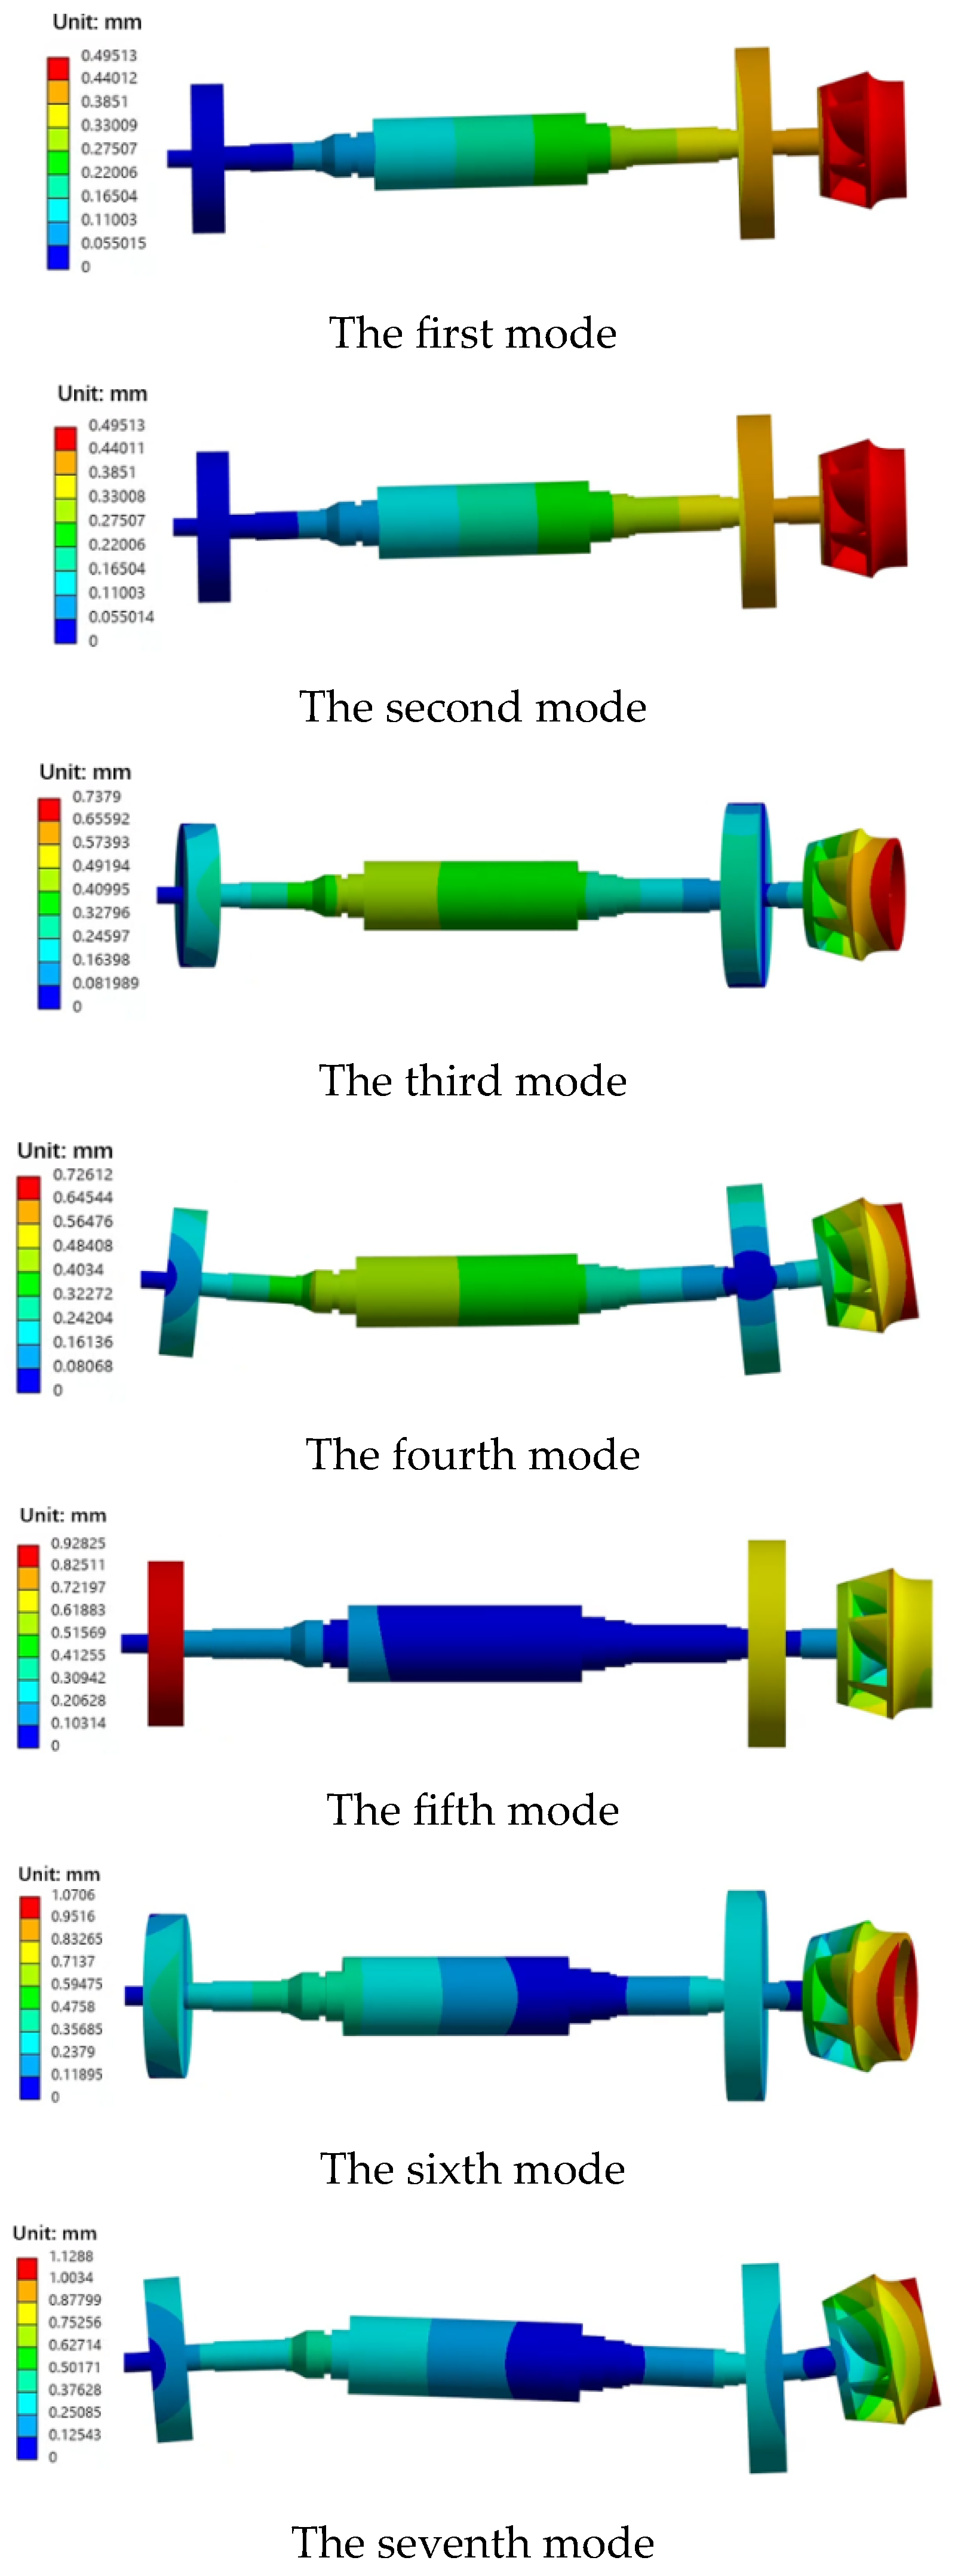
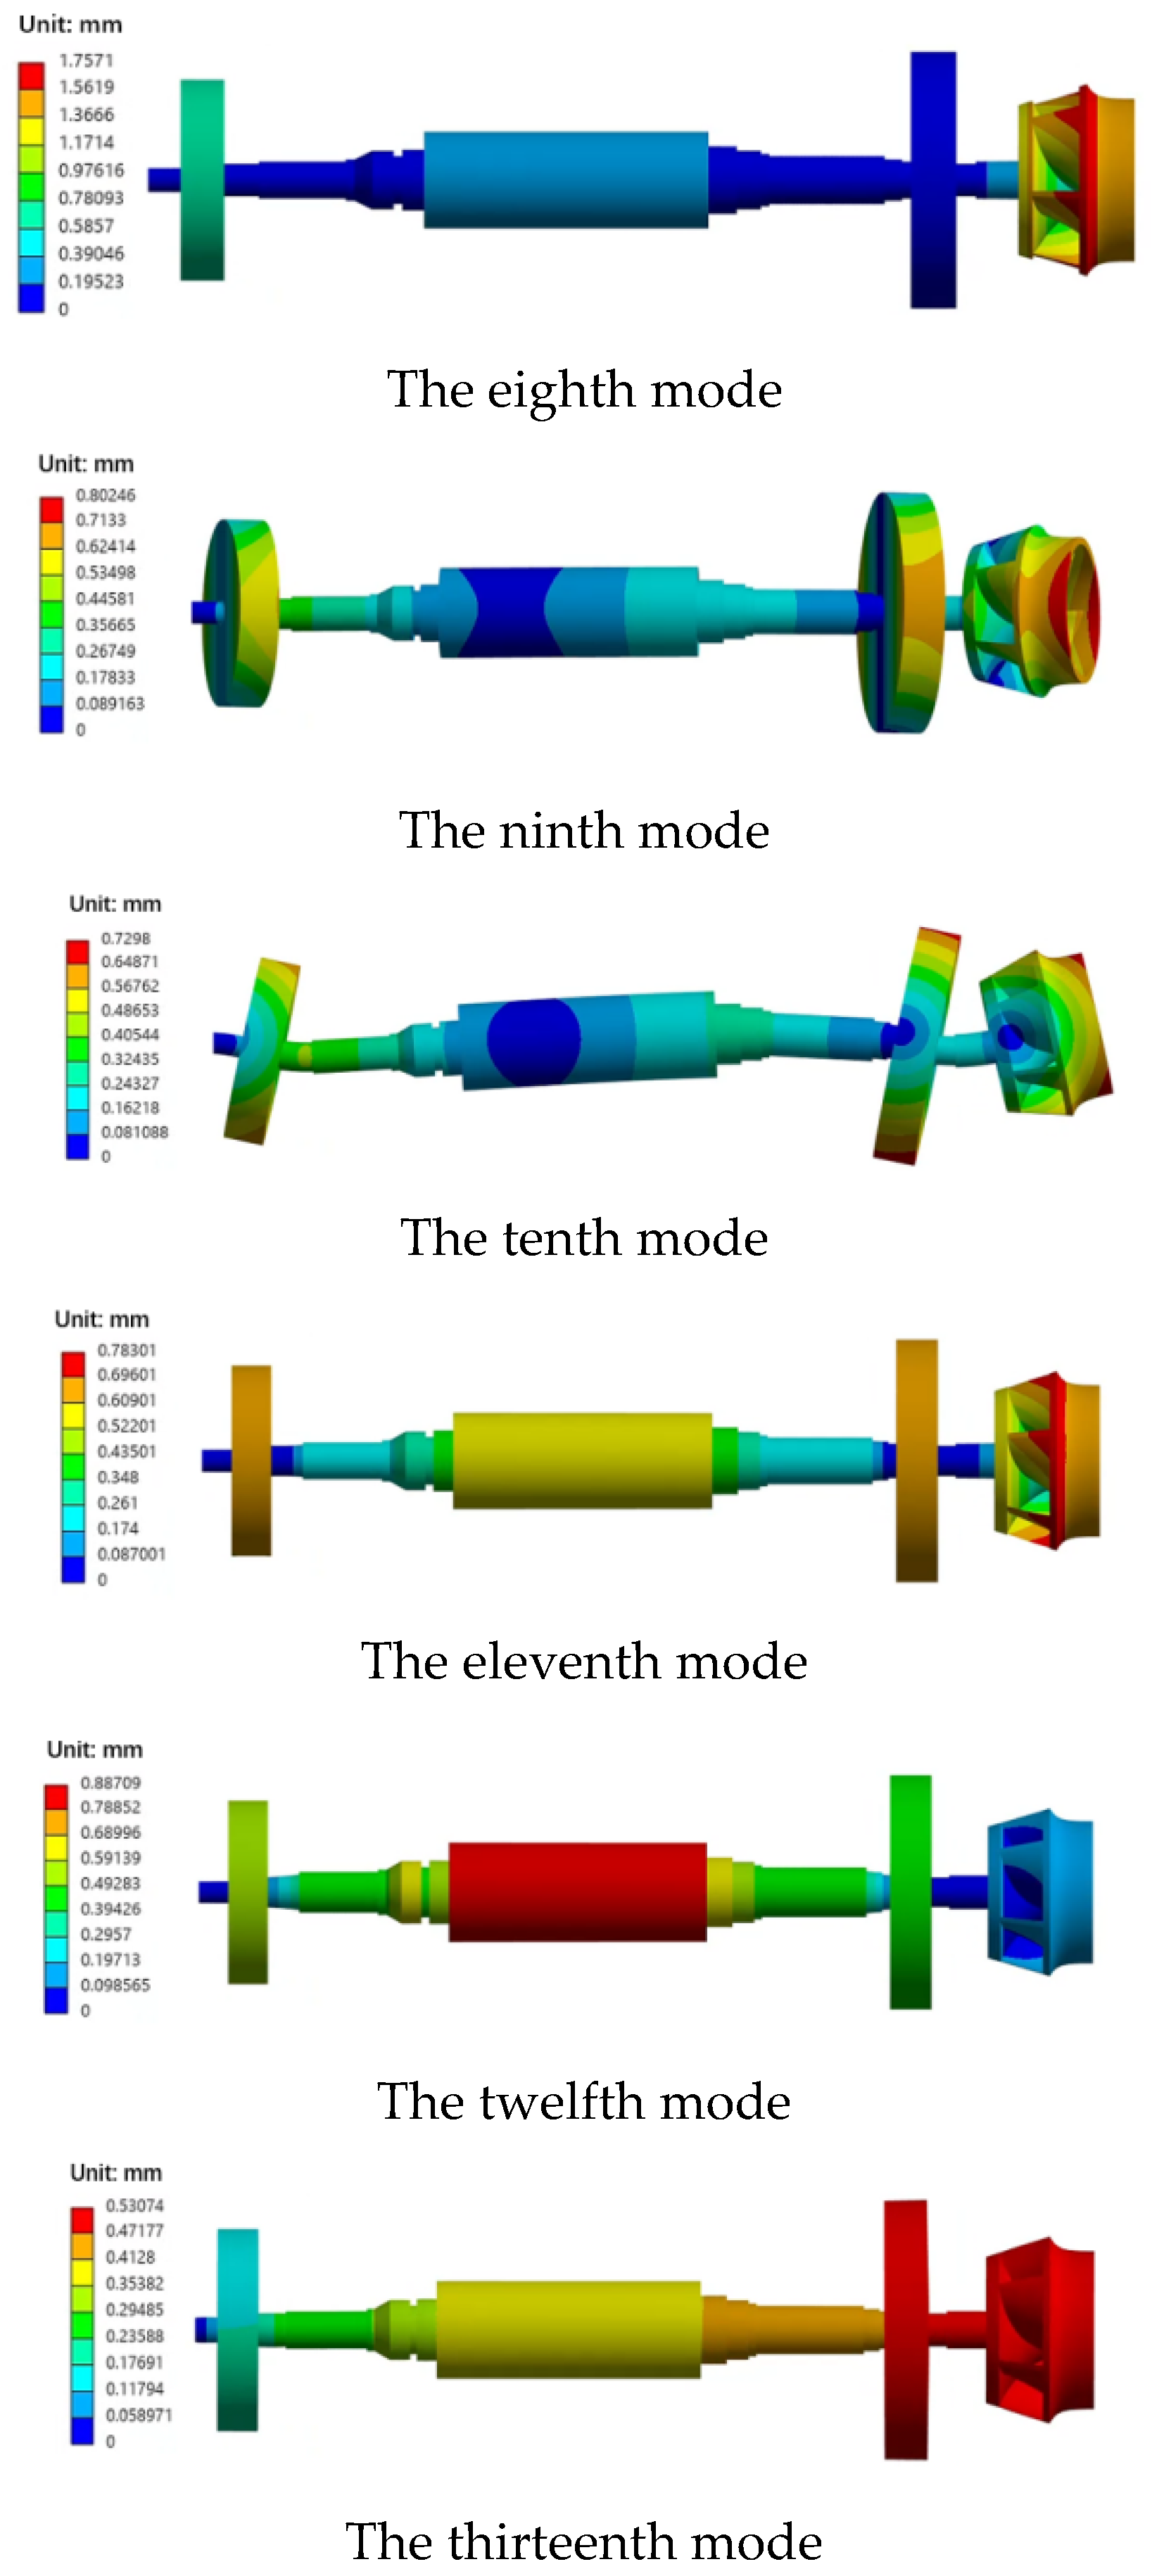
To more comprehensively observe the vibration characteristics of the reactor coolant pump (RCP) rotor and ensure structural stability during the acceleration process, this study extracted as many modal orders as possible, obtaining up to the 13th-order mode. The results are shown in the accompanying Figure 15.
Figure 15.
Modal Shapes of the Structure.
Based on the pre-stressed modal analysis of the nuclear main pump rotor structure under a high-temperature environment of 300 °C, the first 13-order modal shapes and their dynamic characteristics were successfully extracted and analyzed. The first and second modes exhibited no significant deformation, with the entire structure slightly lifted above the horizontal axis. These two modes featured relatively low frequencies and large amplitudes, making them the most easily excited shapes of the structure. The third, fourth, and ninth modes displayed coupled synchronous swinging between the impeller and the main shaft, reflecting complex dynamic behaviors under the coupling effects of mass distribution and stiffness. The fifth mode showed no significant torsion. The sixth and seventh modes exhibited coupled asynchronous swinging of the impeller and the main shaft. The eighth mode manifested as a torsional mode of the impeller and the upper flywheel, representing the first occurrence of torsion, which can thus be defined as the first-order torsional mode of the structure. This mode marks an important transition in the vibration form from bending-dominated to torsion-involved. The tenth and eleventh modes reverted to the swinging patterns of the shaft itself, indicating that the flexibility of the shaft still significantly influences the overall dynamic response at higher orders. The twelfth and thirteenth modes showed no significant deformation.
From an overall perspective of the modal shapes, the vibration patterns of the rotor structure are predominantly bending modes, with torsional vibration appearing only in the eighth mode and no significant torsional characteristics observed in subsequent modes. This indicates that the system possesses excellent torsional stiffness and stability, making torsional vibrations difficult to excite, which helps suppress fatigue damage caused by torsion. Combined with the Campbell diagram analysis results, the rotor effectively avoids major excitation frequencies within the rated speed range, with no resonant intersections observed, demonstrating that the critical speed settings are reasonable and the operational range remains within safe limits. Additionally, the modal frequencies are distributed relatively evenly without significant frequency clustering, further proving the balanced dynamic stiffness of the structure.
In summary, the nuclear main pump rotor model demonstrates favorable dynamic characteristics and structural safety under the conditions of 300 °C high temperature and multi-physics coupling. The dominance of bending vibrations aligns with common vibration patterns in rotating machinery, while sufficient torsional stiffness and effective avoidance of critical speeds indicate high vibration safety margins and reliability during startup, shutdown, and steady-state operations. This meets the requirements for structural dynamic performance in engineering.
4. Conclusions
This study investigates a canned nuclear main pump using a thermal-fluid–structure interaction numerical simulation approach to systematically analyze the effects of different acceleration rates on internal flow and structural dynamic characteristics during restart after a power failure. The main conclusions are as follows:
- (1)
- Analysis of external characteristics and pressure pulsation indicates that under the medium-acceleration scenario (4.5 s), the head development is stable, and the pressure pulsation amplitude is minimized. This effectively avoids flow instability and cavitation risks caused by inappropriate acceleration, demonstrating optimal overall hydraulic performance.
- (2)
- Vortex structure and turbulent kinetic energy distribution reveal that under this acceleration condition, the development of vorticity and turbulent kinetic energy intensity within the impeller remains at a low level throughout the process. Flow separation is suppressed, resulting in a more stable internal flow field, thereby avoiding backflow and vortex-induced vibrations associated with high and low acceleration rates, respectively.
- (3)
- Dynamic stress characteristic analysis shows that under the medium-acceleration scenario, the stress distribution on the impeller is uniform with a gradual increase, and no significant stress concentration is observed. The stress amplitude rises moderately with the flow rate, indicating that this acceleration strategy effectively controls alternating stress levels, contributing to delayed fatigue damage.
- (4)
- Modal and resonance characteristic analysis demonstrates that the rotor system is dominated by bending vibrations, with critical speeds set appropriately. The Campbell diagram shows no occurrence of resonance. The medium-acceleration scenario allows the system to quickly pass through critical speed regions, avoiding excitation of structural resonance and ensuring excellent dynamic safety.
Author Contributions
Q.F.: investigation, methodology, project administration and visualization. J.W.: writing–original draft, data curation and software. R.Z.: supervision, resources and writing–review and editing. S.Y.: funding acquisition, resources, validation and formal analysis. All authors have read and agreed to the published version of the manuscript.
Funding
This research received no external funding.
Data Availability Statement
The original contributions presented in this study are included in the article. Further inquiries can be directed to the corresponding author.
Acknowledgments
Thanks to all the authors for their contributions to this article.
Conflicts of Interest
The authors declare no conflicts of interest.
Nomenclature
| H | Head |
| RCP | Reactor Coolant Pump |
| Cp | pressure coefficient |
| Ct | Time coefficient |
| SST | Shear Stress Transport Model |
| Q | Liquid flow rate |
| n | rotational speed |
| η | efficiency |
| ρ | density |
| μ | viscosity |
| CFD | Computational Fluid Dynamics |
| SST | Shear Stress Transport |
| Yk, Yω | destruction terms in turbulence model |
| Γk, Γω | effective diffusivity |
References
- Zhen, Y.Q. Research on China’s Nuclear Power Development Strategy. Power Syst. Clean Energy 2010, 26, 3–8. [Google Scholar]
- Lee, T.; Harrison, K. Assessing safety culture in nuclear power stations. Saf. Sci. 2000, 34, 61–97. [Google Scholar] [CrossRef] [Scilit]
- Dmitriy, L.; Tatiana, K. Quality assurance program of a nuclear facility. E3S Web Conf. 2019, 97, 03015. [Google Scholar] [CrossRef] [Scilit]
- Wang, X.; Wang, P.; Yuan, S. Study on Gas-Liquid Two-Phase Flow Characteristics of Reactor Coolant Pump During Coastdown Transition Process. At. Energy Sci. Technol. 2014, 213, 2004–2011. [Google Scholar]
- Zhou, T.; Zhu, Y.; Tang, S. Research Status and Prospects of Fault Diagnosis for Reactor Coolant Pumps. J. Drain. Irrig. Mach. Eng. 2024, 42, 1081–1090. [Google Scholar]
- Jiao, F.; Ding, S.; Li, J.; Zheng, L.; Zhang, Q.; Xiao, Z.; Zhou, J. Analysis of Loss of Offsite Power Events at China’s Nuclear Power Plants. Sustainability 2018, 10, 2680. [Google Scholar] [CrossRef] [Scilit]
- Urbanowicz, K.; Ramos, M.H. New Advances in Water Hammer Problems. Water 2023, 15, 4004. [Google Scholar] [CrossRef] [Scilit]
- Liu, L.; Gao, J.; Zhou, C. Pressure Pulsation Analysis of a Large Reactor Coolant Pump Experimental Loop Based on Field Test and Numerical Simulation. Nucl. Eng. Des. 2025, 431, 113686. [Google Scholar] [CrossRef] [Scilit]
- Gao, H.; Gao, F.; Zhao, X. Transient Flow Analysis in Reactor Coolant Pump Systems During Flow Coast down Period. Nucl. Eng. Des. 2010, 241, 509–514. [Google Scholar] [CrossRef] [Scilit]
- Liu, X.; Liu, J.; Wang, D.; Wang, X.; Lu, Y.; Zhu, R.; Fu, Q.; Chen, Y.; Zhong, W. Experimental Study on the Impact of Power Failure Accident on Safety Characteristics of Reactor Coolant Pump. At. Energy Sci. Technol. 2009, 43, 448–451. [Google Scholar] [CrossRef] [Scilit]
- Ye, D.; Lai, X.; Wen, H. Study on Performance Characteristics of Reactor Coolant Pump During Coast down Shutdown Transition Process. J. Chin. Soc. Power Eng. 2020, 40, 593–599. [Google Scholar] [CrossRef]
- Qu, Z.; Li, Y.; Jun, P. Study on pressure surge characteristics of reactor coolant pump shaft stuck accident condition based on wavelet analysis. Nucl. Eng. Des. 2022, 397, 111921. [Google Scholar] [CrossRef] [Scilit]
- Deng, S. Transient Calculation of Main Pump in Qinshan Nuclear Power Phase II Project. Nucl. Power Eng. 2001, 22, 494–496, 507. [Google Scholar] [CrossRef]
- Zhang, L.; Zhang, D.; Wang, S. Study on the Influence of Rotational Inertia on Transient Characteristics of Marine Nuclear Power Main Pump. Ship Ocean. Eng. 2005, 3, 55–57. [Google Scholar] [CrossRef]
- Xu, Y.; Xu, S. Comparison of Calculation Models for Coastdown Speed of Reactor Coolant Pump. Power Equip. 2011, 25, 236–238. [Google Scholar] [CrossRef]
- Wu, G.Y.; Wang, Q.C.; Zhang, K. CFD Simulation of Hydrodynamics and Heat Transfer for Scale-Up of the Jetting Fluidized Beds. Powder Technol. 2016, 304, 120–133. [Google Scholar] [CrossRef] [Scilit]
- Micale, D.; Ferroni, C.; Uglietti, R. Computational Fluid Dynamics of Reacting Flows at Surfaces: Methodologies and Applications. Chem. Ing. Tech. 2022, 94, 634–651. [Google Scholar] [CrossRef] [Scilit]
- Berselli, L.C.; Lewandowski, R.; Nguyen, D.D. Rotational Forms of Large Eddy Simulation Turbulence Models: Modeling and Mathematical Theory. Chin. Ann. Math. (Ser. B) 2021, 42, 17–40. [Google Scholar] [CrossRef] [Scilit]
- Yakhot, V.; Orszag, S.A. Renormalization Group Analysis of Turbulence. I. Basic Theory. J. Sci. Comput. 1986, 1, 3–51. [Google Scholar] [CrossRef] [Scilit]
- Freile, R.; Tano, M.E.; Ragusa, J.C. CFD Assessment of RANS Turbulence Modeling for Solidification in Internal Flows Against Experiments and Higher Fidelity LBM-LES Phase Change Model. Ann. Nucl. Energy 2024, 197, 110275. [Google Scholar] [CrossRef] [Scilit]
- Menter, F.R. Two-Equation Eddy-Viscosity Turbulence Models for Engineering Applications. AIAA J. 1994, 32, 1598–1605. [Google Scholar] [CrossRef] [Scilit]
- Huang, D.; Huang, F. Coupled Thermo-Fluid Stress Analysis of Kambara Reactor with Various Anchors in the Stirring of Molten Iron at Extremely High Temperatures. Appl. Therm. Eng. 2014, 73, 222–228. [Google Scholar] [CrossRef] [Scilit]
- Cao, J.; Luo, Y.; Ahn, S.-H. Influence of Rotation on the Modal Characteristics of a Bulb Turbine Unit Rotor. Renew. Energy 2022, 187, 887–895. [Google Scholar] [CrossRef] [Scilit]
- Li, J.; Wei, Y.; Gao, H. Improved calculation method for dry modal analysis of four-stage centrifugal-pump rotor system based on concentrated-mass method. PLoS ONE 2024, 19, e0306061. [Google Scholar] [CrossRef] [Scilit] [PubMed]
- Hao, C.; Zheng, P.Z.; Fang, R. Experimental Study of Modal Characteristics for Heated Composite Structures. J. Aerosp. Eng. 2022, 35, 04022038. [Google Scholar] [CrossRef] [Scilit]
- Olimstad, G.; Østby, K.T.P. Failure and Redesign of a High-Speed Pump with Respect to Rotor-Stator Interaction. Eng. Fail. Anal. 2019, 104, 704–713. [Google Scholar] [CrossRef] [Scilit]
- Zhong, H.; Zhu, R.; Wang, X.; Zhang, B.; Lu, Y. Influence of Start-Up Acceleration on Internal Flow of Reactor Coolant Pump Impeller. J. Drain. Irrig. Mach. Eng. 2018, 36, 300–306. [Google Scholar] [CrossRef]
- Du, K. Study on Hydrodynamic Characteristics and Blade Hydraulic Excitation Characteristics of Shaji Station Vertical Mixed-Flow Pump Unit Under Reverse Power Generation Conditions. Ph.D. Thesis, Yangzhou University, Yangzhou, China, 2023. [Google Scholar]
- Geng, Z. Failure Analysis of a Certain Type of Diesel Locomotive Crankshaft. Ph.D. Thesis, Dalian Maritime University, Dalian, China, 2023. [Google Scholar] [CrossRef]
- Fu, Q.; Wang, D.; Zhao, Y. Dynamic Characteristics Analysis of RCP Impeller Based on Fluid-Thermal-Solid Coupling. Nucl. Eng. Des. 2024, 428, 113482. [Google Scholar] [CrossRef] [Scilit]
Disclaimer/Publisher’s Note: The statements, opinions and data contained in all publications are solely those of the individual author(s) and contributor(s) and not of MDPI and/or the editor(s). MDPI and/or the editor(s) disclaim responsibility for any injury to people or property resulting from any ideas, methods, instructions or products referred to in the content. |
© 2025 by the authors. Licensee MDPI, Basel, Switzerland. This article is an open access article distributed under the terms and conditions of the Creative Commons Attribution (CC BY) license (https://creativecommons.org/licenses/by/4.0/).