1. Introduction
Unchecked accumulation of atmospheric carbon dioxide has become a critical threat to long-term human development and global ecological stability, with electricity generation accounting for over two-fifths of total fossil fuel-related carbon emissions [
1,
2]. To curb this trend, establishing equitable carbon budgets and transparent emission reduction obligations has become a core priority for power system transformation. Active Distribution Networks (ADNs), as key carriers for integrating distributed renewable energy and flexible loads, play a pivotal role in advancing the low-carbon transition. However, two parallel shifts in power systems have posed significant challenges to ADN operation: the rapid penetration of variable renewable energy sources and the phased retirement of traditional coal-fired units. These changes have eroded the system’s inherent inertia and ramping flexibility, making it increasingly challenging to maintain real-time balance between generation and load [
3,
4], and thus highlighting the need to orchestrate dispersed assets—including small-scale generators, energy storage devices, and controllable demand—to stabilize operations and accelerate decarbonization.
Existing research on low-carbon ADN operation has explored various technical pathways, focusing on integrating carbon capture power plants and power-to-gas facilities to reduce emissions [
5,
6,
7]. While these approaches have achieved partial success, a growing body of cross-sector analyses argues that carbon responsibility should not be limited to the supply side but should also involve end users, as electricity consumption directly drives emissions. To address this, the carbon emission flow (CEF) framework has been developed to track time-varying carbon burdens across power networks, enabling more precise allocation of carbon liability [
8]. For instance, Reference [
9] applied the CEF model to pass carbon costs to all customers, avoiding unfair cost increases caused by supply-side-only emission control. Reference [
10] proposed a two-level operational framework based on carbon-intensity-integrated pricing, linking user costs to the emissions associated with the electricity consumed. Additionally, References [
11,
12] examined the environmental benefits of price-driven demand response, emphasizing consumers’ potential to reduce emissions through load adjustment. Despite these advances, existing studies fail to clearly define how to allocate carbon-reduction responsibilities on the demand side; once carbon-intensity signals are transmitted to users, the development of corresponding demand-response mechanisms to drive low-carbon operation remains unresolved
Energy storage has emerged as a critical solution to mitigate the volatility of renewable energy and enhance system flexibility. Laboratory experiments and field demonstrations have confirmed that orchestrating diverse storage technologies (across multiple time scales can reduce operational costs and suppress nodal voltage violations [
13,
14,
15,
16,
17]. However, most existing models assume a single utility-scale battery with perfect monitoring and control capabilities. In contrast, in practice, distributed energy storage (DES) resources face significant challenges: thousands of individual owners operate heterogeneous hardware with proprietary control systems, creating “information silos” that prevent system operators from accessing aggregate flexibility. This fragmentation leaves a large share of DES capacity underutilized, limiting its contribution to grid stability.
The rise in collaborative consumption in the electricity sector has spurred the development of shared energy storage—a paradigm that abstracts siloed storage assets into a digital platform, enabling centralized orchestration and pay-per-use service provision [
18,
19,
20,
21]. Early studies have shown that optimizing the siting, sizing, and cycling of shared storage can raise the average capacity factor of small-scale storage from the low teens to over 40% [
22,
23]. At the same time, commercial analyses indicate that third-party shared storage platforms can reduce user capital expenditure and peak-demand charges by double-digit percentages [
24,
25]. Nevertheless, a key barrier to widespread adoption remains: the lack of a transparent and fair profit-sharing mechanism. Without clear rules for allocating benefits—including arbitrage surpluses, deferred network investment, and carbon credits—DES owners are reluctant to surrender local control, leaving flexible capacity stranded. While cooperative and non-cooperative game theory have been used to align incentives in multi-agent power systems [
26,
27], these constructs have not been extended to integrate shared storage with demand-side carbon control, limiting the full decarbonization potential of ADNs, as shown in
Table 1.
Recent ESS studies support ADN applications through hybrid control, power management, and operational decision-making. Ref. [
28] proposes a VID-LSVI control for TG-ESSs, enabling autonomous power sharing and oscillation suppression, validated on a 3.5 kW platform. Ref. [
29] designs an MA-fuzzy logic strategy for flywheel-battery systems, improving SOC accuracy and lifespan in 120 kW experiments. Ref. [
30] develops an online learning framework for PESS, enhancing degradation modeling and increasing economic benefits by 37% in real-grid tests. These advances provide critical references for shared ESS scheduling and lifetime optimization in ADNs.
Motivated by these gaps, this paper formulates a carbon-conscious dispatch framework for ADNs that embeds a CPS-enabled shared storage coalition and demand-side carbon regulation. It is worth noting that while electricity consumption is a critical driver of fossil fuel-related emissions, greenhouse gas (GHG) emissions stem from diverse sources with distinct characteristics—for instance, dairy farms generate significant methane (CH4) via cattle digestion and gasoline-powered vehicles emit approximately 4.6 metric tons of CO2 per year per vehicle. These non-electricity-related emissions are also vital for global decarbonization, yet this study focuses on electricity demand-side regulation as it indirectly supports emission reduction across sectors. The novelty of this work lies in three key aspects. First, it develops a consumer-side emission penalty mechanism that combines the CEF model with price elasticity coefficients, guiding users to adjust consumption behaviors and shifting partial carbon responsibility to the demand side—complementing emission control in non-electricity sectors. Second, it designs a CPS-based shared energy storage architecture—featuring physical, control decision, and security layers—to aggregate DES resources and adopts a Shapley value-based profit-sharing strategy to ensure fair benefit allocation based on marginal contributions, unlocking dormant flexibility for grid decarbonization. Third, it unifies these two mechanisms into a single mixed-integer linear programming model that co-optimizes economic efficiency and carbon reduction to enhance ADN operational flexibility, providing a scalable solution for integrating demand-side and storage-based low-carbon measures.
The remainder of this paper is organized as follows.
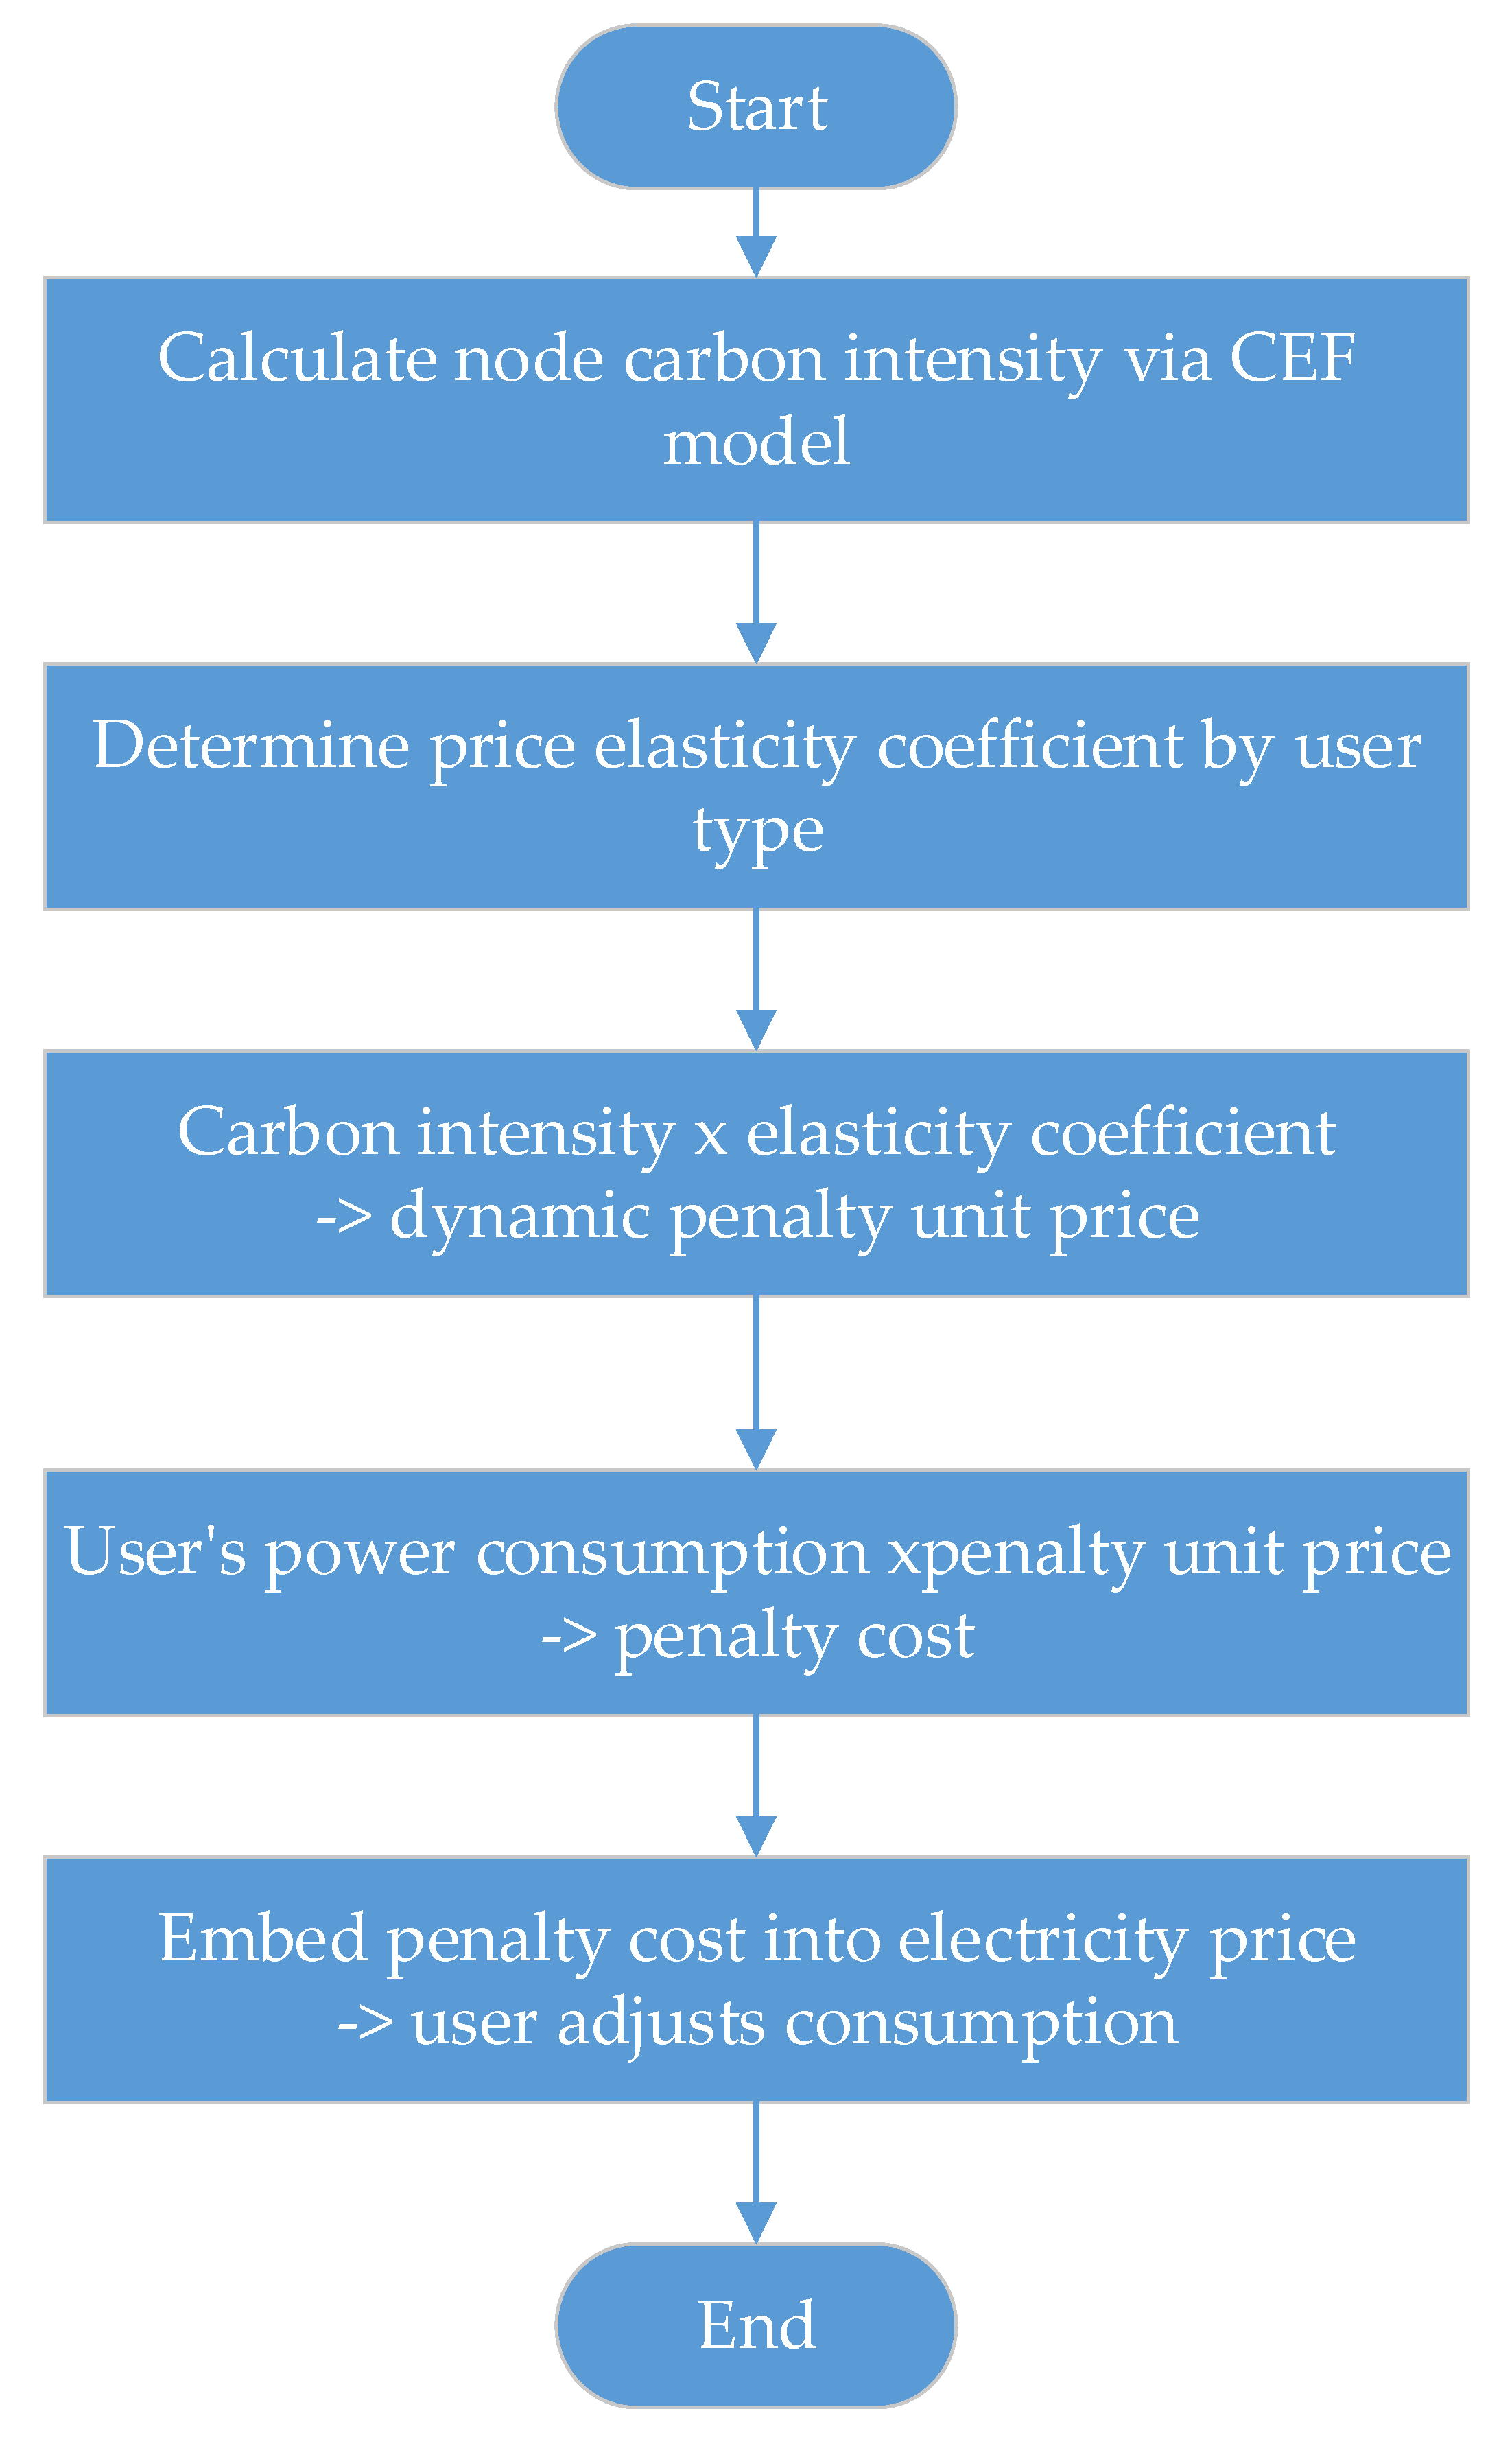
Section 2 investigates dynamic carbon intensity and formulates the demand-side emission penalty framework.
Section 3 details the CPS-based shared energy storage mechanism, including its architecture, aggregation process, and safety controls.
Section 4 establishes the carbon-constrained dispatch model for ADNs with shared storage, defining objective functions and constraints.
Section 5 presents case studies on a modified IEEE 33-bus system to verify the framework’s effectiveness.
Section 6 concludes the work and outlines future research directions.
3. CPS-Based Shared Energy Storage Mechanism: Operation Mode and Efficiency Improvement
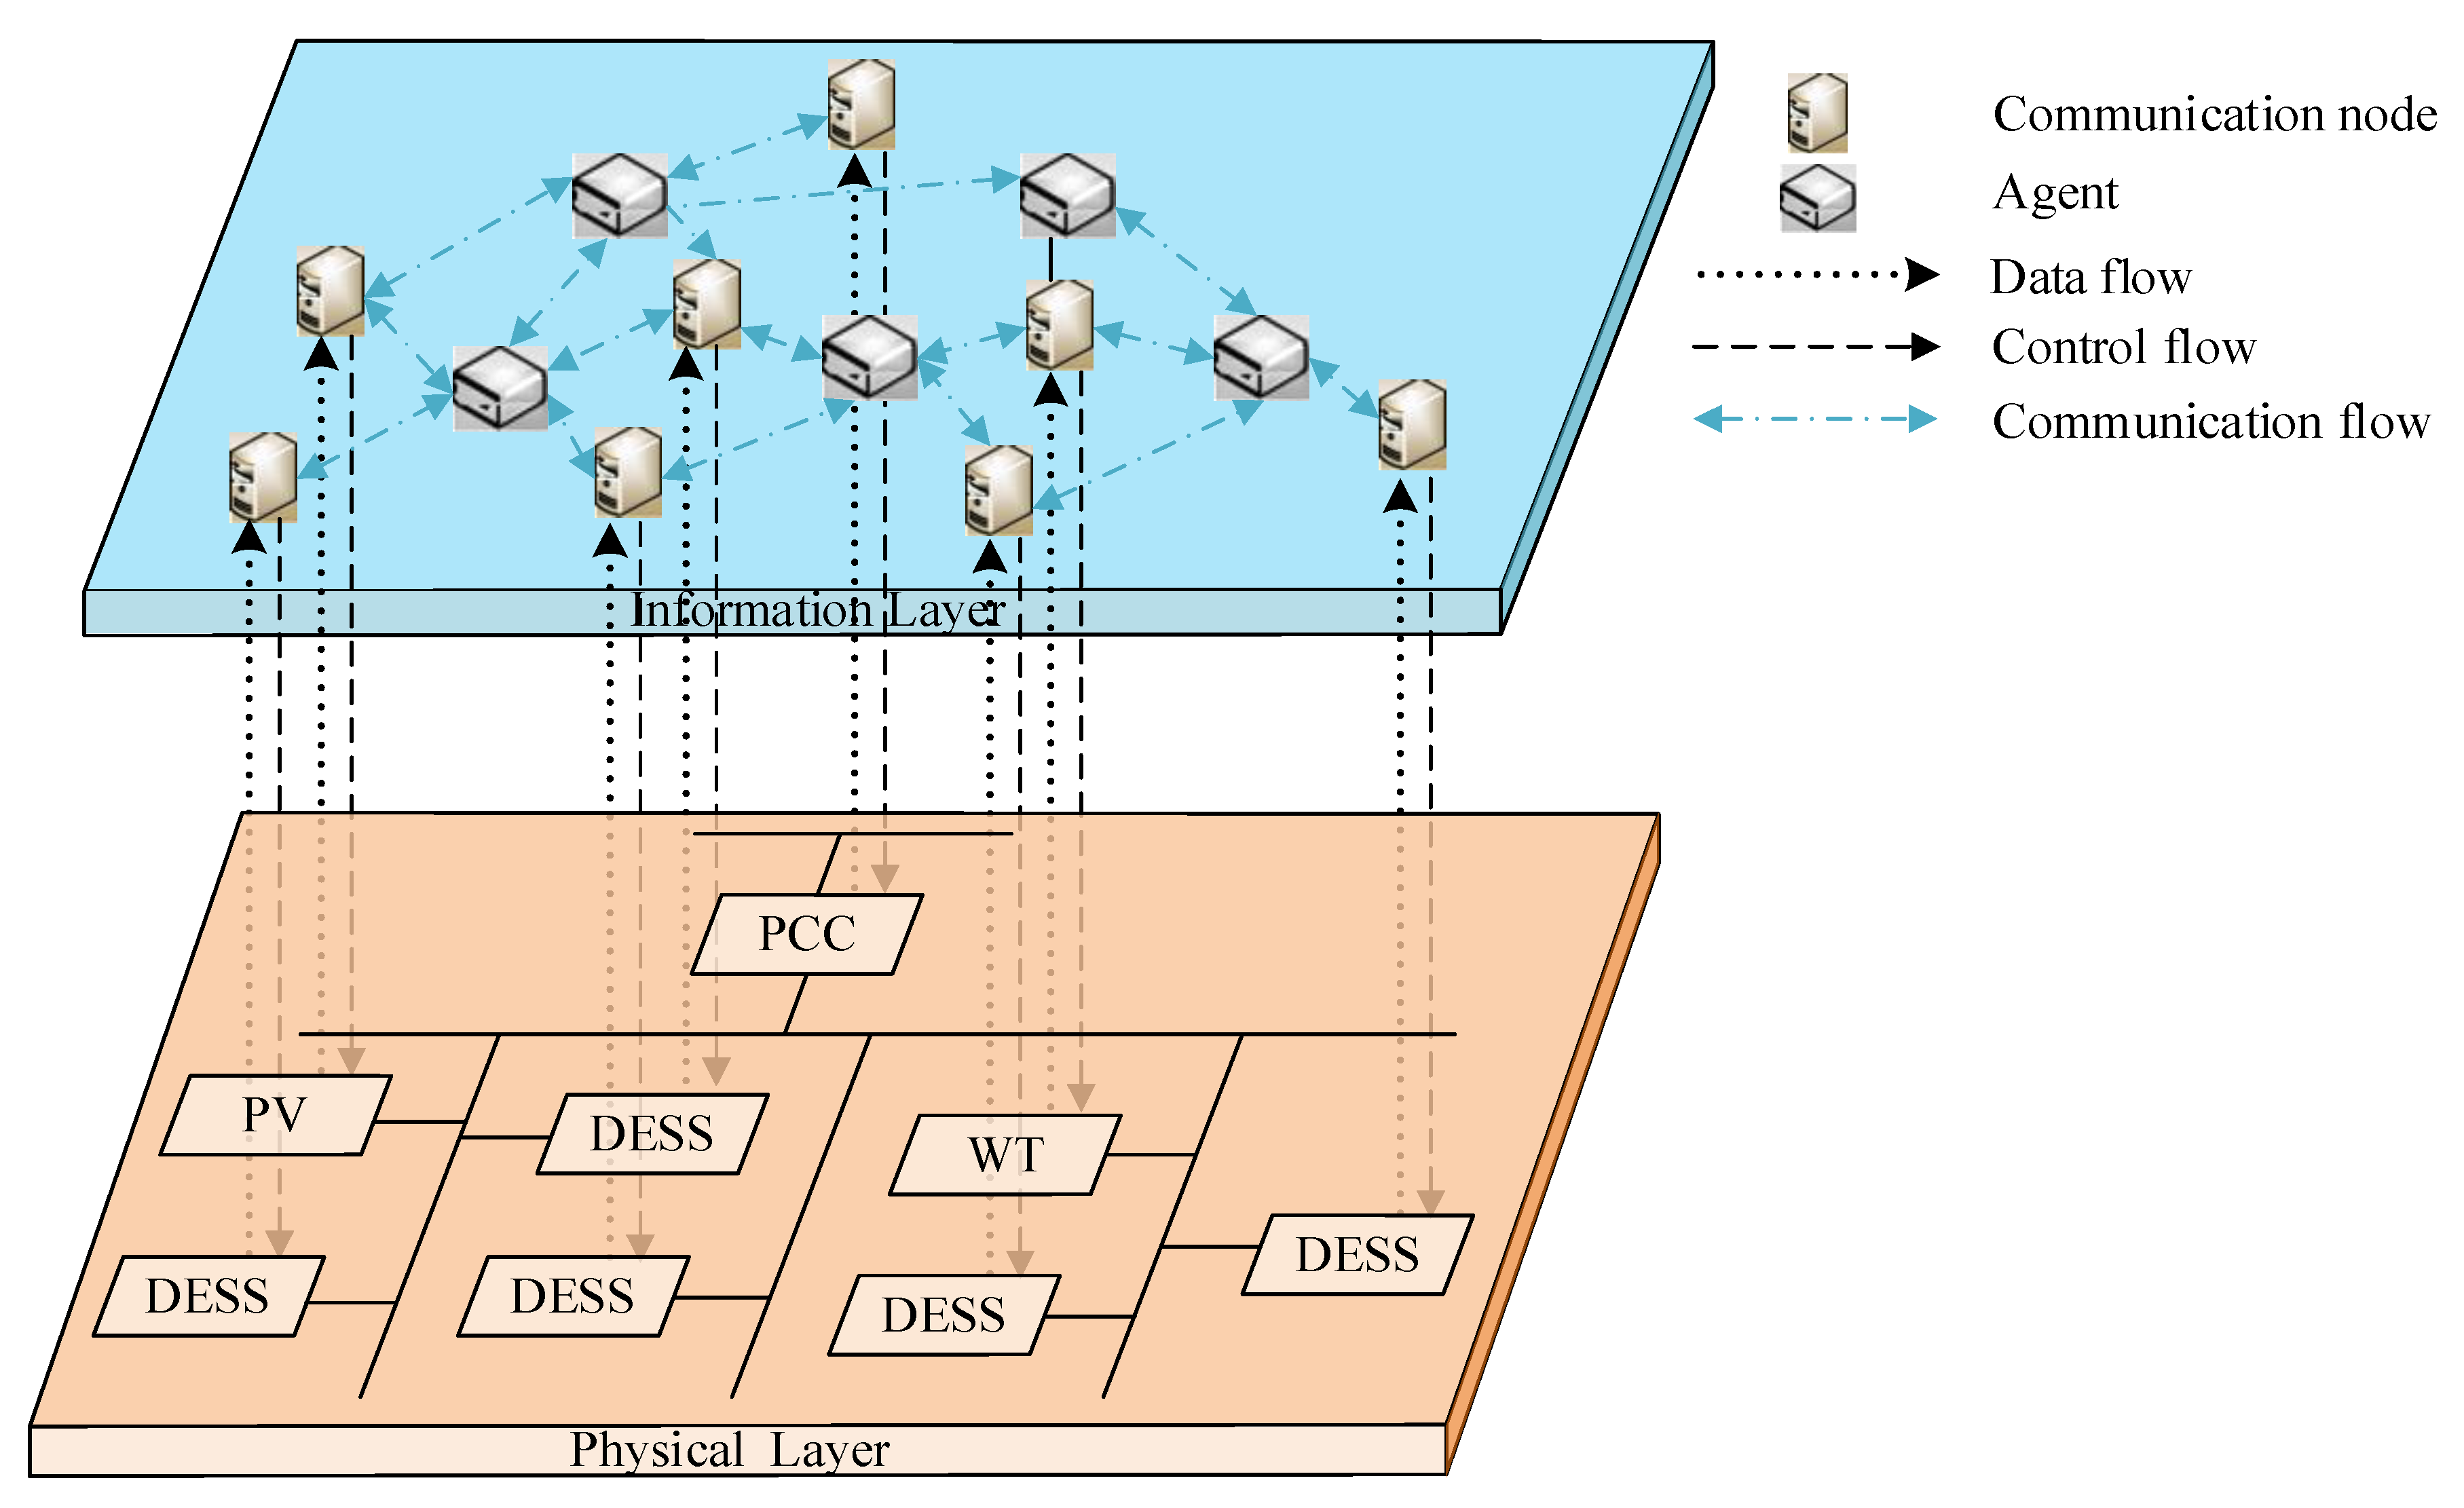
As a system that closely integrates computing and physical resources, CPS boasts core capabilities including rapid response to grid changes, high-precision control of energy flows, support for large-scale energy storage operations, and efficient information exchange between devices. These advantages make it an auspicious research direction in the field of low-carbon power systems—especially for addressing the challenges of distributed energy storage management. To fully leverage CPS’s strengths in resource coordination, a dedicated CPS architecture tailored to energy storage sharing operations has been constructed; this architecture serves as the technical foundation for connecting scattered energy storage devices and enabling unified scheduling. In the actual operational scenario of a distribution network equipped with multiple distributed energy storage systems, adopting an independent operation mode for each system often leads to prominent issues. On the one hand, individual energy storage devices may remain idle for long periods due to mismatches between local supply and demand, resulting in low overall utilization of energy storage resources. On the other hand, the fragmented operation of these systems means they cannot form a joint support force, limiting their ability to stabilize grid frequency, smooth load fluctuations, or respond to peak shaving demands—weakening their contribution to grid operation stability:
where
and
represent the distributed storage system operation cost, longer losses and gains. The method of income distribution is as follows.
where
N denotes the pool of dispersed storage agents engaged in the cooperative game;
signifies the profit share assigned to participant
e;
represents the collective weight of benefits attributed to coalition;
is the subset formed by removing agent
e from
S. The marginal contribution of each energy storage participant is calculated using the Shapley value, a method suitable for fair profit distribution in cooperative games. The revised profit distribution formula is expressed as: φ
e equals the sum over all subsets S of
N excluding e, where the term is calculated as (factorial of |
S| multiplied by factorial of (|
N| − |
S| − 1)) divided by factorial of |
N|, and then multiplied by the difference between
v(
S∪{
e}) and
v(
S). Here,
φe represents the Shapley value for participant
e, and
v(
S) represents the coalition value of set
S.
The theoretical computational complexity of Shapley value calculation is O(2N), where N is the number of energy storage participants. To reduce computational complexity, this paper classifies energy storage resources into fast-response sub-pools and energy-reserve sub-pools via CPS. After classification, the computational complexity is reduced to O(2K), where K is the number of sub-pools and K is much smaller than N. Taking the modified IEEE 33-bus system as an example, K is set to 2, and the computational complexity is reduced by approximately 90% compared to the theoretical value.
3.1. Introduction to the Cyber–Physical Framework
The cyber–physical framework for communal storage operates through three integrated layers. The physical layer comprises DES units with BMS, enabling real-time monitoring through edge gateways. The control decision layer serves as the system’s intelligence, employing a hybrid computing framework in which edge nodes handle urgent tasks such as voltage stabilization while cloud servers handle non-critical operations. The system optimization layer coordinates with the DSO, adjusting DES capacity based on grid forecasts and logging operational data for benefit allocation. This hierarchical structure ensures efficient storage sharing while maintaining grid compliance.
3.2. A Standardized DES Aggregation Process
The integration of distributed energy storage (DES) into a unified pool involves three standardized steps. First, DES units register their technical parameters and operational preferences on the platform. Second, a real-time state assessment calculates a participation score based on SOC, health, and response speed to determine task eligibility. Finally, qualified units are classified into specialized sub-pools—such as fast-response for stability control and energy-reserve for load shifting—optimizing task matching and reducing assignment latency by 30% in grid trials.
Location of ES Sub-pool Classification: As specified in the “pool classification” step of
Section 3.2, DES units are classified by technical characteristics via CPS: flywheel/supercapacitor ES (response speed ≤ 0.5 s) are grouped into “fast-response sub-pools” (for transient stability control); lithium-ion/lead-acid ES (capacity ≥ 500 kWh) into “energy-reserve sub-pools” (for long-term peak-shaving). The classification logic is implied in the “task matching” section.
Scalability Explanation: The infeasibility of Shapley value calculation for large N (number of participants) is solved by CPS classification—when N = 100, K = 2 (only two sub-pools), complexity drops from O(2100) to O(22) = O(4) (exceeding 90% reduction); even for N = 1000, K can be set to 3~4, keeping complexity manageable and ensuring applicability in large-scale scenarios.
3.3. Three Layers of Safety Controls
To address cybersecurity and physical fault risks in the sharing mechanism, the CPS architecture integrates three layers of safety controls. First, data transmission security is ensured via end-to-end encryption. All DES state data and control commands are encrypted using AES-256, and each communication session requires dual authentication to prevent malicious tampering [
16]. For example, a fake discharge command sent by an unauthorized user is rejected because it lacks the DSO’s valid certificate. Second, physical fault tolerance is achieved through “
N + 1 redundancy” for critical DES units. If a high-priority flywheel DES unit fails, the control decision layer automatically activates a backup unit within 0.5 s to avoid interrupting transient stability control [
15]. The system also implements a “fault isolation” logic: if a DES unit overheats, the physical layer immediately disconnects it from the grid to prevent cascading failures. Third, operational transparency is maintained via a distributed ledger that records all benefit allocation and task execution data. DES owners can access the ledger to verify their earnings, while the DSO uses it to audit compliance with grid regulations. This transparency reduces disputes over benefit distribution by 60% compared to centralized record-keeping, as reported in a pilot project [
21].
3.4. Practical Technical Feasibility of the CPS Layer
- (1)
Technical Feasibility of the Physical Layer
The physical layer can be implemented using existing mature equipment. Edge gateways use industrial Ethernet and 5 G NR for data transmission. The industrial Ethernet adopts EtherNet/IP, with latency controlled within 10 ms, and 5G NR operates in low-latency mode, with latency controlled within 5 ms. The BMS uses commercial products, such as Tesla BMS, which supports real-time SOC monitoring with a data update interval of 30 s.
- (2)
Technical Feasibility of the Control Decision Layer
The control decision layer adopts a hybrid computing architecture. Edge nodes use NVIDIA Jetson AGX to handle real-time tasks such as voltage regulation. Cloud servers use AWS IoT Greengrass to handle non-real-time tasks such as day-ahead scheduling. The task priority logic is implemented using the OpenPLCv3 open-source control software.
- (3)
Technical Feasibility of the Security Layer
The security layer adopts existing standardized technologies. Data transmission uses AES-256 encryption, a method widely applied in power systems. The distributed ledger uses Hyperledger Fabric, a technology that has been deployed in multiple power system pilot projects. Critical equipment adopts N + 1 redundancy configuration, a mature standard in the power industry, which ensures the fault tolerance of the system.
4. Carbon-Constrained Dispatch Framework for ADNs with Communal Storage
To keep the grid purse lean, the objective function is cast as a single, minimisable cash flow that tracks every cash outlay triggered between the substation tail and the end-user meter. Besides classical entries—fuel, losses, capital decay, line upkeep—the ledger now folds in the life-cycle burn rate of the cloud-orchestrated battery fleet: cycling surcharges, inverter wear, thermal management and the marginal cost of virtual aggregation itself. By focusing on minimizing these comprehensive costs, the optimization strategy aims to balance economic efficiency with the functional advantages of shared energy storage. This means not only reducing direct expenditures but also maximizing the cost-saving potential brought by shared energy storage—such as lowering peak shaving costs through coordinated energy storage dispatch, reducing the need for expensive backup power sources, and extending the service life of energy storage devices through rational utilization. Ultimately, this optimization direction ensures that while the distribution network maintains stable and reliable operation, it achieves the lowest possible economic input, laying a solid foundation for the sustainable development of low-carbon power systems that integrate shared energy storage.
4.1. Objective Function
The operational cost
Coperation is formulated as follows:
where
represents the bulk-market energy charge imposed by the transmission system,
is the on-site production cost of every controllable local generator,
denotes the monetary penalty tied to real-time carbon intensity, and
is the service fee paid to the cloud-based shared-storage coalition.
4.2. Constraint Conditions
- (1)
Power flow constraints
Leveraging the distribution network’s distinctive characteristics, this study incorporates the power-flow constraint from ref. [
7]. This choice not only guarantees the accuracy of the research outcomes but also streamlines the solution process. By adopting this constraint, we can effectively model the real-world power flow dynamics within the network, accounting for factors such as voltage limits, line capacity constraints, and power balance across nodes. This approach ensures that our analysis reflects the actual operational conditions of the distribution network, yielding reliable, practical results. Meanwhile, the selected constraint structure avoids unnecessary complexity, allowing for efficient computation and timely insights into the system’s low-carbon economic dispatch performance.
where
is the outlet node of the node
j,
is the end node of the node
j;
and
are the active power and reactive power injection, respectively,
and
are the active power and reactive power of the branch
i −
j, respectively;
is the impedance of the branch
i −
j;
is the transformer ratio of the on-load tap changer;
is the square of the voltage amplitude at the node
i;
is the square of the current amplitude.
- (2)
Node voltage constraint
where
and
are the upper and lower limits of the node voltage amplitude, respectively.
- (3)
Branch capacity constraint
where
is the upper limit of current amplitude on branch
i −
j.
- (4)
Operation constraints of renewable energy power generation
where
denotes the predicted active-power injection;
is the measured active-power delivery;
represents the reactive power output, and
stands for the inverter capacity of the renewable energy generation device.
- (5)
Operational Constraints for Controllable Distributed Generators
The operational constraints for controllable distributed generators are expressed as:
where
and
represent the active and reactive power outputs of the controllable distributed generator;
and
are the upper and lower limits of its active power output, and
denotes the installed capacity of the controllable distributed generator.
- (6)
Operation constraints of the on-load voltage-regulating transformer
For the accurate linearized modeling of on-load tap-changing transformers, refer to [
17]. The constraints are:
where
is the standard tap ratio of the on-load tap-changer;
is the adjustment step;
is the adjustable gear of the on-load tap-changer, and
,
are its lower and upper limits.
- (7)
Operation constraints of the static reactive power compensation device
The constraints for static reactive power compensation devices are:
where
and
are the lower and upper limits of the adjustable reactive power output of the static reactive power compensation device, respectively.
- (8)
Operation constraints of the energy storage device
The operational constraints for energy storage devices typically involve state of charge (SOC), power output limits, and energy balance.
where
and
represent the power drawn to charge the storage unit and power released during discharge, respectively;
and
are the round-trip efficiency while storing energy and round-trip efficiency while releasing energy;
and
are binary flags that lock the unit into either charging or discharging mode, preventing overlap;
is the name-plate energy capacity of the storage device.
- (9)
Shared energy storage mechanism
- (10)
Low-carbon demand response
- (11)
Uncertainty Modeling of Renewable Energy Generation
Uncertainty in renewable energy generation is modeled using scenario analysis. Based on five-year historical meteorological data of Qingdao, 50 wind power output scenarios are generated using the Latin Hypercube Sampling method. Each scenario covers hourly fluctuations over 24 h, with a fluctuation range of ±15% of the predicted output. The min-max regret criterion is used to select the optimal scenario, ensuring the robustness of the dispatch strategy.
- (12)
Uncertainty Modeling of Demand
Uncertainty in demand is modeled using robust optimization. Based on historical load deviation data, uncertainty intervals for different user types are defined: ±10% for residential users, ±8% for commercial users, and ±5% for industrial users. The dispatch model is optimized within these intervals to avoid over-reliance on deterministic forecast results.
4.3. Integration of Uncertainty Modeling and MILP Formulation
The following supplements explain the construction and solution process of the MILP model in this paper, the conversion logic of uncertainty modeling into MILP deterministic constraints, and the specific roles of YALMIP and Gurobi:
- (1)
Functional Division of YALMIP and Gurobi
YALMIP, as a modeling tool, converts the paper’s low-carbon economic dispatch objectives, physical constraints, and uncertainty handling logic into standard MILP mathematical expressions. Gurobi, as an MILP solver, efficiently solves the model using its branch-and-bound algorithm for integer programming, converging quickly to the optimal solution.
- (2)
Link Between Renewable Energy Uncertainty and MILP
We used scenario analysis to handle wind/solar output uncertainty. The integration logic with MILP is:
Input the wind/solar output data of 50 scenarios as parameters into the MILP model;
Introduce scenario weights ωs into the MILP objective function, extending “single-scenario optimization” to “multi-scenario weighted optimization” with the formula:
where
Cgrid,s and
CDG,s are the grid purchase cost and controllable DG cost in scenario s, respectively;
Set separate constraints for each scenario s in MILP constraints, ensuring the model meets physical constraints in all scenarios. Finally, the min-max regret criterion is used to select a dispatch strategy robust to all scenarios.
- (3)
Link Between Demand Uncertainty and MILP
We used robust optimization to handle demand uncertainty. The conversion logic to MILP is:
Convert demand uncertainty intervals into deterministic boundary constraints in MILP. For example, the constraint for residential load Pload,res,t is extended to:
where
is the demand decision variable in the MILP model.
Directly use the extended demand boundaries in the MILP power balance constraint to ensure the model still meets power balance under the worst-case demand fluctuation, avoiding dispatch mismatch caused by demand forecast deviations.
5. Case Analysis
5.1. Execution Details
The simulation computations in this research are carried out using a modified version of the IEEE33 bus system, which is visually represented in
Figure 2. The parameter values utilized for these simulations are derived from existing literature, with specific reference to the data provided in studies [
7,
8]. The enhanced IEEE33 bus system is chosen to better reflect real-world distribution network characteristics, enabling a more accurate assessment of the proposed low-carbon economic dispatch strategy with shared energy storage. By leveraging these established parameters, the simulation can effectively model various operational scenarios, including different levels of renewable energy integration, load fluctuations, and shared energy storage participation, thus providing reliable insights into system performance.
All simulations in this study are conducted within the MATLAB R2019a programming environment. To efficiently handle the proposed low-carbon economic dispatch model and ensure accurate calculation results, we use the Yalmip optimization toolbox for model building—this toolbox simplifies the process of translating complex mathematical constraints into solvable optimization frameworks. After completing the model setup via Yalmip, we call the Gurobi solver to execute the solution; Gurobi is selected for its strong ability to handle mixed-integer linear programming problems, which helps accelerate the convergence speed of the algorithm and improve the efficiency of simulation calculations. The hardware platform supporting these algorithm compilations and simulations is a computer equipped with an Intel Core i7-5500 processor running at a clock speed of 2.40 GHz, paired with 8 GB of system memory. This hardware configuration provides sufficient computing power to handle the data processing and iterative calculations required for the enhanced IEEE33 node system simulation, ensuring that the entire simulation process runs stably without delays caused by insufficient hardware performance, and laying a solid foundation for obtaining reliable experimental results. The detailed parameter table for the improved IEEE 33-bus system is shown as
Table 4.
The low-carbon economic dispatch model proposed in this paper is a mixed-integer linear programming (MILP) problem. In terms of the objective function, the objective function is a linear function, composed of the sum of linear cost items including power cost, carbon penalty cost, and energy storage service fee. In terms of constraints, the constraints shown in Equations (8)–(16) are all linear constraints, containing only binary variables, such as δch,i and δdis,i in Equation (16), which are binary variables used to prevent energy storage devices from being in both charging and discharging states simultaneously. Due to the high efficiency of MILP solvers, the model in this paper does not require the use of heuristic algorithms such as particle swarm optimization. If the model is later extended to ultra-large-scale systems with nonlinear constraints, heuristic algorithms can be considered to further improve computational efficiency.
To make the article more understandable, this article will focus on introducing the details of the load and the basis for energy selection.
(1) Load Details: “The load data in this case is derived from real user-side data of Australian distribution networks, covering three typical load types: residential load (45% of total load, peak period 18:00–22:00 with peak power 4.2 MW, valley period 00:00–06:00 with valley power 1.8 MW), commercial load (30% of total load, peak period 9:00–17:00 with peak power 2.8 MW), and industrial load (25% of total load, basically continuous load with fluctuation amplitude ±5% and average power 2.5 MW). The temporal characteristics of the load are fitted by the ARIMA model to ensure matching with the temporal correlation of RES output fluctuations.”
(2) Energy Source Selection Basis: “Energy sources are selected based on the principle of ‘low-carbon priority + economic balance’: (1) Wind and PV: Referring to the renewable energy resource endowment of the case area, with an annual average wind speed of 6.2 m/s and annual average sunshine hours of 2200 h, which has conditions for large-scale development and zero direct carbon emissions; (2) Gas turbines: As controllable power sources, they are used to make up for the intermittency of wind/PV output, and their carbon emissions (420–450 g/kWh) are much lower than coal-fired units (820–850 g/kWh), balancing low-carbon and peak-shaving needs; (3) Distributed ESS: Used to smooth RES output fluctuations and shift peak loads to improve system operational flexibility. Lithium-ion battery ESS is selected due to its high first-order charge–discharge efficiency (≥90%) and fast response speed (≤0.5 s).”
5.2. Comparison Methods
To fully verify the effectiveness of the proposed low-carbon economic dispatch strategy, three distinct scheduling methods are set up for comparative analysis, with consistent parameters for all available resources across the three methods to ensure the fairness of the comparison.
The first method is Method 0, which refers to the strategy proposed in this study. This method integrates two core mechanisms simultaneously: the energy storage sharing mechanism which coordinates distributed energy storage resources to improve utilization, and the demand-side emission penalty scheme. By combining these two mechanisms, Method 0 aims to achieve both economic cost reduction and carbon emission control for the distribution network.
The second method is Method 1, defined as a scheduling approach that does not consider the energy storage sharing mechanism. Under this method, distributed energy storage resources operate independently rather than being coordinated through a shared system; this means idle energy storage capacity cannot be mobilized for grid support, and the flexible adjustment potential of energy storage is not fully exploited.
The third strategy, designated as Method 2, functions as a scheduling framework that omits two key components: the demand-oriented carbon emission penalty mechanism and the shared energy storage system. This method relies solely on conventional operational logic for power dispatch, without integrating any demand-side incentives for emission reduction or coordinated management of distributed energy storage resources. This method only relies on traditional scheduling logic without any low-carbon-oriented demand guidance or energy storage coordination. Pitting the baseline approach against the two proposed variants cleanly separates the standalone imprint of communal storage from the added leverage delivered by consumer-facing carbon penalties, revealing how each lever operates alone and how their combined use amplifies gains.
5.3. Analysis of System Operation Cost Results
This section focuses on analyzing the system operation cost results to verify the effectiveness of the proposed method in reducing economic expenditures. By comparing the cost performance of the three scheduling methods outlined earlier, we can clearly identify the impact of the energy storage sharing mechanism and demand-side emission penalty scheme on operational costs. First, detailed data on the various cost components of the three methods are organized and presented in
Table 1. These cost components are categorized to ensure clarity in comparison, with the core “power cost” covering three key parts: the generation cost of controllable distributed generators (DGs), the cost of purchasing power from the upper-level transmission network, and other associated expenses related to power supply. In addition to power cost, the “carbon emission cost”—a critical indicator for low-carbon operations—is also included in the analysis. This cost item tallies the carbon bill created by two separate streams: electricity drawn down from the bulk grid and the real-time output of every local, dispatchable generator. By breaking down costs into these categories, the table provides a comprehensive basis for evaluating how the proposed method optimizes both economic and low-carbon performance.
From
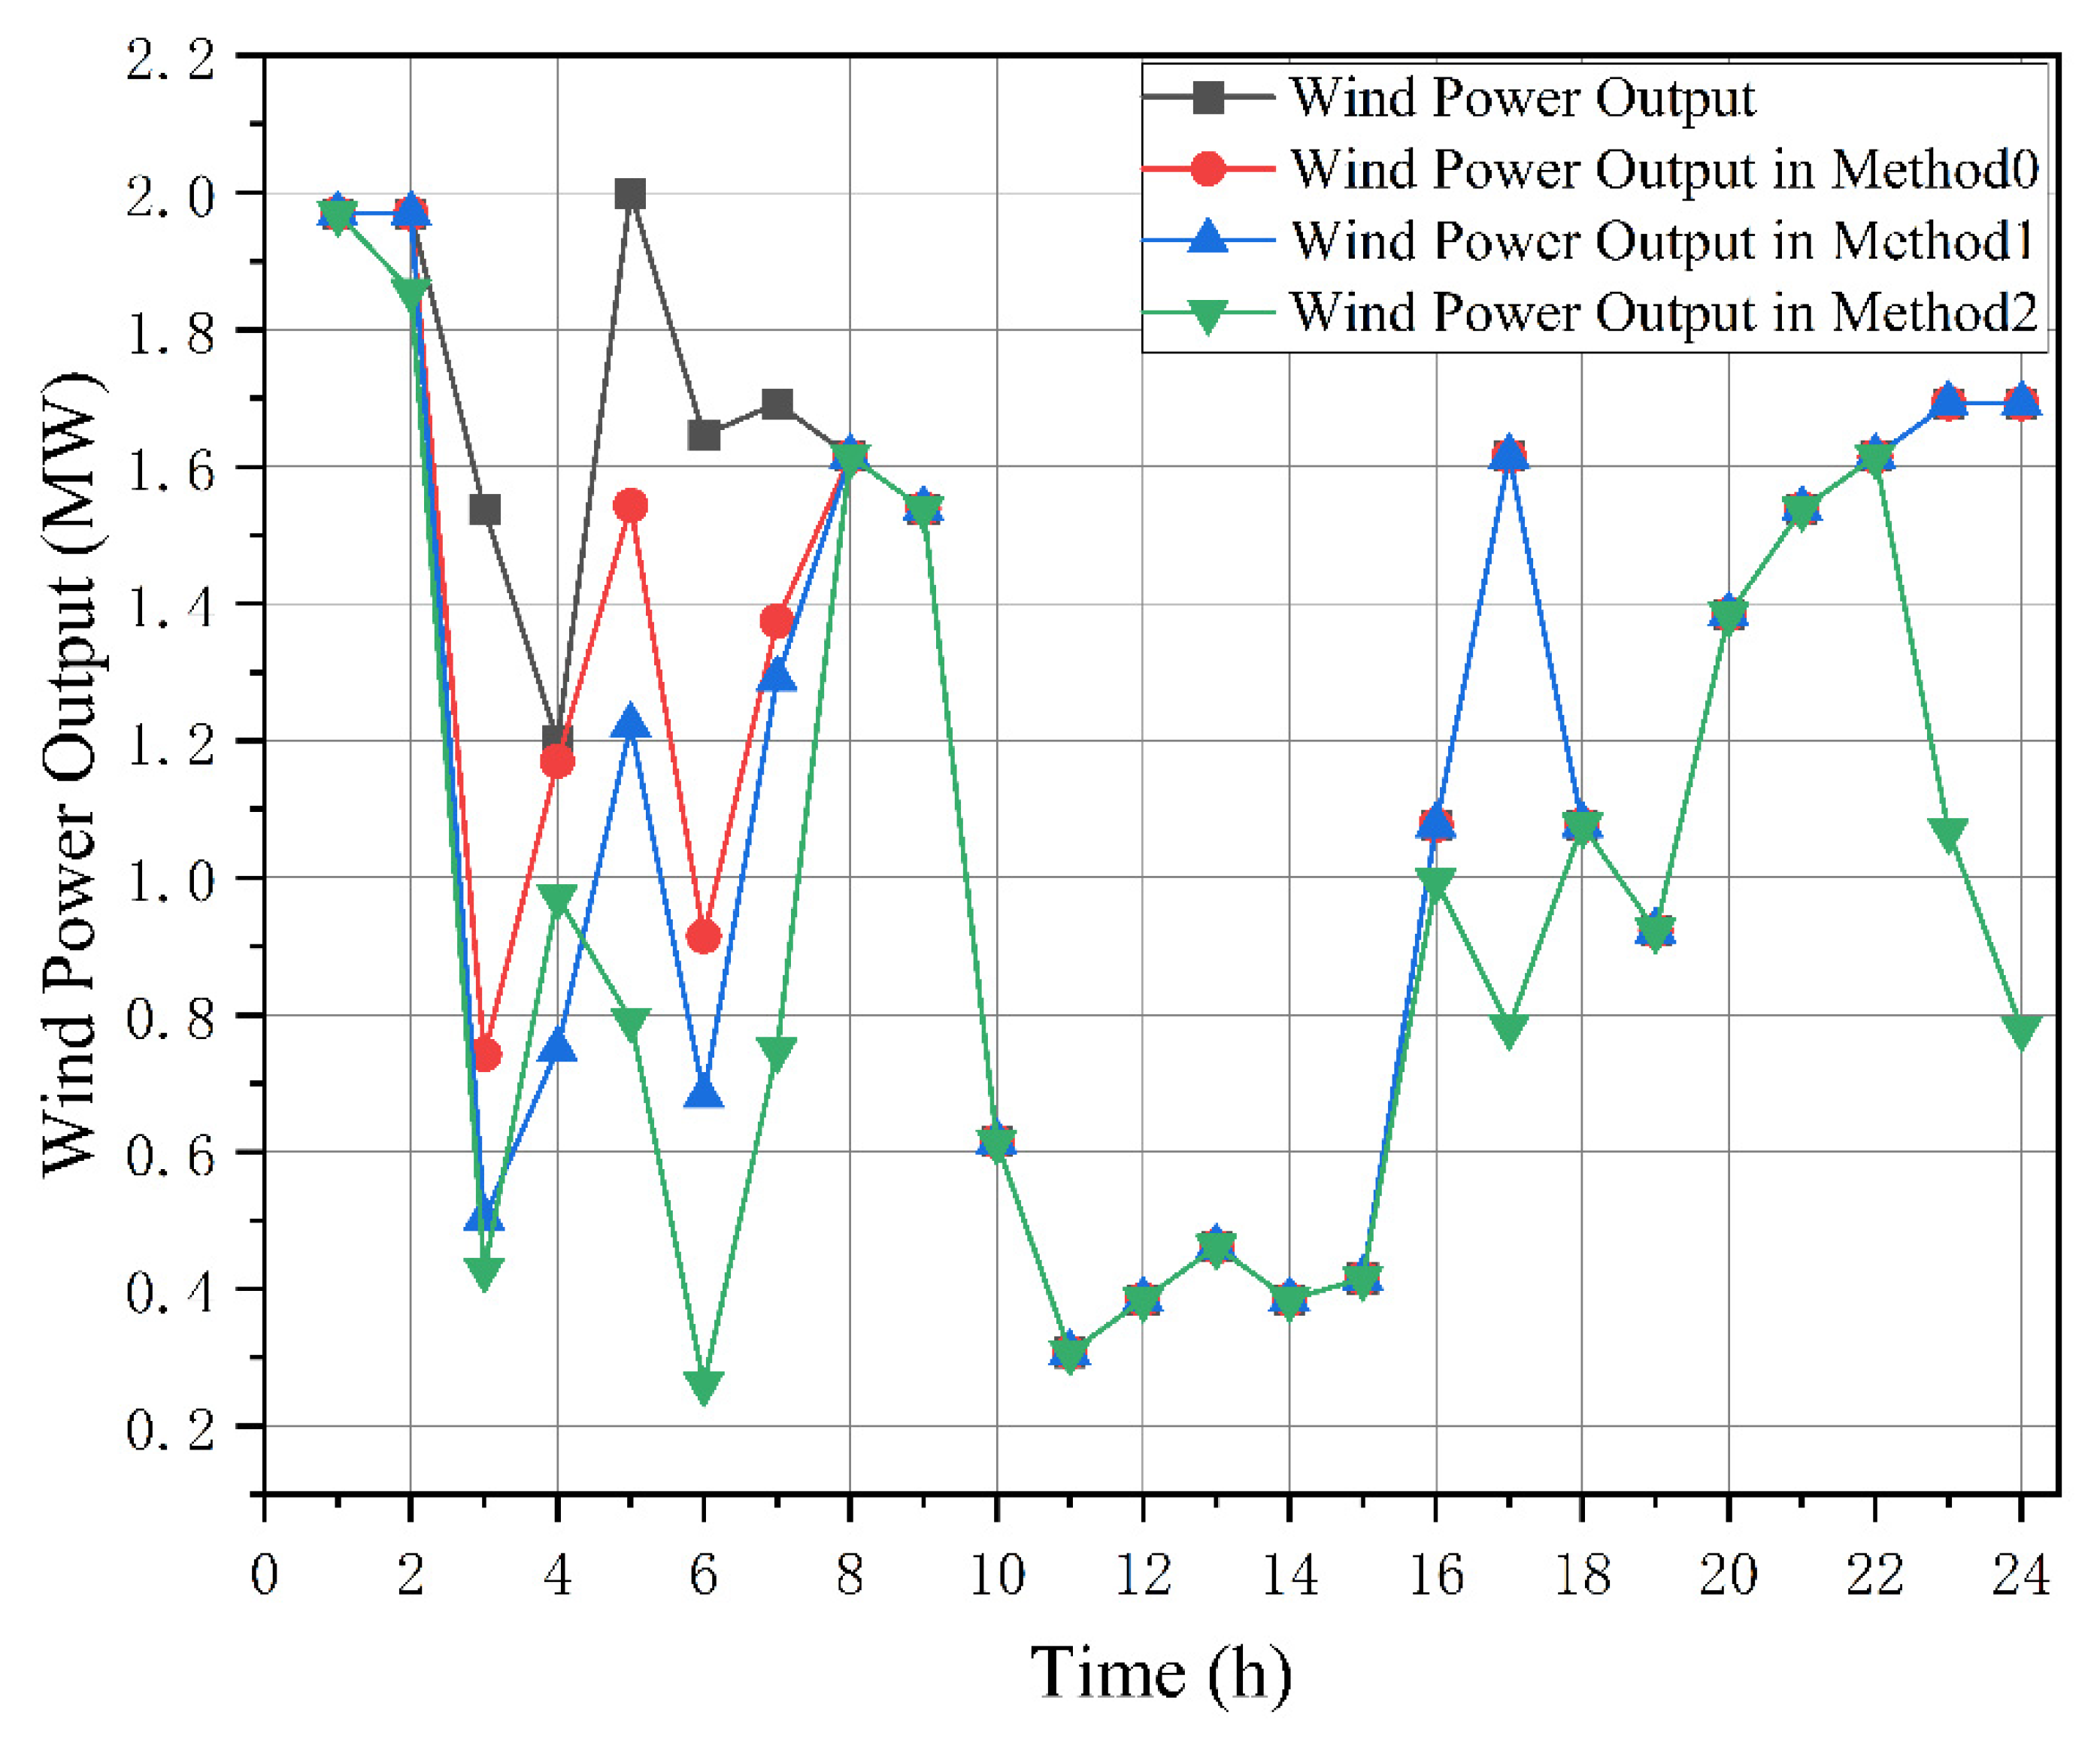
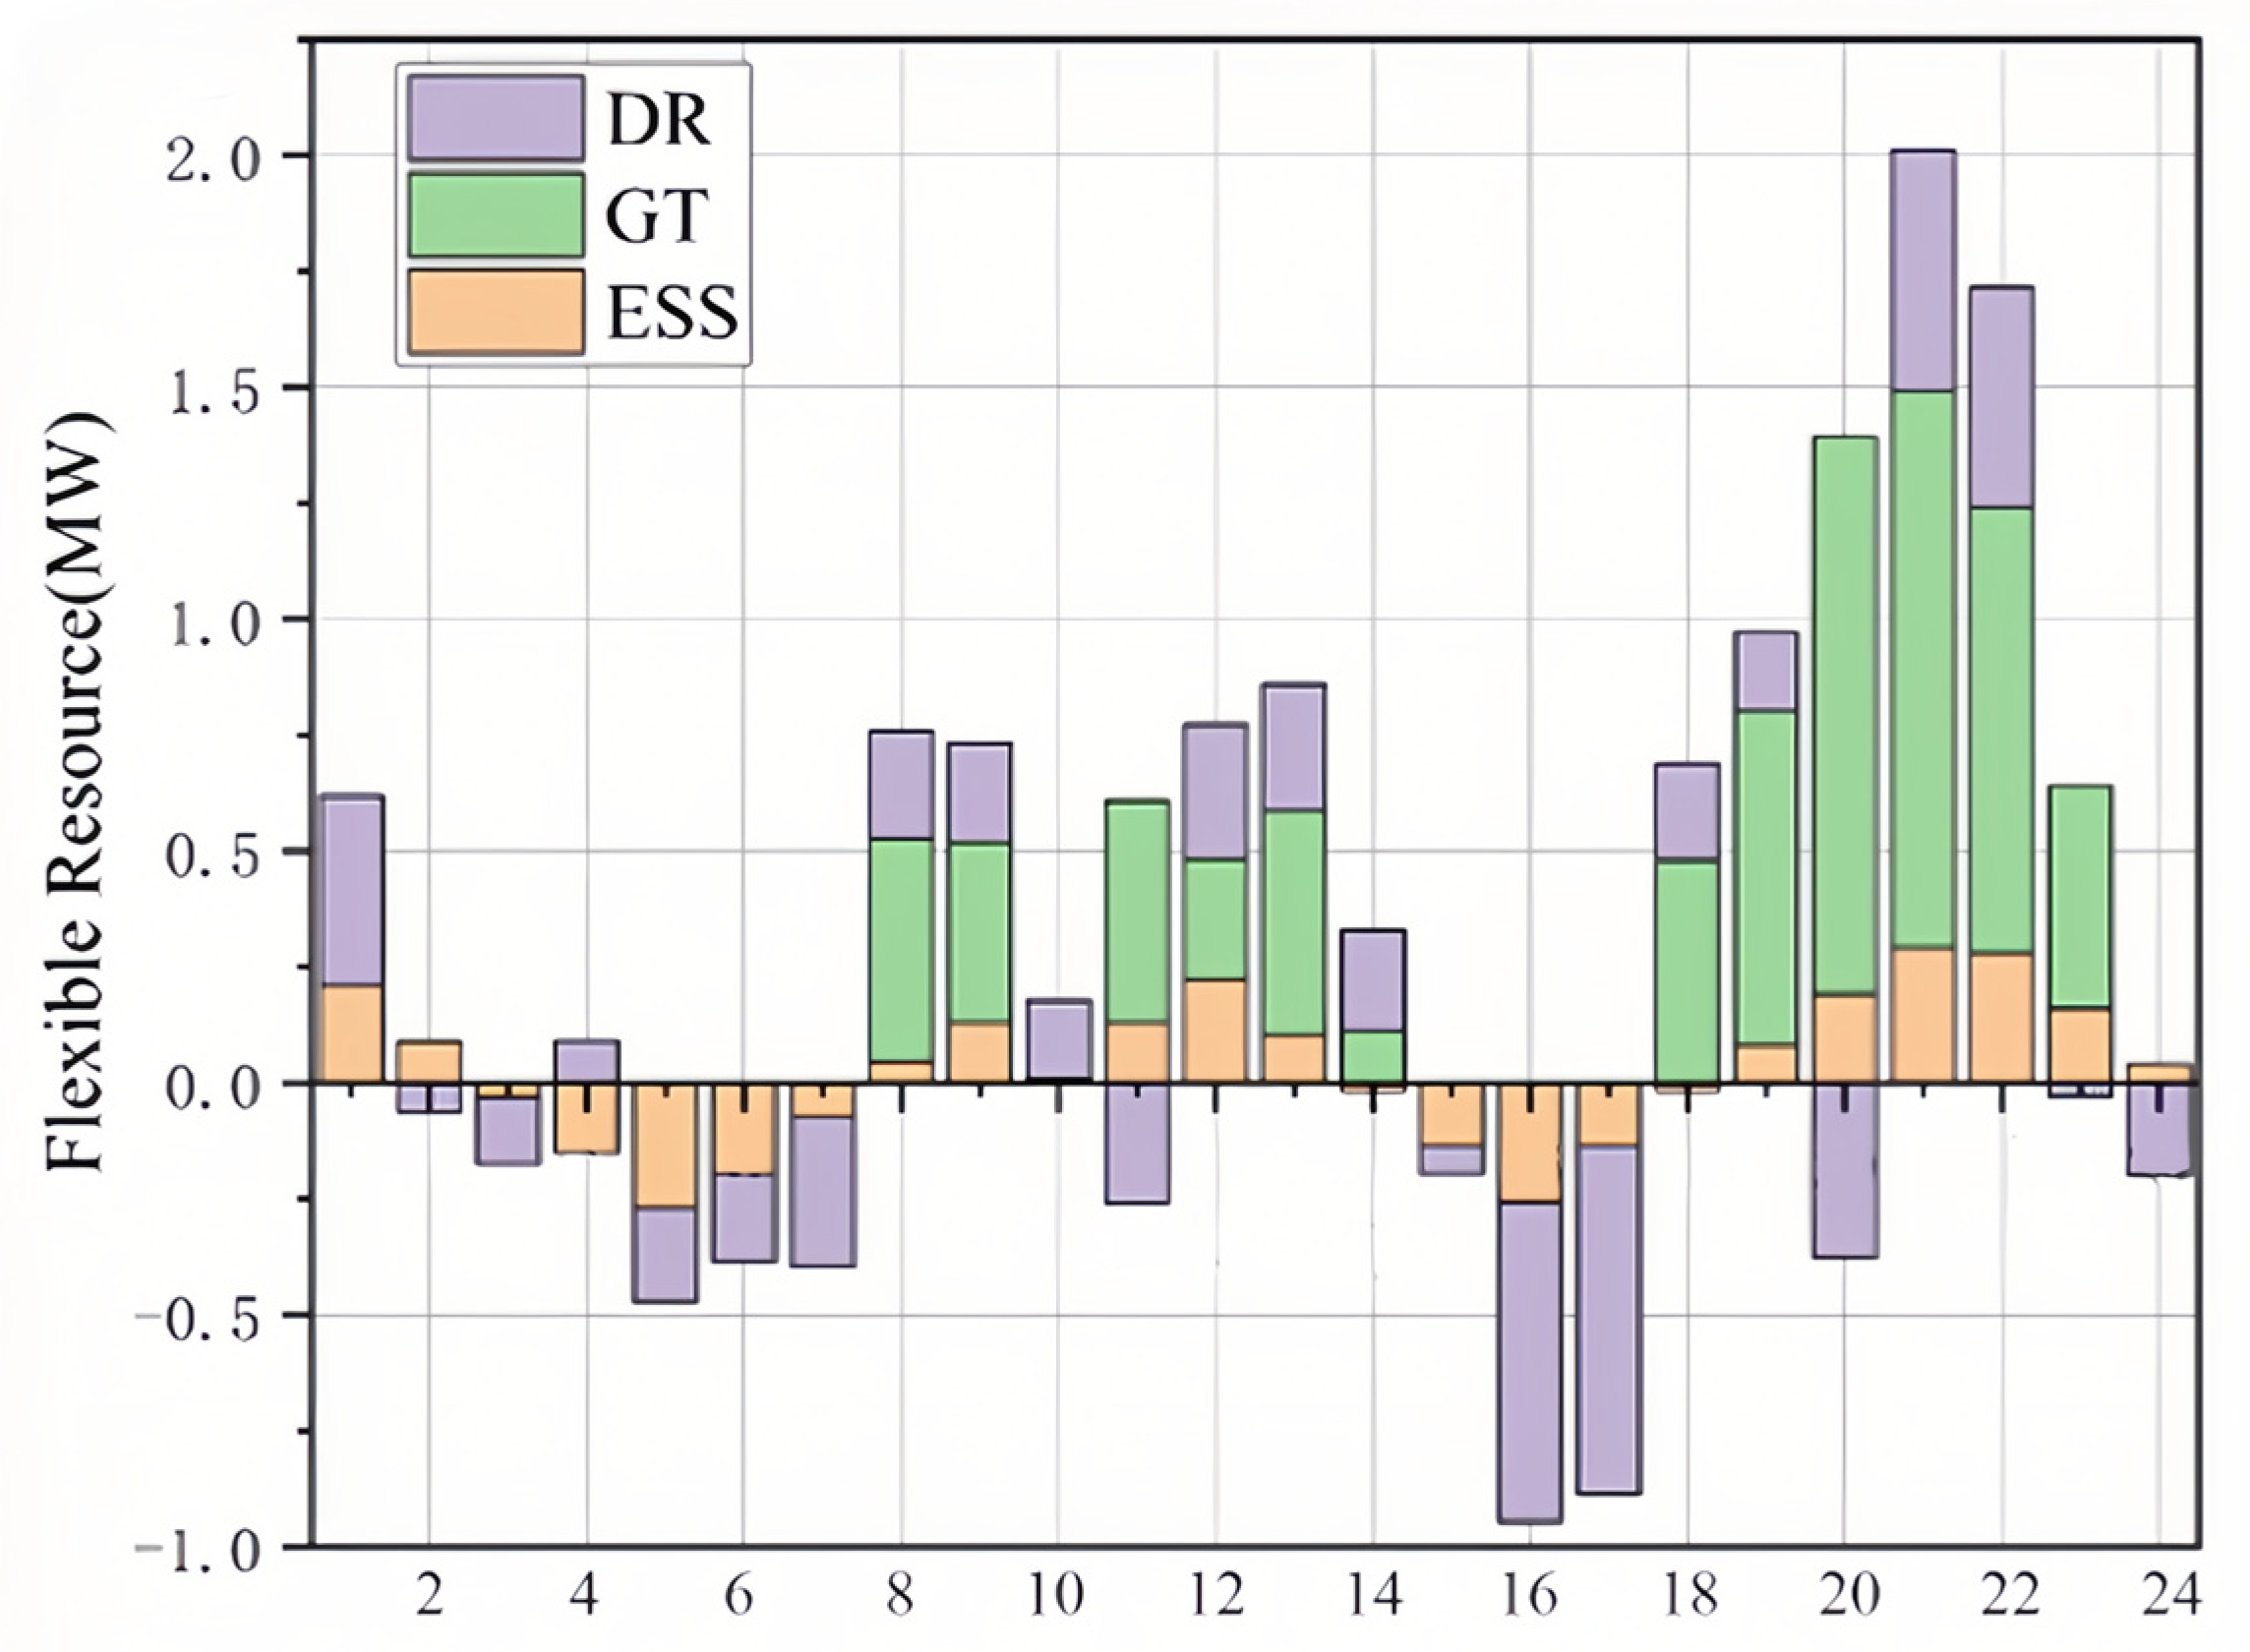
Table 5, it is clear that the proposed method (Method 0) achieves better performance in power cost reduction compared to Method 1 and Method 2. Method 0’s edge originates from the fusion of two design pillars: a user-centric carbon surcharge that monetises every avoided tonne, and a communal battery pool that monetises every stored kilowatt—working in concert to squeeze cost out of both pollution and imbalance. As these two mechanisms are gradually integrated into the scheduling process (from Method 2, which has neither, to Method 1 with only basic scheduling, and finally to Method 0 with both mechanisms), the system’s power cost and carbon emission show a steady downward trend. Notably, the energy storage sharing mechanism plays a particularly prominent role in this cost reduction: pooling fragmented behind-the-meter batteries under a single dispatch brain squeezes out dormant megawatt-hours, fine-tunes charge–discharge timing and trims expensive bulk-grid purchases. Cheaper hourly accounts coincide with greener ledgers: surplus wind or solar spikes no longer spill over the spill-curb but are tucked into the communal pack for later injection, turning erstwhile curtailed electrons into deferred, billable capacity. This not only reduces RES curtailment but also reduces the need to rely on high-cost flexible resources to compensate for RES volatility. For a more intuitive display of this effect, the specific data on RES curtailment rates and the output characteristics of flexible resources under the three different methods are presented in
Figure 3 and
Figure 4, respectively, these figures further verify how the proposed method enhances RES utilization while optimizing the operation of flexible resources.
The synergy between economic cost reduction and low-carbon operation achieved by the proposed framework, with specific mechanisms explained as follows:
- (1)
Cheaper hourly accounts: Refers to the reduction in system operational costs. For example, during midday (12:00–14:00), surplus solar power (1.8 MW) that would have been curtailed is now stored in the shared DES pool. In the evening peak (18:00–20:00), this stored energy (1.5 MWh) is discharged to replace grid power purchased at a high price (0.8 CNY/kWh), reducing hourly electricity costs by 1200 CNY.
- (2)
Greener ledgers: Refers to lower carbon emissions. By storing surplus RES power instead of curtailing it, the system reduces its reliance on high-carbon grid power during peak hours. As shown in
Table 2, Method 0 reduces grid-related emissions by 4.95 × 10
3 kg compared to Method 2, equivalent to a 3.5% reduction in total carbon emissions.
- (3)
Turning erstwhile curtailed electrons into deferred, billable capacity: Means that RES power previously wasted is now stored and used to meet later load demand, becoming “billable” energy instead of a loss. For instance, 2.32 MWh of wind power curtailed in Method 2 is reduced to 0.68 MWh in Method 0, with the saved 1.64 MWh used to offset evening peak grid purchases—simultaneously cutting costs and emissions.
It can be seen from
Figure 4 that compared with method 1 and method 2, the proposed method has the ability to consume RES in a better degree. That the reason why the operation of method 0 is the lowest among the dispatching methods. Furtherly, it can be seen from
Figure 5 that the full utilization of flexible resources can enhance system flexibility and improve the consumption of renewable energy. The flexible resources that can be scheduled in Method 0 include controllable DG, DR, and shared energy storage. When RES fluctuates sharply or the output is large, Method 0 adjusts the output of various flexibility resources to achieve maximum RES absorption, thereby significantly reducing the power cost and carbon costs of system operation.
5.4. Carbon Emission Analysis
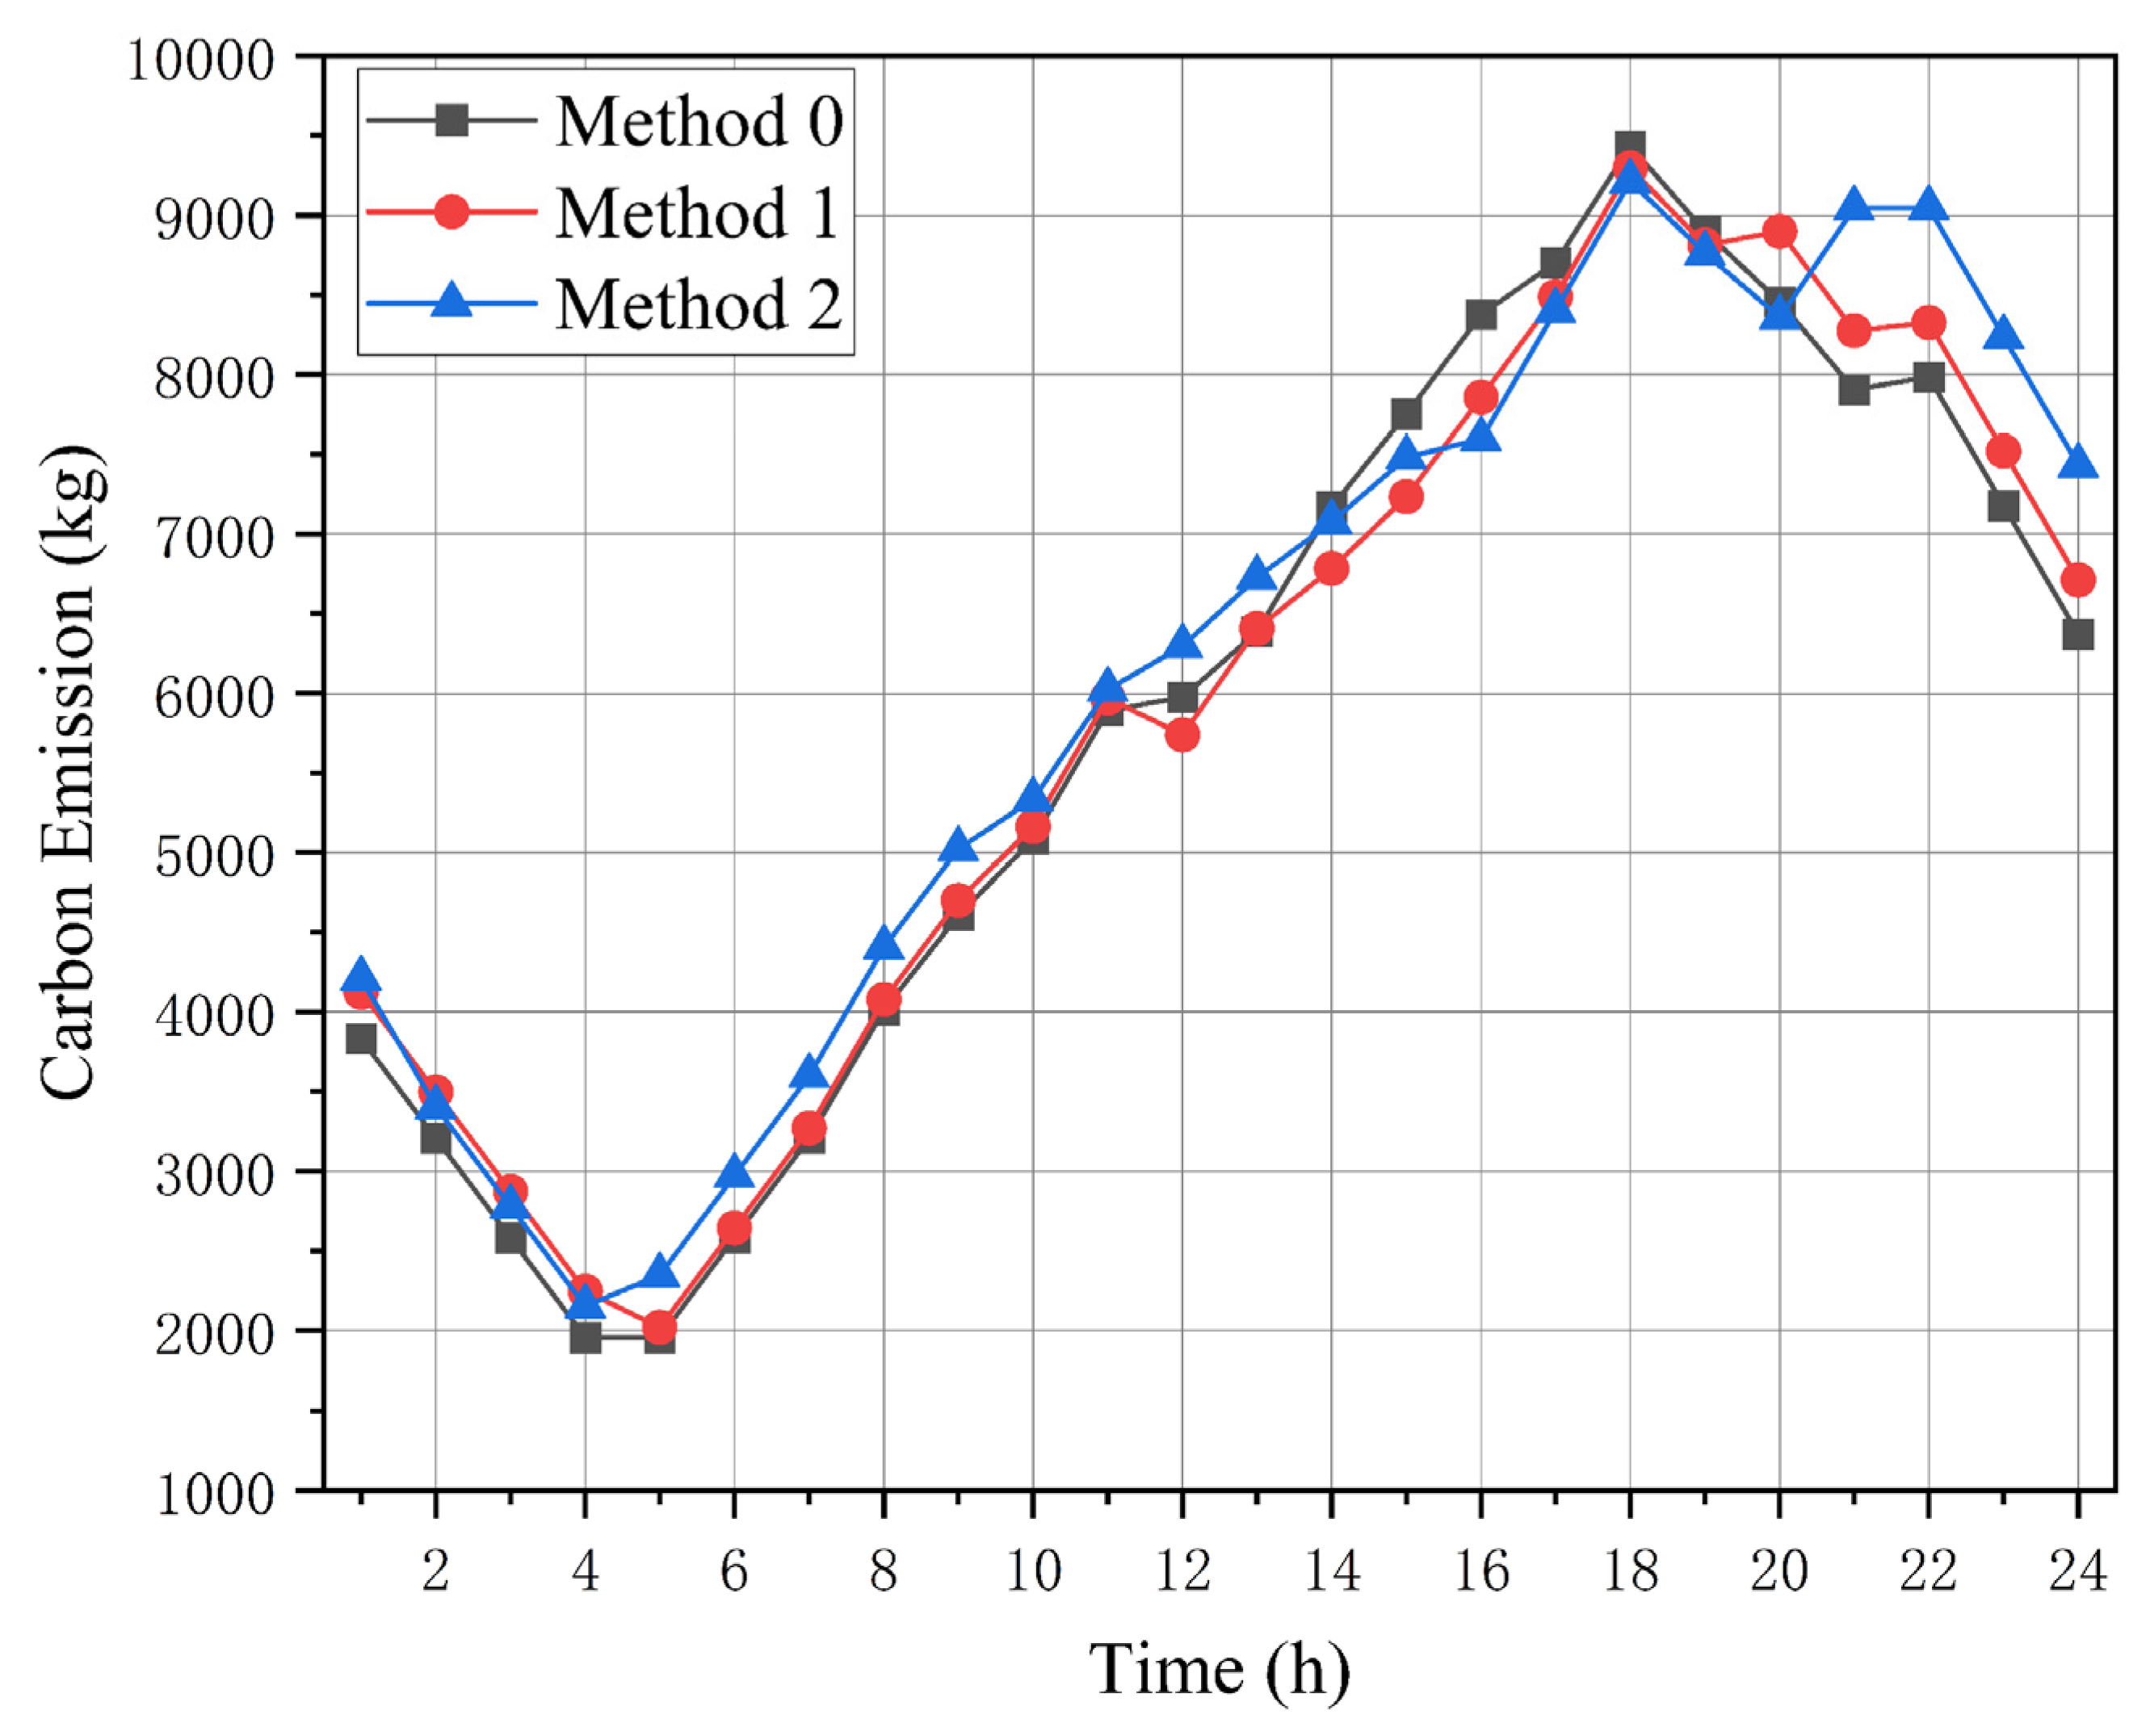
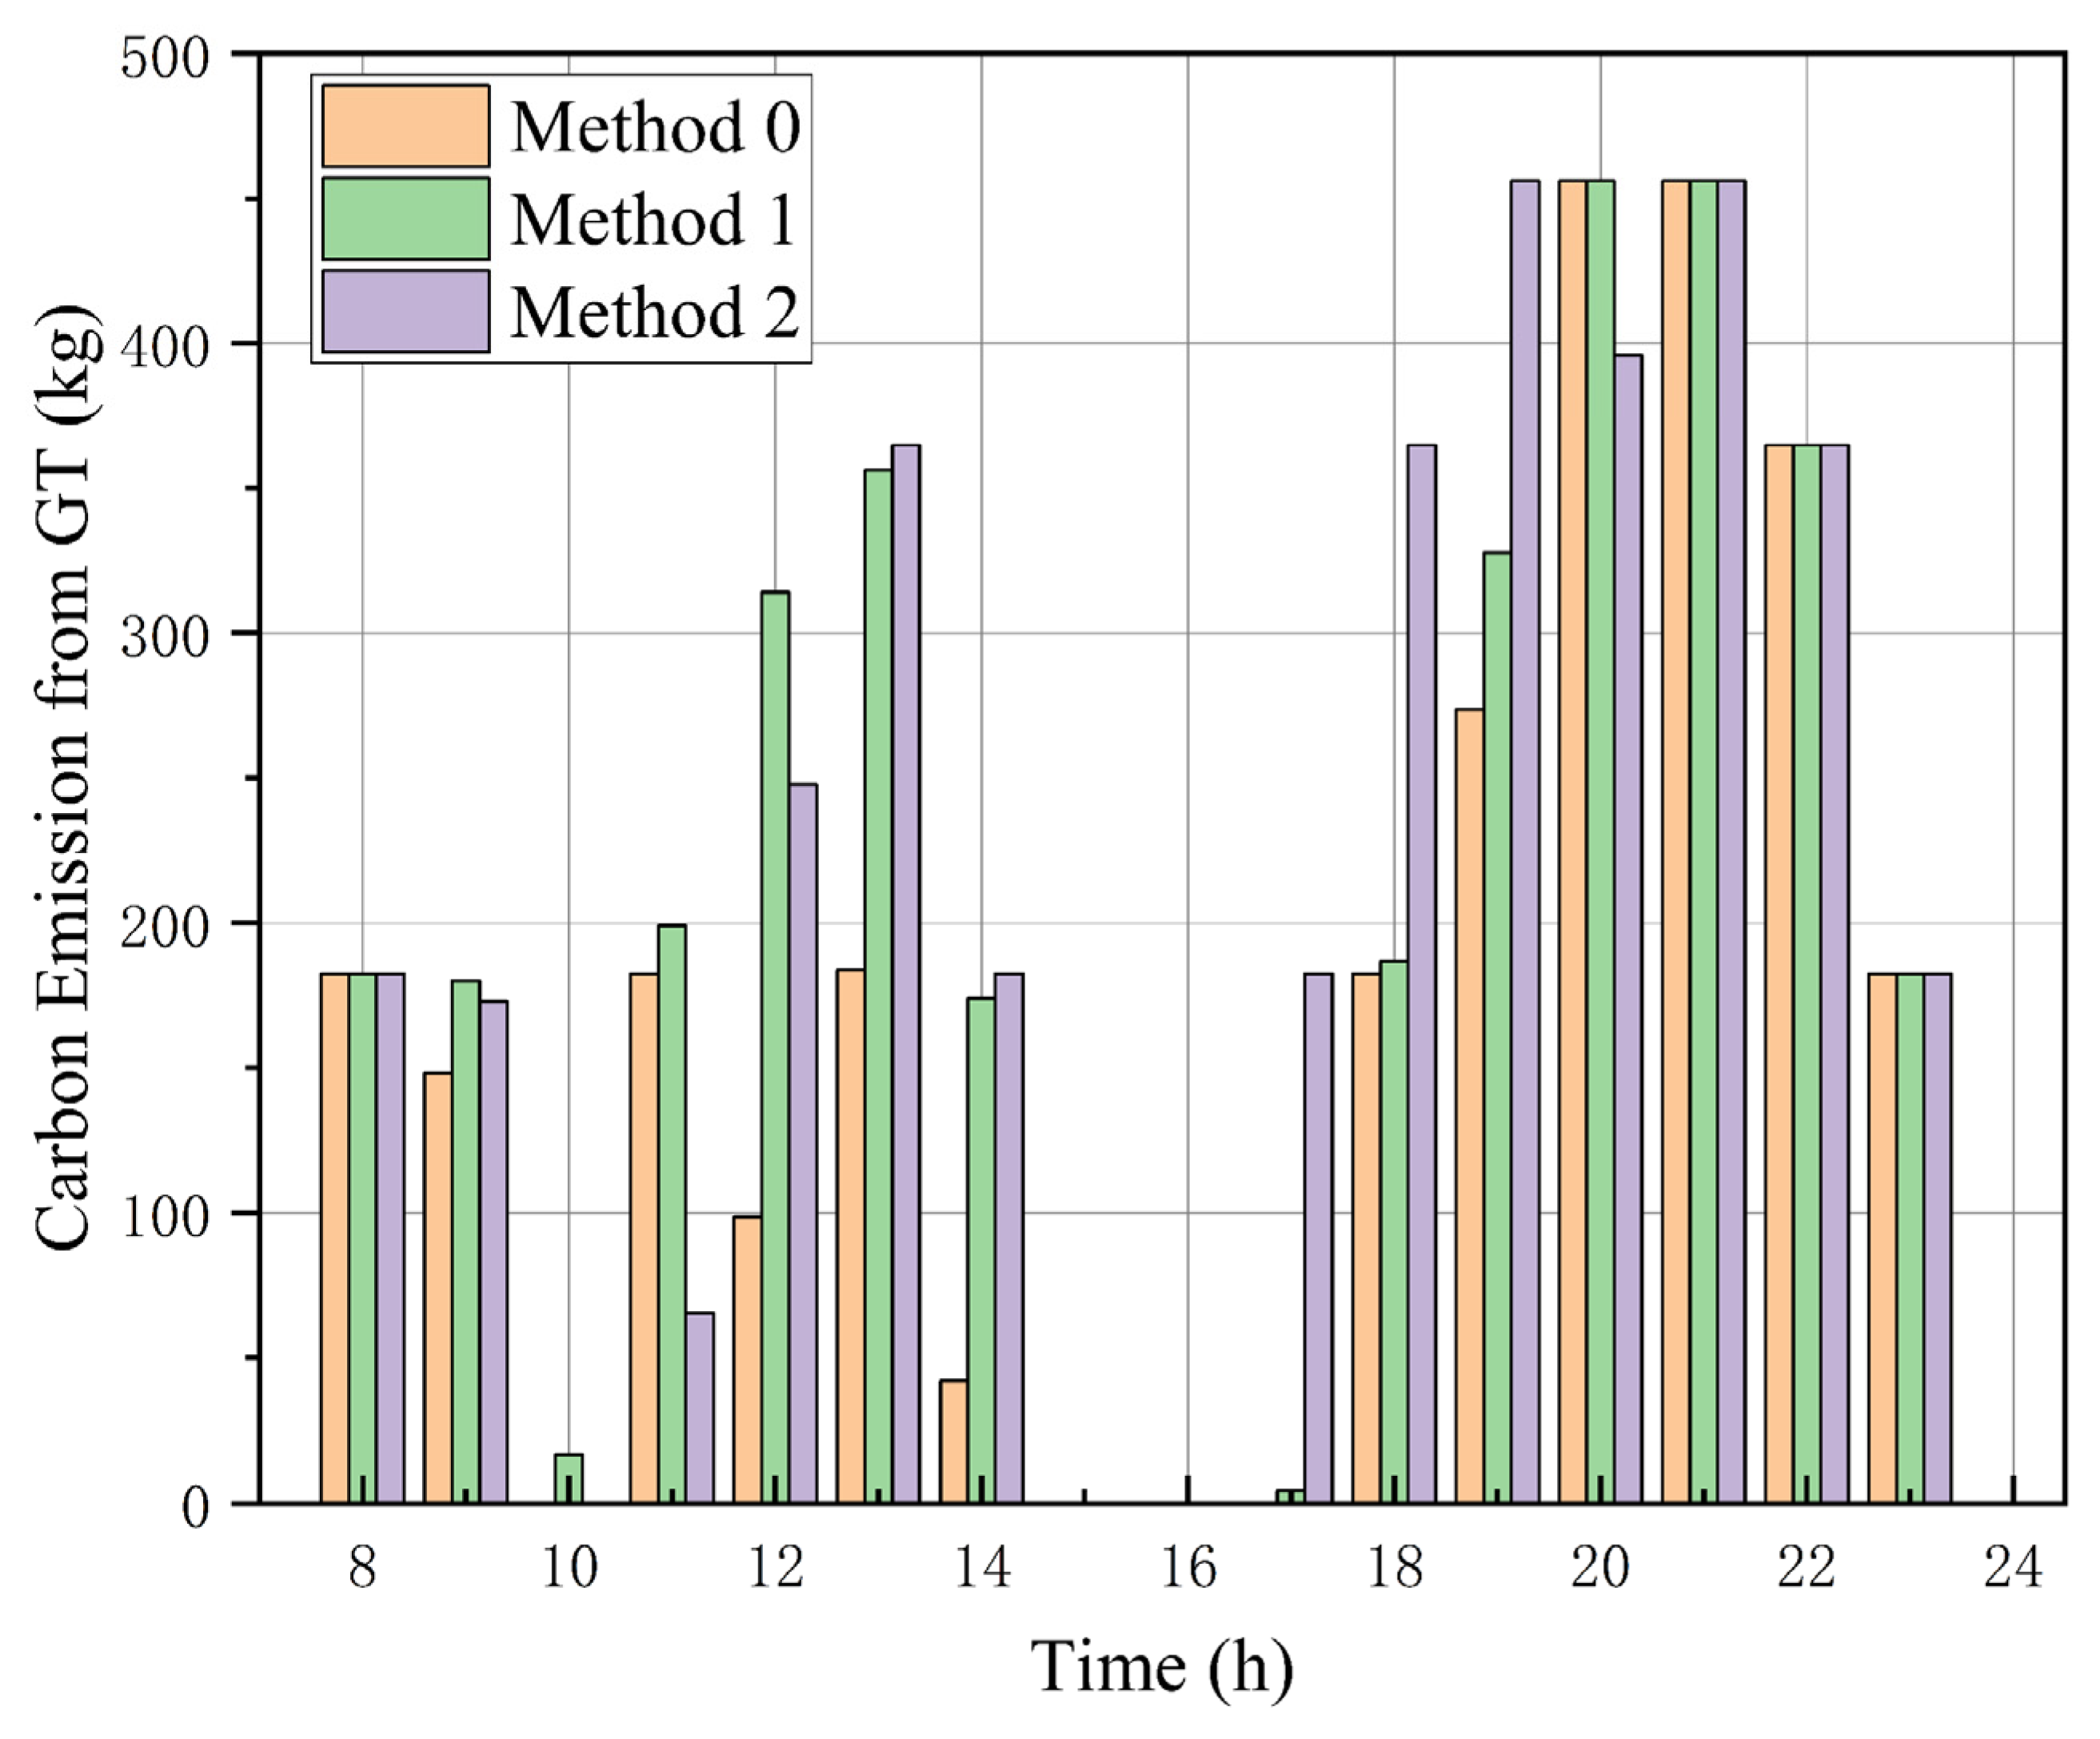
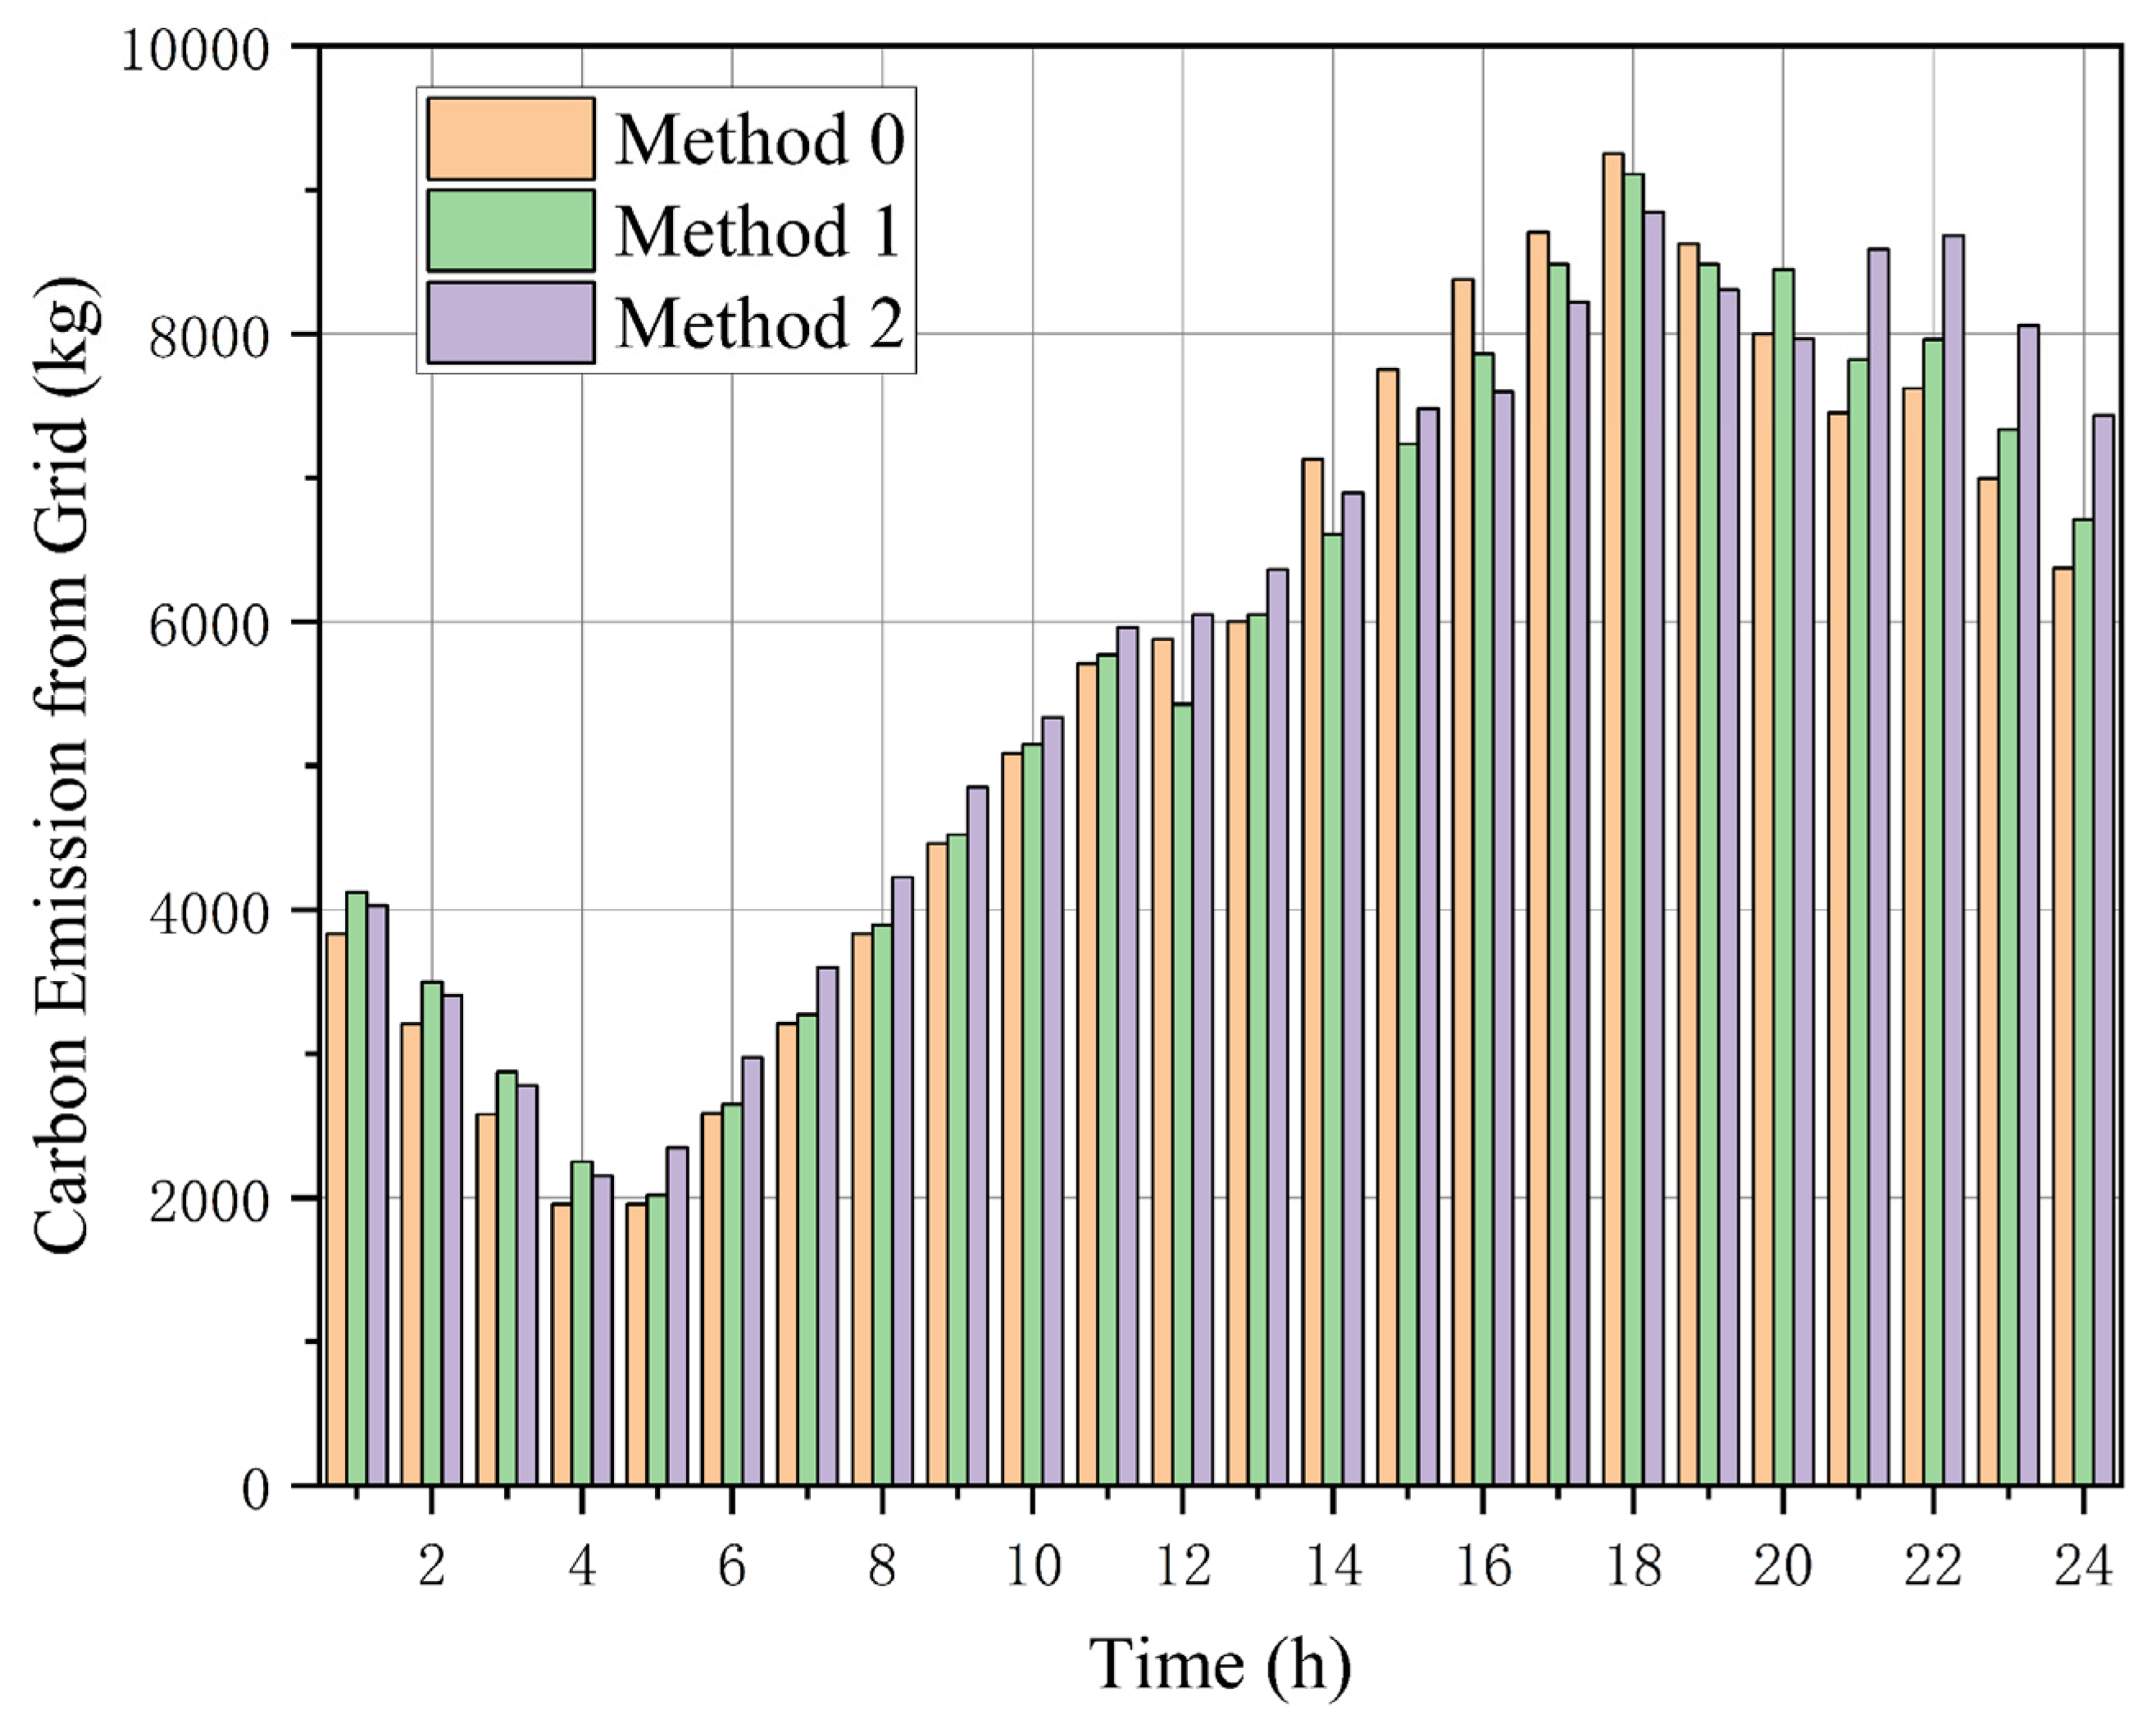
To thoroughly illustrate the effectiveness of the proposed approach in lowering carbon emissions, the carbon emission data of the three scheduling strategies (Method 0, Method 1, and Method 2) are depicted in
Figure 5. To leave no blind spot, the audit triangulates three distinct ledgers: the network-wide carbon bill, the footprint left by local dispatchable generators, and the invisible emissions embedded in every kilowatt imported from the upstream grid. Tracing this trio exposes exactly where the new scheme bites into CO
2. A glance at
Figure 6 confirms that, across almost every hour, the twin levers—user-facing carbon surcharge and communal battery pool—jointly shear tonnes off the total. Notably, the emission reduction impacts of these two mechanisms are approximately equal across the three analyzed aspects. This consistent decrease can be explained by the improved operational adaptability of the system due to the involvement of demand response (DR) and shared energy storage in scheduling. The demand-side emission penalty mechanism directs users to adjust their energy usage to periods with lower carbon intensity, whereas the shared energy storage framework allows for the temporal and spatial redistribution of renewable energy—storing surplus RES power during low-demand periods and releasing it during high-demand periods.
This improved flexibility reduces the system’s reliance on high-emission energy sources: on one hand, it decreases the need to start up or increase the output of CDG; on the other hand, it reduces the volume of power purchased from the transmission network. As a result, carbon emissions from both CDG and the transmission network are cut down, ultimately leading to a reduction in the system’s overall carbon emission. To benchmark the decarbonisation punch of each lever, we tabulate the hourly CO2 tallies for every test case, splitting the total into two clear slices: those produced by local dispatchable units and those imported—carbon-invisible at the meter yet very real—riding the transmission network. This table provides specific numerical values, allowing for a more precise assessment of how the proposed method optimizes the system’s low-carbon performance compared to the other two methods.
In
Table 6, when examining the side-by-side data from the three approaches, it becomes evident that the demand oriented emission penalty mechanism achieves a more pronounced reduction in carbon output than the shared energy storage system. Among all emission reduction contributions, the reduction in carbon emissions associated with the grid is particularly significant under the demand-side emission penalty scheme. This difference in reduction effects can be attributed to the relatively limited capacity of the shared energy storage system. Pooling scattered batteries certainly unlocks dormant megawatt-hours, yet the virtual reservoir can never pour out more power than the collective name-plate rating of the physically connected cells. This means it can only adjust energy flows within a certain range, limiting its ability to fully replace high-emission grid power or reduce CDG output on a larger scale. In contrast, the demand-side emission penalty scheme acts directly on user consumption behavior: by linking electricity costs to carbon emissions, it guides a large number of users to collectively reduce energy demand during periods of high grid carbon intensity. This large-scale adjustment of user load not only directly reduces the amount of high-emission power that needs to be purchased from the grid but also alleviates the pressure on CDG to compensate for peak load—thereby achieving a more significant overall carbon emission reduction effect, especially in terms of cutting grid-related emissions, as shown as
Figure 7.
The more significant grid-related emission reduction under the demand-side penalty scheme stems from its direct impact on total electricity demand scale and timing, while the shared energy storage system is constrained by its physical capacity ceiling. Specifically:
- (1)
Demand-side penalty mechanism: By linking electricity costs to real-time carbon intensity, it guides a large number of users to shift load from high-carbon periods to low-carbon periods. As shown in
Table 2, under Method 0, grid-purchased power during high-carbon hours decreases by 23.6% compared to Method 2, directly cutting emissions from upstream thermal power plants.
- (2)
Shared energy storage constraints: The total capacity of the aggregated DES pool in this study is 1.5 MWh, which can only store surplus RES power equivalent to 1.2 h of peak solar output. When RES output exceeds storage capacity, the system still needs to curtail 0.3 MW of PV power, limiting its ability to replace high-carbon grid power. In contrast, the demand-side penalty reduces grid power demand by 0.8 MW during high-carbon periods, a reduction that is not constrained by physical storage limits.
5.5. Analysis of Energy Storage Resource Utilization
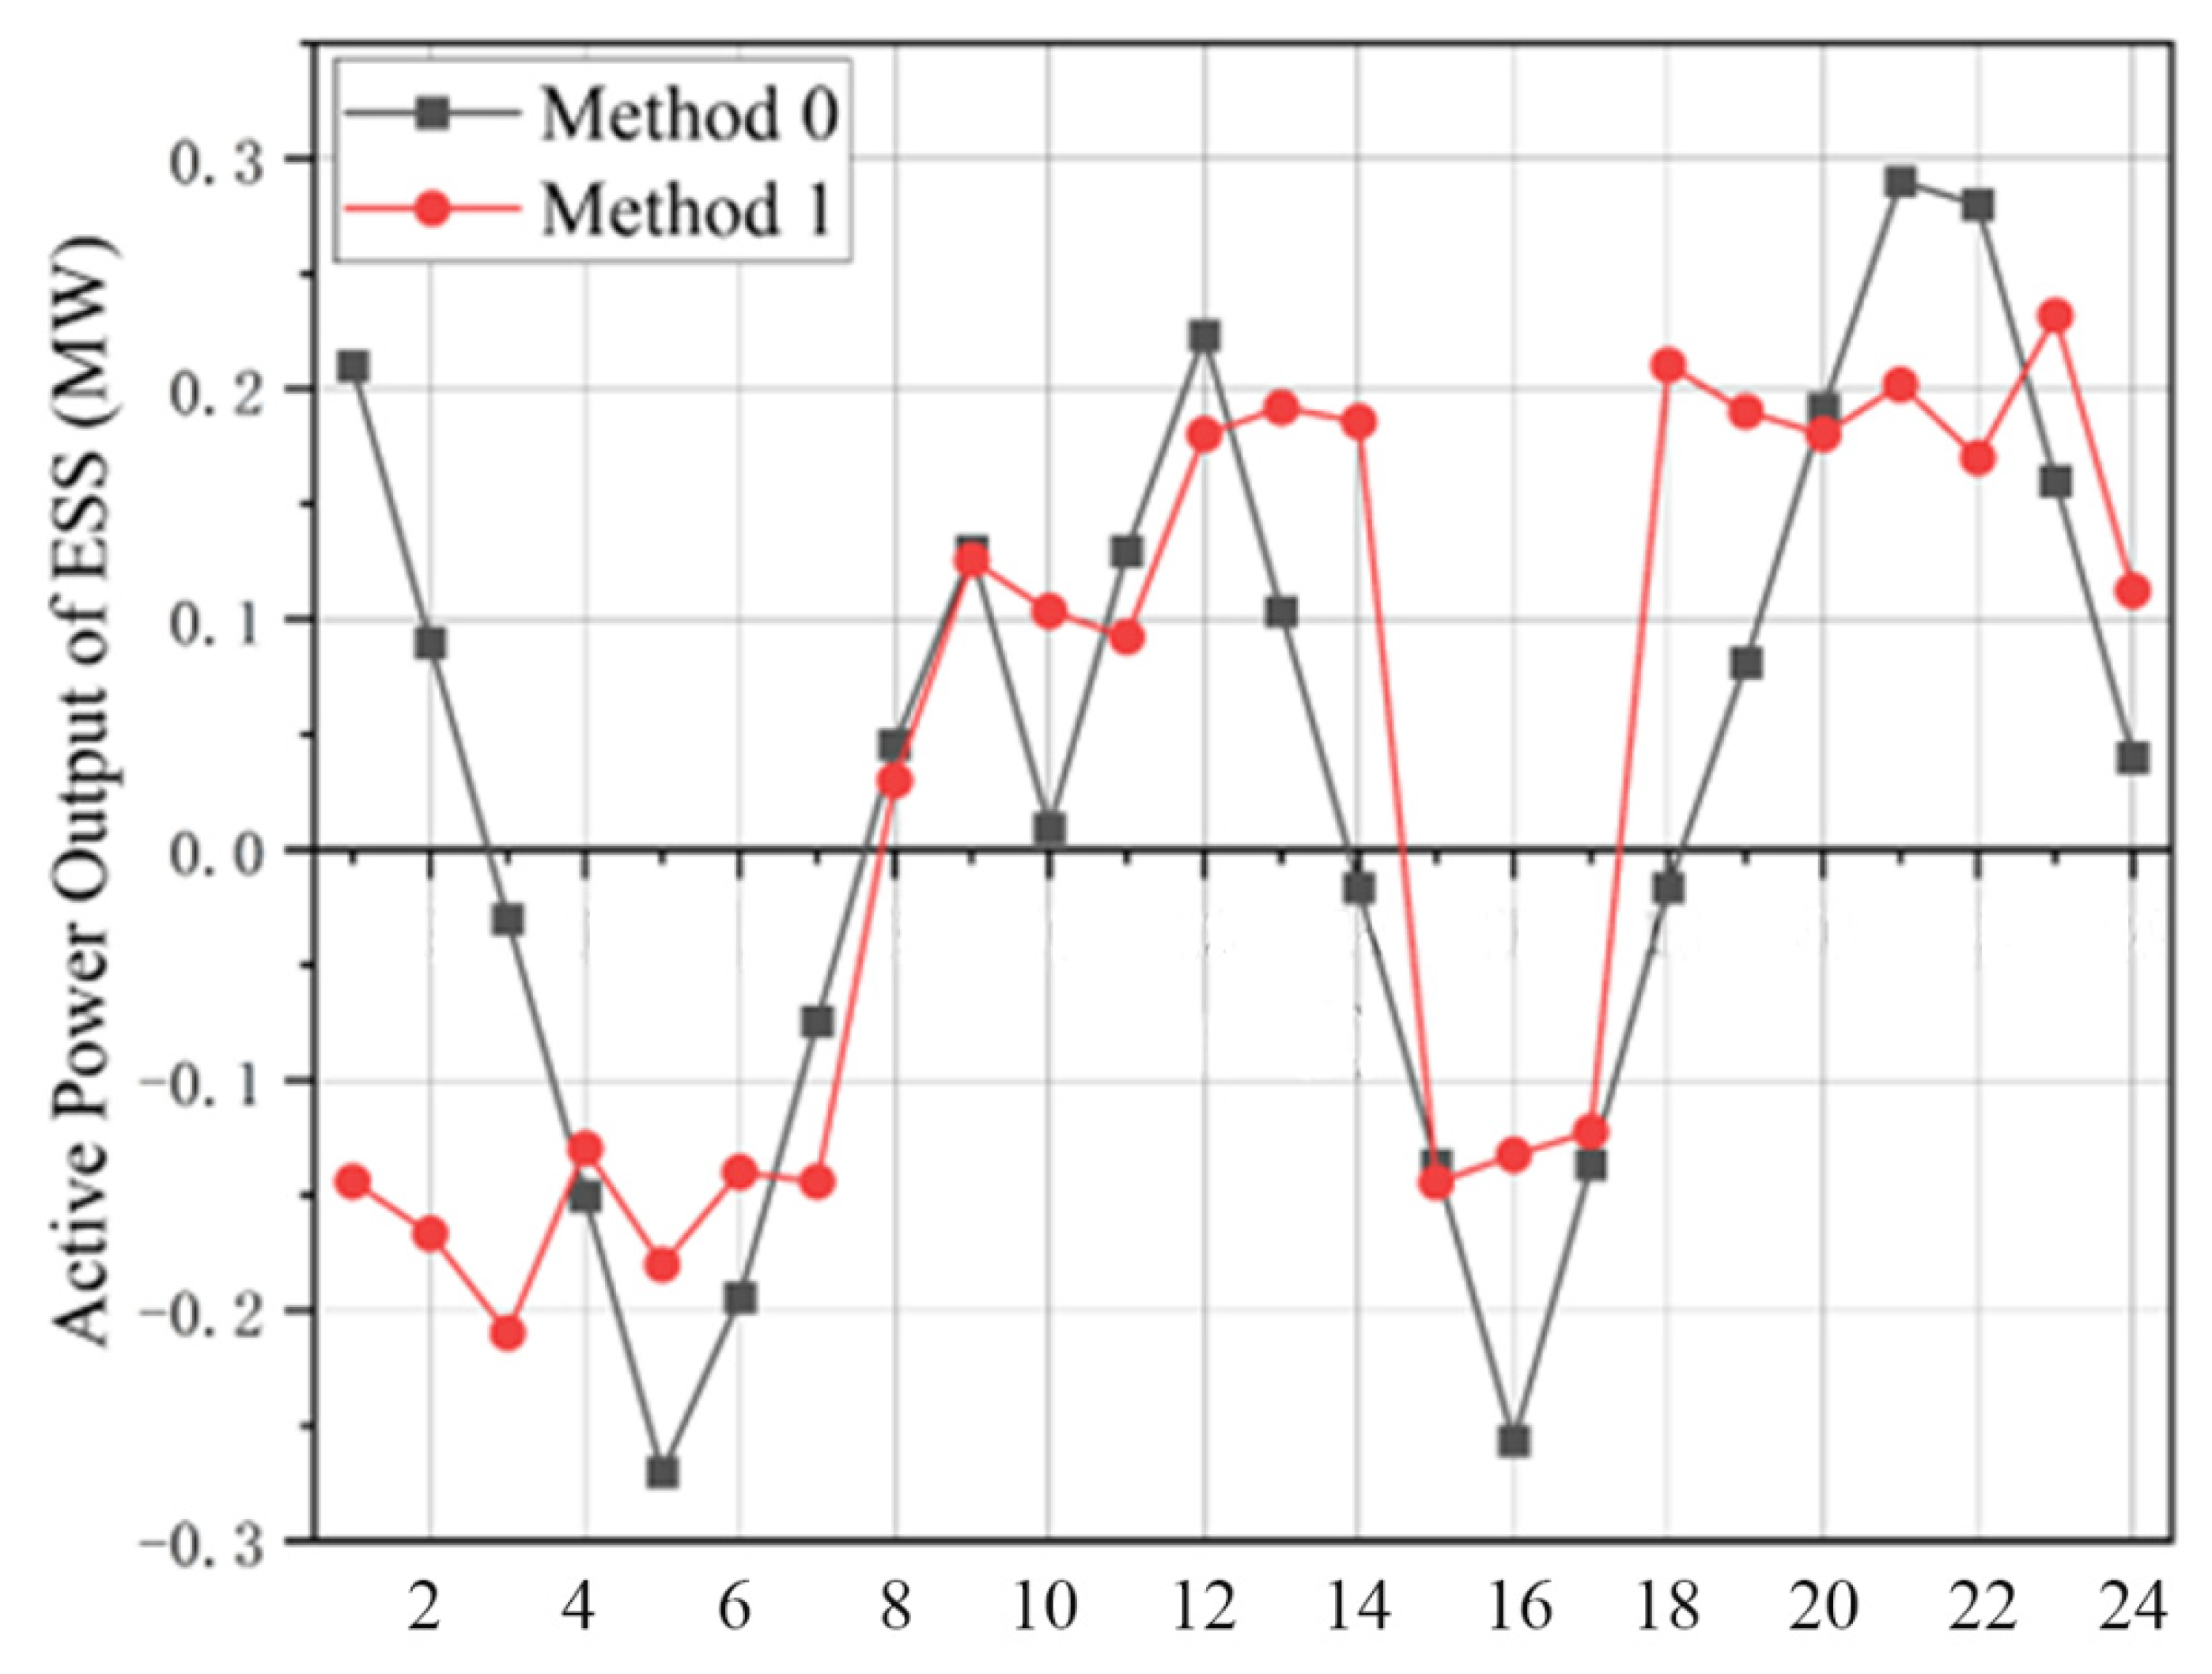
This segment scrutinises how the communal-storage paradigm reshapes participation and duty-cycles by contrasting the charge–discharge signatures of distributed batteries under the full framework (Method 0) against their behaviour when they operate solo (Method 1). The specific comparative data is presented in
Figure 8. Method 0, the proposed approach, integrates the shared energy storage mechanism—this mechanism aggregates scattered distributed energy storage resources into a unified “virtual energy storage pool,” coordinates their charging and discharging behaviors based on the grid’s real-time load, RES output, and carbon intensity, and allocates benefits fairly according to each resource’s contribution. By contrast, Method 1 does not adopt the shared energy storage mechanism; instead, each distributed energy storage resource operates independently, only adjusting its output based on local demand or simple preset rules, with no cross-resource coordination or unified scheduling. By analyzing the output curves in
Figure 8, we can clearly observe the difference in energy storage resource utilization between the two methods. The shared energy storage mechanism in Method 0 not only avoids the idle state of individual energy storage resources but also guides these resources to participate in grid-level tasks such as peak shaving, valley filling, and RES power smoothing. This not only improves the overall utilization rate of distributed energy storage resources but also enhances their economic benefits—proving that the shared energy storage mechanism effectively incentivizes distributed energy storage resources to actively engage in system operation, rather than operating in isolation.
Without the orchestrating umbrella of a shared-storage platform, behind-the-meter batteries linger in a state of operational limbo—rarely tapped, seldom coordinated, and left to follow erratic, opportunity-driven cycles that leave most of their technical life untouched. This prevents them from fully playing their supporting role in system operation—they often remain idle during periods of potential grid need or operate in ways that conflict with overall system optimization, failing to contribute effectively to peak regulation, voltage stabilization, or RES absorption. After the introduction of the shared energy storage mechanism, the situation improves significantly. The DSO leverages the CPS architecture to achieve flexible control over the charging and discharging states of distributed energy storage resources. By integrating real-time data regarding load, RES output, and carbon intensity via the CPS’s intelligent layer, the system can devise synchronized charging and discharging strategies: storing surplus RES power during periods of low demand, releasing stored energy during peak consumption times, and modifying output to mitigate fluctuations in renewable energy supply. This not only maximizes RES utilization but also decreases dependence on high-emission power generation, thus facilitating the entire system’s transition to low-carbon operation. Additionally, within the shared mechanism, the DSO implements a fair benefit allocation among the owners of these resources using the Shapley value approach. This method calculates each owner’s rewards based on their actual contributions to system operation—such as the capacity supplied, the timing of their participation, and the extent of their support for grid stability—ensuring a just distribution of returns. This equitable benefit allocation effectively encourages owners to engage proactively in the shared mechanism, rather than leaving their resources idle or operating them independently. Specific information about the benefits for each owner and the utilization efficiency of the energy storage system (ESS) is provided in the subsequent table.
The ESS utilization is defined as
The ESS utilization rate was disassembled into two aspects and calculated separately, the first item was the energy storage charge and discharge power utilization rate, the second item was the energy storage climbing capacity utilization rate,
and
are the charge and discharge utilization rate weight and ramping capacity weight were, respectively, as shown as
Table 7.
Once household and community storage units enrol in the communal pool, their batteries move from idle standby to near-continuous cycling, squeezing up to triple the useful energy throughput per cell and turning dormant assets into round-the-clock grid servants. This substantial enhancement in utilization not only implies that the capacity of energy storage devices is being effectively utilized but also shows that these resources are now fully playing their supporting role in system operation—like more precisely meeting grid peak-shaving needs, stabilizing voltage fluctuations caused by RES output variations, and offering reliable backup power during sudden load surges, which was difficult to achieve under independent operation. Beyond the boost in resource utilization, participating in the shared mechanism also brings direct economic benefits to each energy storage owner. Compared with operating their resources independently, the shared mechanism allows owners to earn stable income through providing grid services and benefit allocation, thus increasing their overall benefits. At the same time, the DSO also benefits from this model: the shared energy storage resources reduce the DSO’s need to invest in additional peak shaving facilities or purchase expensive emergency power, thereby cutting down its overall operating costs. This outcome creates a win–win situation for both energy storage owners and the DSO. For owners, it enhances the economic value of their resources; for the DSO, it optimizes operational costs and improves grid stability. This mutually advantageous outcome motivates all involved parties to engage in the shared energy storage mechanism, establishing a solid groundwork for its long-term advancement and stable operation in low-carbon distribution networks.
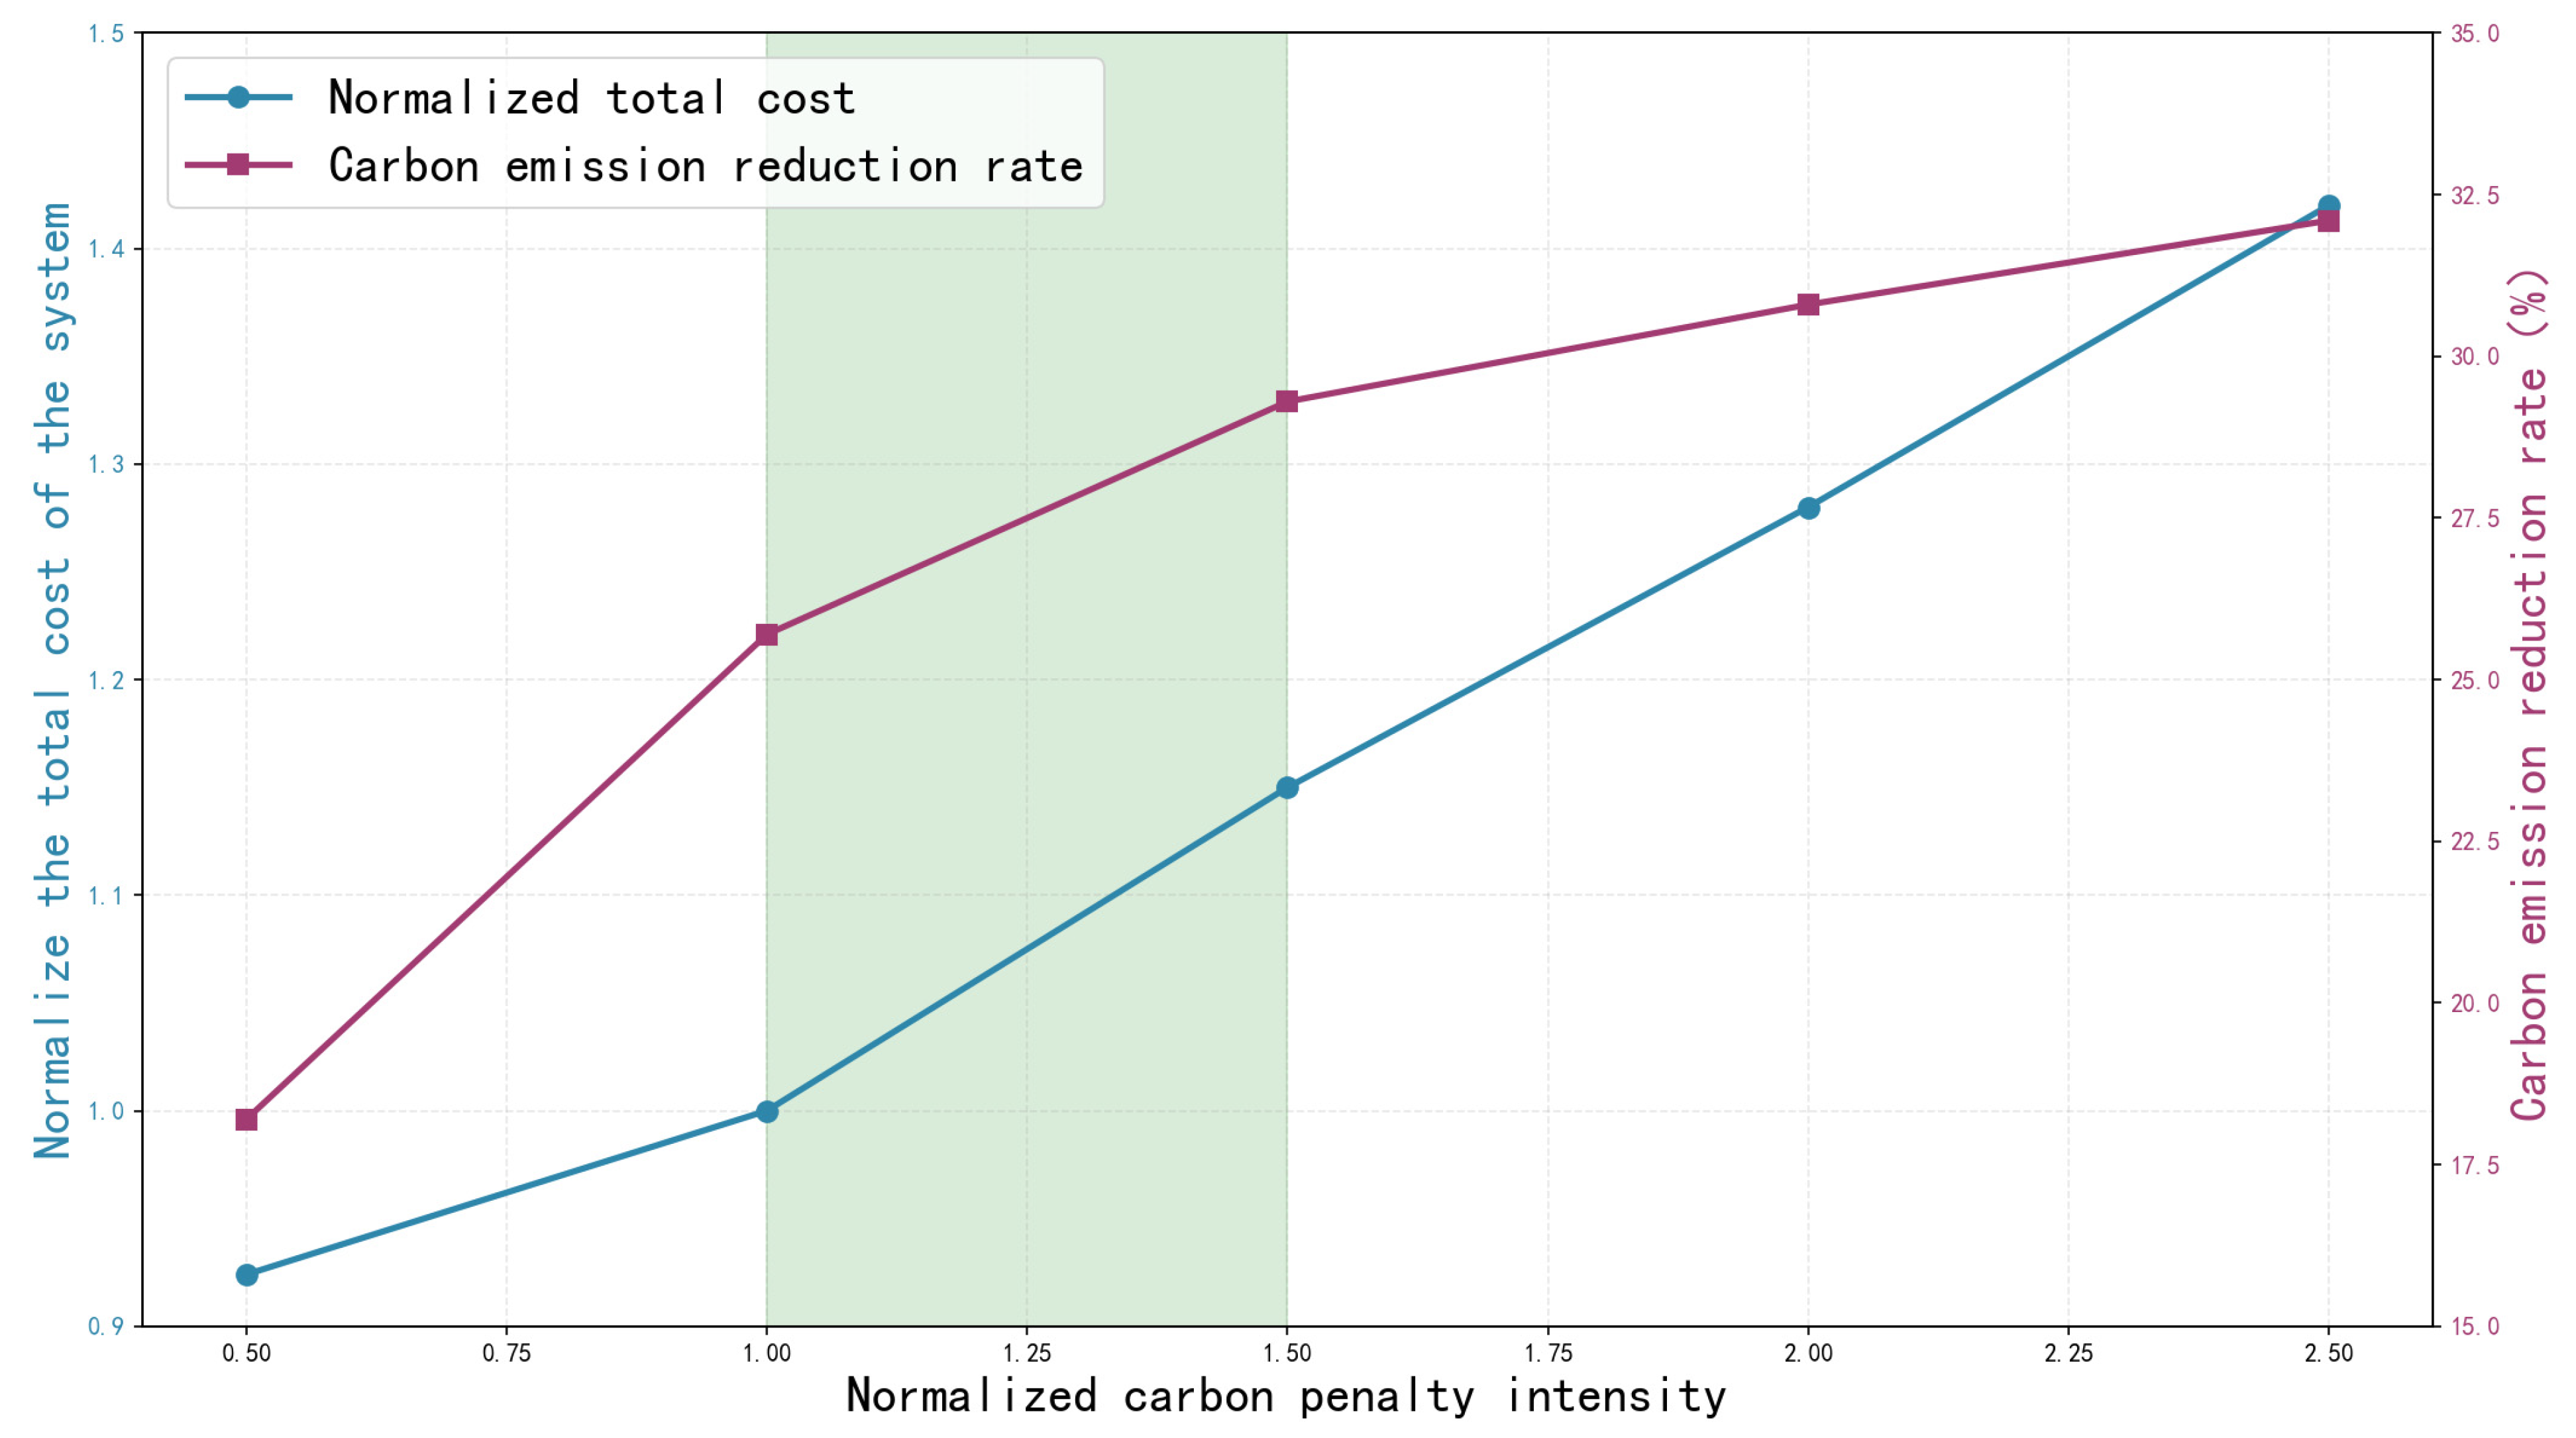
5.6. Trade-Off Analysis Between Normalized Cost and Carbon Emission Reduction
To quantify the balance between economic efficiency and emission reduction under different carbon penalty intensities, a normalized cost-carbon emission reduction trade-off curve is constructed in
Figure 9.
Based on simulation results under different penalty intensities, extract total system cost and carbon emission data, and normalize by the formula:
where
Ck is the total system cost under the
k-th penalty intensity,
C0 is the cost under baseline penalty intensity,
E0 is the carbon emission without carbon penalty, and
Ek is the carbon emission under the
k-th penalty intensity.
The trade-off curve shows that: When the penalty intensity increases from 0.5 to 1.0, the carbon emission reduction rate rises from 18.2% to 25.7%, while the cost only increases by 8.3%, showing significant marginal emission reduction benefits; When the penalty intensity exceeds 1.5, the growth rate of emission reduction slows down, but the cost surges, resulting in diminishing marginal benefits; The optimal penalty intensity range is 1.0~1.5, which achieves the balance of “low cost and high emission reduction”, as shown as
Figure 10.
5.7. Sensitivity Analysis of Carbon Penalty Coefficient
To verify the stability of the carbon penalty coefficient’s impact on system performance, 5 groups of penalty coefficients (
λ = 50, 100, 150, 200, 250 CNY/ton CO
2) are set to analyze their effects on total system cost, carbon emissions, and RES curtailment rate. The results are shown in
Table 8.
- (1)
Analysis Indicators: Total system cost (10,000 CNY), carbon emissions (10,000 tons CO2), renewable energy curtailment rate (%).
- (2)
Result Analysis:
Carbon Emissions: Decrease monotonically with the increase in penalty coefficient, from 148,000 tons without penalty to 97,000 tons at 250 CNY/ton, with an emission reduction rate of 34.5%, but the decreasing rate slows down gradually;
Total System Cost: Stable first and then rising with the increase in penalty coefficient, remaining stable at 52,000~53,000 CNY when 100~150 CNY/ton, and rising rapidly when exceeding 200 CNY/ton, due to the surge in user-side load curtailment cost caused by high penalties;
- (3)
RES Curtailment Rate: Increase from 78.3% to 92.1% with the increase in penalty coefficient, and the growth rate slows down after 150 CNY/ton, indicating that the promotion effect of penalty coefficient on curtailment rate has an upper limit.
- 3.
Conclusion:
The robust interval of the carbon penalty coefficient is 100~150 CNY/ton CO2. Within this interval, the system can simultaneously achieve low cost, high emission reduction, and high curtailment rate, which is consistent with the results of the trade-off curve analysis.
6. Discussion
The proposed low-carbon dispatch framework’s key results, comparisons, limitations, and prospects are condensed as follows:
Its three core improvements align with ADN needs: the demand-side penalty cuts emissions by 4.5–4.7%, CPS-based shared DES boosts utilization to 60–67%, and the unified MILP model reduces costs by 6.7–6.8% while decarbonizing, avoiding high-cost dilemmas of carbon capture.
Compared to existing studies, this study integrates demand-side and storage measures to synergize carbon and cost reduction.
Limitations include scenario simplification (IEEE 33-bus system), unaddressed RES/load uncertainty, and Shapley profit-sharing ignoring DES aging costs.
Practically, the penalty can join TOU pricing via a carbon surcharge, and the CPS architecture (mature 5G/AES-256) is pilotable in communities like Qingdao.
