Abstract
The aircraft air-cycle system (ACS) provides cabin cooling, dehumidification, and pressurization. As a key component, the water separator removes free moisture from the air, preventing turbine icing/blockage under high humidity and avoiding humidity-induced electronics failures, thus ensuring reliable ACS operation. Existing studies focus mainly on oil and chemical applications, with limited work for aircraft ACS. To address this research gap, this study investigates a straight-through cyclone water separator for aircraft ACS applications. We built a test platform to measure separation efficiency and conducted experiments at swirl angles of 20°, 30°, and 40°. A simulation model based on the Reynolds Stress turbulence model and a discrete phase model was established, and its simulation efficiency agreed with experiments within 4.1%. Simulation on water separator under high-pressure and low-pressure conditions were conducted, revealing internal flow fields and droplet dynamics. Results show each swirl angle has a distinct high-efficiency operating range, enabling selection according to system parameters across air mass flow rates; under varying humidification rate, the 40° swirl generator performed best. Simulations further indicate that higher operating pressure markedly improves performance: pressure loss decreased from 4.5 kPa to 0.7 kPa, while separation efficiency increased by 30.7%.
1. Introduction
The air-cycle system (ACS), a core subsystem of modern commercial aircraft environmental control system, underpins passenger comfort and operational safety. Its primary functions include pressurization, cooling, and dehumidification. Dehumidification is achieved by compressing and cooling the moist air to induce condensation, followed by removal of the resulting condensate by a water separator (WS). A high-efficiency WS prevents droplet-induced erosion of downstream turbine vanes, maintains cabin humidity within a comfortable range, and reduces the risk of condensate-related failures in avionics and other electronics. Consequently, WS performance directly influences the reliability and overall efficiency of the ACS [1,2].
Gas–liquid separation has long been a critical enabling technology across modern industries, including oil and gas, chemicals, energy, and environmental protection. Among available approaches, cyclone separators are widely adopted owing to their structural simplicity, high separation efficiency, and compact form factor, making them particularly suitable for space-constrained applications requiring high performance. Their operation relies on imparting swirl to the gas–liquid mixture so that, under combined gravitational and centrifugal fields, the denser liquid phase migrates outward and is separated from the gas phase [3].
A substantial body of experimental and numerical research has established a strong understanding of the flow physics and performance optimization of cyclone separators. The current consensus is that separation performance is governed by a complex interplay between operating conditions and structural parameters. Regarding operating conditions, variations in air mass flow rate, gas–liquid ratio, and inlet flow velocity are known to induce coupled changes in swirl and turbulence intensities, which in turn jointly determine separation efficiency [4,5,6].
At the design level, structural parameters play a decisive role. For axial flow separators in particular, vane design is critical. Research has shown that vane angle is a highly sensitive parameter: decreasing the angle weakens centrifugal forcing and droplet deposition, whereas increasing it strengthens these forces and improves performance [7]. Vane shape and outlet angle have also been identified as key drivers of both separation efficiency and pressure loss [8]. Other geometric features, including inlet geometry, cylinder height, and exhaust tube parameters, offer further avenues for performance optimization [6,9]. In contrast, parameters such as hub diameter and vane count have been found to exert a more limited influence [7]. These findings have inspired novel designs, such as separators incorporating helical guide vanes or optimized straight-through configurations. By modifying the internal flow field, these advanced designs enhance the capture of small droplets, improve grade efficiency, and reduce energy consumption, demonstrating significant performance gains over conventional designs [9,10,11].
In the simulation of gas–liquid separation, a consensus has also emerged regarding modeling approaches. While various turbulence and multiphase models have been explored, a coupled approach combining the Reynolds Stress Model (RSM) with the Discrete Phase Model (DPM) has become the widely accepted standard [12]. The robustness of the RSM–DPM framework is demonstrated by its successful application across diverse separator configurations and operating conditions. For instance, it has been used to characterize the internal flow field and particle dynamics in vertical cyclones at low inlet velocities, with predictions showing strong agreement with experimental data (discrepancies generally within 10%) [13]. The framework has also been effectively employed to assess the effects of vane geometry in second-stage axial cyclones [14] and to construct three-dimensional models for predicting two-phase flow in supersonic separators [15]. The consistent accuracy of the RSM–DPM methodology in capturing complex flow phenomena has established it as a highly adaptable and validated tool for separator analysis and optimization.
Compared with gas–liquid separation research in other domains, studies on water separators for Aircraft Environmental Control Systems (ACS) are relatively scarce. Existing research has established the fundamental separation mechanisms through a combination of theoretical analysis, experiments, and numerical simulation. This work has produced validated engineering correlations for key performance metrics, including single droplet separation efficiency and critical separation diameter, with predictions matching experimental measurements to within 5% accuracy [16,17]. Furthermore, empirical relations linking pressure loss to air flow rate, flow area, and swirl angle have been developed, and fractional efficiencies of 85–92% have been shown to be achievable under certain operating conditions [18]. Simulation accuracy has also been improved by incorporating advanced submodels, such as those capturing droplet–wall splash effects [19]. Collectively, these studies indicate that high water removal efficiencies are attainable. Nevertheless, research specifically addressing the structure–performance relationships and internal multiphase flow and heat transfer mechanisms of water separators in ACS remains limited, leaving their structural design and control strategies without a well-founded theoretical basis. This study focuses on a straight-through cyclone water separator. A performance test platform for water separation efficiency was constructed to examine how structural and operating parameters—including swirl angle, air mass flow rate, and humidification rate—affect separation performance. In parallel, a three-dimensional numerical model of the water separator was developed by coupling the RSM with the DPM. Simulations were conducted under both high- and low-pressure conditions to resolve the internal flow field distribution and droplet transport characteristics, and to elucidate the corresponding changes in separation behavior across pressure regimes. The findings provide reliable guidance for selecting swirl angles and tuning operating parameters in engineering practice, and offer a theoretical basis for the further optimization and application of straight-through cyclone water separators in ACS.
2. Experimental Design
2.1. Experimental Platform
An exterior view of the straight-through cyclone water separator is shown in Figure 1. After air carrying free droplets enters the separator, the swirl generator—a fixed component that imparts rotation through its geometric design rather than mechanical movement—induces a swirling flow that drives droplets toward the wall via inertial effects; the droplets subsequently drain into the collection sump, while the air exits through the main outlet along the central axis, thereby achieving efficient gas–liquid separation.
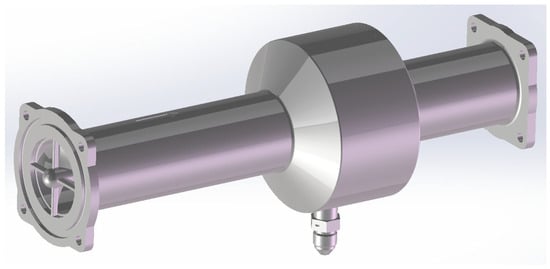
Figure 1.
External view of the straight-through cyclone water separator.
To evaluate flow resistance and water separation efficiency, a performance test platform for the water separator was constructed as shown in Figure 2 and Figure 3. The platform comprises four primary modules: air supply, humidification, test section, and data acquisition. The air supply consists of a centrifugal blower and a variable-frequency drive, with airflow into the test section regulated by frequency control. The humidification module includes a high-pressure water tank, an air pump, and a two-phase nozzle. Pressurized water is injected into the nozzle by compressed air, atomized into droplets with a prescribed size distribution, and introduced into the main duct to mix with the air, thereby emulating humid air at the separator inlet. Transparent viewing windows are installed upstream and downstream of the test section to enable real-time observation of gas–liquid mixing. The water separator under test is mounted within the test section, and the separated liquid water is collected by a water collection tank for subsequent weighing and efficiency calculation. The data acquisition section features a comprehensive testing system, with the equipment and measurement parameters shown in Table 1.
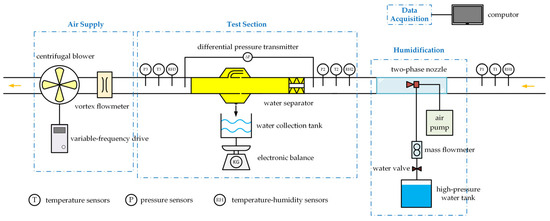
Figure 2.
Operating principle of the water separator experimental platform.
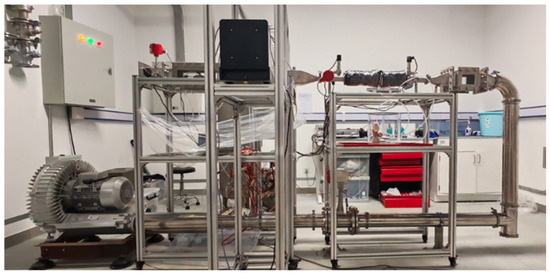
Figure 3.
Photograph of the experimental platform.

Table 1.
Experimental equipment measurement parameters.
2.2. Experimental Conditions
2.2.1. Structural Parameters
As a key structural parameter governing the flow field, the swirl angle directly modulates swirl intensity, pressure-drop characteristics, and the extent of droplet separation. In this study, swirl generators with swirl angles of 20°, 30°, and 40° were selected for comparative testing. As shown in Figure 4, the swirl generator adopts an axisymmetric design comprising a central shaft and helical vanes. The leading end of the central shaft is hemispherical to promote a smooth airflow transition. Detailed geometric parameters are provided in Table 2.
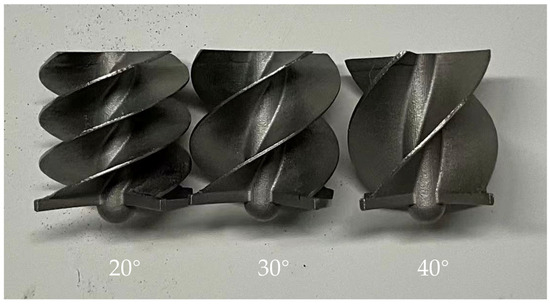
Figure 4.
Photographs of swirl generators with different swirl angles.
Table 2.
Swirl generator geometric parameters.
2.2.2. Operating Parameters
To explore the influence of operating parameters on separator performance, this study varied the air mass flow rate and the humidification rate. The specific test matrices are summarized in Table 3. The air mass flow rate ranged from 100 to 300 kg/h, and the humidification rate ranged from 5 to 15 g/kg. Subject to the swirl generator configurations and experimental constraints, each swirl generator was tested under at least nine independent operating conditions spanning low to high flow rates and low to high humidification rates. Under each condition, key performance metrics—including separation efficiency and pressure loss—were measured and evaluated.
Table 3.
Operating conditions under different parameter settings.
2.3. Data Processing
2.3.1. Parameter Calculation
This study focuses on two primary performance metrics of the water separator: pressure loss () and water separation efficiency (). The pressure loss is measured directly by a differential pressure transmitter and defined as the instantaneous pressure difference between the inlet and outlet cross-sections under steady operating conditions.
To remove the influence of geometry and fluid properties, the air mass flow rate and pressure data are further nondimensionalized. Specifically, the Reynolds number () and the Pressure loss coefficient () are employed to characterize the airflow and the pressure loss, respectively. The Reynolds number, representing the ratio of inertial to viscous forces, is computed as follows:
where is the air density (kg/m3), is the flow velocity, is the characteristic length (m), and is the dynamic viscosity of air (). In this study, the characteristic length is taken as the inner diameter of the water separator, 38 mm. The air density is computed from the measured temperature and pressure using an empirical equation:
where is the measured pressure (Pa); is the standard atmospheric pressure, taken as 101,325 Pa; is the measured temperature (K); and is the reference absolute temperature, taken as 273 K. The flow velocity is obtained from the air mass flow rate as follows:
where is the air mass flow rate, obtained directly from the vortex flowmeter; and is the separator inlet cross-sectional area.
The dynamic viscosity of air is temperature-dependent and is calculated using the Sutherland equation:
The pressure loss coefficient quantifies the ratio of flow resistance to dynamic pressure and is calculated as follows [20]:
where is the measured pressure loss.
The separation efficiency () is defined, under a given steady operating condition, as the ratio of the total mass of water separated to the total mass of water entering the separator minus the mass of water that evaporates, and is computed as follows:
where is the total mass of water separated, is the injected water mass flow rate, is the duration of the operating condition, is the humidity ratio at the air inlet, and is the humidity ratio at the separator inlet. The parameters and are obtained directly via electronic balance weighing and a mass flowmeter, respectively, whereas and require further calculation.
The August–Roche–Magnus correlation [21] is employed to compute the saturation vapor pressure () and the humidity ratio () at a given measurement point under steady conditions. This correlation provides good accuracy over the range from −45 °C to +60 °C:
where is the relative humidity, is the temperature, and is the total air pressure. The three quantities , and are obtained directly from the humidity sensor, the temperature sensor, and the pressure sensor, respectively.
2.3.2. Uncertainty Analysis
To assess the uncertainty associated with the experimental measurements and calculated results, the relative uncertainty is evaluated using the following formulation [22,23]:
where ; xi denotes the uncertainty of each parameter. For directly measured parameters, xi represents the measurement sensor precision, while for derived parameters, it indicates the relative uncertainty. The term ai corresponds to the highest power of parameter xi in function R.
The differential pressure transmitter has a span of 0–100 kPa, while the actual measured pressure ranges from 80 to 100 kPa; the actual weighing range is 84–510 g. The uncertainties of the principal parameters are summarized in Table 4.
Table 4.
Relative uncertainty of parameters.
3. Numerical Methods
When the droplet volume fraction is below 10%, gas–liquid separation is typically investigated using a Discrete Phase Model (DPM) within the Lagrangian framework to resolve the internal flow field and droplet dynamics [24]. For turbulence closure, the SST k–ω model, the Realizable k–ε model, the Standard k–ε model, the RNG k–ε model, and the RSM are commonly employed. Among these, the RSM can reliably capture rotating flows and has been widely applied in gas–liquid separator studies. The RSM is capable of representing vortex-dominated fields; however, its numerical solution involves seven transport equations, offering higher accuracy, slightly better near-wall performance when combined with a two-layer approach, and higher computational cost than two-equation models [25]. Consequently, many cyclone separator studies adopt a coupled DPM–RSM simulation strategy, which yields good agreement with experimental data [26]. To further elucidate the separation mechanism of the present water separator and to visualize the internal flow field and droplet trajectories under varying operating parameters, a simulation model was developed by coupling the RSM with DPM. All simulations in this study were performed using the software ANSYS FLUENT 2024R1.
3.1. Physical Model and Boundary Conditions
A three-dimensional model was established as illustrated in Figure 5, with boundary conditions shown therein; all specific parameter values were taken from experimental measurements. To ensure a stable and uniform inflow into the swirl generator, a 15 mm flow-conditioning section was retained upstream of the separator model. The outer wall of the water collector and the collector outlet were specified as escape boundaries; droplets that impinge on these designated escape surfaces are considered separated.
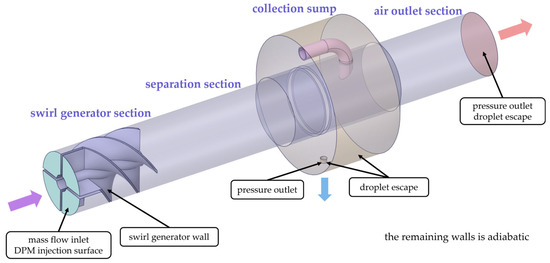
Figure 5.
Computational fluid domain and boundary specifications for straight-through cyclone water separator.
3.2. Governing Equations and Turbulence Model
The fluid motion inside the water separator adheres to the principles of mass and momentum conservation, with the governing equations expressed as:
where is the velocity vector (m/s); is the stress tensor (Pa); f is the external volume force.
To accurately predict the strongly anisotropic turbulent flow within the separator, the RSM is employed to capture turbulence anisotropy in rotating flows. The Reynolds stress transport equations are written as:
where are the Reynolds stress components, is the diffusion term, is the production term, is the pressure–strain correlation term, is the dissipation term, and is the rotation term. By directly solving these terms, the RSM can faithfully resolve the complex internal flow features of the water separator [27,28].
3.3. Discrete Phase Model
This study employs a Discrete Phase Model (DPM) within the Euler–Lagrange framework to numerically simulate droplet motion in the water separator. In this approach, droplets are treated as a discrete phase tracked within the continuous air phase, with submodels for droplet breakup, coalescence, and rough-wall interactions integrated to elucidate the complex droplet dynamics inside the separator, including breakup, coalescence, and their interactions with rough walls during transport. In the DPM, droplet motion follows Newton’s second law, and the trajectory equation can be expressed as:
where is the droplet velocity, is the continuous-phase velocity, and are the droplet and fluid densities, respectively, is the drag force per unit droplet mass, and denotes additional body forces, including pressure-gradient, virtual-mass, and other possible external forces, while additional body forces were not utilized in the present study.
In this study, droplets are modeled using the DPM with the droplet breakup model, coalescence model, and rough wall model activated.
This investigation employs the KHRT breakup model to simulate droplet fragmentation in high-velocity rotational flows [29]. The model incorporates dual instability mechanisms: Kelvin-Helmholtz instability, which characterizes aerodynamic surface wave propagation, and Rayleigh-Taylor instability, which addresses acceleration-induced deformation. This integrated approach enhances the accuracy of droplet breakup characterization across diverse flow regimes, with default KHRT parameters implemented.
Droplet coalescence is modeled using the Stochastic Collision Model with default parameters, providing probabilistic analysis of droplet interactions. In cyclone separators, when droplet volume fractions become substantial, inter-droplet phenomena—particularly collision-coalescence events—significantly impact separation efficiency. This modeling approach effectively captures these critical physical mechanisms, thereby enhancing simulation fidelity.
A rough wall model was implemented to simulate textured surfaces for particles in DPM, improving particle-wall interaction calculations by accounting for surface irregularities. Model parameters were calibrated using experimentally determined surface characteristics: Ra of 6.4 μm, Rq of 7.9 μm, and Rsm of 75 μm.
3.4. Simulation and Solution Methods
A surface-injection type is employed, with liquid water specified as the material. Droplets are injected from the inlet surface. The droplet size follows a Rosin–Rammler (R–R) distribution, with the distribution index calculated from experimental measurements as 4.5, a main diameter of 1.5 × 10⁻⁵ m, a minimum diameter of 6 × 10⁻⁶ m, and a maximum diameter of 2.5 × 10⁻⁵ m.
The continuous phase is air with ideal-gas density. A three-dimensional, pressure-based transient solver is employed, with the RSM for turbulence closure. Pressure–velocity coupling uses the SIMPLE scheme, and the Continuity Equation was discretized using the Second-Order Upwind Scheme, while the First-Order Upwind Scheme was implemented for all remaining Transport Equations. All Scaled Residuals were converged to values below 1 × 10⁻⁴.
3.5. Grid-Independence Verification
To eliminate the influence of mesh resolution on the numerical results, a mesh-independence study was conducted. By varying the mesh size, three meshes of different densities were generated for trial computations. As shown in Figure 6, the relative differences are 8.16% (0.42 M–4.0 M) and 4.23% (4.0 M–7.26 M) for separation efficiency, and 1.81% (0.42 M–4.0 M) and 0.44% (4.0 M–7.26 M) for pressure loss. Considering computational cost and mesh-independence results, a 4.0 million-cell mesh is deemed sufficient. Therefore, balancing accuracy and computational cost, a mesh with 4,000,181 cells was ultimately selected for subsequent simulations. The minimum mesh quality of this configuration exceeds 0.2, meeting the solution accuracy requirements.
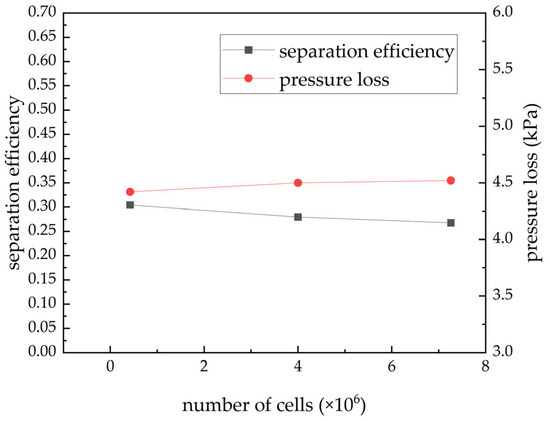
Figure 6.
Grid-independence verification.
4. Results
4.1. Analysis of Internal Flow Characteristics of the Separator
This study investigates the effects of swirl angle, air mass flow rate, and humidification rate on flow resistance characteristics. Figure 7 presents the relationship between Re and K at different swirl angles, with the humidification rate fixed at 10 g/kg, exhibiting a distinct piecewise behavior: initially constant, followed by a gradual increase. Specifically, for swirl angles of 30° and 40°, K remains essentially constant within Re of 50,000–130,000. When Re exceeds 130,000, K begins to rise with Re, likely reflecting a transition in the internal flow regime relative to the preceding stage. For a swirl angle of 20°, a positive correlation between K and Re emerges once Re reaches approximately 70,000. In other words, smaller swirl angles induce stronger swirl intensity, making the flow more prone to regime transition at lower Re.
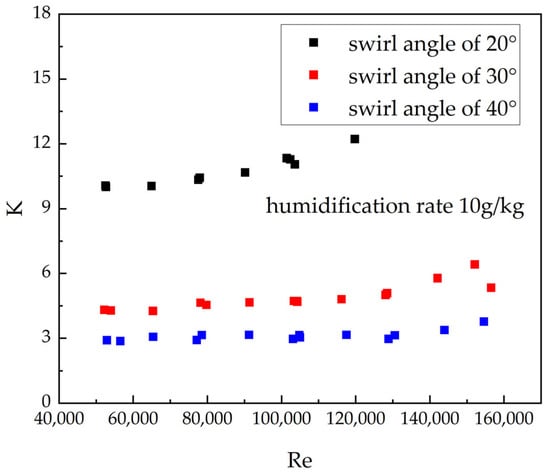
Figure 7.
Relationship between Re and K for different swirl angles from experimental data under a constant humidification rate (10 g/kg).
Figure 8 shows the relationship between humidification rate and K at different swirl angles. Under a constant air mass flow rate (200 kg/h), the humidification rate has an insignificant effect on the internal pressure loss of the water separator. Therefore, in engineering design, the influence of humidification rate on flow resistance can be neglected within a certain range, thereby simplifying the design process.
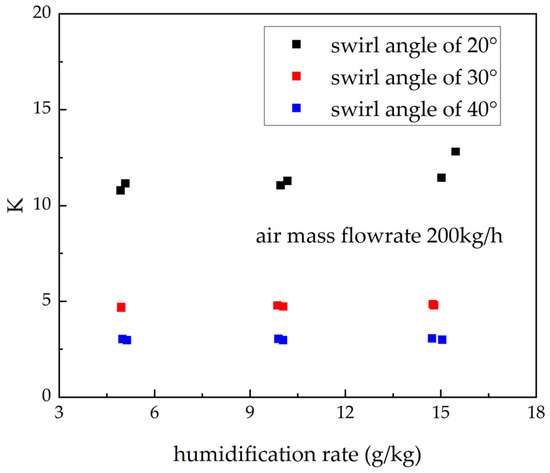
Figure 8.
Relationship between humidification rate and K from experimental data under a constant air mass flow rate (200 kg/h).
4.2. Analysis of Separation Efficiency
4.2.1. Effect of Different Air Mass Flow Rates
Figure 9, Figure 10 and Figure 11 present the separation efficiency of 20°, 30°, and 40° swirl generators under varying air mass flow rates, with the humidification rate fixed at 10 g/kg. (The error bars represent the error for this operating condition, and are related to the relative uncertainty of the measurement and the deviation in humidification rate control.). The experimental results reveal a non-monotonic trend—“rise–fall–rise”—with separation efficiency spanning approximately 5–60%. For the 20° and 30° swirl generators, distinct peak and trough points are observed; the 40° swirl generator exhibits a peak within the tested range but no evident trough. As the swirl angle increases (swirl intensity decreases), the air mass flow rates corresponding to the peak and trough shift progressively toward higher values. This complex nonlinear behavior resembles the Muschelknautz model proposed by Alex C. Hoffmann and Louis E. Stein in the 1970s [30]. In the low-flow regime, increasing the air mass flow rate enhances separation efficiency. The peak for smaller swirl angles appears at lower air mass flow rates (≈125 kg/h), whereas for the larger swirl angle (40°) it occurs at higher air mass flow rates (≈175 kg/h). The underlying mechanism is that a stronger tangential velocity component generates greater centrifugal force, promoting droplet migration to the wall and thereby improving separation efficiency. A smaller swirl angle (e.g., 20°) produces a stronger tangential component, enabling the centrifugal effect to reach the critical level required for effective separation at lower flow rates; hence, the peak emerges earlier in terms of air mass flow rate.
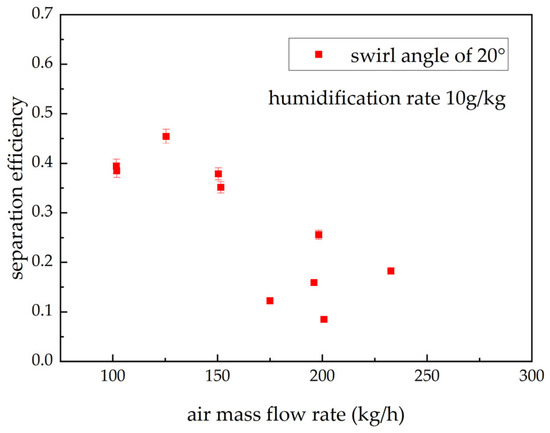
Figure 9.
Separation efficiency of the 20° swirl generator at different air mass flow rates from experimental data under a constant humidification rate (10 g/kg).
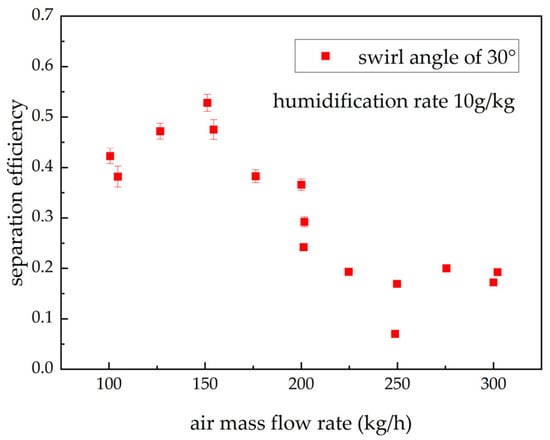
Figure 10.
Separation efficiency of the 30° swirl generator at different air mass flow rates from experimental data under a constant humidification rate (10 g/kg).
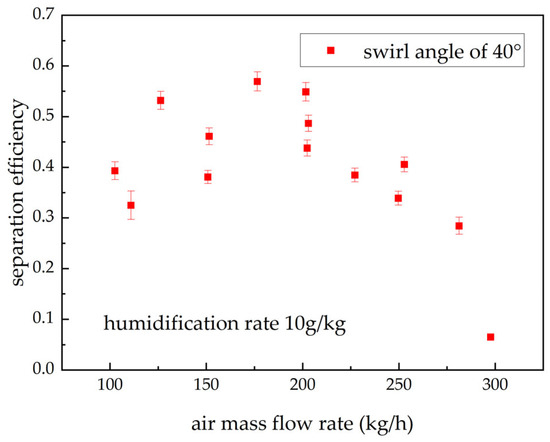
Figure 11.
Separation efficiency of the 40° swirl generator at different air mass flow rates from experimental data under a constant humidification rate (10 g/kg).
As the air mass flow rate increases to the intermediate regime, separation efficiency drops markedly once a critical threshold is exceeded. According to the Muschelknautz model, a substantial rise in air mass flow rate sharply intensifies near-wall shear and turbulence, potentially inducing complex secondary flows and vortex structures. This intensified turbulence and shear disrupt the previously stable separation region, depriving the boundary layer of its capacity to convey particles stably. Particles that have been separated are re-entrained by the high-speed core flow and carried from the wall region back into the clean gas core. Consequently, the probability increases that droplets will be re-entrained into the mainstream or break up into smaller droplets, leading to an abrupt decline in separation efficiency.
While a higher air mass flow rate intensifies droplet swirl, the excessive air velocity also causes more frequent collisions and greater droplet entrainment, thereby reducing the number of droplets captured by the collector. This leads to a steep decline in separation efficiency as the flow rate increases from 200 to 250 kg/h. The high sensitivity to operating conditions also explains the wider scattering of data points in certain flow regions, which is caused by minor variations in initial conditions.
At high air mass flow rates, beyond another critical point, separation efficiency begins to rise again. As the Reynolds number increases, the Strouhal number (St) of vortex-core oscillation initially grows and then approaches an asymptotic constant, while turbulence continues to intensify [31]. There exists a critical condition under which the influence of internal flow-field instability weakens, yielding a relatively stable state that diminishes the impact of vortex-core oscillations on droplet separation; centrifugal forces once again become dominant, and separation efficiency resumes an increasing trend. Moreover, with decreasing swirl angle (swirl intensity increase), a more stable vortex structure can form at lower air mass flow rates. Accordingly, the trough in separation efficiency for the small-angle swirl generator (20°) appears at a lower air mass flow rate, whereas for the larger-angle swirl generator (30°) the trough shifts to a higher air mass flow rate.
Performance comparisons across swirl angles show that the 40° swirl generator (weakest swirl intensity) achieves higher overall separation efficiency in the 100–200 kg/h range but experiences a pronounced drop at 300 kg/h. By contrast, the 30° swirl generator exhibits a clear recovery in efficiency at 300 kg/h. This is because the centrifugal force generated by the 40° swirl generator is insufficient to overcome the strengthened turbulent disturbances, whereas the 30° swirl generator (moderate swirl intensity) has already entered a stable, strongly turbulent regime at this air mass flow rate (with St approaching a constant and vortex-core oscillation exerting a reduced influence on separation efficiency), thereby delivering superior performance in that range. Therefore, swirl generator design should target an optimal swirl angle for the specific operating air mass flow rate range rather than simply seeking stronger or weaker swirl. Considering the flow characteristics across air mass flow rates, engineering applications should select an appropriate swirl angle to achieve the best compromise between flow resistance and separation efficiency.
4.2.2. Effect of Different Humidification Rates
To investigate the influence of humidification rate on separation efficiency at different swirl angles, experiments were conducted at an air mass flow rate of 200 kg/h for swirl angles of 20°, 30°, and 40°. Figure 12 presents the separation efficiency at different humidification rates for each swirl angle, with the air mass flow rate fixed at 200 kg/h (Error bars indicate measurement errors.). For each swirl generator, three humidification rates—5 g/kg, 10 g/kg, and 15 g/kg—were tested with two repeated trials per condition.
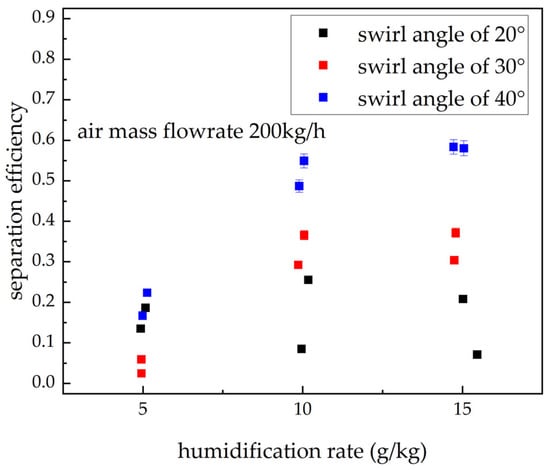
Figure 12.
Separation efficiency under different humidification rates for various swirl angles from experimental data under a constant air mass flow rate (200 kg/h).
The results indicate that, for the 30° and 40° swirl generators, separation efficiency increases markedly with humidification rate. As the moisture content of the airflow rises, the spatial concentration of droplets increases, which substantially enhances inter-droplet collision and coalescence. The resulting larger droplets experience stronger centrifugal forces in the swirling flow, facilitating their migration to the wall and subsequent capture, which manifests macroscopically as improved separation efficiency. However, the increase is not linear. When the humidification rate increases from 5 g/kg to 10 g/kg, separation efficiency improves significantly; when it further increases from 10 g/kg to 15 g/kg, the incremental gain diminishes. This suggests that, under higher humidification rates, separation efficiency approaches its theoretical upper bound, limiting further improvement.
The 20° swirl generator exhibits distinct behavior at this air mass flow rate, showing lower sensitivity of separation efficiency to changes in humidification rate. Although a 20° swirl angle generates the strongest initial swirl intensity, excessive swirl under the present operating condition may induce flow-field instabilities, such as secondary flows or vortex breakdown. These complex structures can counteract the benefits associated with larger droplet sizes.
Consequently, under the current operating condition, the 40° swirl generator delivers the highest overall separation efficiency, with a clear and consistent dependence on humidification rate.
4.3. Comparative Simulation Analysis Under High-Pressure and Low-Pressure Conditions
Constrained by experimental conditions, high-pressure tests of the water separator were not conducted; instead, numerical simulations were employed to assess the effect of operating pressure on separation efficiency, thereby providing theoretical guidance for selecting dehumidification locations in environmental control systems. To verify the fidelity of the simulation model, simulations were conducted for both dry conditions at various air mass flow rates and a representative wet condition from the experiments (air mass flow rate of 200 kg/h and humidification rate of 10 g/kg). Figure 13 compares the simulated and experimental inlet pressures under dry conditions at various air mass flow rates. In the simulation, the outlet pressure was set to match the experimental data as a boundary condition. The resulting error between the simulated and experimental inlet pressures ranged from 0.01% to 2.13%. This indicates that the simulation method can accurately model the internal airflow dynamics of the water separator. And the representative wet experimental results, boundary conditions, and simulation outputs are summarized in Table 5. The simulation agrees well with the experiment, with a separation efficiency deviation of 4.1%.
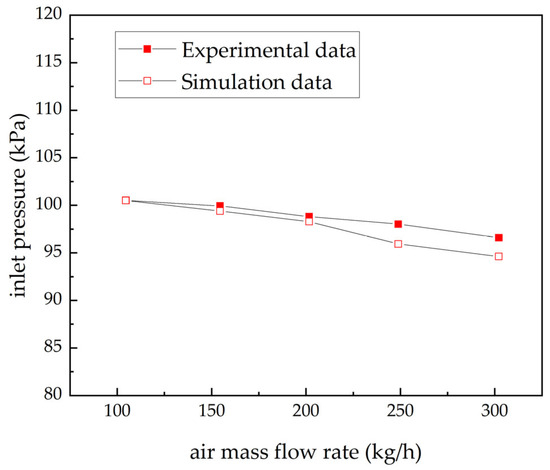
Figure 13.
Comparison of inlet pressures between simulation and experiment under dry conditions with different air mass flow rates.
Table 5.
Comparative analysis of simulation and experimental results under the low-pressure condition (air mass flow rate of 200 kg/h and humidification rate of 10 g/kg).
Figure 14 presents the simulated separation efficiency and pressure loss under different operating conditions. Under the high-pressure condition—implemented by increasing the pipeline back pressure by 600 kPa—the pressure loss decreases from 4.5 kPa to 0.7 kPa, while the separation efficiency rises from 28% to 36.6%. Therefore, the high-pressure water separator exhibits superior separation performance.
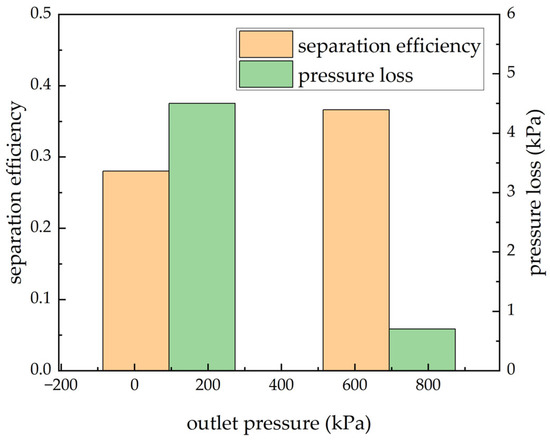
Figure 14.
Separation efficiency and pressure differential from simulation data under high- and low-pressure conditions.
We further analyze the differences in the internal flow fields of the separator under high- pressure and low-pressure conditions. Figure 15 shows the pressure contours on the y-plane within the separator for both cases. The results indicate that the pressure distribution patterns are similar: after the swirl generator section, centrifugal forces establish a pronounced pressure gradient, with pressure decreasing from the wall toward the axis and forming a low-pressure core along the centerline. Notably, this low-pressure feature is most pronounced at the center of the swirl generator outlet. For the same flow rate, a higher pressure corresponds to a lower velocity; consequently, the flow field at high pressure is markedly more uniform. This leads to a significantly reduced pressure loss and a higher separation efficiency under high pressure.
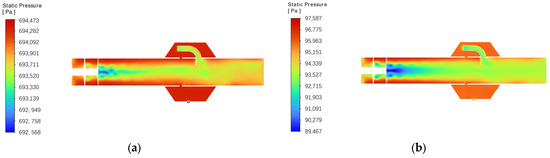
Figure 15.
Pressure contour on the y-plane of the water separator: (a) The high-pressure condition; (b) The low-pressure condition.
Figure 16 and Figure 17 depict, respectively, the airflow streamlines and particle size trajectories inside the separator under high-pressure and low-pressure conditions, to elucidate the influence of operating pressure on the internal dynamics. Under low pressure, swirling flow forms a high-speed core near the axis with a pronounced radial velocity gradient, consistent with a strong vortex. However, low pressure also aggravates gas carry-under, whereby a portion of the air is entrained into the lower collection sump, directly degrading separation efficiency. By contrast, the high-pressure condition yields a more uniform flow field that effectively suppresses gas carry-under losses, thereby enhancing separation performance. At high pressure, particles, driven by centrifugal forces, can effectively accumulate and form a stable particle stream along the wall, leading to efficient capture and thus higher separation efficiency. Conversely, under low pressure, the higher gas velocity induces two adverse effects: (i) particle trajectories become more dispersed, hindering effective aggregation; and (ii) particle breakage intensifies, reducing the overall particle size. The combination of these effects is the principal reason why separation efficiency at low pressure is substantially lower than at high pressure.
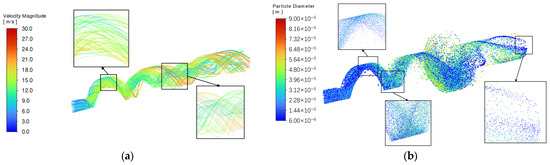
Figure 16.
Airflow streamlines and particle size trajectories inside the water separator under high-pressure conditions: (a) Airflow streamlines; (b) particle size trajectories.
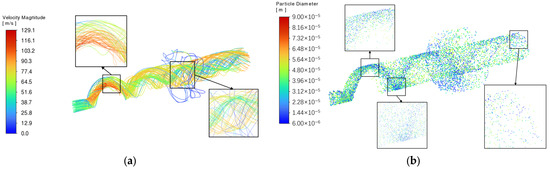
Figure 17.
Airflow streamlines and particle size trajectories inside the water separator under low-pressure conditions: (a) Airflow streamlines; (b) particle size trajectories.
5. Conclusions and Discussion
This study integrates experiments and numerical simulations to systematically investigate the combined effects of swirl angle, air mass flow rate, humidification rate, and operating pressure on the flow resistance and separation performance of a water separator, thereby deepening the understanding of the complex gas–liquid two-phase flow mechanisms inside cyclone water separators. The main conclusions are as follows:
- Separation efficiency exhibits a non-monotonic dependence on air mass flow rate, following a “rise–fall–rise” trend. This behavior arises from the competition and transition among multiple mechanisms, including centrifugal separation, turbulence-induced secondary entrainment of droplets, and the tendency of the flow field to become relatively stabilized at higher flow rates.
- Swirl angle is the key parameter governing the flow-field structure and separation performance. A 20° swirl angle generates stronger swirl and reaches the efficiency peak more rapidly at low air mass flow rates; however, it also intensifies turbulent dissipation, resulting in a pronounced increase in pressure loss and an earlier onset of flow instability at lower Re. Over portions of the flow-rate range, the 30° swirl generator attains a stable, strongly turbulent state earlier and achieves higher separation efficiency than the 40° swirl generator. Nonetheless, in aggregate, the 40° swirl angle delivers superior overall performance across a wider range of air mass flow rates.
- The high-pressure water separator outperforms its low-pressure counterpart. Increasing operating pressure significantly enhances separation performance (with an efficiency improvement of approximately 30.7%) while reducing pressure loss. High pressure suppresses gas velocity, yielding a more uniform flow field, effectively diminishing gas carry-under losses, and promoting stable droplet attachment and collection along the wall.
This work provides an important theoretical basis for the optimized design and engineering application of water separators. A principal limitation is the absence of quantitative characterization of the inlet droplet state—i.e., whether droplet sizes had changed or coalesced into a liquid film. Future studies should quantify the inlet droplet-state distribution and elucidate its influence on separation efficiency. Additionally, this study primarily relies on experimental methods, with preliminary simulation work serving as a complement. Future research will expand to comprehensive simulations across all operating conditions to thoroughly investigate pressure-enhanced separator performance and internal flow dynamics.
Author Contributions
Conceptualization, Y.C.; methodology, Y.C. and H.Y.; software, Y.C.; validation, Y.C.; formal analysis, Y.C. and H.Y.; investigation, Y.C.; resources, Y.C. and C.W.; data curation, and Y.C., H.Y. and X.Z.; writing—original draft preparation, Y.C.; writing—review and editing, H.Y.; visualization, Y.C.; supervision, C.W. and X.Z.; project administration, C.W. and X.Z.; funding acquisition, X.Z. All authors have read and agreed to the published version of the manuscript.
Funding
This research was funded by Zhuhai Industry-university-research, grant number ZH22017001210053PWC.
Data Availability Statement
Data are contained within the article.
Acknowledgments
During the preparation of this manuscript, the authors used GPT5 for the purposes of translating and polishing the text. The authors have reviewed and edited the output and take full responsibility for the content of this publication.
Conflicts of Interest
The authors declare no conflicts of interest.
Abbreviations
The following abbreviations are used in this manuscript:
| ACS | Aircraft Air-cycle System |
| DPM | Discrete Phase Model |
| RSM | Reynolds Stress Model |
| CFD | Computational Fluid Dynamics |
| Re | Reynolds Number |
| K | Pressure loss coefficient |
| St | Strouhal Number |
References
- Liao, J.; Yang, C.; Yang, H. Evaluation of Aircraft Environmental Control System Order Degree and Component Centrality. Aerospace 2023, 10, 438. [Google Scholar] [CrossRef]
- Scott, T.J.A.; Jacob, C.; Cheng, F.; Manasseh, R.; Leontini, J.S. Global instability of flows through single- and double-bifurcation airway models. J. Fluid Mech. 2025, 1020, A32. [Google Scholar] [CrossRef]
- Yang, L.; Chen, X.; Huang, C.; Liu, S.; Ning, B.; Wang, K. A review of gas-liquid separation technologies: Separation mechanism, application scope, research status, and development prospects. Chem. Eng. Res. Des. Trans. Inst. Chem. Eng. 2024, 201, 257–274. [Google Scholar] [CrossRef]
- Yuan, T.; Wang, C.; Chen, M.; Yang, F.; Hou, Y.; Ma, L.; Duan, Z.; Che, D. Simulation investigation on separation characteristics of gas-liquid model products from in-situ pyrolysis of tar-rich coal. J. Environ. Chem. Eng. 2025, 13, 115719. [Google Scholar] [CrossRef]
- Liu, L.; Bai, B. Scaling laws for gas–liquid flow in swirl vane separators. Nucl. Eng. Des. 2016, 298, 229–239. [Google Scholar] [CrossRef]
- Movafaghian, S.; Jaua-Marturet, J.A.; Mohan, R.S.; Shoham, O.; Kouba, G.E. The effects of geometry, fluid properties and pressure on the hydrodynamics of gas-liquid cylindrical cyclone separators. Int. J. Multiph. Flow 2000, 26, 999–1018. [Google Scholar] [CrossRef]
- Kataoka, H.; Shinkai, Y.; Hosokawa, S.; Tomiyama, A. Swirling annular flow in a steam separator. J. Eng. Gas Turbines Power 2009, 131, 032904. [Google Scholar] [CrossRef]
- Mao, Y.; Pu, W.; Zhang, H.; Zhang, Q.; Song, Z.; Chen, K.; Han, D. Orthogonal experimental design of an axial flow cyclone separator. Chem. Eng. Process. 2019, 144, 107645. [Google Scholar] [CrossRef]
- Sun, Z.; Li, J.; Sun, M.; Wang, Z. Study of flow characteristics in straight-flow gas-liquid cyclone separator. Chem. Eng. Res. Des. Trans. Inst. Chem. Eng. 2025, 219, 100–119. [Google Scholar] [CrossRef]
- Matsubayashi, T.; Katono, K.; Hayashi, K.; Tomiyama, A. Effects of swirler shape on swirling annular flow in a gas-liquid separator. Nucl. Eng. Des. 2012, 249, 63–70. [Google Scholar] [CrossRef]
- Fu, S.; Tao, L.; Shen, Z.; Xu, M.; Yang, D.; Hu, Y.; Zhou, F. Effects of helical guide vanes on droplet behavior and separation performance in gas-liquid separators. Chem. Eng. Process.—Process Intensif. 2025, 209, 110197. [Google Scholar] [CrossRef]
- Qiu, Z.; Zhou, L.; Bai, L.; El-Emam, M.A.; Agarwal, R. Empirical and numerical advancements in gas-liquid separation technology: A review. Geoenergy Sci. Eng. 2024, 233, 212577. [Google Scholar] [CrossRef]
- Zhang, Y.; Li, K.; Zhang, K.; Zhu, G.; Sun, Z.; Shi, J. Research on the flow field characteristics of the industrial elliptical cyclone separator. Separations 2025, 12, 50. [Google Scholar] [CrossRef]
- Tang, Y.; Qiao, Z.; Cao, Y.; Si, F.; Romero, C.E.; Rubio-Maya, C. Numerical analysis of separation performance of an axial-flow cyclone for supercritical CO2-water separation in CO2 plume geothermal systems. Sep. Purif. Technol. 2020, 248, 116999. [Google Scholar] [CrossRef]
- Liu, X.; Liu, Z.; Li, Y. Investigation on separation efficiency in supersonic separator with gas-droplet flow based on DPM approach. Sep. Sci. Technol. 2014, 49, 2603–2612. [Google Scholar] [CrossRef]
- Wang, Z.H. Separation Mechanism and Experimental Research of High Pressure Water Separator. Master’s Thesis, Beihang University, Beijing, China, 1992. (In Chinese). [Google Scholar]
- Dang, C.B. Performance Research of High Pressure Water Separator. Ph.D. Thesis, Beihang University, Beijing, China, 1997. (In Chinese). [Google Scholar]
- Yang, C.X.; Yuan, X.G.; Wang, Z.H. Experimental research on high pressure water separator. Fluid Eng. 1991, 21, 13–15. (In Chinese) [Google Scholar]
- Chen, L.; Zhang, X.; Wang, C.; Yang, C. Analysis on high-pressure water separator. Procedia Eng. 2015, 121, 558–566. [Google Scholar] [CrossRef][Green Version]
- Li, Q.; Xu, W.; Wang, J.; Jin, Y. Performance evaluation of a new cyclone separator—Part I: Experimental results. Sep. Purif. Technol. 2015, 141, 375–388. [Google Scholar] [CrossRef]
- Alduchov, O.A.; Eskridge, R.E. Improved Magnus form approximation of saturation vapor pressure. J. Appl. Meteorol. 1996, 35, 601–609. [Google Scholar] [CrossRef]
- Moffat, R.J. Describing the uncertainties in experimental results. Exp. Therm. Fluid Sci. 1988, 1, 3–17. [Google Scholar] [CrossRef]
- Holman, J.P. Experimental Methods for Engineers, 8th ed.; McGraw-Hill Education: Boston, MA, USA, 2011; pp. 132–134. [Google Scholar]
- Feng, J.; Chang, Y.; Peng, X.; Qu, Z. Investigation of the oil-gas separation in a horizontal separator for oil-injected compressor units. Proc. Inst. Mech. Eng. Part A J. Power Energy 2008, 222, 403–412. [Google Scholar] [CrossRef]
- Escue, A.; Cui, J. Comparison of turbulence models in simulating swirling pipe flows. Appl. Math. Model. 2010, 34, 2840–2849. [Google Scholar] [CrossRef]
- Ding, H.; Sun, C.; Wang, C.; Wen, C.; Tian, Y. Prediction of dehydration performance of supersonic separator based on a multi-fluid model with heterogeneous condensation. Appl. Therm. Eng. 2020, 171, 115074. [Google Scholar] [CrossRef]
- Wang, Z.; Jin, A.; Liu, M. Simulation and Experimental Design of an Axial Flow Cyclone Separator Suitable for High-Wind–Sand Environments. Sustainability 2025, 17, 3355. [Google Scholar] [CrossRef]
- Kaya, M.N.; Satcunanathan, S.; Meinke, M.; Schröder, W. Leading-Edge Noise Mitigation on a Rod–Airfoil Configuration Using Regular and Irregular Leading-Edge Serrations. Appl. Sci. 2025, 15, 7822. [Google Scholar] [CrossRef]
- Ishak, M.H.H.; Ismail, F.; Mat, S.C.; Aziz, M.S.A.; Abdullah, M.Z.; Abas, A. Numerical study on the influence of nozzle spray shape on spray characteristics using diesel and biofuel blends. Biofuels 2019, 12, 1109–1121. [Google Scholar] [CrossRef]
- Hoffmann, A.C.; Stein, L.E.; Bradshaw, P. Gas Cyclones and Swirl Tubes: Principles, Design and Operation. Appl. Mech. Rev. 2003, 56, B28–B29. [Google Scholar] [CrossRef]
- Grimble, T.A.; Agarwal, A.; Juniper, M.P. Local linear stability analysis of cyclone separators. J. Fluid Mech. 2017, 816, 507–538. [Google Scholar] [CrossRef]
Disclaimer/Publisher’s Note: The statements, opinions and data contained in all publications are solely those of the individual author(s) and contributor(s) and not of MDPI and/or the editor(s). MDPI and/or the editor(s) disclaim responsibility for any injury to people or property resulting from any ideas, methods, instructions or products referred to in the content. |
© 2025 by the authors. Licensee MDPI, Basel, Switzerland. This article is an open access article distributed under the terms and conditions of the Creative Commons Attribution (CC BY) license (https://creativecommons.org/licenses/by/4.0/).