Review

Artificial Intelligence in Rice Quality and Milling: Technologies, Applications, and Future Prospects

1
Advanced Food Innovation Centre (AFIC), Sheffield Hallam University, Sheffield S9 2AA, UK
2
School of Engineering and Mathematics, Sheffield Hallam University, Sheffield S1 1WB, UK
*
Authors to whom correspondence should be addressed.
Processes 2025, 13(11), 3731; https://doi.org/10.3390/pr13113731
Submission received: 16 September 2025 / Revised: 27 October 2025 / Accepted: 13 November 2025 / Published: 19 November 2025

Abstract

The global demand for high-quality rice necessitates advancements in milling technologies and quality assessment techniques that are rapid, accurate, and scalable. Traditional methods of rice evaluation are time-consuming and subjective, and are increasingly being replaced by artificial intelligence driven solutions that offer non-destructive, real-time monitoring capabilities. This review presents a comprehensive synthesis of current AI applications including machine vision, deep learning, spectroscopy, thermal imaging, and hyperspectral imaging for the assessment and classification of rice quality across various stages of processing. Major emphasis is put on the recent advances in convolutional neural networks (CNNs), YOLO architectures, and Mask R-CNN models, and their integration into industrial rice milling systems is discussed. Additionally, the review highlights next steps, notably designing lean AI architectures suitable for edge computing, hybrid imaging systems, and the creation of open-access datasets. Across recent rice-focused studies, classification accuracies for grading and varietal identification are typically ≥ 90 % using machine vision and CNNs, while NIR–ANN models for physicochemical properties (e.g., moisture/protein proxies) commonly report strong fits ( R 2 0.90 0.99 ). End-to-end detectors/segmenters (e.g., YOLO/YO-LACTS) achieve high precision suitable for near real-time inspection. These results indicate that AI-based approaches can substantially outperform conventional evaluation in both accuracy and throughput.

1. Introduction

Agriculture, contributing 6.4% to the global GDP, plays a crucial role as the main provider of food and economic output worldwide. In numerous countries, it serves as a major revenue source, while millions of individuals depend on it for energy and employment [1]. The UN FAO estimates that, to feed the 2050 population, food production must rise by roughly seventy percent [2]. Despite sufficient global food production to feed the entire population, 500 million people remain malnourished, and over 821 million face hunger. To meet future population demands, yearly cereal production must rise by 3 billion tonnes, and meat production must increase by more than 200% by 2050 [3]. To meet future demands, both crop sizes and farm structures must expand, alongside the adoption of advanced agricultural technologies. While this is feasible, it remains unclear whether such growth can be achieved in a sustainable and inclusive manner. Additionally, dietary habits have shifted significantly in recent decades, with a notable increase in the consumption of processed foods. Despite evolving trends, certain staple foods remain consistently present in consumers’ diets. A prominent example rice (Oryza sativa L.) is consumed by most populations, providing the chief staple for about 50% of people worldwide [4].

1.1. Aim and Scope of the Study

The main objective of this review is to systematically synthesize and evaluate artificial intelligence (AI) technologies applied in rice quality assessment and milling. The study aims to highlight both existing research trends and gaps between laboratory prototypes and industrial deployment. Specifically, it focuses on three research questions:
(i)
Which AI-based sensing and analytical technologies have been used to assess rice-grain quality and morphology?
(ii)
How do these technologies compare in terms of performance, data requirements, and practicality for real-time applications?
(iii)
What are the limitations, challenges, and future research directions in implementing AI-based quality assessment at industrial scale?
The scope of this review encompasses machine vision, spectroscopy, hyperspectral imaging, thermal imaging, and AI-based data modelling techniques, emphasizing their roles in predicting rice characteristics such as shape, colour, chalkiness, hardness, and milling yield. By consolidating findings across these domains, the review establishes a comparative framework to evaluate both traditional and AI-enhanced approaches, outlining their relative advantages, limitations, and industrial readiness.
Agricultural production, industrialization, and consumption of rice constitute a vital global economic activity, with nearly half of the world’s population consuming it daily [5]. About half of the global population, notably in Latin America, Asia, and some African countries, relies on rice as its primary energy supply [6]. The widespread popularity of rice can be largely attributed to its low cost, fast, and simple preparation, as it complements a variety of cooking methods [7].
Rice is a key energy source rich in nutritional components, including fibre, minerals, proteins, vitamins, and antioxidants. Figure 1 illustrates the rice plant, harvested grain, and the subsequent stages of rice processing, including unpolished (brown) and polished (white) rice. It has been a primary food consumed by over half of the global population. Shahbandeh et al. [8] reports that Asian populations are the leading consumers of this food product, with China at the leading forefront, consuming the highest of about 154.9 million metric tons (MMT), closely followed by India at 103.5 MMT, Vietnam at 73.3 MMT, Bangladesh at 36.7 MMT, and Indonesia at 35.6 MMT per harvest year. Recent years have seen a rise in demand in Asia and developing countries, for milled rice characterized by high-quality traits as defined by consumers [9,10,11]. Thus, enhancing the quality traits of rice is essential to ensure high consumer acceptance. Rice (Oryza sativa L.) is a major commercial grain globally, and its economic value is closely linked to the proportion of well processed rice. In the rice milling industries, the quality of required for rice production are influenced by several factors, with visual characteristics being particularly crucial, as they significantly impact consumer choices and preferences. Quality assessment of rice basically includes factors such as the physical properties, aroma, and taste. These factors are traditionally evaluated after the milling process. However, for consumers, rice quality are primarily assessed based on its appearance [9,10]. Consequently, appearance characteristics, such as grain length and breadth, significantly influence the commercial value of rice. Manual inspection of grain physical parameters in milling industries are labour-intensive process. Conventional rice quality analysis relies on expert human operators who visually inspect and the evaluate rice samples at defined intervals. However, this method is susceptible to errors caused by human fatigue and occasional lapses in judgment. Given the inaccuracies associated with manual inspections of rice quality, there is a need for accurate, precise and less labour intensive methods for real-time rice milling analysis. AI computer vision model utilize image processing techniques to meet this need, as AI techniques provide the added advantage of being non-destructive. Furthermore, for real-time implementation, these methods (AI approaches) can be utilized during milling processes by installing cameras along the rice production line. Today, AI model has proven to be a sophisticated and reliable tool for addressing complex practical challenges across various fields [12,13]. In a broad context, artificial intelligence (AI) is defined as the capability of computers and other machines to emulate intelligent behaviours exhibited by humans and nature in order to address practical problems. Typically, AI relies on two core concepts: learning and reasoning, which are utilized for modelling and optimization [14]. Learning automates model construction, while reasoning draws logical conclusions from rigorously documented evidence [15]. AI technologies facilitate advanced process control by improving real-time monitoring, boosting operational efficiency, and implementing self-correcting systems within production environments in food processes and quality control [16]. In the case of rice quality assessment, AI can be effectively applied to carry out a range of functions such as assessing food quality, implementing control strategies, classifying food products, and generating predictive insights [17]. Recent AI developments enable data-driven modeling and process optimization for rice quality, e.g., detecting pathogens, selecting grains, and controlling milling [17,18]. Recent deep learning methods have been applied to classify, monitor, and detect defects throughout rice production and milling [18,19,20]. The impressive capabilities of deep learning methods hold significant potential for enhancing the feature extraction in the rice milling process [21,22,23]. AI comprises several branches such as ANNs, fuzzy-logic systems, metaheuristic optimization methods, and combined (hybrid) approaches.
The motivation for this review is the growing need for accurate, rapid, and non-invasive rice quality assessment systems in both breeding programs and commercial rice milling. With increasing consumer demand for premium rice traits such as uniformity, low chalkiness, and varietal authenticity, traditional methods fall short due to their subjective nature and labour intensity. Artificial intelligence offers a promising solution, yet adoption remains fragmented.

1.2. Major Contribution

This review distinguishes itself from previous literature by offering a structured, comparative analysis of traditional and AI-driven techniques for rice quality assessment, with a focus on real-world implementation. Unlike earlier reviews that either broadly cover AI in agriculture or narrowly examine specific imaging methods, this study synthesizes diverse AI tools such as deep learning models like YOLOv8, CNNs, and other model systems specifically for rice milling and quality classification. The review also highlights a critical gap for AI applications into commercial rice milling operations. To address this, we emphasize AI methods with proven accuracy in experimental settings but limited industry uptake and propose potential solutions for industrial integration and validation. Unlike prior reviews that discuss rice quality technologies at a high level [16] or survey broader agri-AI trends [24], this review maps rice-specific sensing modalities (RGB vision, NIR, HSI) directly to target traits (morphology, chalkiness, composition) and aligns them with AI model families (traditional ML vs. deep learning). We further connect laboratory metrics to deployment considerations (latency, robustness, edge feasibility) and provide a structured, reproducible basis for comparison across rice-focused studies [25,26,27,28].

2. Materials and Methods

2.1. Systematic Review Statement

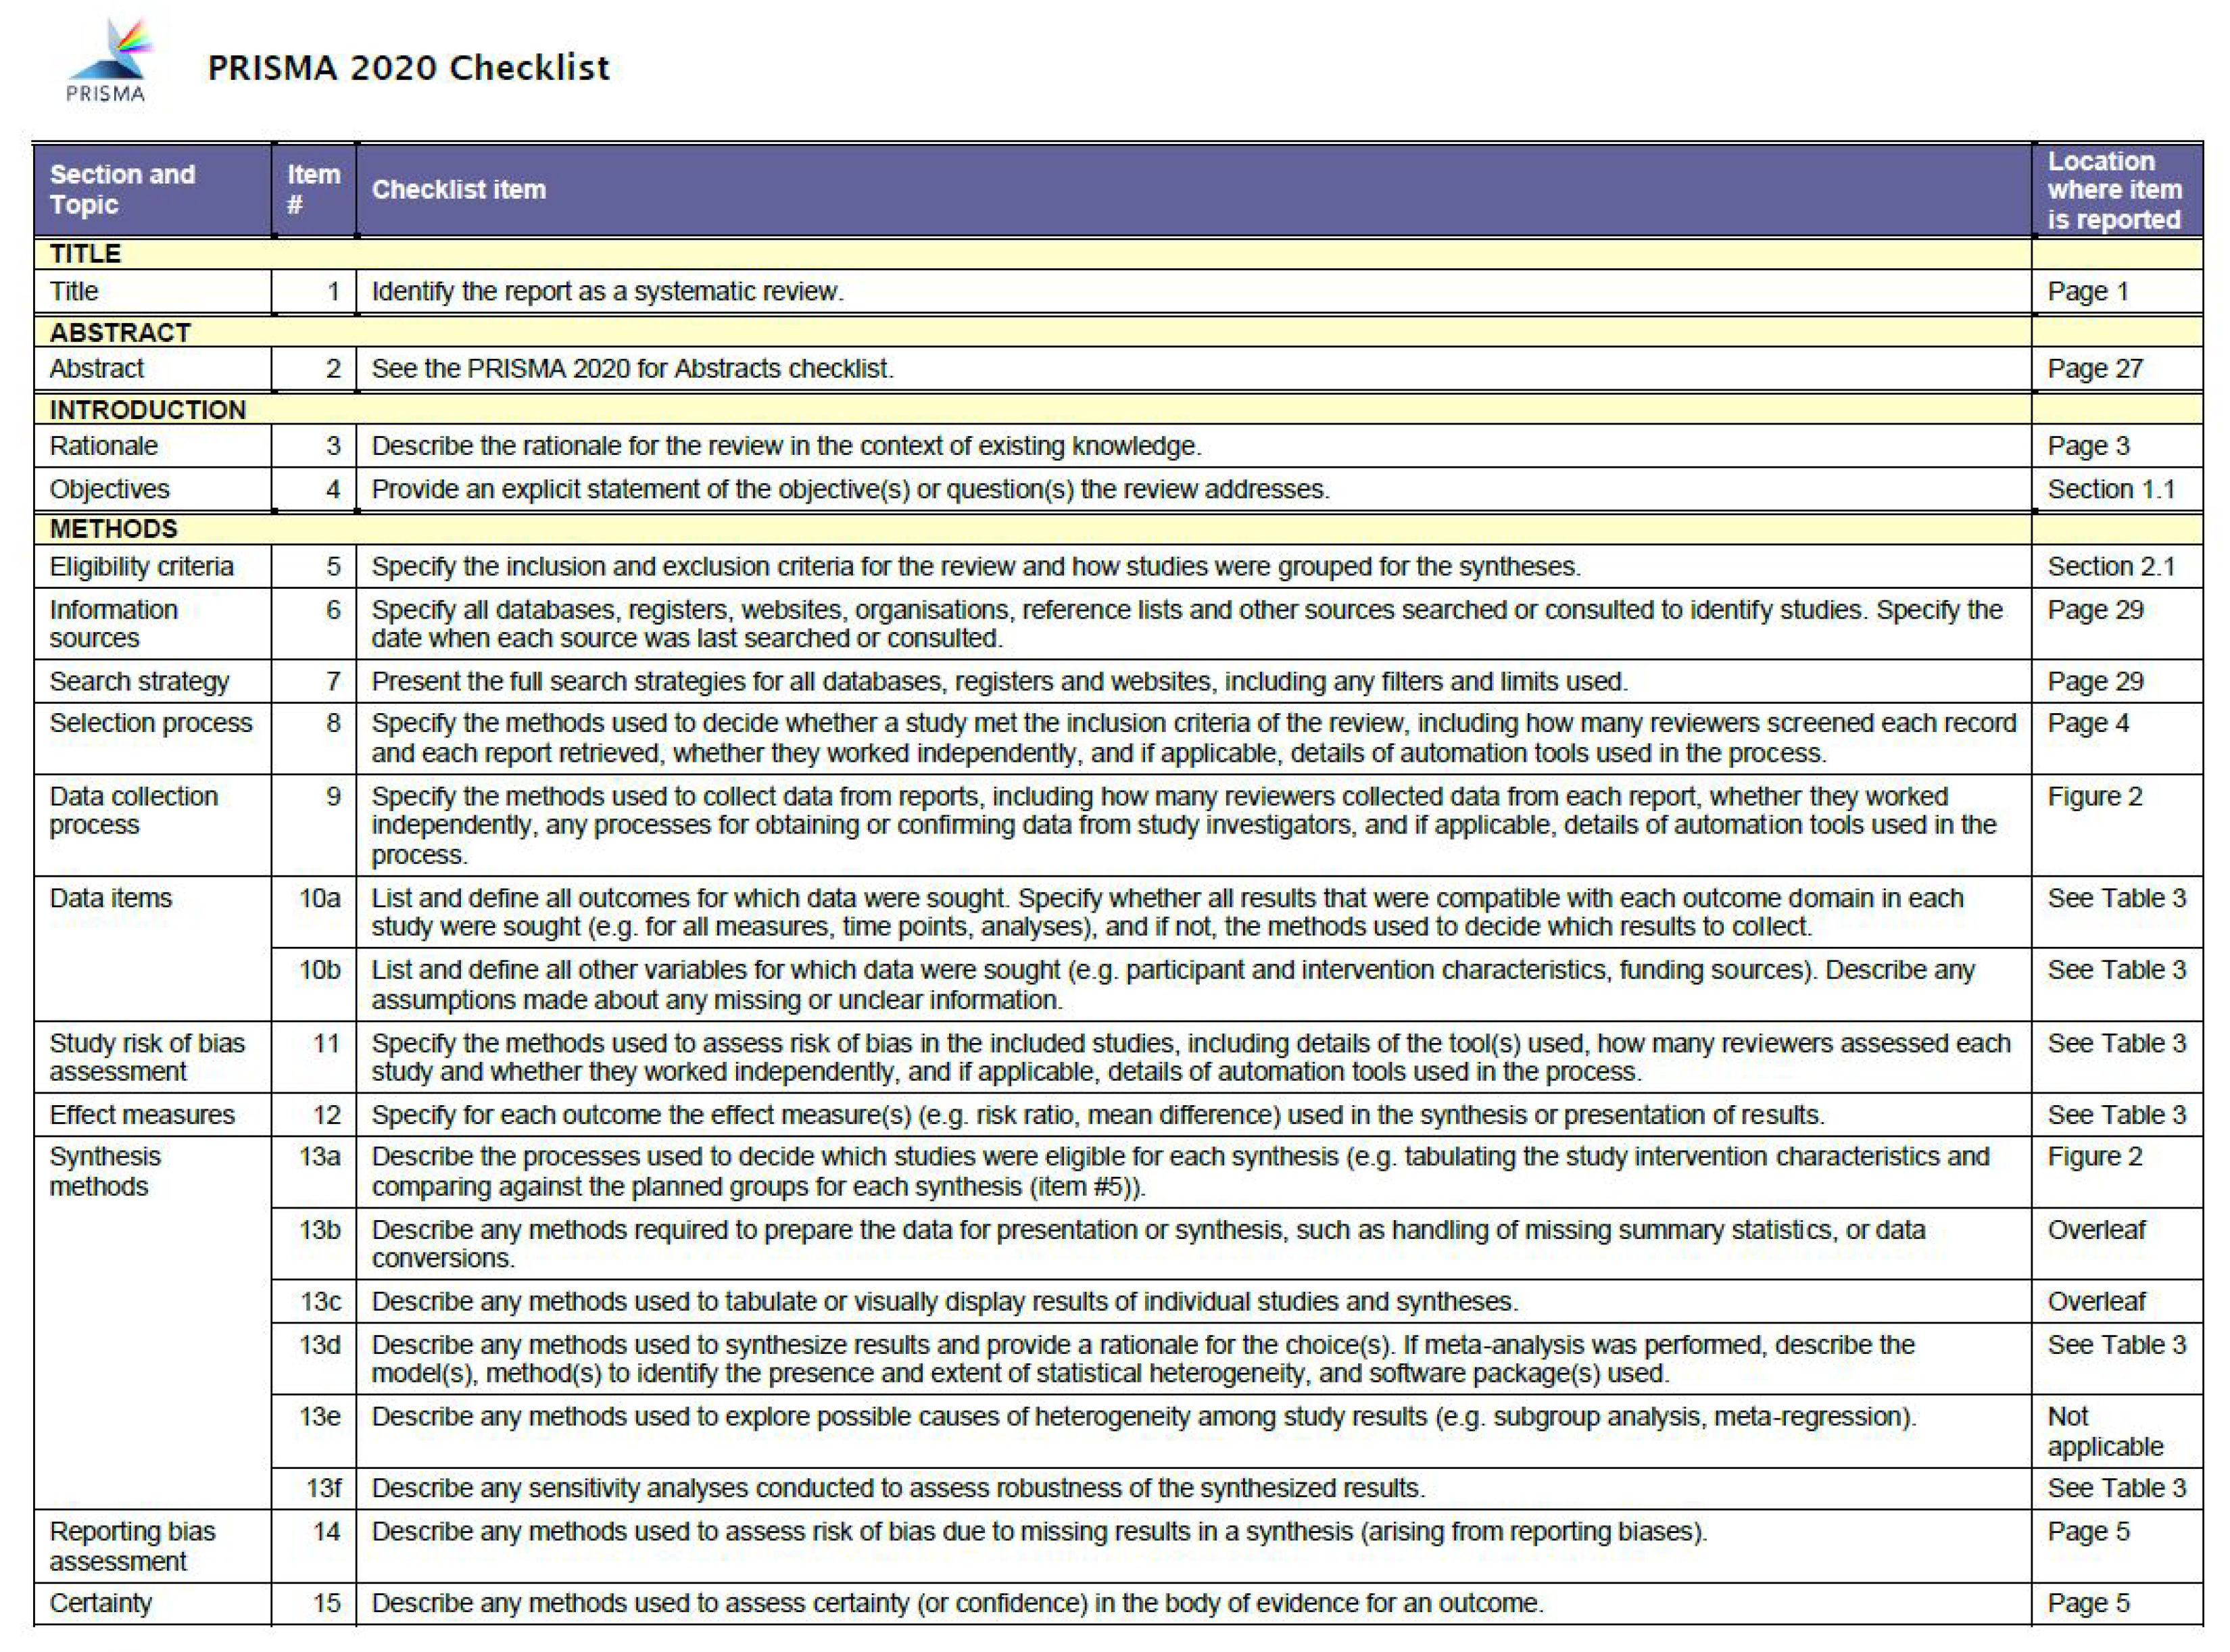
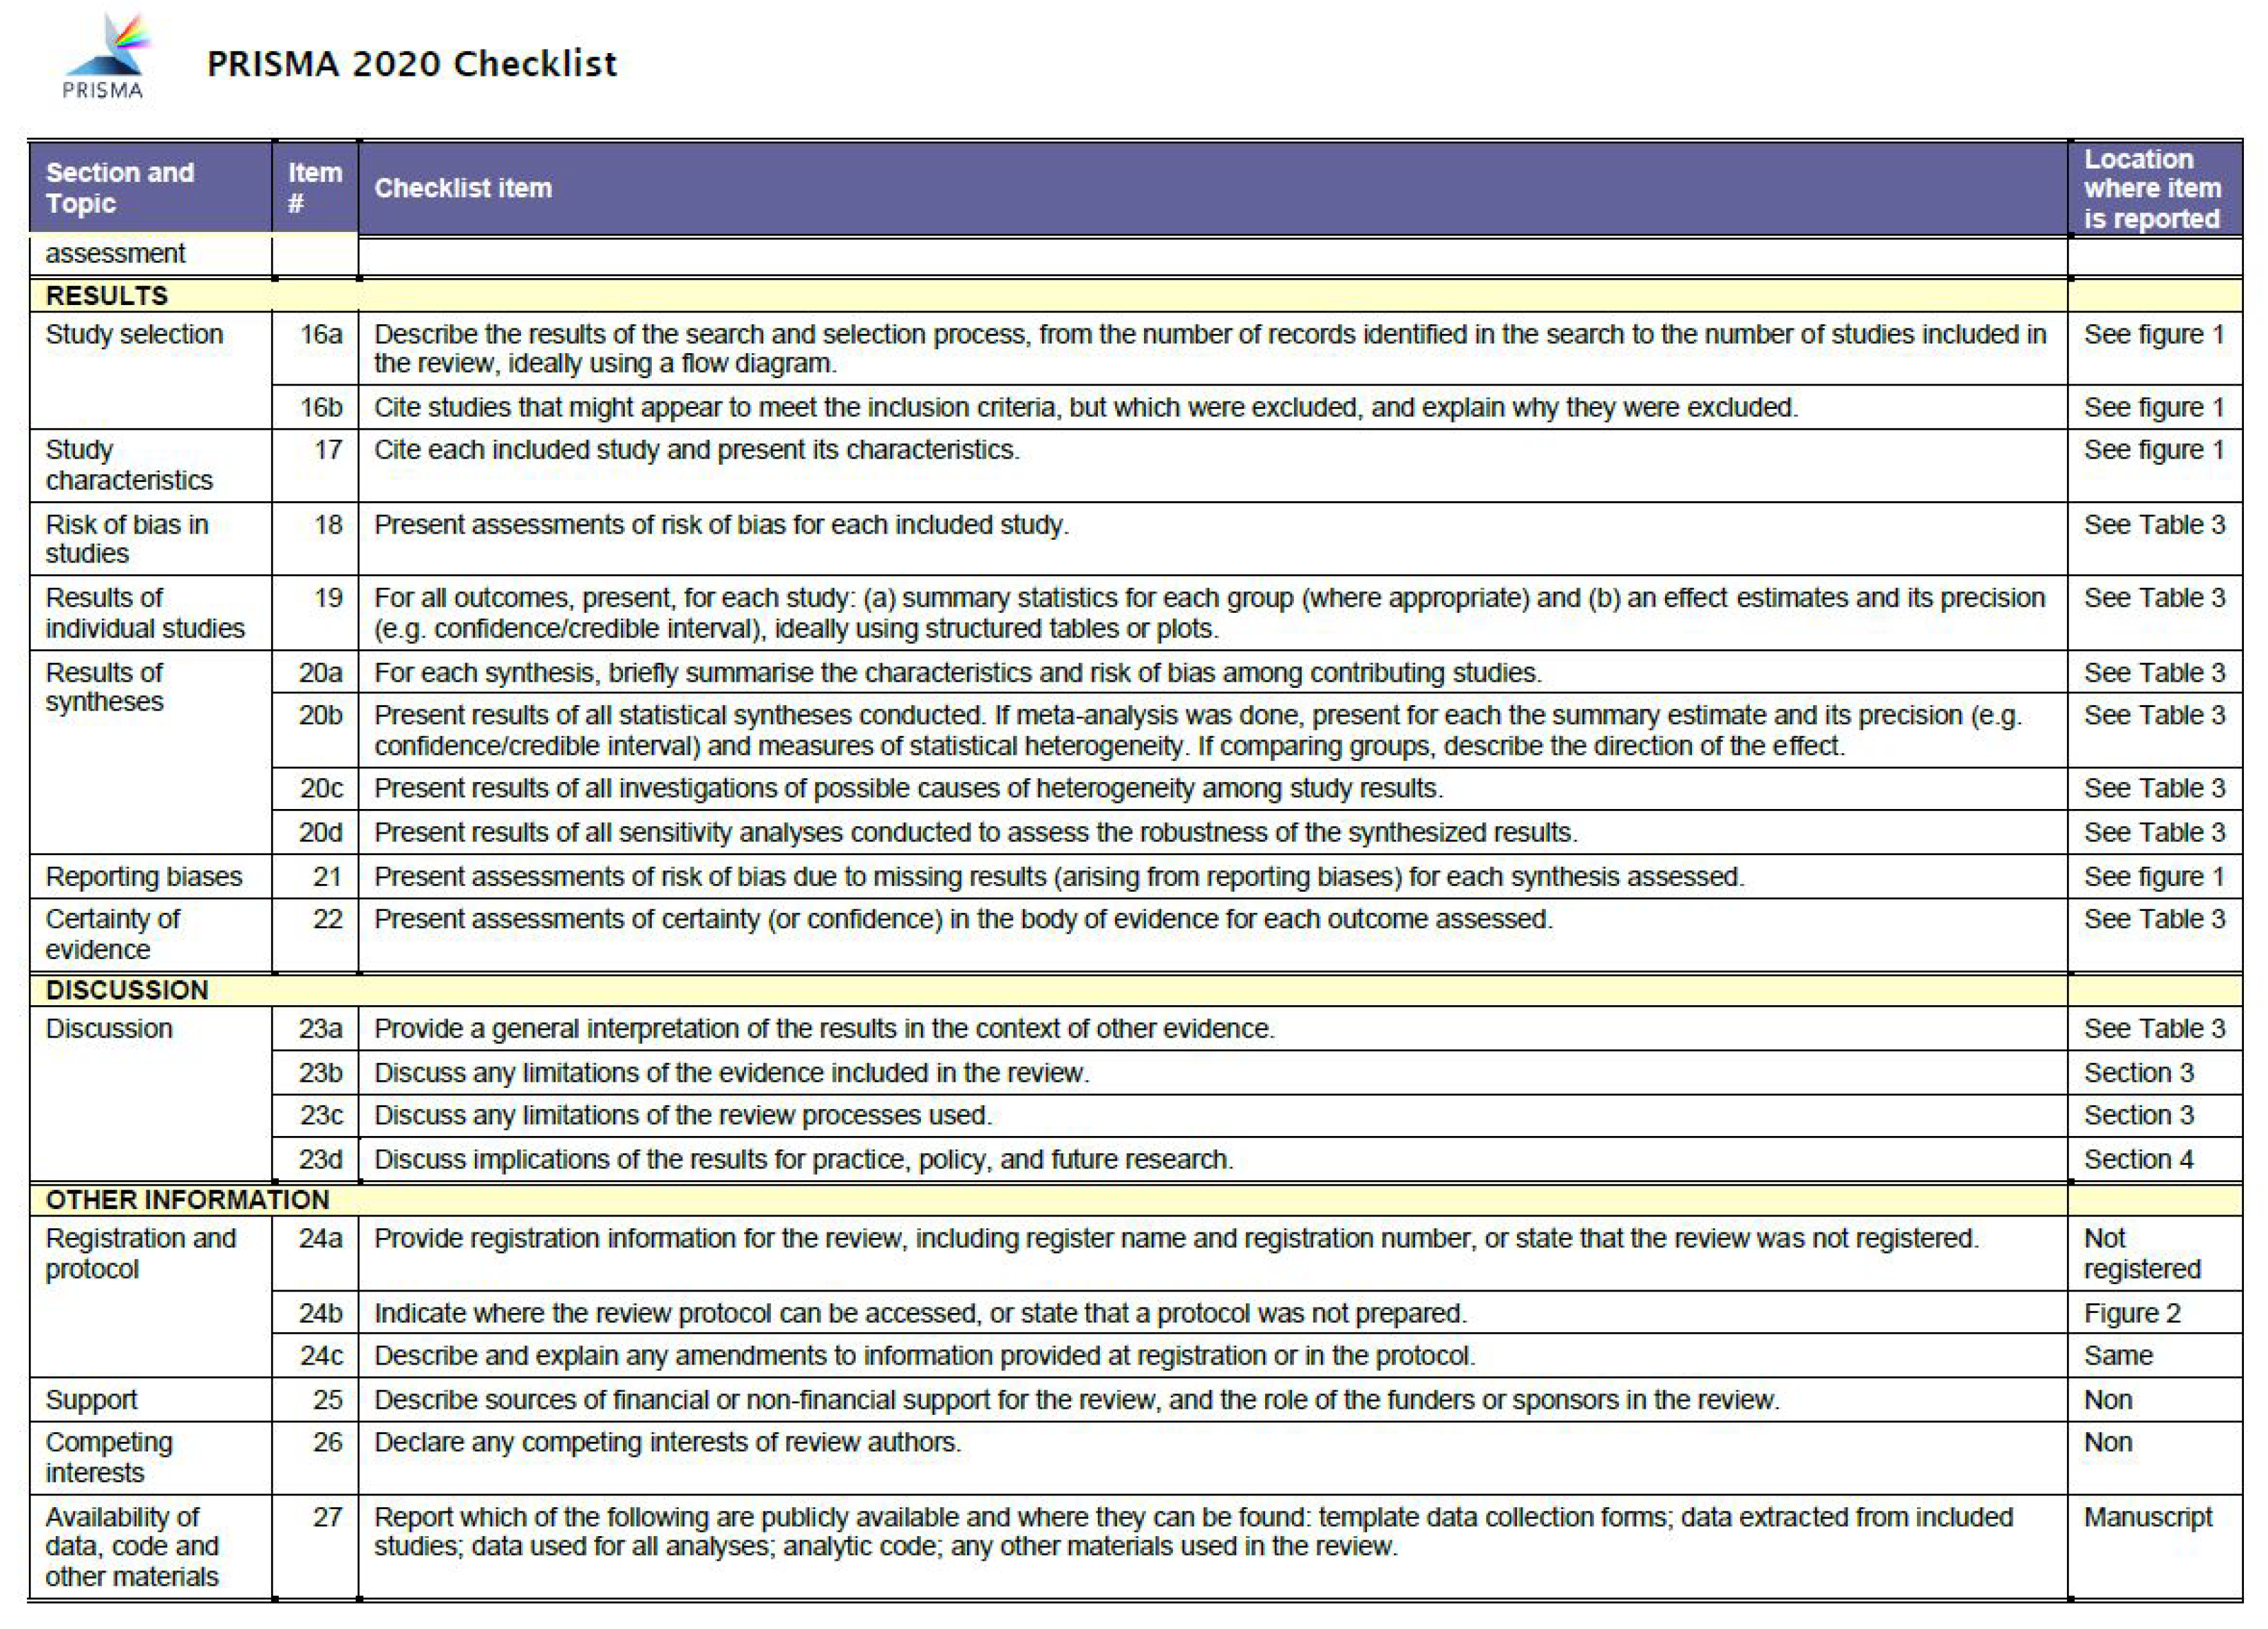
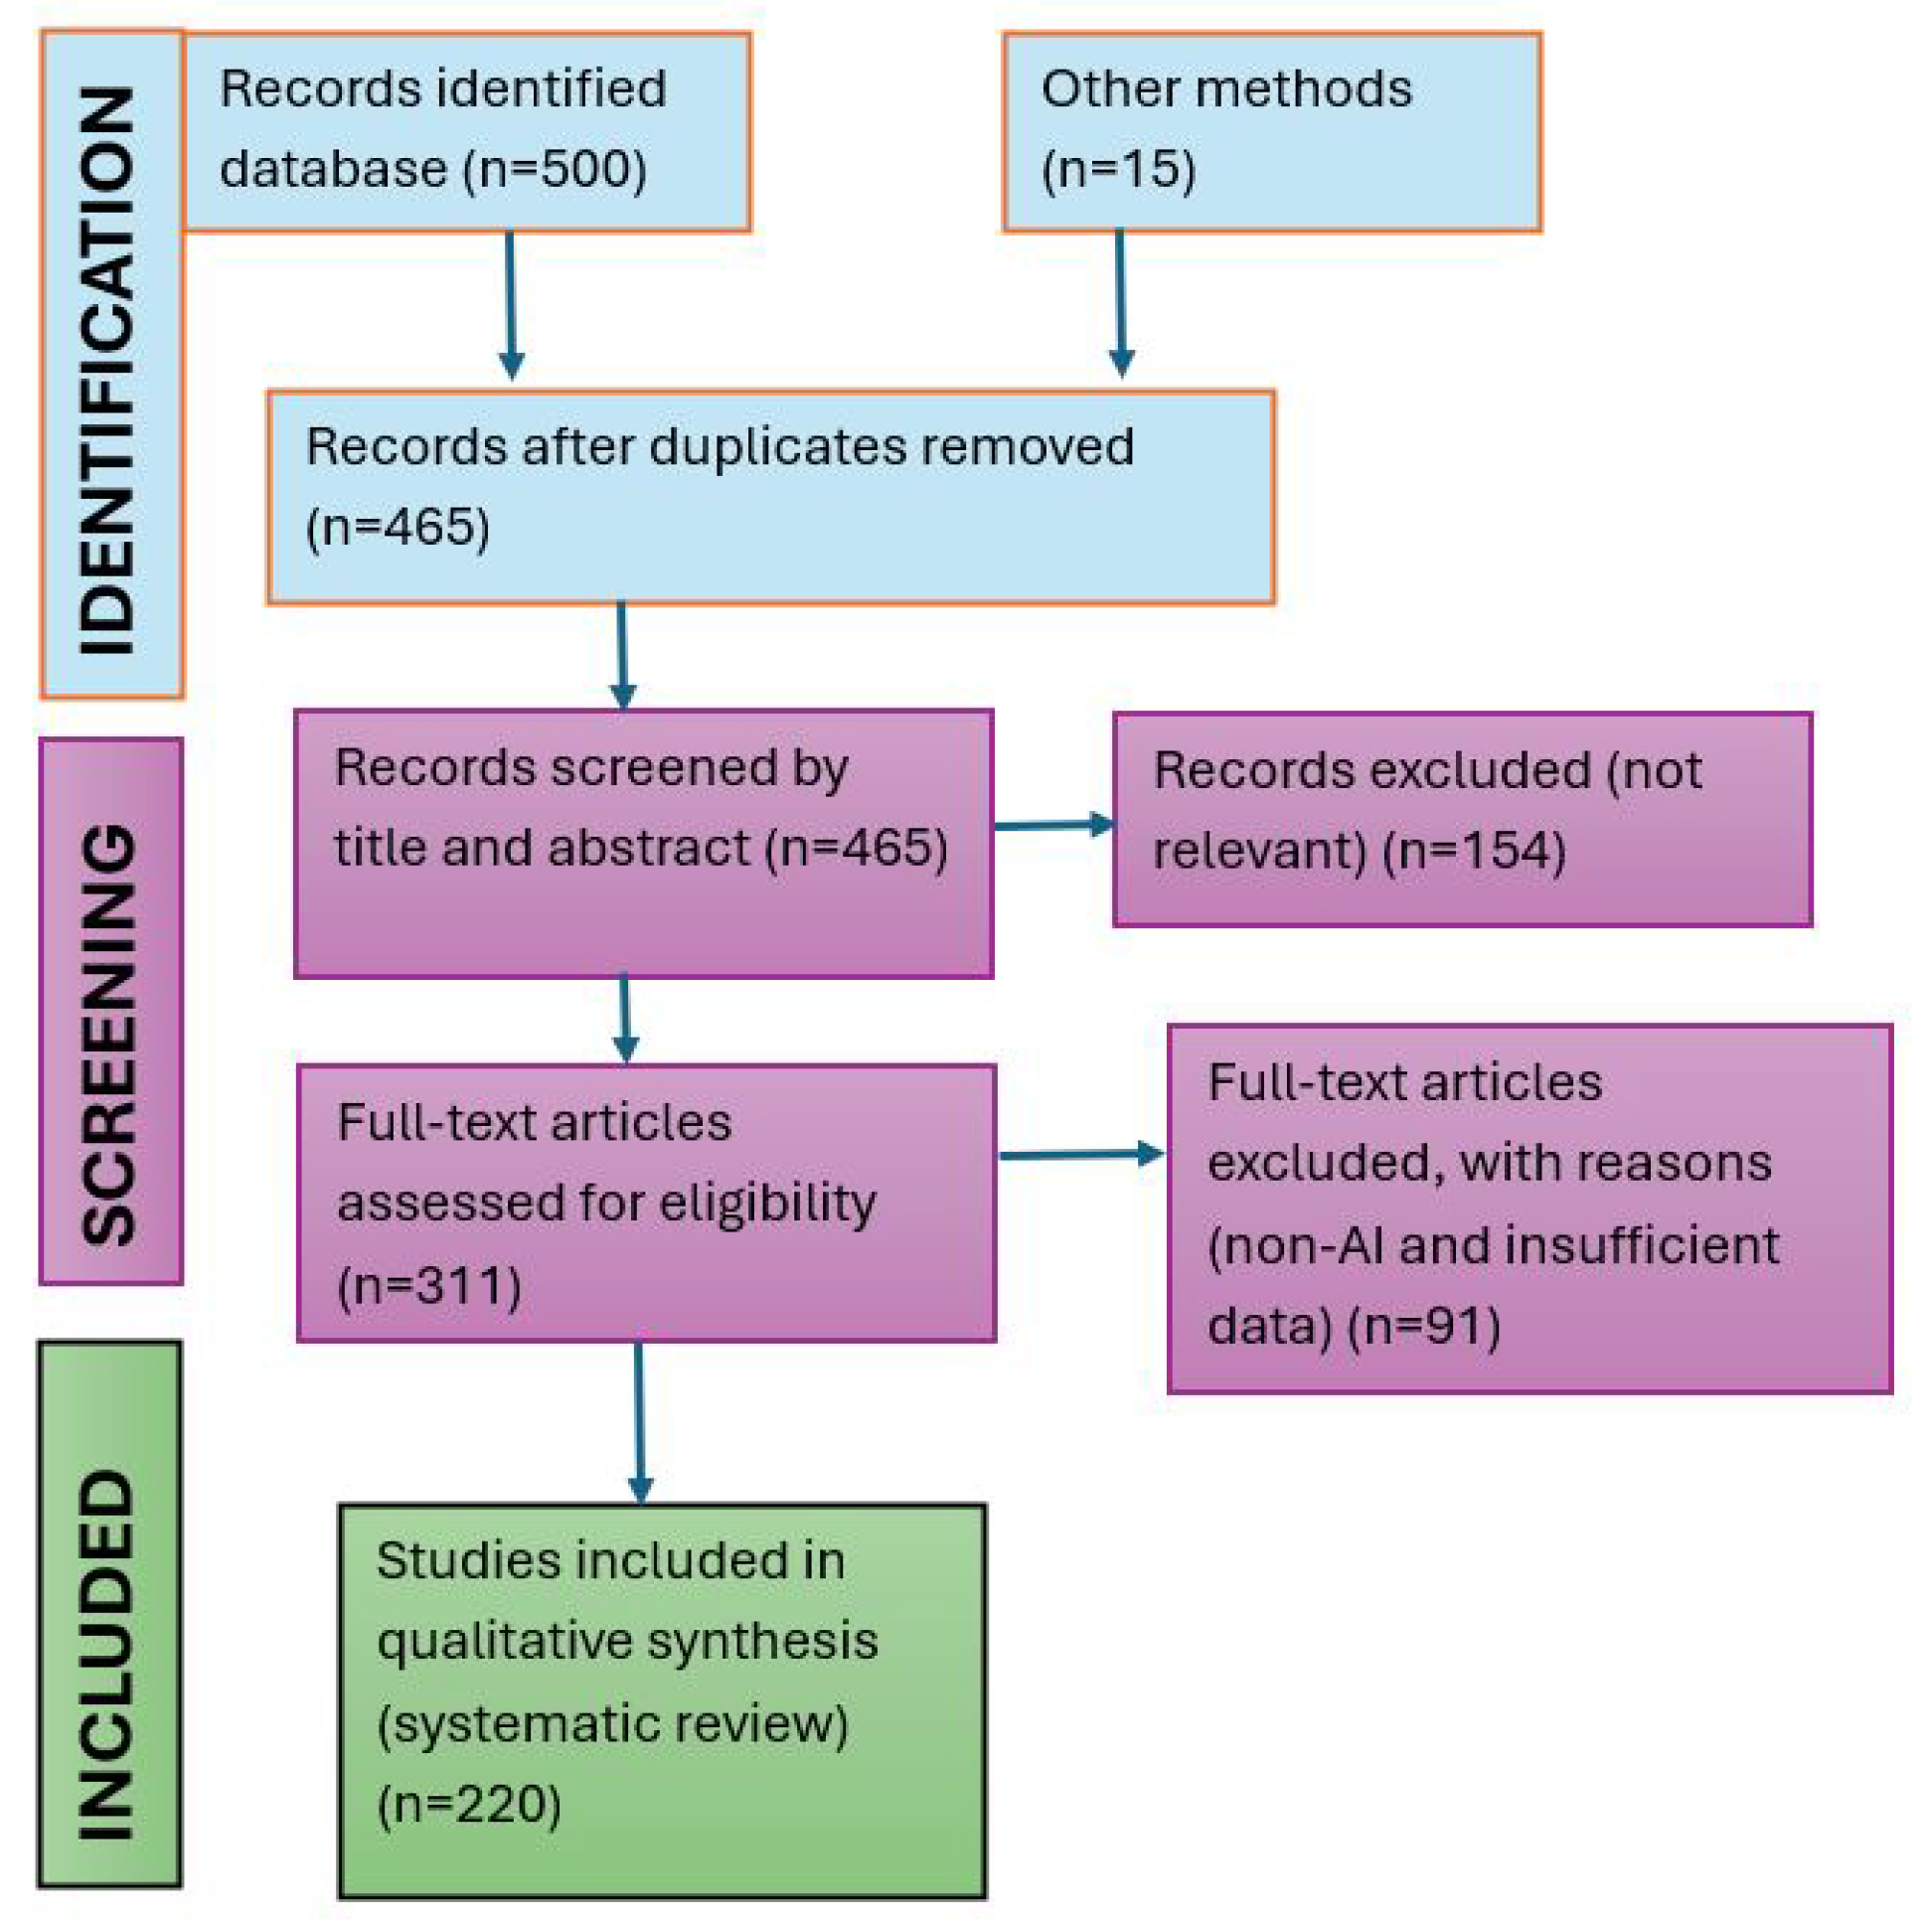
This systematic review was conducted following the PRISMA 2020 guidelines to ensure methodological transparency and reproducibility. The review protocol was developed in advance, defining the objectives, inclusion and exclusion criteria, and search strategy as shown in Appendix A. Although the protocol was not registered in a public database, all search, screening, and selection procedures were defined and systematically documented to ensure transparency and replicability. The PRISMA procedure is shown in (Figure 2).
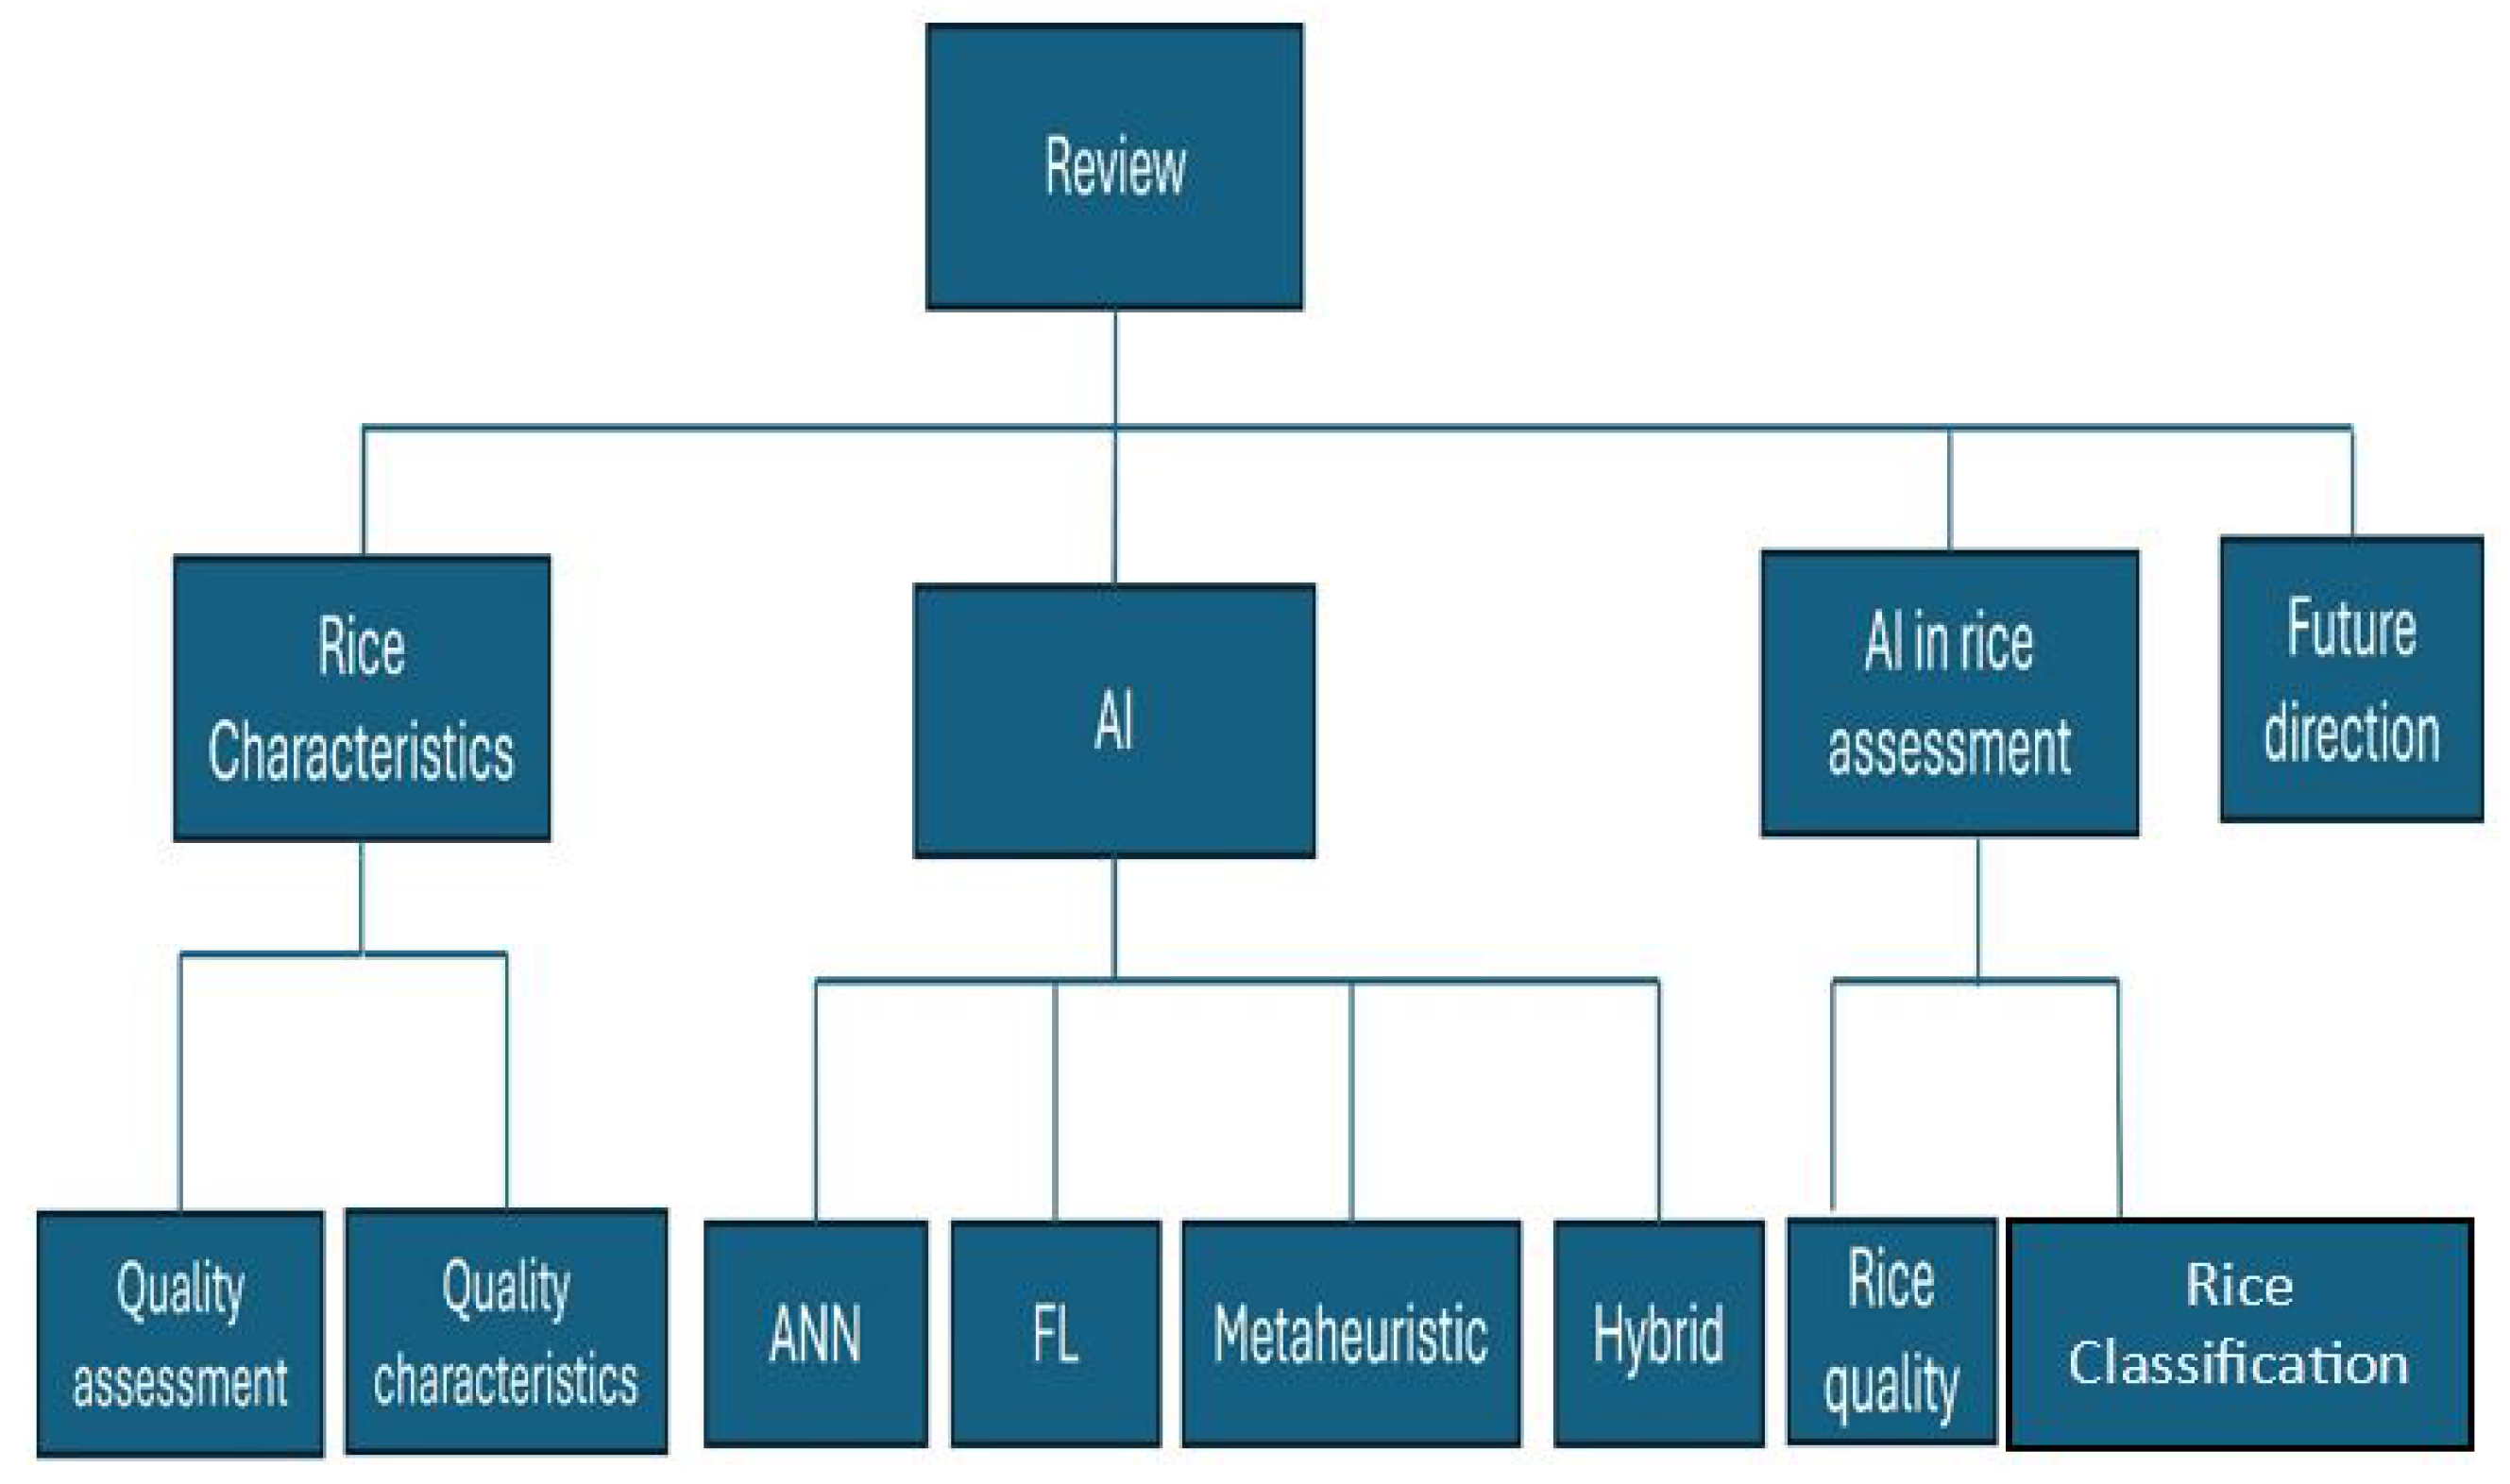
The review adopts a structured approach to synthesizing literature on artificial intelligence in rice quality assessment. This comprehensive review focused on rice processing, milling, analysis, quality, machine vision, deep learning, hyperspectral imaging, milling optimization, and AI in agriculture (Figure 3). Publications between 2000 and 2025 were considered to capture both foundational and cutting-edge developments. Studies were included if they focused on AI or computer-vision-based methods for rice morphology, classification, or milling process optimization.
The selected literature was categorized according to sensing modality (e.g., visual imaging, spectroscopy, hyperspectral, thermal) and analytical approach (machine learning, deep learning, hybrid models). Each study was analyzed based on its dataset characteristics, model architecture, evaluation metrics (e.g., accuracy, precision, recall, mAP), and suitability for real-time or industrial scale application. The synthesized insights were then compared to traditional rice quality assessment methods to identify performance improvements, limitations, and opportunities for technology transfer to industrial environments.

2.2. Agronomic Importance and Processing

Rice, classified within the Oryza genus, consists of 24 species, with Oryza sativa rice from Asia and Oryza glaberrima rice from Africa being the two primary species of significant agricultural importance for human consumption [29]. The remaining 22 wild species of the Oryza genus are naturally distributed across tropical and subtropical regions worldwide, including large areas of Africa, Southeast Asia, Australasia, as well as Central and South America [30]. Oryza sativa, the more widely cultivated of the two domesticated species, is divided into three major varieties: Indica, Japonica, and Javanica, all of which are extensively grown. The Indica subspecies produces elongated, slender grains commonly grown across tropical and subtropical regions of Asia and the Americas. Owing to its high amylose and low amylopectin concentrations, it tends to cook into a firm, non-sticky texture [31,32], with a more translucent appearance [33]. Conversely, Japonica rice is characterized by short to medium, round grains cultivated primarily in temperate zones, including Japan and northern China. Its higher amylopectin content results in a softer, stickier texture, contributing to the grains’ adhesive properties and the final product’s opacity [34]. Finally, Javanica represents a medium-grain type predominantly grown across the Philippines and the highland regions of Indonesia and Madagascar [35].
Rice is currently cultivated, processed and milled in over 100 countries (Figure 1), yielding approximately 500 million tons of paddy rice each year, across an estimated 165 million hectares of farmland [36]. On a global scale, irrigated lowland rice covers about 93 million hectares and contributes roughly 75% of total rice output [37]. Rainfed lowland systems in regions such as South Asia, parts of Southeast Asia, and much of Africa provide around 20% of global rice production, while upland rice, also grown under rainfed conditions, accounts for approximately 4% [38]. Given that three-quarters of rice cultivation depends on irrigation, the crop utilizes about 30% of the world’s irrigation water, together with 14% of fertilizer use and nearly 10% of pesticide consumption [39]. Moreover, rice production acts as an important source of methane and nitrous oxide emissions in the global agricultural sector [40]. Approximately 90% of the world’s rice is produced across key Asian countries, including Indonesia, Bangladesh, Vietnam, Myanmar, Thailand, the Philippines, Japan, Pakistan, Cambodia, South Korea, Nepal, and Sri Lanka. In the African context, rice represents the fastest-growing staple food crop in terms of both demand and output. Africa’s contribution to global cereal production has gradually expanded, from around 9% in 1961 to about 15% in 2007. However, domestic production currently satisfies only 54% of the continent’s rice consumption [5,41,42]. The dehusking followed by milling eliminates the external layers of the paddy, including the husk and bran, resulting in edible rice grains. Typically, husking equipment is divided into three principal classes: stone-type dehullers, rubber roll huskers, and impeller-driven models [43]. Stone dehullers remain prevalent in Asia, where brown rice is directly milled using abrasive or friction mills. Research indicates that the type of liner used has a significant impact on the husking efficiency [44]. Abrasive and friction-type milling systems are utilized for bran removal. It has been noted that abrasive mills are prone to over-milling. In huller-type mill, dehusking and milling are conducted in a single operation, leading to increased grain damage. Employing a dehusker prior to milling enhances both milling efficiency and head rice yields. Another crucial step in rice processing is parboiling. During the parboiling process, the husk undergoes splitting and detachment from the grain, facilitating easy dehusking [45]. The degree of milling (DOM) refers to the extent to which the bran layer is removed from rice kernels during the milling process. Factors influencing DOM include grain hardness, geometric attributes such as size and shape, the depth of surface ridges, the thickness of the bran layer, and the operational efficiency of the milling system [46]. Rice with greater hardness necessitates higher energy input to attain an equivalent degree of milling (DOM) compared to softer rice varieties [47]. Energy consumption during milling is influenced by grain thickness, hardness, shape, variety, and the degree of milling (DOM) [23,47]. Reduced surface hardness increases the likelihood of damage during milling, resulting in reduced yield and diminished product quality. of milled rice, particularly for long grains. The extent of mass loss and kernel fracture depends on parameters such as the rice cultivar, grain morphology, and aleurone layer thickness [48].

2.3. Structure and Chemical Composition

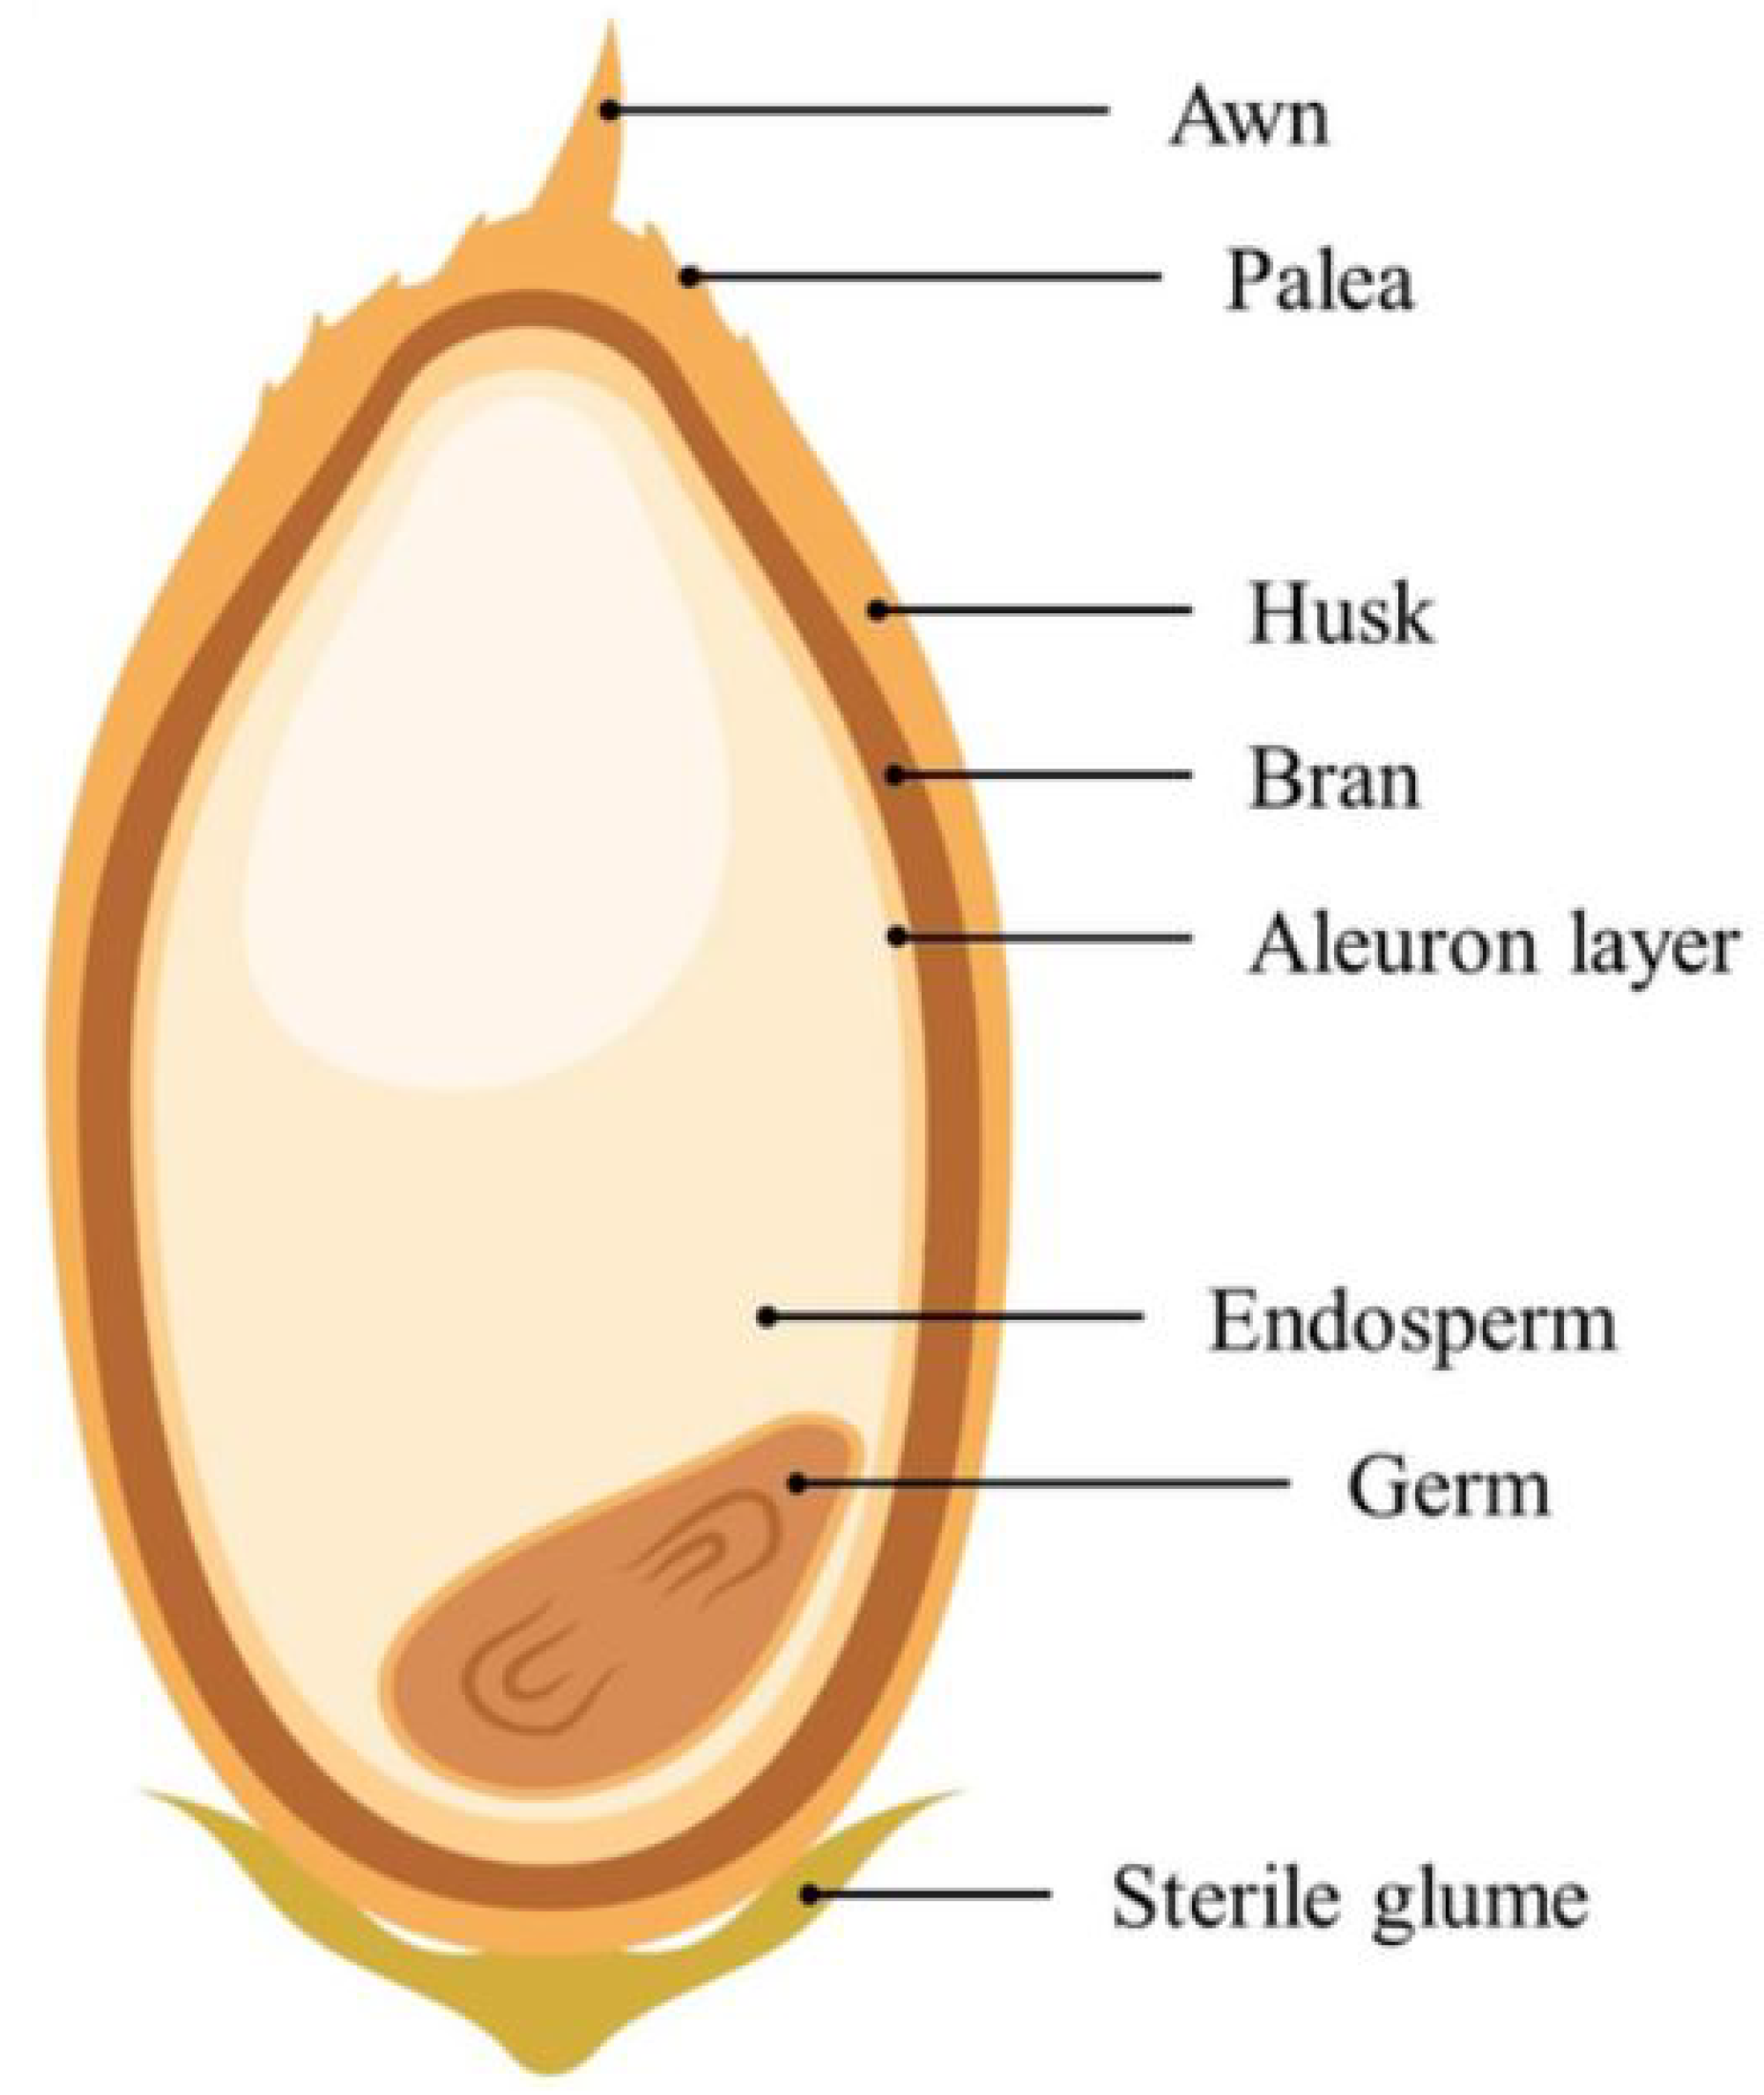
An in-depth knowledge of grain morphological features is fundamental to the assessment of rice’s physical and chemical attributes [49]. The caryopsis structure comprises the pericarp, endosperm, and embryo (or germ), which are enclosed by a tough, siliceous hull (Figure 2). This outer covering is derived from two specialized bracts, the lemma and palea [50]. The rice husk serves as a protective barrier for the caryopsis (grain), contributing to its resistance against insect infestation during storage and offering protection from primary pests. When stored at regulated humidity levels, rice grains remain viable for extended periods. The pericarp and aleurone layers exhibit the greatest accumulation of nutrients, including proteins, fats, fiber, minerals, and vitamins. Conversely, the endosperm is dominated by starch and protein, while the germ portion holds the most lipids [50,51,52]. Carbohydrates account for approximately 75–80% of the grain’s composition, with starch comprising around 90% of these carbohydrates as the main component. This is accompanied by fibers and free sugars, including fructose, raffinose, and glucose [53,54]. The endosperm primarily contains starch and protein, while the bran fraction is abundant in dietary fiber, and the germ portion consists largely of lipids with trace quantities of other carbohydrates [55]. The protein content of rice varies according to processing methods and environmental factors such as cultivation practices, nitrogen fertilizer application, solar exposure, and temperature during grain filling [56]. The dominant protein fractions in rice are prolamins and glutelins. Similar to other cereal grains, lysine is the limiting amino acid, whereas cysteine and methionine occur in relatively higher amounts. Rice lipids mainly consist of triglycerides, phospholipids, and free fatty acids, with a substantial proportion located in the germ, which accounts for roughly one-third of the total lipid pool [57]. Brown rice, due to its higher lipid concentration, is more susceptible to lipid oxidation than polished white rice, where the lipid level is reduced by the removal of surface layers during polishing. Regarding fatty acid composition, approximately 95% of rice lipids are made up of palmitic acid (16:0), oleic acid (18:1), and linoleic acid (18:2). These fatty acids are nutritionally essential for numerous physiological functions, as they cannot be synthesized endogenously and therefore must be supplied through the diet [58].

2.4. Biotic and Abiotic Factors Affecting Grain Quality

The relationship between grain and its storage environment constitutes an ecosystem, where product quality is influenced by both living organisms and non-living environmental conditions [56]. After harvest, rice is typically stored for varying durations prior to consumption. During this period, notable changes occur in its physical, chemical, and physiological attributes, ultimately altering its nutritional quality and sensory properties [59,60]. Such modifications manifested in factors like pasting characteristics, color, flavor, and biochemical composition are collectively termed "rice aging" [61]. The interaction among grain structure, surrounding air, and storage parameters result in shifts in moisture content, kernel temperature, and intergranular relative humidity. Together, these conditions shape the storage atmosphere in which the equilibrium moisture content of rice grains may fluctuate [62]. Moisture equilibrium, or hygroscopic balance, occurs when the grain’s water content reaches a steady state corresponding to the relative humidity of the surrounding air at a specific temperature. The equilibrium moisture content (EMC) is established when the water vapor pressure within the grain becomes balanced with the vapor pressure of the external atmosphere [63]. An increase in air temperature reduces the rate at which moisture is released from the grain, suggesting enhanced resistance to the movement of heat and water vapor from the kernel core to its outer surface [64]. Variations in equilibrium moisture content (EMC) throughout storage may result in grain degradation and quantitative losses due to the interplay of physical, chemical, and biological mechanisms. Elevated temperature and moisture within the grain bulk enhance respiratory metabolism, and the rate of these processes is largely governed by the prevailing storage environment [60]. Increased respiration during storage reduces grain viability and alters its physicochemical quality. Heat and moisture exchanges occurring between the grain bulk and intergranular atmosphere promote quality deterioration and lead to elevated CO2 concentrations [59]. Storage induced structural modifications, including enhanced lignification and cell wall reinforcement, impede starch gelatinization [65]. These alterations collectively degrade the nutritional composition, cooking characteristics, and palatability of rice [66]. Moreover, variations in internal grain properties and environmental conditions affect physiological traits such as respiration rate and germinative capacity [67]. Of all the grain properties affected by storage parameters, germination potential exhibits the greatest susceptibility [68].

2.5. Quality Assessment of Rice Grain Techniques

Food quality and nutritional integrity play a central role in shaping consumer perception and market acceptance, and internal characteristics [69]. Key external attributes of importance include size, shape, color, shading, flavor, texture, gloss, firmness, and odor (Figure 4), along with the absence of visible defects, such as noticeable bruising [70]. The market offers a wide variety of rice types, primarily tailored to meet consumer preferences and specific cooking applications. Rice quality variations stem from a combination of genetic, environmental, and processing-related factors, such as cultivar type, cultivation method, postharvest treatment, milling procedure, storage condition, and preparation method [71]. Aroma and textural qualities are critical attributes determining rice quality that can impact the market value of rice and serve as primary factors driving consumer preferences [72]. Maleki et al. [73] demonstrated that among regular rice consumers, preferences for rice cooked with varying rice-to-water proportions were shaped by individual inclinations toward either a fluffy or sticky texture. Given the fluctuating market valuation of rice production, ongoing monitoring of its quality assessment, authenticity verification, and contamination detection is essential [20]. Rice quality evaluation can be conducted based on physical grain characteristics, milling efficiency, chemical composition, and cooking behavior [74]. The physical properties of rice grains comprise external aspects (e.g., dimensions, geometric shape, surface smoothness, and color) and internal factors such as mass, kernel hardness, bulk volume, and flow dynamics. These parameters are critical throughout the entire process, from harvesting and encompassing the entire post-harvest value chain for quality end-use [75]. In addition to morphological characteristics, the chemical composition of rice encompassing protein, moisture, and amylose contents together with functional attributes like gelatinization properties, plays a crucial role in determining overall grain quality [76]. The marketability and consumer acceptance of paddy, according to commercial standards, are largely influenced by milling performance, including brown rice yield, total milled rice recovery, and the proportion of unbroken kernels [77,78]. Grain shape in rice is quantified through dimensional attributes including length, breadth, and their proportional relationship (length-to-width ratio), parameters commonly applied in the classification and identification of commercial cultivars [78]. Chalkiness, characterized by an opaque white appearance in the endosperm, lowers head rice quality and reduces the head rice yield during milling. Moreover, rice cultivars with comparable grain appearances can display diverse cooking behaviors due to variations in their compositional constituents, especially amylose content, which impacts viscosity profile [79]. Rice varieties that have similar grain appearances may demonstrate distinct cooking behaviors due to variations in their chemical composition, primarily the amylose content, which influences viscosity profiles [80]. The establishment of efficient and rapid techniques for rice quality control holds significant promise for their deployment in screening varieties and in the milling industry.

2.6. Traditional Assessment Methods in Rice Milling

Milling Quality

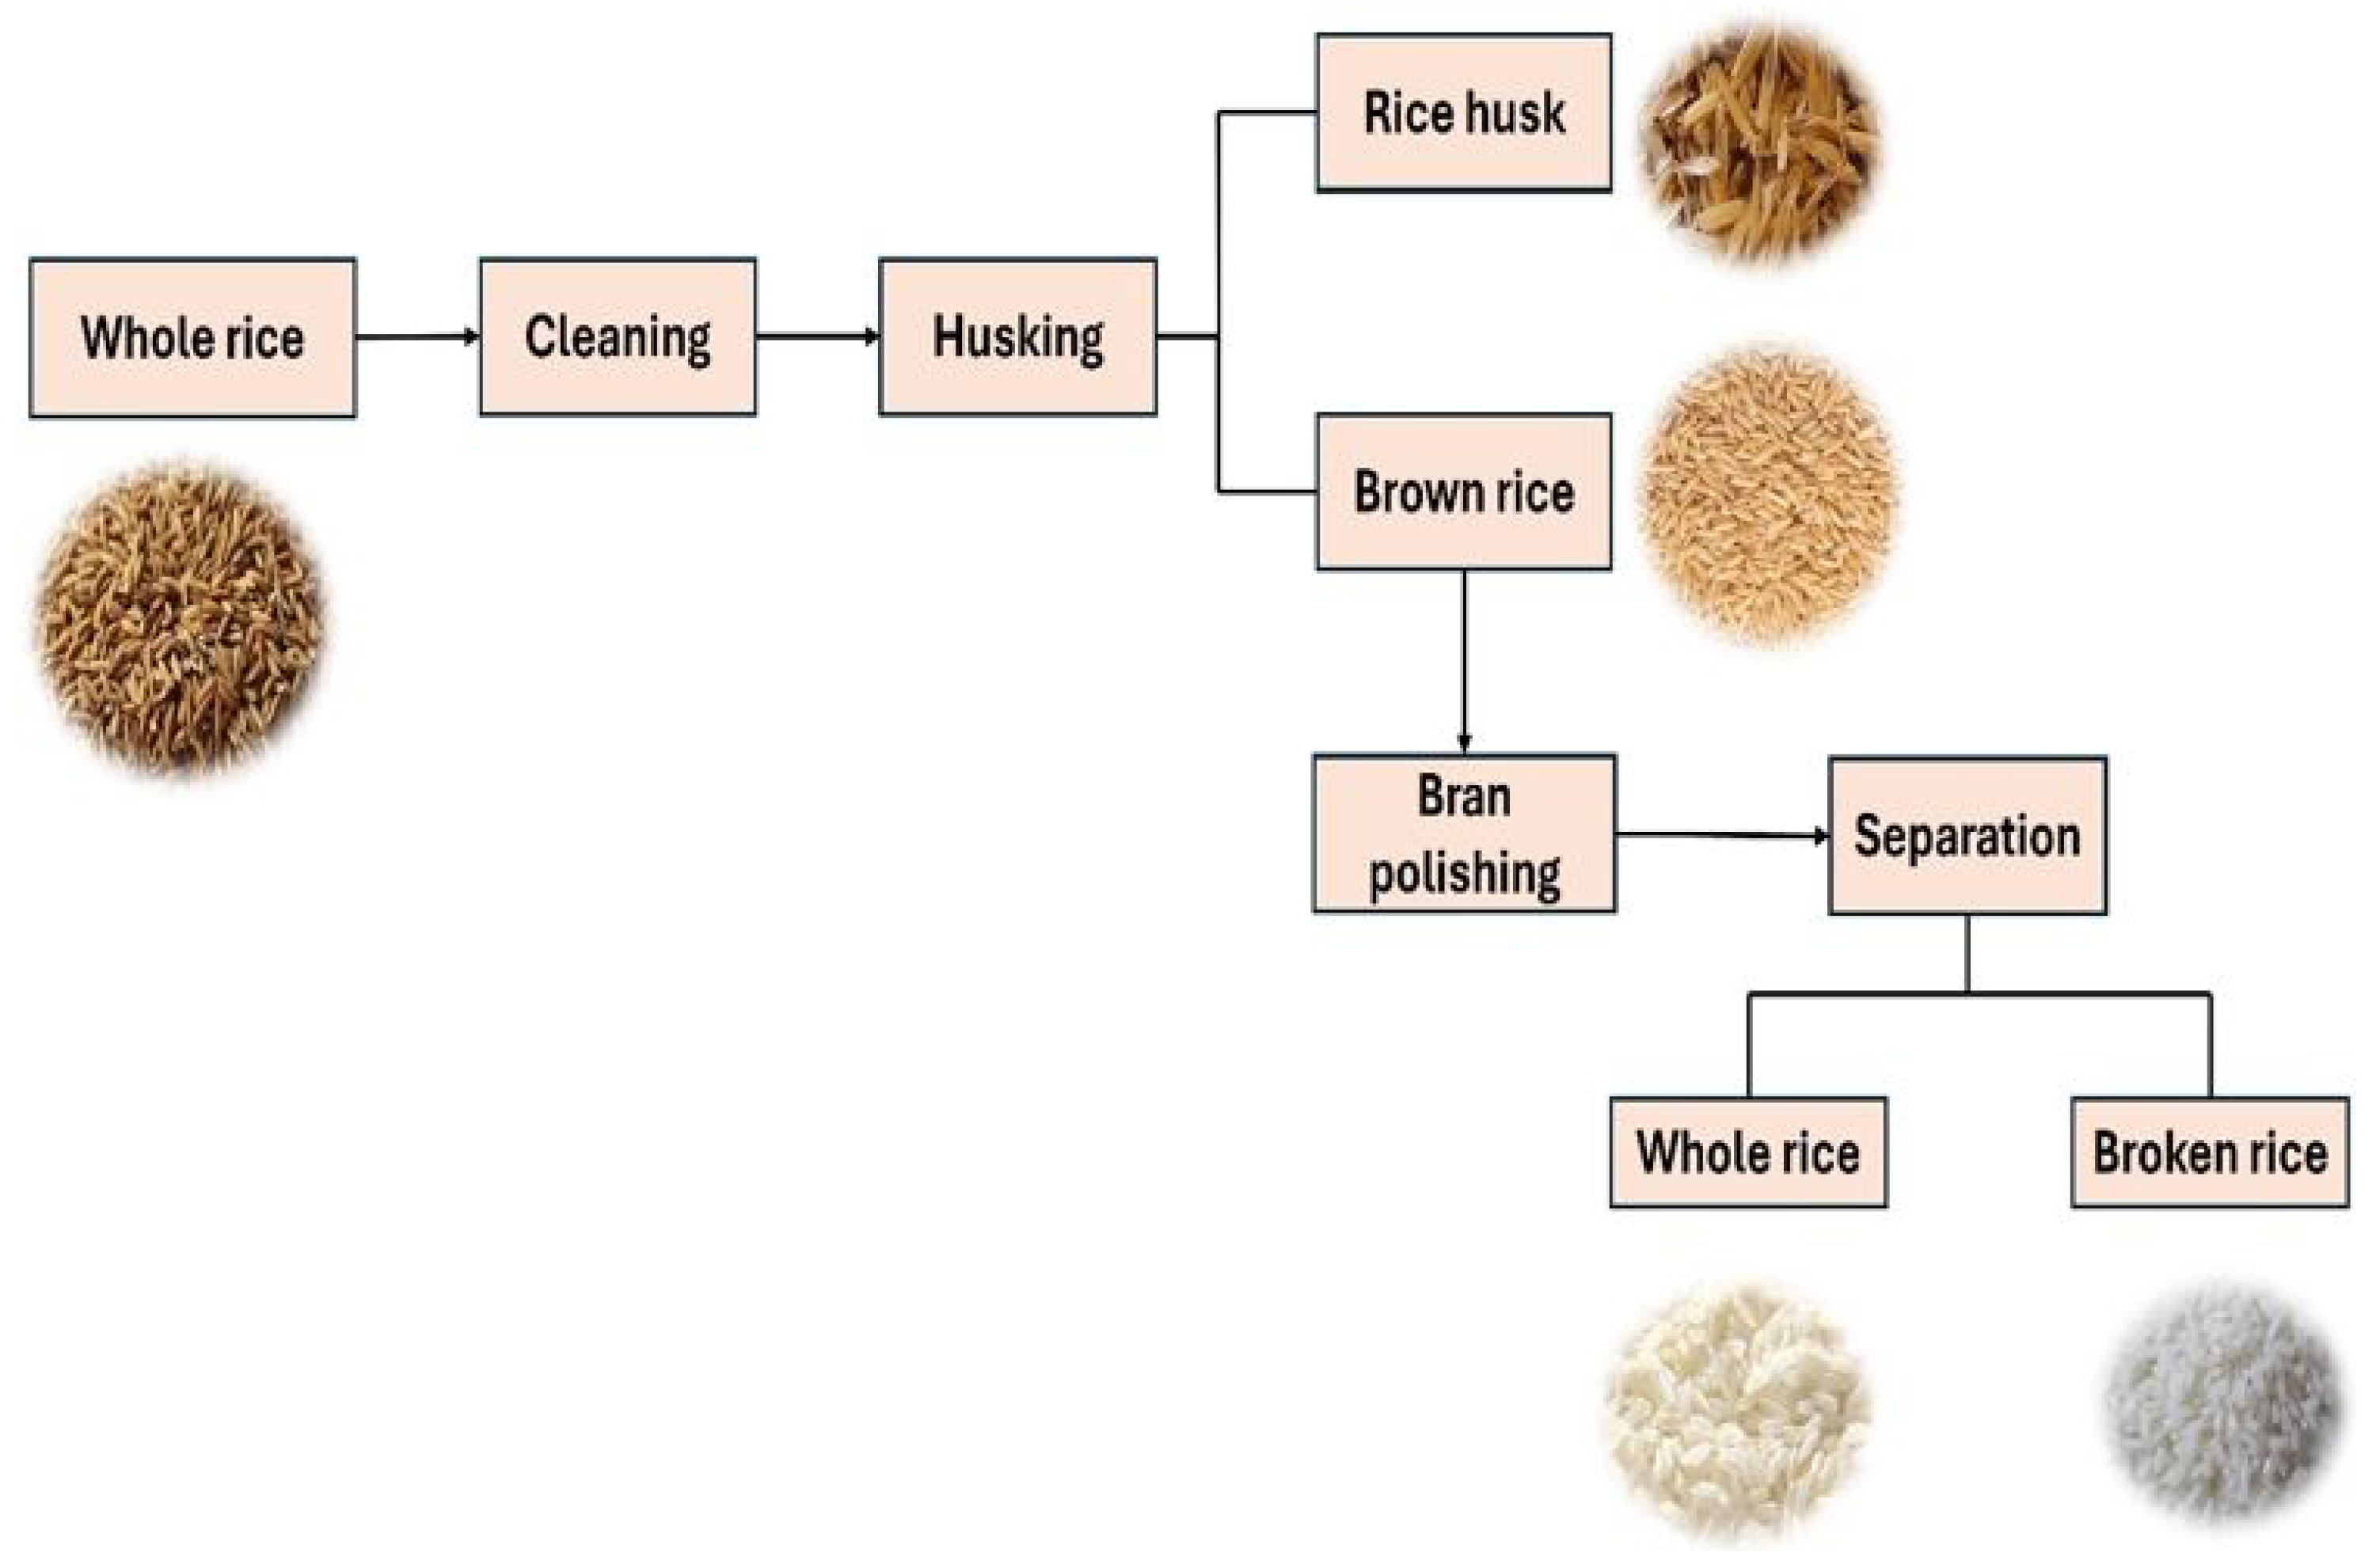
Operational faults and the adoption of non-standard processing techniques can induce fissures in rice grains during milling. This, in turn, elevates the proportion of broken rice and diminishes the overall product grade [81]. The study of rice’s physical properties is crucial for designing suitable processing machinery and establishing standardized procedures. This knowledge helps to minimize losses that occur during the milling process [82]. Milling yield refers to proportion of total milled rice and head rice obtained following the milling of a defined quantity of rough rice [83]. The milling process begins with cleaning raw paddy to remove impurities such as leaves, straw, and other foreign materials [84].
This step is followed by dehulling, which separates the outer husk from the grain, and a secondary cleaning to clear away any residual hulls from the brown rice. Subsequently, the brown rice undergoes polishing, after which broken kernels are separated from the whole grains. Milling yield is then evaluated through established equations that quantify milling performance from the initial rough rice [74].
Brown rice count ( % ) = wt of brown rice wt of rough rice × 100 %
Hulls ( % ) = wt of hulls wt of rough rice × 100 %
Total milled rice ( % ) = wt of total milled rice wt of rough rice × 100 %
Head rice count ( % ) = wt of total milled rice wt of brown rice × 100 %
Degree of milling % = wt of total milled rice wt of brown rice × 100 %
Typically, rough rice contains 20–22% hulls, with literature reporting variations ranging from 18–26%. Bran and embryos add an additional 8–10%. Out of every 100 g of paddy, about 70 g of polished rice and 20 g of fragments are generally obtained, giving an overall head rice yield of roughly 50%. However, earlier studies have indicated that the recovery rate of head rice typically ranges from 25% to 65%, depending on varietal and processing factors [50,75].

2.7. Physical Properties Assessed

In certain countries, consumers link sensory quality to the dimensions of rice kernels, emphasizing the significance of this trait across the entire rice industry. Various sectors within these industries utilize measurements of dimensional attributes (length and width) of rice kernels to evaluate rough, brown, and milling percentage to assess this attribute [75]. Table 1 and Table 2 outline the criteria for kernel length, length-to-width ratio, and grain weight used by IRRI breeders as key selection parameters in the development of new rice cultivars [85]. Grain boldness is sometimes described as an additional characteristic for rice cultivars. However, these criteria are neither intended nor capable of capturing all possible size and shape variations found globally. Other rice-trading countries apply different standards when defining kernel dimensions [86].
Food companies typically consider the dimensional traits of milled rice grains in their procurement standards, as milled rice represents the principal commercial product for producing value-added rice goods. The dimensions can be determined manually by aligning 10–20 filled kernels in a straight line and measuring them with calipers or a ruler. To expedite this process, various forms of image analysis are also employed. Beyond basic dimensional parameters, additional kernel traits such as surface area-to-weight ratio can be evaluated. This metric captures a broader range of morphological variation than basic dimensional measures and has been linked to differential water absorption and cooking characteristics [87].
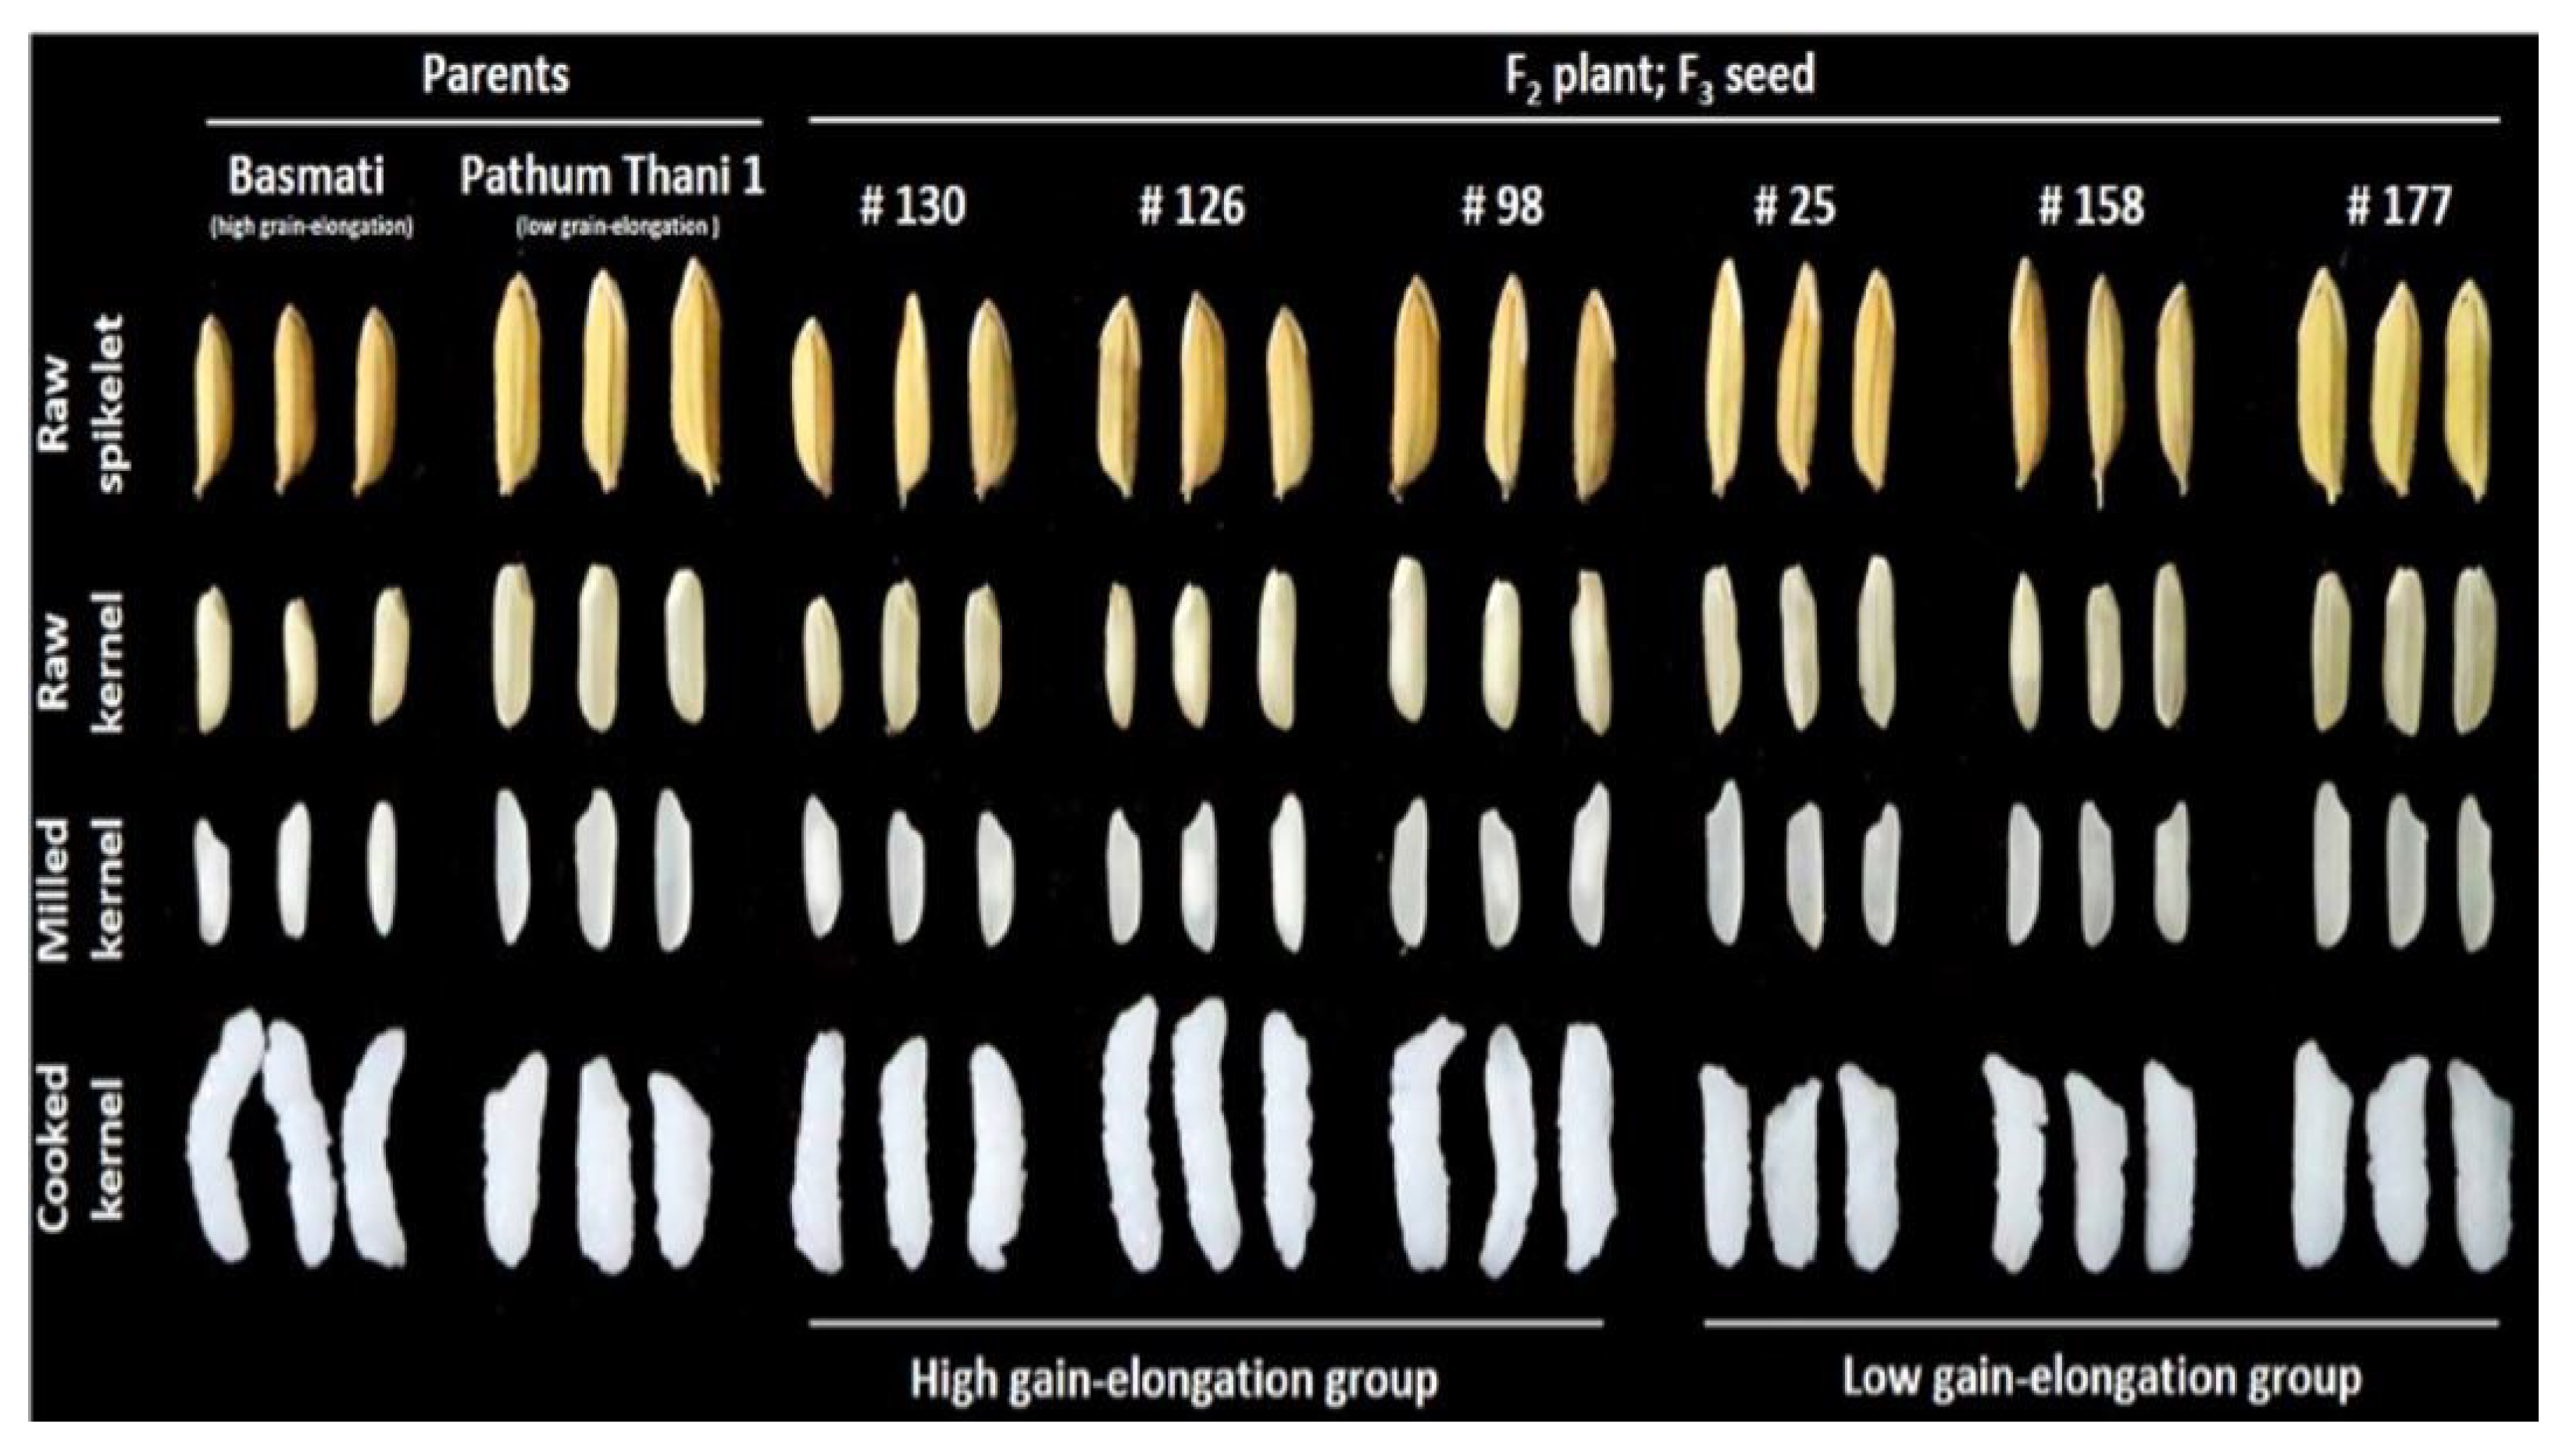
The categorization of rice grains based on their physical traits including length, width, and chalkiness plays a crucial role in determining the cooking quality of milled rice, as presented in Figure 5. The calculated S value, which reflects grain shape, allows for the systematic classification of rice into separate size categories: superfine, fine, medium, and coarse. Genetic loci associated with grain length and width have been discovered, and several of the corresponding genes have already been cloned [88,89]. Various genotyping methods utilizing molecular markers have been applied to identify these mutations within breeding populations. For example, the DRR-GL marker system offers a rapid and efficient approach for detecting the functional variation in the GS3 gene [90]. A more detailed characterization of rice kernel morphology, beyond simple length and width measurements, is required to enhance the scope of the genetic regulation of grain shape. Yin et al. [91] categorized grain shape traits into several dimensional parameters, including grain length, grain width, length-to-width ratio, grain area, and roundness. In comparison to earlier studies, these authors identified six previously unreported markers linked to the measured parameters of kernel dimension. Although progress has been made in understanding the genetic regulation of kernel morphology, comprehensive identification of genetic markers linked to all kernel traits remains incomplete for use in rice breeding programs.

Grain Color

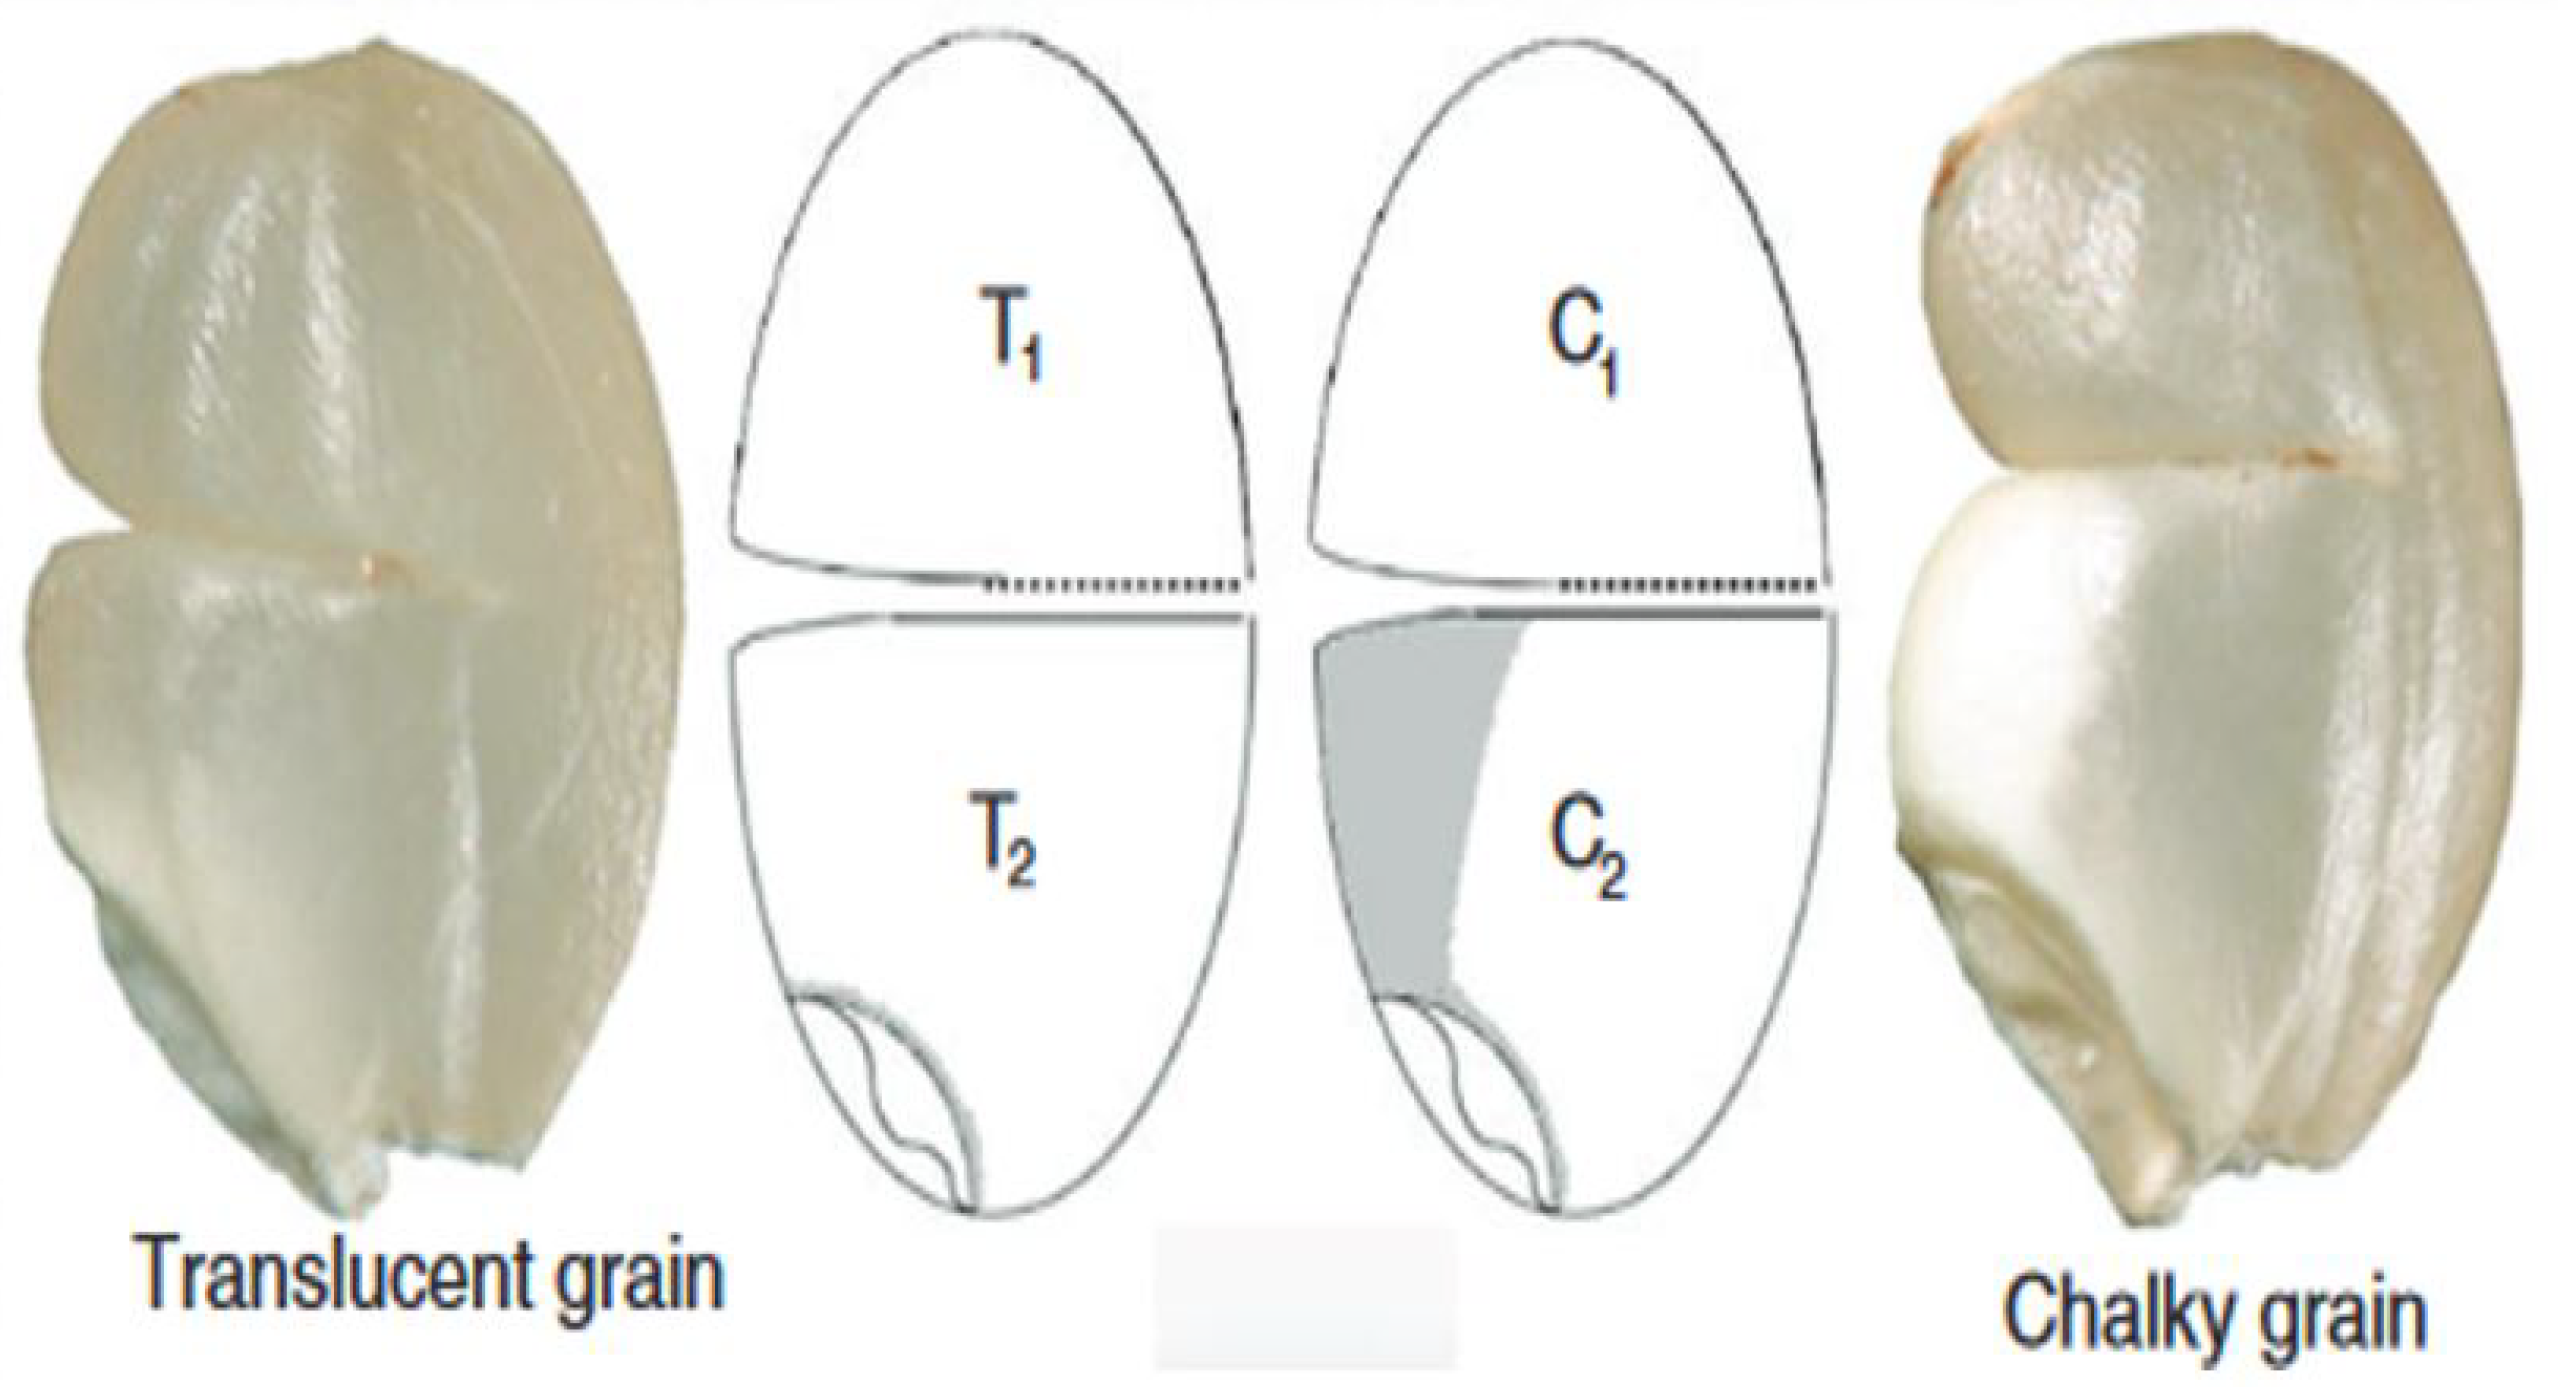
Rice appearance is a vital attribute influencing consumer preference and breeding strategies for new varieties. Traits like grain color are important not only for market appeal but also in the engineering of processing equipment such as separators, dryers, and storage systems. Chalkiness, identified by white opaque patches on the kernel, may range from small localized spots to full-kernel coverage (Figure 6). The occurrence of this characteristic has been documented in all major grains [93]. The rice industry generally favors kernels with high translucency and minimal chalkiness, with the primary exceptions being waxy rice, known for its complete opacity, and Arborio rice, which typically contains a chalky core. Chalkiness in rice kernels impacts key physical characteristics and functional performance of the grain [94]. The expression of chalkiness in rice kernels is influenced by genetic makeup and environmental conditions, prompting breeders to eliminate this trait through successive selection cycles [95]. Methods for assessing chalkiness vary. Quantify of the percentage of kernels with any chalk presence, others report those exceeding a defined chalk threshold, while additional approaches classify kernels based on chalk location such as ventral side, white core, and dorsal streak [96].
Chalk content is most commonly assessed through subjective visual evaluation of kernels positioned on a light box; however, some breeding and research programs now employ digital imaging techniques for a more objective quantification of chalk levels [97]. In addition to low chalk content, consumers generally prefer rice kernels with a high degree of whiteness. Kernels exhibiting any colour deviation from white are typically regarded as lower quality. This includes rice with inherent greyness or discoloration caused by factors such as stink bug damage or kernel smut [98]. For a given cultivar, extended milling duration leads to increased kernel whiteness due to greater bran removal. In general, as the degree of milling increases, kernels across all cultivars exhibit enhanced whiteness. However, certain hybrid varieties achieve higher whiteness and reduced yellowness at lower milling degrees compared to compared with numerous standard U.S. long-grain cultivars cultivated under similar conditions [99]. Rice kernel whiteness may be evaluated quantitatively using devices like the Satake Milling Meter or Kett Whiteness Meter. In addition, the coloration of head rice can be determined through colorimetric methods or digital imaging systems, as discussed in the next section [100].

2.8. Non-Destructive Techniques for Rice Quality Assessment

2.8.1. Machine Vision

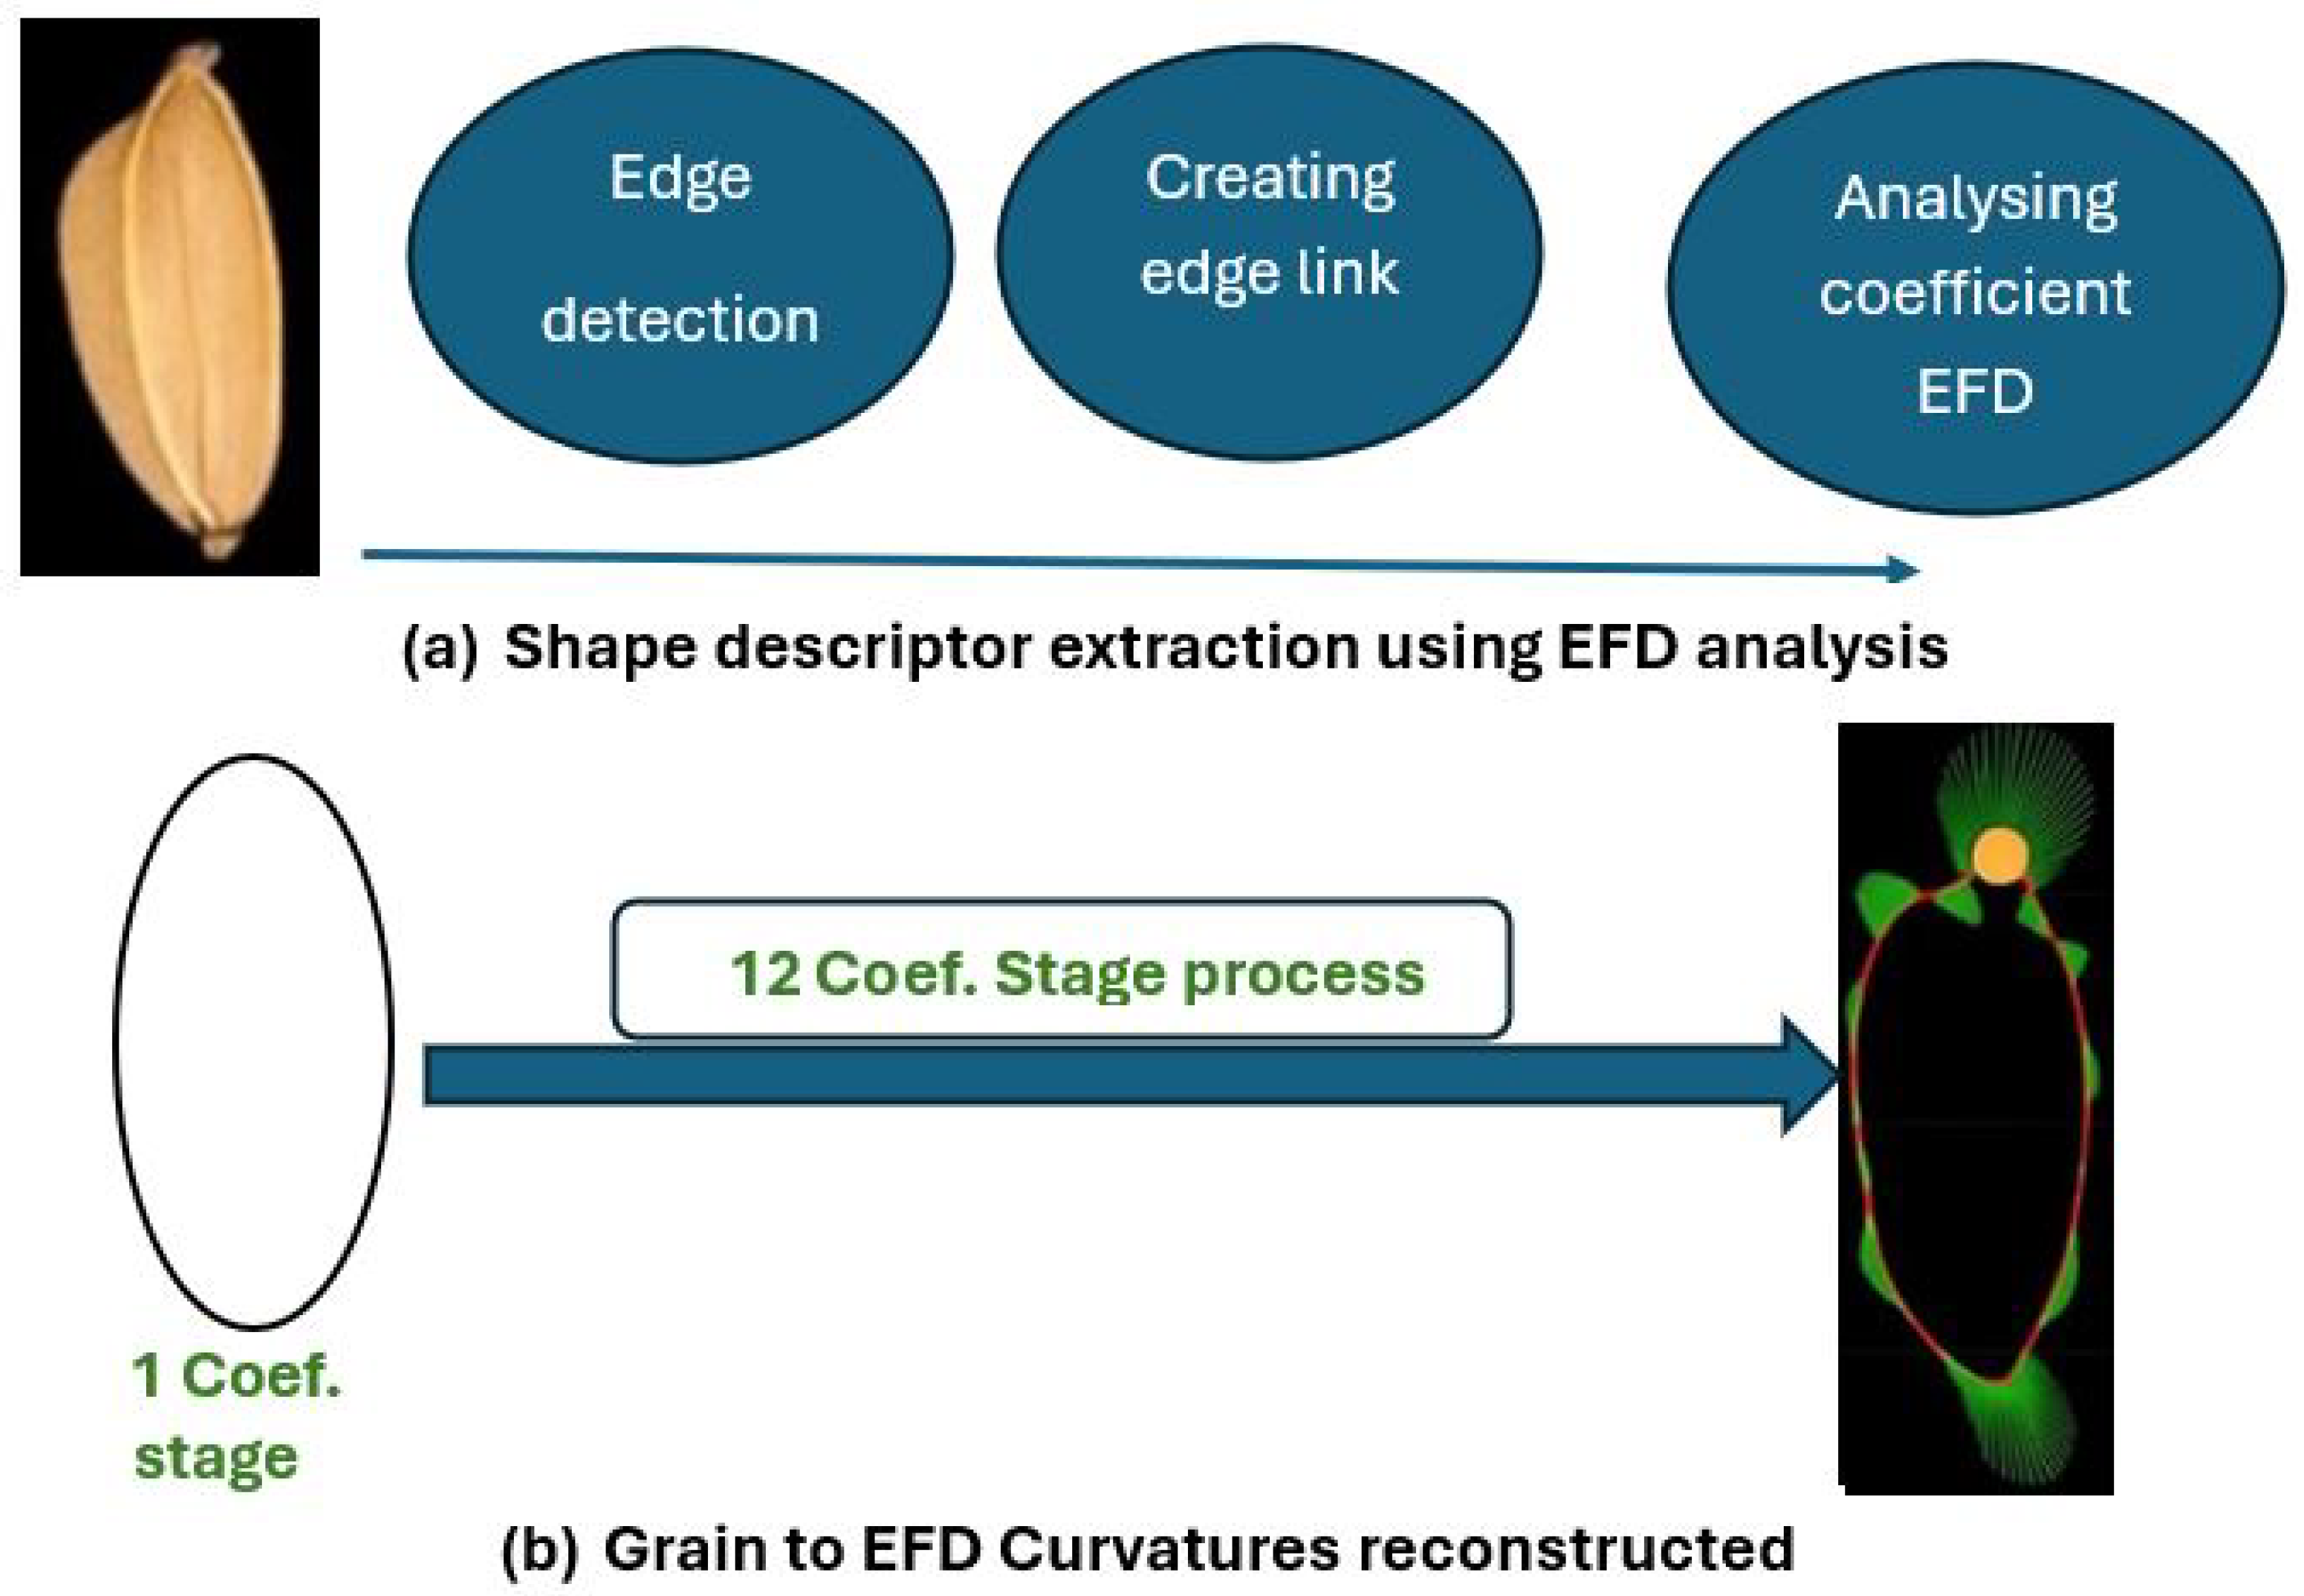
Machine vision, a non-invasive, accurate, and time-efficient technique [101], has shown strong efficacy in assessing the quality of crops and food products [102]. A standard machine vision system consists of four key components: an illumination source, an image sensor, a lens, and a computer equipped with a frame grabber or digitizer for image acquisition and processing [103]. Most systems operate within the visible light spectrum (380–780 nm), allowing for seed identification and grading based on external attributes like size, shape, color, and texture [104]. Machine vision is increasingly applied in food quality assessment, offering an affordable, hygienic, and consistent method [105]. Applications in shape classification, defect detection, and quality assessment are common, with geometric methods often focusing on rice morphology parameters like compactness, length, and axis ratios. Razavi et al. [106] used micrometer data and image processing to study the geometric properties of three Iranian rice varieties, finding that length, width, height, and projected area decreased with layer removal, while sphericity increased. Additionally, Singathala et al. [107] developed a quality evaluation technique for milled rice, utilizing filtering, segmentation, and edge detection to extract shape features, followed by length and breadth analysis to assess rice quality. Vu et al. [108] method for inspecting rice varieties based on geometric and morphological characteristics was proposed. An image containing 48 rice kernels was first segmented, and the individual seeds were normalized prior to extracting their features. The extracted features were then classified using the Adaboost algorithm, which showed superior performance compared to DT and RF classifiers as shown in Figure 7 and Figure 8.

2.8.2. Spectroscopy

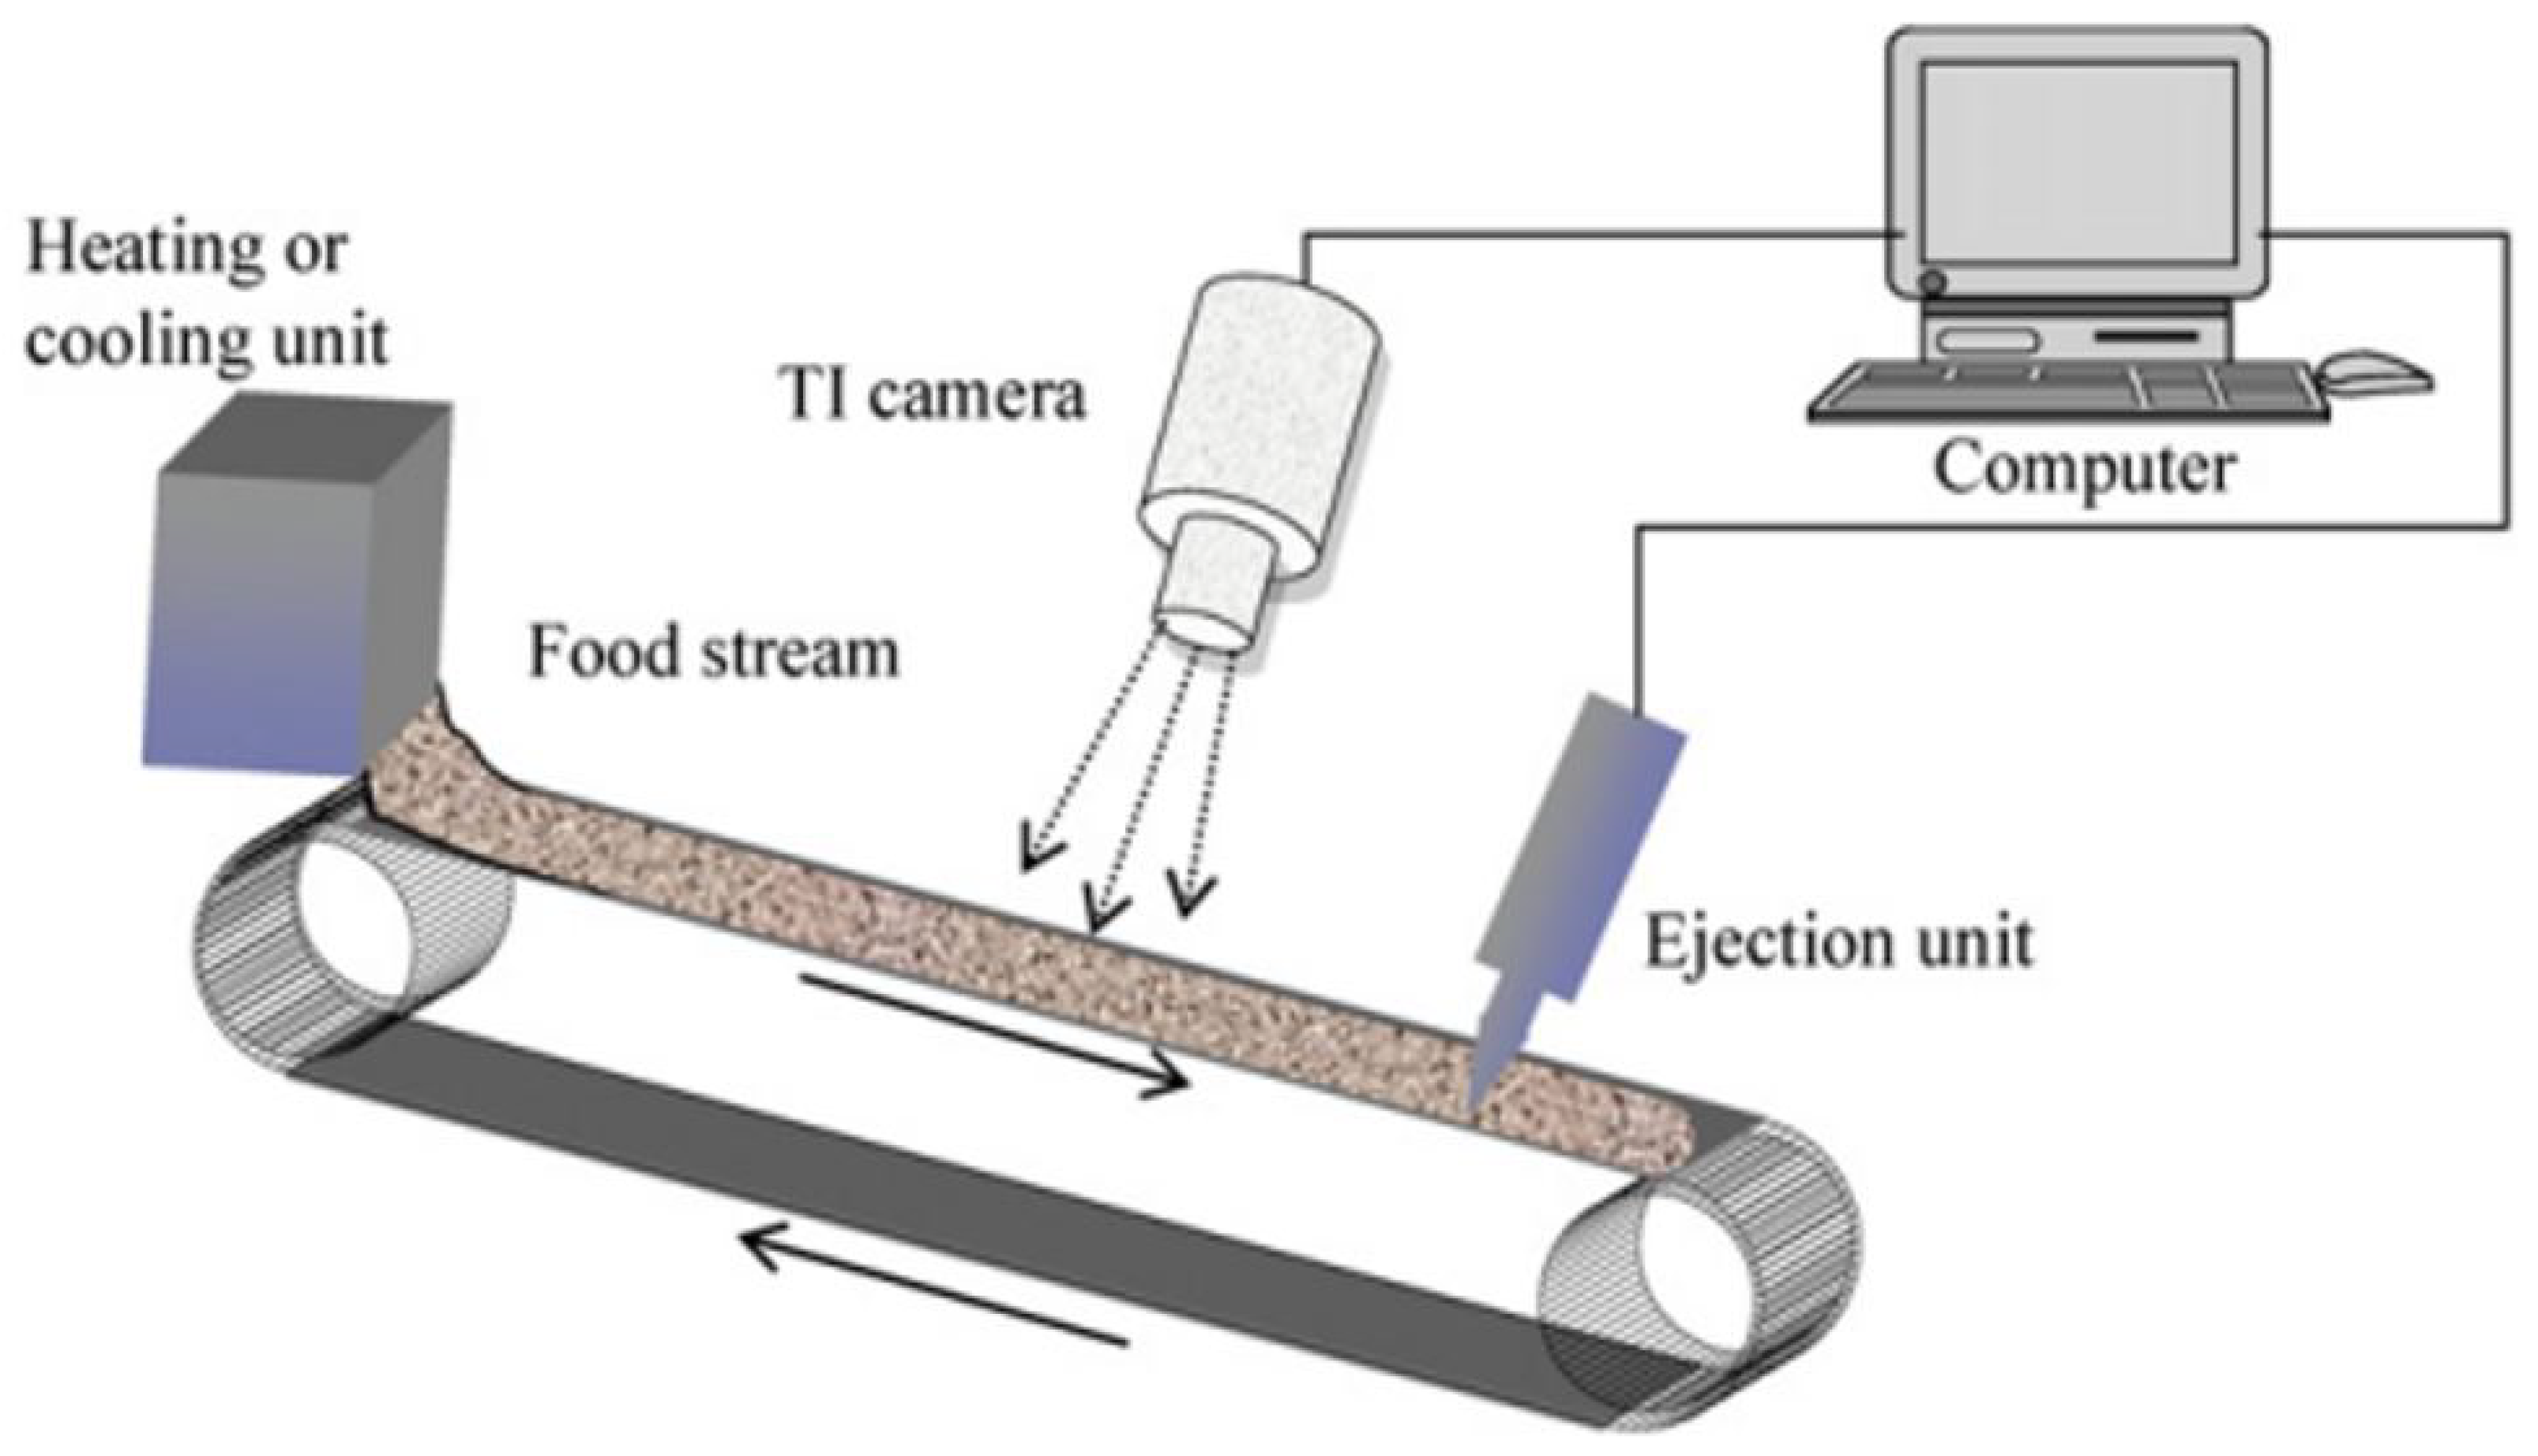
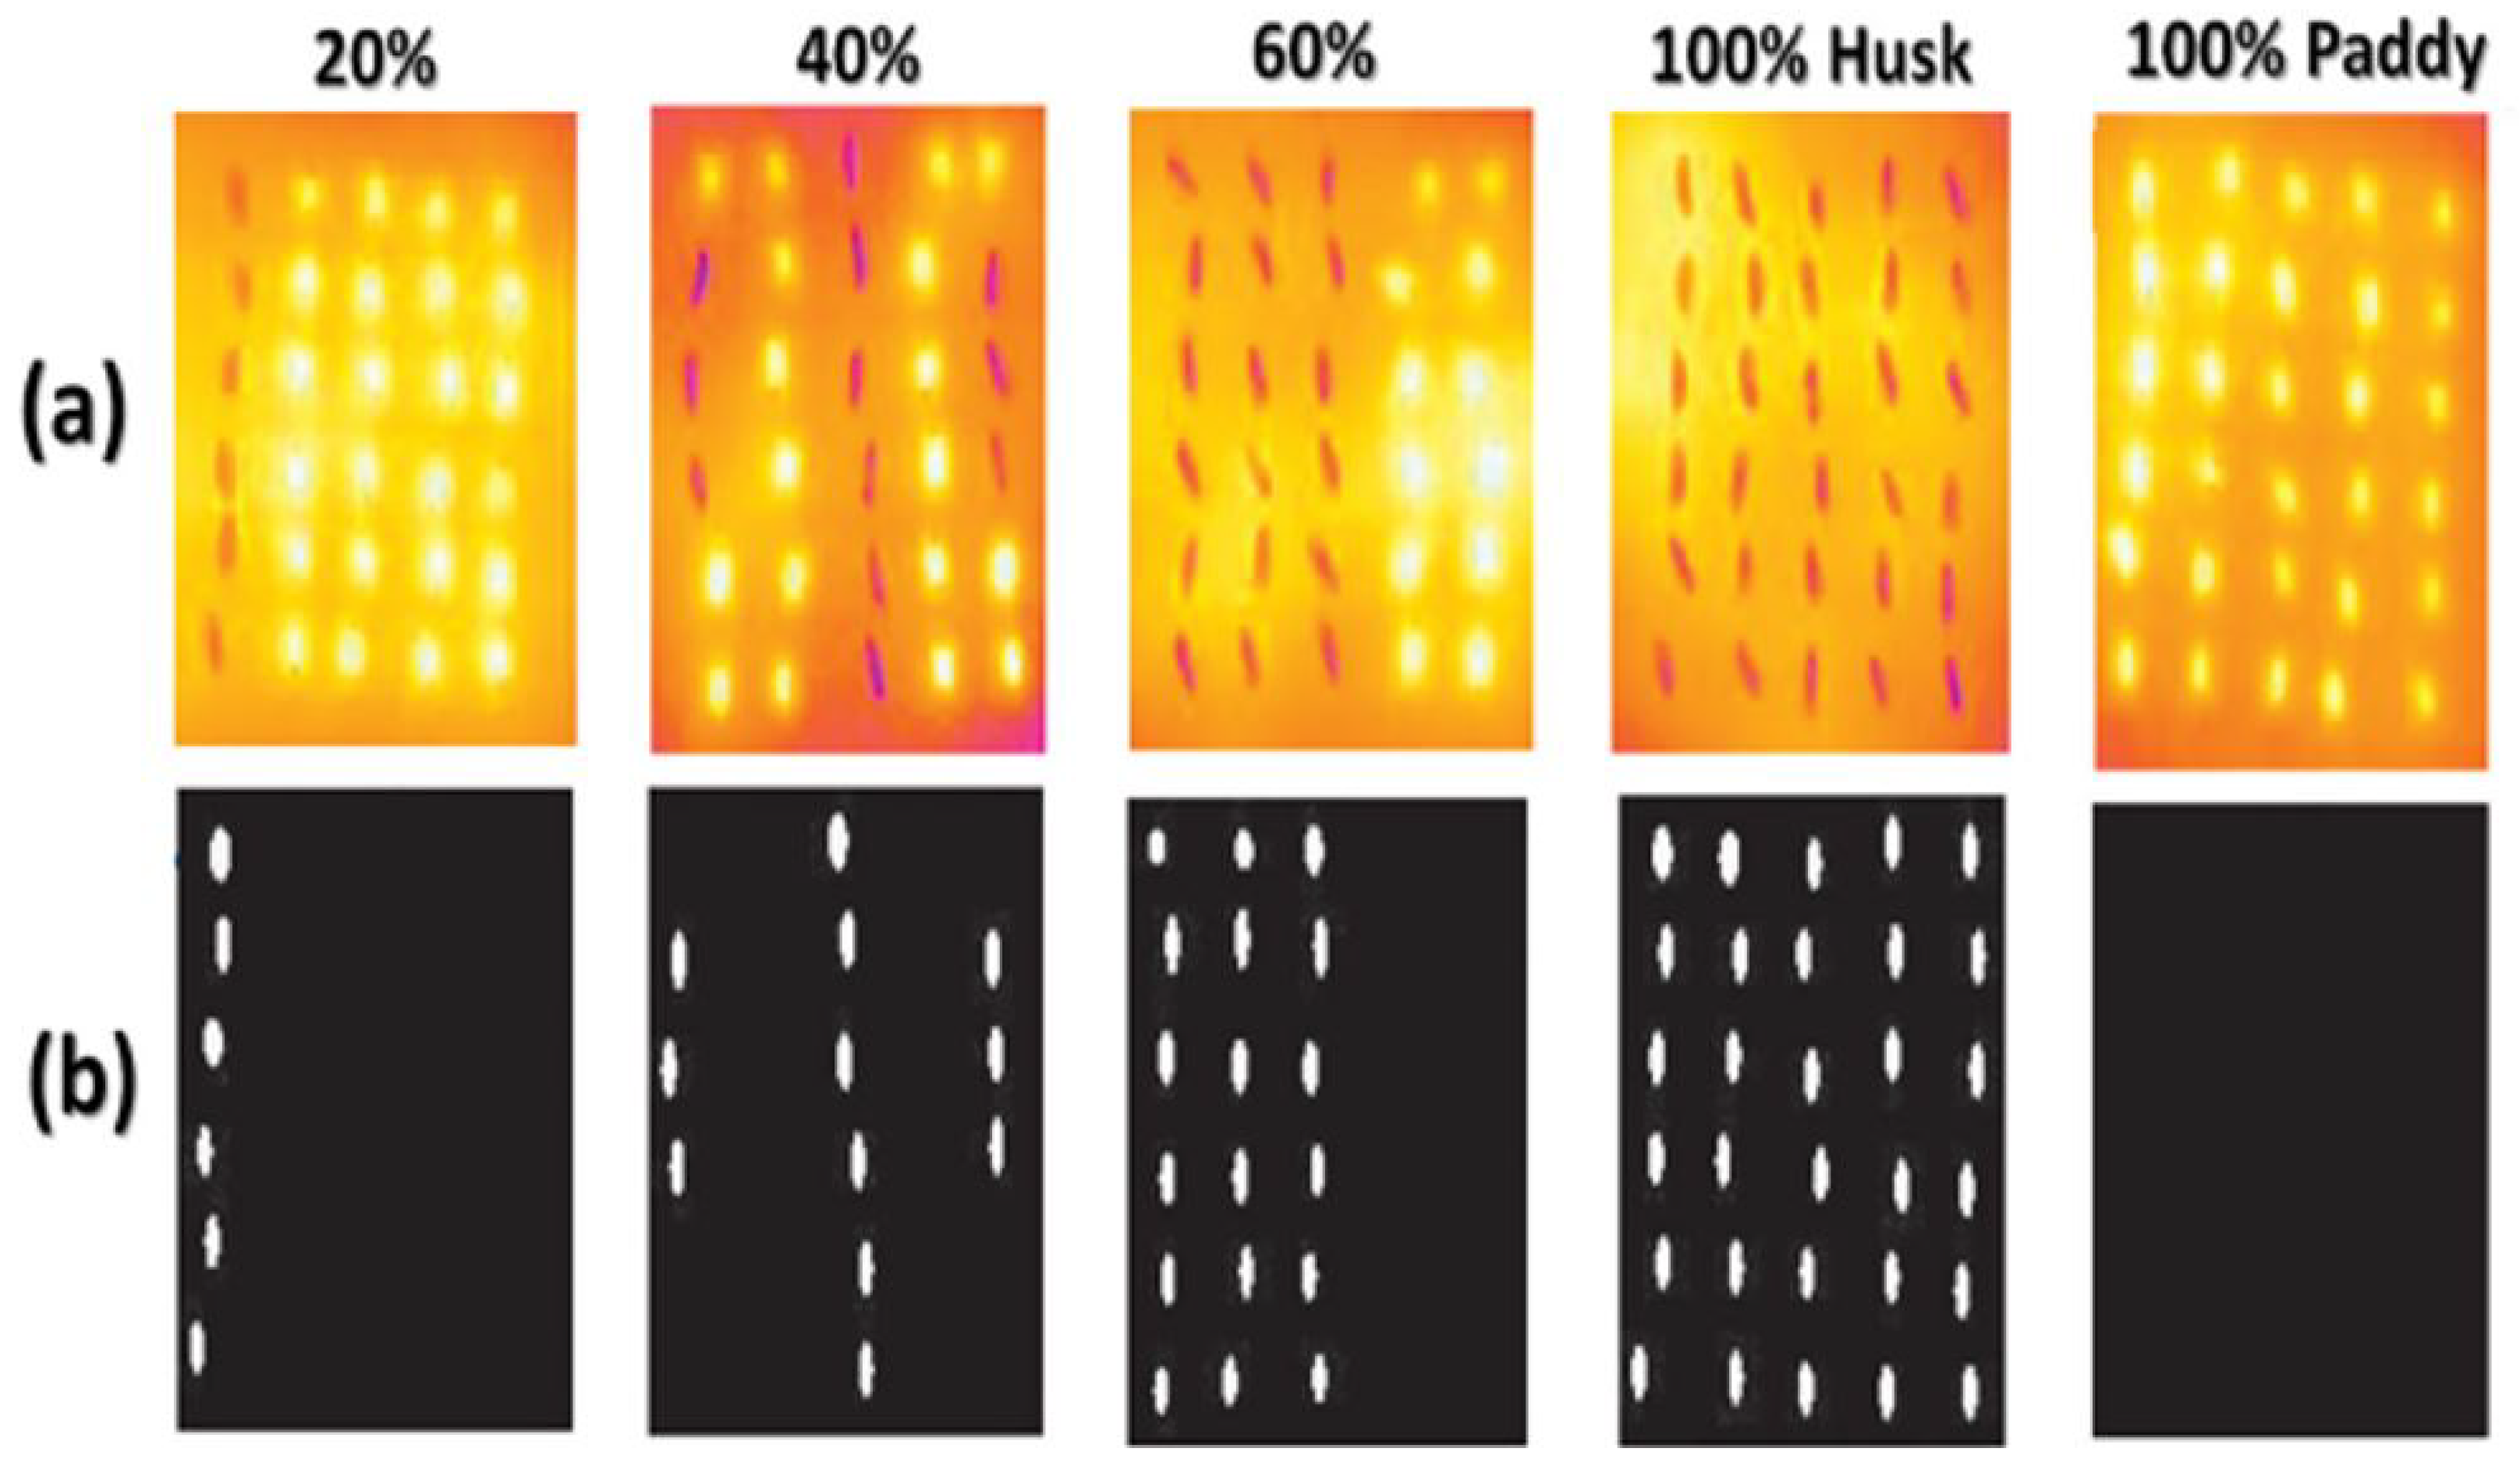
Spectroscopy analyzes and measures spectra generated when matter absorbs, reflects, or emits electromagnetic radiation. Various techniques such as near-infrared, mid-infrared, fluorescence, Fourier-transform infrared, and Raman spectroscopy, have been effectively applied as fast and sensitive methods for assessing the quality and authenticity of cultivated crop seeds [110]. Near- and mid-infrared spectroscopy utilize molecular overtones and combination vibrations to characterize chemical structures, while Fourier transform infrared captures infrared spectra, offering more comprehensive chemical information on samples than NIR [111]. Raman spectroscopy also supports agrifood analysis by identifying sample components such as lipids, proteins, and carbohydrates, even in small amounts [112]. NIR spectroscopy has been explored for rice quality analysis, with specific relevance to the analysis of moisture and protein composition detection. Ref. [113] reported a NIR scanning 33 wavelengths (825–1075 nm), achieving effective automatic predictions of protein and moisture content, with a prediction accuracy for protein content of R2 = 0.70, SEP = 0.24% in brown rice, and R2 = 0.76, SEP = 0.22% in milled rice. Ref. [114] applied NIR spectroscopy to differentiate Basmati rice from lower-value varieties using discriminant analysis on NIR transmittance spectra (850–1050 nm), which successfully identified all Basmati samples; however, the model exhibited a cross-validation error ranging from 8% to 20% due to limited sample diversity, suggesting a need for broader validation. Further studies have demonstrated the effectiveness of NIR spectroscopy in discriminating Basmati rice from lower-grade varieties [114]. Using NIR transmittance mode (850–1050 nm), 23 single grains from 116 samples were analyzed, with the calibration model developed from spectra of 62 bulk samples. Discriminant analysis outperformed PCA, successfully distinguishing all Basmati samples included in the study. Thermal imaging captures and converts an object’s thermal signature into visual format for contactless analysis and feature identification (Figure 8). This method enables high-resolution, two-dimensional surface temperature mapping, with data applicable in various ways [115]. In the agro-food industry, thermal imaging has become popular due to its minimally intrusive, contact-free, and high-throughput measurement capabilities suited to online applications [116]. Thermal imaging devices are designed for ease of use, provide accurate and repeatable temperature readings, and do not rely on additional illumination, distinguishing them from other imaging techniques [117]. Applications include assessing seed quality, detecting diseases, evaluating the degree of water deficiency in crops, monitoring soil moisture, and determining agri-food maturity [118]. Thermal imaging’s use for bruise detection in apples was first explored by [119], who monitored temperature changes in bruised apples through natural convection. Similarly, Jamil et al. [120] applied thermal imaging, with 0.05 °C thermal sensitivity in the mid-infrared range, to differentiate paddy husks by heating and cooling treatments on samples with varying husk content (20, 40, 60, and 100%) (Figure 9). Differences in heat transfer between seeds and husks produced notable surface temperature variations, with a 25-s cooling cycle yielding a high classification accuracy of 98.07% for husk identification.

2.8.3. Thermal Images of Paddy Seeds

Immature paddy seeds, which lead to low milling recovery, high breakage rates, inferior grain quality, and greater susceptibility to diseases in storage, are considered foreign materials and should be fully removed from batches. Ref. [122] applied thermal imaging to identify paddy seeds with varying foreign substance levels, maturity stages, and moisture content. Thermal videos were captured after heating and cooling the samples, and selected frames were analysed. Seed samples were segmented in thermal frames, and the average pixel values representing surface temperature were calculated as the sample’s thermal index. The study found a strong linear relationship (r2 = 0.896) between thermal index values and paddy maturity stage is shown in Figure 10.

2.8.4. Hyperspectral Imaging

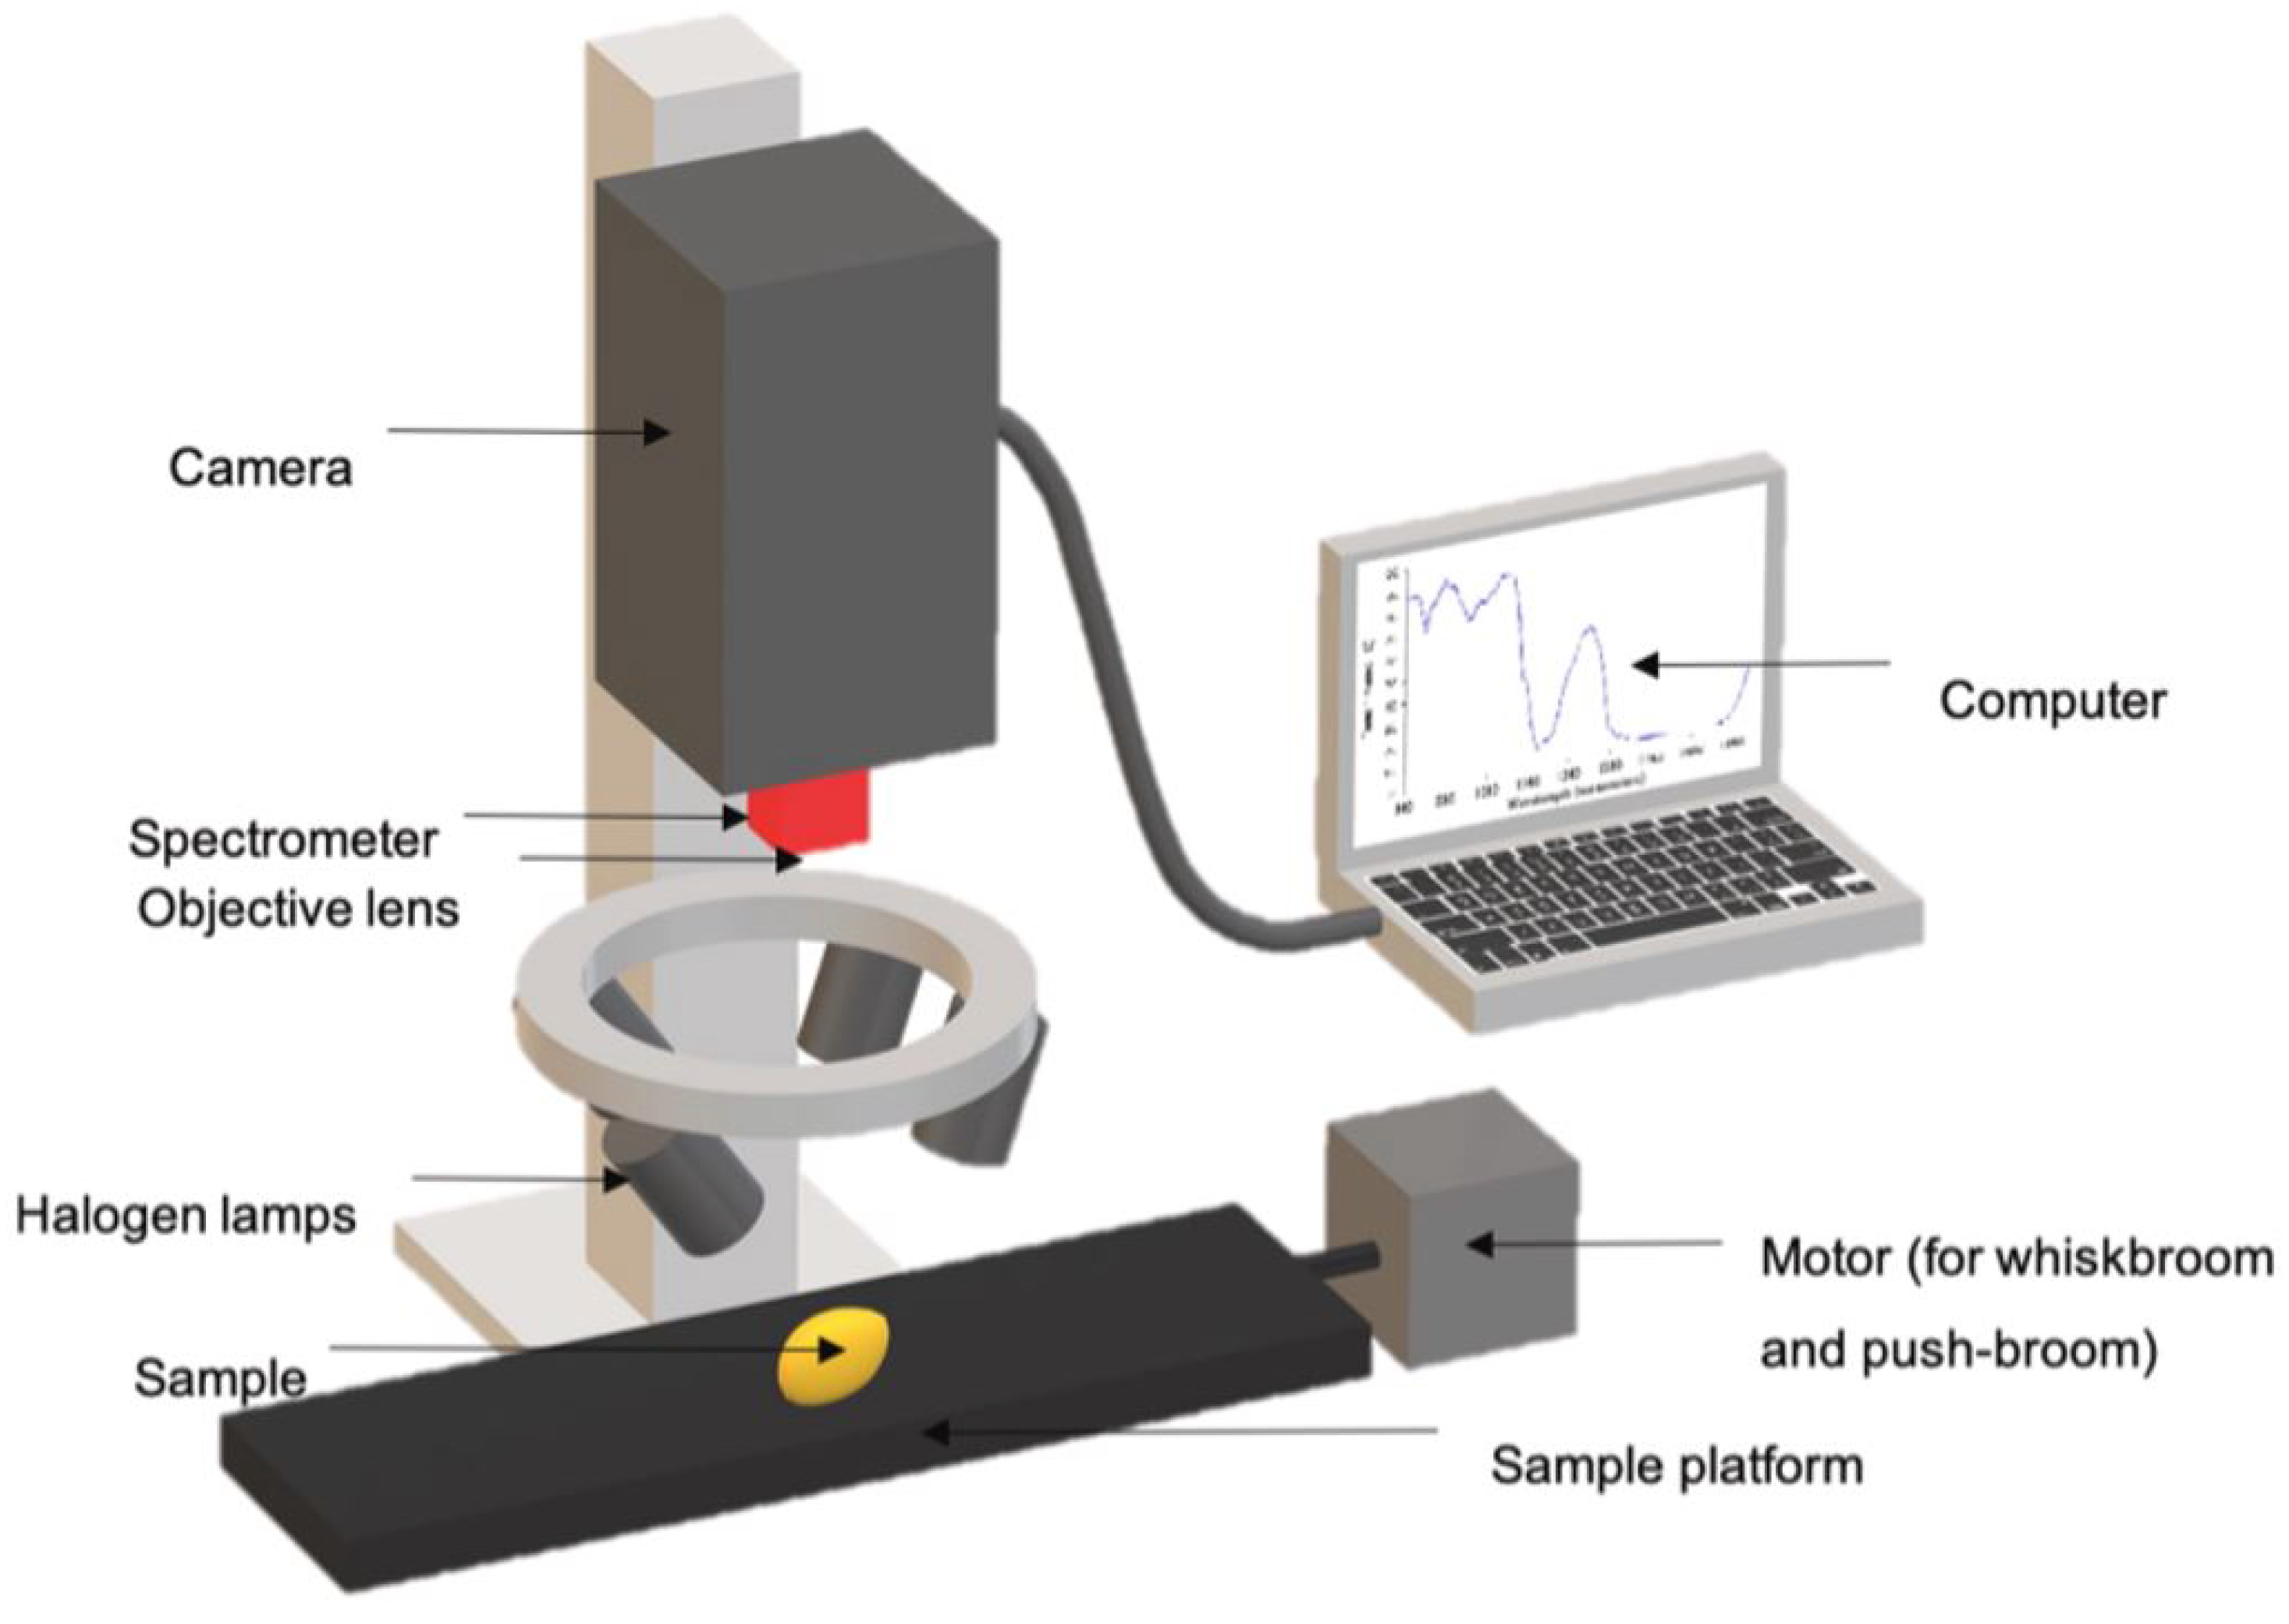
Hyperspectral imaging (HSI) has gained recognition as an advanced tool for assessing food quality attributes and verification of product authenticity by capturing both spectral and spatial data from samples [123]. A typical hyperspectral imaging (HSI) system generally comprises a light source, a CCD camera, a spectrograph, a conveyor belt, and a computer equipped with control software [124]. A schematic illustration of such an HSI system is presented in Figure 11. The light source is a crucial component of an HSI system, supplying illumination for the entire imaging setup. Halogen lamps, frequently used for this purpose, offer a stable and continuous spectrum spanning the visible to near-infrared (NIR) range [125]. Spectrographs commonly operate within the visible–near-infrared (Vis–NIR, 400–1000 nm), near-infrared (NIR, 900–1700 nm), and short-wave infrared (SWIR, 1000–2500 nm) ranges, while ultraviolet (UV, 220–400 nm) and mid-wave infrared (MWIR, 3500–5000 nm) systems are less frequently used in food and agricultural applications [123,124]. The spectrograph advanced optical design ensures high-quality, distortion-free imaging. Positioned in front of the CCD camera, the spectrograph enables spatial scanning to capture both image and spectral data of samples. The computer controls data collection, processing, and analysis, while also storing hyperspectral images for specific applications.
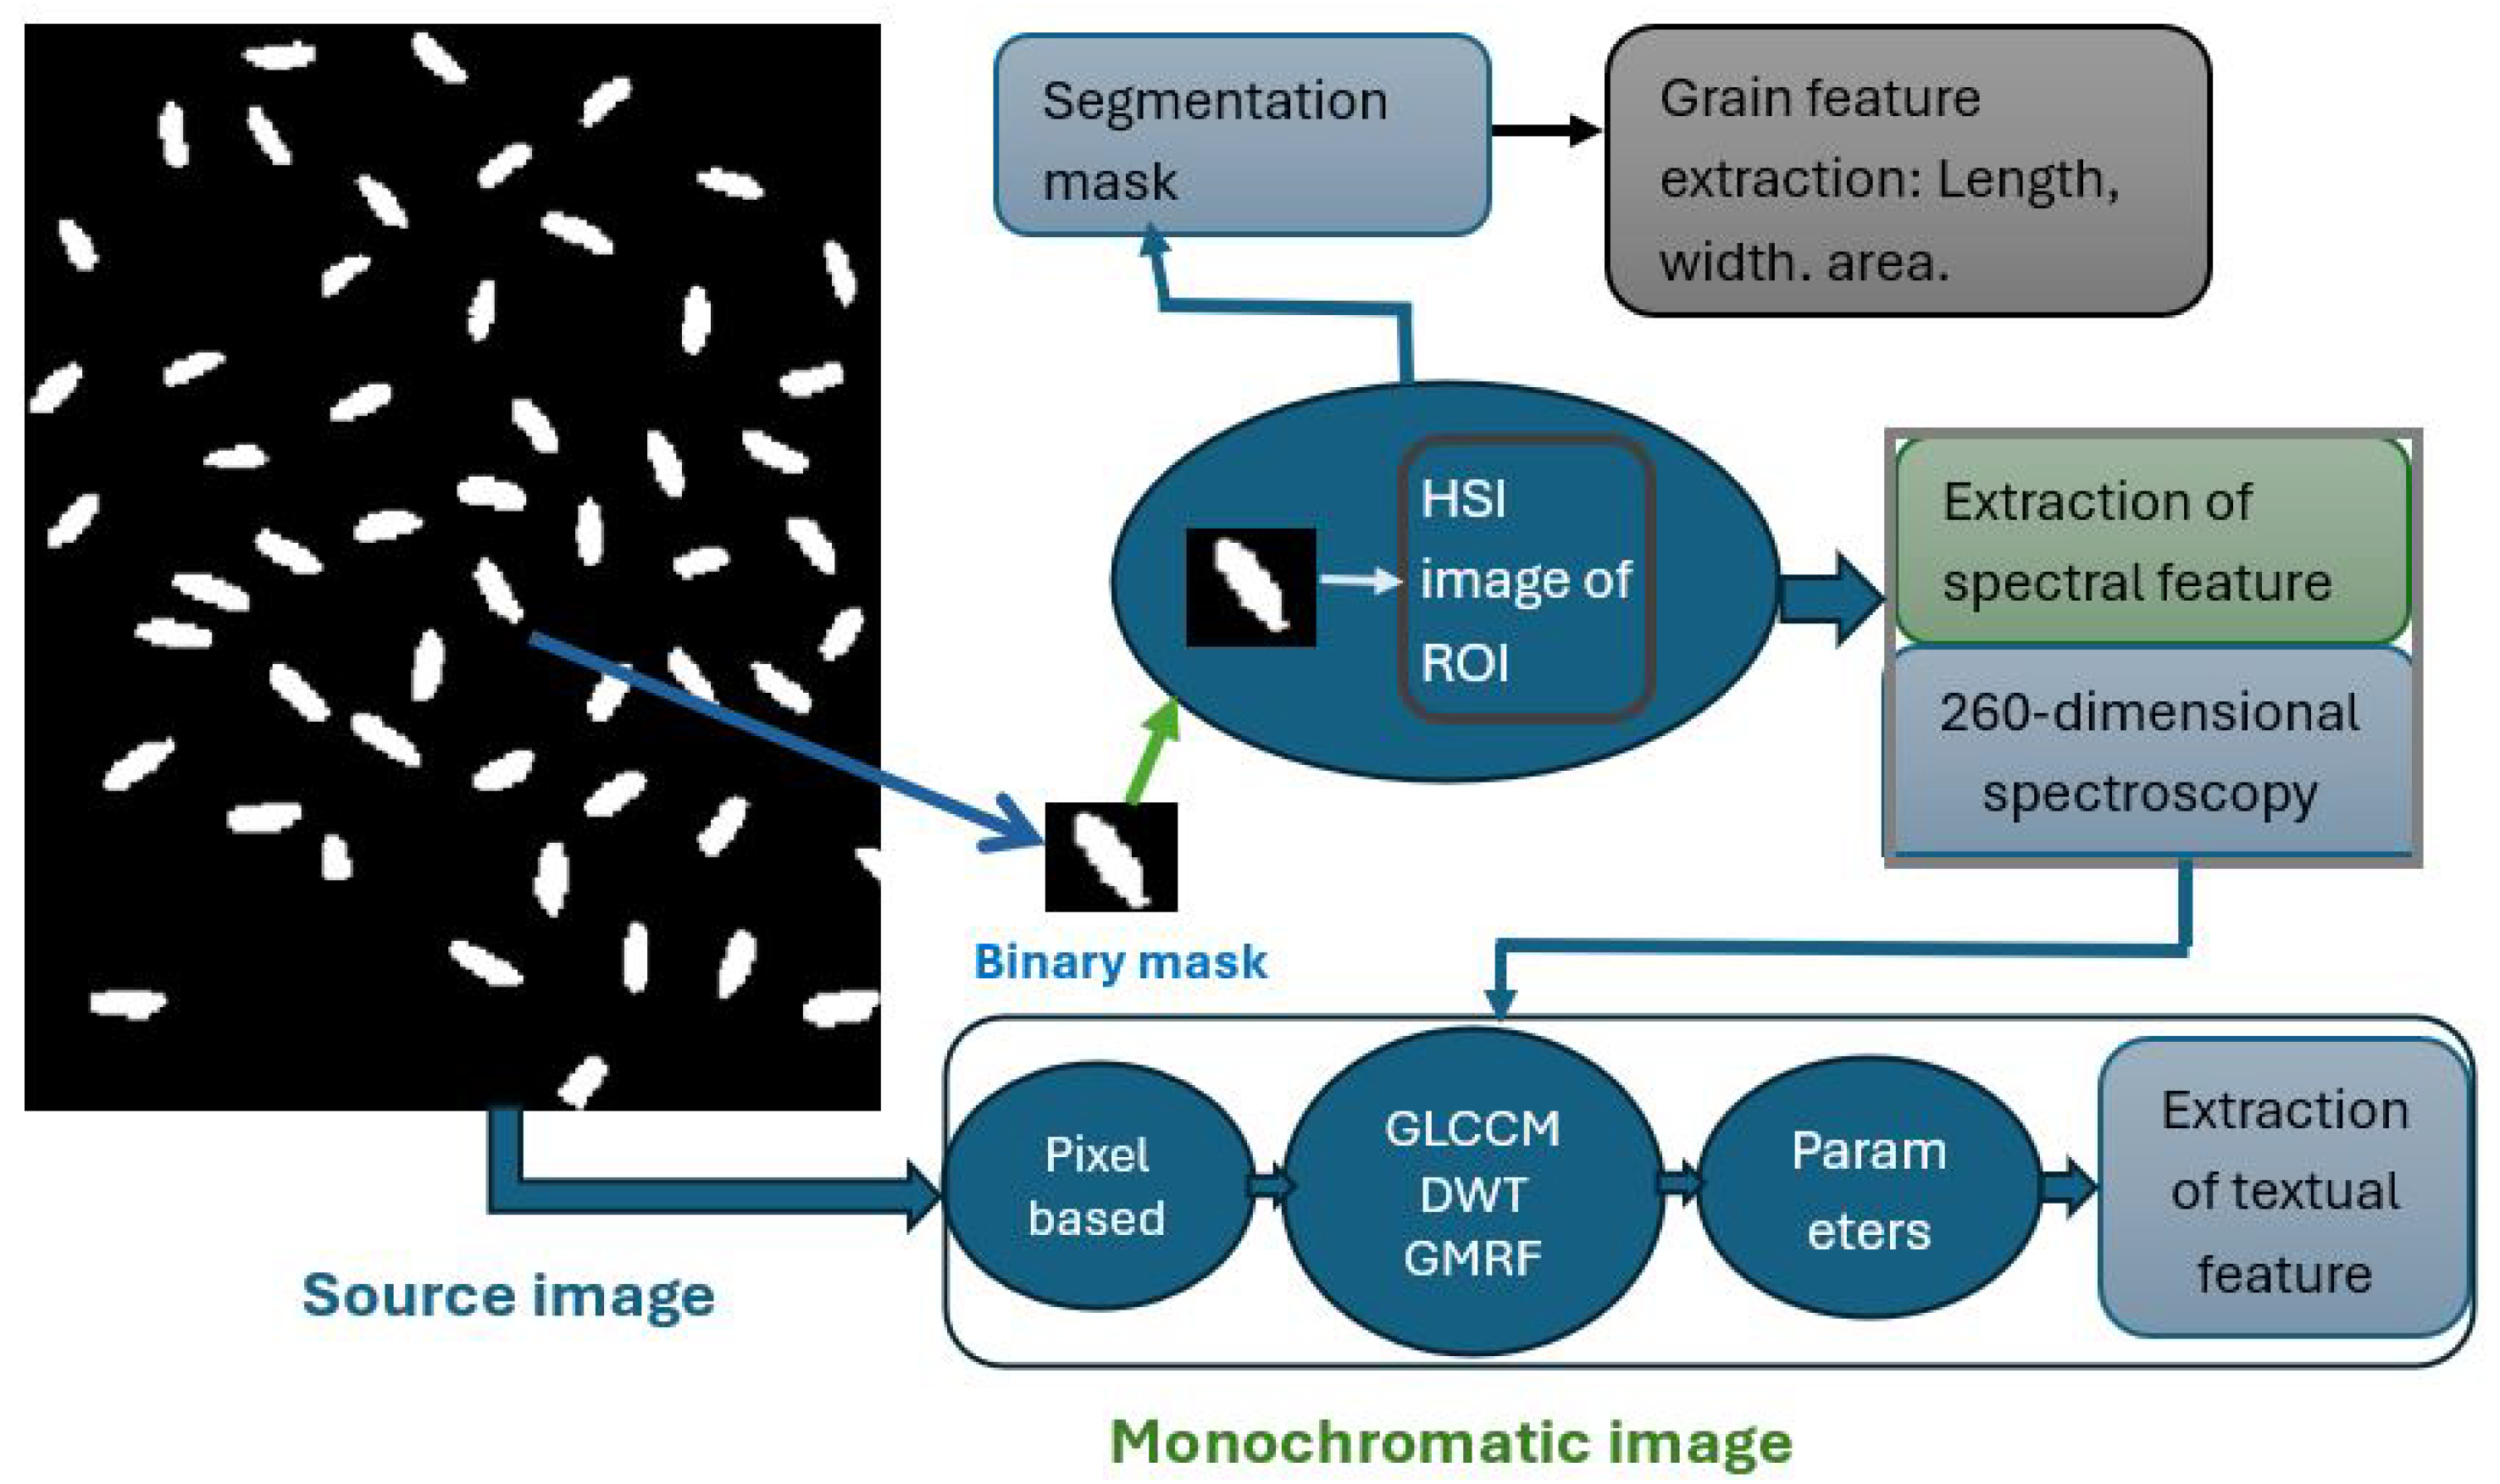
A key advantage of HSI is that it is non-destructive, allowing high-value products such as glutinous rice to remain intact. The technique can handle large throughputs quickly, delivering real-time or near real time quality information that supports rapid decisions to maintain standards and limit waste. Owing to its fine spectral detail, HSI reveals quality cues that conventional methods may overlook, improving accuracy in assessment, sorting, and classification [126]. Studies by Lin et al. [127] and Weng et al. [128] have shown HSI’s effectiveness in distinguishing rice varieties using advanced deep learning (Figure 12). Likewise, Sun et al. [129] demonstrated HSI’s capability in identifying various barley seed varieties, showcasing its versatility in agricultural monitoring. Deng et al. [130] used HSI (400–1000 nm range) to classify rice seeds from six short-grain varieties, achieving a 91.95% accuracy with a semi-supervised K-means clustering algorithm. Similarly, Wang et al. [131] used hyperspectral images (400–1000 nm) to assess paddy rice chalkiness and shape for cultivar discrimination with PCA and BPNN models, reaching accuracies of 89.2% and 89.9%, respectively. Li et al. [132] employed HSI to detect industrial wax in rice, obtaining 80% detection accuracy with PLS and 93.3% with LDA. In a follow-up study, the group applied the successive projections algorithm (SPA) to determine the optimal set of wavelengths for analysis, improving LDA classification accuracy to 96%. In HSI applications, reflectance spectroscopy is often derived from images to model analyte relationships, with additional image-based color, morphology, and texture information enhancing analysis performance [133]. Since texture extraction from greyscale hyperspectral images lacks specificity, monochromatic images at selected wavelengths offer richer textural information [12]. For rice, integrating morphological parameters and textural features from these specific wavelengths with reflectance spectroscopy aids in accurate variety classification.
Figure 11. Setup of hyperspectral imaging (HSI) [134].
Processes 13 03731 g011
Figure 12. A flow diagram illustrating the extraction of spectral, grain morphology and surface texture features of rice. These characteristics were gathered and integrated to identify rice varieties [128].
Processes 13 03731 g012

2.8.5. Artificial Intelligence

Artificial Intelligence (AI) reflects contemporary advances in computation, drawing on biologically inspired paradigms including artificial neural networks (ANN), convolutional neural networks (CNN), fuzzy logic (FL), metaheuristic search, and hybrid approaches, which are attracting growing global attention [135]. AI systems exhibit human like capabilities learning, reasoning, communicating, perceiving, and making decisions and deliver strong results in computer-integrated engineering. Notably, AI enhances monitoring and production process efficiency, as well as enabling automatic corrections in manufacturing [136]. In rice quality assessment, AI can effectively optimize quality parameters to achieve desirable characteristics that traditional methods may not deliver [16]. Intelligent data driven techniques, including machine learning and deep learning are utilized for classification, monitoring, and defect detection related to rice quality characteristics [137]. The impressive capabilities of machine and deep learning present significant potential for enhancing rice quality monitoring and assessment [138].

2.8.6. Machine Learning

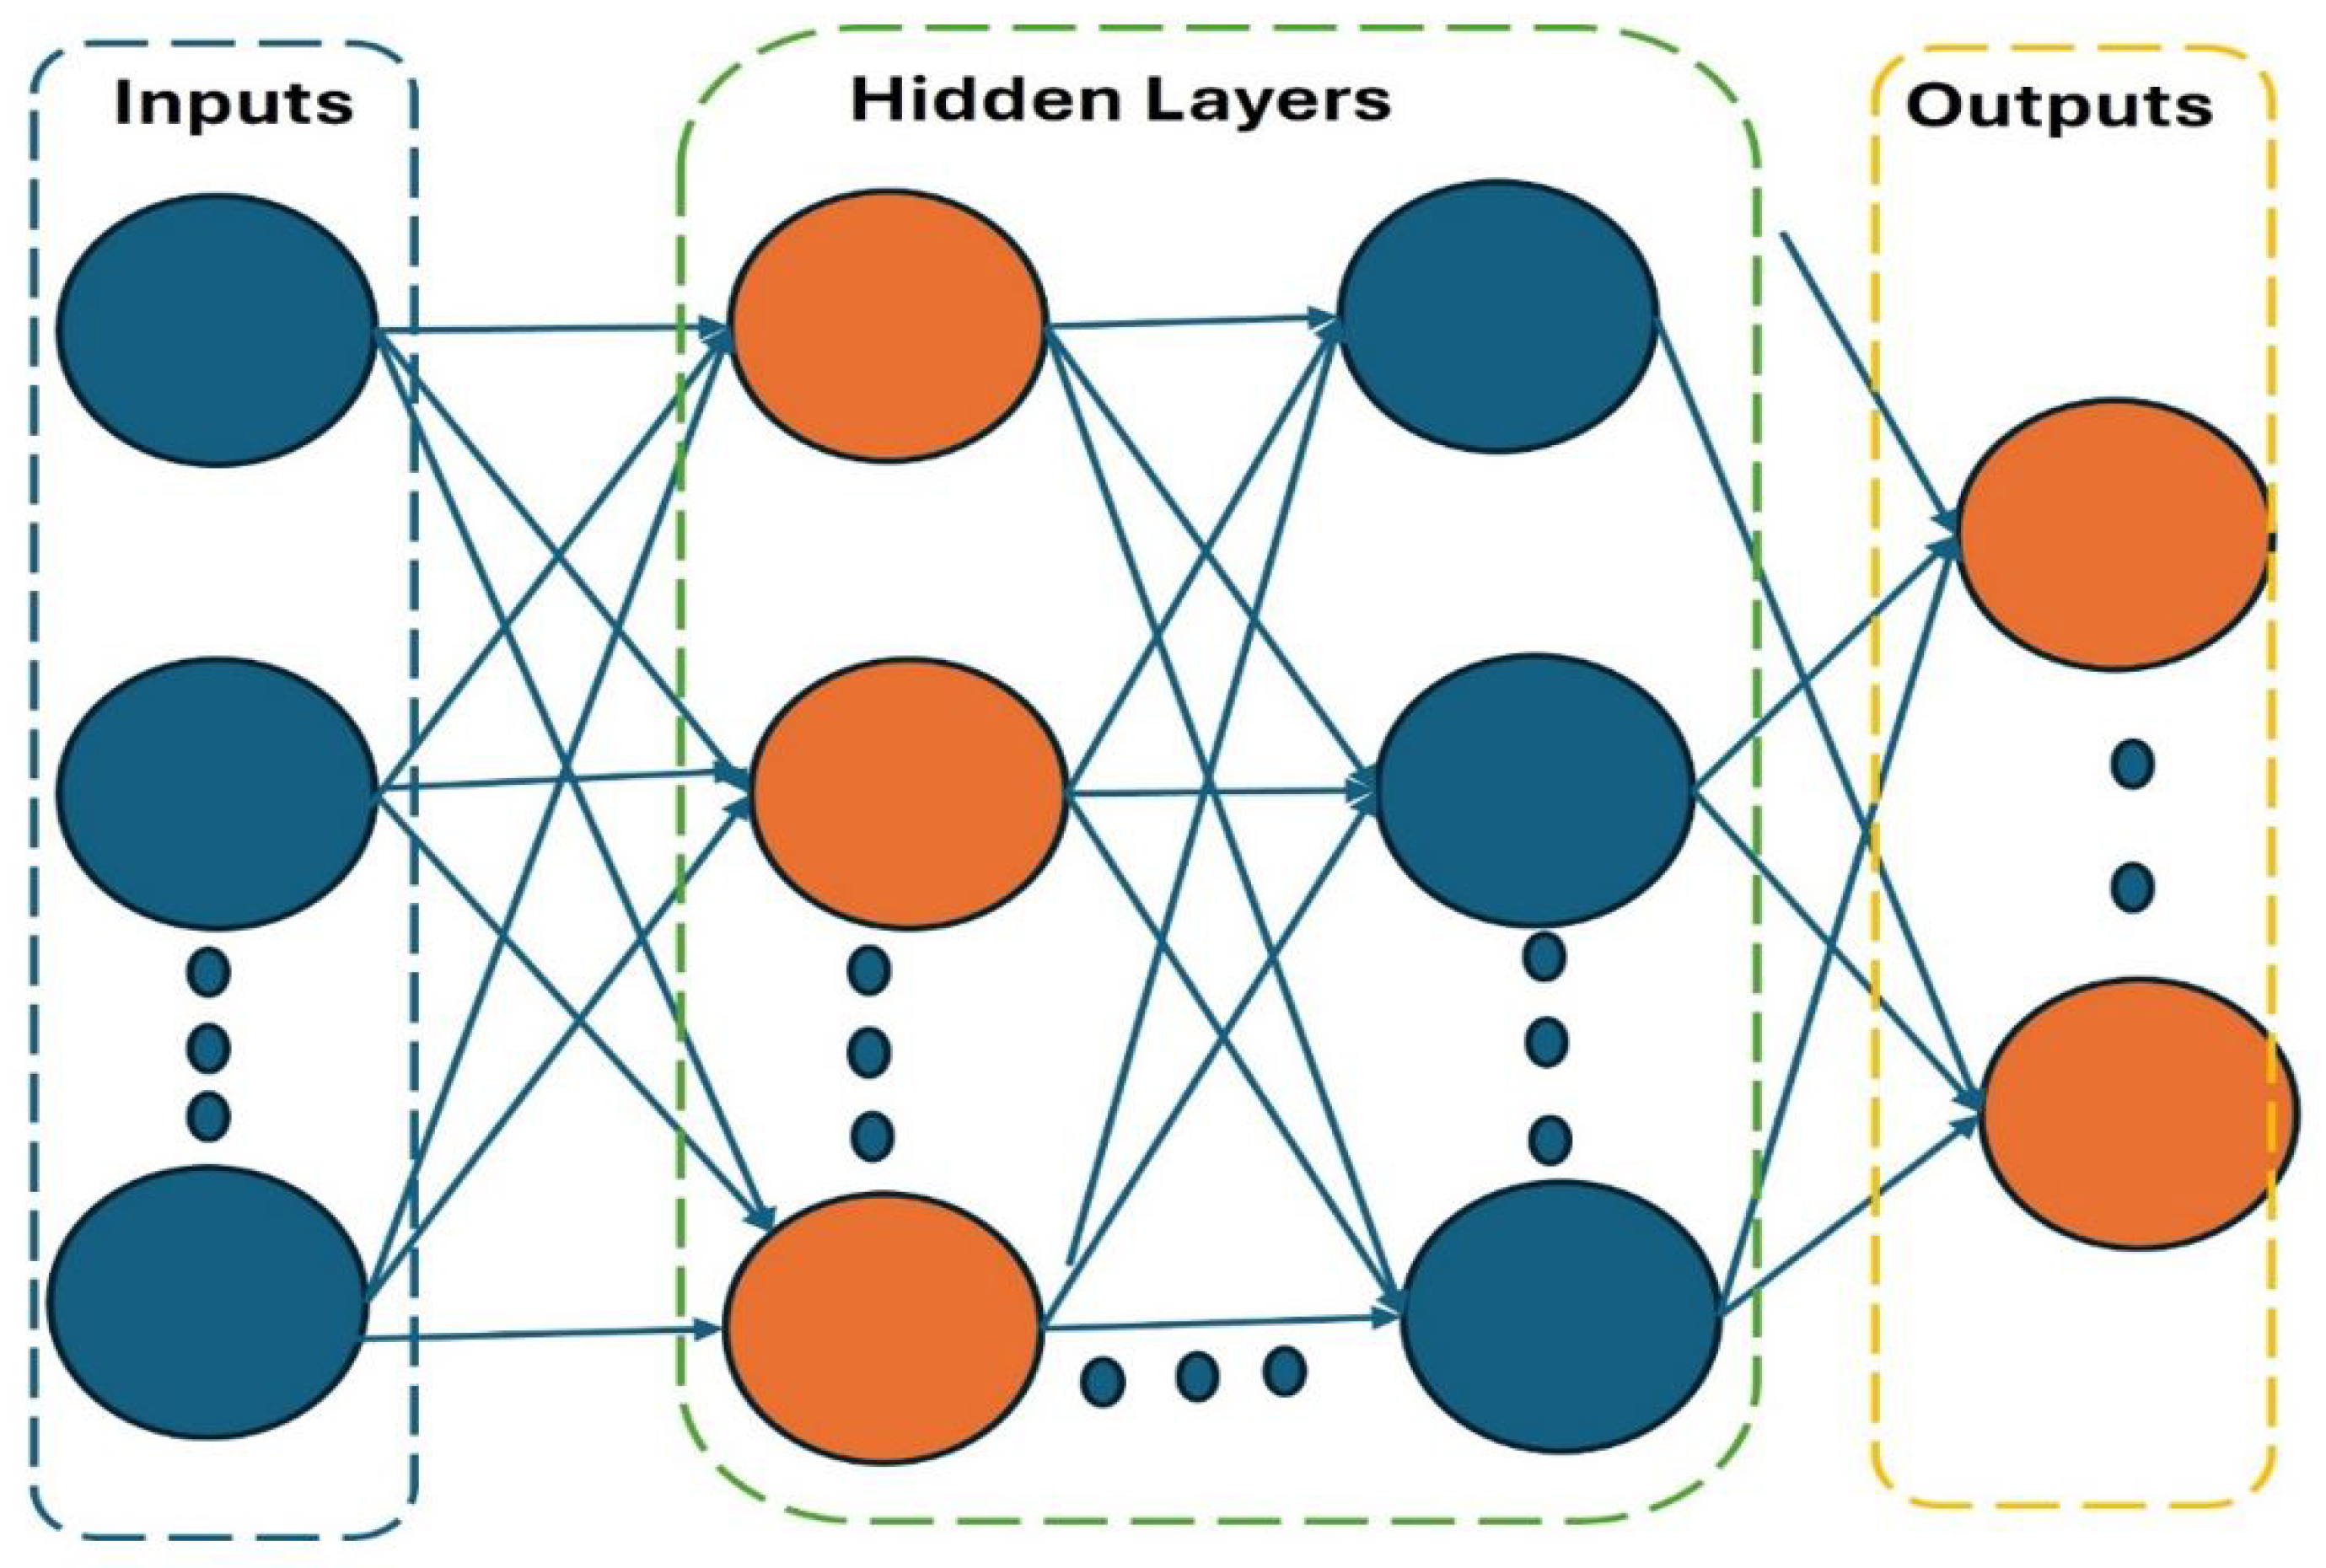
Digital agriculture and food tech advances have accelerated the uptake of machine learning for tasks such as rice quality assessment. ML enables fast, consistent evaluation workflows that reduce human error and decision bias [139]. These models deliver rapid, accurate, and dependable outputs, and recent studies summarize their uses, advantages, and limitations in rice quality evaluation [138]. Observations indicate that trends in machine learning tend to prioritize classification tasks over regression tasks, likely due to the traditional reliance on multivariate data analysis among food scientists for predicting chemometric data in rice quality research. Machine learning represents a growing technology that is essential for modelling complex non-linear data associated with food and agriculture, which can be difficult to analyse using conventional modelling techniques [140]. Machine learning is commonly grouped into supervised and unsupervised paradigms, reflecting the data available and the learning goal. In supervised settings, models are trained on examples that pair inputs with target labels, allowing the learner to map inputs to desired outputs and then generalize to new cases [141]. Within supervised learning, tasks are typically divided into classification and regression according to the prediction target. Classification seeks to infer categorical labels from input features [142]. Common classifiers include support vector machines (SVM), artificial neural networks (ANN), Naive Bayes, and k-nearest neighbors (kNN) [143]. In regression, the goal is to predict a continuous outcome by modeling relationships between predictors and the response. Common families include linear/non-linear regression, generalized linear models, decision trees, artificial neural networks (ANN), Gaussian process regression (GPR), support vector machines (SVM), and ensemble methods [143,144]. Artificial neural networks (ANNs) can be tailored to many tasks pattern recognition, feature extraction, classification, prediction, and process modeling by learning complex, non-linear relationships in data [145]. Conceptually inspired by biological neurons, an ANN is organized in layers of interconnected nodes. A standard architecture includes an input layer (holding the predictor variables), one or more hidden layers, and an output layer (producing the target variables). Model capacity and generalization are governed by design choices such as the number of neurons per layer and the depth (count of hidden layers); with appropriate configuration and training, ANNs provide robust approximations for challenging non-linear problems [146]. Model configuration can be tuned either by trial and error or via algorithmic optimization. In an ANN, nodes are interconnected through learnable weights (see Figure 13). For each hidden layer, a neuron aggregates its inputs (weighted sum or similar net operation), applies a chosen activation function, and passes the resulting value forward to subsequent neurons; during training, the connection weights are updated to improve the network’s predictive objective [147].
Unsupervised learning seeks the structure of the data itself, discovering patterns and associations without labeled outputs [148]. It is especially useful for clustering and dimensionality reduction, where the aim is to group similar samples or compress features while retaining salient information. Common techniques used to uncover latent organization include k-means clustering, Gaussian mixture models (GMMs), and hierarchical clustering tree methods [149]. Semi-supervised learning leverages a mix of labeled and unlabeled samples during training to infer the target outputs, reducing the need for extensive annotation [141]. Such approaches along with unsupervised methods are especially useful when labeled data are scarce because collecting and curating annotations is costly and time-consuming [141]. However, unlike fully supervised settings, evaluating validity is more challenging: predictions often lack ground truth labels for direct comparison, which complicates rigorous assessment [150].

2.8.7. Deep Learning

Deep learning is a state-of-the-art branch of machine learning that trains deep neural networks architectures with multiple hidden layers so the model can capture increasingly abstract, complex representations [151]. In agriculture, one of the most widely used deep models is the convolutional neural network (CNN), a supervised framework well suited to classification, recognition, and segmentation in computer-vision pipelines [152]. Compared with traditional ML, deep learning can model complex patterns and handle very large datasets, which suits big-data scenarios. It also learns features automatically from raw inputs, reducing manual feature engineering and the expert effort it typically requires [153]. Evidence from rice-specific studies suggests deep learning is preferable for high-dimensional image/spectral inputs and end-to-end defect or segmentation tasks delivering state-of-the-art accuracy and real-time feasibility [25,26,28]. Traditional ML (e.g., PLSR/SVM/ANN with engineered features) remains advantageous when datasets are smaller, model interpretability is prioritized, or compute is constrained; NIR–ANN pipelines in particular provide strong predictive performance for composition traits with lower deployment cost [16,27]. Table 3. Shows recent application of machine and deep learning application in rice quality assessment.
Table 3. Summary of AI/ML-based models applied to rice quality assessment, grading, classification, and disease detection.
Prediction ModelTechniqueObjectiveMain OutcomesReference
AlexNet architectureComputer visionRice grading classificationAccuracy 98%, sensitivity 97%, specificity 96%[154]
DNN, CNN, ANNVisible imagingClassification of rice varietiesANN 99%, DNN 99%, CNN 100% accuracy[155]
PCA, PLS, ANN, LS-SVM, BPNNMultispectral imagingClassify rice cultivars and detect adulterationBPNN reached 92% accuracy[19]
MLP neural networkCCD camerasRice grading classification55.93% (Fajr), 84% (Tarom), 82% (Shiroodi); binary 86–95%[156]
LR, LDA, k-NN, SVMMachine visionRice seed classificationSVM: 90.61% (group1), 82% (group2), 83% combined; InceptionResNetV2: 95%[157]
BPNNDigital cameraClassifying paddy seedsColour–shape–texture model 95.2%, proposed method 97%[158]
ANNE-nose, NIRRice quality traitsClassification 98%; aroma prediction R = 0.95 –0.98[71]
ANN, MLRBiochemical compositionRice quality predictionMLR R 2  = 0.27–0.96; ANN R 2  = 0.98 (train), 0.88 (val), 0.90 overall[20]
MLRNIRSGrain weight, amylose, brown rice weight R 2 = 0.67–0.85[159]
PLSR, LS-SVM, ICAIRRice quality prediction R 2 = 0.89–0.98[160]
LeNet, GoogLeNet, RF, LR, SVM, ResNetHyperspectralVariety identificationAccuracy 86%[161]
PLSDA, SIMCA, RF, KNN, SVM, PCAHyperspectralVariety identificationAccuracy 80–100%[162]
ResNet, VGG, EfficientNet, MobileNetImagingRice grain classificationEfficientNet 99.67%;
MobileNet fastest (2556s)
[163]
SVMImagingChalkinessIndica 98.5%, Japonica 97.6%[164]
PCANetHyperspectral imagingRice classificationTrain 98%, predict 98.57%[128]
BP-ANNIRRice grades R 2 = 95.45%[165]
SVM, LR, RF, LeNet, GoogLeNet, ResNetNIRVariety identificationResNet best: 86%[161,165]
ANN, SVM, BNComputer visionMilled rice grain classificationANN 98%, SVM 98%, DT 97%, BN 96%[166]
ANFIS, SVM, KNNImagingGrading of Basmati riceAccuracy > 98% (broken/whole)[167]
SVM + GA, KNNGeometric propertiesGrain quality analysisAccuracy 92%→93%; SVM best; k-NN 88%[168]
YOLOv7VideoRice seed countingmAP 99%; tracking 100% accuracy, 83% precision[161]
MSIA, CNNHyperspectralRice qualityAccuracy, precision, recall, F1 = 99%[169]
CNNImagingEarly disease detectionAccuracy 97.70%[170]
YOLOv5, RCNN, RetinaNet, SSD, Cascade RCNNED imagingYield traitsYOLOv5: Precision 98.94%, Recall 97.91% (filled); 90.96/94.94% (unfilled)[171]
PCA-KNN, SPA-KNN, PCA-LS-SVM, SPA-LS-SVMRaman spectroscopyClassificationSPA-LS-SVM: 94%[172]
Correlation analysisVIS-NIRChalkiness index R 2 = 0.89[173]
SVMNIR imagingColored rice inspectionBroken 99%, chalkiness 96.3%, damaged 93%[174]
AlexNetNI-myRIO visionVariety classificationAccuracy 98%, sensitivity 97%, specificity 96.4%[154]
CNN modelsImagingDamage classificationEfficientNet-B0 up to 100% accuracy[175]
Fuzzy logicComputer visionWhitening performanceAccuracy 89.2%[166]
Mask R-CNNImagingImpurity and broken rateAccuracy +6.13% (broken), +9.19% (impurities)[159]
CNNE-nose hyperspectralRice quality differenceAccuracy 98.07%[176]
Logistic regressionComputer visionSorting broken/chalky grainsCorrelation R 2 0.94 [177]
ResNet34, ResNet50ImagingClassification and qualityResNet50 > 99.85% (six varieties)[178]
YOLOXImagingRice disease identificationmAP 95.58%[179]
YOLOv5s-CBAM-DMLHeaImagingWeedy rice identificationmAP@0.5 = 98.9%; inference 4 ms; 28% fewer computations[180]

2.8.8. CNN

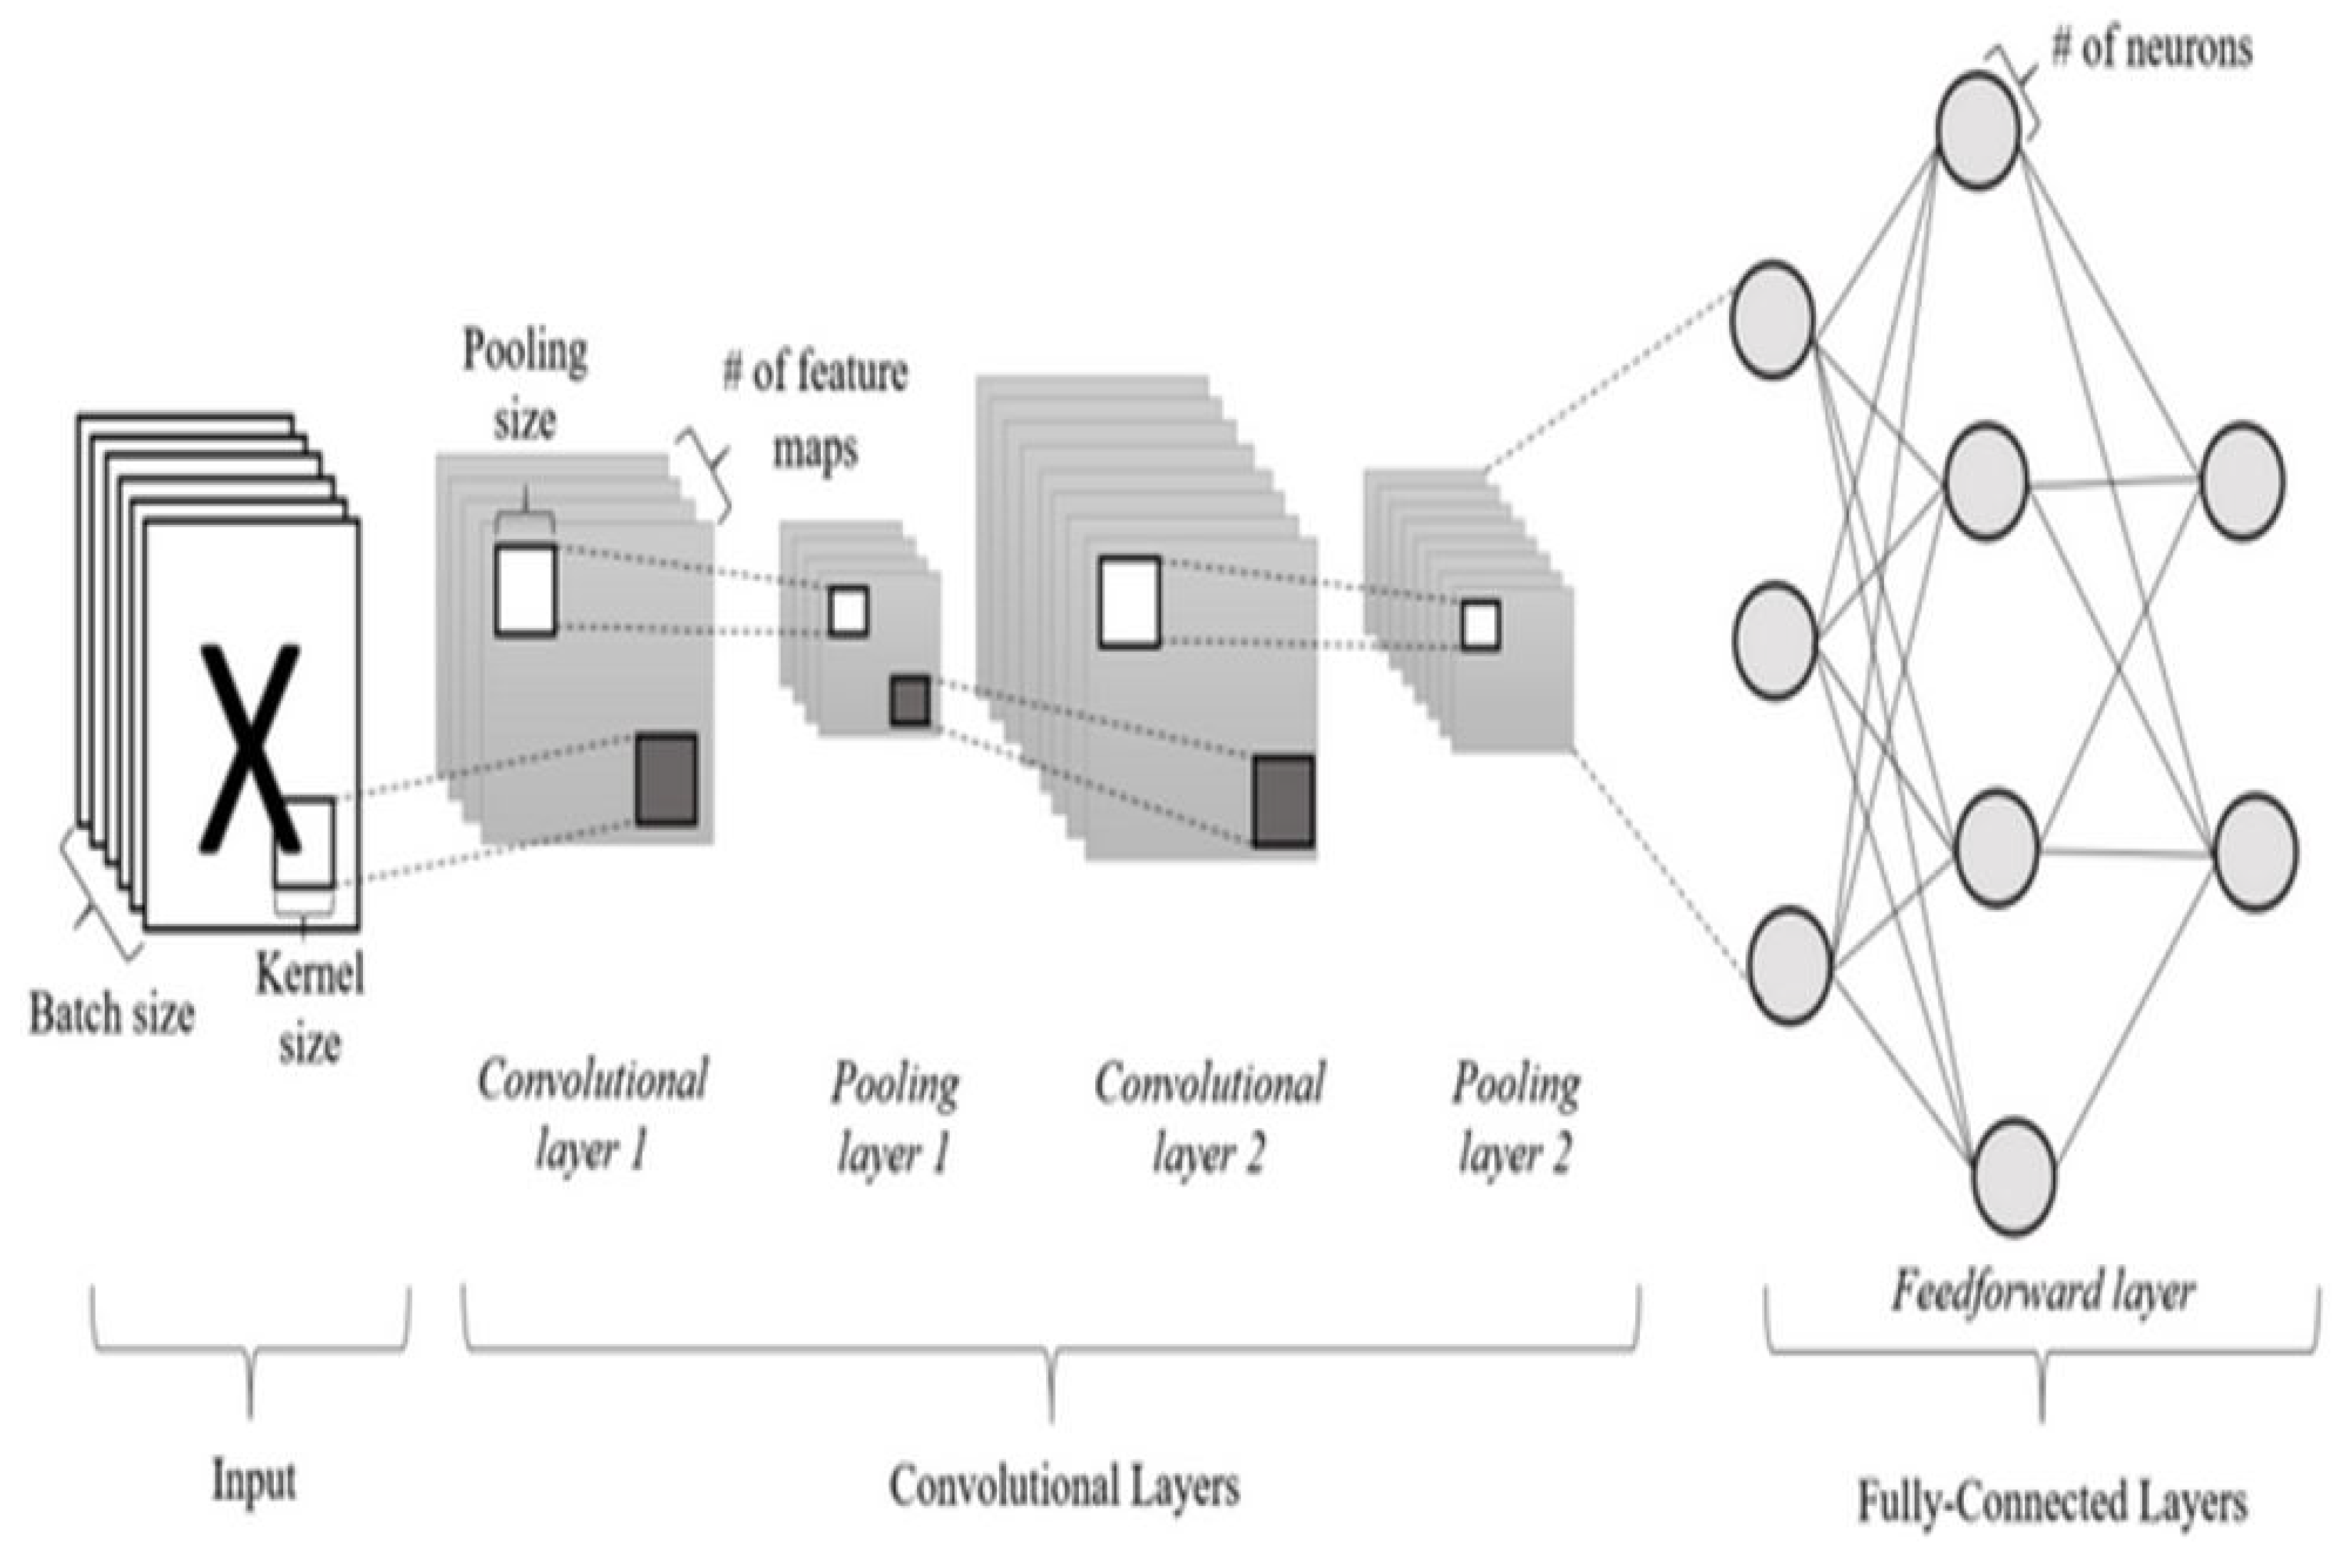
Convolutional neural networks (CNNs) are among the most widely used architectures in deep learning. Their major strength is the ability to learn task-relevant features directly from data, greatly reducing the need for manual feature design [181]. Inspired by the organization of the visual cortex, CNNs stack convolution, nonlinearity, and pooling operations to form progressively more abstract representations. Their effectiveness is commonly attributed to sparse (local) connectivity, parameter sharing through convolutional kernels, and the emergence of stable, comparable representations that generalize across image locations [182]. Reliable detection and classification of rice quality are essential to protect market value. As a result, current work continues to improve techniques for recognizing damage, disease, and grain attributes. Quality checks occur pre-harvest, during processing, and post-processing. This review centers on recent CNN applications in this area, where rice quality control encompasses evaluation of internal/external defects, chalkiness levels, and key physical traits. Figure 14 provides an overview of recent studies utilizing CNNs for rice quality evaluation.

2.8.9. Instance Segmentation

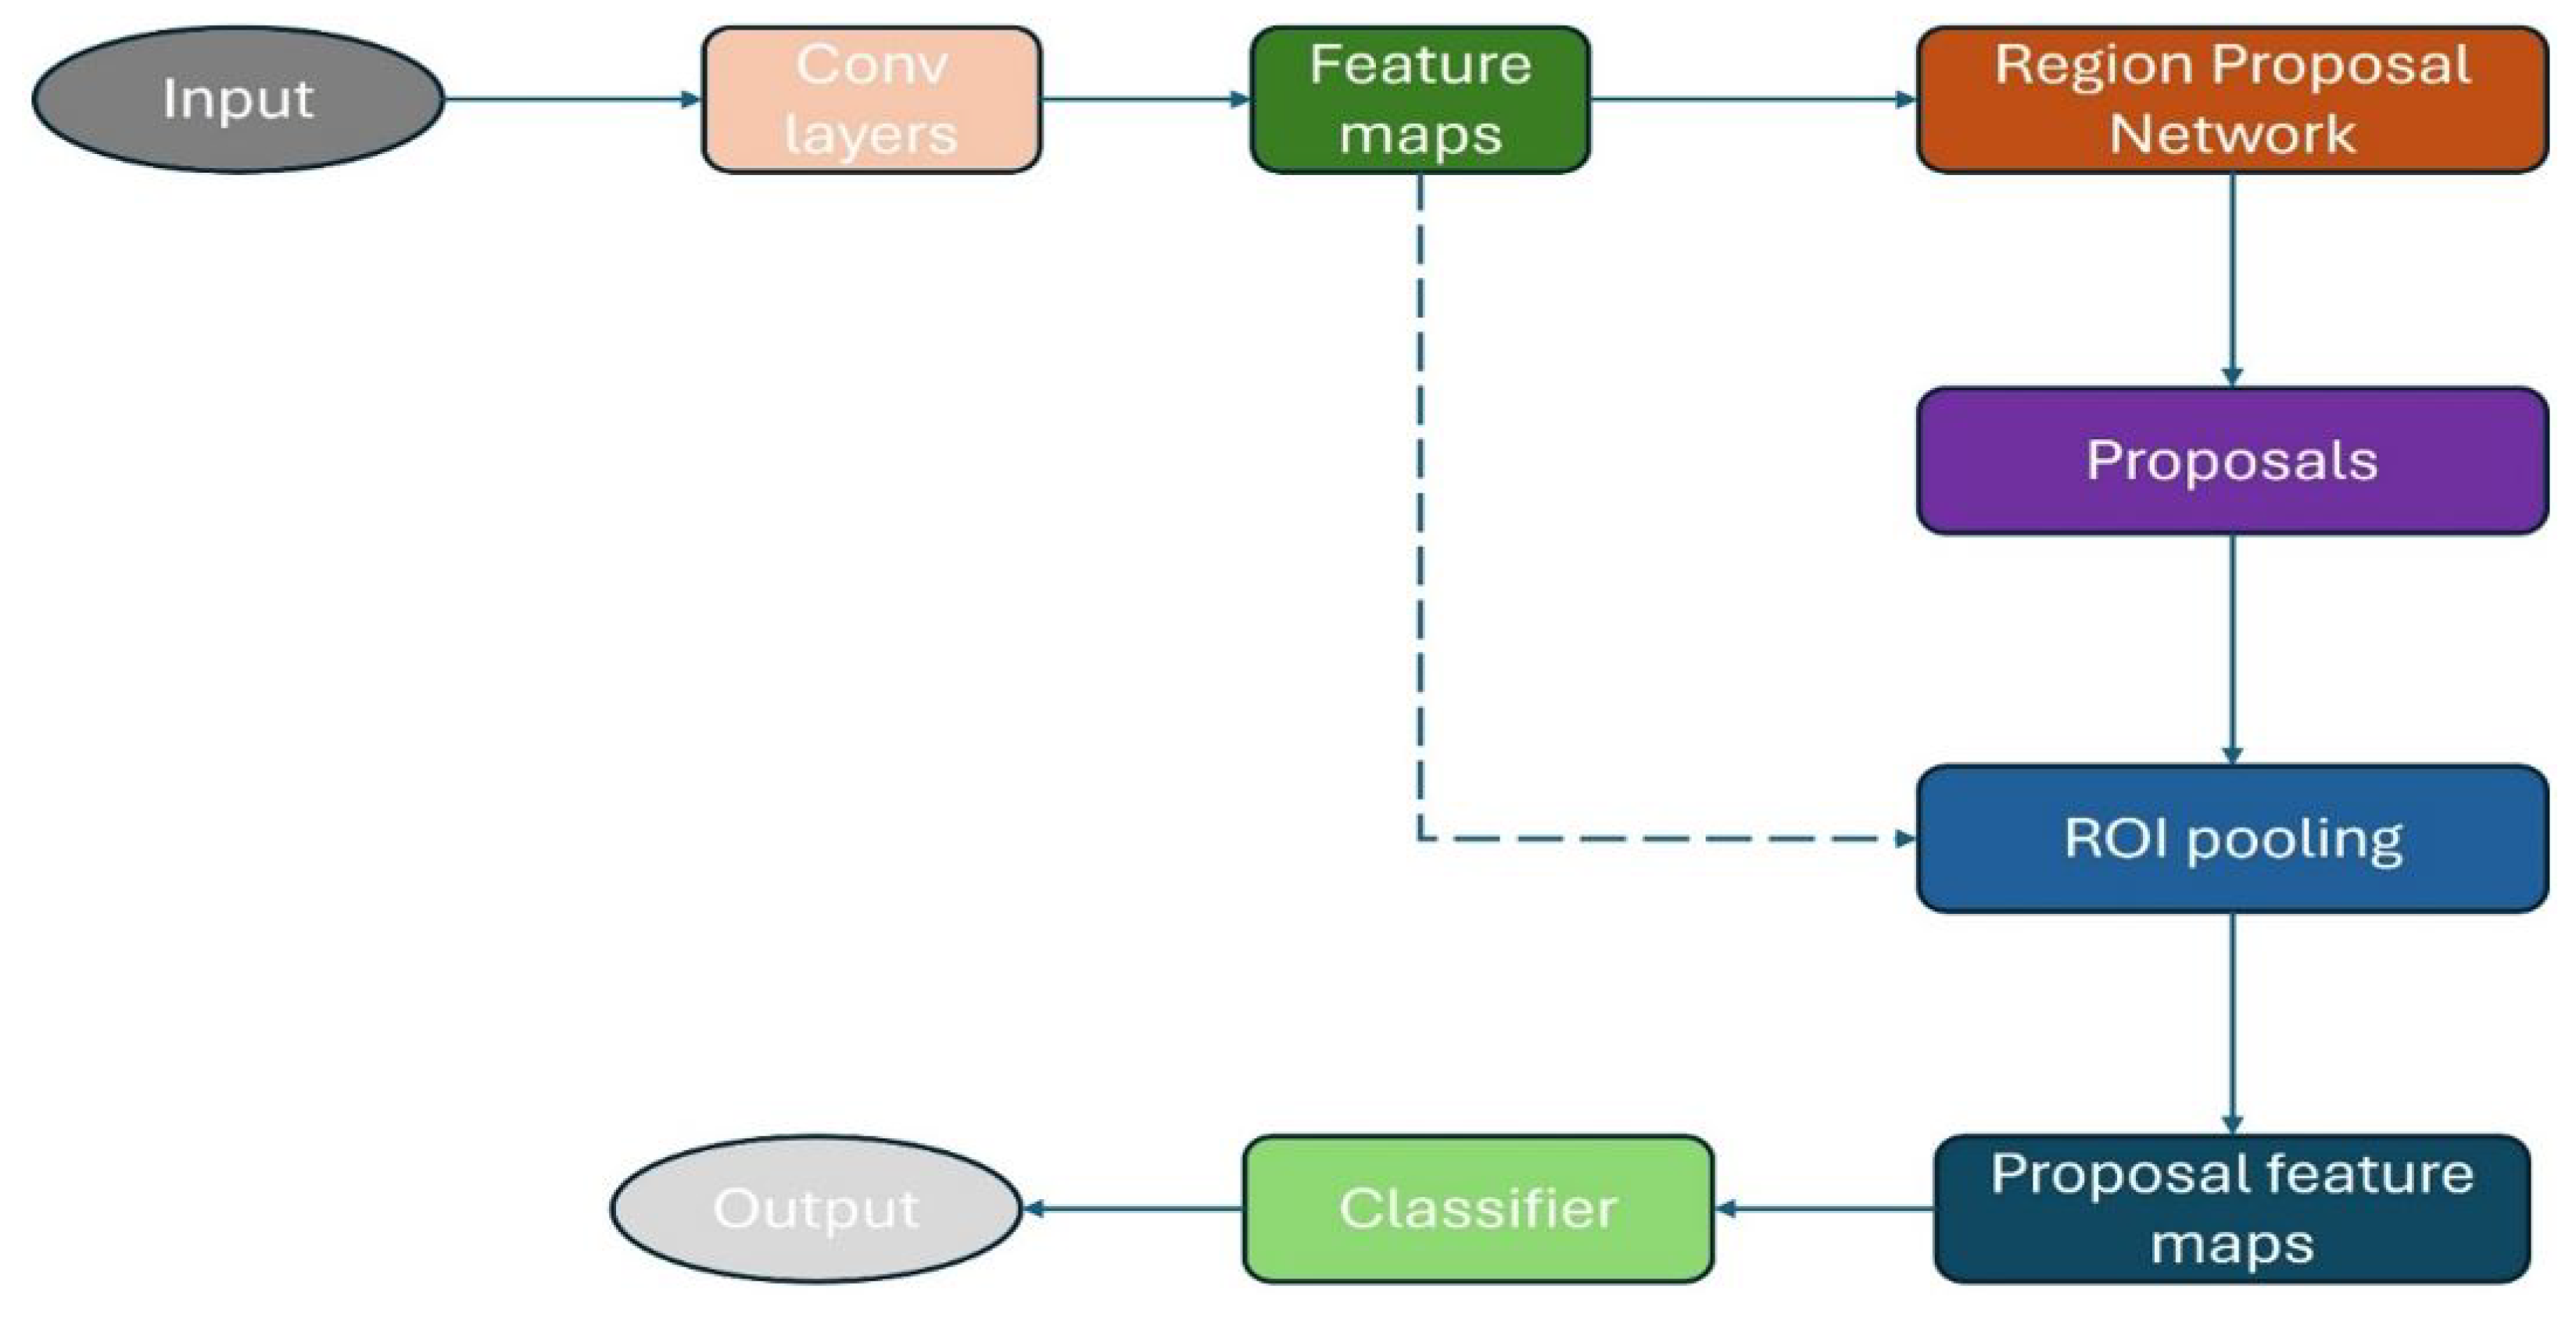
Instance segmentation is a computer-vision task that combines object detection with semantic segmentation, producing both the identity and an exact pixel mask for each object in a scene [184]. In agricultural settings, this capability enables fine grained measurement of plant and crop morphology, supporting analyses of growth status, disease symptoms, and yield potential [185]. This capability also serves as a foundation for various research and development areas, including robotic thinning of immature fruit [186]. Traditional instance segmentation methods for agricultural images largely relied on manually engineered features and traditional image analysis methods, such as the Watershed Transform [187], Graph-based Segmentation [188], Active Contours [189], level set, and Region Growing [190]. However, these approaches often require extensive manual setup and adjustments, which can be time-consuming and less reliable. Prior studies have demonstrated the efficacy of these methods across diverse applications, including the segmentation of apple blossoms [191], localization and segmentation of strawberry fruit, counting cranberries, and segmenting guava fruits [192]. Deep learning detectors are commonly grouped into one-stage and two-stage families. In a two-stage pipeline exemplified by Mask R-CNN, the first stage uses a Region Proposal Network (RPN) to produce candidate regions of interest; the second stage classifies these proposals and refines their boxes masks to yield precise localization and labels [193]. This cascaded design prioritizes accuracy by devoting a separate step to proposal refinement and verification. Mask R-CNN is a deep learning framework that performs object detection and instance segmentation in a single model, delivering accurate localization together with a per-object mask. Building on Faster R-CNN, it adds a parallel mask-prediction head alongside the classification and bounding-box regression branches, enabling precise delineation of individual objects in complex scenes. Owing to this design, Mask R-CNN has become a strong baseline for high-accuracy image analysis across diverse applications [194]. The Mask R-CNN pipeline comprises three core parts: a feature-extraction backbone, a Region Proposal Network (RPN), and parallel heads for classification/bounding-box regression and mask generation (see Figure 15). The backbone typically a convolutional network encodes the input image into shared feature maps used by all subsequent modules. Leveraging these maps, the RPN scores anchors and outputs candidate regions of interest (RoIs) that are likely to contain objects. Each RoI is then routed to two branches: one refines the class label and bounding box, while the other predicts a high-resolution instance mask for the detected object. The bounding box and classification head assigns a category to each proposed region and refines its bounding-box coordinates, whereas the mask head outputs a binary pixel mask for the corresponding object instance within that region. Deploying Mask R-CNN and related deep-learning models in agricultural settings faces practical hurdles. Performance depends heavily on the quality and diversity of training data, yet field imagery is highly variable including lighting, weather, background clutter, and crop growth stage all shift over time and space—making generalization difficult and potentially degrading accuracy [195,196]. Mask R-CNN also carries substantial compute demands for both training and inference [185], which can limit real-time deployment on farms where high-end hardware is uncommon. Despite these constraints, many recent agricultural studies have successfully applied Mask R-CNN–based instance segmentation to diverse tasks, including crop identification [197], disease recognition [198], weed discrimination [199], and tree segmentation/detection [200].

2.8.10. You Only Look Once (YOLO)

Among deep-learning tools used in agriculture, two architectures dominate attention: You Only Look Once (YOLO) and Mask R-CNN. Both have proven effective for instance level analysis, driving progress in crop detection, pest disease monitoring, weed identification, and the segmentation of canopy elements such as branches and fruit [196].These workflows are central to precision automated agriculture and benefit substantially from modern deep learning. The YOLO family uses a one-stage pipeline that performs object detection and, in many variants, classification and instance semantic segmentation in a single pass, enabling high throughput. Mask R-CNN, in contrast, follows a two-stage design and typically delivers stronger segmentation accuracy [201]. Owing to its speed and computational economy, YOLO is well suited to real-time field operations, including robotic pruning and thinning [202], as well as other targeted interventions in crop management [203]. The YOLO family for detection (and, in many variants, instance segmentation) has progressed quickly, with newer releases boosting both accuracy and throughput. YOLOv8 extends design ideas from earlier versions (e.g., YOLOv3/YOLOv5) while refining the backbone, head, and training strategy to improve performance. Unlike two-stage frameworks, YOLOv8 follows a single-pass approach: it predicts bounding boxes and class scores directly, omitting a separate region-proposal step and thereby streamlining inference for real-time use. YOLOv8 introduces a major innovation by adopting an anchor-free, center-point detection mechanism, offering improved performance and simplicity compared to the anchor-based frameworks of YOLOv5 through YOLOv7. In addition, YOLOv8 utilizes Pseudo Supervision (PS), a method involving the training of several differently configured models on a common dataset to enhance generalization and robustness. This approach generates a broader spectrum of predictive outputs, contributing to enhanced precision and resilience of the model final results [196]. YOLOv8 is released in multiple sizes to balance speed and accuracy for different deployment needs. YOLOv8-Tiny prioritizes throughput and fits resource-constrained, real-time devices, at the cost of some accuracy. YOLOv8-Small offers a practical trade-off, delivering faster inference with more detailed detection than Tiny. The YOLOv8-Standard variant provides balanced, general-purpose performance across many scenarios. For maximum precision, YOLOv8-Large emphasizes higher accuracy, suitable for applications where fine detail and detection quality are critical. Recent improvements to YOLOv8 have broadened its use across agriculture, enabling it to cope with diverse field conditions. With stronger low-level feature processing, the model supports early detection of subtle pest and disease cues, which is essential for crop protection [204]. Enhanced YOLOv8 variants have been applied to greenhouse vegetable disease recognition, enabling earlier intervention and management [205]. In parallel, researchers have embedded attention modules into YOLOv8 to boost detection robustness; for example, Ref. [206] reports improved tomato detection in visually cluttered field conditions. While YOLOv8 has demonstrated excellent object detection performance, its application in rice milling remains underexplored beyond academic prototypes. There is limited discussion on how these models handle noise, occlusion, or non-standard lighting in industrial settings.

2.8.11. Other Learning Methods

Diverse machine learning methods have been applied to support non-destructive quality analysis in agricultural produce. They include logistic regression [207], naive Bayes [208], nearest neighbour [209], stochastic gradient decent [210], gradient tree boosting [211], Adaptive neuro-fuzzy inference system [167,212], genetic algorithm [168], metaheuristic optimization [213] Zareiforoush, Minaei, Alizadeh, & Banakar, etc. fuzzy logic [214], While different learning algorithms may deliver satisfactory performance for a specific task, it is always preferable to select the most effective one. Selection of a suitable algorithm commonly involves balancing factors like memory usage, predictive performance on validation data, training speed, and transparency of the model’s internal mechanisms, typically assessed via iterative experimentation.

3. Implementation and Limitations of Current AI Techniques in Rice Quality Assessment

Rice analysis using AI systems has progressed beyond proof-of-concept. CNN-based appearance inspection and automatic grading systems have been prototyped for online use. Instance-segmentation/detection models tailored to polished-rice defects and morphology (e.g., Yolo) support automated broken-rate and impurity quantification, while hybrid instance-segmentation+OBB frameworks enable precise morphology estimation under motion and occlusion for feedback to milling control. These exemplars demonstrate feasibility for integrating AI modules into modern milling lines. Despite their demonstrated potential, current artificial intelligence (AI) approaches, particularly CNNs and other deep learning models face significant limitations when applied to rice quality assessment. One of the primary challenges is the heavy reliance on large, annotated datasets for model training. However, such datasets are often scarce, especially for the diverse range of rice cultivars, grain qualities, and processing conditions encountered globally. This lack of representative data hinders the ability of models to generalize across different geographical regions and milling practices. Furthermore, many AI models are developed and validated in highly controlled laboratory environments with stable lighting, uniform sample presentation, and limited background noise. When these models are deployed in real-world industrial settings; where conditions are far more variable, they often experience substantial performance degradation due to factors such as grain occlusion, motion blur, inconsistent lighting, dust interference, and hardware variability. Another significant constraint is the absence of standardized benchmark datasets and evaluation protocols in the field of AI-driven rice quality assessment. This lack of common validation frameworks makes it difficult to perform objective comparisons between different models and hinders reproducibility across studies. Additionally, current AI architectures such as Mask R-CNN and YOLOv8, although offering high classification and segmentation accuracy, typically require substantial computational resources, including high-end GPUs and large memory capacities. This poses a barrier to their adoption in small-scale or rural rice milling operations, where infrastructure may be limited and cost-effectiveness is a key concern. Without the development of lighter, resource-efficient models or edge-AI solutions, the practical scalability of these technologies remains constrained.

4. Conclusions

The present work reviewed rice grain quality assessment methods and strategies focusing on different quantifiable parameters, and how recent non-invasive techniques and computational techniques enhance predictive assessment of grain quality. Additionally, the application of non-invasive techniques and several artificial intelligence technologies in the efficient assessment of milled rice was introduced. The result shows that the emerging technology can detect changes in various indexes in the quality assessment process of rice grain milling without damaging the structure of the sample. The results show that the advantages of recent technology and artificial intelligence approaches can be used to detect and control the precision of milling process of rice online, control the colour and shape changes rice grain, and improve the overall organoleptic quality of milled rice for consumer preferences. This review further offers a holistic synthesis of multidisciplinary AI techniques, helping researchers and industry practitioners identify optimal algorithms, sensing platforms, and validation protocols for rice quality assessment. It highlights the efficiency, non-destructive nature, and automation potential of AI approaches. Rapid progress in applying AI to engineering is improving system efficiency. In rice processing, AI methods are well suited to the complex dynamics of milling. Because rice quality assessment depends on many interacting factors and varies over time, it is hard to model and optimize with conventional tools. Across competing approaches, AI typically delivers higher accuracy and performance for modeling and optimization of rice quality. This review covers the use of leading AI methods to model and optimize key rice quality attributes such as geometric traits, sensory properties, surface chalkiness, and degree of milling (DM). The evidence indicates that AI can deliver more accurate and consistent assessments while reducing cost, time, and false decisions relative to conventional approaches. Overall, AI is poised to play a central role in modeling, optimization, control, and monitoring of rice quality across the processing chain. In addition, we outline future research directions, including richer benchmark datasets, robust validation under variable line conditions, lightweight edge-deployable models, and explainable workflows to support industrial adoption.

5. Future Works

Future work should include explainable AI (XAI) so users can see why rice grading models make each decision, building trust in the industry. We also need real-world case studies, especially in developing countries, to show these tools work at scale. Priorities are as follows: Create open, standardized datasets with clear labels. Use strong external/variety-wise validation to build lightweight, edge-ready models for online use. Systems should connect to IOT device for closed-loop control, remote monitoring, report uncertainty for safer decisions, and provide simple operator interfaces. Finally, run techno-economic and sustainability studies to prove ROI, energy impacts, and maintenance needs across different mill environments.

Author Contributions

B.I.: Writing—review & editing, Writing—original draft, Methodology, Investigation, Data curation, Conceptualization. A.B.: Writing—review & editing. Y.S.: Writing—review & editing. A.S.: Writing—review & editing. H.Z.: Writing—review & editing, Writing—original draft, Supervision, Project administration, Methodology, Conceptualization. All authors have read and agreed to the published version of the manuscript.

Funding

Open Access funding provided by Sheffield Hallam University. This research received no external funding.

Data Availability Statement

The data generated during the current study are available from the corresponding author upon reasonable request.

Acknowledgments

The authors gratefully acknowledge support from the Advanced Food Innovation Centre (AFIC) and Sheffield Hallam University.

Conflicts of Interest

The authors declare no conflicts of interest.

Appendix A. PRISMA Checklist

Processes 13 03731 i001Processes 13 03731 i002

References

  1. Dorling, D. World population prospects at the UN: Our numbers are not our problem? In The Struggle for Social Sustainability; Policy Press: Bristol, UK, 2021; pp. 129–154. [Google Scholar]
  2. Pomeroy, J.; Jose, D.; Tyler, A.; Bloxham, P.; Culling, J. The Future of Food: Can We Meet the Needs of 9bn People? Free to View Report; HSBC Global Research: London, UK, 2023. [Google Scholar]
  3. van Dijk, M.; Morley, T.; Rau, M.L.; Saghai, Y. A meta-analysis of projected global food demand and population at risk of hunger for the period 2010–2050. Nat. Food 2021, 2, 494–501. [Google Scholar] [CrossRef] [PubMed]
  4. Asma, J.; Subrahmanyam, D.; Krishnaveni, D. The global lifeline: A staple crop sustaining two thirds of the world’s population. Agric. Arch. 2023, 2, 15–18. [Google Scholar] [CrossRef]
  5. Abdo, A.I.; Tian, M.; Shi, Z.; Sun, D.; Abdel-Fattah, M.K.; Zhang, J.; Wei, H.; Abdeen, M.A. Carbon footprint of global rice production and consumption. J. Clean. Prod. 2024, 474, 143560. [Google Scholar] [CrossRef]
  6. Zafar, S.; Jianlong, X. Recent advances to enhance nutritional quality of rice. Rice Sci. 2023, 30, 523–536. [Google Scholar] [CrossRef]
  7. Das, M.; Dash, U.; Mahanand, S.S.; Nayak, P.K.; Kesavan, R.K. Black rice: A comprehensive review on its bioactive compounds, potential health benefits and food applications. Food Chem. Adv. 2023, 3, 100462. [Google Scholar] [CrossRef]
  8. Shahbandeh, M. Total Global Rice Consumption 2008/09–2024/25. Statista. Available online: https://www.statista.com/statistics/255977/total-global-rice-consumption/ (accessed on 10 November 2025).
  9. Bairagi, S.; Demont, M.; Custodio, M.C.; Ynion, J. What drives consumer demand for rice fragrance? Evidence from South and Southeast Asia. Br. Food J. 2020, 122, 3473–3498. [Google Scholar] [CrossRef]
  10. Mané, I.; Bassama, J.; Ndong, M.; Mestres, C.; Diedhiou, P.M.; Fliedel, G. Deciphering urban consumer requirements for rice quality gives insights for driving the future acceptability of local rice in Africa: Case study in the city of Saint-Louis in senegal. Food Sci. Nutr. 2021, 9, 1614–1624. [Google Scholar] [CrossRef]
  11. Wahyudi, A.; Kuwornu, J.K.M.; Gunawan, E.; Datta, A.; Nguyen, L.T. Factors influencing the frequency of consumers’ purchases of locally-produced rice in Indonesia: A Poisson regression analysis. Agriculture 2019, 9, 117. [Google Scholar] [CrossRef]
  12. Li, D.; Shen, M.; Li, D.; Yu, X. Green apple recognition method based on the combination of texture and shape features. In Proceedings of the IEEE International Conference on Mechatronics and Automation (ICMA), Takamatsu, Japan, 6–9 August 2017. [Google Scholar]
  13. Mao, S.; Wang, B.; Tang, Y.; Qian, F. Opportunities and Challenges of Artificial Intelligence for Green Manufacturing in the Process Industry. Engineering 2019, 5, 995–1002. [Google Scholar] [CrossRef]
  14. Mavani, N.R.; Ali, J.M.; Othman, S.; Hussain, M.A.; Hashim, H.; Rahman, N.A. Application of Artificial Intelligence in Food Industry—A Guideline. Food Eng. Rev. 2022, 14, 134–175. [Google Scholar] [CrossRef] [PubMed]
  15. Jafari-Marandi, R.; Khanzadeh, M.; Tian, W.; Smith, B.; Bian, L. From in-situ monitoring toward high-throughput process control: Cost-driven decision-making framework for laser-based additive manufacturing. J. Manuf. Syst. 2019, 51, 29–41. [Google Scholar] [CrossRef]
  16. Aznan, A.; Viejo, C.G.; Pang, A.; Fuentes, S. Review of technology advances to assess rice quality traits and consumer perception. Food Res. Int. 2023, 172, 113105. [Google Scholar] [CrossRef] [PubMed]
  17. Thapa, A.; Nishad, S.; Biswas, D.; Roy, S. A comprehensive review on artificial intelligence assisted technologies in food industry. Food Biosci. 2023, 56, 103231. [Google Scholar] [CrossRef]
  18. Addanki, M.; Patra, P.; Kandra, P. Recent advances and applications of artificial intelligence and related technologies in the food industry. Appl. Food Res. 2022, 2, 100126. [Google Scholar] [CrossRef]
  19. Liu, W.; Xu, X.; Liu, C.; Zheng, L. Nondestructive Detection of Authenticity of Thai Jasmine Rice Using Multispectral Imaging. J. Food Qual. 2021, 2021, 6642220. [Google Scholar] [CrossRef]
  20. Sampaio, P.S.; Almeida, A.S.; Brites, C.M. Use of artificial neural network model for rice quality prediction based on grain physical parameters. Foods 2021, 10, 3016. [Google Scholar] [CrossRef]
  21. Kim, S.Y.; Lee, H. Effects of quality characteristics on milled rice produced under different milling conditions. J. Korean Soc. Appl. Biol. Chem. 2012, 55, 643–649. [Google Scholar] [CrossRef]
  22. Qiu, X.; Pang, Y.; Yuan, Z.; Xing, D.; Xu, J.; Dingkuhn, M.; Li, Z.; Ye, G. Genome-wide association study of grain appearance and milling quality in a worldwide collection of Indica rice germplasm. PLoS ONE 2015, 10, e0145577. [Google Scholar] [CrossRef]
  23. Yadav, B.K.; Jindal, V.K. Changes in head rice yield and whiteness during milling of rough rice (Oryza sativa L.). J. Food Eng. 2008, 86, 113–121. [Google Scholar] [CrossRef]
  24. Espinel, R.; Herrera-Franco, G.; Rivadeneira García, J.L.; Escandón-Panchana, P. Artificial intelligence in agricultural mapping: A review. Agriculture 2024, 14, 1071. [Google Scholar] [CrossRef]
  25. He, Y.; Fan, B.; Sun, L.; Fan, X.; Zhang, J.; Li, Y.; Suo, X. Rapid appearance quality of rice based on machine vision and convolutional neural network research on automatic detection system. Front. Plant Sci. 2023, 14, 1190591. [Google Scholar] [CrossRef]
  26. Zhou, J.; Zeng, S.; Chen, Y.; Kang, Z.; Li, H.; Sheng, Z. A method of polished rice image segmentation based on YO-LACTS for quality detection. Agriculture 2023, 13, 182. [Google Scholar] [CrossRef]
  27. Son, S.; Kim, D.; Choi, M.C.; Lee, J.; Kim, B.; Choi, C.M.; Kim, S. Weight interpretation of artificial neural network model for analysis of rice (Oryza sativa L.) with near-infrared spectroscopy. Food Chem. X 2022, 15, 100430. [Google Scholar] [CrossRef] [PubMed]
  28. Ilo, B.; Rippon, D.; Singh, Y.; Shenfield, A.; Zhang, H. Real-Time Rice Milling Morphology Detection Using Hybrid Framework of YOLOv8 Instance Segmentation and Oriented Bounding Boxes. Electronics 2025, 14, 3691. [Google Scholar] [CrossRef]
  29. Atwell, B.J.; Wang, H.; Scafaro, A.P. Could abiotic stress tolerance in wild relatives of rice be used to improve Oryza sativa? Plant Sci. 2014, 215, 48–58. [Google Scholar] [CrossRef]
  30. Vaughan, D.A.; Morishima, H.; Kadowaki, K. Diversity in the Oryza genus. Curr. Opin. Plant Biol. 2003, 6, 139–146. [Google Scholar] [CrossRef]
  31. Wei, X.; Huang, X. Origin, taxonomy, and phylogenetics of rice. In Rice: Chemistry and Technology; Elsevier: Amsterdam, The Netherlands, 2018; pp. 1–29. [Google Scholar]
  32. Zhu, D.; Zheng, X.; Yu, J.; Chen, M.; Li, M.; Shao, Y. Effects of Starch Molecular Structure and Physicochemical Properties on Eating Quality of Indica Rice with Similar Apparent Amylose and Protein Contents. Foods 2023, 12, 3535. [Google Scholar] [CrossRef] [PubMed]
  33. Kowsalya, P.; Sharanyakanth, P.S.; Mahendran, R. Traditional rice varieties: A comprehensive review on its nutritional, medicinal, therapeutic and health benefit potential. J. Food Compos. Anal. 2022, 114, 104742. [Google Scholar] [CrossRef]
  34. Zhang, W.; Liu, Y.; Luo, X.; Zeng, X. Pasting, cooking, and digestible properties of Japonica rice with different amylose contents. Int. J. Food Prop. 2022, 25, 936–947. [Google Scholar] [CrossRef]
  35. Śliwińska-Bartel, M.; Burns, D.T.; Elliott, C. Rice fraud a global problem: A review of analytical tools to detect species, country of origin and adulterations. Trends Food Sci. Technol. 2021, 116, 36–46. [Google Scholar] [CrossRef]
  36. Van Nguyen, N.; Ferrero, A. Meeting the challenges of global rice production. Paddy Water Environ. 2006, 4, 1–9. [Google Scholar] [CrossRef]
  37. Singh, P.K.; Venkatesan, K.; Swarnam, T.P. Rice genetic resources in tropical islands. In Biodiversity and Climate Change Adaptation in Tropical Islands; Elsevier: Amsterdam, The Netherlands, 2018; pp. 355–384. [Google Scholar]
  38. Mwakyusa, L.; Dixit, S.; Herzog, M.; Heredia, M.C.; Madege, R.R.; Kilasi, N.L. Flood-tolerant rice for enhanced production and livelihood of smallholder farmers of Africa. Front. Sustain. Food Syst. 2023, 7, 1244460. [Google Scholar] [CrossRef]
  39. Yuan, S.; Linquist, B.A.; Wilson, L.T.; Cassman, K.G.; Stuart, A.M.; Pede, V.; Miro, B.; Saito, K.; Agustiani, N.; Aristya, V.E. Sustainable intensification for a larger global rice bowl. Nat. Commun. 2021, 12, 7163. [Google Scholar] [CrossRef]
  40. Pittelkow, C.M.; Adviento-Borbe, M.A.; Hill, J.E.; Six, J.; van Kessel, C.; Linquist, B.A. Yield-Scaled Global Warming Potential of Annual Nitrous Oxide and Methane Emissions from Continuously Flooded Rice in Response to Nitrogen Input. Agric. Ecosyst. Environ. 2013, 177, 10–20. [Google Scholar] [CrossRef]
  41. Muthayya, S.; Sugimoto, J.D.; Montgomery, S.; Maberly, G.F. An overview of global rice production, supply, trade, and consumption. Ann. N. Y. Acad. Sci. 2014, 1324, 7–14. [Google Scholar] [CrossRef]
  42. Shen, N.; Tan, J.; Wang, W.; Xue, W.; Wang, Y.; Huang, L.; Yan, G.; Song, Y.; Li, L. Long-term changes of methane emissions from rice cultivation during 2000–2060 in China: Trends, driving factors, predictions and policy implications. Environ. Int. 2024, 191, 108958. [Google Scholar] [CrossRef]
  43. Eyarkai Nambi, V.; Manickavasagan, A.; Shahir, S. Rice milling technology to produce brown rice. In Brown Rice; Springer International Publishing: Berlin/Heidelberg, Germany, 2017; pp. 3–21. [Google Scholar]
  44. Carcea, M.; Turfani, V.; Narducci, V.; Melloni, S.; Galli, V.; Tullio, V. Stone milling versus roller milling in soft wheat: Influence on products composition. Foods 2019, 9, 3. [Google Scholar] [CrossRef]
  45. Roy, P.; Orikasa, T.; Okadome, H.; Nakamura, N.; Shiina, T. Processing conditions, rice properties, health and environment. Int. J. Environ. Res. Public Health 2011, 8, 1957–1976. [Google Scholar] [CrossRef]
  46. Xiao, Y.; Jia, F.; Meng, X.; Han, Y. Breakpoint Planning Method for Rice Multibreak Milling. Foods 2023, 12, 1864. [Google Scholar] [CrossRef]
  47. Liu, K.; Cao, X.; Bai, Q.; Wen, H.; Gu, Z. Relationships between physical properties of brown rice and degree of milling and loss of selenium. J. Food Eng. 2009, 94, 69–74. [Google Scholar] [CrossRef]
  48. Muchlisyiyah, J.; Shamsudin, R.; Kadir Basha, R.; Shukri, R.; How, S.; Niranjan, K.; Onwude, D. Parboiled rice processing method, rice quality, health benefits, environment, and future perspectives: A review. Agriculture 2023, 13, 1390. [Google Scholar] [CrossRef]
  49. Chen, F.; Lu, Y.; Pan, L.; Fan, X.; Li, Q.; Huang, L.; Zhao, D.; Zhang, C.; Liu, Q. The underlying physicochemical properties and starch structures of indica rice grains with translucent endosperms under low-moisture conditions. Foods 2022, 11, 1378. [Google Scholar] [CrossRef]
  50. Mohidem, N.A.; Hashim, N.; Shamsudin, R.; Man, H.C. Rice for food security: Revisiting its production, diversity, rice milling process and nutrient content. Agriculture 2022, 12, 741. [Google Scholar] [CrossRef]
  51. Cornejo-Ramírez, Y.I.; Martínez-Cruz, O.; Del Toro-Sánchez, C.L.; Wong-Corral, F.J.; Borboa-Flores, J.; Cinco-Moroyoqui, F.J. Características estructurales de almidones y sus propiedades funcionales. CYTA J. Food 2018, 16, 1003–1017. [Google Scholar] [CrossRef]
  52. Zhang, H.; Jang, S.G.; Lar, S.M.; Lee, A.R.; Cao, F.Y.; Seo, J.; Kwon, S.W. Genome-wide identification and genetic variations of the starch synthase gene family in rice. Plants 2021, 10, 1154. [Google Scholar] [CrossRef]
  53. Siregar, S.; Nurhikmat, A.; Amdani, R.Z.; Hatmi, R.U.; Kobarsih, M.; Kusumaningrum, A.; Karim, M.A.; Dameswari, A.H.; Siswanto, N.; Siswoprayogi, S. Estimation of proximate composition in rice using ATR-FTIR spectroscopy and Chemometrics. ACS Omega 2024, 9, 32760–32768. [Google Scholar] [CrossRef]
  54. Vici, G.; Perinelli, D.R.; Camilletti, D.; Carotenuto, F.; Belli, L.; Polzonetti, V. Nutritional properties of rice varieties commonly consumed in Italy and applicability in gluten free diet. Foods 2021, 10, 1375. [Google Scholar] [CrossRef]
  55. Manzoor, A.; Pandey, V.K.; Dar, A.H.; Fayaz, U.; Dash, K.K.; Shams, R.; Ahmad, S.; Bashir, I.; Fayaz, J.; Singh, P. Rice bran: Nutritional, phytochemical, and pharmacological profile and its contribution to human health promotion. Food Chem. Adv. 2023, 2, 100296. [Google Scholar] [CrossRef]
  56. Müller, A.; Nunes, M.T.; Maldaner, V.; Coradi, P.C.; de Moraes, R.S.; Martens, S.; Leal, A.F.; Pereira, V.F.; Marin, C.K. Rice drying, storage and processing: Effects of post-harvest operations on grain quality. Rice Sci. 2022, 29, 16–30. [Google Scholar] [CrossRef]
  57. Jayaprakash, G.; Bains, A.; Chawla, P.; Fogarasi, M.; Fogarasi, S. A Narrative Review on Rice Proteins: Current Scenario and Food Industrial Application. Polymers 2022, 14, 3003. [Google Scholar] [CrossRef]
  58. Samaranayake, M.D.W.; Abeysekera, W.K.S.M.; Hewajulige, I.G.N.; Somasiri, H.P.P.S.; Mahanama, K.R.R.; Senanayake, D.M.J.B.; Premakumara, G.A.S. Fatty acid profiles of selected traditional and new improved rice varieties of Sri Lanka. J. Food Compos. Anal. 2022, 112, 104686. [Google Scholar] [CrossRef]
  59. Kim, D.S.; Kim, Q.W.; Kim, H.; Kim, H.J. Changes in the chemical, physical, and sensory properties of rice according to its germination rate. Food Chem. 2022, 388, 133060. [Google Scholar] [CrossRef]
  60. Maftoon Azad, N.; Alizadeh, A.; Kazemiyan Jahromi, A.; Ehsan Torkamani, A.; Baghaei, S.; Mirazimi Abarghuei, F. Effects of Thermodynamic Properties of Rice and Ambient Conditions on Moisture Migration during Storage at Naturally Ventilated Warehouses. Arab. J. Chem. 2023, 16, 104761. [Google Scholar] [CrossRef]
  61. Peng, B.; He, L.; Tan, J.; Zheng, L.; Zhang, J.; Qiao, Q.; Wang, Y.; Gao, Y.; Tian, X.; Liu, Z. Effects of Rice Aging on Its Main Nutrients and Quality Characters; Canadian Center of Science and Education: Toronto, ON, Canada, 2019. [Google Scholar]
  62. Rodrigues, D.M.; Coradi, P.C.; Teodoro, L.P.R.; Teodoro, P.E.; dos S. Moraes, R.; Leal, M.M. Monitoring and predicting corn grain quality on the transport and post-harvest operations in storage units using sensors and machine learning models. Sci. Rep. 2024, 14, 6232. [Google Scholar] [CrossRef]
  63. de Moraes, R.S.; Coradi, P.C.; Nunes, M.T.; Leal, M.M.; Müller, E.I.; Teodoro, P.E.; Flores, E.M.M. Thick layer drying and storage of rice grain cultivars in silo-dryer-aerator: Quality evaluation at low drying temperature. Heliyon 2023, 9, e17962. [Google Scholar] [CrossRef] [PubMed]
  64. Chen, P.; Chen, N.; Zhu, W.; Wang, D.; Jiang, M.; Qu, C.; Li, Y.; Zou, Z. A Heat and Mass Transfer Model of Peanut Convective Drying Based on a Two-Component Structure. Foods 2023, 12, 1823. [Google Scholar] [CrossRef]
  65. Ilias, I.A.; Wagiran, A.; Azizan, K.A.; Ismail, I.; Samad, A.F.A. Irreversibility of the cell wall modification acts as a limiting factor in desiccation tolerance of Oryza sativa ssp. Indica cv MR303. Plant Stress 2024, 12, 100463. [Google Scholar] [CrossRef]
  66. Wang, H.; Xiao, N.; Ding, J.; Zhang, Y.; Liu, X.; Zhang, H. Effect of germination temperature on hierarchical structures of starch from brown rice and their relation to pasting properties. Int. J. Biol. Macromol. 2020, 147, 965–972. [Google Scholar] [CrossRef] [PubMed]
  67. do Nascimento, L.Á.; Abhilasha, A.; Singh, J.; Elias, M.C.; Colussi, R. Rice Germination and Its Impact on Technological and Nutritional Properties: A Review. Rice Sci. 2022, 29, 201–215. [Google Scholar] [CrossRef]
  68. Beaulieu, J.C.; Boue, S.M.; Goufo, P. Health-promoting germinated rice and value-added foods: A comprehensive and systematic review of germination effects on brown rice. Crit. Rev. Food Sci. Nutr. 2023, 63, 11570–11603. [Google Scholar] [CrossRef]
  69. Plasek, B.; Lakner, Z.; Temesi, Á. Factors That Influence the Perceived Healthiness of Food—Review. Nutrients 2020, 12, 1881. [Google Scholar] [CrossRef] [PubMed]
  70. Rai, S.; Wai, P.P.; Koirala, P.; Bromage, S.; Nirmal, N.P.; Pandiselvam, R.; Nor-Khaizura, M.A.R.; Mehta, N.K. Food product quality, environmental and personal characteristics affecting consumer perception toward food. Front. Sustain. Food Syst. 2023, 7, 1222760. [Google Scholar] [CrossRef]
  71. Aznan, A.; Gonzalez Viejo, C.; Pang, A.; Fuentes, S. Rapid assessment of rice quality traits using low-cost digital technologies. Foods 2022, 11, 1181. [Google Scholar] [CrossRef]
  72. Dixon, W.R.; Morales-Contreras, B.E.; Kongchum, M.; Xu, Z.; Harrell, D.; Moskowitz, H.R.; Wicker, L. Aroma, Quality, and Consumer Mindsets for Shelf-Stable Rice Thermally Processed by Reciprocal Agitation. Foods 2020, 9, 1559. [Google Scholar] [CrossRef]
  73. Maleki, C.; Oliver, P.; Lewin, S.; Liem, G.; Keast, R. Preference Mapping of Different Water-to-Rice Ratios in Cooked Aromatic White Jasmine Rice. J. Food Sci. 2020, 85, 1576–1585. [Google Scholar] [CrossRef]
  74. Sultana, S.; Faruque, M.; Islam, M.R. Rice grain quality parameters and determination tools: A review on the current developments and future prospects. Int. J. Food Prop. 2022, 25, 1063–1078. [Google Scholar] [CrossRef]
  75. Qadir, N.; Wani, I.A. Physical properties of four rice cultivars grown in Indian temperate region. Appl. Food Res. 2023, 3, 100280. [Google Scholar] [CrossRef]
  76. Zhu, Y.; Xie, F.; Ren, J.; Jiang, F.; Zhao, N.; Du, S.k. Structural analysis, nutritional evaluation, and flavor characterization of parched rice made from proso millet. Food Chem. X 2023, 19, 100784. [Google Scholar] [CrossRef]
  77. Yi, Z.; Zhuohua, Z.; Likui, F.; Yunjun, Z.; Geng, Z. Impact of milling on the sensory quality and flavor profile of an aromatic rice variety produced in Chongqing. J. Cereal Sci. 2024, 116, 103844. [Google Scholar] [CrossRef]
  78. Ali, F.; Jighly, A.; Joukhadar, R.; Niazi, N.K.; Al-Misned, F. Current status and future prospects of head rice yield. Agriculture 2023, 13, 705. [Google Scholar] [CrossRef]
  79. Prom-U-Thai, C.; Rerkasem, B. Rice quality improvement: A review. Agron. Sustain. Dev. 2020, 40, 64. [Google Scholar] [CrossRef]
  80. Hebishy, E.; Buchanan, D.; Rice, J.; Oyeyinka, S.A. Variation in amylose content in three rice variants predominantly influences the properties of sushi rice. J. Food Meas. Charact. 2024, 18, 4545–4557. [Google Scholar] [CrossRef]
  81. Liu, X.; Shi, Z.; Zhang, Y.; Li, H.; Pei, H.; Yang, H. Characteristics of Damage to Brown Rice Kernels under Single and Continuous Mechanical Compression Conditions. Foods 2024, 13, 1069. [Google Scholar] [CrossRef]
  82. Venkatesan, S.; Udhaya Nandhini, D.; Senthilraja, K.; Prabha, B.; Jidhu Vaishnavi, S.; Eevera, T.; Somasundaram, E.; Balakrishnan, N.; Raveendran, M.; Geethalakshmi, V. Traditional cultivars influence on physical and engineering properties of rice from the cauvery deltaic region of Tamil Nadu. Appl. Sci. 2023, 13, 5705. [Google Scholar] [CrossRef]
  83. Singh, N.; Singh, H.; Kaur, K.; Singh Bakshi, M. Relationship between the degree of milling, ash distribution pattern and conductivity in brown rice. Food Chem. 2000, 69, 147–151. [Google Scholar] [CrossRef]
  84. Dhankhar, P.; Hissar, T. Rice Milling. IOSR J. Eng. 2014, 4, 34–42. [Google Scholar] [CrossRef]
  85. Cruz, N.D.; Khush, G. Rice grain quality evaluation procedures. Aromat. Rices 2000, 3, 15–28. [Google Scholar]
  86. Calingacion, M.; Laborte, A.; Nelson, A.; Resurreccion, A.; Concepcion, J.C.; Daygon, V.D.; Mumm, R.; Reinke, R.; Dipti, S.; Bassinello, P.Z. Diversity of global rice markets and the science required for consumer-targeted rice breeding. PLoS ONE 2014, 9, e85106. [Google Scholar] [CrossRef] [PubMed]
  87. Thissa Marasingha, M.M.M.; Samarakoon, E.R.J.; Senarathne, B.M.K.; Samarasinghe, H.G.A.S. Comparative Assessment of Grain Quality Characteristics and Cooking Parameters of White Rice (Oryza sativa Indica and Oryza sativa Japonica) Varieties Cultivated in Sri Lanka. Eng. Proc. 2024, 67, 58. [Google Scholar]
  88. Ren, D.; Ding, C.; Qian, Q. Molecular bases of rice grain size and quality for optimized productivity. Sci. Bull. 2023, 68, 314–350. [Google Scholar] [CrossRef]
  89. Sharma, A.; Jaiswal, H.K. Heterosis for yield and grain quality parameters in basmati rice (Oryza sativa L.). Electron. J. Plant Breed. 2020, 11, 1106–1115. [Google Scholar] [CrossRef]
  90. Tam, B.P.; Tu, P.T.B.; Pha, N.T. Identification of medium-grain rice based on GS3, a gene linked to rice grain size. Indones. J. Biotechnol. 2024, 29, 82–90. [Google Scholar] [CrossRef]
  91. Yin, C.; Li, H.; Li, S.; Xu, L.; Zhao, Z.; Wang, J. Genetic dissection on rice grain shape by the two-dimensional image analysis in one japonica × indica population consisting of recombinant inbred lines. Theor. Appl. Genet. 2015, 128, 1969–1986. [Google Scholar] [CrossRef]
  92. Arikit, S.; Wanchana, S.; Khanthong, S.; Saensuk, C.; Thianthavon, T.; Vanavichit, A.; Toojinda, T. QTL-seq identifies cooked grain elongation QTLs near soluble starch synthase and starch branching enzymes in rice (Oryza sativa L.). Sci. Rep. 2019, 9, 8328. [Google Scholar] [CrossRef]
  93. Lin, Z.; Zheng, D.; Zhang, X.; Wang, Z.; Lei, J.; Liu, Z.; Li, G.; Wang, S.; Ding, Y. Chalky part differs in chemical composition from translucent part of japonica rice grains as revealed by a notched-belly mutant with white-belly. J. Sci. Food Agric. 2016, 96, 3937–3943. [Google Scholar] [CrossRef]
  94. Singh, N.; Sodhi, N.S.; Kaur, M.; Saxena, S.K. Physico-chemical, morphological, thermal, cooking and textural properties of chalky and translucent rice kernels. Food Chem. 2003, 82, 433–439. [Google Scholar] [CrossRef]
  95. Chen, L.; Li, X.; Zheng, M.; Hu, R.; Dong, J.; Zhou, L.; Liu, W.; Liu, D.; Yang, W. Genes controlling grain chalkiness in rice. Crop J. 2024, 12, 979–991. [Google Scholar] [CrossRef]
  96. Kumar, A.; Thomas, J.; Gill, N.; Dwiningsih, Y.; Ruiz, C.; Famoso, A.; Pereira, A. Molecular mapping and characterization of QTLs for grain quality traits in a RIL population of US rice under high nighttime temperature stress. Sci. Rep. 2023, 13, 4880. [Google Scholar] [CrossRef]
  97. Aznan, A.; Gonzalez Viejo, C.; Pang, A.; Fuentes, S. Computer vision and machine learning analysis of commercial rice grains: A potential digital approach for consumer perception studies. Sensors 2021, 21, 6354. [Google Scholar] [CrossRef]
  98. Cuevas, R.P.; Pede, V.O.; McKinley, J.; Velarde, O.; Demont, M. Rice grain quality and consumer preferences: A case study of two rural towns in the Philippines. PLoS ONE 2016, 11, e0150345. [Google Scholar] [CrossRef]
  99. Paul, H.; Nath, B.C.; Golam, M.; Bhuiyan, K. Effect of Degree of Milling on Rice Grain Quality. J. Agric. Eng. 2019, 42, 69–76. [Google Scholar]
  100. Bergman, C.J. Rice end-use quality analysis. In Rice; Elsevier: Amsterdam, The Netherlands, 2019; pp. 273–337. [Google Scholar]
  101. Sun, H.; Xue, J.; Song, Y.; Wang, P.; Wen, Y.; Zhang, T. Detection of fruit tree diseases in natural environments: A novel approach based on stereo camera and deep learning. Eng. Appl. Artif. Intell. 2024, 137, 109148. [Google Scholar] [CrossRef]
  102. Lv, X.; Zhang, X.; Gao, H.; He, T.; Lv, Z.; Zhangzhong, L. When Crops Meet Machine Vision: A Review and Development Framework for a Low-Cost Nondestructive Online Monitoring Technology in Agricultural Production. Agric. Commun. 2024, 2, 100029. [Google Scholar] [CrossRef]
  103. El-Mesery, H.S.; Mao, H.; Abomohra, A.E.F. Applications of non-destructive technologies for agricultural and food products quality inspection. Sensors 2019, 19, 846. [Google Scholar] [CrossRef]
  104. Olorunfemi, B.O.; Nwulu, N.I.; Adebo, O.A.; Kavadias, K.A. Advancements in machine visions for fruit sorting and grading: A bibliometric analysis, systematic review, and future research directions. J. Agric. Food Res. 2024, 16, 101154. [Google Scholar] [CrossRef]
  105. Narendra, V.G.; Hareesh, K.S. Prospects of computer vision automated grading and sorting systems in agricultural and food products for quality evaluation. Int. J. Comput. Appl. 2010, 1, 1–12. [Google Scholar] [CrossRef]
  106. Razavi, S.M.A.; Farahmandfar, R. Effect of hulling and milling on the physical properties of rice grains. Int. Agrophysics 2008, 22, 353–359. [Google Scholar]
  107. Singathala, H.; Malla, J.; Lekkala, P. Quality Analysis and Classification of Rice Grains using Image Processing Techniques. Int. Res. J. Eng. Technol. 2023, 10, 311–315. [Google Scholar]
  108. Vu, H.; Duong, V.N.; Nguyen, T.T. Inspecting rice seed species purity on a large dataset using geometrical and morphological features. In Proceedings of the ACM International Conference Proceeding Series, Danang City, Vietnam, 6–7 December 2018; pp. 321–328. [Google Scholar]
  109. Jeong, E.; Abdellaoui, N.; Lim, J.; Seo, J.A. The presence of a significant endophytic fungus in mycobiome of rice seed compartments. Sci. Rep. 2024, 14, 23367. [Google Scholar] [CrossRef]
  110. Zareef, M.; Arslan, M.; Hassan, M.M.; Ahmad, W.; Ali, S.; Li, H.; Ouyang, Q.; Wu, X.; Hashim, M.M.; Chen, Q. Recent advances in assessing qualitative and quantitative aspects of cereals using nondestructive techniques: A review. Trends Food Sci. Technol. 2021, 116, 815–828. [Google Scholar] [CrossRef]
  111. Hussain, N.; Sun, D.W.; Pu, H. Classical and emerging non-destructive technologies for safety and quality evaluation of cereals: A review of recent applications. Trends Food Sci. Technol. 2019, 91, 598–608. [Google Scholar] [CrossRef]
  112. Xu, Y.; Zhong, P.; Jiang, A.; Shen, X.; Li, X.; Xu, Z.; Shen, Y.; Sun, Y.; Lei, H. Raman spectroscopy coupled with chemometrics for food authentication: A review. TrAC Trends Anal. Chem. 2020, 131, 116017. [Google Scholar] [CrossRef]
  113. Kawamura, S.; Natsuga, M.; Takekura, K.; Itoh, K. Development of an automatic rice-quality inspection system. Comput. Electron. Agric. 2003, 40, 115–126. [Google Scholar] [CrossRef]
  114. Osborne, B.; Mertens, B.; Thompson, M.; Fearn, T. The authentication of Basmati rice using near infrared spectroscopy. J. Near Infrared Spectrosc. 1993, 1, 77–83. [Google Scholar] [CrossRef]
  115. Kumar, D.; Jevin Christy, D.; Sakthibalan, S.; Srivind, J.; Kesavan, K.; Eevera, T.; Thilagar, S.H. Thermal imaging of paddy seeds for quality assessment. J. Trop. Agric. 2024, 62, 111–121. [Google Scholar]
  116. Gowen, A.A.; Tiwari, B.K.; Cullen, P.J.; McDonnell, K.; O’Donnell, C.P. Applications of thermal imaging in food quality and safety assessment. Trends Food Sci. Technol. 2010, 21, 190–200. [Google Scholar] [CrossRef]
  117. ElMasry, G.; ElGamal, R.; Mandour, N.; Gou, P.; Al-Rejaie, S.; Belin, E.; Rousseau, D. Emerging thermal imaging techniques for seed quality evaluation: Principles and applications. Food Res. Int. 2020, 131, 109025. [Google Scholar] [CrossRef]
  118. Lutz, É.; Coradi, P.C. Applications of New Technologies for Monitoring and Predicting Grains Quality Stored: Sensors, Internet of Things, and Artificial Intelligence. Measurement 2022, 188, 110609. [Google Scholar] [CrossRef]
  119. Danno, A.; Miyazato, M.; Ishiguro, E. Quality evaluation of agricultural products by infrared imaging method. Mem. Fac. Agric. Kagoshima Univ. 1980, 16, 157–164. [Google Scholar]
  120. Jamil, N.; Bejo, S.K. Husk Detection Using Thermal Imaging Technology. Agric. Agric. Sci. Procedia 2014, 2, 128–135. [Google Scholar] [CrossRef]
  121. Ginesu, G.; Giusto, D.D.; Margner, V.; Meinlschmidt, P. Detection of foreign bodies in food by thermal image processing. IEEE Trans. Ind. Electron. 2004, 51, 480–490. [Google Scholar] [CrossRef]
  122. Bejo-Khairunniza, S.; Azman, N.; Jamil, N. Paddy grading using thermal imaging technology. Int. Food Res. J. 2016, 23, S245. [Google Scholar]
  123. Aviara, N.A.; Liberty, J.T.; Olatunbosun, O.S.; Shoyombo, H.A.; Oyeniyi, S.K. Potential application of hyperspectral imaging in food grain quality inspection, evaluation and control during bulk storage. J. Agric. Food Res. 2022, 8, 100288. [Google Scholar] [CrossRef]
  124. An, D.; Zhang, L.; Liu, Z.; Liu, J.; Wei, Y. Advances in infrared spectroscopy and hyperspectral imaging combined with artificial intelligence for the detection of cereals quality. Crit. Rev. Food Sci. Nutr. 2023, 63, 9766–9796. [Google Scholar] [CrossRef]
  125. Saha, D.; Manickavasagan, A. Machine learning techniques for analysis of hyperspectral images to determine quality of food products: A review. Curr. Res. Food Sci. 2021, 4, 28–44. [Google Scholar] [CrossRef]
  126. Liu, Y.; Pu, H.; Sun, D.W. Hyperspectral Imaging Technique for Evaluating Food Quality and Safety during Various Processes: A Review of Recent Applications. Trends Food Sci. Technol. 2017, 69, 25–35. [Google Scholar] [CrossRef]
  127. Lin, H.; Wang, Z.; Ahmad, W.; Man, Z.; Duan, Y. Identification of rice storage time based on colorimetric sensor array combined hyperspectral imaging technology. J. Stored Prod. Res. 2020, 85, 101523. [Google Scholar] [CrossRef]
  128. Weng, S.; Tang, P.; Yuan, H.; Guo, B.; Yu, S.; Huang, L.; Xu, C. Hyperspectral imaging for accurate determination of rice variety using a deep learning network with multi-feature fusion. Spectrochim. Acta Part A Mol. Biomol. Spectrosc. 2020, 234, 118237. [Google Scholar] [CrossRef]
  129. Sun, H.; Zhang, L.; Li, H.; Rao, Z.; Ji, H. Nondestructive identification of barley seeds varieties using hyperspectral data from two sides of barley seeds. J. Food Process Eng. 2021, 44, e13769. [Google Scholar] [CrossRef]
  130. Deng, X.; Zhu, Q.; Huang, M. Semi-supervised classification of rice seed based on hyperspectral imaging technology. In Proceedings of the ASABE Annual International Meeting, Quebec, QC, Canada, 13–16 July 2014; American Society of Agricultural and Biological Engineers: St. Joseph, MI, USA, 2014. [Google Scholar]
  131. Wang, L.; Liu, D.; Pu, H.; Sun, D.W.; Gao, W.; Xiong, Z. Use of hyperspectral imaging to discriminate the variety and quality of rice. Food Anal. Methods 2015, 8, 515–523. [Google Scholar] [CrossRef]
  132. Li, B.; Zhao, M.; Zhou, Y.; Hou, B.; Zhang, D. Detection of Waxed Rice Using Visible-Near Infrared Hyperspectral Imaging. J. Food Nutr. Res. 2016, 4, 267–275. [Google Scholar]
  133. Zhao, C.; Lee, W.S.; He, D. Immature green citrus detection based on colour feature and sum of absolute transformed difference (SATD) using colour images in the citrus grove. Comput. Electron. Agric. 2016, 124, 243–253. [Google Scholar] [CrossRef]
  134. Femenias, A.; Gatius, F.; Ramos, A.J.; Teixido-Orries, I.; Marín, S. Hyperspectral imaging for the classification of individual cereal kernels according to fungal and mycotoxins contamination: A review. Food Res. Int. 2022, 155, 111102. [Google Scholar] [CrossRef]
  135. Ullrich, K.; von Elling, M.; Gutzeit, K.; Dix, M.; Weigold, M.; Aurich, J.C.; Wertheim, R.; Jawahir, I.S.; Ghadbeigi, H. AI-based optimisation of total machining performance: A review. CIRP J. Manuf. Sci. Technol. 2024, 50, 40–54. [Google Scholar] [CrossRef]
  136. Xu, Y.; Liu, X.; Cao, X.; Huang, C.; Liu, E.; Qian, S.; Liu, X.; Wu, Y.; Dong, F.; Qiu, C.W. Artificial intelligence: A powerful paradigm for scientific research. Innovation 2021, 2, 100179. [Google Scholar] [CrossRef]
  137. Zhu, L.; Spachos, P.; Pensini, E.; Plataniotis, K.N. Deep learning and machine vision for food processing: A survey. Curr. Res. Food Sci. 2021, 4, 233–249. [Google Scholar] [CrossRef]
  138. Naik, N.K.; Subbarao, M.V.; Sethy, P.K.; Behera, S.K.; Panigrahi, G.R. Machine learning with analysis-of-variance-based method for identifying rice varieties. J. Agric. Food Res. 2024, 18, 101397. [Google Scholar] [CrossRef]
  139. Mana, A.A.; Allouhi, A.; Hamrani, A.; Rahman, S.; el Jamaoui, I.; Jayachandran, K. Sustainable AI-based production agriculture: Exploring AI applications and implications in agricultural practices. Smart Agric. Technol. 2024, 7, 100416. [Google Scholar] [CrossRef]
  140. Meshram, V.; Patil, K.; Meshram, V.; Hanchate, D.; Ramkteke, S.D. Machine learning in agriculture domain: A state-of-art survey. Artif. Intell. Life Sci. 2021, 1, 100010. [Google Scholar] [CrossRef]
  141. Mahesh, B. Machine Learning Algorithms—A Review. Int. J. Sci. Res. 2020, 9, 381–386. [Google Scholar] [CrossRef]
  142. Sarker, I.H. Machine Learning: Algorithms, Real-World Applications and Research Directions. SN Comput. Sci. 2021, 2, 160. [Google Scholar] [CrossRef]
  143. Bansal, M.; Goyal, A.; Choudhary, A. A comparative analysis of K-nearest neighbor, genetic, support vector machine, decision tree, and long short term memory algorithms in machine learning. Decis. Anal. J. 2022, 3, 100071. [Google Scholar] [CrossRef]
  144. Dhaliwal, D.S.; Williams, M.M. Sweet corn yield prediction using machine learning models and field-level data. Precis. Agric. 2024, 25, 51–64. [Google Scholar] [CrossRef]
  145. Taherdoost, H. Deep Learning and Neural Networks: Decision-Making Implications. Symmetry 2023, 15, 1723. [Google Scholar] [CrossRef]
  146. Taye, M.M. Understanding of Machine Learning with Deep Learning: Architectures, Workflow, Applications and Future Directions. Computers 2023, 12, 91. [Google Scholar] [CrossRef]
  147. Schmidhuber, J. Deep learning in neural networks: An overview. Neural Netw. 2015, 61, 85–117. [Google Scholar] [CrossRef]
  148. Sitokonstantinou, V.; Koukos, A.; Drivas, T.; Kontoes, C.; Papoutsis, I.; Karathanassi, V. A scalable machine learning pipeline for paddy rice classification using multi-temporal sentinel data. Remote Sens. 2021, 13, 1769. [Google Scholar] [CrossRef]
  149. Wang, J.; Jiang, J. Unsupervised deep clustering via adaptive GMM modeling and optimization. Neurocomputing 2021, 433, 199–211. [Google Scholar] [CrossRef]
  150. Gambella, C.; Ghaddar, B.; Naoum-Sawaya, J. Optimization problems for machine learning: A survey. Eur. J. Oper. Res. 2021, 290, 807–828. [Google Scholar] [CrossRef]
  151. Archana, R.; Jeevaraj, P.E. Deep learning models for digital image processing: A review. Artif. Intell. Rev. 2024, 57, 11. [Google Scholar] [CrossRef]
  152. Attri, I.; Awasthi, L.K.; Sharma, T.P.; Rathee, P. A review of deep learning techniques used in agriculture. Ecol. Inform. 2023, 77, 102217. [Google Scholar]
  153. Tien, P.W.; Wei, S.; Darkwa, J.; Wood, C.; Calautit, J.K. Machine Learning and Deep Learning Methods for Enhancing Building Energy Efficiency and Indoor Environmental Quality – A Review. Energy AI 2022, 10, 100198. [Google Scholar] [CrossRef]
  154. Jeyaraj, P.R.; Asokan, S.P.; Samuel Nadar, E.R. Computer-Assisted Real-Time Rice Variety Learning Using Deep Learning Network. Rice Sci. 2022, 29, 489–498. [Google Scholar]
  155. Koklu, M.; Cinar, I.; Taspinar, Y.S. Classification of rice varieties with deep learning methods. Comput. Electron. Agric. 2021, 187, 106285. [Google Scholar] [CrossRef]
  156. Fayyazi, S.; Abbaspour-Fard, M.H.; Rohani, A.; Monadjemi, S.A.; Sadrnia, H. Identification and classification of three Iranian rice varieties in mixed bulks using image processing and MLP neural network. Int. J. Food Eng. 2017, 13. [Google Scholar] [CrossRef]
  157. Kiratiratanapruk, K.; Temniranrat, P.; Sinthupinyo, W.; Prempree, P.; Chaitavon, K.; Porntheeraphat, S.; Prasertsak, A. Development of paddy rice seed classification process using machine learning techniques for automatic grading machine. J. Sens. 2020, 2020, 7041310. [Google Scholar] [CrossRef]
  158. Chaugule, A.A.; Mali, S.N. Identification of paddy varieties based on novel seed angle features. Comput. Electron. Agric. 2016, 123, 415–422. [Google Scholar] [CrossRef]
  159. Wu, J.G.; Shi, C.H. Prediction of grain weight, brown rice weight and amylose content in single rice grains using near-infrared reflectance spectroscopy. Field Crops Res. 2004, 87, 13–21. [Google Scholar] [CrossRef]
  160. Shao, Y.; Cen, Y.; He, Y.; Liu, F. Infrared spectroscopy and chemometrics for the starch and protein prediction in irradiated rice. Food Chem. 2011, 126, 1856–1861. [Google Scholar] [CrossRef]
  161. Jin, B.; Zhang, C.; Jia, L.; Tang, Q.; Gao, L.; Zhao, G.; Qi, H. Identification of Rice Seed Varieties Based on Near-Infrared Hyperspectral Imaging Technology Combined with Deep Learning. ACS Omega 2022, 7, 4735–4749. [Google Scholar] [CrossRef]
  162. Kong, W.; Zhang, C.; Liu, F.; Nie, P.; He, Y. Rice seed cultivar identification using near-infrared hyperspectral imaging and multivariate data analysis. Sensors 2013, 13, 8916–8927. [Google Scholar] [CrossRef]
  163. Farahnakian, F.; Sheikh, J.; Farahnakian, F.; Heikkonen, J. A comparative study of state-of-the-art deep learning architectures for rice grain classification. J. Agric. Food Res. 2024, 15, 100890. [Google Scholar] [CrossRef]
  164. Sun, C.; Liu, T.; Ji, C.; Jiang, M.; Tian, T.; Guo, D.; Wang, L.; Chen, Y.; Liang, X. Evaluation and analysis the chalkiness of connected rice kernels based on image processing technology and support vector machine. J. Cereal Sci. 2014, 60, 426–432. [Google Scholar] [CrossRef]
  165. Chen, K.; Huang, M. Prediction of milled rice grades using Fourier transform near-infrared spectroscopy and artificial neural networks. J. Cereal Sci. 2010, 52, 221–226. [Google Scholar] [CrossRef]
  166. Zareiforoush, H.; Minaei, S.; Alizadeh, M.R.; Banakar, A. Qualitative classification of milled rice grains using computer vision and metaheuristic techniques. J. Food Sci. Technol. 2016, 53, 118–131. [Google Scholar] [CrossRef]
  167. Mandal, D. Adaptive neuro-fuzzy inference system based grading of basmati rice grains using image processing technique. Rom. J. Inf. Sci. Technol. 2019, 22, 19. [Google Scholar] [CrossRef]
  168. Ramdhani, Y.; Alamsyah, D.P. Enhancing Sustainable Rice Grain Quality Analysis with Efficient SVM Optimization Using Genetic Algorithm. E3S Web Conf. 2023, 426, 01035. [Google Scholar] [CrossRef]
  169. Kang, S.; Zhang, Q.; Wei, H.; Shi, Y. An efficient multiscale integrated attention method combined with hyperspectral system to identify the quality of rice with different storage periods and humidity. Comput. Electron. Agric. 2023, 213, 108259. [Google Scholar] [CrossRef]
  170. Debnath, O.; Saha, H.N. An IoT-based intelligent farming using CNN for early disease detection in rice paddy. Microprocess. Microsyst. 2022, 94, 104631. [Google Scholar] [CrossRef]
  171. Sun, M.; Huang, S.; Lu, Z.; Wang, M.; Zhang, S.; Yang, K.; Tang, B.; Yang, W.; Huang, C. A novel method for intelligent analysis of rice yield traits based on LED transmission imaging and cloud computing. Measurement 2023, 217, 113017. [Google Scholar] [CrossRef]
  172. Tian, F.; Tan, F.; Li, H. An rapid nondestructive testing method for distinguishing rice producing areas based on Raman spectroscopy and support vector machine. Vib. Spectrosc. 2020, 107, 103017. [Google Scholar] [CrossRef]
  173. Saha, K.K.; Al Riza, D.F.; Ogawa, Y.; Suzuki, T.; Sugimoto, T.; Kondo, N. Assessment of chalkiness index of Sake rice using transmission imaging. Spectrochim. Acta Part A Mol. Biomol. Spectrosc. 2022, 275, 121149. [Google Scholar] [CrossRef]
  174. Chen, S.; Xiong, J.; Guo, W.; Bu, R.; Zheng, Z.; Chen, Y.; Yang, Z.; Lin, R. Colored rice quality inspection system using machine vision. J. Cereal Sci. 2019, 88, 87–95. [Google Scholar] [CrossRef]
  175. Moses, K.; Miglani, A.; Kankar, P.K. Deep CNN-based damage classification of milled rice grains using a high-magnification image dataset. Comput. Electron. Agric. 2022, 195, 106811. [Google Scholar]
  176. Shi, Y.; Yuan, H.; Xiong, C.; Zhang, Q.; Jia, S.; Liu, J.; Men, H. Improving performance: A collaborative strategy for the multi-data fusion of electronic nose and hyperspectral to track the quality difference of rice. Sens. Actuators B Chem. 2021, 333, 129546. [Google Scholar] [CrossRef]
  177. Fan, F.; Chen, H.; Gao, Y.; Mou, T. Quantitative detection and sorting of broken kernels and chalky grains in milled rice using computer vision algorithms. J. Food Eng. 2024, 383, 112225. [Google Scholar] [CrossRef]
  178. Razavi, M.; Mavaddati, S.; Koohi, H. ResNet deep models and transfer learning technique for classification and quality detection of rice cultivars. Expert Syst. Appl. 2024, 247, 123276. [Google Scholar] [CrossRef]
  179. Pan, J.; Wang, T.; Wu, Q. RiceNet: A Two Stage Machine Learning Method for Rice Disease Identification. Biosyst. Eng. 2023, 225, 25–40. [Google Scholar] [CrossRef]
  180. Yuan, C.; Liu, T.; Gao, F.; Zhang, R.; Seng, X. YOLOv5s-CBAM-DMLHead: A lightweight identification algorithm for weedy rice (Oryza sativa f. spontanea) based on improved YOLOv5. Crop Prot. 2023, 172, 106342. [Google Scholar] [CrossRef]
  181. Krichen, M. Convolutional neural networks: A survey. Computers 2023, 12, 151. [Google Scholar] [CrossRef]
  182. Naranjo-Torres, J.; Mora, M.; Hernández-García, R.; Barrientos, R.J.; Fredes, C.; Valenzuela, A. A review of convolutional neural network applied to fruit image processing. Appl. Sci. 2020, 10, 3443. [Google Scholar] [CrossRef]
  183. Ang, K.M.; El-Kenawy, E.S.M.; Abdelhamid, A.A.; Ibrahim, A.; Alharbi, A.H.; Khafaga, D.S.; Tiang, S.S.; Lim, W.H. Optimal design of convolutional neural network architectures using teaching–learning-based optimization for image classification. Symmetry 2022, 14, 2323. [Google Scholar] [CrossRef]
  184. Hafiz, A.M.; Bhat, G.M. A Survey on Instance Segmentation: State of the Art. Int. J. Multimed. Inf. Retr. 2020, 9, 171–189. [Google Scholar] [CrossRef]
  185. Zhang, Q.; Liu, Y.; Gong, C.; Chen, Y.; Yu, H. Applications of deep learning for dense scenes analysis in agriculture: A review. Sensors 2020, 20, 1520. [Google Scholar] [CrossRef]
  186. Champ, J.; Mora-Fallas, A.; Goëau, H.; Mata-Montero, E.; Bonnet, P.; Joly, A. Instance segmentation for the fine detection of crop and weed plants by precision agricultural robots. Appl. Plant Sci. 2020, 8, e11373. [Google Scholar] [CrossRef] [PubMed]
  187. Niu, C.; Li, H.; Niu, Y.; Zhou, Z.; Bu, Y.; Zheng, W. Segmentation of cotton leaves based on improved watershed algorithm. In Proceedings of the 9th IFIP WG 5.14 International Conference, CCTA 2015, Beijing, China, 27–30 September 2015; Springer: Berlin/Heidelberg, Germany, 2015; pp. 425–436. [Google Scholar]
  188. Pham, V.H.; Lee, B.R. An Image Segmentation Approach for Fruit Defect Detection Using K-Means Clustering and Graph-Based Algorithm. Vietnam J. Comput. Sci. 2015, 2, 25–33. [Google Scholar] [CrossRef]
  189. Clement, J.; Novas, N.; Gazquez, J.A.; Manzano-Agugliaro, F. An active contour computer algorithm for the classification of cucumbers. Comput. Electron. Agric. 2013, 92, 75–81. [Google Scholar] [CrossRef]
  190. Ma, J.; Du, K.; Zhang, L.; Zheng, F.; Chu, J.; Sun, Z. A Segmentation Method for Greenhouse Vegetable Foliar Disease Spots Images Using Color Information and Region Growing. Comput. Electron. Agric. 2017, 142, 110–117. [Google Scholar] [CrossRef]
  191. Tian, Y.; Yang, G.; Wang, Z.; Li, E.; Liang, Z. Instance segmentation of apple flowers using the improved Mask R–CNN model. Biosyst. Eng. 2020, 193, 264–278. [Google Scholar] [CrossRef]
  192. Lin, G.; Tang, Y.; Zou, X.; Wang, C. Three-dimensional reconstruction of guava fruits and branches using instance segmentation and geometry analysis. Comput. Electron. Agric. 2021, 184, 106107. [Google Scholar] [CrossRef]
  193. Carranza-García, M.; Torres-Mateo, J.; Lara-Benítez, P.; García-Gutiérrez, J. On the performance of one-stage and two-stage object detectors in autonomous vehicles using camera data. Remote Sens. 2020, 13, 89. [Google Scholar] [CrossRef]
  194. Hassan, E.; El-Rashidy, N.; Talaa, F.M. Review: Mask R-CNN Models. Nile J. Commun. Comput. Sci. 2022, 3, 17–27. [Google Scholar] [CrossRef]
  195. Hoogenboom, G. Contribution of agrometeorology to the simulation of crop production and its applications. Agric. For. Meteorol. 2000, 103, 137–157. [Google Scholar] [CrossRef]
  196. Sapkota, R.; Ahmed, D.; Karkee, M. Comparing YOLOv8 and Mask R-CNN for instance segmentation in complex orchard environments. Artif. Intell. Agric. 2024, 13, 84–99. [Google Scholar] [CrossRef]
  197. Wang, S.; Sun, G.; Zheng, B.; Du, Y. A crop image segmentation and extraction algorithm based on Mask RCNN. Entropy 2021, 23, 1160. [Google Scholar] [CrossRef]
  198. Afzaal, U.; Bhattarai, B.; Pandeya, Y.R.; Lee, J. An instance segmentation model for strawberry diseases based on mask R-CNN. Sensors 2021, 21, 6565. [Google Scholar] [CrossRef]
  199. Osorio, K.; Puerto, A.; Pedraza, C.; Jamaica, D.; Rodríguez, L. A Deep Learning Approach for Weed Detection in Lettuce Crops Using Multispectral Images. AgriEngineering 2020, 2, 471–488. [Google Scholar] [CrossRef]
  200. Safonova, A.; Guirado, E.; Maglinets, Y.; Alcaraz-Segura, D.; Tabik, S. Olive tree biovolume from UAV multi-resolution image segmentation with Mask R-CNN. Sensors 2021, 21, 1617. [Google Scholar] [CrossRef] [PubMed]
  201. Soviany, P.; Ionescu, R.T. Optimizing the Trade-off between Single-Stage and Two-Stage Object Detectors Using Image Difficulty Prediction. arXiv 2018, arXiv:1803.08707. [Google Scholar]
  202. Hussain, M.; He, L.; Schupp, J.; Lyons, D.; Heinemann, P. Green fruit segmentation and orientation estimation for robotic green fruit thinning of apples. Comput. Electron. Agric. 2023, 207, 107734. [Google Scholar] [CrossRef]
  203. Seol, J.; Kim, J.; Son, H.I. Field evaluations of a deep learning-based intelligent spraying robot with flow control for pear orchards. Precis. Agric. 2022, 23, 712–732. [Google Scholar] [CrossRef]
  204. Zhang, L.; Ding, G.; Li, C.; Li, D. DCF-YOLOv8: An Improved Algorithm for Aggregating Low-Level Features to Detect Agricultural Pests and Diseases. Agronomy 2023, 13, 2012. [Google Scholar] [CrossRef]
  205. Wang, X.; Liu, J. Vegetable disease detection using an improved YOLOv8 algorithm in the greenhouse plant environment. Sci. Rep. 2024, 14, 4261. [Google Scholar] [CrossRef] [PubMed]
  206. Yang, G.; Wang, J.; Nie, Z.; Yang, H.; Yu, S. A Lightweight YOLOv8 Tomato Detection Algorithm Combining Feature Enhancement and Attention. Agronomy 2023, 13, 1824. [Google Scholar] [CrossRef]
  207. Jahangirlou, M.R.; Morel, J.; Akbari, G.A.; Alahdadi, I.; Soufizadeh, S.; Parsons, D. Combined use of APSIM and logistic regression models to predict the quality characteristics of maize grain. Eur. J. Agron. 2023, 142, 126629. [Google Scholar] [CrossRef]
  208. Yang, Z.; Ren, J.; Zhang, Z.; Sun, Y.; Zhang, C.; Wang, M.; Wang, L. A New Three-Way Incremental Naive Bayes Classifier. Electronics 2023, 12, 1730. [Google Scholar] [CrossRef]
  209. Bhargava, A.; Bansal, A. Fruits and vegetables quality evaluation using computer vision: A review. J. King Saud-Univ.-Comput. Inf. Sci. 2021, 33, 243–257. [Google Scholar] [CrossRef]
  210. Chuquimarca, L.E.; Vintimilla, B.X.; Velastin, S.A. A review of external quality inspection for fruit grading using CNN models. Artif. Intell. Agric. 2024, 14, 1–20. [Google Scholar] [CrossRef]
  211. Mahamat, A.A.; Boukar, M.M.; Leklou, N.; Celino, A.; Obianyo, I.I.; Bih, N.L.; Stanislas, T.T.; Savastanos, H. Decision Tree Regression vs. Gradient Boosting Regressor Models for the Prediction of Hygroscopic Properties of Borassus Fruit Fiber. Appl. Sci. 2024, 14, 7540. [Google Scholar] [CrossRef]
  212. Esmaili, M.; Aliniaeifard, S.; Mashal, M.; Vakilian, K.A.; Ghorbanzadeh, P.; Azadegan, B.; Seif, M.; Didaran, F. Assessment of adaptive neuro-fuzzy inference system (ANFIS) to predict production and water productivity of lettuce in response to different light intensities and CO2 concentrations. Agric. Water Manag. 2021, 258, 107201. [Google Scholar] [CrossRef]
  213. Tomar, V.; Bansal, M.; Singh, P. Metaheuristic Algorithms for Optimization: A Brief Review. Eng. Proc. 2023, 59, 238. [Google Scholar]
  214. Singh, A.; Raj, K.; Meghwar, T.; Roy, A.M. Efficient Paddy Grain Quality Assessment Approach Utilizing Affordable Sensors. AI 2024, 5, 686–703. [Google Scholar] [CrossRef]
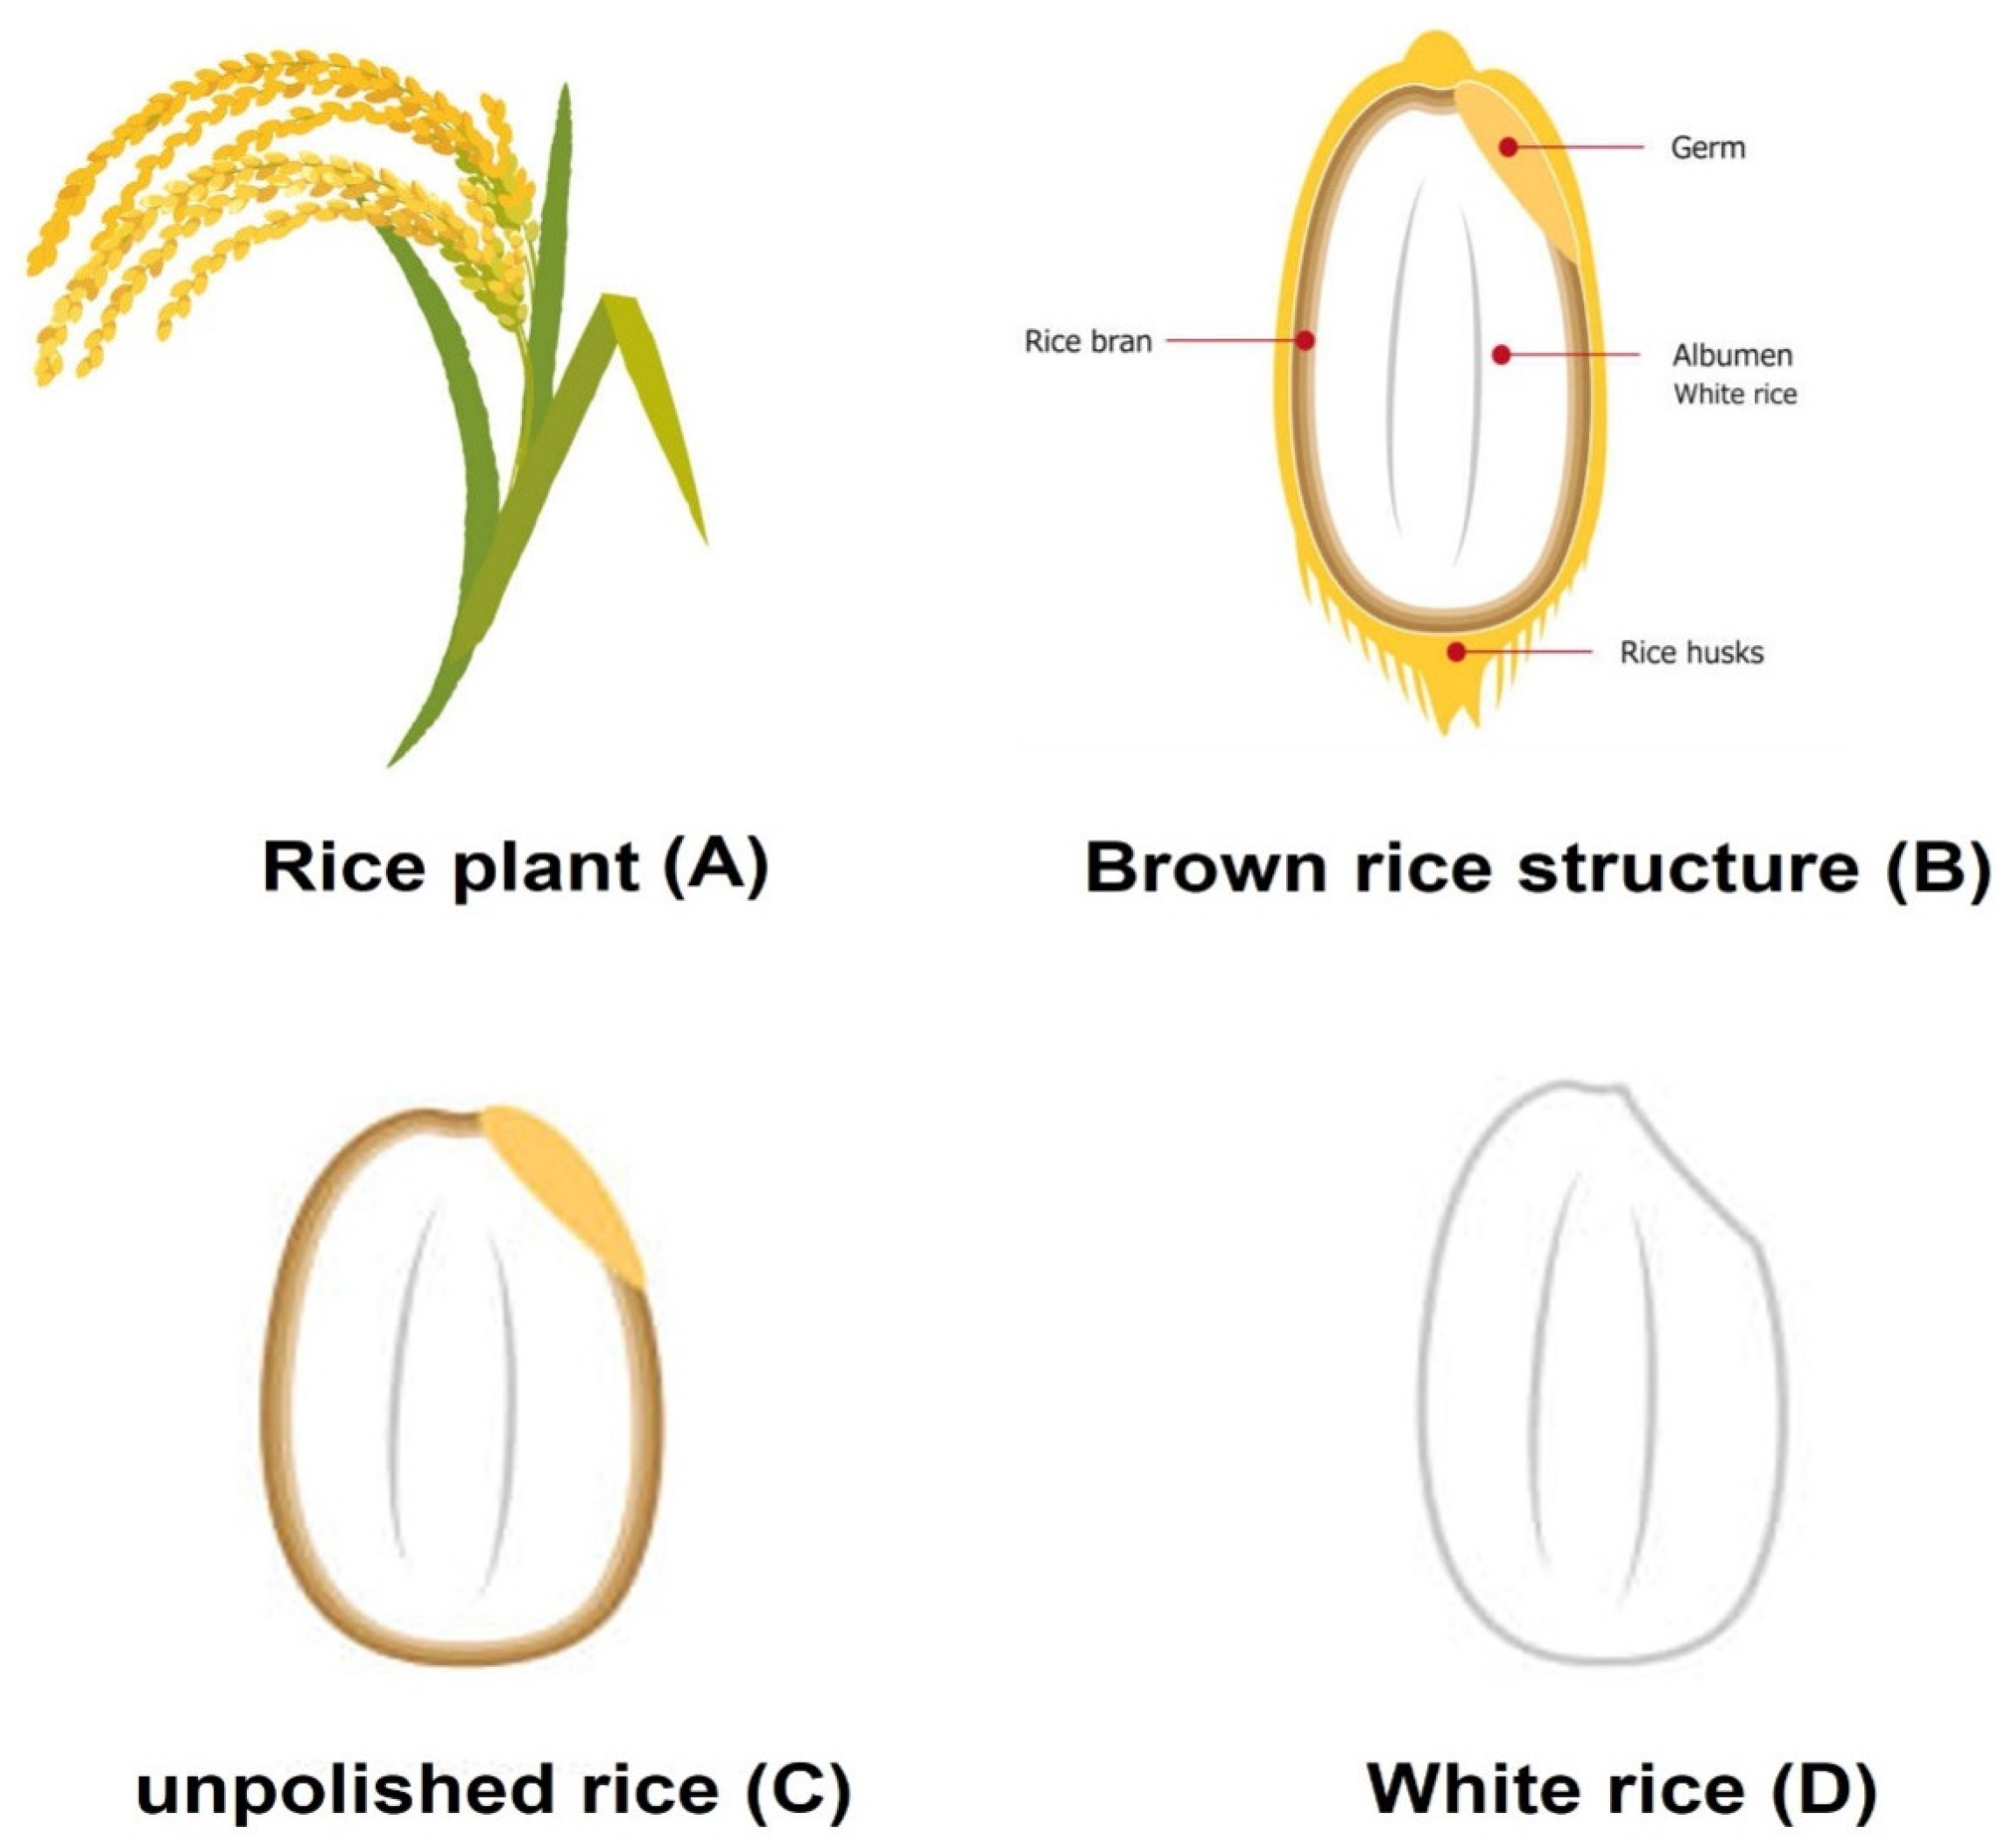
Figure 1. Represents (A) rice plant (B) brown rice structure (C) unpolished rice and (D) polished white rice.
Processes 13 03731 g001
Figure 2. PRISMA flow diagram of procedure used in this review.
Processes 13 03731 g002
Figure 3. Review protocol of contents used.
Processes 13 03731 g003
Figure 4. Schematic representation of milling of whole rice grain.
Processes 13 03731 g004
Figure 5. Variations in length and width of raw and cooked rice cultivars [92].
Processes 13 03731 g005
Figure 6. The illustration shows the structural differences between translucent and chalky rice grains. T1 and T2 refer to the upper and lower sections of the translucent grain, while C1 and C2 mark the corresponding regions of the chalky grain. Among these, T1, T2, and C1 are transparent, whereas C2 is opaque [93].
Processes 13 03731 g006
Figure 7. The rice seed’s biological structure, annotated with reference points, was used to guide normalization, which was performed according to seed orientation and the specified reference markers [109].
Processes 13 03731 g007
Figure 8. (a) Rice seed biological structure highlighting reference points. (b) Normalization rules applied based on seed orientation and reference points [108].
Processes 13 03731 g008
Figure 9. Schematic representation of a food inspection system integrating thermal imaging [121].
Processes 13 03731 g009
Figure 10. Thermal images of paddy seeds with varying husk quantities are shown in (a), alongside binary images obtained through simple thresholding to highlight husk areas as white pixels in (b). Paddy husks are depicted as darker regions in thermal images, owing to their reduced thermal conductivity and lower temperature relative to the rice seeds. Adapted from [120].
Processes 13 03731 g010
Figure 13. Schematic architecture of ANN.
Processes 13 03731 g013
Figure 14. Typical network architecture of a sequential CNN [183].
Processes 13 03731 g014
Figure 15. Conceptual illustration of the architecture of Fast R-CNN.
Processes 13 03731 g015
Table 1. Size classification used by the International Rice Research Institute [85].
Grain TypeLength (mm)Scale
Very long≥7.501
Long 6.61 to 7.50 3
Medium 5.51 to 6.60 5
Short≤5.507
Table 2. Shape classification used by the International Rice Research Institute [85].
Grain TypeLength (mm)Scale
Slender≥3.01
Medium 2.1 to 3.0 5
Bold≤2.09
Disclaimer/Publisher’s Note: The statements, opinions and data contained in all publications are solely those of the individual author(s) and contributor(s) and not of MDPI and/or the editor(s). MDPI and/or the editor(s) disclaim responsibility for any injury to people or property resulting from any ideas, methods, instructions or products referred to in the content.