Article

Inducing Interconnected Fractures in Granite via Pulsed Power Plasma Using Nanoparticles: A Waterless Stimulation Approach for Enhanced Geothermal Systems

1
Petroleum Engineering Department, University of Houston, Houston, TX 77204, USA
2
Petroleum Engineering Department, Faculty of Engineering, Cairo University, Giza 3725121, Egypt
*
Authors to whom correspondence should be addressed.
Processes 2025, 13(11), 3721; https://doi.org/10.3390/pr13113721
Submission received: 20 October 2025 / Revised: 12 November 2025 / Accepted: 17 November 2025 / Published: 18 November 2025

Abstract

This study introduces nanoparticle-enhanced pulsed power plasma stimulation (NP-3PS) as a waterless fracturing technology for enhanced geothermal systems (EGS), employing ultrafast high-pressure plasma discharges from a 20 kJ capacitor charged to 40 kV to initiate and propagate complex fractures in 8-inch (20.32 cm) granite cubes via single pulses of 10, 12, and 16 kJ and a staged 4 + 6 kJ sequence. A 2-inch (5.03 cm) borehole was filled with nanofluid containing 0.3 wt % aluminum NP (60–80 nm) suspended in 7 wt % potassium chloride (KCl) + 0.18 wt % guar gum to sustain thermite reactions and multi-cycle shockwaves, generating peak pressures exceeding 100,000 psi (690 MPa) within microseconds. Post-stimulation diagnostics using 13 µm micro-CT, thin-section microscopy, and acoustic velocity analysis revealed dense branched fractures, porosity increase from 1.3% to 4.6% (~250%), and thermal conductivity reduction of 9–16%, indicating enhanced permeability and convective heat-transfer potential. The NP-driven multi-pulse mechanism reactivated existing fractures at lower energy without wire replacement, establishing a quantitative framework linking plasma dynamics, rock damage evolution, and thermal response, thus confirming NP-3PS as a scalable and sustainable alternative to hydraulic fracturing for geothermal reservoir stimulation.

1. Introduction

Contemporary energy systems grapple with two primary challenges: satisfying the rising global energy needs while minimizing environmental impact. As the shift to sustainable energy gains momentum, subsurface engineering, especially rock fracturing, becomes increasingly critical. Engineered fractures in subsurface formations are foundational to key industries. For instance, more than 95% of oil and gas extraction from unconventional shale reservoirs [1,2] and 80–90% of EGS [3,4,5] depend on horizontal drilling paired with hydraulic fracturing (HF). Recent studies also demonstrate the value of these methods in boosting mining extraction efficiency [6].
HF continues to dominate as the leading method for tapping into low-permeability unconventional reservoirs. However, it poses escalating environmental and operational difficulties. A typical horizontal well requires 15–25 million liters (4–6.6 million gallons) of water, straining freshwater resources, particularly in arid areas [7]. Furthermore, HF triggers low-magnitude seismic events (~1–2.0) in 5–10% of instances [8,9,10,11,12], largely due to changes in formation pressure and fault activation. The technique also contributes notably to greenhouse gas emissions, with proppant transport and injection accounting for 8–12% of a well’s total lifecycle emissions [13,14]. These concerns, alongside risks of erratic fracture growth and significant fluid loss, highlight the pressing need for alternative subsurface completion strategies.
Electrohydraulic fracturing (EHF) emerges as a promising alternative, employing high-voltage electrical pulses to generate stress and initiate rock fractures [15]. The application of EHF for enhanced oil recovery was first explored in 1968 [16]. In practice, energy stored in capacitors is discharged via wellbore electrodes, creating plasma and shockwaves that can damage the reservoir, with fracture scale tied to the energy released. EHF operates primarily in two modes: pulsed corona electrohydraulic discharge (PCED) and pulsed arc electrohydraulic discharge (PAED) [17,18].
PCED uses low-energy, high-voltage discharges to produce non-thermal plasma [17,18]. This occurs in localized areas near electrode tips when the electric field surpasses the dielectric breakdown threshold of the surrounding liquid. The resulting pulse emits ultraviolet light and reactive chemicals, effective for chemical reactions and sterilization. However, its limited shockwave production offers little mechanical impact, making it unsuitable for fracturing reservoirs physically.
In contrast, PAED is a high-energy method that delivers strong electrical arcs between submerged electrodes [19]. Exceeding the medium’s disintegration voltage forms conductive plasma channels, releasing substantial energy. This causes rapid evaporation, bubble expansion, and shockwaves, leading to significant cavitation. The blend of mechanical forces from shocks and thermal stresses makes PAED highly effective for rock fracturing. Electrodes are designed to endure extreme conditions, handling thousand-ampere pulses in the microsecond range. PAED creates dispersed micro-fractures through rapid stress changes, differing from HF’s quasi-static approach [20]. Rock permeability increases partially when energy reaches a critical level, even without visible fractures [21,22]. Yet, its effectiveness wanes in complex subsurface conditions, such as high thermal and fluid conductivity [23], and energy losses from water dispersion and cavitation reduce efficiency. Studies indicate less than 25% of electrical energy converts to mechanical force via shockwaves [24,25], limiting its use for long-term flow enhancement in HF treatments.
Pulsed power plasma stimulation (3PS) advances beyond traditional PAED, generating robust plasma that triggers an intense thermite reaction [18,26]. This involves placing a fusible link or metallic powders, often aluminum (Al), between underwater electrodes to enhance the electrical discharge. The reaction between ionized Al and water creates a highly exothermic process, potentially amplifying energy release severalfold [18]. Unlike HF’s bi-wing fracture patterns, 3PS fosters numerous micro-fractures linked to existing fissures, greatly enhancing rock permeability.
Figure 1 illustrates the key differences between 3PS and other rock stimulation techniques, including HF, gas gun, and explosives, each with distinct pressure profiles and energy delivery times. HF applies pressure gradually, reaching around 5000 psi (34.5 MPa) over an hour [27], promoting fracture growth along existing strata but requiring large water and proppant volumes, raising issues like groundwater contamination and induced seismicity. The extended duration also leads to thermal and pressure losses, reducing effectiveness in unconventional rocks.
Conversely, 3PS delivers a rapid, high-intensity pressure pulse up to 100,000 psi (690 MPa) in microseconds [26]. This is achieved by vaporizing a metallic medium in a conductive fluid, producing transient plasma and ultrasonic shockwaves. The high stress rates create complex fracture networks, even in ultra-low permeability formations like shale or igneous rocks. Compared to HF, 3PS uses less fluid, lowers environmental impact, and reduces seismic risk, making it a promising option for geothermal energy, unconventional hydrocarbon recovery, and advanced mining.
EGS harnesses heat from deep underground to generate renewable energy, relying heavily on effective fracture networks to enhance heat extraction efficiency [28,29]. Traditional HF methods, while effective, face limitations in ultra-deep or high-temperature environments due to water loss and thermal degradation of proppants [30]. In contrast, 3PS’s ability to induce micro-fractures with minimal fluid usage offers a sustainable alternative, particularly in regions with limited water availability [26].
Moreover, the integration of 3PS with thermal storage systems in EGS can optimize energy recovery. The rapid shockwaves and thermal energy release from 3PS can enhance heat transfer within fractured reservoirs, improving the storage and retrieval of thermal energy [31]. Recent advancements suggest that combining 3PS with advanced monitoring techniques, such as distributed acoustic sensing, can provide real-time data on fracture propagation and thermal performance, further refining EGS operations [32]. This approach not only boosts the economic viability of EGS projects but also aligns with global efforts to transition to carbon-neutral energy sources [33].
The exploration phase of EGS also benefits from 3PS’s precision. Unlike explosive methods that risk uncontrolled fracturing, 3PS allows targeted stimulation, reducing the likelihood of short-circuiting heat exchange systems [34]. Additionally, the reduced seismic footprint of 3PS compared to HF minimizes community concerns, facilitating regulatory approval for EGS projects in seismically sensitive areas [35]. As research progresses, the scalability of 3PS for large-scale EGS deployments remains a key area of investigation, promising to revolutionize geothermal energy extraction and utilization.

2. Nanoparticle-Enhanced Pulsed Power Plasma Stimulation

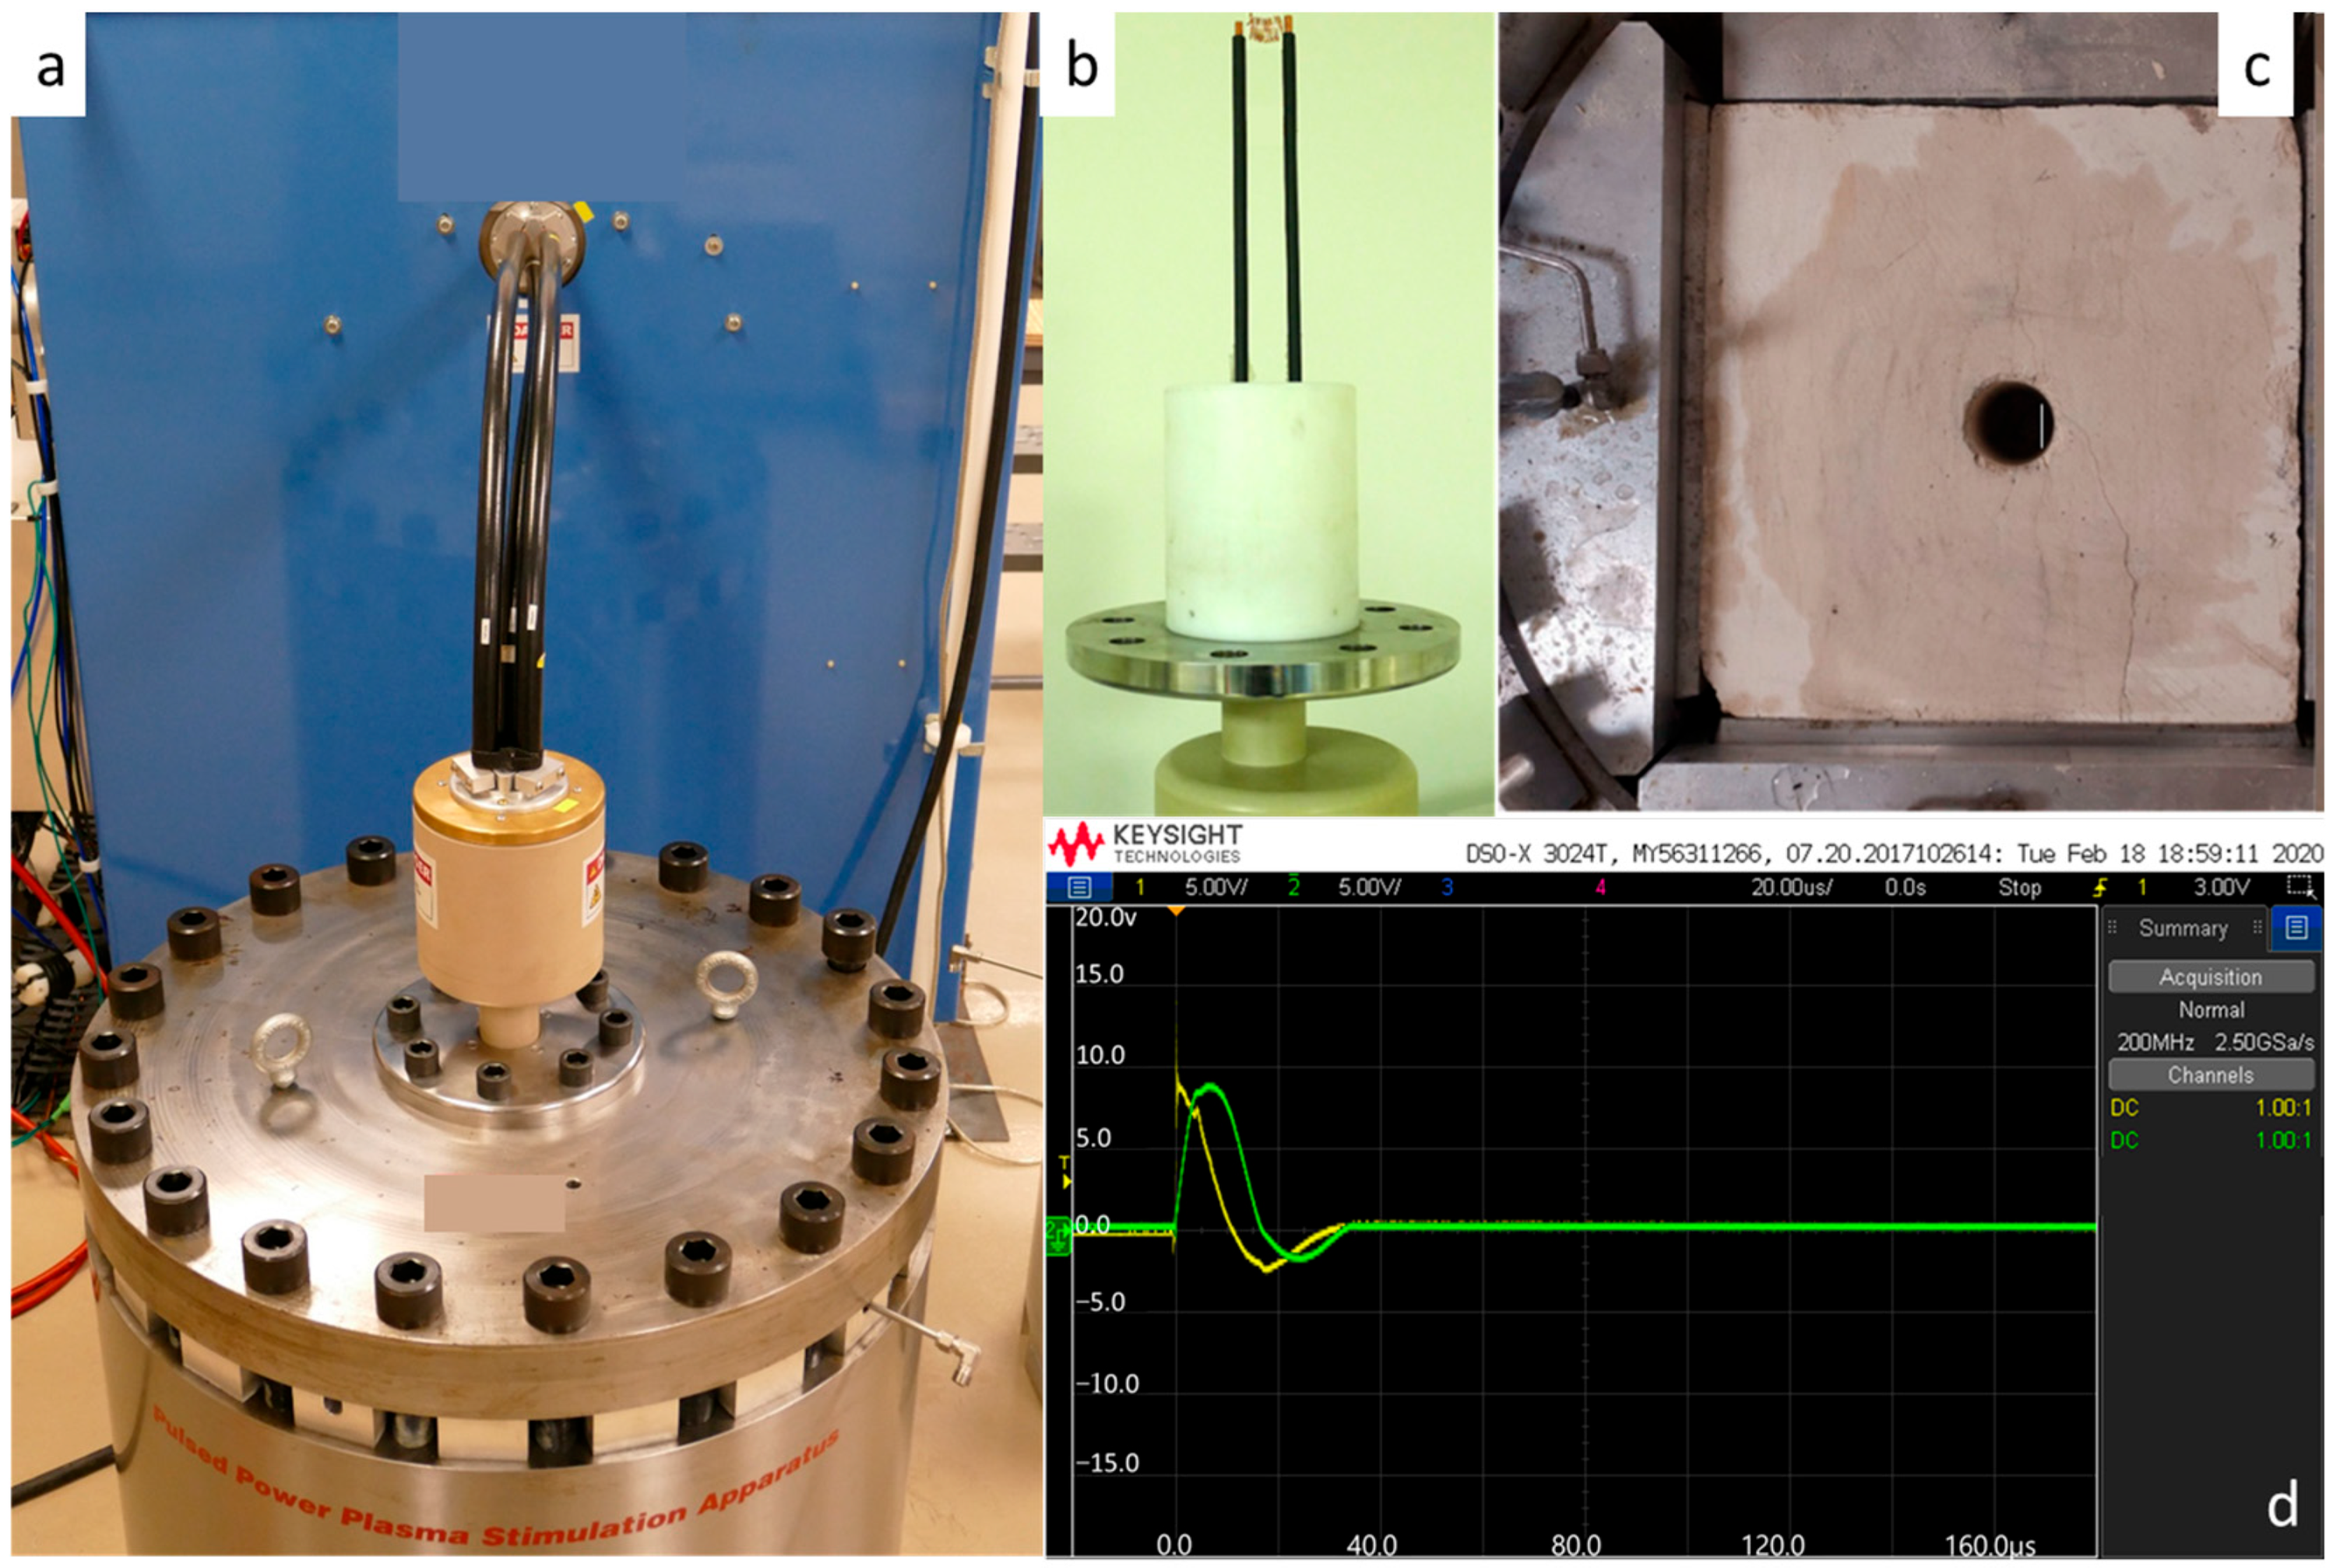
The utilization of high-voltage pulsed discharges for rock stimulation has undergone significant advancements over the past decade. Initial studies, such as those by Bazargan et al. [36], showcased the use of plasma torch perforation as a preliminary step to HF in unconventional reservoirs. Soliman’s patent (2019) [37] further emphasized the potential of shockwave-assisted fracturing to generate multiple fracture planes, reducing dependence on traditional water-heavy techniques. Building on this foundation, research conducted at the University of Houston’s Petroleum Engineering Department since 2020 has propelled 3PS forward through experiments on 14” (35.56 cm) cubic rock samples. Early trials employed Al wires to initiate thermite reactions and plasma stimulation within true triaxial cells (Figure 2). The experimental setup featured capacitors for energy storage, connectors with Al wires, and monitoring equipment to capture voltage, current, and post-pulse fracture visibility (Figure 2). Works by Rezaei et al. [38] examined the impact of discharge energy on rock damage under various confining stresses, while Khalaf et al. [39] conducted both numerical and experimental analyses to compare shockwave stimulation outcomes. Soliman et al. [18] consolidated these efforts, underscoring 3PS’s effectiveness in waterless fracturing to enhance near-wellbore permeability and estimated ultimate recovery (EUR) in unconventional reservoirs.
A comprehensive review by Nguyen et al. [26] evaluates the 3PS application across diverse geological settings with a focus on field trials. Nguyen et al. report that 3PS, when optimized with energy inputs of 5–15 kJ per pulse, achieved fracture network enhancements up to 30% greater than conventional HF in low-permeability shale, as validated by microseismic monitoring. Meanwhile, challenges include electrode wear and energy loss in highly conductive fluids, but the study proposes adaptive electrode designs and real-time energy modulation as viable solutions. This review positions 3PS as a transformative approach for energy extraction, particularly in water-scarce regions.
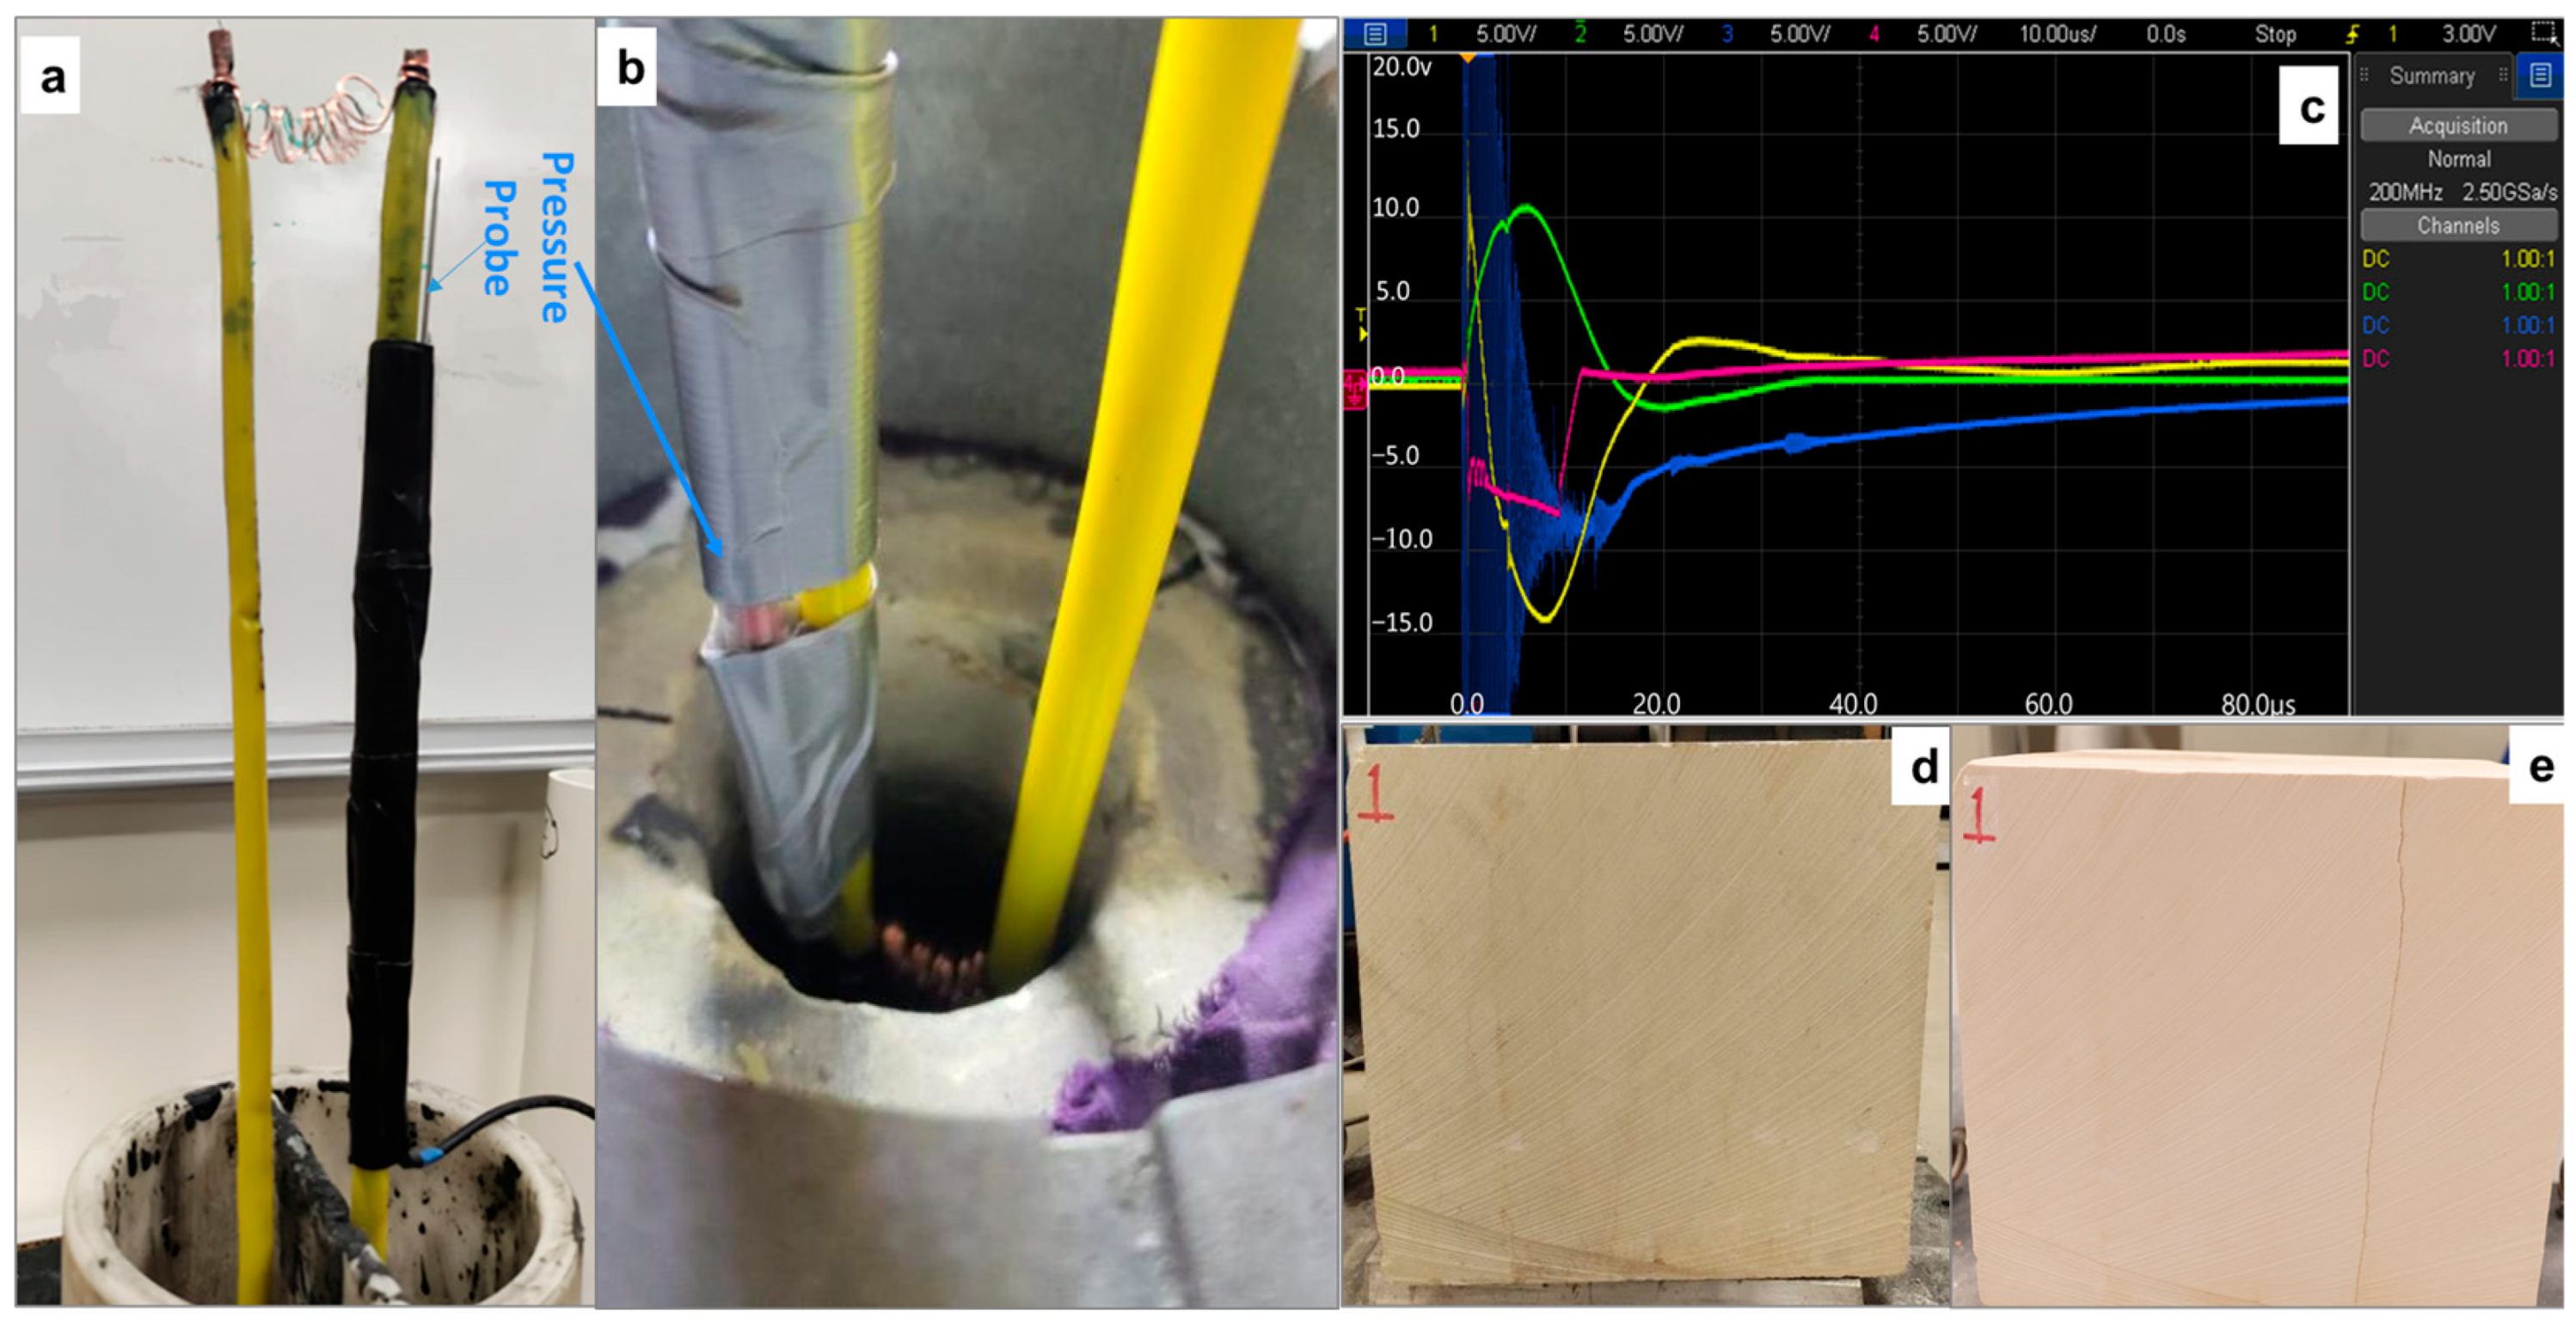
Despite its potential, the fusible wire method in 3PS has notable drawbacks. Each stimulation cycle relies on the complete vaporization of the Al wire, resulting in a single pressure peak and shockwave per discharge (Figure 2d). After each test, the connector must be disassembled, the wire replaced, and the system recalibrated before the next stimulation, limiting scalability and continuous fracture development while increasing downtime. Reproduced experiments confirmed that the wire-3PS system produces only one thermite cycle (Figure 3c), leading to a single major pressure peak and stimulation event. While effective at generating fractures (Figure 3e), the inability to sustain multiple cycles within a single discharge restricts energy efficiency and fracture complexity.
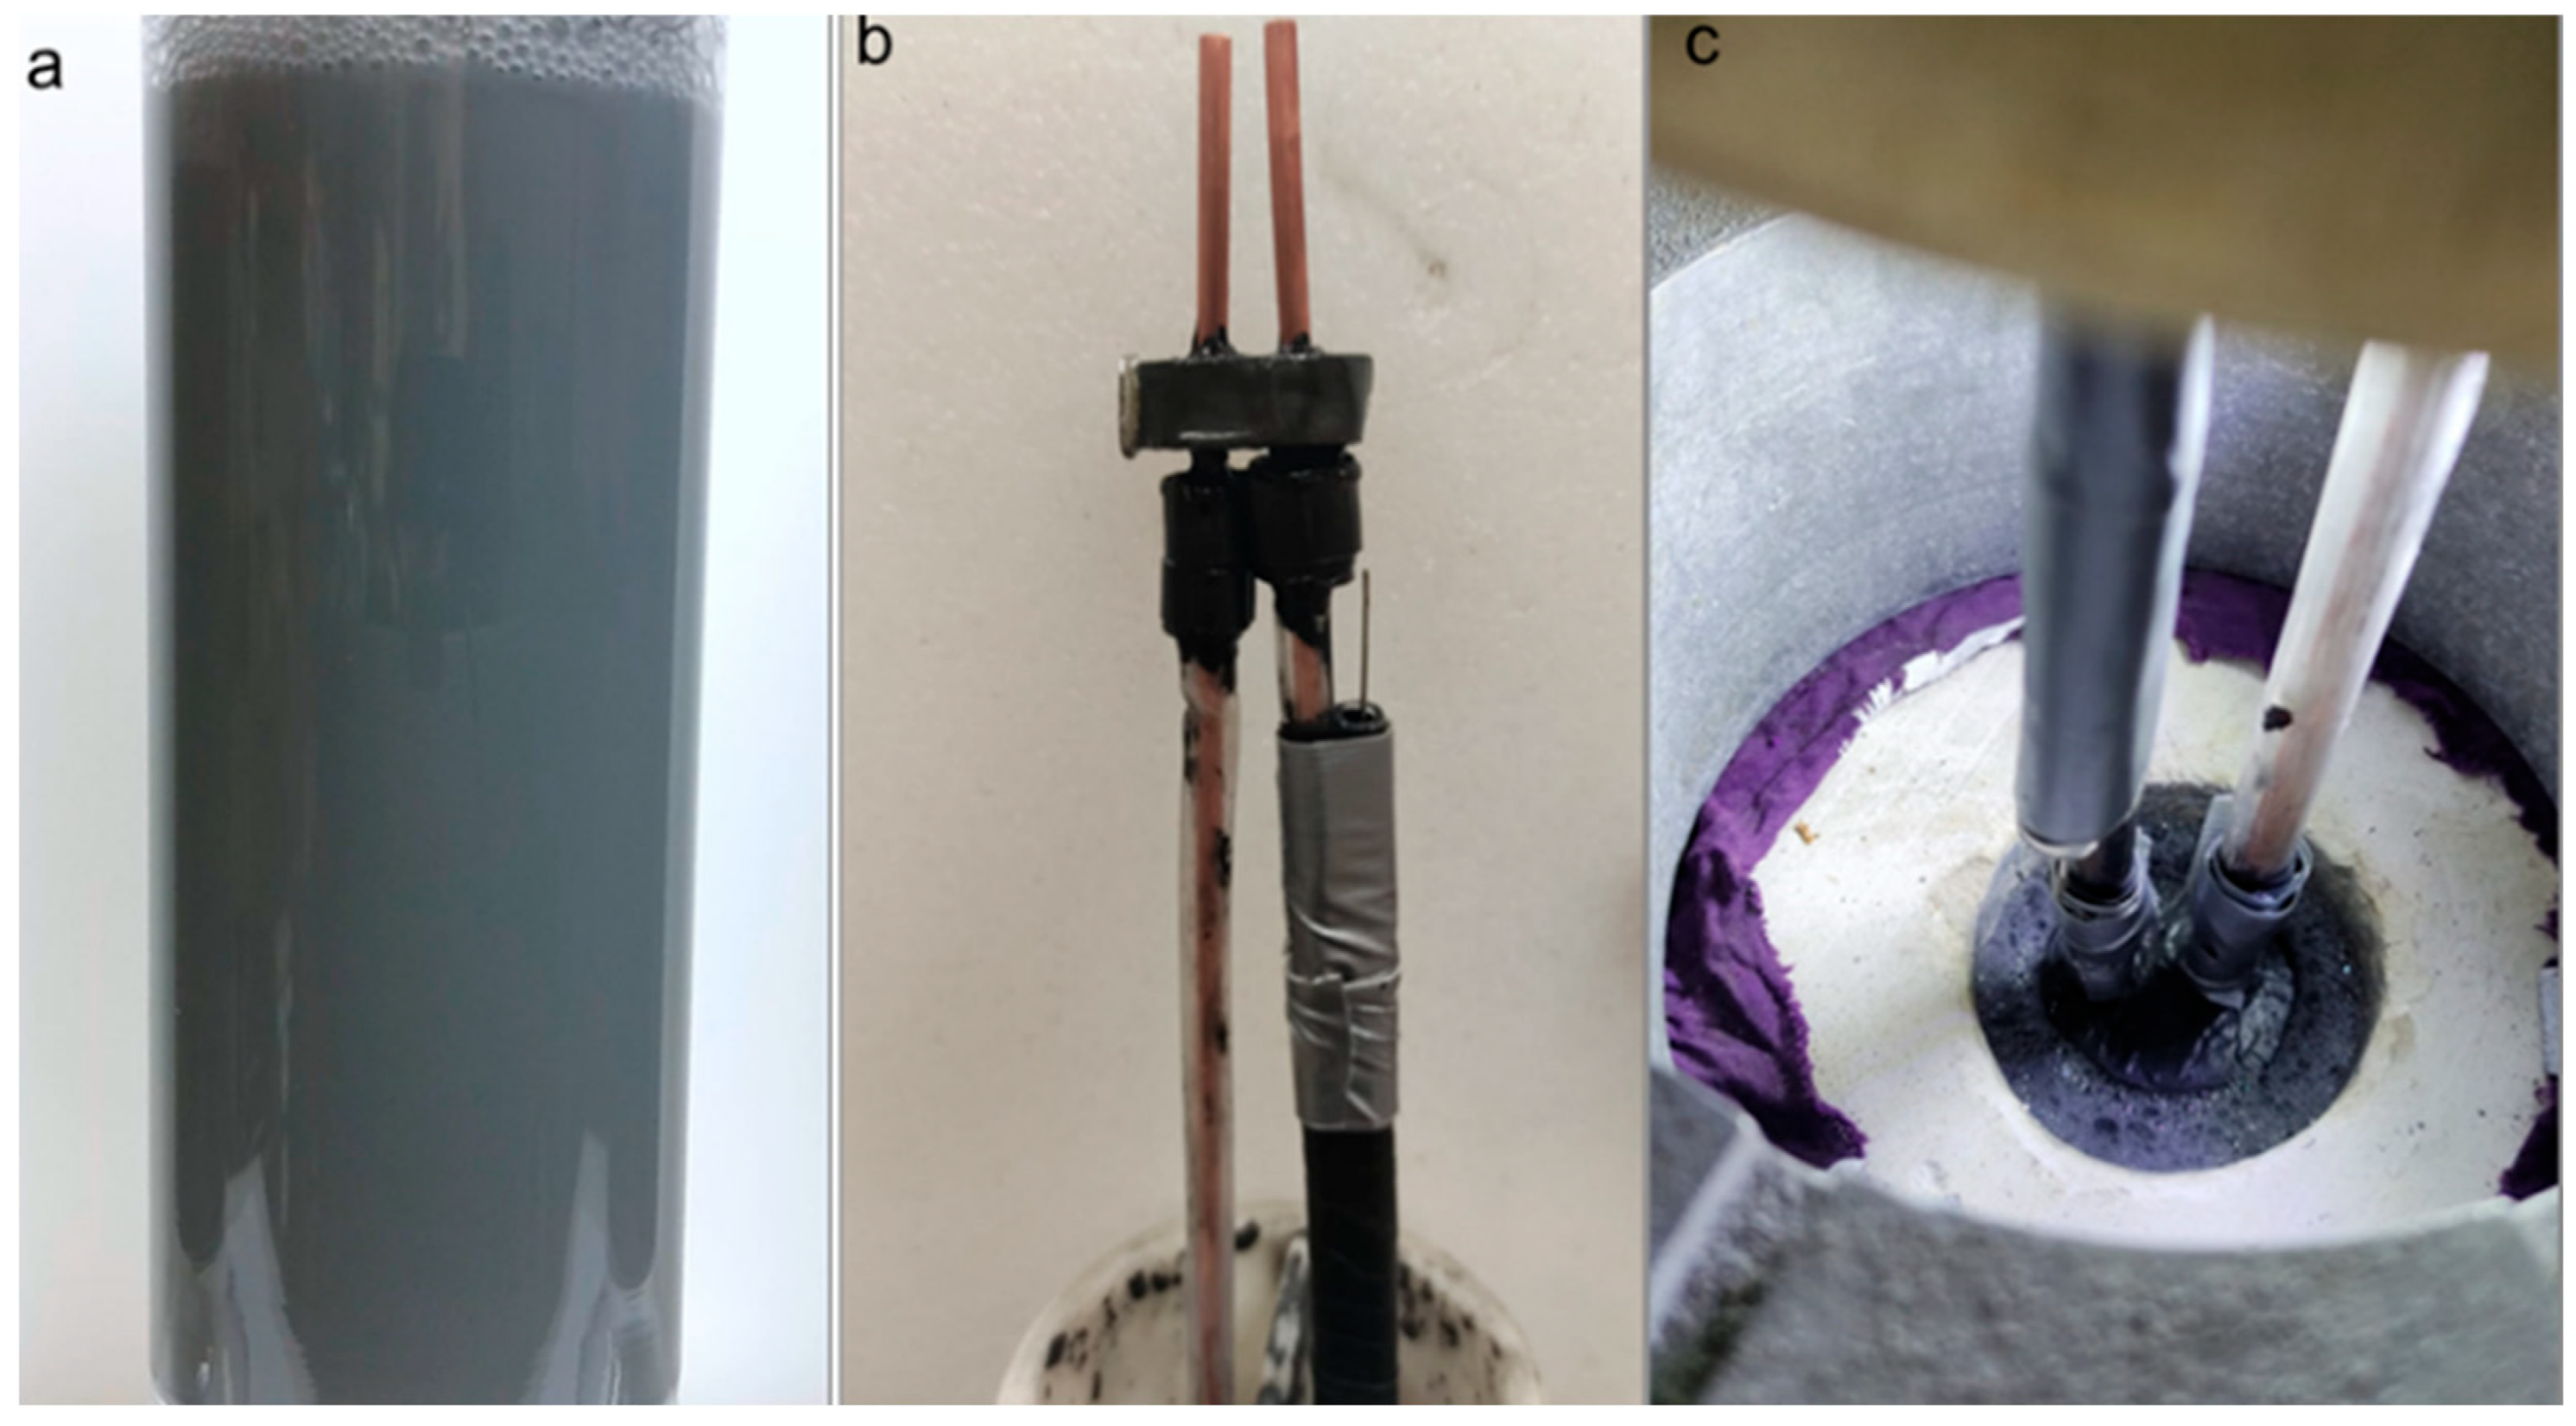
This study introduces a novel fluid mixture containing 60–80 nm Al NP suspended in brine with guar gum to improve viscosity and particle stability (Figure 4a) To overcome the single-cycle constraint of Al wires. This formulation enables multiple thermite reactions within the borehole fluid, creating successive plasma channels and multiple pressure peaks in one stimulation event. Concurrently, the electrode design was reengineered (Figure 4b,c) to ensure consistent plasma propagation and reduce losses from arc deflection or wire burnout.
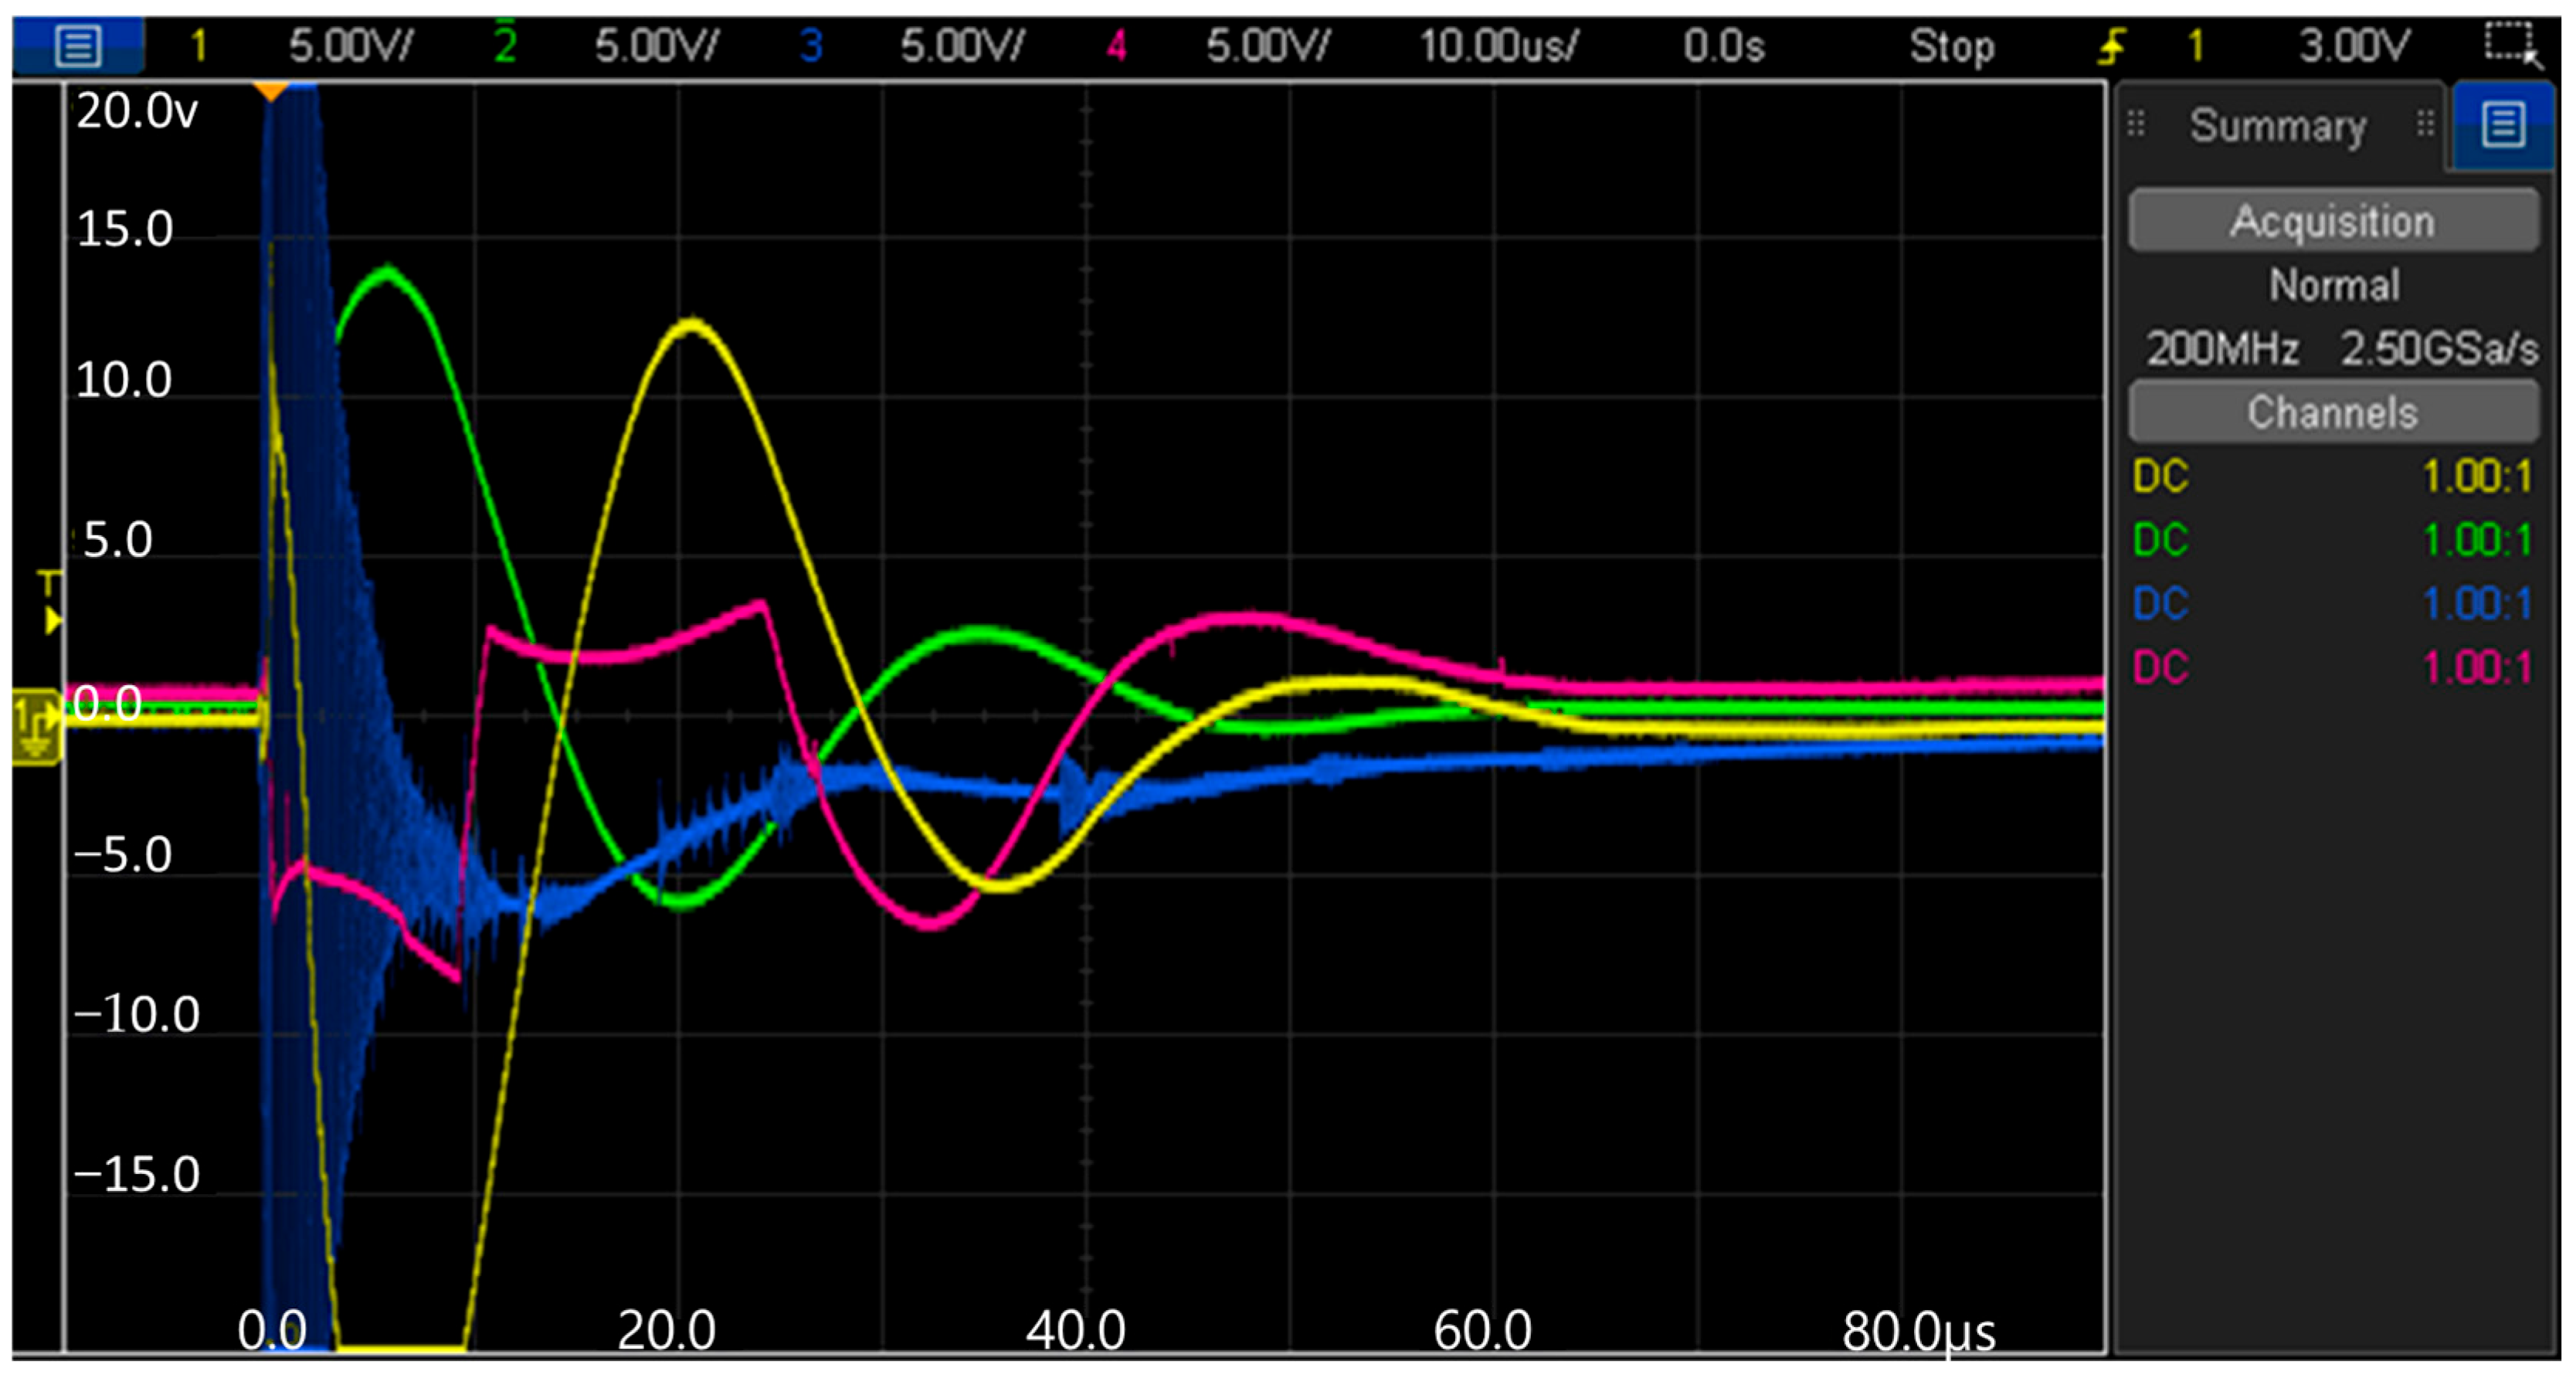
Comparative signal data reveal the difference: traditional wire-based discharges at 8–10 kJ produced a single plasma cycle (Figure 2d and Figure 3c), whereas the NP fluid exhibited multiple thermite cycles, resulting in repeated pressure peaks and extended energy release (Figure 5). This advancement addresses wire-related limitations, enhancing efficiency, fracture propagation, and the potential for field-scale implementation in various rock types.
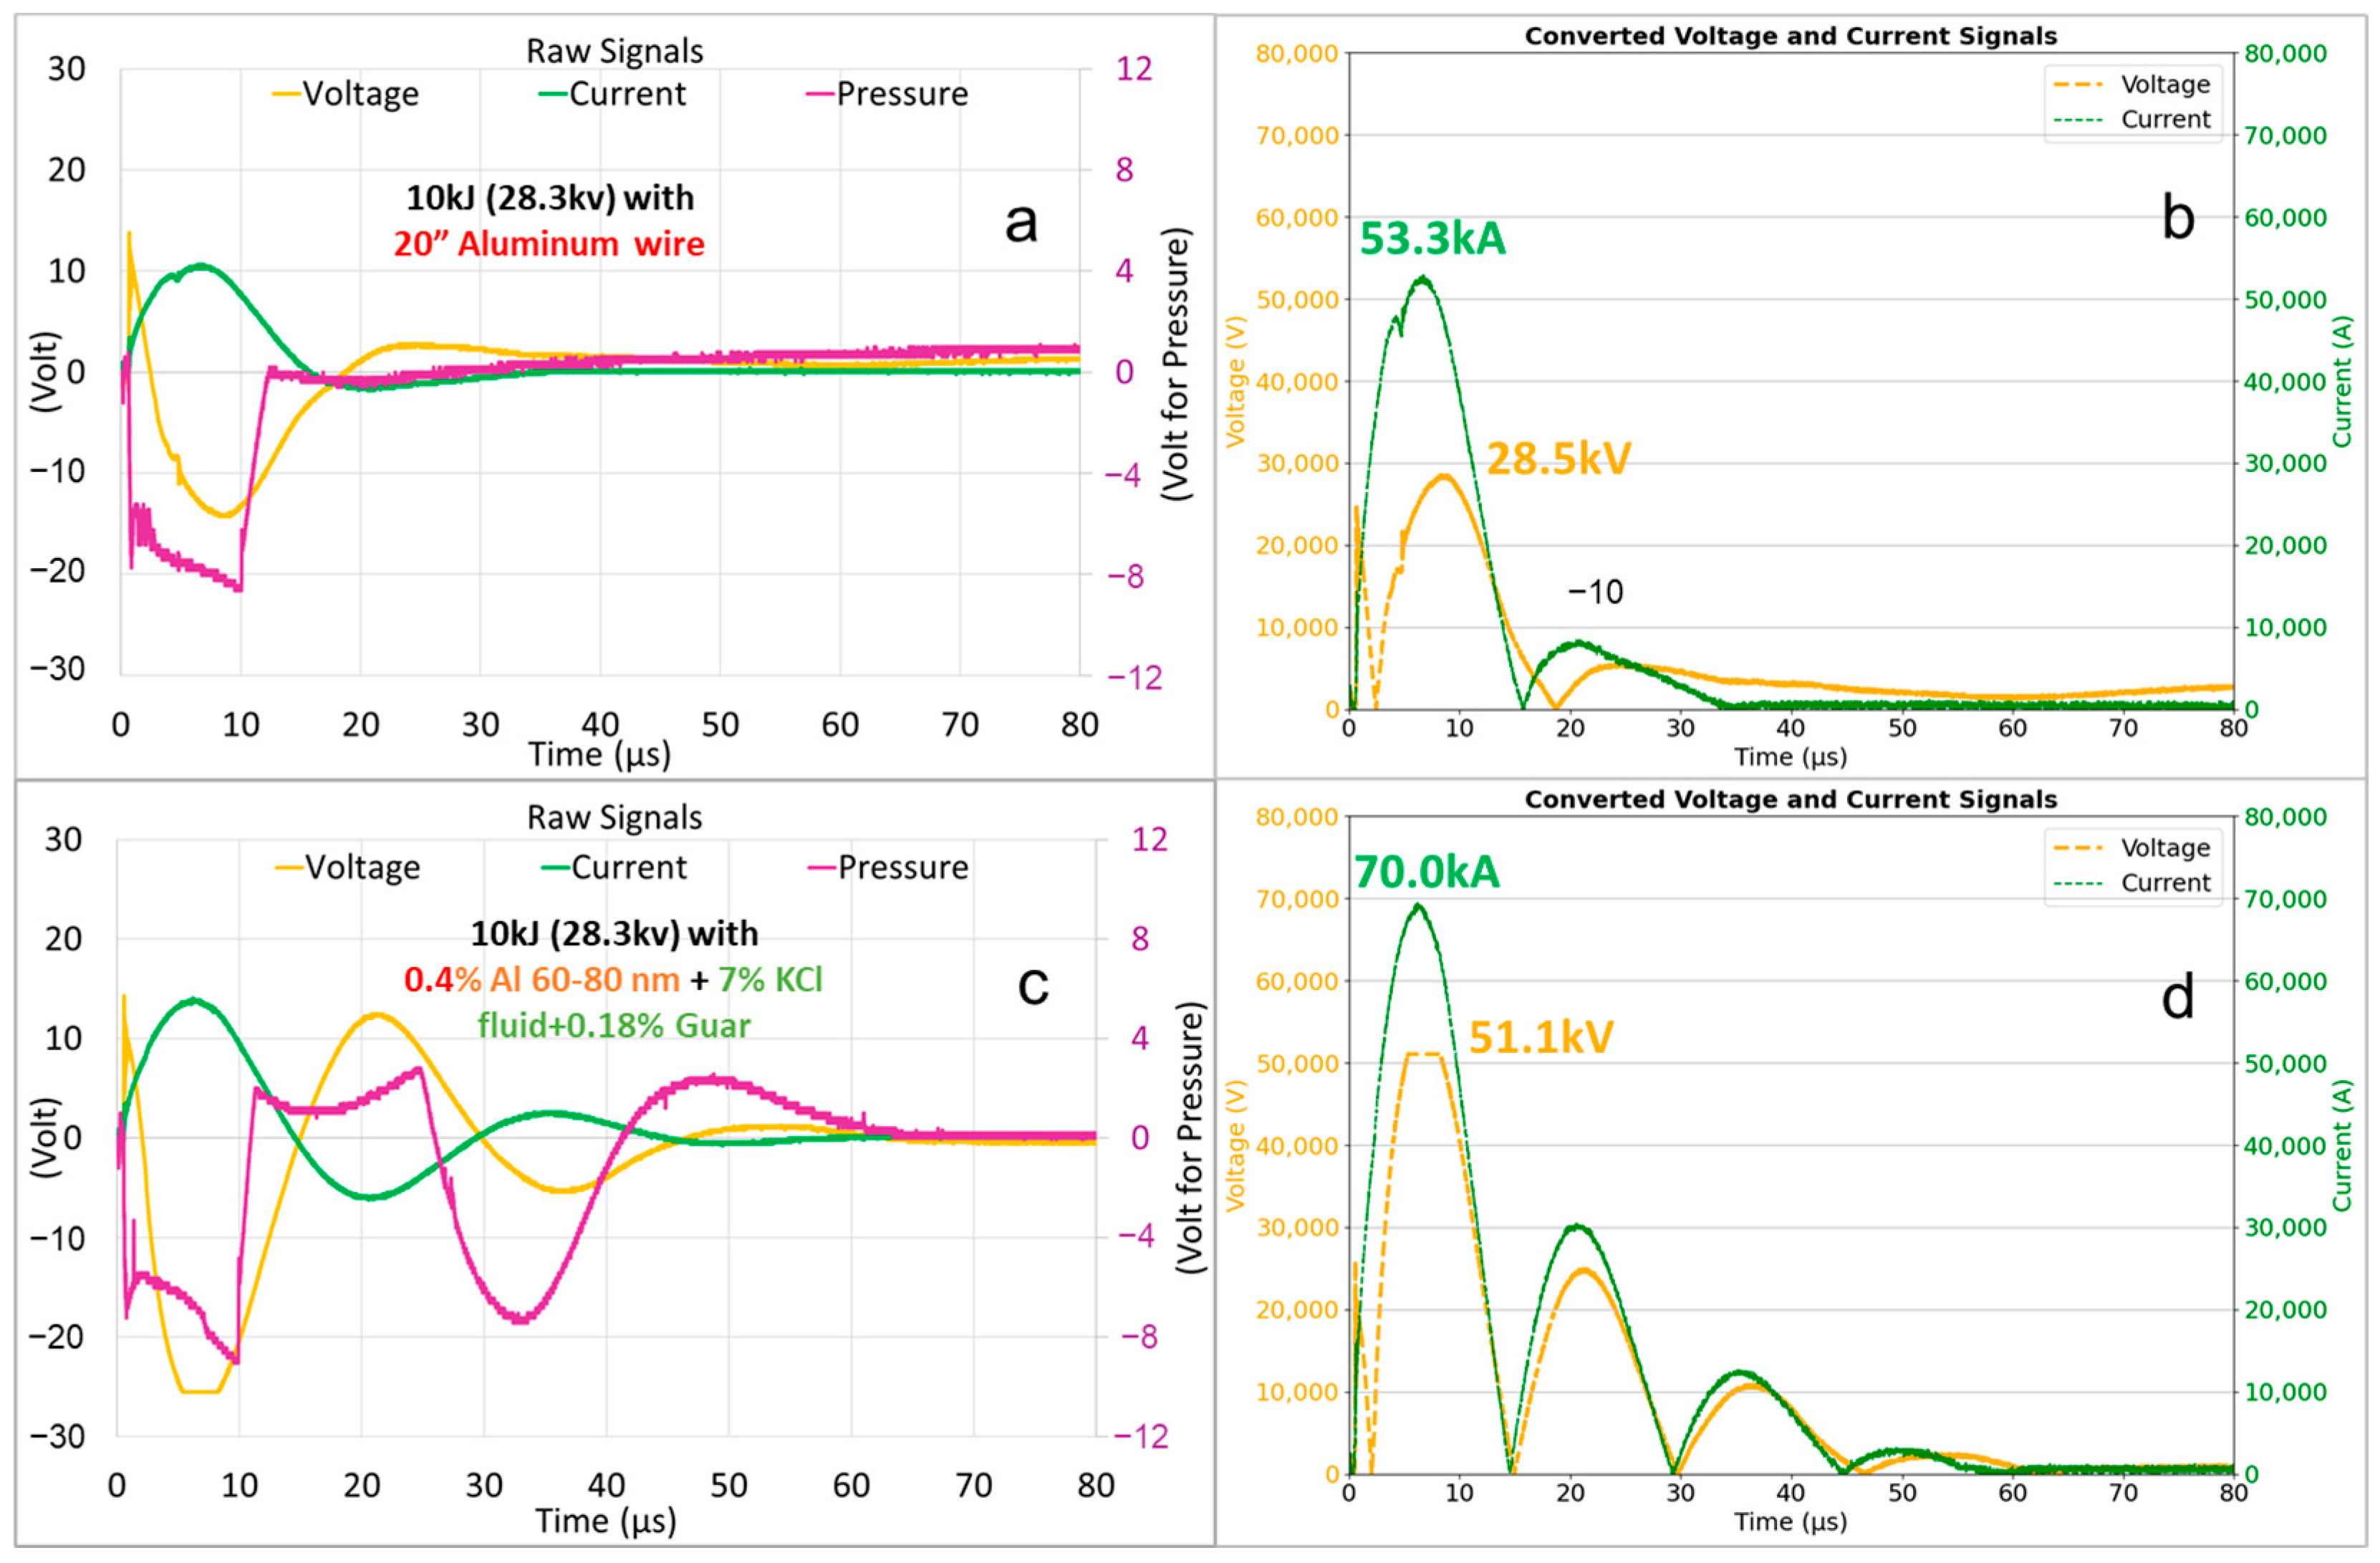
Furthermore, Figure 6 and Figure 7 provide a detailed comparison of electrical and mechanical responses during 3PS using the conventional Al wire versus the innovative Al NP fluid, both tested under a 10 kJ discharge at an initial charging voltage of 28.3 kV.
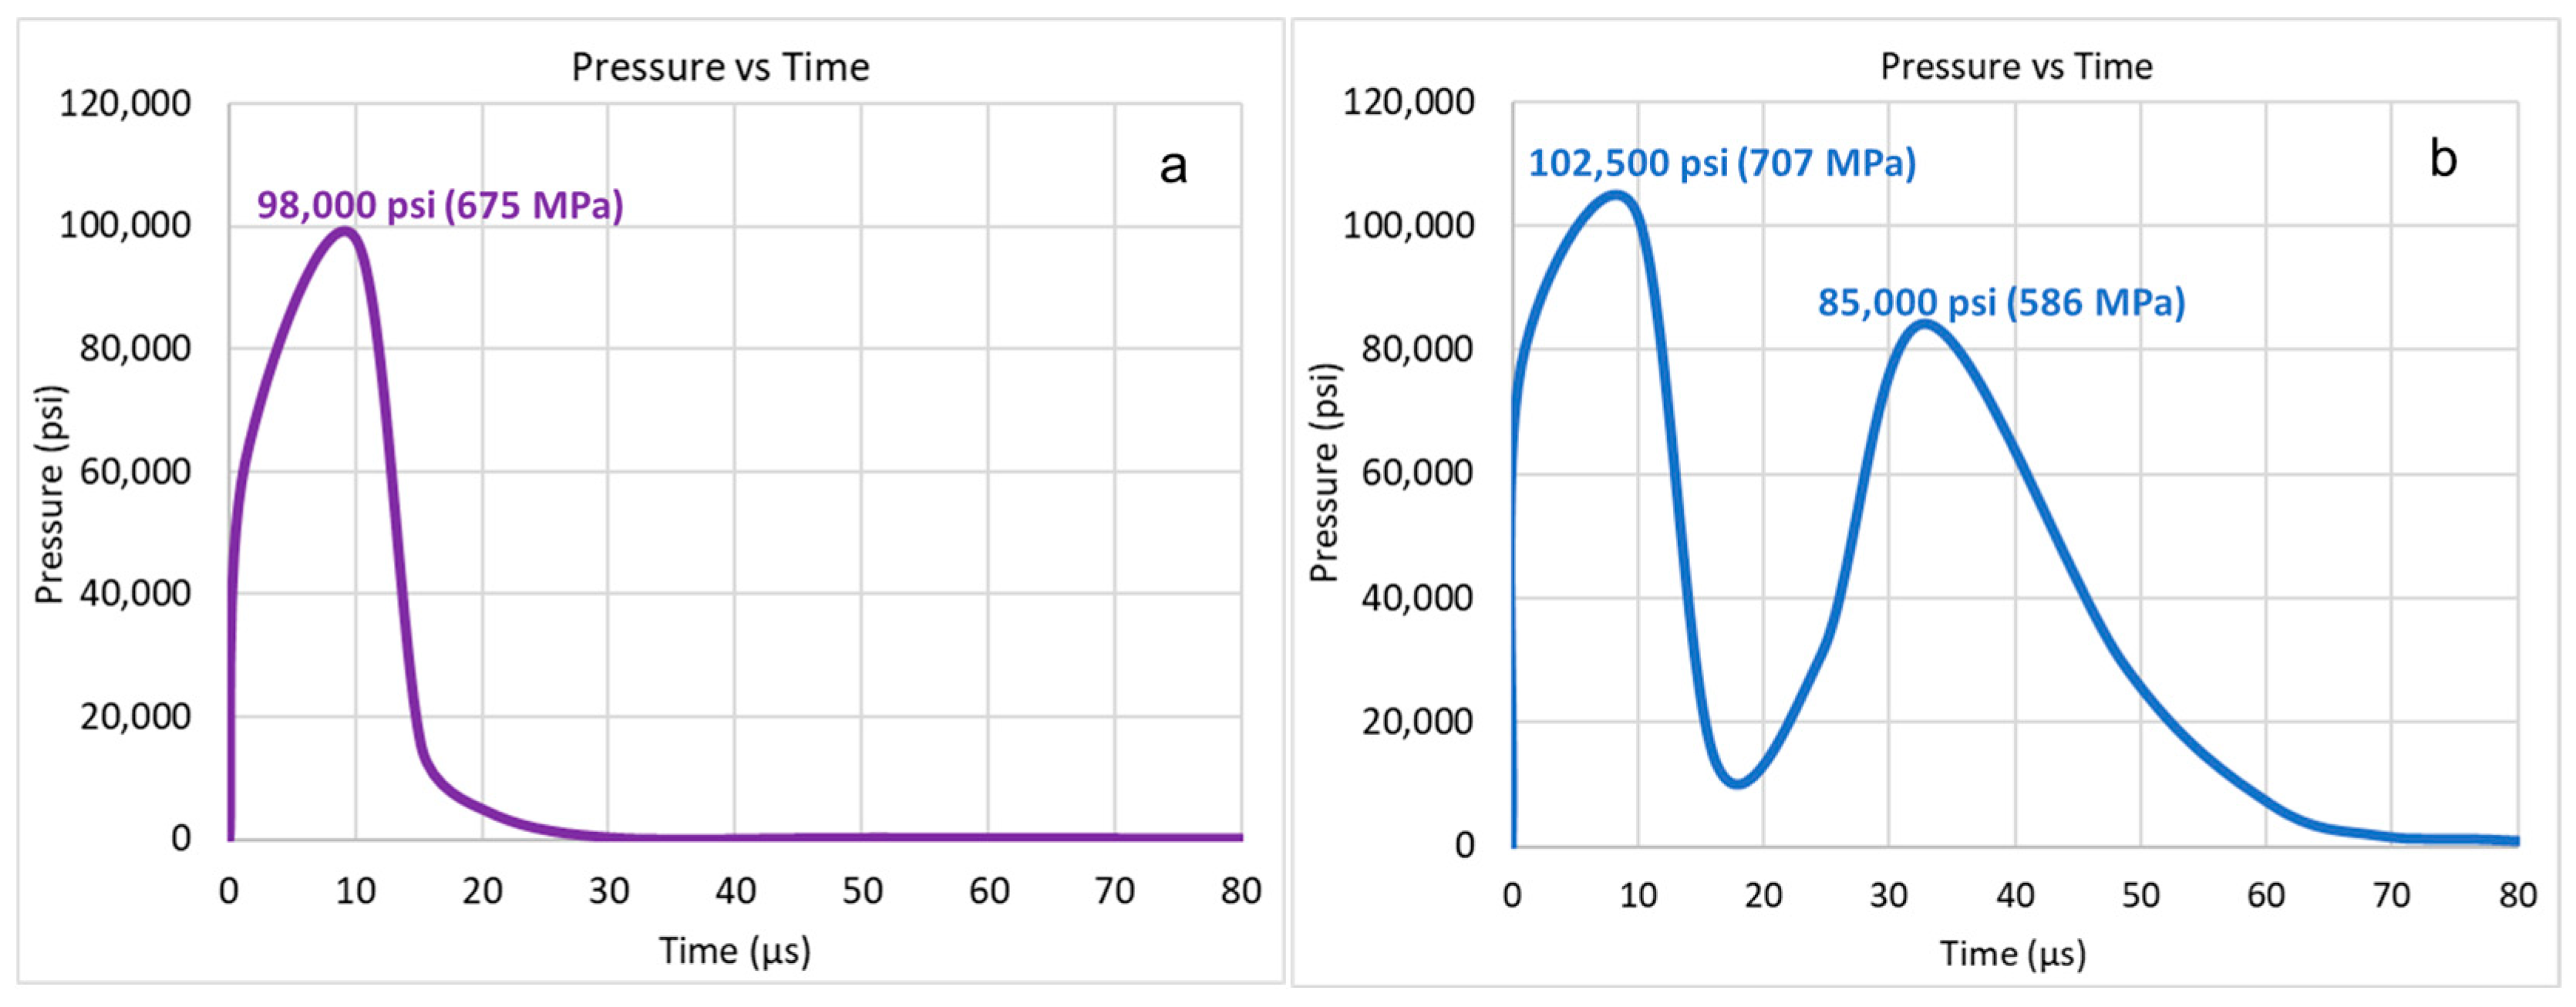
The comparative analysis underscores the superior performance of NP-based approach in sustaining multi-cycle thermite reactions and generating repeated high-pressure impulses—processes essential for efficient plasma-driven fracture stimulation. In contrast, the conventional wire-based configuration (Figure 3a) employs a 20-inch (50.8 cm) Al fusible wire submerged within the borehole fluid as the discharge medium. The raw signal traces (Figure 6a) display voltage (orange), current (green), and pressure (purple) evolution over time, revealing a single, sharp discharge event. Correspondingly, the processed electrical profiles (Figure 6b) show a peak voltage of 28.5 kV, nearly equivalent to the full system charge (100% of input), and a peak current of 53.3 kA. These parameters yielded a single dominant pressure pulse of approximately 98,000 psi (675 MPa) (Figure 7a), which rapidly decayed within 15 μs. This short-lived, single-cycle behavior—attributed to complete vaporization of the Al wire—confines the plasma energy release to one discrete thermite event, limiting fracture propagation and preventing reactivation or secondary pressure buildup. Such transient discharge dynamics align with prior pulsed power studies, confirming that the wire-based system’s energy delivery is inherently constrained to one irreversible cycle.
In contrast, the NP fluid system, consisting of 0.4 wt% Al NP (60–80 nm) in a 7 wt% KCl brine with 0.18 wt% guar gum for suspension, showcases enhanced multi-cycle performance. The redesigned electrodes, positioned centrally in the fluid-filled borehole, promote distributed thermite activation. Raw signals (Figure 6c) display oscillatory patterns in voltage and current, suggesting sequential plasma arcs. Processed profiles (Figure 6d) reveal a higher peak voltage of 51.1 kV (an 80% increase over the wire method) and a peak current of 70.0 kA, reflecting better energy coupling due to NP dispersion. This yields two distinct pressure peaks (Figure 7b): an initial spike to 102,500 psi (707 MPa) followed by a secondary peak at 85,000 psi (586 MPa), extending the stimulation duration and enabling progressive fracture development without hardware adjustments. The NP fluid’s capacity for multiple pressure cycles—compared to the wire’s single peak—enhances fracture complexity and permeability across rock types. Quantitatively, the integrated pressure impulse (area under the curve) is 1.5–2 times greater in the NP case, based on signal integration, correlating with observed fracture patterns in post-stimulation samples. This innovation reduces operational downtime from wire replacement, as seen in replication tests, and supports Soliman’s (2019) [37] focus on secondary shockwaves for real-time fracture enhancement. Future field-scale applications could harness these multi-peak dynamics to optimize energy delivery in sedimentary and granite formations, minimizing environmental impact while improving recovery efficiency.

3. Experimental Setup and Measurements

3.1. Mechanistic Framework of NP-3PS

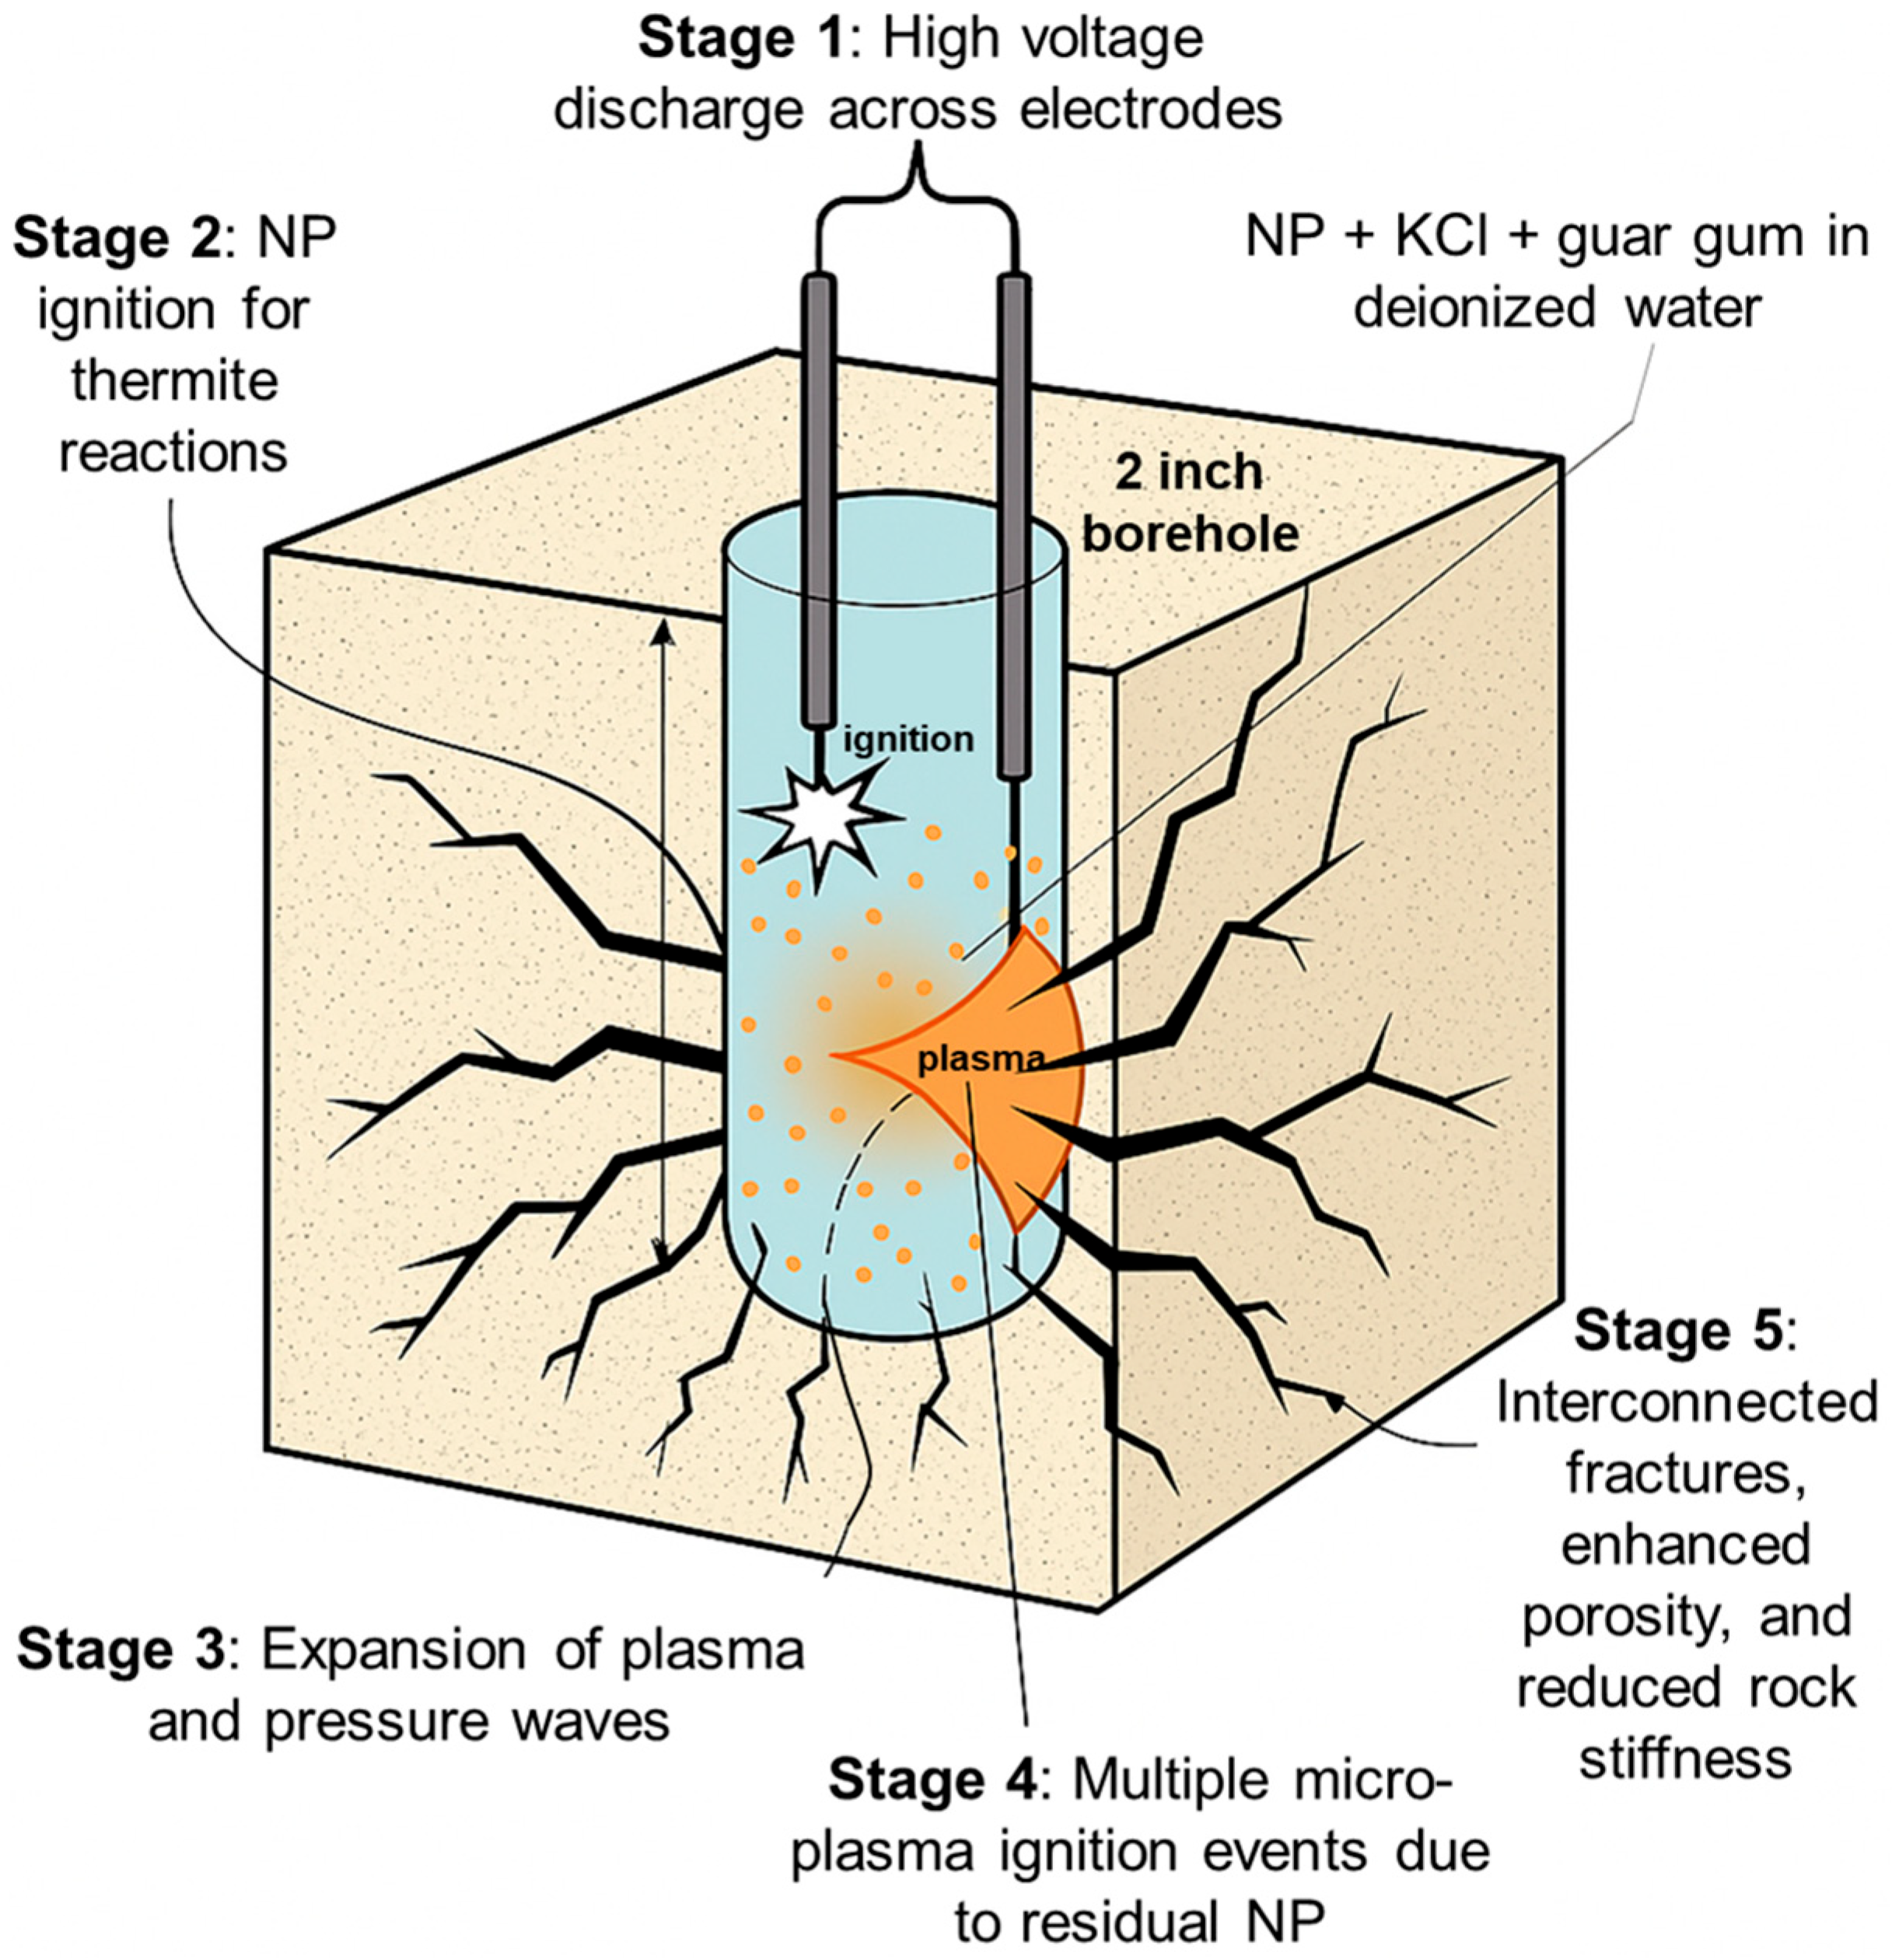
The NP-3PS mechanism is illustrated in Figure 8, depicting the coupled electro-thermal-mechanical processes responsible for fracture generation in crystalline rocks. The conductive KCl–guar medium ensures continuous current flow while maintaining NP suspension and extending plasma residence time through the fluid: (1) A rapid discharge between electrodes immersed in the NP-laden fluid initiates intense electrical breakdown within the 2-inch (5.08 cm) borehole, creating localized ionization paths and an initial plasma front. (2) NP undergo thermite ignitions, producing extremely high localized temperatures. This reaction releases additional heat and energy, amplifying the plasma intensity and enhancing conductivity within the discharge channel. (3) The expanding plasma undergoes adiabatic expansion, generating ultrafast pressure fronts exceeding 100,000 psi (690 MPa). These shockwaves impart alternating compressive and tensile stresses that nucleate microcracks and open grain boundaries. (4) Residual NP within the conductive medium serve as distributed ignition sites, sustaining multiple micro-plasma events. This multi-cycle discharge behavior improves electrical-to-mechanical energy coupling and prolongs the effective duration of the stimulation process compared to traditional single-pulse wire systems. (5) Continuous pressure peaks and localized heating drive microcrack coalescence into interconnected fractures, leading to enhanced porosity, permeability, and reduced rock stiffness. These outcomes collectively improve heat transfer efficiency, making NP-3PS a promising waterless stimulation approach for EGS.

3.2. System Configuration

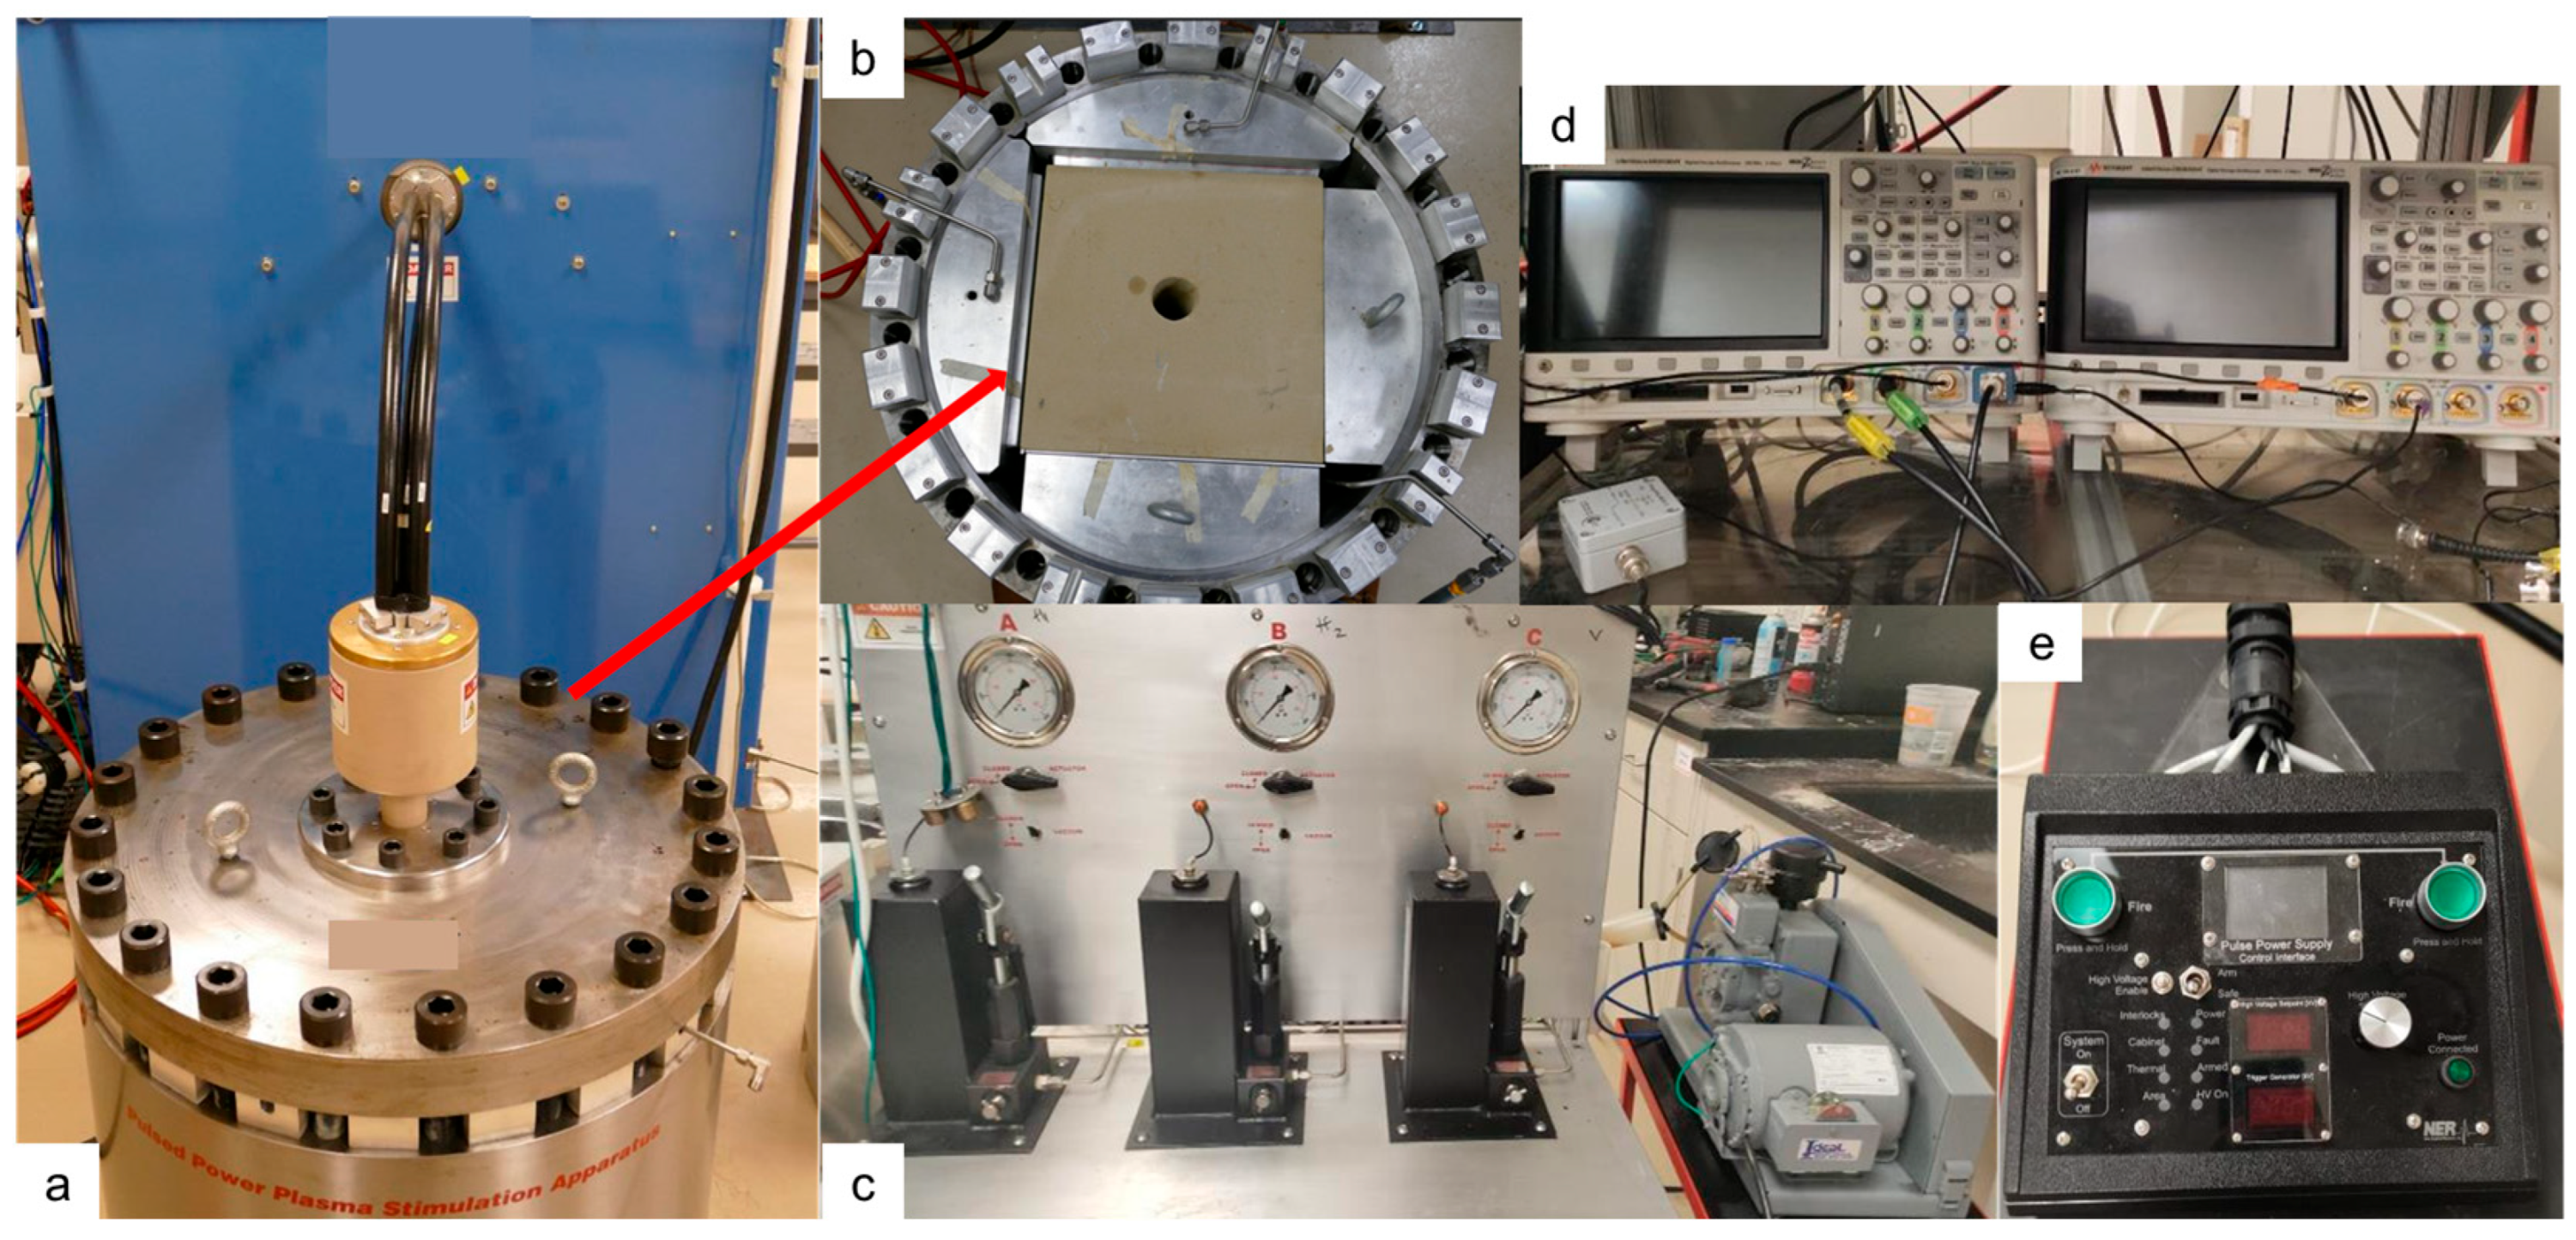
The NP-3PS experiments were conducted at the University of Houston using a custom-built high-voltage discharge system (Figure 9). The setup consisted of a 20 kJ, 40 kV capacitor bank (Figure 9a) capable of generating controlled electrical discharges into rock specimens. A remote-controlled interface with a dual-button interlock system ensured safe operation at high voltage (Figure 9e). Real-time electrical signals were captured using a high-speed digital oscilloscope (Keysight Technologies, Colorado Springs, CO, USA) (Figure 9d).
The rock samples were mounted within a true triaxial testing cell (Figure 9b), possibly rated up to 3000 psi (26.7 MPa), allowing the application of confining stress in three orthogonal directions through a hydraulic pump system (Figure 9c). This configuration simulated realistic in situ subsurface stress conditions during plasma-induced fracture stimulation.

3.3. Specimen Preparation and Stimulation Conditions

Initial experiments utilized 14” (35.56 cm) cubic sandstone, limestone (Figure 9b), and concrete to optimize the fluid formulation for NP-3PS. This iterative process identified the most effective composition Al NP (60–80 nm) suspended in KCl brine to maximize plasma stability, thermite reaction efficiency, and shockwave generation while minimizing settling and conductivity issues. Following this optimization, NP-3PS trials were extended to harder crystalline formations using 8” (20.32 cm) granite cubes (Figure 10a) to evaluate performance in low-permeability, high-temperature environments typical of EGS. The granite specimens were prepared with a central 2-inch diameter borehole drilled axially to accommodate the stimulation assembly.
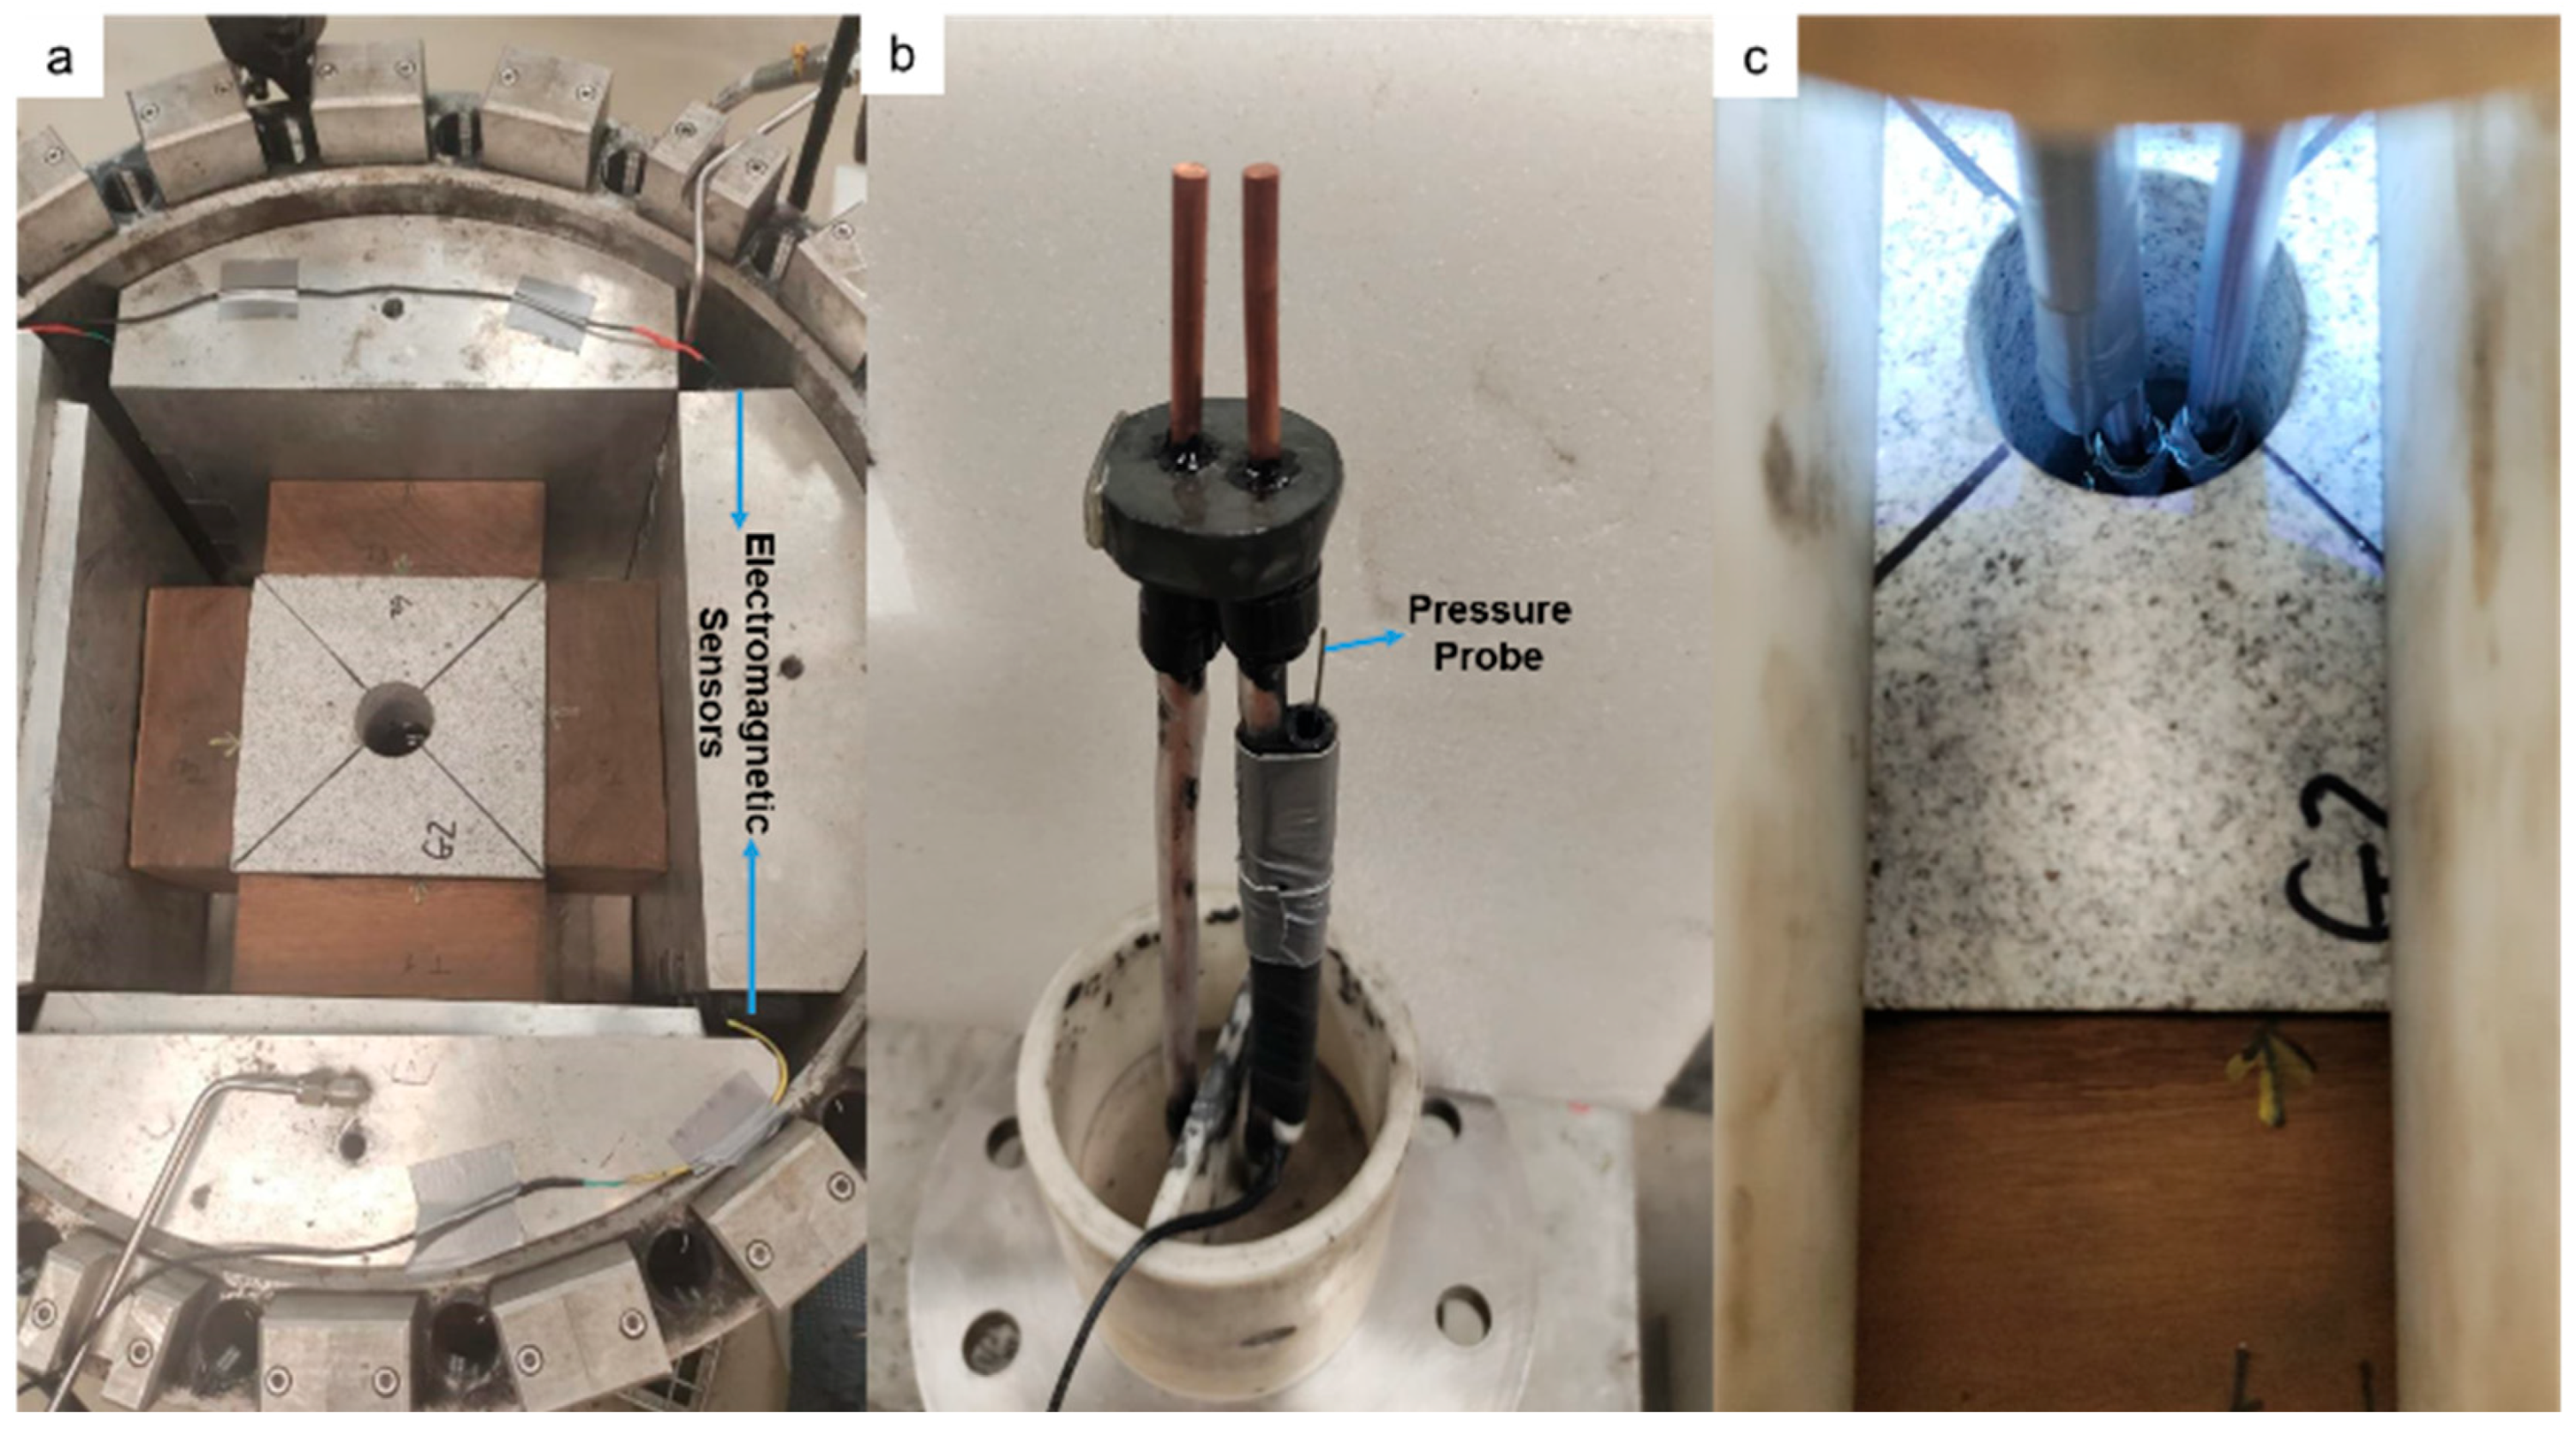
Copper electrodes, bridged by the NP fluid, were paired with a needle probe piezoelectric hydrophone for real-time measurements of high-frequency ultrasound and shockwave pressures in the liquid medium (Figure 10b), enabling precise capture of transient dynamics (rise time ≈ 50 ns, sensitive diameter < 0.5 mm). The probe features a maximum pressure to 145,000 psi (1000 MPa). Calibration was performed using shock wave standards in water, with traceable sensitivity verified up to 290 psi (2 MPa) and constant response confirmed up to 4640 psi (32 MPa). Above this range, sensitivity is extrapolated based on material linearity and historical validation in high-pressure lithotripsy fields. Measurement uncertainty is estimated at ±5% within the calibrated range to 4640 psi (32 MPa) due to minor nonlinearities in response under extreme compression. Beyond 4640 psi (32 MPa), uncertainty rises to ±10%, reflecting reduced empirical validation but supported by consistent performance in prior high-energy shock wave studies. This integrated probe-electrode system was inserted through sealed feedthroughs in the true triaxial cell platens (Figure 10c) to prevent fluid leakage, electrical arcing, and pressure loss, ensuring safe and reliable operation.
Due to the destructive nature of high-energy plasma stimulation and the high cost of large, homogeneous 8” (20.32 cm) granite blocks, only brand-new specimen was tested per experimental condition. This constraint precluded triplicate measurements for statistical reporting of pressure, energy, or fracture metrics with mean ± standard deviation. However, repeatability was ensured through standardized fluid composition (0.3 wt% Al NP + 7 wt% KCl + 0.18 wt% guar gum), fixed electrode geometry, consistent capacitor charging (±2%), and identical triaxial stress application. Observed peak pressures varied <8% across comparable runs, aligning with single-specimen validation protocols in prior pulsed plasma studies.

3.4. Measurement Techniques

Voltage, current, pressure, and electromagnetic (EM) waveforms were simultaneously recorded using synchronized oscilloscope channels (Figure 9d). Signals were digitized at a sampling rate of 10 MS/s (0.1 μs resolution) via a oscilloscope, enabling capture of voltage, current signals and peak pressures up to 145,000 psi within pulse durations of 20–80 μs. This high temporal resolution was critical for resolving the rapid rise times (<1 μs) of plasma discharge events and distinguishing multi-cycle shockwave behavior from single-cycle wire-based discharges. Multiple EM sensors were positioned around the specimen to track plasma discharge propagation and field distribution (Figure 9a). Thus, this integrated measurement approach enabled detailed analysis of energy transfer efficiency and dissipation mechanisms, plasma channel stability and structure, as well as the amplitude and frequency characteristics of shockwave propagation.
Diamond-embedded drill bits of varying sizes were used to collect core samples from pre- and post-stimulated rocks. The qualities of the bulk material were characterized by first extracting larger cores, which had a diameter of four inches (10.2 cm), and then drilling smaller cores, which had a diameter of one inch (2.54 cm), thereby facilitating focused evaluations of porosity and geomechanical properties. Volumetric helium displacement was used to ascertain the porosity of the material, and this was then cross-validated using gravimetric methods. Consequently, this allowed for a comparative investigation of the development of the pore structure that was caused by plasma stimulation. These measurements provided both the baseline porosity values and the quantification of the augmentation that resulted from the formation of the fracture networ.
Mechanical characterization was performed using triaxial compression tests on 1” × 2” (2.54 cm × 5.08 cm) cylindrical plugs (Figure 11a). Strain gauges and pressure transducers were installed to monitor axial and radial deformation during loading (Figure 11b), with the specimens enclosed in a sealed chamber to maintain consistent boundary conditions (Figure 11c). These tests provided insight into the residual strength and elastic behavior of the stimulated rock.
Dynamic acoustic properties of granite cores were assessed to evaluate the potential impact of NP-3PS on elastic behavior and fracture-induced weakening, which aligns with the study’s objective to characterize post-stimulation geomechanical changes. Initial measurements were performed on a pre-NP-3PS vertically drilled core using a pulse-receiver system with piezoelectric transducers, capturing compressional (Vp) and shear (Vs) wave velocities through high-speed oscilloscope recordings synchronized with plasma discharge events. Since horizontal directional properties were unavailable from direct pre-stimulation sampling, conversion models from [40,41] were utilized, providing a framework for geomechanical anisotropy and an empirical model to derive horizontal equivalents from vertical dynamic parameters based on elastic symmetry. Following NP-3PS, cores were drilled vertically and horizontally to facilitate respective measurements and comparisons.
Post-stimulation samples were imaged using a Zeiss Xradia 510 Versa micro-CT system (Carl Zeiss AG, Oberkochen, Germany) in the university of Houston lab, providing 3D visualization of fracture geometry and pore evolution. The scans distinguished primary plasma-induced macro-fractures from secondary networks branching off pre-existing flaws. Comparative analysis confirmed that NP-based fluids produced more extensive and interconnected damage than single-wire discharges. Petrographic microscopy of thin sections revealed mineralogical changes, fracture aperture growth, and localized thermal effects. Moreover, observations under transmitted and reflected light identified residual NP and reaction byproducts within fractures, thus supporting their role in stabilizing repeated plasma discharges.
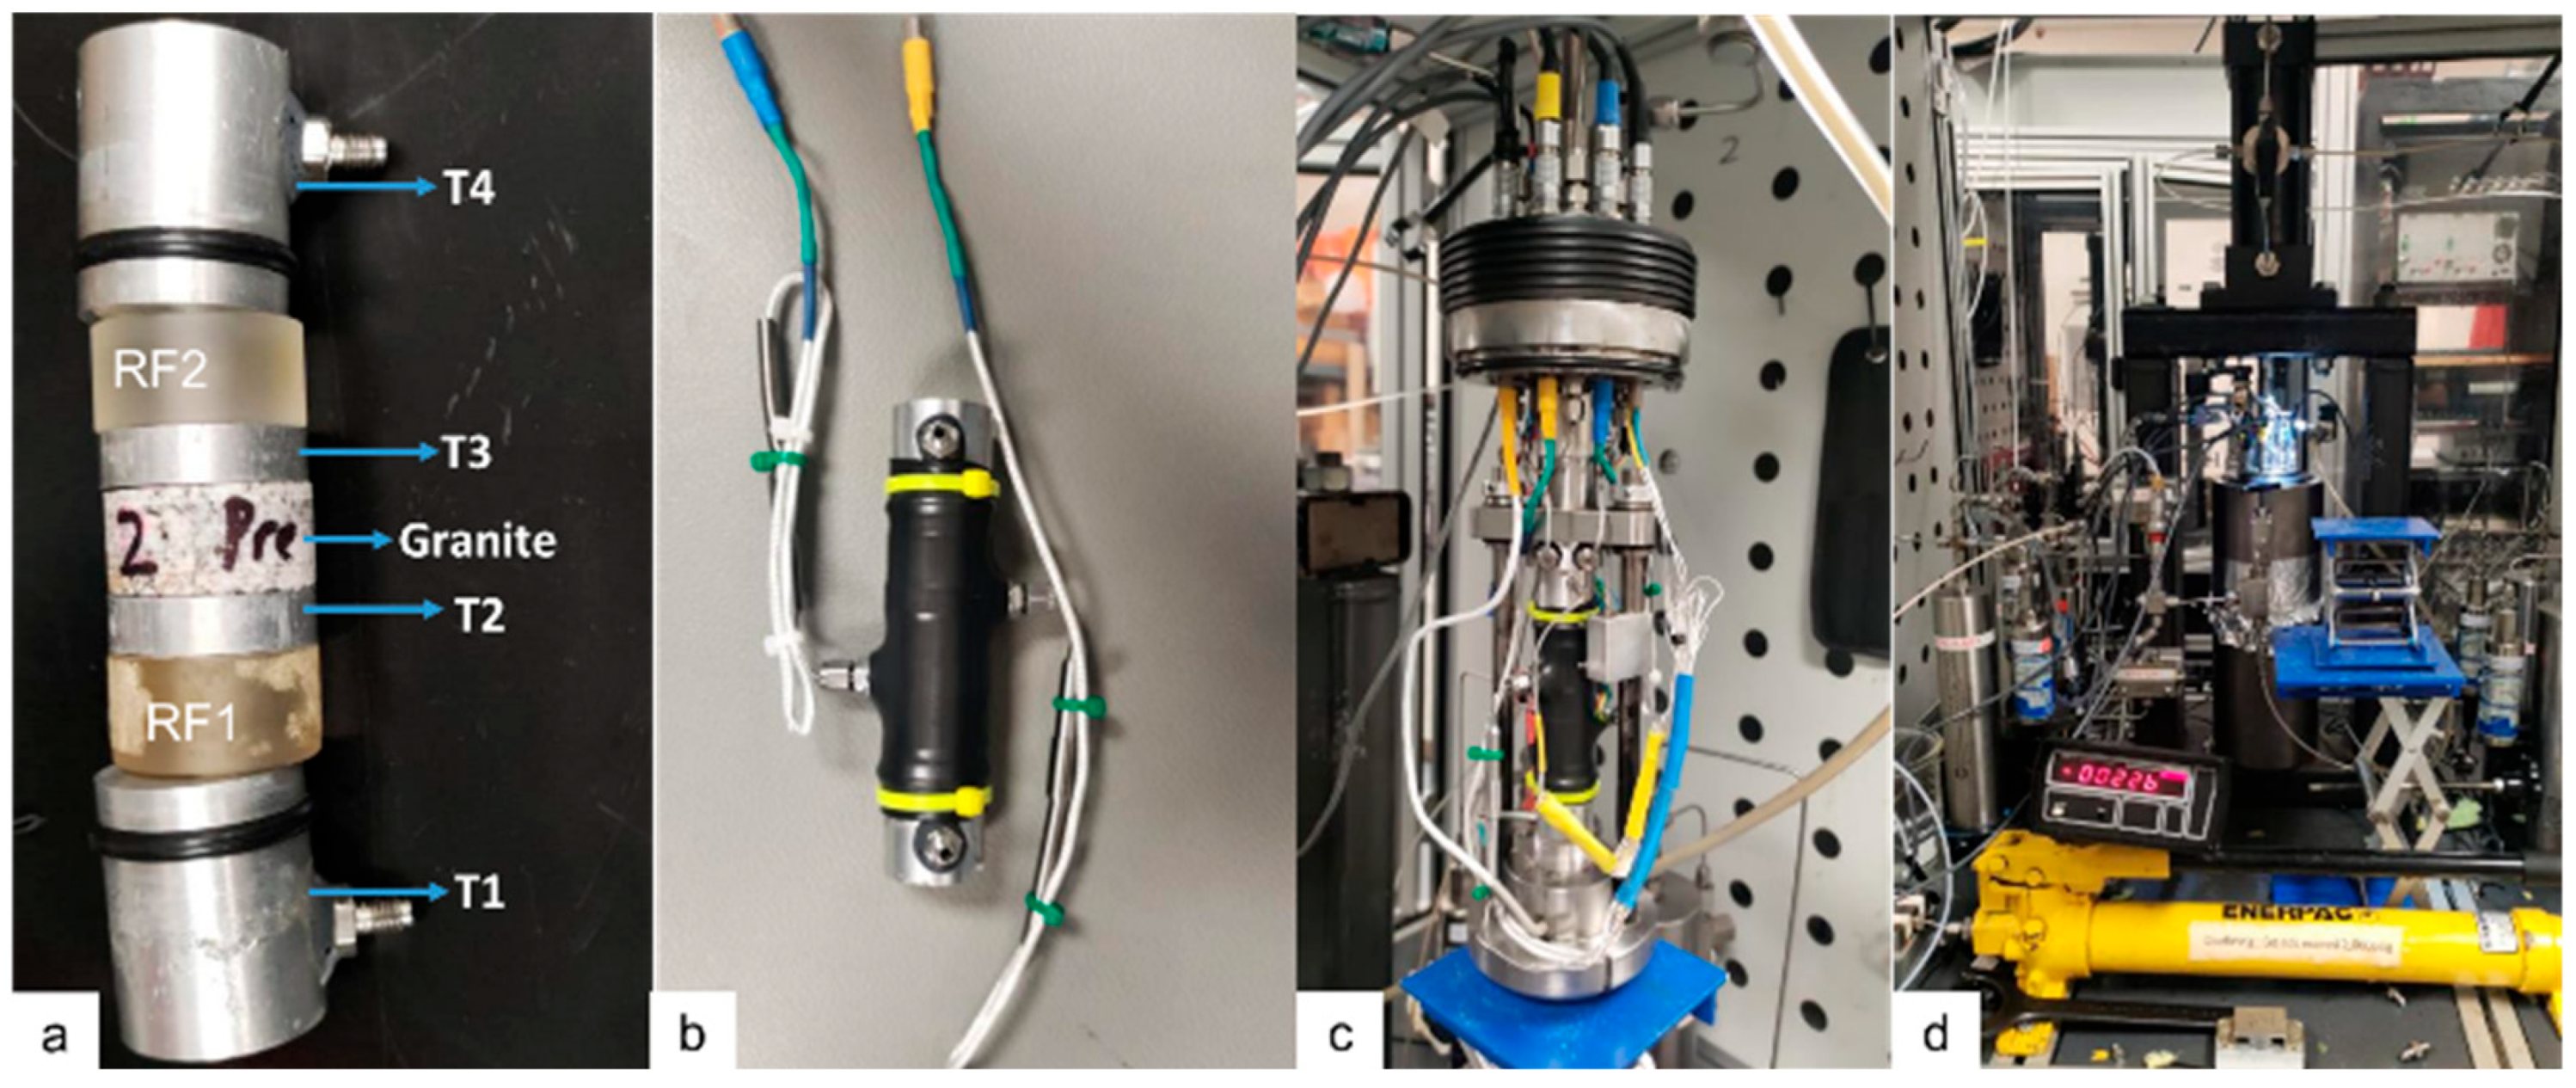
Thermal transport properties were evaluated to link microstructural damage with heat transfer efficiency, a key consideration for geothermal stimulation applications. Thin granite core plugs (0.5” × 1” or 1.27 cm × 2.54 cm) were prepared and mounted securely within a sleeve to avoid edge losses (Figure 12a,b). Thermal conductivity was measured using steady-state axial heat flow techniques, with sensors carefully connected to both ends of the core (Figure 12c). The entire measurement assembly (Figure 12d) enabled consistent thermal profiling before and after plasma stimulation. Notably, reductions in conductivity were interpreted as evidence of micro-crack proliferation, which in turn enhances fluid circulation and effective surface area for heat extraction.
A laboratory-scale axial heat flow apparatus was employed to determine the thermal conductivity of the granite core. The system configuration included a central granite specimen sandwiched between two reference materials (RF1 and RF2, each 0.503 in in length and 1.003 in in diameter) of known thermal conductivity (kr = 1.38 W·m−1·K−1). To monitor the axial temperature profile, four thermocouples were embedded along the central axis:
  • T1: Top of RF1 (heat source),
  • T2: RF1–granite interface,
  • T3: Granite–RF2 interface,
  • T4: Bottom of RF2 (heat sink).
A vacuum was applied around the entire measurement assembly during testing to eliminate radial heat loss caused by air convection or conduction, ensuring one-dimensional axial heat flow. This is essential for accurate steady-state thermal conductivity measurement, particularly for detecting minor conductivity changes due to micro-crack proliferation post-plasma stimulation. To further enhance accuracy, axial stress was applied to the composite stack (RF2–Granite–RF1) to eliminate interfacial thermal resistance caused by gaps between the granite core and reference materials. This ensures intimate contact, allowing the four embedded thermocouples to record true axial temperature profiles, critical for precise heat flux calculation. With these optimizations, thermal conductivity was measured using steady-state axial heat flow techniques. The system was confined and thermally insulated to ensure one-dimensional conduction. A heat source was applied at the top end, and the temperature rise was recorded every second for ~5800 s. Once a quasi-steady-state was reached (typically between 5000–6000 s), the gradients were analyzed.
Composite gradient method [42], which assumes 1D steady-state conduction through a composite stack of materials, is used to estimate the effective thermal conductivity of granite using the following heat flux balance in Equation (1):
k s = L s 2 A s T s k r A r 1 T r 1 L r 1 +   k r A r 2 T r 2 L r 2
where:
  • k s is the effective thermal conductivity
  • k r is the referenced thermal conductivity of RF1 and RF2
  • L s ,   L r 1 ,     L r 2 are the lengths of the granite, RF1, and RF2, respectively
  • A s ,   A r 1 ,   A r 2 are the cross-sectional areas of the granite, RF1, and RF2, respectively
  • T s = T2 − T3
  • T r 1 = T1 − T2
  • T r 2 = T3 − T4

4. Nanoparticle Fluid Optimization

A systematic experimental program was conducted to NP-3PS. The formulation parameters—including NP size, concentration, ionic strength, and polymer content in deionized water—were carefully adjusted to enhance plasma stability, thermite reaction persistence, and shockwave propagation efficiency:
  • Al NP of 60–80 nm, 99.7% purity (SkySpring Nanomaterials, Inc., Texas, USA) were selected as the active energetic component due to their high specific surface area (approximately 20–30 m2/g) [43] and chemical stability in brine. Preliminary suspension and ignition tests confirmed that this size range provided an optimal balance between rapid thermite activation and oxidative resistance in the brine. Smaller particles (<50 nm) exhibited strong agglomeration tendencies, resulting in premature oxidation and reduced reactivity, whereas larger particles (>100 nm) showed poor dispersion and diminished plasma energy yield.
  • KCl served as the ionic base of the NP fluid, providing both high conductivity and physicochemical stability under high-temperature, high-salinity geothermal conditions. Although clay stabilization is not a primary concern in crystalline geothermal reservoirs (unlike in conventional operations where KCl prevents clay swelling and permeability loss [44,45]), its inclusion here maintains ionic strength, ensures stable electrochemical pathways, and promotes consistent plasma channel formation and sustained thermite reactions between NPs. This KCl (Nutricost Manufacturing, LLC., Utah, USA) conductive environment enhances electron mobility across the discharge gap, accelerating plasma initiation and strengthening electro-mechanical energy coupling during NP-3PS events.
  • A polymeric stabilizer, guar gum (ACH Food Companies, Inc., California, USA), was added at 0.18 wt% to increase viscosity and improve NP suspension over extended periods. This concentration, consistent with conventional HF formulations [46], provided adequate stability for more than ten days without significantly affecting flowability or discharge behavior. Although viscosity variation was not systematically analyzed in this study, the selected guar concentration maintained homogeneous particle dispersion throughout all laboratory trials and was therefore adopted as the baseline for subsequent experiments.
These compositional refinements proved critical in controlling plasma channel initiation and maintaining high discharge intensity. The optimized formulation facilitated repeatable multi-cycle thermite reactions and stable plasma propagation, directly influencing the magnitude and structure of induced shockwaves across multiple lithologies.

4.1. NP-3PS in 4 wt% KCl and 0.18 wt% Guar Gum Base Fluid

The first set of NP-3PS trials employed 4 wt% KCl solutions to examine the interaction of NP concentration and discharge energy (8–10 kJ) on rock fracturing. NP were dispersed with 0.18 wt% guar gum at concentrations of 0.15 and 0.4 wt%. Despite careful control of borehole geometry and electrical input, no visible fractures were produced at these conditions (Figure 13). Energy recovery values were near unity, indicating that the applied input was not effectively converted to mechanical work. These results suggest that the conductivity provided by 4 wt% KCl was insufficient to sustain plasma energy levels necessary for fracture initiation, independent of NP dosage or energy level. Surface inspections confirmed this trend: specimens with 0.15 wt% NP (Figure 13a–c) and 0.4 wt% NP (Figure 13d–f) exhibited no cracking, spalling, or fluid losses. This absence of macroscopic or microscopic failure highlights that plasma intensity was inadequate to nucleate fractures when paired with relatively low ionic strength.

4.2. NP-3PS in 7 wt% KCl and 0.18 wt% Guar Gum Base Fluid

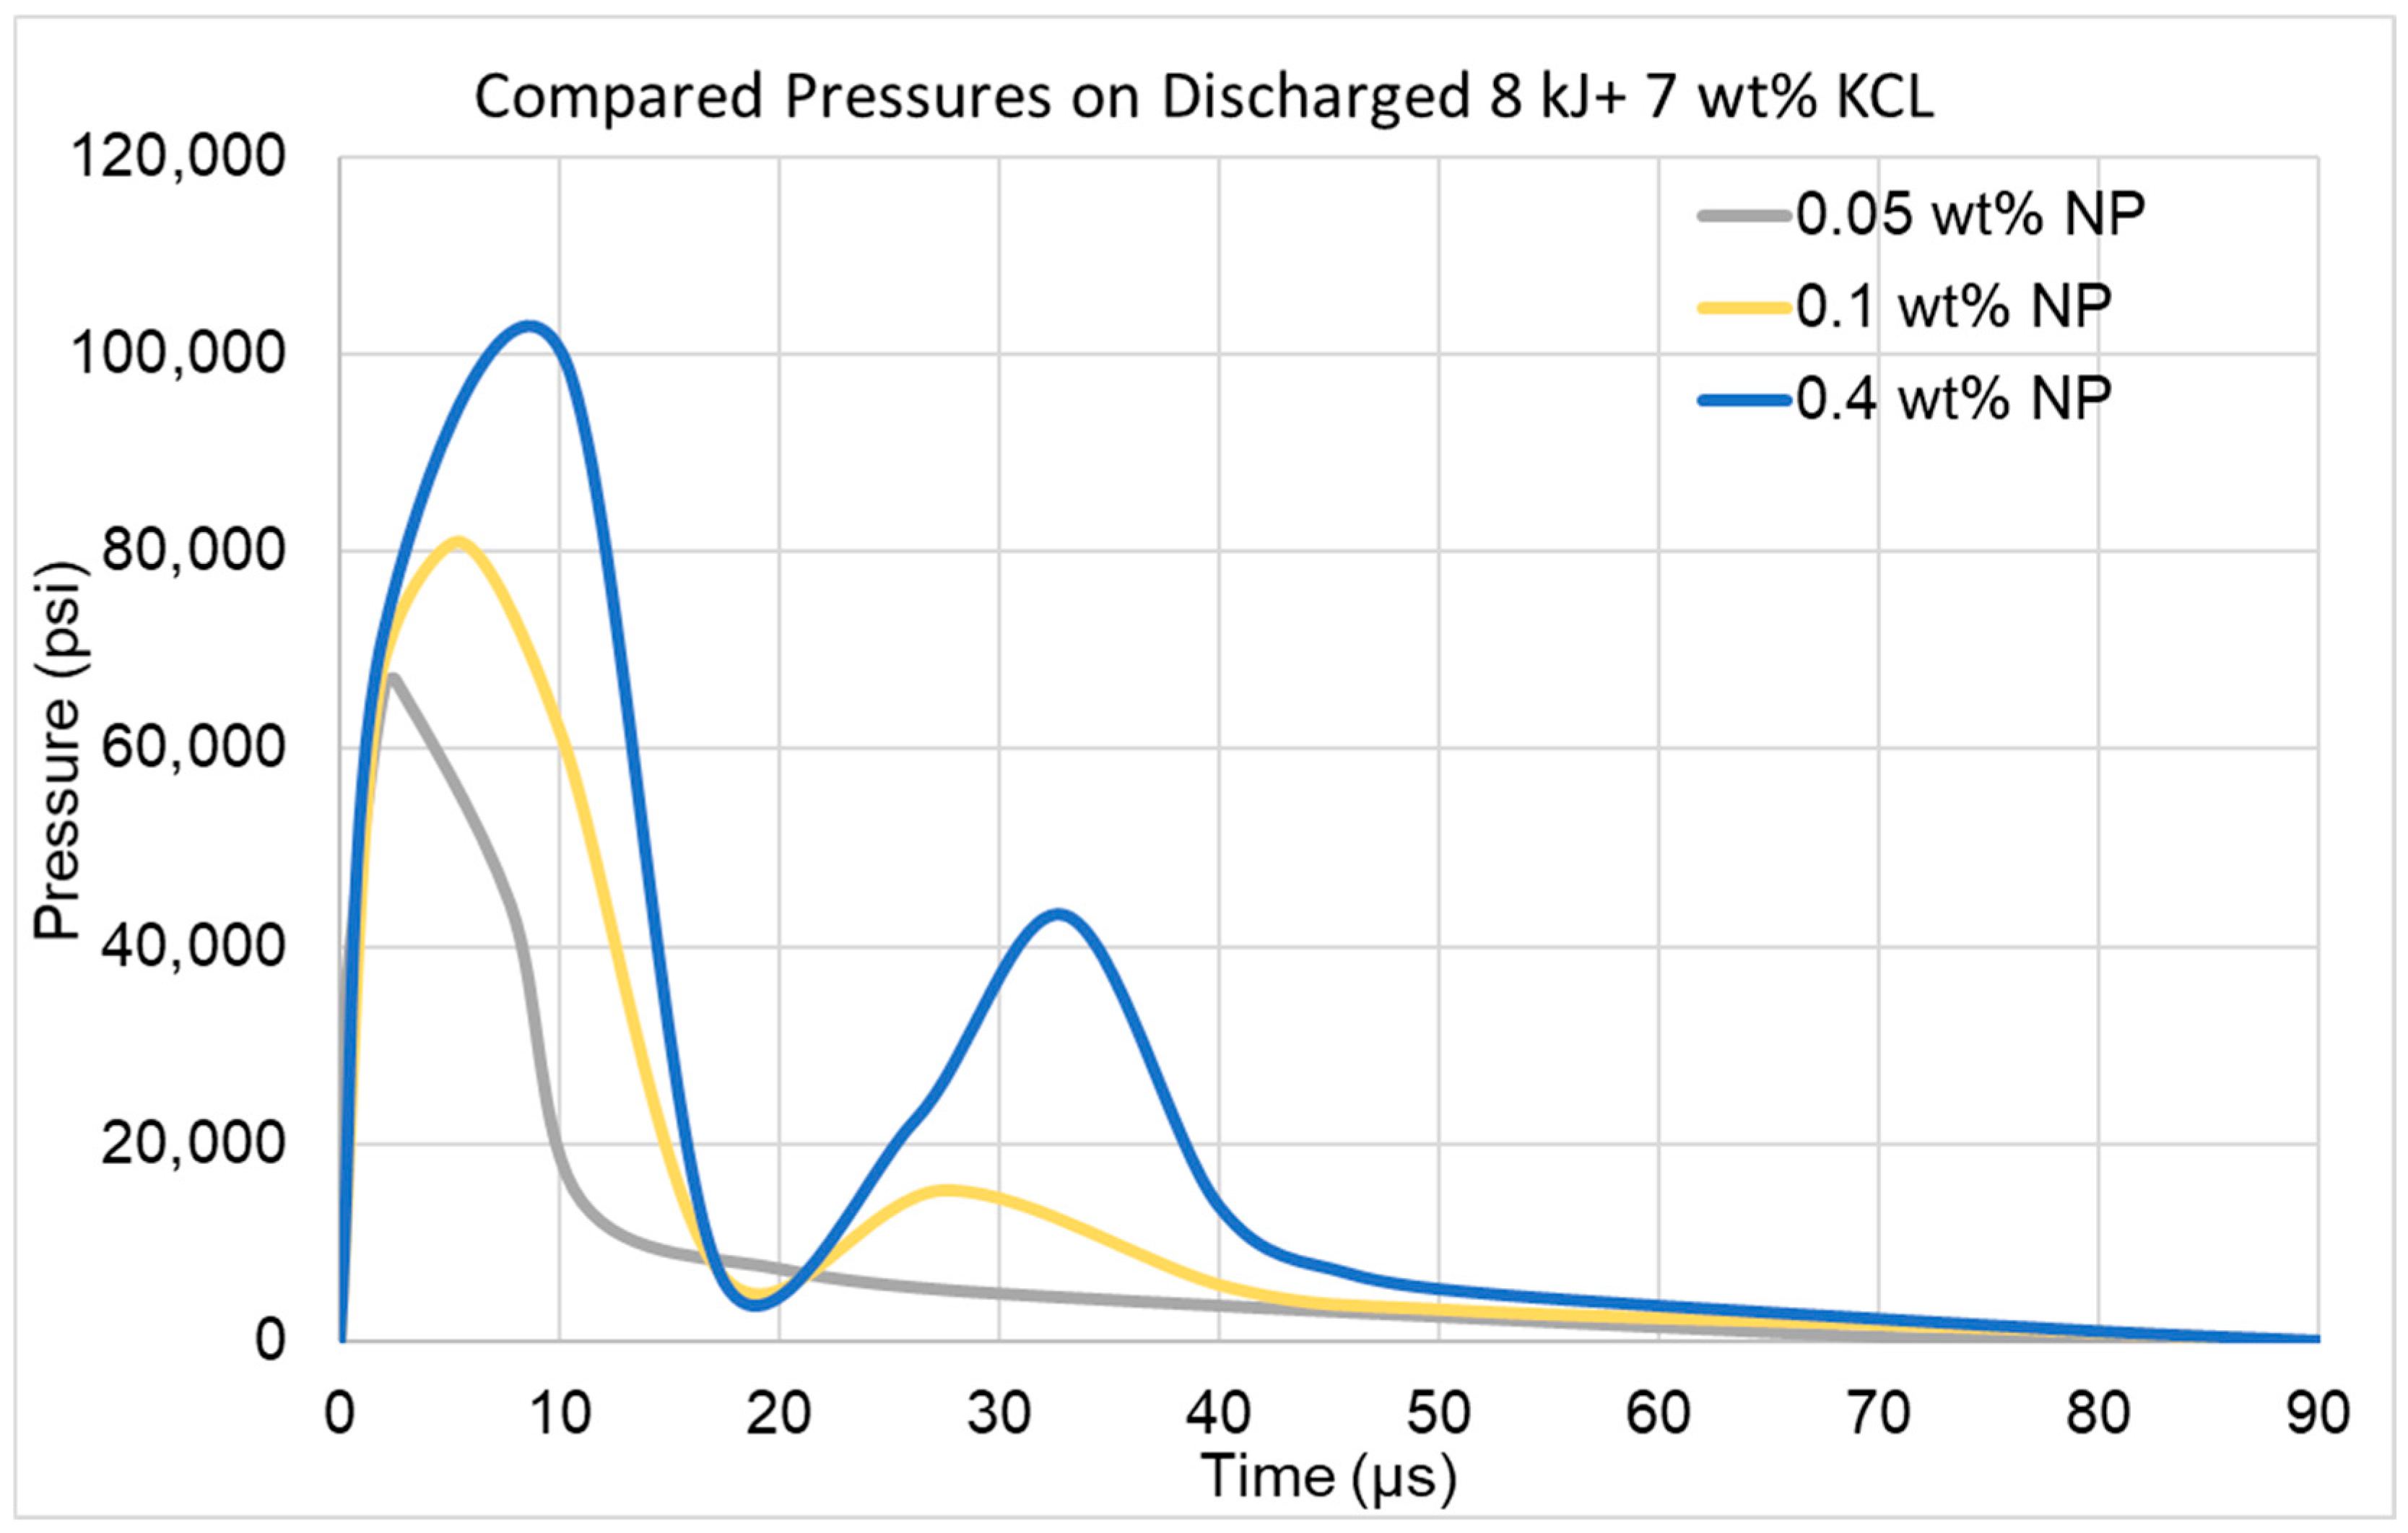
To isolate the effect of NP concentration, subsequent experiments used 7 wt% KCl while varying NP from 0.05 to 0.4 wt%. At low loadings (0.05–0.1 wt%) and 8 kJ discharge, no fractures were detected. Pressure peaks reached 65,000–80,000 psi (448–551 MPa) within microseconds, yet the plasma signatures remained short-lived and low in magnitude, reflecting weak energy coupling. Efficiencies ranged from 0.98 to 1.39, indicating negligible stimulation.
In contrast, the experiment using 0.4 wt% NP with 7 wt% KCl under an 8 kJ discharge produced extensive fracture propagation, as illustrated in Figure 14. Major fractures radiated outward from the borehole in multiple orientations and traversed the entire thickness of the specimen, demonstrating that the NP-3PS discharge effectively coupled with the rock matrix to drive large-scale mechanical failure. The fractures were continuous and interconnected, forming preferential flow pathways that ultimately resulted in complete fluid loss from the system. This observation highlights both the potency of the stimulation and the challenge of controlling fracture geometry when operating under these fluid and energy conditions.
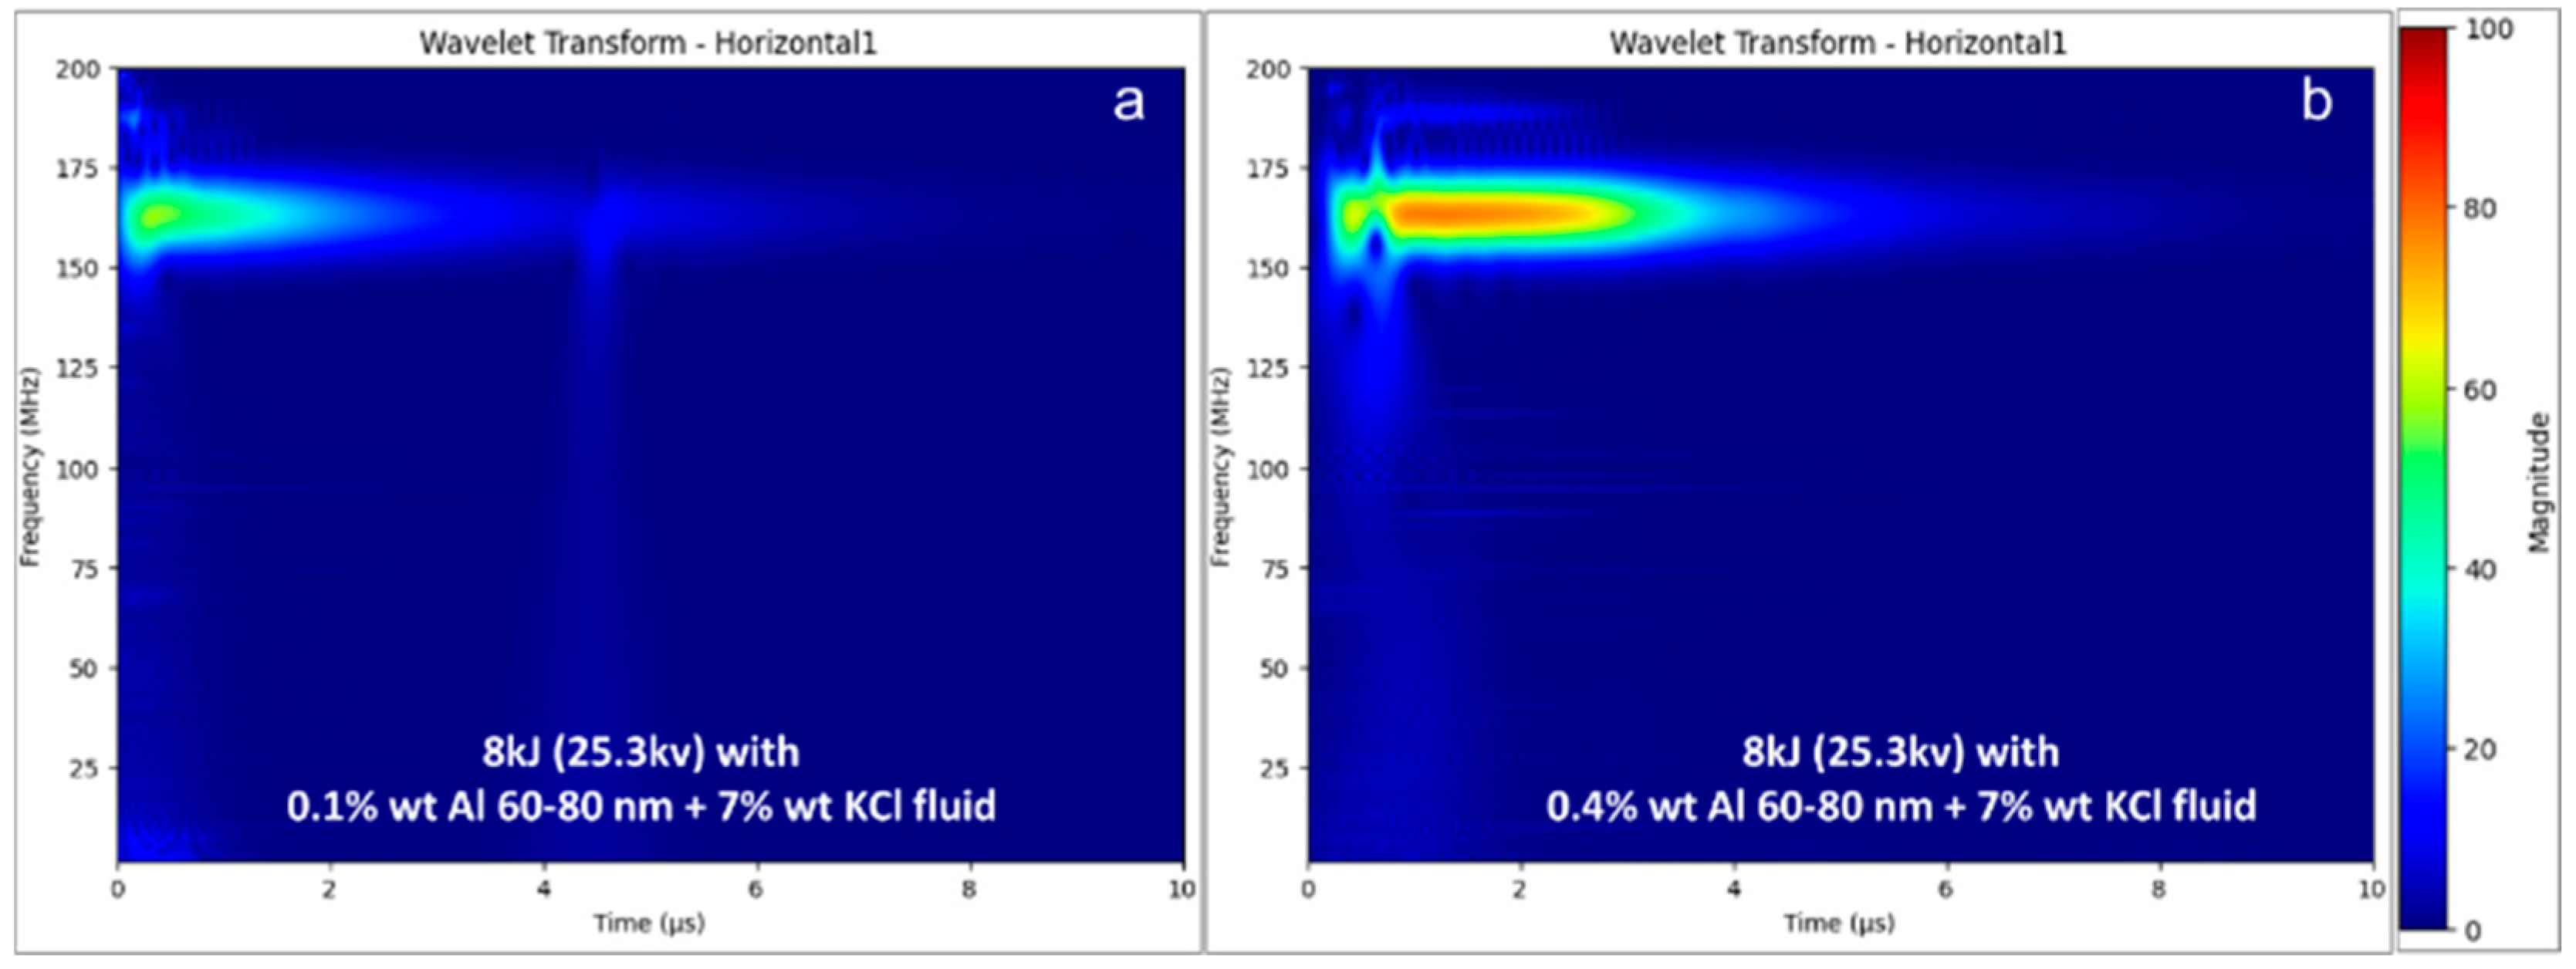
Complementing the visual evidence, the EM wavelet transform presented in Figure 15 provides further insight into the plasma dynamics during this experiment. Unlike the low-intensity, short-duration signals observed at lower NP concentrations (Figure 15a), the 0.4 wt% NP case produced a sustained, high-frequency signal centered around 175 MHz with a broader temporal span (Figure 15b). This signature is consistent with a robust and stable plasma channel capable of depositing energy into the surrounding medium over a prolonged period. The extended duration of high-frequency activity explains the extensive fracture development seen in Figure 14, confirming that NP-enhanced conductivity significantly strengthened the plasma discharge.
Pressure measurements, shown in Figure 16, corroborate these findings. The pressure-time curve for this configuration exhibited the highest recorded peak pressure of approximately 103,000 psi (710 MPa) within 10 µs, followed by a distinct secondary spike of 43,000 psi (296 MPa). The initial sharp peak reflects the instantaneous release of plasma-generated energy, while the secondary peak is attributed to explosive fluid expansion into the newly created fracture network. This two-stage pressure response indicates a transition from localized plasma-induced stress to distributed hydraulic expansion, effectively amplifying fracture propagation. The calculated stimulation efficiency of 2.07 under these conditions underscores the strong energy transfer from electrical discharge to mechanical deformation.
A more balanced outcome was observed with 0.2 wt% NP and 7 wt% KCl at 10 kJ. Fractures were well-distributed through the rock without destructive overshoot (Figure 17). This configuration achieved 1.52 efficiency, combining fracture effectiveness with improved operational control. These findings suggest that 0.2–0.4 wt% NP with 7 wt% KCl and moderate discharge energy provides an optimized stimulation window.

4.3. NP-3PS in 10 wt% KCl and 0.18 wt% Guar Gum Base Fluid

Further testing at elevated ionic strength (10 wt% KCl) was performed to investigate the impact of higher conductivity on NP-enhanced plasma stimulation. Experiments were conducted with NP concentrations of 0.3 and 0.4 wt% under discharge energies of 8 and 10 kJ. At 8 kJ with 0.3 wt% NP, the specimen remained fully intact across all examined surfaces, with no visible evidence of fracture nucleation. This outcome suggests that the majority of the input energy was dissipated within the highly conductive fluid medium rather than being transmitted into the rock matrix. The excessive ionic strength effectively acted as an energy sink, reducing the available plasma intensity below the threshold required for fracture initiation.
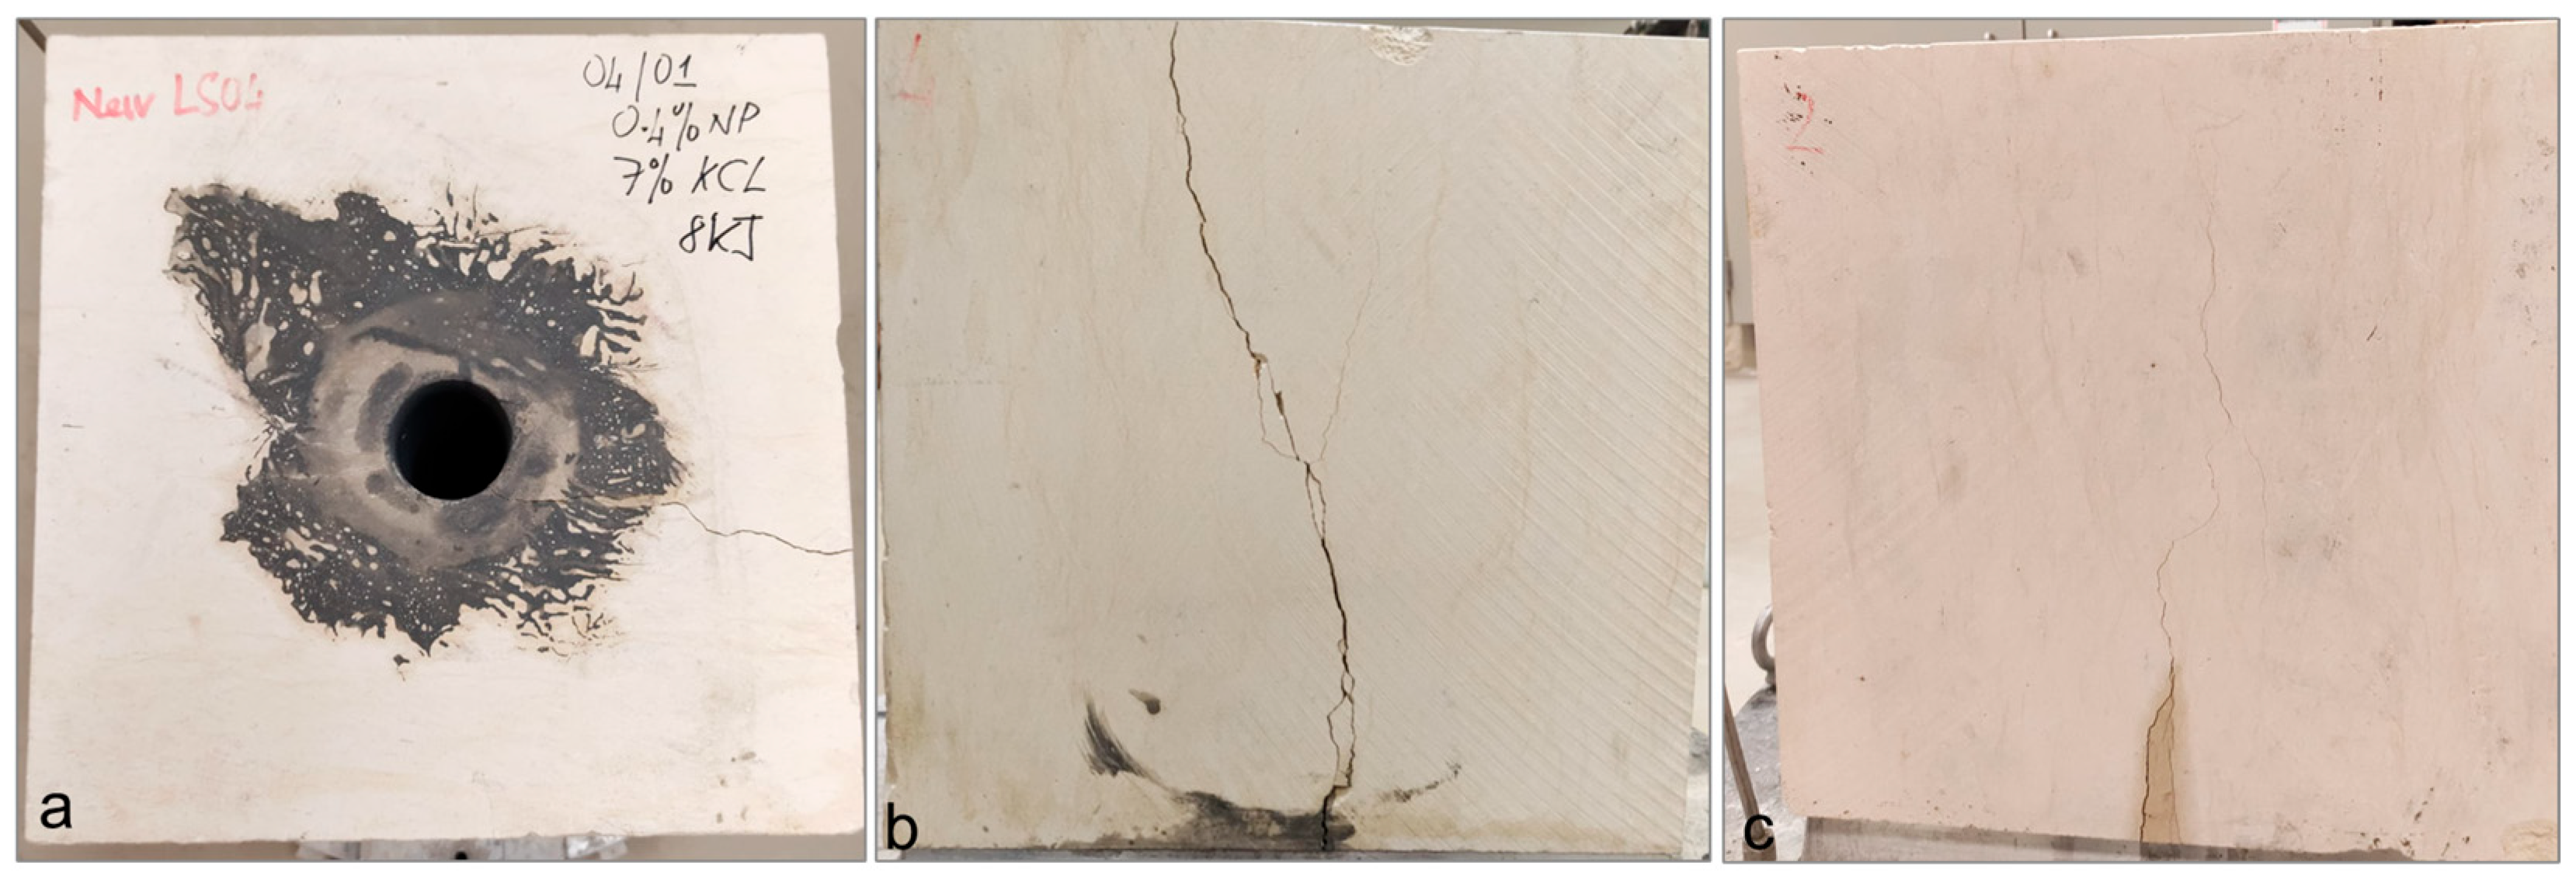
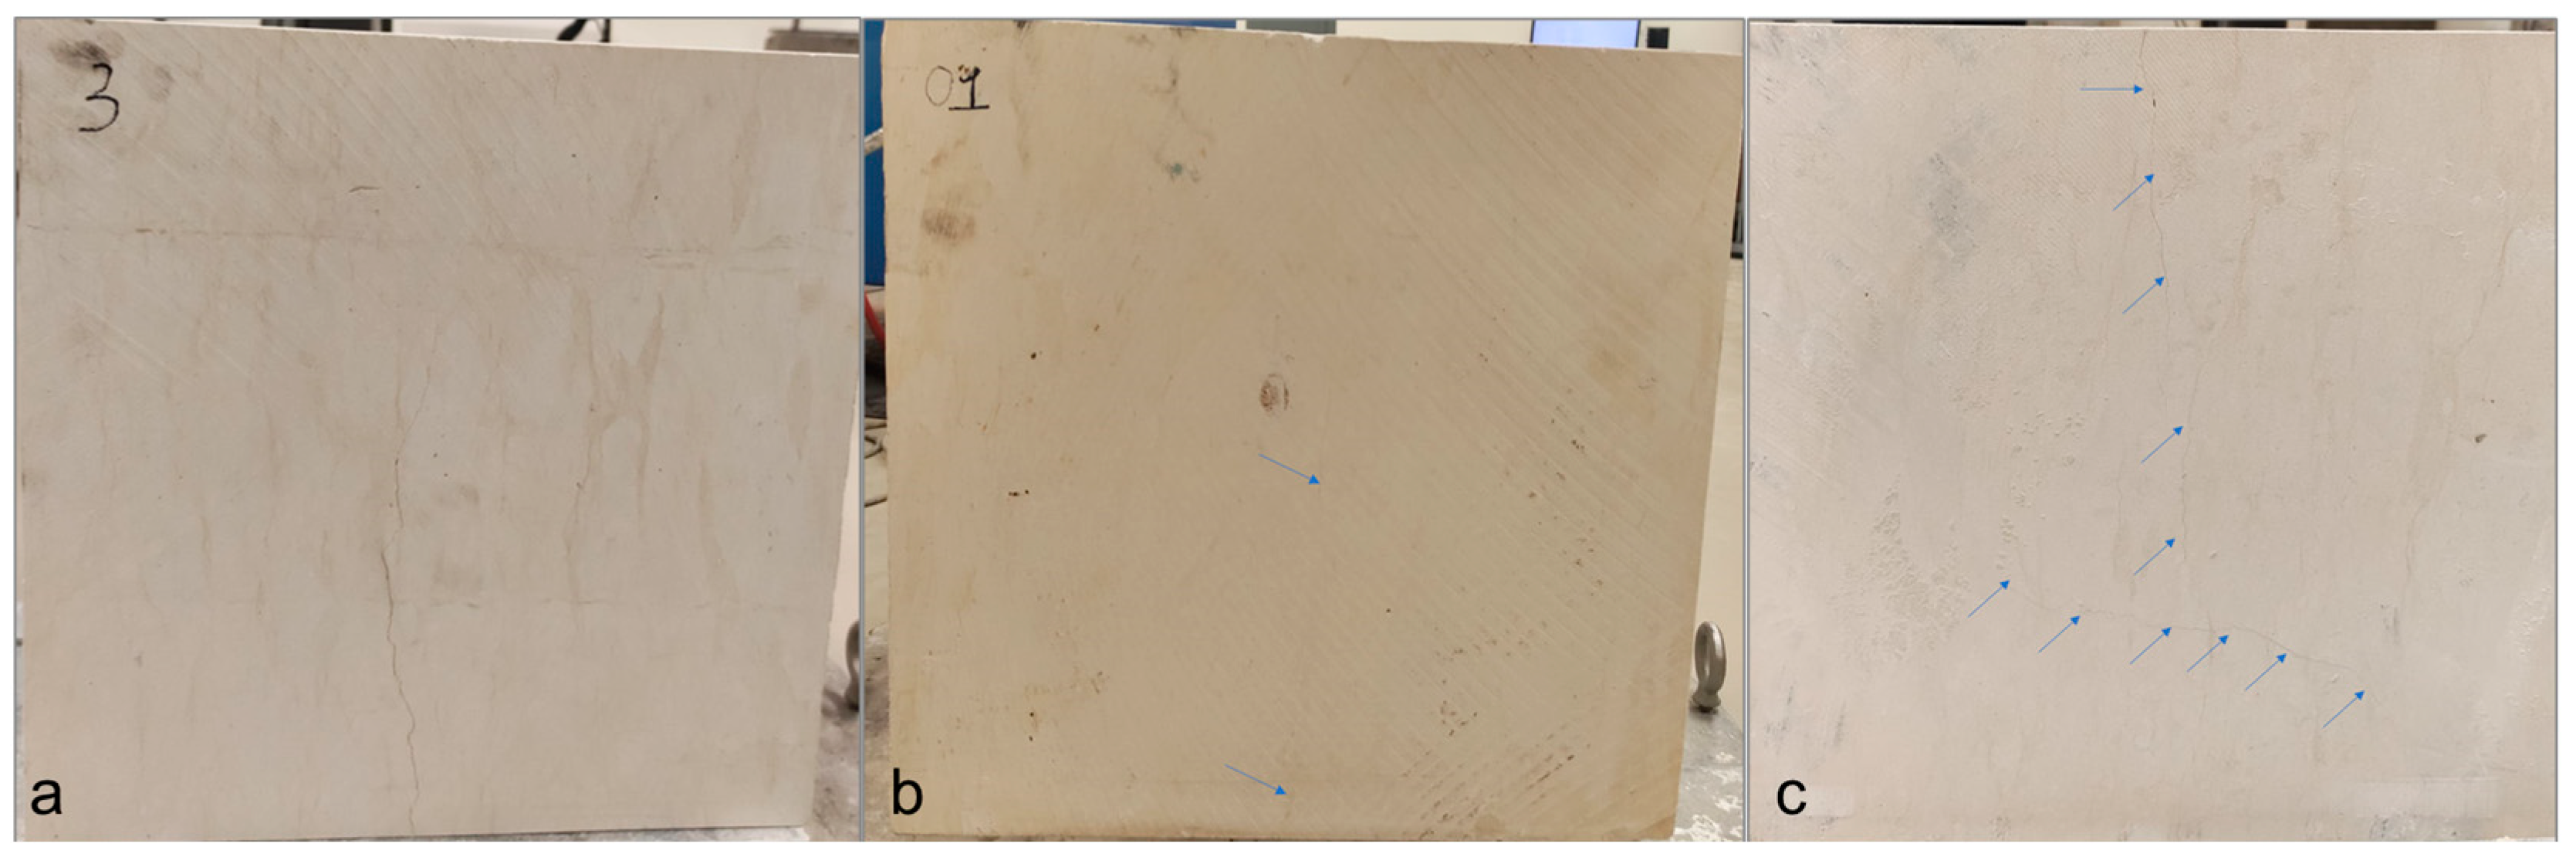
At 10 kJ with 0.4 wt% NP, a marginal improvement was observed in the form of hairline cracks along the side and bottom surfaces of the specimen (Figure 18a–c). These fractures were thin, subparallel, and largely superficial, extending only short distances without forming interconnected networks. Their geometry indicates that the plasma discharge achieved partial stress localization but failed to sustain sufficient energy to propagate fractures deeply into the rock. The visual evidence supports the interpretation that while increased discharge energy and NP loading enhanced plasma activity, the elevated conductivity of the 10 wt% KCl solution continued to dominate the system’s energy balance, dispersing electrical input into the fluid rather than concentrating it at the borehole–rock interface.
Figure 18 illustrates this limitation clearly, as the detected fractures lack the depth and branching complexity seen in lower KCl experiments (e.g., 7 wt% cases, Figure 13 and Figure 16). Instead, the fractures appear as faint surface markings, insufficient to enable fluid transport or significant structural modification. These results emphasize that while high KCl concentrations stabilize NP suspensions and promote current flow, they simultaneously accelerate premature spark formation and local energy dissipation, undermining the efficiency of plasma-driven fracture creation. Collectively, the findings demonstrate that 10 wt% KCl represents an over-conductive environment where energy coupling into the rock is substantially reduced, highlighting the importance of maintaining a moderate ionic strength to balance conductivity with effective fracture stimulation.
These results of NP fluid optimization demonstrate that 4 wt% KCl provided insufficient ionic strength, yielding low calculated energy and no fractures. For experiments using 10 wt% KCl, despite its high ionic conductivity, the overabundance of free ions may have resulted in excessive energy dissipation along the fluid path and released outside the capacitor, leading to minimal or no fracture formation. These high-conductivity conditions produced intense electrical sparks localized at the electrode connections, indicating inefficient energy transfer into the rock matrix. This suggests that the electric field preferentially discharged along the fluid column rather than generating a concentrated plasma channel at the borehole–rock interface. The optimal 7 wt% KCl struck a critical balance, delivering high plasma coupling efficiency and enabling strong, sustained plasma generation with minimal external dissipation. This concentration supports robust electrical breakdown within the NP-laden fluid, promoting distributed thermite reactions and multi-cycle shockwaves (>100,000 psi or 690 MPa).

5. Granite Stimulation Results

The results from NP-3PS experiments on 8” (20.32 cm) granite cubes provide robust evidence of the technique’s capacity to induce interconnected fracture networks in hard crystalline formations, directly addressing the research objective of evaluating ultrafast shockwave effects on fracture propagation, geometry, and property alterations under simulated EGS conditions. The granite specimens, representative of low-permeability hot dry rock reservoirs, were systematically characterized for baseline mechanical properties prior to stimulation. Subsequent NP-3PS trials, employing an optimized fluid formulation of 0.3 wt% NP dispersed in 7 wt% KCl brine stabilized with 0.18 wt% guar gum, delivered discharge energies from 6 kJ to 16 kJ. This configuration enabled multi-cycle thermite reactions, overcoming the single-pulse limitations of traditional fusible-wire methods and facilitating sustained pressure impulses without tool retrieval. Real-time diagnostics captured peak pressures exceeding 100,000 psi (690 MPa) within microseconds, while post-stimulation analyses—encompassing CT imaging, thin-section petrography, dynamic acoustic testing, porosity quantification, and thermal conductivity assessments—quantified enhancements in fracture complexity, permeability, and heat transfer efficiency. These findings underscore NP-3PS’s potential as a scalable, waterless stimulation alternative for EGS, where deep penetration and thermal performance are paramount.

5.1. Baseline Mechanical Characterization of Granite

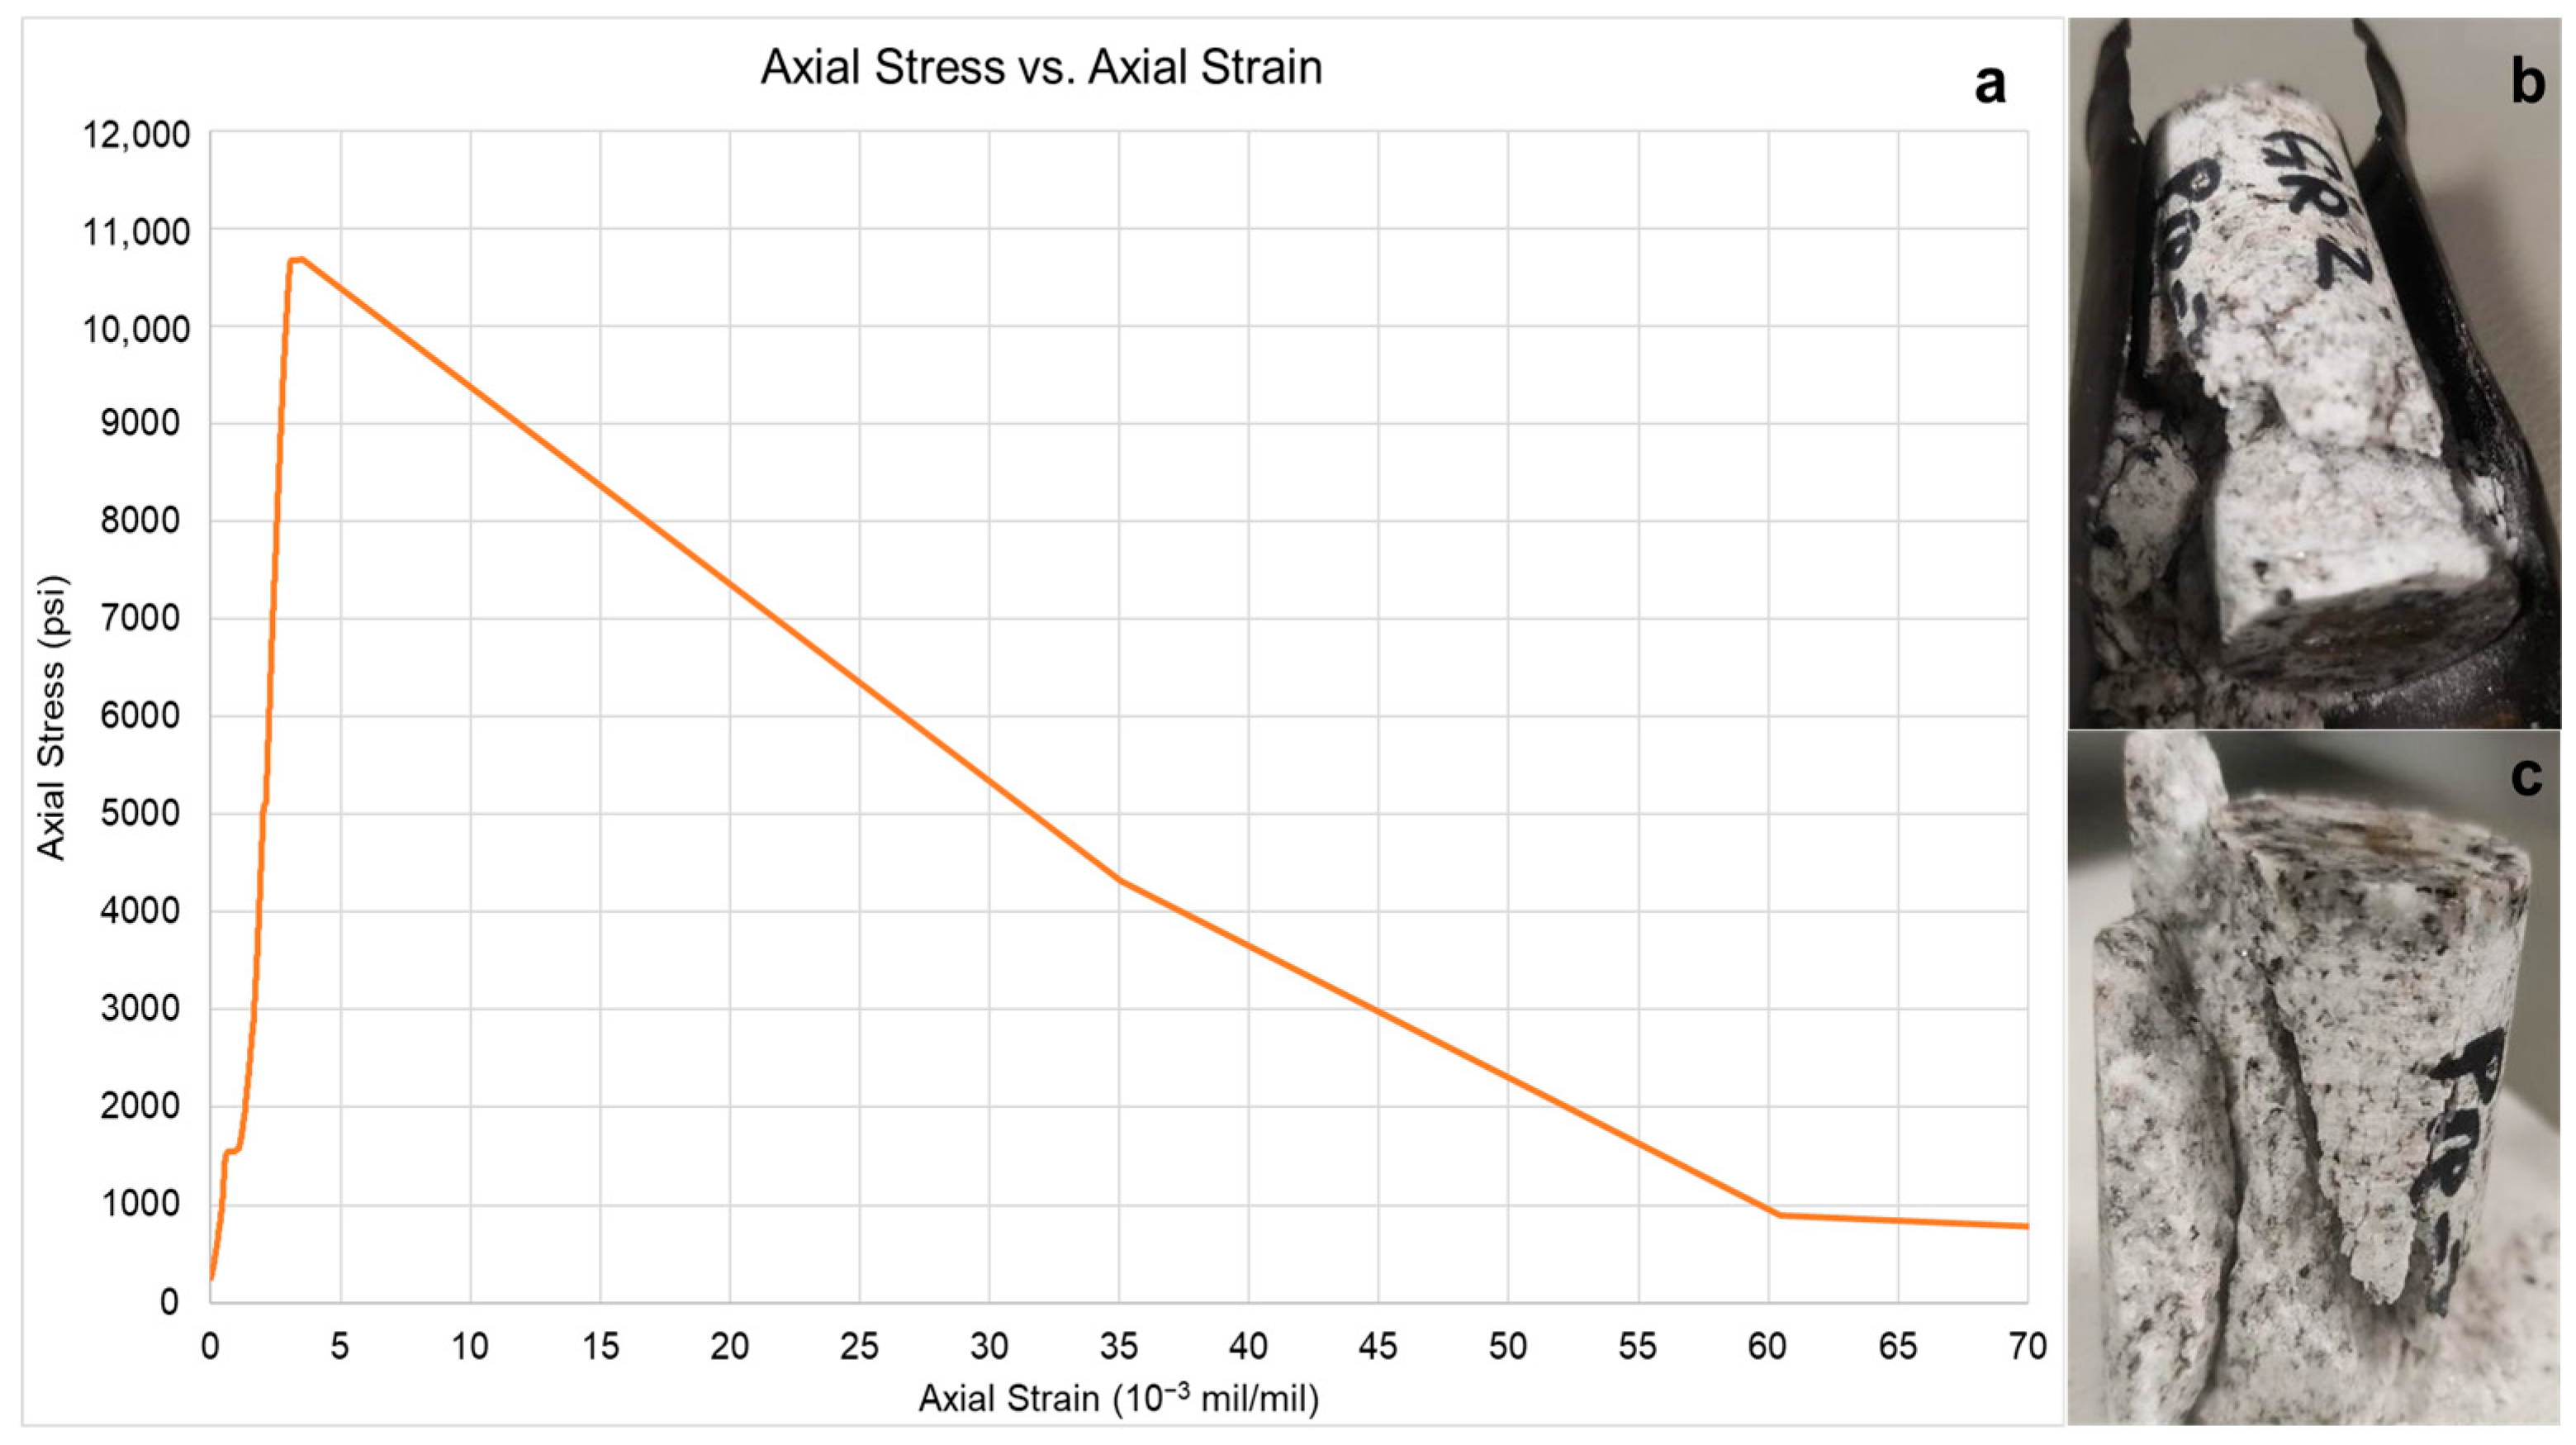
To establish damage thresholds relevant to EGS reservoir stimulation, baseline geomechanical properties were determined through uniaxial and triaxial compression tests on core plugs extracted from the granite cubes. Single-stage triaxial testing without lateral confinement (Figure 19a) revealed an unconfined compressive strength (UCS) of 10,700 psi (73.7 MPa) and a Young’s modulus of 6.78 Mpsi (46.7 GPa), with failure characterized by axial splitting in horizontal views (Figure 19b) and shear-band development in vertical sections (Figure 19c). These values align with typical Granite analogs used in geothermal studies, indicating a brittle response under monotonic loading.
Multi-stage triaxial test was conducted by incrementally increasing confining pressures to the point of positive dilatancy to generate stress–strain data that establishes Mohr-Coulomb failure criteria. The resulting failure envelopes yielded an internal friction angle of approximately 33° and cohesion of 3000 psi (26.7 MPa), enabling estimation of the indirect tensile strength at 4520 psi (31.2 MPa) via the tensile cutoff intercept. This tensile threshold is critical for interpreting NP-3PS-induced Mode I fractures, as subsequent shockwave pressures routinely exceeded it by 10–20-fold, ensuring initiation and propagation in the low-porosity matrix (baseline ~1.3%). These characterizations not only validated the granite’s representativeness for EGS targets but also provided benchmarks for post-stimulation damage indices, linking observed fracture enhancements to reduced breakdown pressures in field-scale applications.

5.2. Macroscopic Fracture Morphologies

Post-stimulation visual analyses revealed a clear scaling relationship between discharge energy and fracture development, directly linking input energy to propagation extent and geometric complexity—key parameters for permeability enhancement in EGS reservoirs. Top-view inspections (Figure 20) exhibited radially oriented tensile fractures emanating from the central 2-inch borehole.
At 16 kJ (Figure 20a), multiple branched fractures extended 6–8 inches, displaying apertures of 1–3 mm and secondary fissures inclined at 30–45°, characteristic of mixed-mode tensile–shear failure under anisotropic stress fields. The 12 kJ discharge (Figure 20b) produced moderately branched fractures extending 4–6 inches, while the 10 kJ case (Figure 20c) yielded shorter, 2–4 inch hairline cracks with limited lateral propagation. In comparison, the primed 6 kJ sequence (Figure 20d) generated intermediate fracture networks spanning 3–5 inches, illustrating the cumulative effect of sequential plasma discharges on localized damage intensification. Photogrammetric surface mapping indicated that the total fracture area increased from approximately 0.02 m2 at 10 kJ to 0.08 m2 at 16 kJ, corresponding to estimated stimulated volumes of 0.03–0.08 m3 per specimen. These findings confirm that fracture complexity and stimulated volume scale nonlinearly with discharge energy, emphasizing the tunable nature of NP-3PS for controlled subsurface stimulation.
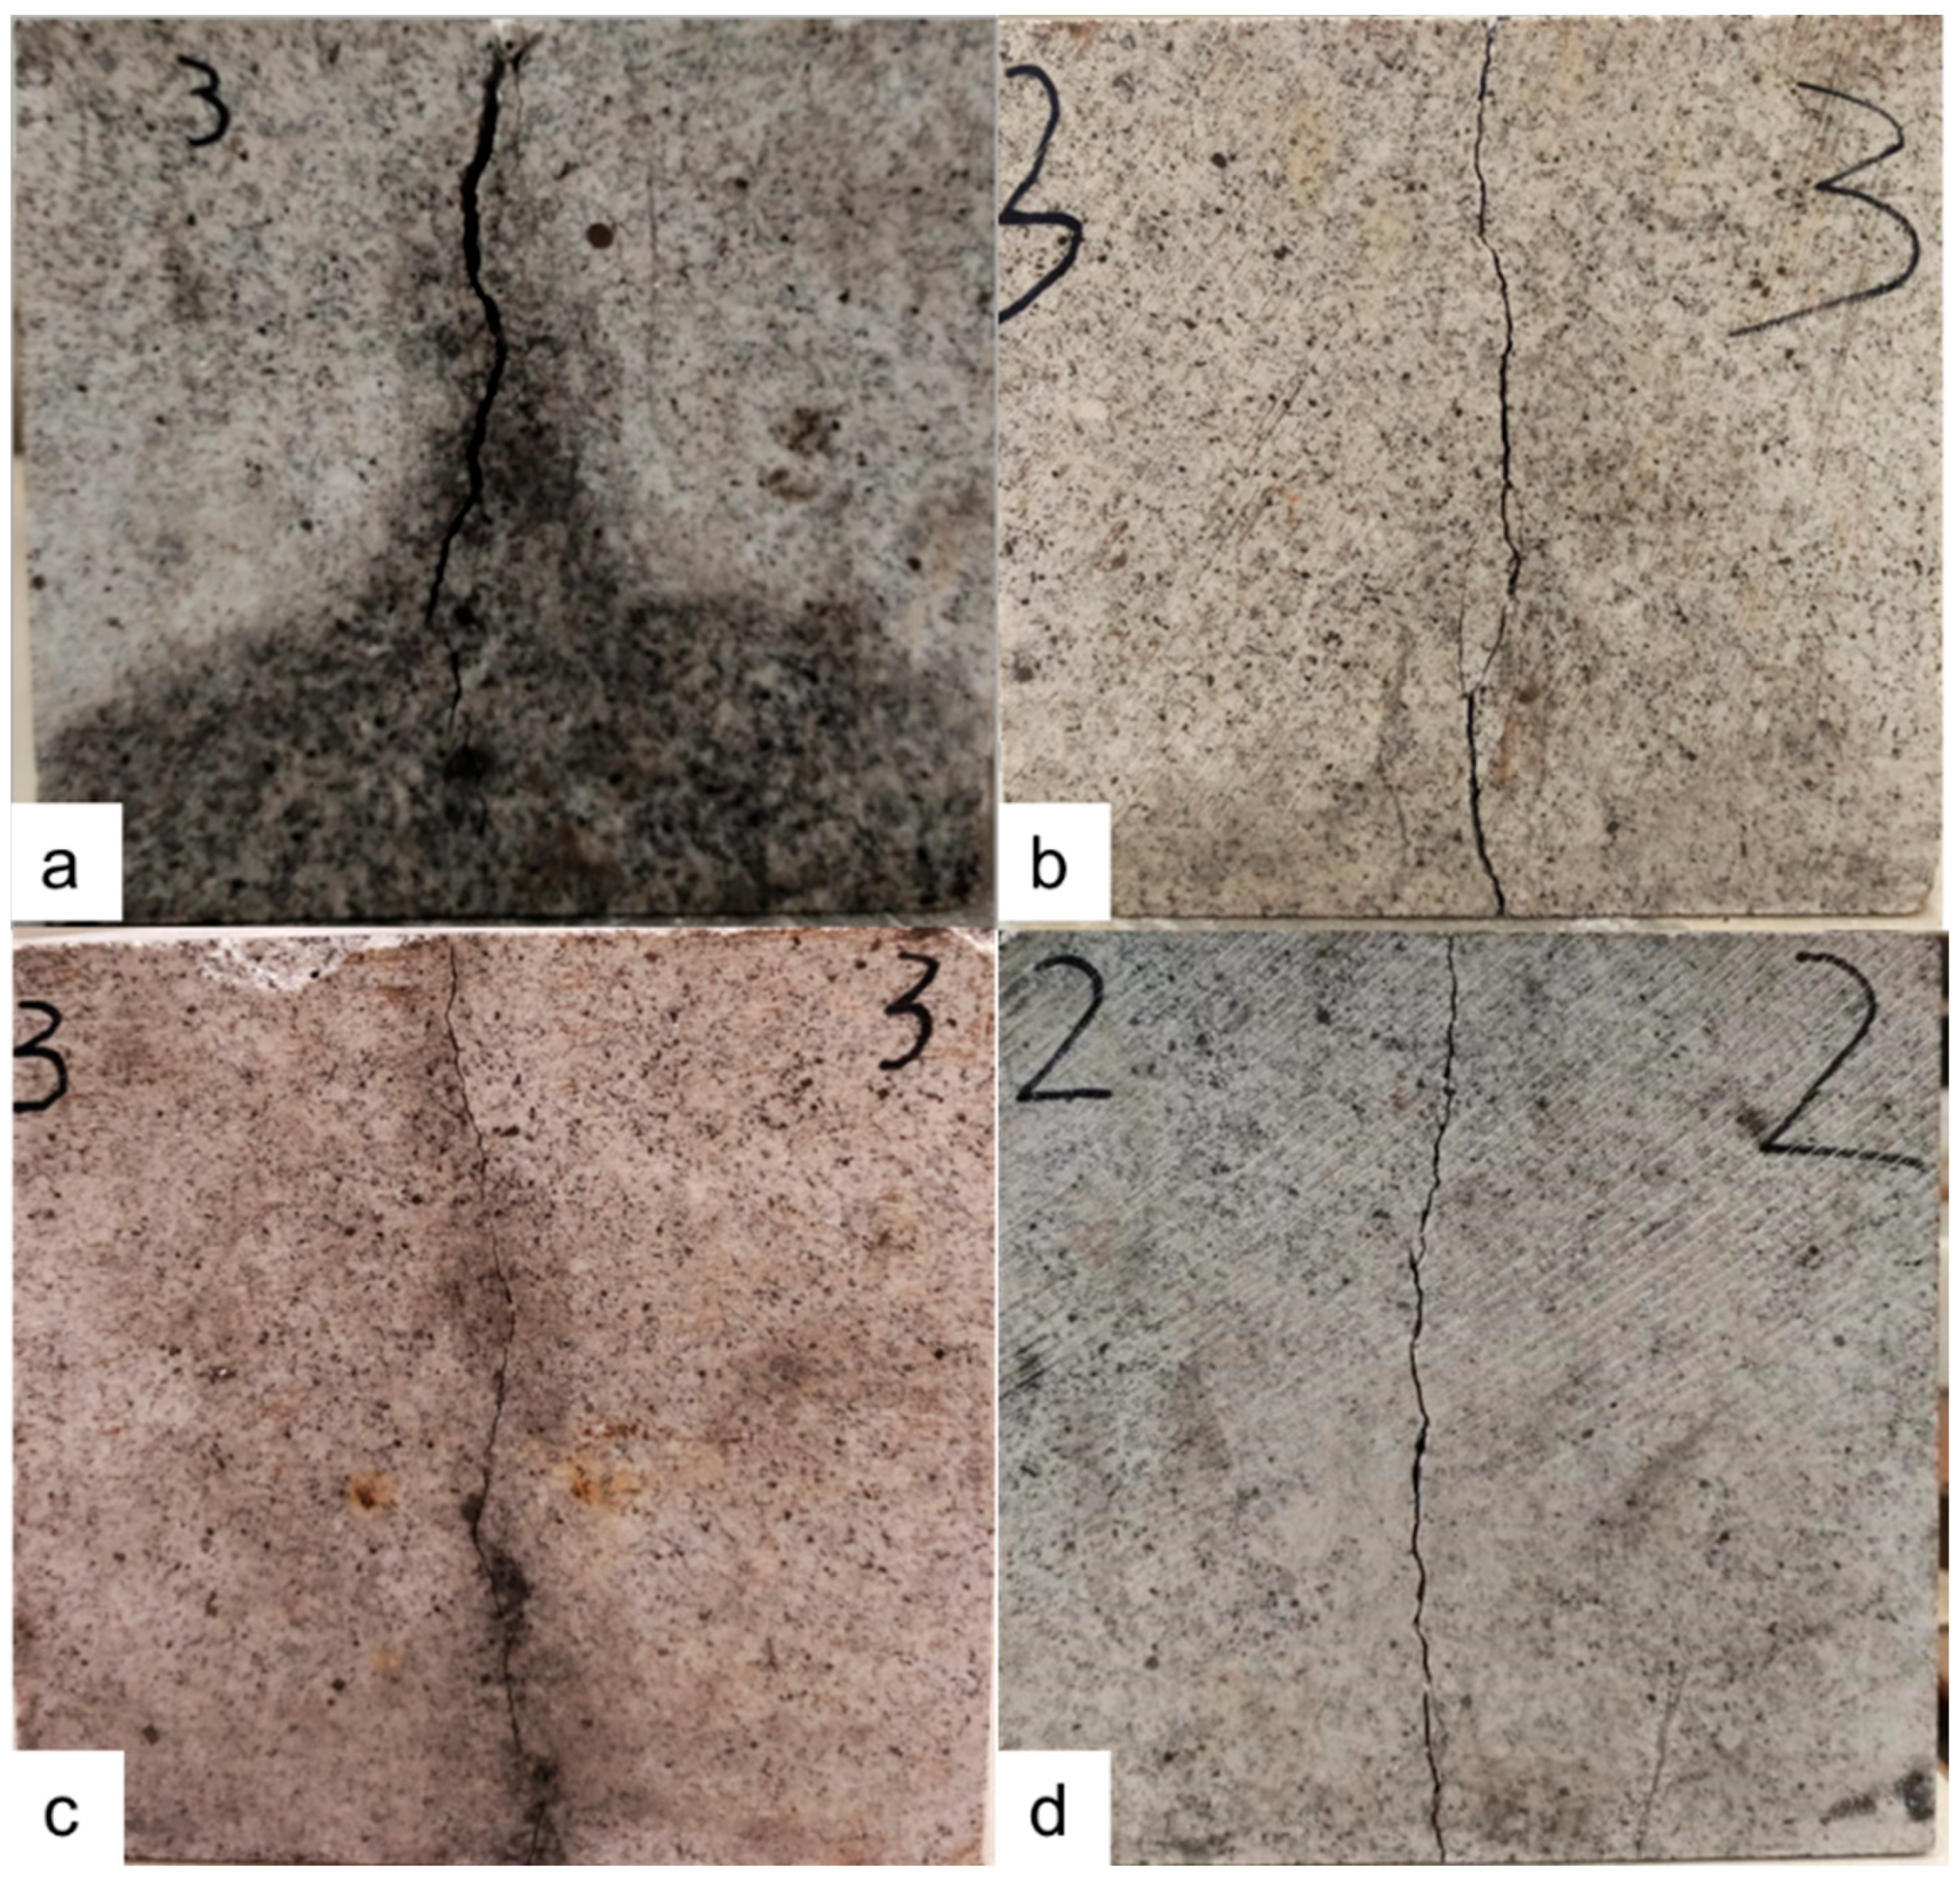
Side-view examinations (Figure 21) confirmed vertical fracture propagation across the full 8-inch height of the granite cubes, with fracture paths consistently following mineral-guided trajectories influenced by quartz–feldspar heterogeneities. At 16 kJ (Figure 21a), the fracture exhibited a tortuous, through-going profile with the widest aperture, averaging 1–3 mm, reflecting maximal energy penetration. The 12 kJ discharge (Figure 21b) achieved full 8-inch penetration with a reduced aperture of 0.5–1 mm, accompanied by lateral offsets, while 10 kJ (Figure 21c) resulted in full-height propagation with apertures <0.5 mm, manifesting as superficial damage. The 2-pulse 4 kJ + 6 kJ (Figure 21d) also extended across the full 8 inches, initiating oblique fractures with apertures of 0.5–1 mm. Across all energy levels, the fracture width increased with higher discharge energy, correlating directly with the intensity of the NP-3PS shockwave, though penetration depth remained consistent at the full 8-inch height.
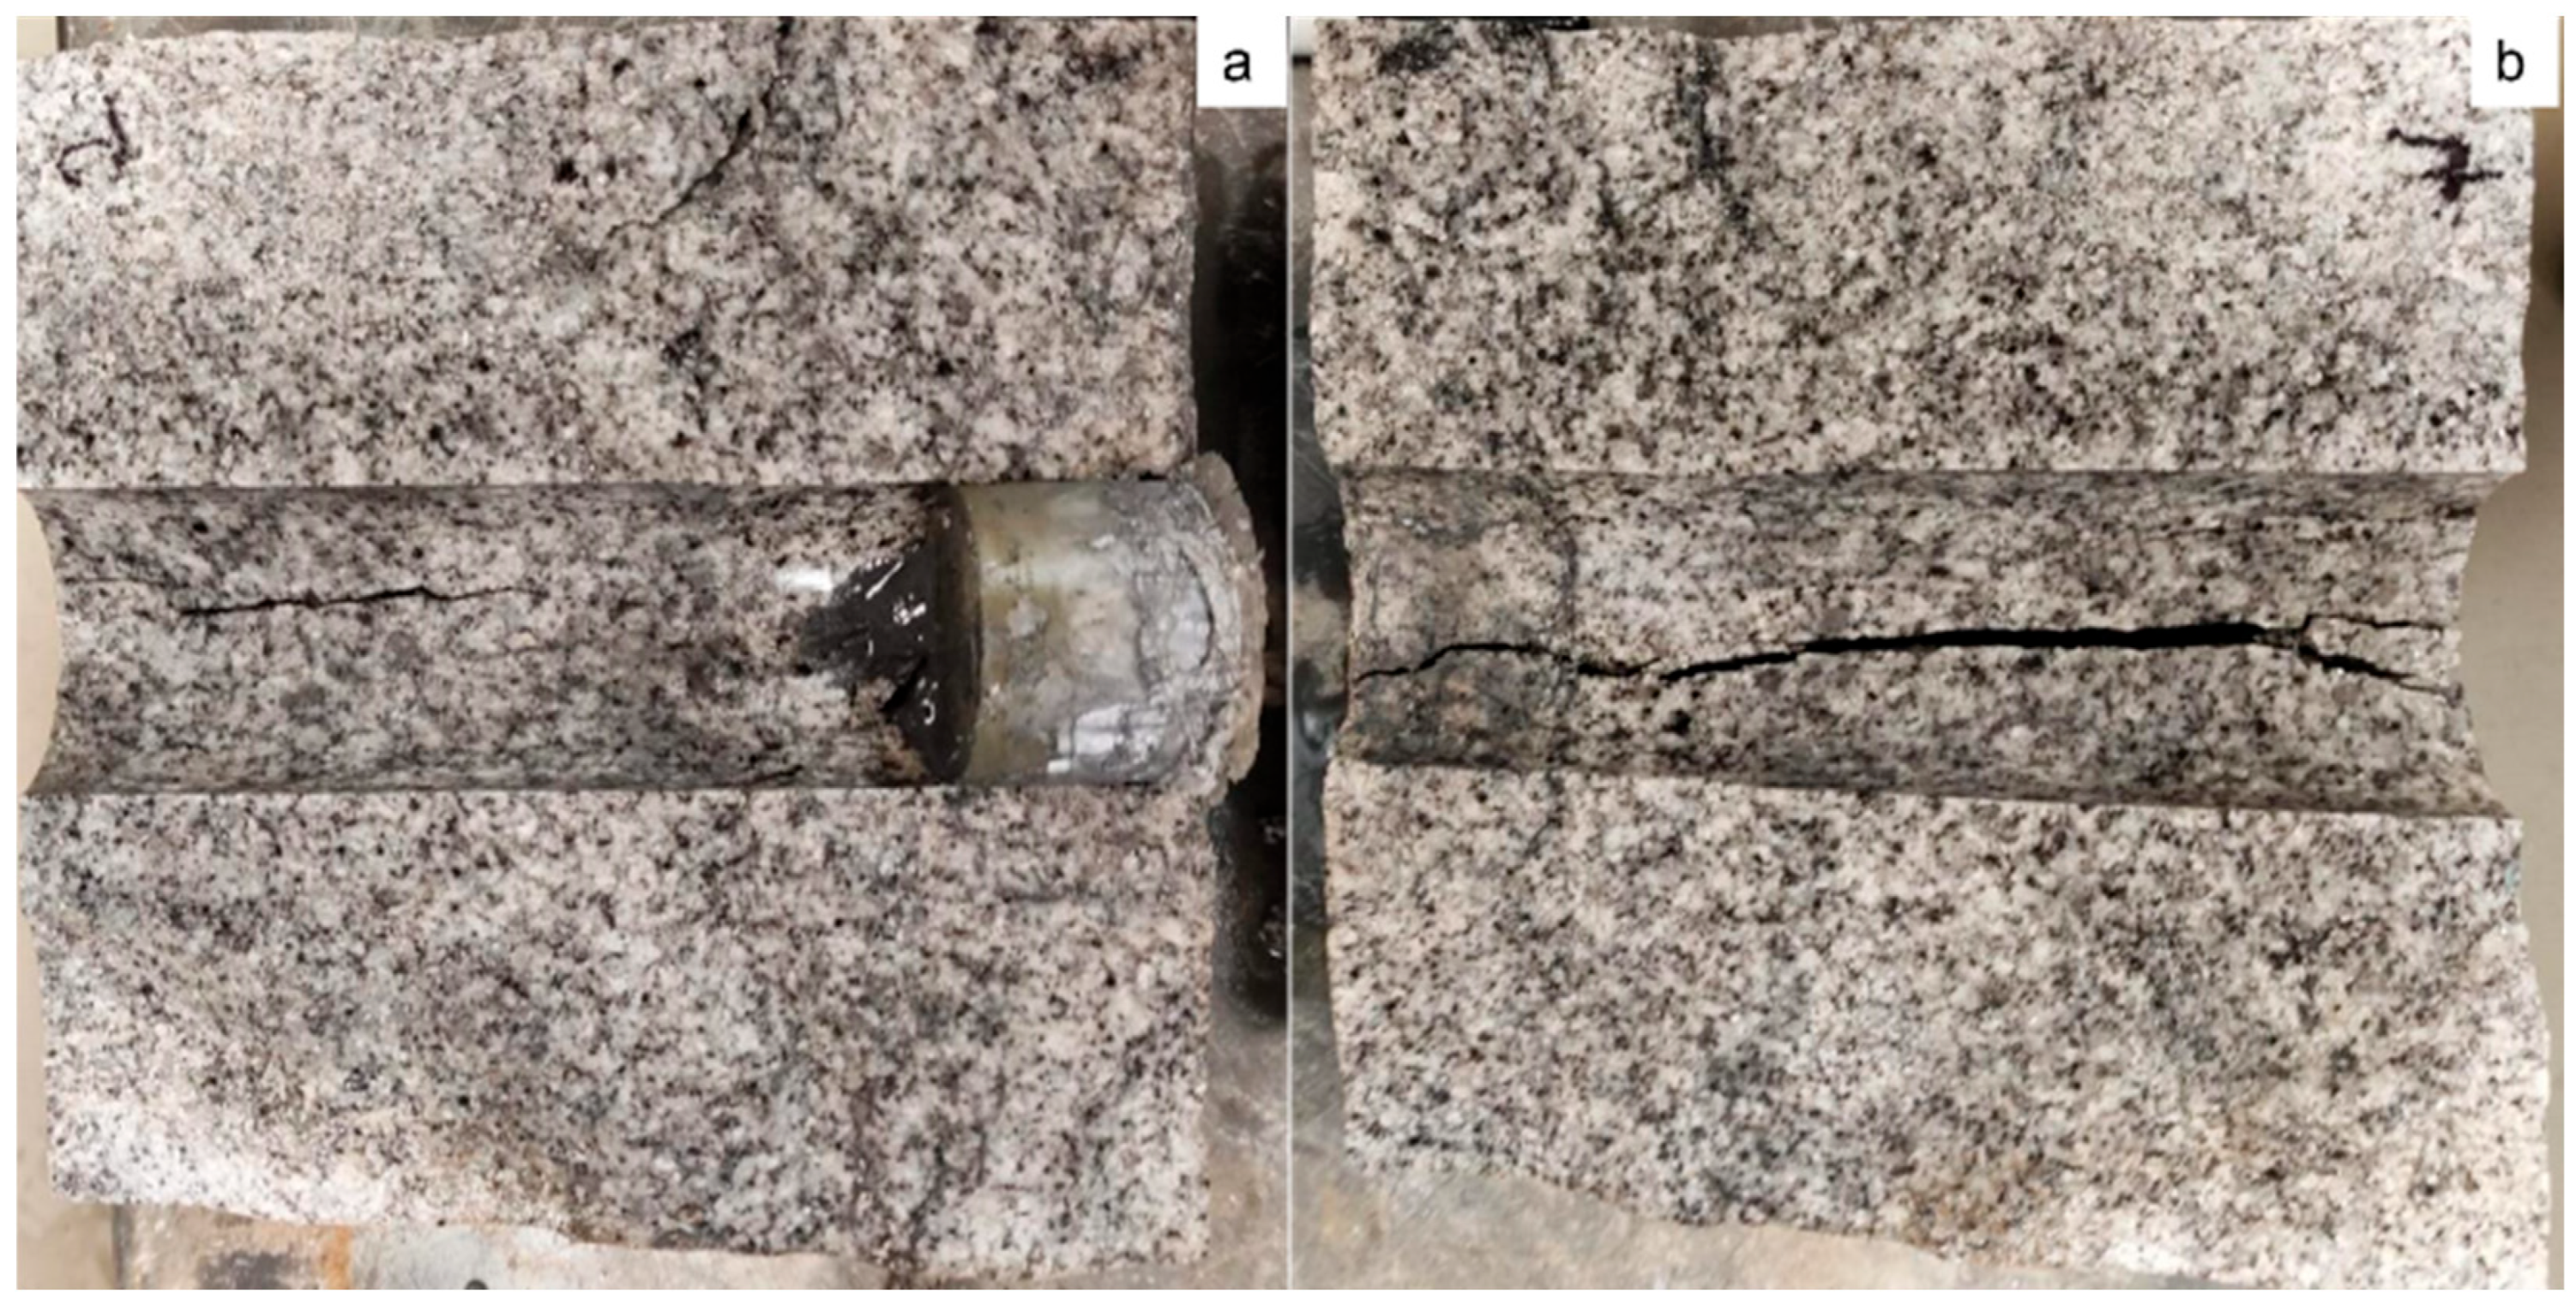
Borehole proximal views post-16 kJ (Figure 22) exposed tensile cracking with NP residues adhering to walls (average aperture 0.5–1.5 mm), implying a self-propping mechanism that could sustain EGS flow paths under closure stresses up to 4520 psi (31.2 MPa). Overall, higher energies amplified complexity (branching density ~5–10/m at 16 kJ vs. <2/m at 10 kJ), aligning with the objective of creating conductive networks for heat extraction while the priming strategy offers low-energy alternatives for zonal targeting.

5.3. Dynamic Pressure Responses and Stimulation Efficiency

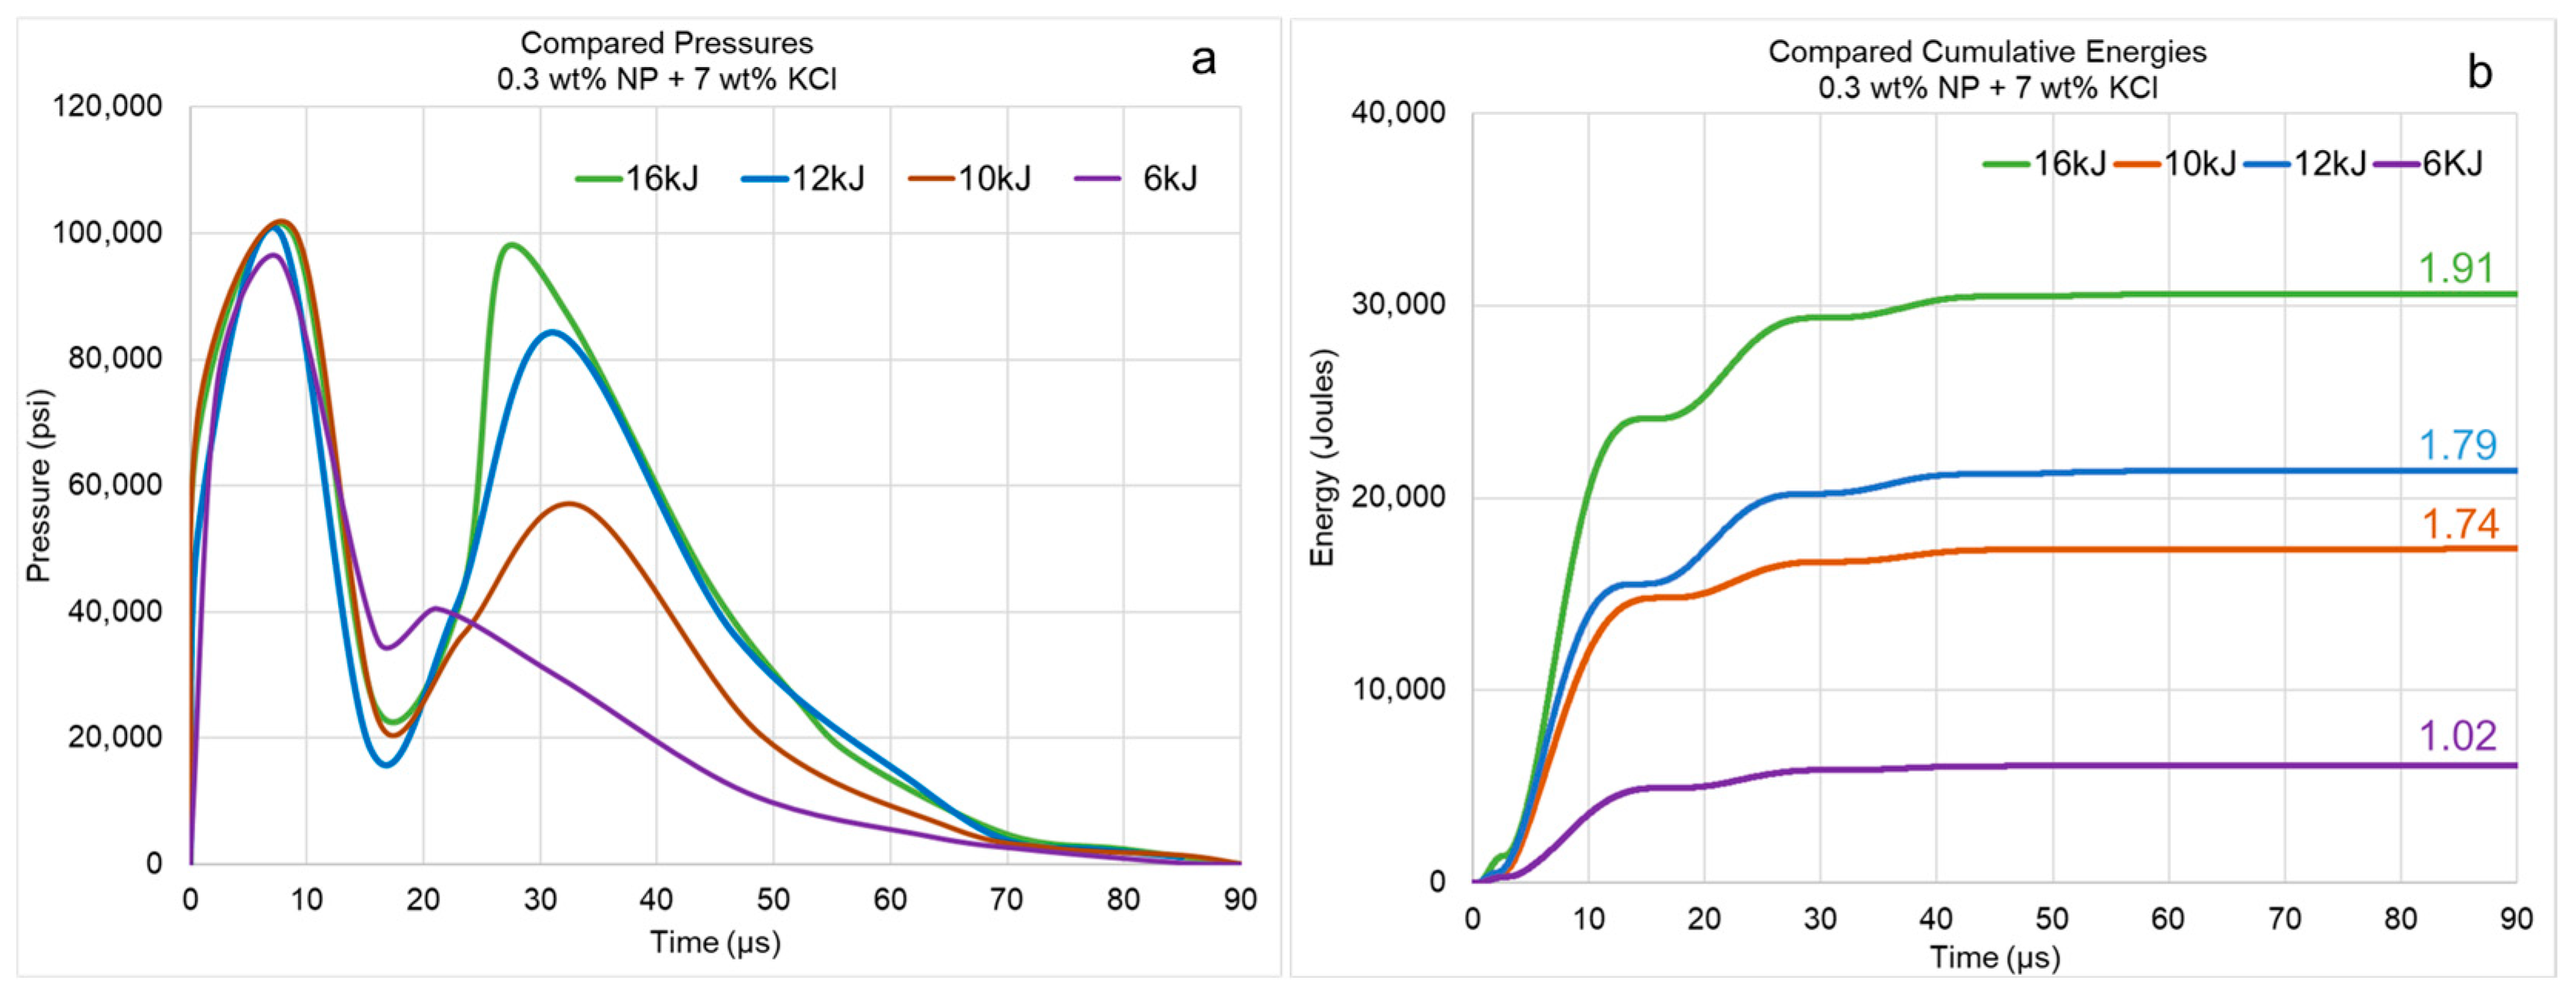
Real-time pressure monitoring during NP-3PS discharges (Figure 23a) underscored the technique’s hydrodynamic efficacy, revealing a nonlinear escalation in peak borehole pressures: the first peak reached 95,000 psi (655 MPa) for the 6 kJ pulse following 4 kJ priming, while exceeding 100,000 psi (690 MPa) for the 10 kJ, 12 kJ, and 16 kJ discharges, all achieved within 10 μs rise times. The multi-peak waveforms (1–3 distinct cycles per event) were characteristic of NP-mediated thermite reactions, with the 0.3 wt% NP enabling sequential exothermic ignitions that extended plasma arc durations to 15–25 μs, compared to <5 μs in conventional wire-based analogs. Notably, the second pressure peak increased in magnitude and occurred more rapidly with higher discharge energies, reflecting enhanced energy coupling and accelerated thermite reactivity, with values escalating from approximately 40,000 (276 MPa) psi at 6 kJ to over 95,000 psi (655 MPa) at 16 kJ within 5–10 μs of the initial peak.
Stimulation efficiency was quantified as the ratio of cumulative discharge energy to nominal electrical input energy to deliver theinstantaneous mechanical impulse per electrical input, enabled by NP thermite augmentation. While correlated with peak pressure and fracture density, it does not directly predict long-term permeability or fracture stability. Sustained enhancements of porosity were validated via post-stimulation diagnostics, confirming stable, interconnected networks. However, closure under high in situ stress remains untested.
During the stimulations in Granite rock, the efficiencies (Figure 23b) ranged from 1.02 at a primed 6 kJ to 1.91 at 16 kJ, reflecting progressive optimization of energy coupling into the granite matrix. In this study, the cumulative discharge energy was determined by integrating the instantaneous product of voltage and current over the effective discharge duration (approximately 0–90 µs). Values greater than one do not indicate a physical gain of mechanical energy but instead represent a normalized ratio highlighting the degree of energy transfer efficiency within the integration window relative to the idealized capacitor release profile. Isolated 4 kJ pulses produced flat profiles, confirming an ignition threshold ≥ 6 kJ for crystalline lithologies, whereas the two-stage protocol mitigated this by pre-heating the NP fluid, achieving comparable damage to single 10 kJ shots at reduced total energy (10 kJ vs. 16 kJ). These results demonstrate NP-3PS’s capability to deliver targeted, high-impulse shockwaves for EGS fracture initiation, where minimizing energy loss in low-permeability rocks is critical for operational efficiency and economic viability.

5.4. Subsurface Fracture Characterization via Micro-CT

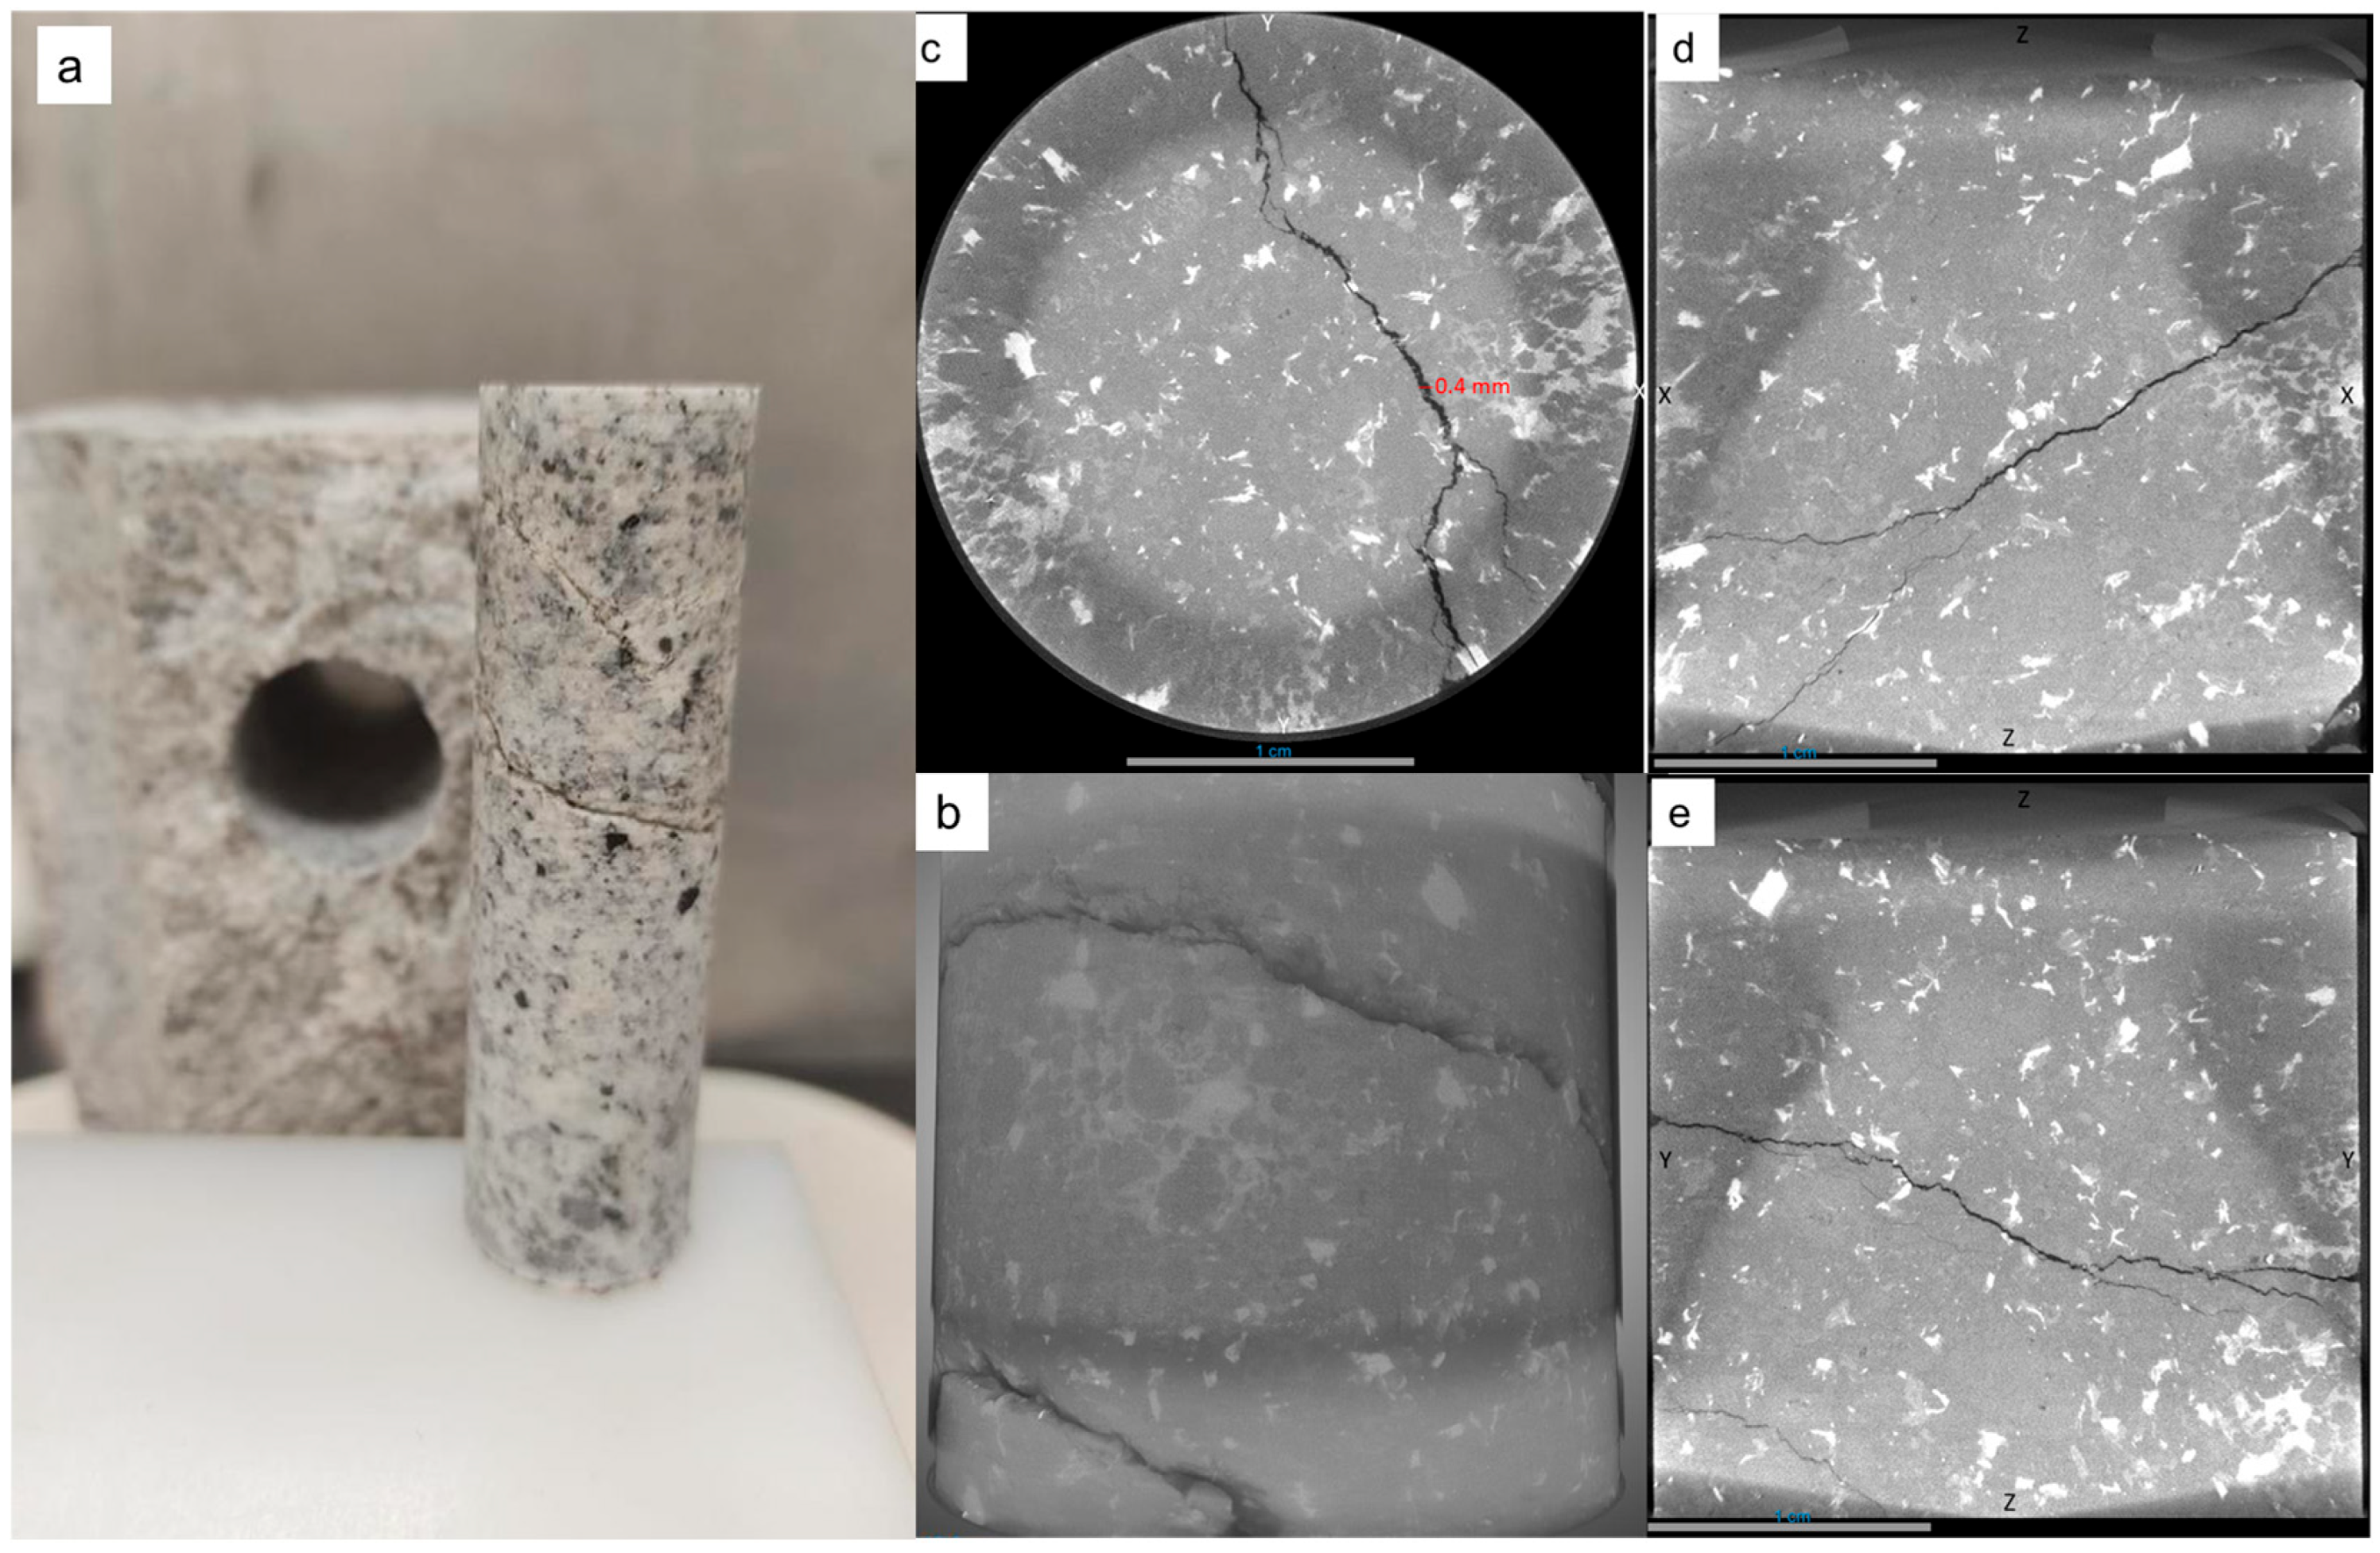
To quantify internal geometries beyond surface observations, a 1-inch diameter core plug was extracted horizontally from the 16 kJ-stimulated cube (Figure 24a) and subjected to micro-CT scanning at 13 μm voxel resolution (Figure 24b).
The 3D reconstruction delineated a dominant oblique fracture plane bisecting the core from borehole remnant to periphery, with a curved trajectory attributable to anisotropic shockwave refraction along mineral alignments (e.g., feldspar–plagioclase interfaces). Total fracture volume measured 0.6–0.9 cm3, comprising 3–4.5% of the ~20 cm3 core, with apertures averaging 100–300 μm and a connectivity index > 0.8 (per percolation theory), indicating hydraulically viable pathways for geothermal fluid circulation.
Orthogonal cross-sections (Figure 24c–e) elucidated propagation mechanics: the XY plane (Figure 24c) depicted radial divergence from the borehole with subtle bifurcations (aperture taper from 400 μm central to 100 μm peripheral), confirming epicentral tensile nucleation; the XZ plane (Figure 24d) illustrated diagonal traversal with uniform width (150–250 μm), evidencing sustained wave penetration; and the YZ plane (Figure 24c) exposed lateral anastomosing along grain boundaries, with 20–50 μm secondary offshoots from reflected stresses. These subsurface features, absent in pre-stimulation controls, highlight NP-3PS’s efficacy in generating deep, branching networks essential for EGS, where fracture tortuosity enhances contact area without excessive complexity that could impede flow.

5.5. Grain-Scale Microstructural Insights from Thin-Section Petrography

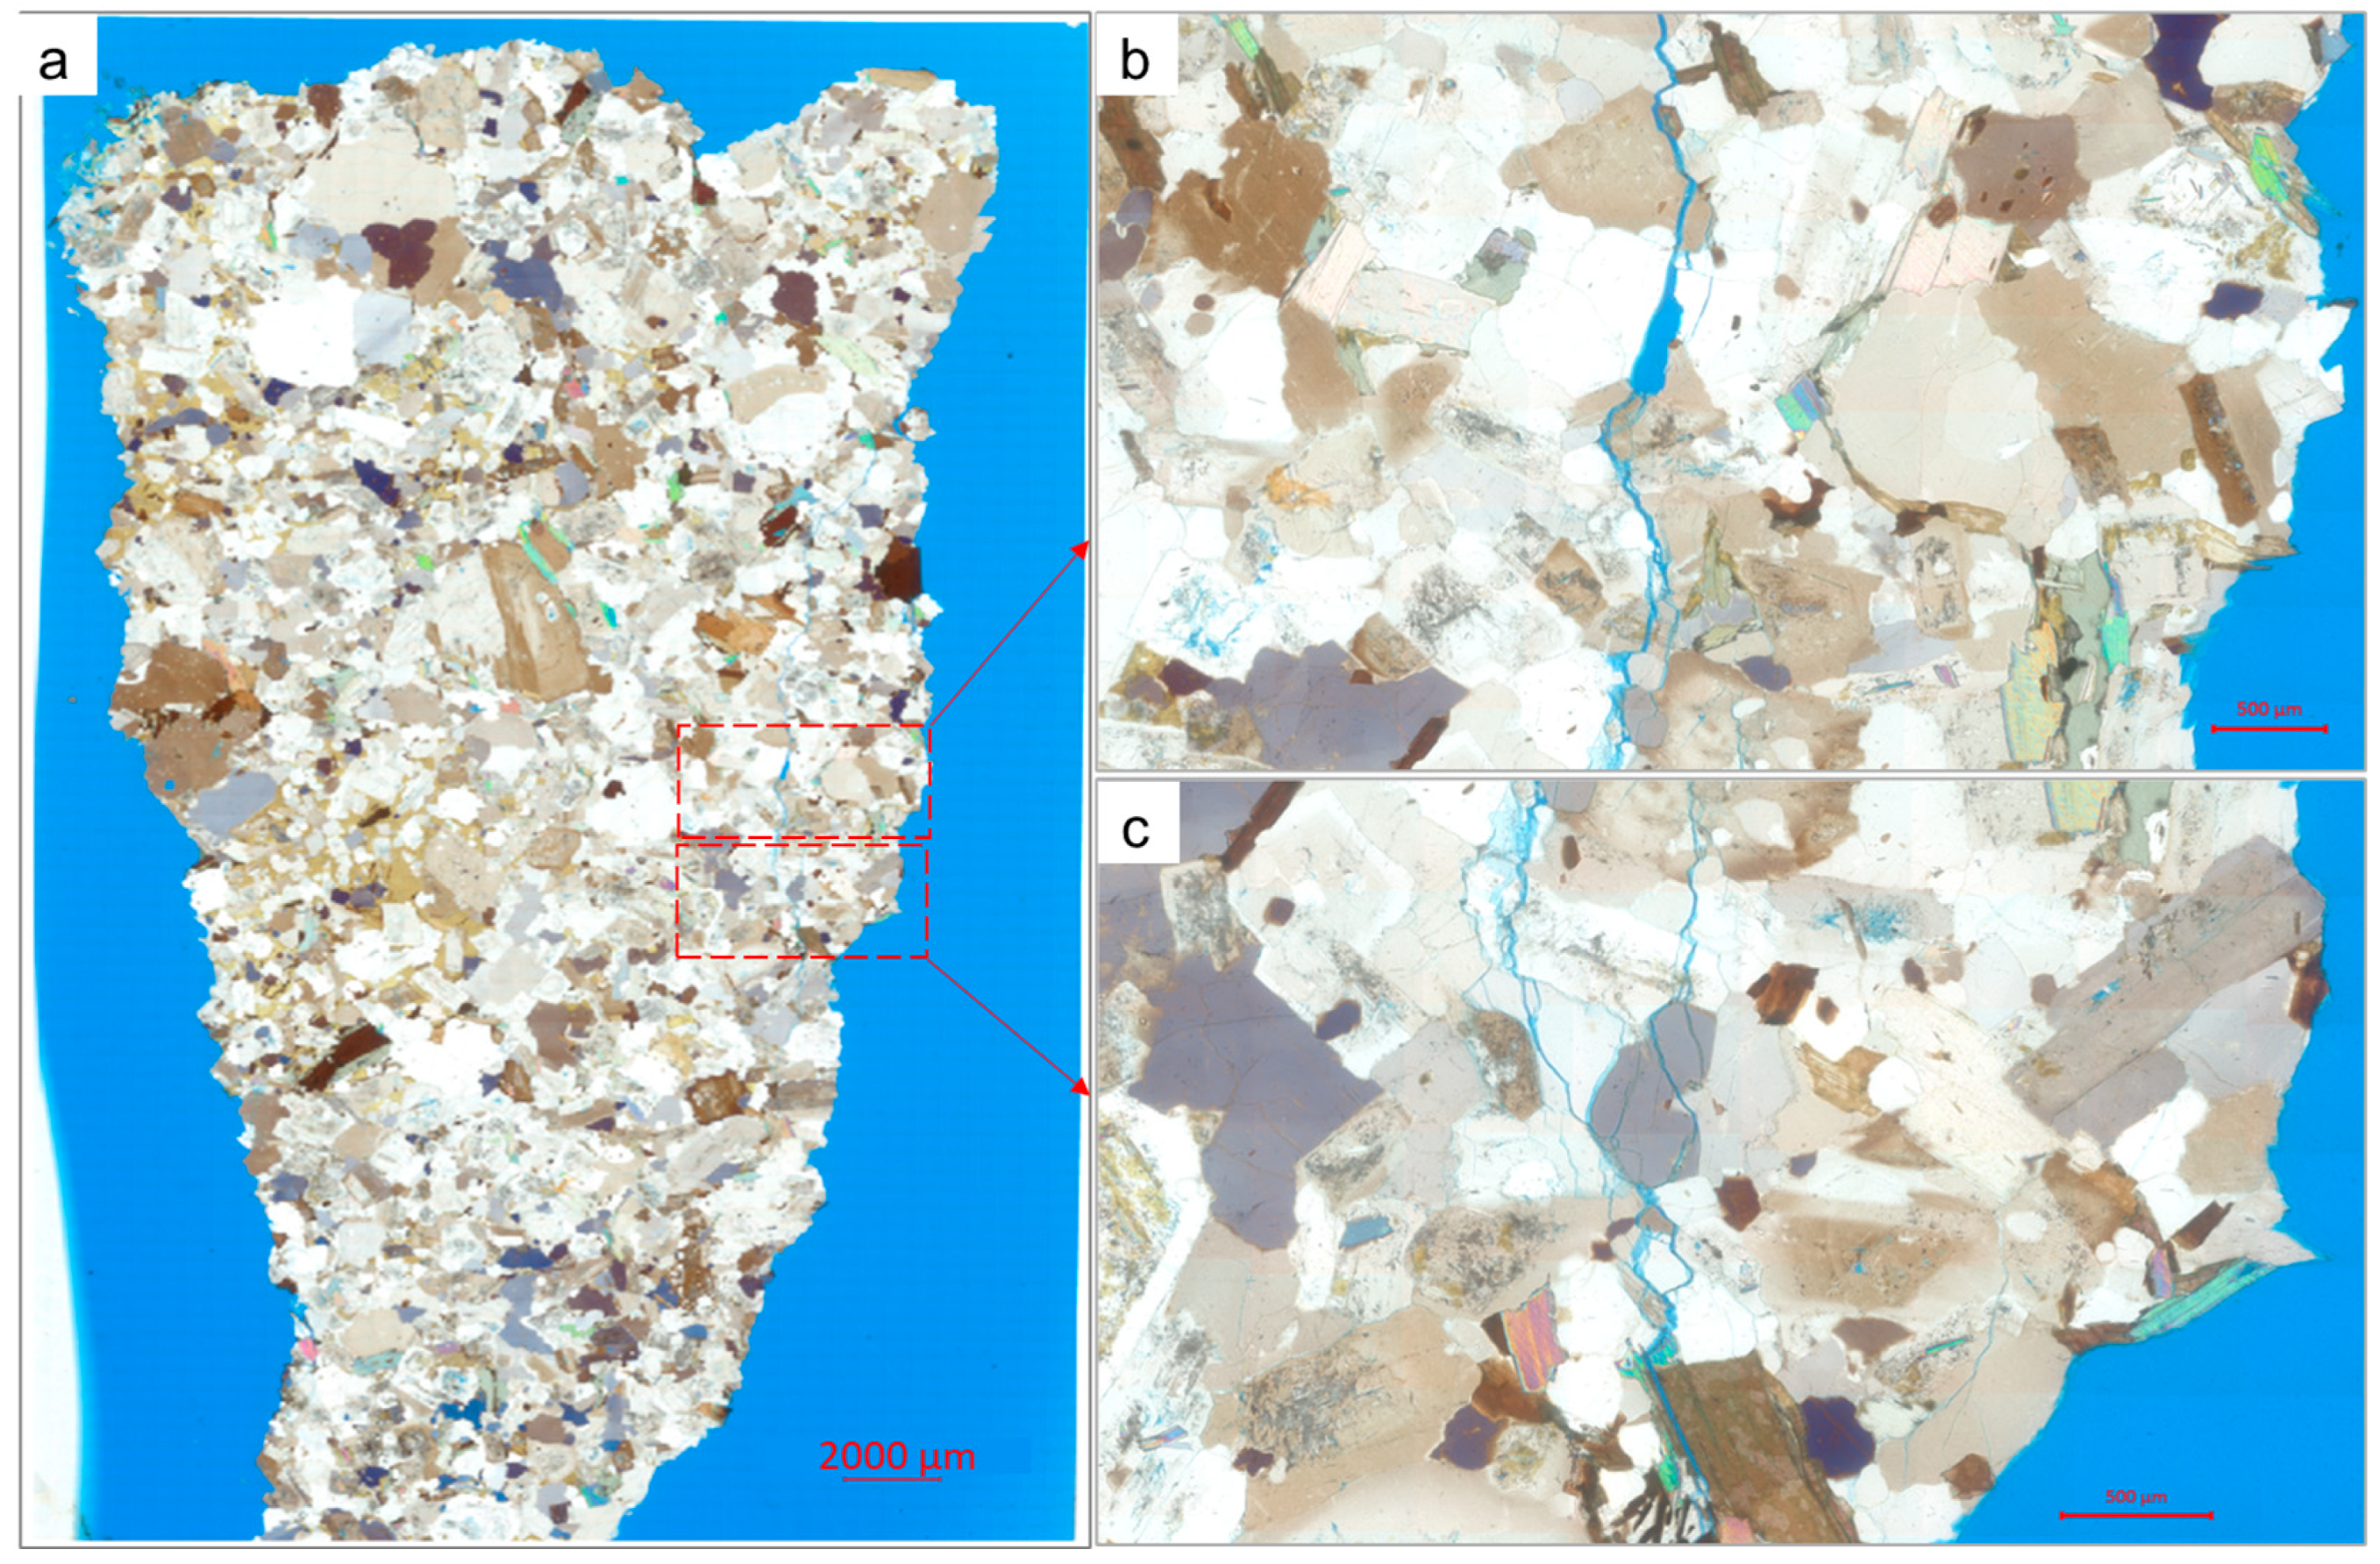
Thin-section analysis under polarized light at 0.2 μm effective resolution (Figure 25) provided atomistic-scale validation of shockwave-induced damage in the 16 kJ sample.
The full polished section (Figure 25a; 30 μm thick) exhibited a pervasive fracture mosaic traversing the polycrystalline matrix, with crack densities of 100–150 per mm2 in proximal areas of interest (Figure 25b,c), a 5–7-fold increase over baseline (<20/mm2). Dominant intergranular paths exploited weak quartz–feldspar and biotite interfaces, while transgranular extensions cleaved competent grains (>200 μm, Mohs hardness 6–7), reflecting localized tensile stresses exceeding 4520 psi (31.2 MPa). No evidence of thermal alteration (e.g., melting or recrystallization) was observed, preserving matrix integrity, but NP particulates (dark inclusions under crossed polars) lined ~30% of crack tips, suggesting enhanced conductivity for repeated stimulations. These observations affirm the ultrafast pulses’ role in nucleating microcracks that coalesce into macro-fractures, directly supporting EGS goals of permeability augmentation without chemical degradation.

5.6. Acoustic and Petrophysical Property Degradation

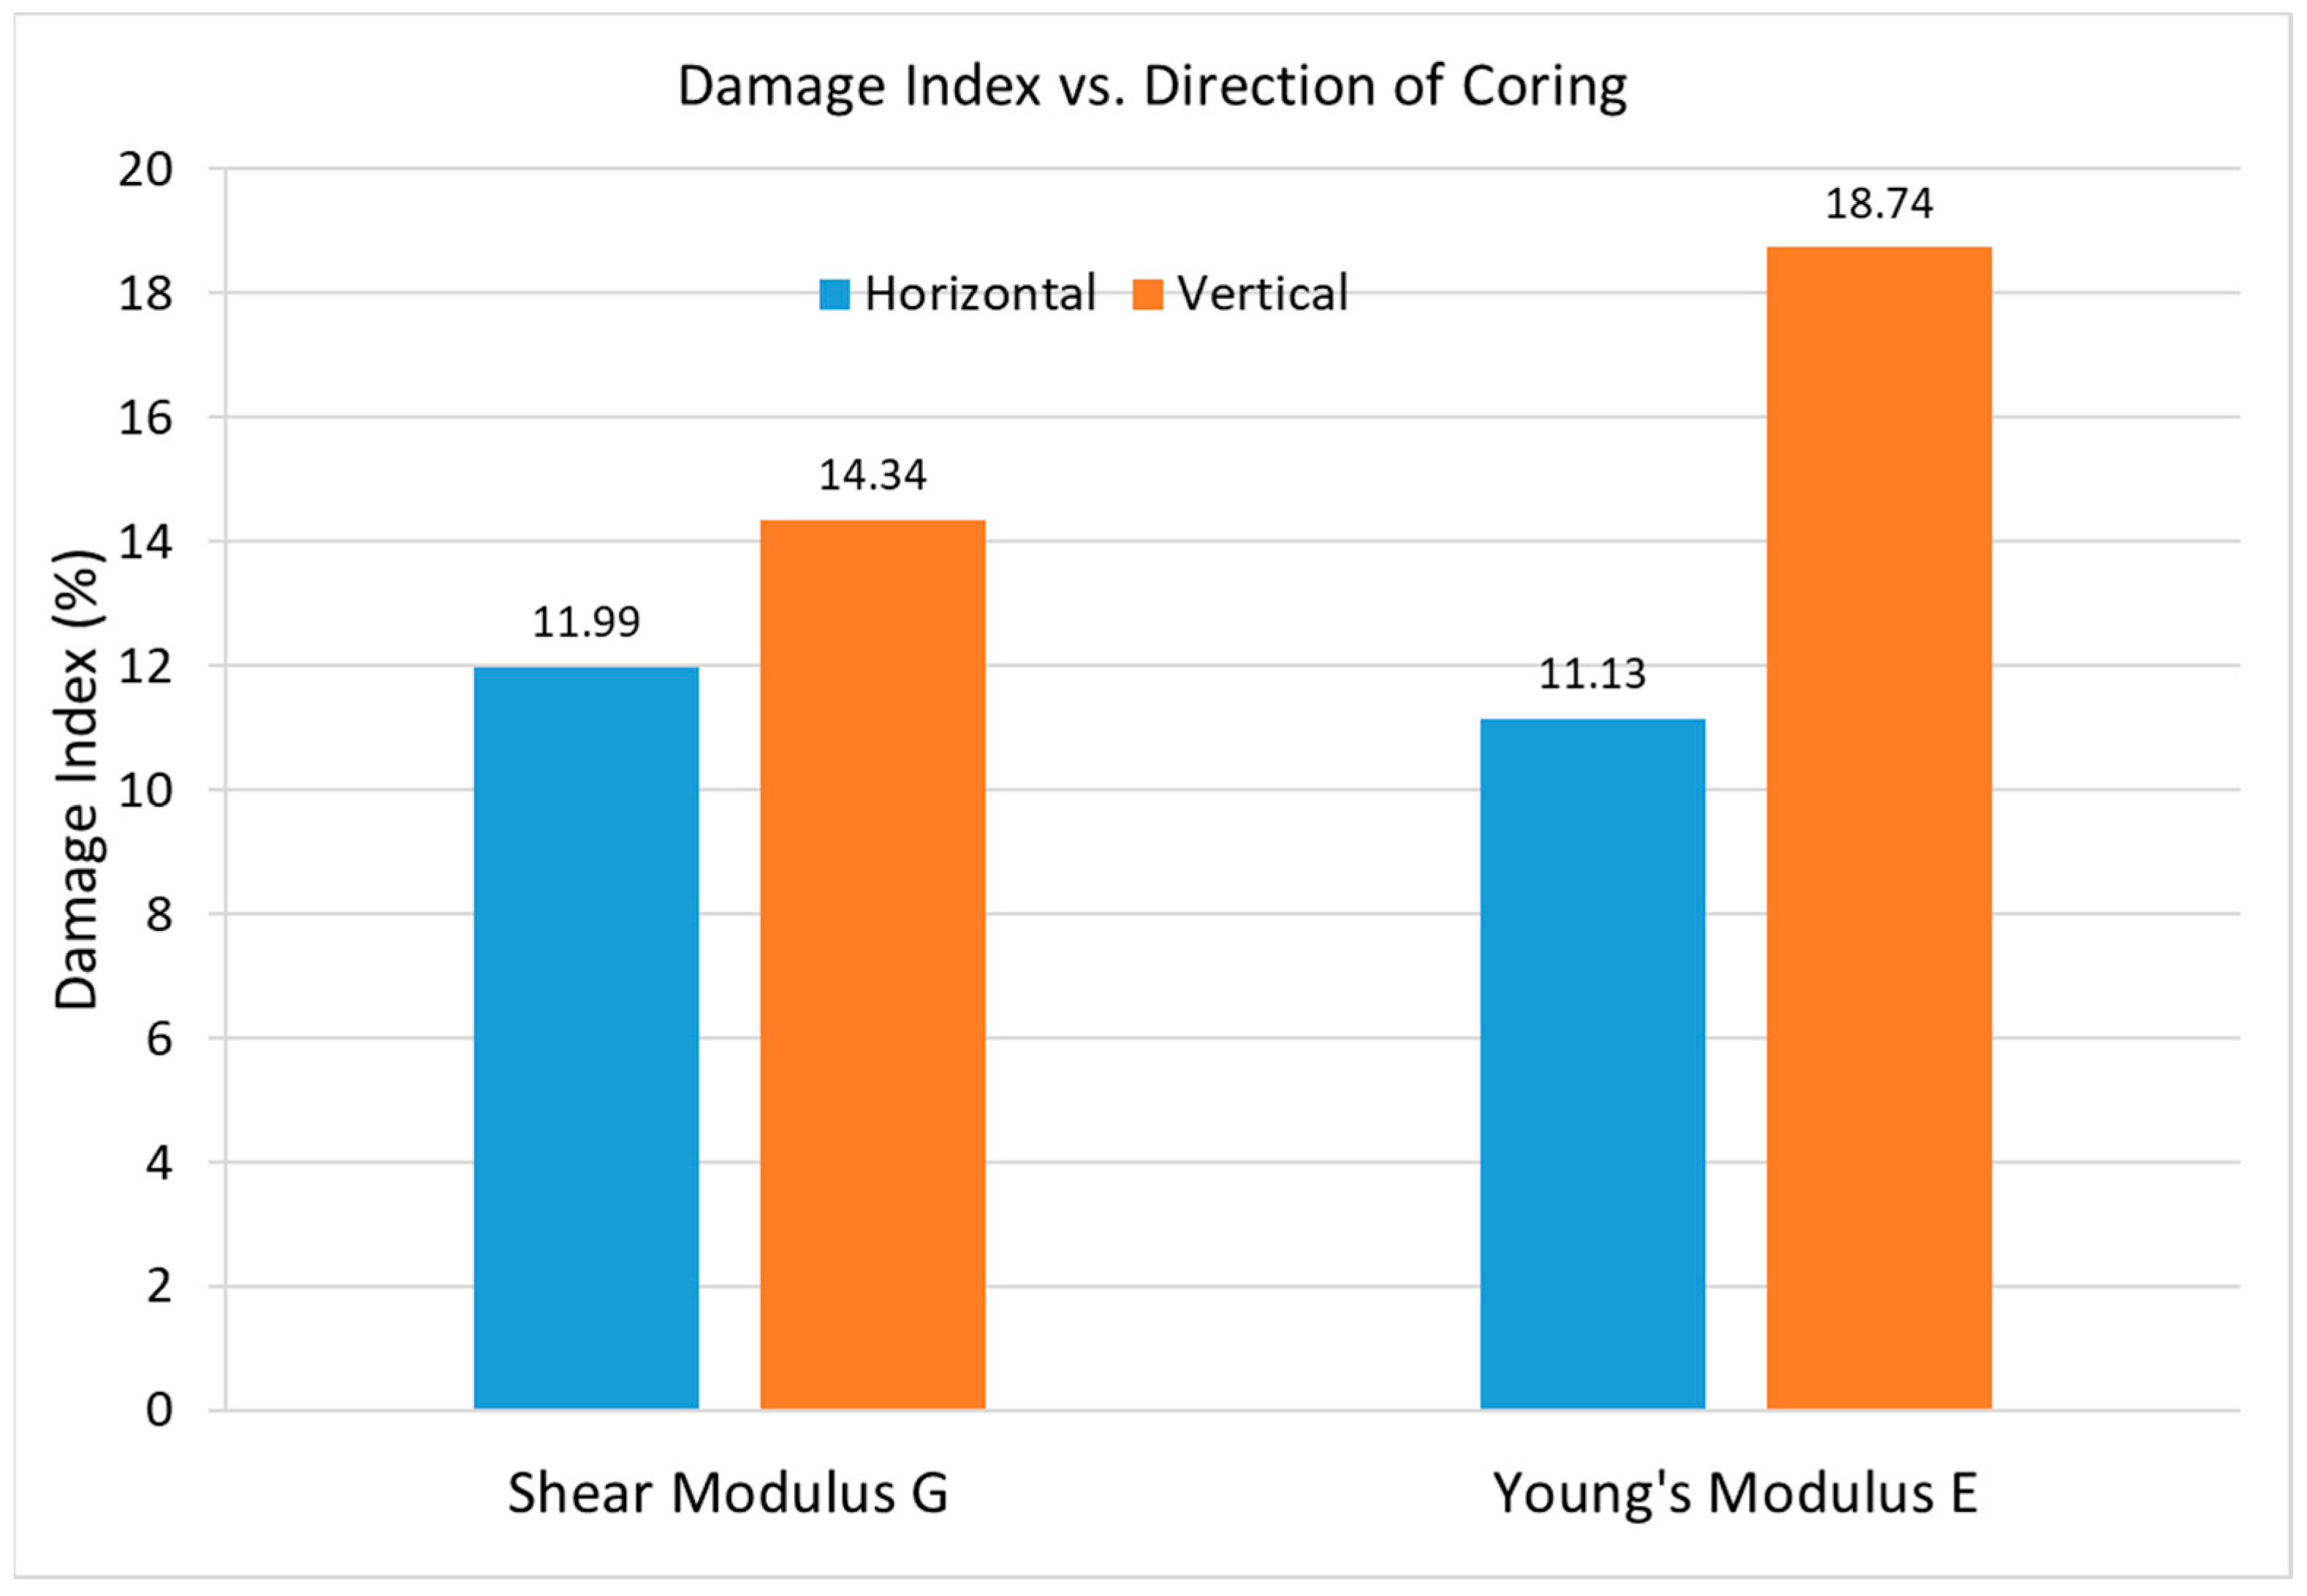
Dynamic elastic wave testing on pre- and post-NP-3PS core plugs (Table 1) quantified structural weakening, with P-wave transit times increasing from 11.6 μs to 12.4 μs (horizontal) and 15.3 μs (vertical), yielding velocity reductions from 4.39 km/s to 4.28 km/s and 3.86 km/s, respectively. S-wave times rose from 19.2 μs to 21.0 μs and 23.8 μs, decreasing velocities from 2.67 km/s to 2.52 km/s and 2.49 km/s. Derived elastic parameters reflected significant degradation: bulk modulus (K) declined by 5% (horizontal) to 33% (vertical), shear modulus (G) decreased by 12–14%, and Young’s modulus (E) dropped by 11–19%, indicating increased ductility and fracture-related softening and serving as robust proxies for fracture density and aligning closely with CT-derived fracture volumes. The pronounced vertical damage indices underscore the alignment of fractures with the stimulation direction, enhancing the technique’s relevance for EGS reservoir development. Damage indices (DI), calculated as the percentage reduction in elastic moduli relative to pre-stimulation values (Equation (2)), are quantified and presented in Figure 26.
D I = M p r e M p o s t M p o s t × 100
where M represents K, G, or E.
Porosity, measured via helium porosimetry, surged from 1.3% pre-NP-3PS to 3.2% (horizontal drilled core)–4.6% (vertical drilled core) post-NP-3PS, an 150 to 250% relative increase, predominantly in the stimulated zone, signifying enhanced matrix connectivity and potential permeability uplift (estimated 3–5× via Kozeny–Carman modeling). Density decreased marginally from 2625 kg/m3 to 2592–2590 kg/m3, consistent with void expansion. These petrophysical shifts validate NP-3PS’s capacity to transform impermeable granite into viable EGS reservoirs, where such gains could double heat recovery rates.

5.7. Thermal Conductivity Modifications

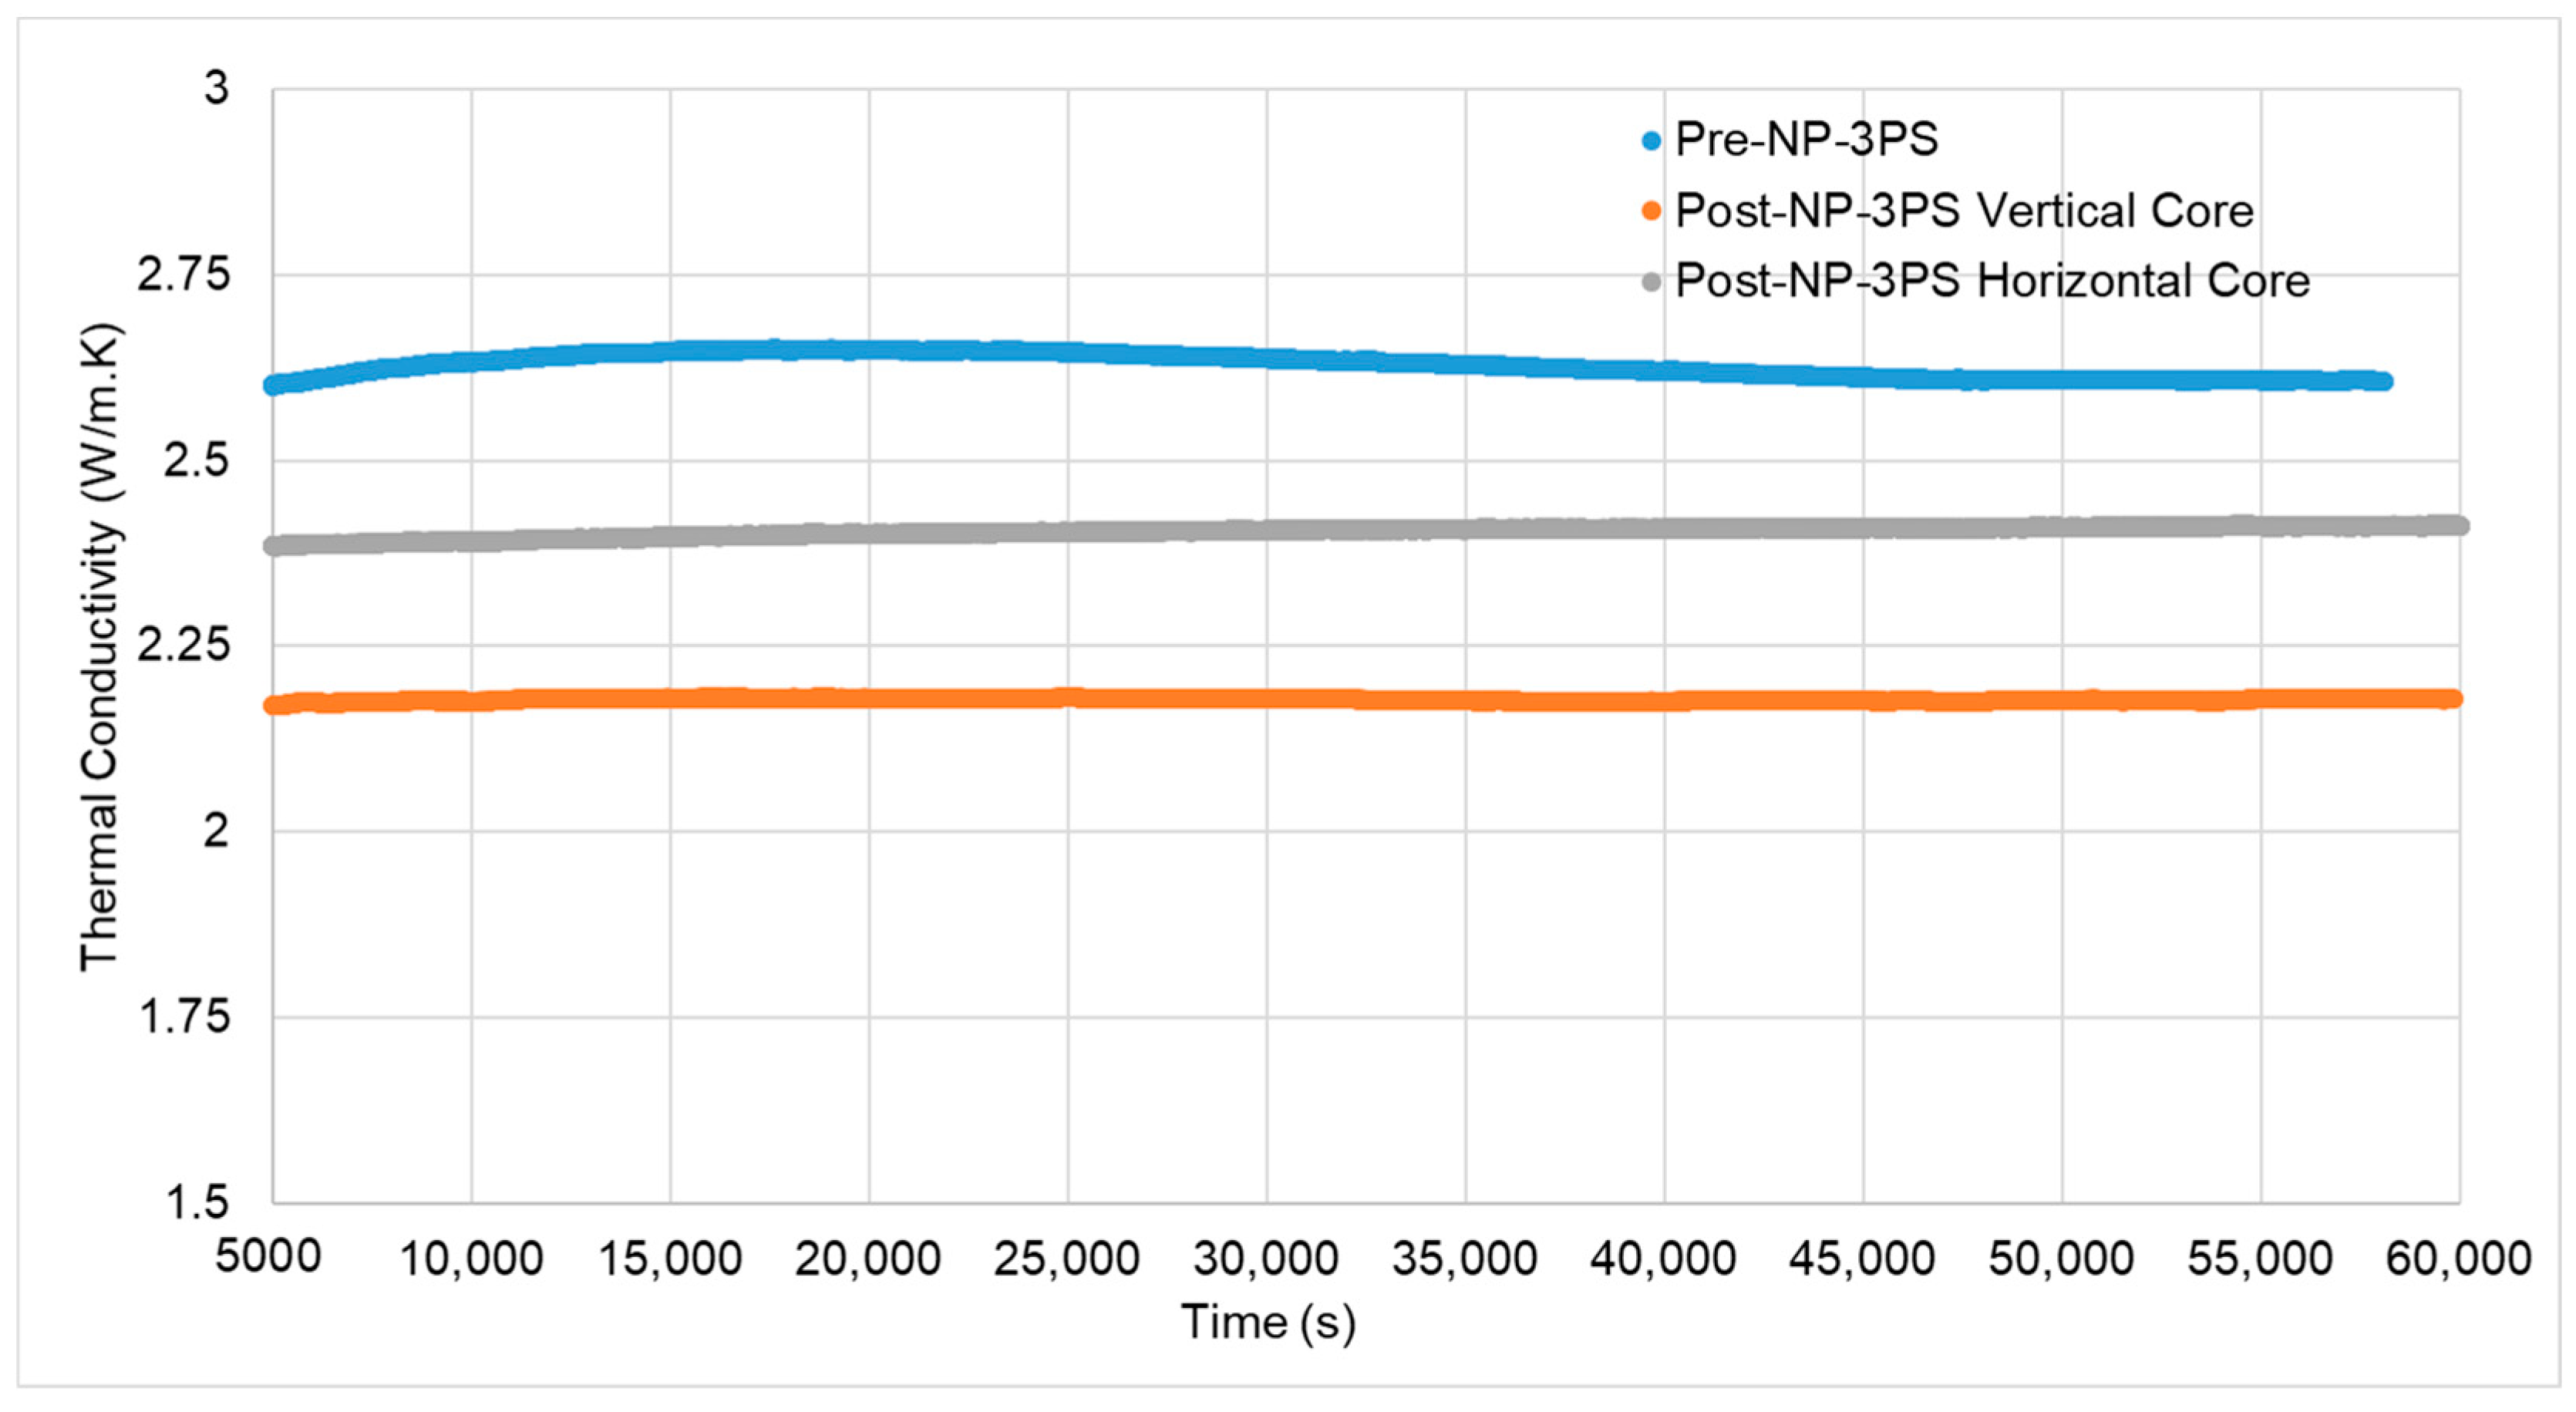
Steady-state thermal conductivity measurements, conducted using the divided-bar apparatus on core plugs extracted from both horizontal and vertical orientations relative to the stimulated granite cube (Figure 27), revealed orientation-dependent reductions post-NP-3PS, providing direct insights into the impact of fracture geometry on heat transfer dynamics in EGS.
The baseline thermal conductivity of intact granite was measured at 2.61 W/m·K, reflecting the dense, low-porosity crystalline matrix typical of hot dry rock reservoirs. Following 16 kJ stimulation, the horizontal core plug—drilled perpendicular to the dominant fracture plane—exhibited a modest 9% decrease to 2.38 W/m·K, attributable to limited radial microcracking that introduced minor convective pathways without substantially disrupting axial conduction. In contrast, the vertical core, aligned parallel to the primary oblique fracture network, displayed a more pronounced 16% reduction to 2.18 W/m·K, consistent with enhanced void connectivity and increased tortuosity along the propagation direction, as corroborated by CT-derived fracture volumes (0.6–0.9 cm3) and apertures (100–300 μm).
These differential responses highlight the anisotropic nature of NP-3PS-induced damage: horizontal sampling captured transverse effects dominated by intergranular separations, yielding subtler thermal perturbations, whereas vertical sampling emphasized longitudinal fracture dominance, amplifying heat dissipation through sustained convective loops within the network. The observed decrease, is emblematic of fractured media behavior where introduced apertures reduce effective matrix contact and promote fluid-mediated transfer—critical for EGS injector-producer pairs, where such modifications could elevate heat extraction rates by 20–30% over unstimulated baselines. Porosity augmentation (from 1.3% to 4.6%) further synergizes with these changes, suggesting a coupled enhancement in thermal diffusivity that aligns with the study’s objective of optimizing stimulation for geothermal viability. Future analyses incorporating transient methods could refine these estimates under dynamic flow conditions, but the current data affirm NP-3PS’s role in tailoring thermal performance to reservoir-specific fracture alignments.

5.8. Quantitative Energy Efficiency Comparison with Field-Scale EGS and Potential Scalibility

To quantitatively benchmark NP-3PS against field-scale enhanced geothermal systems (EGS), energy efficiency is evaluated in kWh per cubic meter of rock stimulated (kWh/m3). In laboratory tests, a single 16 kJ NP-3PS pulse (0.0044 kWh) induced interconnected fractures in an 8” (20.32 cm) granite cube (0.00084 m3), yielding an energy intensity of ~5.24 kWh/m3. Accounting for multi-pulse staging (3–5 pulses per zone) and system losses (~30%), the effective lab-scale efficiency is estimated at 15–20 kWh/m3 for achieving >200% porosity increase and 3–5× permeability uplift.
In contrast, field EGS projects report significantly higher energy demands. The Utah FORGE EGS pilot (2023–2025) used hydraulic stimulation with pump power exceeding 3000 hp (2237 kW) over 10+ hours to treat ~500 m3, consuming ~45,000 kWh/m3 when normalized to stimulated rock volume [47,48]. Earlier Fenton Hill experiments (1970s–1980s) required 30,000–60,000 kWh/m3 due to high friction losses and water circulation [49,50]. Even modern binary-cycle EGS designs with optimized injection report 10,000–25,000 kWh/m3 when including pumping, proppant transport, and fluid heating [51,52].
Thus, NP-3PS offers a potential at least 500-fold reduction in energy intensity compared to hydraulic EGS methods, driven by direct electromechanical energy transfer, elimination of water circulation, and NP-enabled multi-cycle plasma efficiency. While lab-to-field scaling introduces transmission and tooling losses, even a conservative 50–100 kWh/m3 in downhole deployment would represent a transformative leap in sustainable geothermal stimulation. However, stability and conductivity of the Al NP + KCl + guar gum suspension were only confirmed at ambient conditions. Geothermal temperatures may induce NP agglomeration, guar degradation, or salt precipitation, potentially reducing plasma initiation efficiency. Future work will include autoclave aging, in situ conductivity probes, and high-temperature rheology to ensure downhole performance.
From a field application perspective, this capability transforms NP-3PS into a customizable stimulation tool, enabling operators to minimize unintended fracture growth into non-productive or sensitive zones, enhance fracture connectivity within desired reservoir compartments, and promote directional permeability enhancement in anisotropic or layered formations. For instance, in deviated or horizontal wells, electrodes could be oriented to align fractures with the maximum horizontal stress, maximizing reservoir contact while reducing breakthrough risks in adjacent aquifers. Furthermore, the NP fluid’s penetration along fractures introduces a self-propping effect, where residual conductive particles sustain pathways for repeated pulses, facilitating staged treatments without rig interventions. This directional control, combined with low energy thresholds (e.g., 6 kJ post-priming in granite), positions NP-3PS as a versatile alternative for precision stimulation in complex reservoirs. However, the potential of high pore pressures and stresses in geothermal reservoirs could not be addressed in this study due to true triaxial stresses up to 3000 psi (26.7 MPa) in the experiments.
Scalability from bench to field remains a critical next step. Current 8”–14” (20.32–35.56 cm) cube experiments demonstrate proof-of-concept under controlled triaxial stresses, but transitioning to pilot-scale testing will require (1) upscaling capacitor banks to 100–200 kJ with modular electrode arrays, (2) robust downhole tooling (e.g., insulated coil tubing or wireline-deployed plasma guns), and (3) real-time pressure and temperature monitoring validated against numerical models. Initial field trials in low-risk geothermal or depleted wells, leveraging existing infrastructure, will confirm multi-stage stimulation efficacy, fluid containment, and long-term fracture conductivity, paving the way for full-field deployment.

6. Conclusions

This study successfully introduced and validated NP-3PS as an innovative waterless technique for inducing interconnected fracture networks in granite, a representative hard crystalline formation for EGS. By leveraging an optimized fluid formulation of 0.3 wt% NP (60–80 nm) in 7 wt% KCl brine stabilized with 0.18 wt% guar gum, NP-3PS enabled multi-cycle thermite reactions and shockwave generation, achieving peak pressures up to 100,000 psi (690 MPa) within microseconds across discharge energies of 6–16 kJ. The experimental results demonstrated significant enhancements in fracture complexity, porosity (from 1.3% to 4.6%, a ~250% increase), acoustic velocities (12–19% reductions in elastic moduli), and thermal conductivity (9% decrease in horizontal cores and 16% in vertical cores), directly fulfilling the objective of evaluating ultrafast pulse impacts on propagation, geometry, and property alterations under controlled laboratory conditions.
Compared to conventional fusible-wire methods, NP-3PS offers superior operational flexibility by eliminating the need for tool retrieval and wire replacement after each cycle. Instead, the NP fluid can be circulated to sustain multi-pulse stimulations as desired, substantially reducing downtime and operational costs in field deployments. These advantages, combined with the waterless nature of the process, address key limitations of traditional HF and acid stimulation, such as high-water consumption, environmental risks, and lithological constraints, while providing directional fracture control aligned with electrode orientation for targeted reservoir enhancement.
The observed outcomes with dense, branching fractures with high connectivity indices and improved heat transfer potential underscore NP-3PS’s promise for EGS applications, where permeability augmentation and thermal efficiency are critical for viable heat extraction in low-porosity granitic reservoirs. Nonetheless, challenges such as fluid-NP interactions, scale-up of downhole energy delivery, and long-term fracture stability warrant further investigation through larger-scale pilots and coupled hydro-thermo-mechanical modeling.
NP-3PS represents a transformative, sustainable stimulation paradigm capable of delivering complex fracture networks and operational efficiencies across geothermal lithologies. With continued engineering refinement, it holds substantial potential to accelerate the commercialization of EGS, contributing to global renewable energy goals by enabling access to vast, untapped deep-heat resources.

Author Contributions

Conceptualization, S.T.N., M.Y.S., M.E.-S.E.-T. and M.A.G.; methodology, S.T.N., M.Y.S., M.E.-S.E.-T., M.A.G., M.M., Y.C., G.U. and L.H.; software, S.T.N.; validation, S.T.N., M.Y.S., M.E.-S.E.-T., M.A.G., M.M., Y.C., G.U. and L.H.; formal analysis, S.T.N. and M.A.G.; investigation, S.T.N., M.Y.S., M.E.-S.E.-T. and M.A.G.; resources, S.T.N., M.Y.S., M.E.-S.E.-T., M.A.G., M.M., Y.C., G.U. and L.H., and M.Y.S.; data curation, S.T.N., M.Y.S., M.E.-S.E.-T., M.A.G., M.M., Y.C., G.U. and L.H.; writing—original draft preparation S.T.N., M.Y.S., M.E.-S.E.-T., M.A.G., M.M., Y.C., G.U. and L.H.; writing—review and editing, S.T.N., M.Y.S., M.E.-S.E.-T., M.A.G., M.M., Y.C., G.U. and L.H.; visualization, S.T.N.; supervision, M.Y.S. and M.M.; project administration, M.Y.S.; funding acquisition, M.Y.S. All authors have read and agreed to the published version of the manuscript.

Funding

This research received no external funding.

Data Availability Statement

The original contributions presented in the study are included in the article, further inquiries can be directed to the corresponding authors.

Conflicts of Interest

The authors declare no conflicts of interest.

Abbreviations

The following abbreviations are used in this manuscript:
3PSPulsed Power Plasma Stimulation
AlAluminum
CTComputed Tomography
EYoung’s Modulus
EGSEnhanced Geothermal System
EHFElectrohydraulic Fracturing
EMElectromagnetic
EUREstimated Ultimate Recovery
GShear Modulus
HFHydraulic Fracturing
hpHorse Power
KBulk Modulus
KClPotassium Chloride
NPNanoparticles or Nanoparticle
NP-3PSNanoparticle-enhanced pulsed power plasma stimulation
PAEDPulsed Arc Electrohydraulic Discharge
PCEDPulsed Corona Electrohydraulic Discharge
RFReference
VpCompressional Wave Velocity
VsShear Wave Velocity
νPoisson’s Ratio
wt%Weight Percent

References

  1. Maugeri, L. Squeezing more oil from the ground. Sci. Am. 2009, 301, 56–63. Available online: https://www.jstor.org/stable/26001556 (accessed on 13 September 2025). [CrossRef] [PubMed]
  2. Boak, J.; Kleinberg, R. Shale Gas, Tight Oil, Shale Oil and Hydraulic Fracturing. In Future Energy: Improved, Sustainable and Clean Options for Our Planet, 3rd ed.; Letcher, T.M., Ed.; Elsevier: Amsterdam, The Netherlands, 2020; pp. 67–95. [Google Scholar] [CrossRef]
  3. Moska, R.; Labus, K.; Kasza, P. Hydraulic fracturing in enhanced geothermal systems—Field, tectonic and rock mechanics conditions—A review. Energies 2021, 14, 5725. [Google Scholar] [CrossRef]
  4. Xie, Z.; Han, D.; Li, J.; Li, K. A State-of-the-Art Review of Hydraulic Fracturing in Geothermal Systems. Sustainability 2024, 16, 11087. [Google Scholar] [CrossRef]
  5. England, K.; Li, P.; Xing, P.; Moore, J.; McLennan, J. 2024 Enhanced Geothermal System Hydraulic Fracturing Campaign at Utah FORGE. In Proceedings of the SPE Hydraulic Fracturing Technology Conference and Exhibition, The Woodlands, TX, USA, 4–6 February 2025. [Google Scholar] [CrossRef]
  6. Li, H.; Liu, B.; He, Q.; Gao, Y.; Ma, D.; Yang, H.; Cheng, J.; Ye, J.; Liu, G. Improving Hard Rock Materials Cuttability by Hydraulic Fracturing at Mining Working Face. Appl. Sci. 2024, 14, 11908. [Google Scholar] [CrossRef]
  7. USGS. Water Use in Hydraulic Fracturing. 2023. Available online: https://www.usgs.gov/ (accessed on 13 September 2025).
  8. Ellsworth, W.L. Injection-induced earthquakes. Science 2013, 341, 1225942. [Google Scholar] [CrossRef] [PubMed]
  9. National Research Council. Induced Seismicity Potential in Energy Technologies; National Academies Press: Washington, DC, USA, 2013; Available online: https://nap.nationalacademies.org/catalog/13355/induced-seismicity-potential-in-energy-technologies (accessed on 13 September 2025).
  10. Verdon, J.P.; Kettlety, T.; Kendall, J.M. Geomechanical Interpretation of Induced Seismicity at the Preston New Road PNR-2 Well, Lancashire, England; Oil and Gas Authority: London, UK, 2020; Available online: https://www.nstauthority.co.uk/media/6967/olgoga-pnr-2final.pdf (accessed on 13 September 2025).
  11. Baptie, B.; Reay, D. Potential Risks of Induced Seismicity from High Volume Hydraulic Fracturing of Shales in Northern Ireland. 2021. Available online: https://nora.nerc.ac.uk/id/eprint/531954/1/OR21003.pdf (accessed on 13 September 2025).
  12. Hui, G.; Chen, Z.; Wang, P.; Gu, F.; Kong, X.; Zhang, W. Mitigating risks from hydraulic fracturing-induced seismicity in unconventional reservoirs: Case study. Sci. Rep. 2022, 12, 12537. [Google Scholar] [CrossRef]
  13. Burnham, A.; Han, J.; Clark, C.E.; Wang, M.; Dunn, J.B.; Palou-Rivera, I. Life-cycle greenhouse gas emissions of shale gas, natural gas, coal, and petroleum. Environ. Sci. Technol. 2012, 46, 619–627. [Google Scholar] [CrossRef]
  14. Wells, N.J. Analysis of Emissions Profiles of Hydraulic Fracturing Engine Technologies. Master’s Thesis, West Virginia University, Morgantown, WV, USA, 2022. Available online: https://researchrepository.wvu.edu/cgi/viewcontent.cgi?article=12355&context=etd (accessed on 13 September 2025).
  15. La Borderie, C.; Reess, T.; Chen, W.; Maurel, O.; Rey-Berbeder, F.; De Ferron, A. Electrohydraulic Fracturing of Rocks; John Wiley & Sons: Hoboken, NJ, USA, 2016. [Google Scholar] [CrossRef]
  16. Melton, N.M.; Cross, T.S. Fracturing oil shale with electricity. J. Pet. Technol. 1968, 20, 37–41. [Google Scholar] [CrossRef]
  17. Touya, G.; Reess, T.; Pecastaing, L.; Gibert, A.; Domens, P. Development of subsonic electrical discharges in water and measurements of the associated pressure waves. J. Phys. D Appl. Phys. 2006, 39, 5236. [Google Scholar] [CrossRef]
  18. Soliman, M.Y.; Rezaei, A.; Khalaf, M.; Gordon, P.; Cipolla, C. Pulse power plasma stimulation: A technique for waterless fracturing, enhancing the near wellbore permeability, and increasing the EUR of unconventional reservoirs. Gas Sci. Eng. 2024, 122, 205201. [Google Scholar] [CrossRef]
  19. Maddirala, R.; Shukla, R.; Pramanik, R.; Mishra, D.A.; Sharma, A.; Jain, R.; Kakati, H. Impact of Pulse Plasma-Based Shockwave Technology on Sandstone Porosity and Pore Connectivity Using Ultrasonic Compressional Wave Velocity and Microtomography. Energy Fuels 2024, 38, 20433–20448. [Google Scholar] [CrossRef]
  20. Xiao, Y.; House, W.; Unal, E.; Soliman, M.Y. Pulsed Power Plasma Stimulation Technique-Experimental Study on Single Pulse Test for Fractures Initiation. In Proceedings of the SPE/AAPG/SEG Unconventional Resources Technology Conference, Houston, TX, USA, 23–25 July 2018. [Google Scholar] [CrossRef]
  21. Chen, W.; Maurel, O.; Reess, T.; De Ferron, A.S.; La Borderie, C.; Pijaudier-Cabot, G.; Rey-Bethbeder, F.; Jacques, A. Experimental study on an alternative oil stimulation technique for tight gas reservoirs based on dynamic shock waves generated by pulsed arc electrohydraulic discharges. J. Pet. Sci. Eng. 2012, 88, 67–74. [Google Scholar] [CrossRef]
  22. Chen, W.; Maurel, O.; La Borderie, C.; Reess, T.; De Ferron, A.; Matallah, M.; Pijaudier-Cabot, G.; Jacques, A.; Rey-Bethbeder, F. Experimental and numerical study of shock wave propagation in water generated by pulsed arc electrohydraulic discharges. Heat Mass Transf. 2014, 50, 673–684. [Google Scholar] [CrossRef]
  23. He, J.; Zhang, R.; Zhang, J.; Liu, M.; Izuchukwu, O.N. Experimental evaluation of near wellbore stimulation–using electrical explosion shockwave on tight sand reservoir. Oil Gas Sci. Technol. Rev. d’IFP Energ. Nouv. 2018, 73, 60. [Google Scholar] [CrossRef]
  24. Han, R.; Zhou, H.; Liu, Q.; Wu, J.; Jing, Y.; Chao, Y.; Zhang, Y.; Qiu, A. Generation of electrohydraulic shock waves by plasma-ignited energetic materials: I. Fundamental mechanisms and processes. IEEE Trans. Plasma Sci. 2015, 43, 3999–4008. [Google Scholar] [CrossRef]
  25. Xiao, Y. Pulsed Power Plasma Stimulation-Experimental and Numerical Study on Single-Pulse Test. Ph.D. Thesis, Texas Tech University, Lubbock, TX, USA, May 2017. Available online: https://hdl.handle.net/2346/82042 (accessed on 13 September 2025).
  26. Nguyen, S.T.; El-Tayeb, M.E.-S.; Adel Gabry, M.; Soliman, M.Y. Pulsed Power Plasma Stimulation: A Comprehensive Review and Field Insights. Energies 2025, 18, 3334. [Google Scholar] [CrossRef]
  27. Campin, D. An Assessment of the Application of Propellant Enhancement to Conventional Wells. In Proceedings of the SPE Asia Pacific Oil and Gas Conference and Exhibition, Virtual, 17–19 November 2020. [Google Scholar] [CrossRef]
  28. Tester, J.; Anderson, B. Impact of Enhanced Geothermal Systems (EGS) on the United States in the 21st Century. In The Future of Geothermal Energy, Massachusetts Institute of Technology; Idaho National Laboratory: Idaho Falls, ID, USA, 2006; Available online: https://energy.mit.edu/wp-content/uploads/2006/11/MITEI-The-Future-of-Geothermal-Energy.pdf (accessed on 13 September 2025).
  29. Lei, Z.; Zhang, Y.; Cui, Q.; Shi, Y. The injection-production performance of an enhanced geothermal system considering fracture network complexity and thermo-hydro-mechanical coupling in numerical simulations. Sci. Rep. 2023, 13, 14558. [Google Scholar] [CrossRef] [PubMed]
  30. Zhang, K.; Liu, X.F.; Wang, D.B.; Zheng, B.; Chen, T.H.; Wang, Q.; Bai, H.; Yao, E.D.; Zhou, F.J. A review of reservoir damage during hydraulic fracturing of deep and ultra-deep reservoirs. Pet. Sci. 2024, 21, 384–409. [Google Scholar] [CrossRef]
  31. Li, Z.; Zhi, X.; Wu, Z.; Qian, G.; Jiang, R.; Wang, B.; Huang, R.; Yu, X. Role of different energy storage methods in decarbonizing urban distributed energy systems: A case study of thermal and electricity storage. J. Energy Storage 2023, 73, 108931. [Google Scholar] [CrossRef]
  32. Shao, L.; Zhang, J.; Chen, X.; Xu, D.; Gu, H.; Mu, Q.; Yu, F.; Liu, S.; Shi, X.; Sun, J.; et al. Artificial intelligence-driven distributed acoustic sensing technology and engineering application. PhotoniX 2025, 6, 4. [Google Scholar] [CrossRef]
  33. Friedlingstein, P.; O’Sullivan, M.; Jones, M.W.; Andrew, R.M.; Hauck, J.; Landschützer, P.; Le Quéré, C.; Li, H.; Luijkx, I.T.; Olsen, A.; et al. Global carbon budget 2024. Earth Syst. Sci. Data 2025, 17, 965–1039. [Google Scholar] [CrossRef]
  34. Jia, Y.; Tsang, C.F.; Hammar, A.; Niemi, A. Hydraulic stimulation strategies in enhanced geothermal systems (EGS): A review. Geomech. Geophys. Geo-Energy Geo-Resour. 2022, 8, 211. [Google Scholar] [CrossRef]
  35. Zhou, W.; Lanza, F.; Grigoratos, I.; Schultz, R.; Cousse, J.; Trutnevyte, E.; Muntendam-Bos, A.; Wiemer, S. Managing induced seismicity risks from enhanced geothermal systems: A good practice guideline. Rev. Geophys. 2024, 62, e2024RG000849. [Google Scholar] [CrossRef]
  36. Bazargan, M.; Soliman, M.Y.; Habibpour, M.; Rezaei, A. Plasma Torch Perforation to Route Hydraulic Fracturing Operation in Unconventional Reservoirs. In Proceedings of the 48th US Rock Mechanics/Geomechanics Symposium, Minneapolis, MN, USA, 1–4 June 2014; Available online: https://onepetro.org/ARMAUSRMS/proceedings/ARMA14/ARMA14/ARMA-2014-6991/122411 (accessed on 13 September 2025).
  37. Soliman, M.Y. Fracturing Treatment of Subterranean Formations Using Shock Waves. U.S. Patent 10,309,202, 4 June 2019. [Google Scholar]
  38. Rezaei, A.; Siddiqui, F.; Callen, N.; Gordon, P.; House, W.; Soliman, M.Y. Pulsed Power Plasma to Enhance Near Wellbore Permeability and Improve Well Performance. In Proceedings of the SPE Hydraulic Fracturing Technology Conference and Exhibition, The Woodlands, TX, USA, 4–6 February 2020. [Google Scholar] [CrossRef]
  39. Khalaf, M.; Soliman, M.; Farouq-Ali, S.M.; Cipolla, C.; Dusterhoft, R. Experimental study on pulsed plasma stimulation and matching with simulation work. Appl. Sci. 2024, 14, 4752. [Google Scholar] [CrossRef]
  40. Ostadhassan, M.; Zeng, Z.; Zamiran, S. Geomechanical Modeling of an Anisotropic Formation-Bakken Case Study. In Proceedings of the 46th U.S. Rock Mechanics/Geomechanics Symposium, Chicago, IL, USA, 24–27 June 2012; Available online: https://onepetro.org/ARMAUSRMS/proceedings/ARMA12/ARMA12/ARMA-2012-221/122300 (accessed on 13 September 2025).
  41. Ma, Z.; Xiu, N.; Fu, H.; Hou, B.; Chen, D.; Hou, C. Study on calculation of transversely isotropic dynamic rock mechanical parameters and conversion model between dynamic parameters and static parameters. Unconv. Resour. 2023, 3, 297–304. [Google Scholar] [CrossRef]
  42. Feng, Z.; Xiao, X. Thermal conductivity measurement of flexible composite phase-change materials based on the steady-state method. Micromachines 2022, 13, 1582. [Google Scholar] [CrossRef]
  43. Aboueldahab, A. Investigation of the Effect of Nano-Particles Activated Carbon on Heating Heavy Oil Reservoirs. Master’s Thesis, Texas Tech University, Lubbock, TX, USA, December 2016. Available online: https://ttu-ir.tdl.org/items/44f9e7e8-ea49-4603-843b-673dbbf8e254 (accessed on 13 September 2025).
  44. Gdanski, R. High-pH Clay Instability Rating. In Proceedings of the International Symposium and Exhibition on Formation Damage Control, Lafayette, LA, USA, 20–21 February 2002. [Google Scholar] [CrossRef]
  45. Abrams, M.E.; Grieser, B.; Benoit, D.N. Everything You Wanted to Know About Clay Damage but Were Afraid to Ask. In Proceedings of the 2016 AADE Fluids Technical Conference and Exhibition, Houston, TX, USA, 12–13 April 2016; Available online: https://www.aade.org/application/files/7815/7131/8490/AADE-16-FTCE-35_-_Abrams.pdf (accessed on 13 September 2025).
  46. Barati, R.; Liang, J.T. A review of fracturing fluid systems used for hydraulic fracturing of oil and gas wells. J. Appl. Polym. Sci. 2014, 131, 40735. [Google Scholar] [CrossRef]
  47. Moore, J.; Simmons, S.; McLennan, J.; Jones, C.; Skowron, G.; Wannamaker, P.; Nash, G.; Hardwick, C.; Hurlbut, W.; Allis, R.; et al. Utah FORGE: Phase 2C Topical Report; Geothermal Data Repository; Energy and Geoscience Institute at the University of Utah: Salt Lake City, UT, USA, 11 December 2019; No. EE0007080. [Google Scholar] [CrossRef]
  48. Moore, J.; Wannamaker, P.; McLennen, J.; Pankow, K.; Skowron, G.; Nash, G.; Jones, C.; Barker, B.; Podgorney, R.; Simmons, S. Utah FORGE: 2023 Phase 3B Year 1 Annual Report; Geothermal Data Repository; Energy and Geoscience Institute at the University of Utah: Salt Lake City, UT, USA, 9 August 2023; No. EE0007080; Available online: https://gdr.openei.org/submissions/1523. (accessed on 13 September 2025).
  49. Smith, M.C.; Ponder, G.M. Hot-Dry-Rock Geothermal-Energy Development Program; Annual Report, Fiscal Year 1981; Los Alamos National Laboratory: Los Alamos, NM, USA, 1982. [Google Scholar] [CrossRef]
  50. Tenzer, H. Development of hot dry rock technology. Geo-Heat Cent. Q. Bull. 2001, 22, 14–22. Available online: https://pangea.stanford.edu/ERE/pdf/IGAstandard/ISS/2003Germany/III/2_1.ten.pdf (accessed on 13 September 2025).
  51. Gürtürk, M. Predicting the optimal timing for system upgrades in binary geothermal power Plants: A thermodynamic and exergetic approach. Energy Convers. Manag. 2025, 343, 120225. [Google Scholar] [CrossRef]
  52. Zarrouk, S.J.; Moon, H. Efficiency of geothermal power plants: A worldwide review. Geothermics 2014, 51, 142–153. [Google Scholar] [CrossRef]
Figure 1. Pressure profile of 3PS compared to other stimulation methods.
Processes 13 03721 g001
Figure 2. 3PS experiment at University of Houston: (a) Capacitor for stimulation; (b) Connector with Al fusible wire; (c) Limestone specimen in true triaxial cell; (d) Recorded signals of voltage (yellow) and current (green).
Processes 13 03721 g002
Figure 3. Reproduced experiment of 3PS using wire: (a) Electrodes with fusible link and pressure probe; (b) Immersed electrodes in borehole; (c) Recorded signals of voltage (yellow), current (green), pressure (purple), and electromagnetic (blue); (d) Facet 1 of Limestone before stimulation; (e) Facet 1 of Limestone with fracture after stimulation.
Processes 13 03721 g003
Figure 4. The innovated fluid for NP-3PS: (a) Mixture of NP in KCl + guar + deionized water; (b) Design of new electrodes; (c) Centralized electrodes in NP fluid in borehole before experiment.
Processes 13 03721 g004
Figure 5. The recorded signals of voltage (yellow), current (green), pressure (purple), and electromagnetic (blue) under NP-3PS of 10 kJ + 0.4 wt% NP + 7 wt% KCl + 0.18 wt% guar fluid.
Processes 13 03721 g005
Figure 6. Comparison of measure signals: (a) Raw signals by wire-3PS; (b) Converted voltage and current by wire-3PS; (c) Raw signals by NP-3PS; (d) Converted voltage and current by NP-3PS.
Processes 13 03721 g006
Figure 7. The comparison of measured pressure: (a) Wire-3PS with one cycle of pressure peak; (b) NP-3PS with two cycles of pressure peaks.
Processes 13 03721 g007
Figure 8. Conceptual schematic of the NP-3PS mechanism induces fractures in cubic rock.
Processes 13 03721 g008
Figure 9. The NP-3PS experiment setup: (a) High-energy capacitor up to 20 kJ and 40 kV; (b) True triaxial testing cell accommodating 14” (35.56 cm) cubic rock specimens under confining stresses up to 3000 psi (26.7 MPa); (c) Hydraulic pump system for regulating the confining A- and B- horizontal stresses and C-vertical stress; (d) Oscilloscopes for real-time signal acquisition; (e) Discharge energy controller with green firing buttons.
Processes 13 03721 g009
Figure 10. The NP-3PS experimental setup for the Granite rock: (a) Cube named G2 in the triaxial cell with EM sensors; (b) Secured electrodes with pressure probe; (c) Centralized electrodes in borehole of rock.
Processes 13 03721 g010
Figure 11. The setup for Geomechanical measurement: (a) Pre-3PS 1” × 2” (2.54 cm × 5.08 cm) cylindrical core plug (from G2 Granite cube); (b) Installation showing sensors and cable connections; (c) Fully enclosed triaxial cell system for geomechanical testing.
Processes 13 03721 g011
Figure 12. Thermal conductivity measurement setup for granite core plug: (a) 0.5” × 1” (1.27 cm × 2.54 cm) pre-3PS granite core plug G2 prepared with the order of temperature profile; (b) Secured sample within the insulating sleeve; (c) Connection of thermocouples and cables for temperature monitoring; (d) The fully assembled divided-bar cell under controlled heating conditions.
Processes 13 03721 g012
Figure 13. Absence of visible fractures on top and side views following NP-3PS experiment under 10 kJ discharge energy using 0.15 wt% NP + 4 wt% KCl + 0.18 wt% guar fluid: (a) Top view with red-marked T of new concrete C4; (b,c) Side views of facet 3 and 4; 0.4 wt% NP + 4 wt% KCl + 0.18 wt% guar fluid: (d) Top view with red-marked T of new concrete C6; (e,f) Side views of facet 3 and 4.
Processes 13 03721 g013
Figure 14. Prominent fracture development observed after NP-3PS on new Limestone LS03 under 8 kJ in 0.4 wt% NP + 7 wt% KCl + 0.18 wt% guar fluid: (a) Top view with marked date and parameters; (b,c) Side views of facet 4 and 2.
Processes 13 03721 g014
Figure 15. EM wavelet transforms 8 kJ discharge in 7 wt% KCl + 0.18 wt% guar fluid: (a) 0.1 wt% NP showing low-magnitude signals; (b) 0.4 wt% NP exhibiting sustained high-frequency activity.
Processes 13 03721 g015
Figure 16. Pressure profiles comparing NP-3PS responses under 8 kJ discharge energy in 7 wt% KCl + 0.18 wt% guar fluid.
Processes 13 03721 g016
Figure 17. Observed extensive fracture propagation after NP-3PS on new Limestone LS03 under 10 kJ in 0.2 wt% NP + 7 wt% KCl + 0.18 wt% guar fluid: (a) Top view with marked date and parameters; (b,c) Side views of facet 3 and 1.
Processes 13 03721 g017
Figure 18. The visible crack and hairline fractures (blue arrows) on Limestone rock after NP-3PS under 10 kJ in 0.4 wt% NP + 10 wt% KCl + 0.18 wt% guar fluid: (a,b) Side views of facet 3 and 1; (c) Bottom view.
Processes 13 03721 g018
Figure 19. Single triaxial compression test on granite core plug: (a) Test setup with axial loading frame; (b) Horizontal view of failed GR2 specimen showing axial splitting; (c) Vertical view of GR2 specimen revealing shear-band fragmentation.
Processes 13 03721 g019
Figure 20. The visible fractures on top Granite rocks with marked name of G1, G2, G3, and G4 respectively after NP-3PS in 0.3 wt% NP + 7 wt% KCl + 0.18 wt% guar fluid under discharged energy: (a) 16 kJ; (b) 12 kJ; (c) 10 kJ; (d) 4 kJ + 6 kJ.
Processes 13 03721 g020
Figure 21. The visible fractures on side view with marked number 2 or 3 respectively for facet of Granite rock after NP-3PS in 0.3 wt% NP + 7 wt% KCl + 0.18 wt% guar fluid under discharged energy: (a) 16 kJ; (b) 12 kJ; (c) 10 kJ; (d) 4 kJ + 6 kJ.
Processes 13 03721 g021
Figure 22. Borehole proximal view of tensile fracturing in granite after 16 kJ NP-3PS using 0.3 wt% NP + 7 wt% KCl + 0.18 wt% guar fluid: (a) Left half cube; (b) Right half cube.
Processes 13 03721 g022
Figure 23. NP-3PS in 0.3 wt% NP + 7 wt% KCl + 0.18 wt% guar fluid on granite at varying discharge energies exhibiting: (a) The distinct compared pressure profiles; (b) Comparison of cumulative energies.
Processes 13 03721 g023
Figure 24. 13 μm-CT analysis of horizontal core plug from 16 kJ-stimulated granite: (a) Extracted core plug; (b) 3D reconstruction showing dominant oblique fracture network at 13 μm voxel resolution; (c) XY plane showing radial emanation and branching of 0.4 mm crack; (d) XZ plane depicting diagonal extension; (e) YZ plane illustrating lateral continuity with secondary offshoots.
Processes 13 03721 g024
Figure 25. Polarized light thin-section microscopy of 16 kJ-stimulated granite at 0.2 μm effective resolution: (a) full section overview; (b,c) areas of interest highlighting intergranular and transgranular fracture networks.
Processes 13 03721 g025
Figure 26. Comparison of damage indices (relative modulus reductions) for horizontal and vertical core plugs from 16 kJ-stimulated granite, derived from dynamic acoustic measurements, serving as proxies for fracture density.
Processes 13 03721 g026
Figure 27. Thermal conductivity of granite cores pre- and post-NP-3PS: baseline (2.61 W/m·K), 16 kJ post-stimulation horizontal core (2.38 W/m·K, 9% decrease), and post-stimulation vertical core (2.18 W/m·K, 16% decrease).
Processes 13 03721 g027
Table 1. Dynamic acoustic properties of granite core plugs pre- and post-NP-3PS stimulation.
SamplePre-NP-3PSPre-NP-3PSPost-NP-3PSPost-NP-3PSUnit
Vertical CoreHorizontal CoreVertical CoreHorizontal Core
Length5.11 × 10−25.11 × 10−25.92 × 10−25.29 × 10⁻²m
Diameter2.51 × 10−22.51 × 10−22.51 × 10−22.52 × 10⁻²m
Volume2.53 × 10−52.53 × 10−52.92 × 10−52.64 × 10⁻⁵m3
Weight6.64 × 10−26.64 × 10−27.56 × 10−26.85 × 10⁻²kg
Density2625.52625.52589.72591.8kg/m3
Δt P-wave1.16 × 10−51.15 × 10−51.53 × 10−51.24 × 10⁻⁵s
Δt S-wave1.92 × 10−51.92 × 10−52.38 × 10−52.10 × 10⁻⁵s
Vp4.39 × 1034.44 × 1033.86 × 1034.28 × 103m/s
Vs2.67 × 1032.67 × 1032.49 × 1032.52 × 103m/s
ν0.210.220.140.24unitless
K2.58 × 10102.68 × 10102.05 × 10102.45 × 1010Pa
G1.87 × 10101.86 × 10101.60 × 10101.64 × 1010Pa
E4.51 × 10104.57 × 10103.67 × 10104.06 × 1010Pa
Disclaimer/Publisher’s Note: The statements, opinions and data contained in all publications are solely those of the individual author(s) and contributor(s) and not of MDPI and/or the editor(s). MDPI and/or the editor(s) disclaim responsibility for any injury to people or property resulting from any ideas, methods, instructions or products referred to in the content.