Article

Research on Fault Location Method of Distribution Network Based on Archimedes Optimization Algorithm

1
Electric Power Science Research Institute, State Grid Jilin Electric Power Co., Ltd., Changchun 130021, China
2
School of Automation, Beijing Information Science and Technology University, Beijing 100192, China
*
Author to whom correspondence should be addressed.
Processes 2025, 13(11), 3715; https://doi.org/10.3390/pr13113715
Submission received: 6 October 2025 / Revised: 3 November 2025 / Accepted: 7 November 2025 / Published: 18 November 2025
(This article belongs to the Section Energy Systems)

Abstract

To address the challenges of high dimensionality, nonlinearity, and multiple constraints in distribution network fault location, where traditional intelligent optimization algorithms are prone to local optima and slow convergence, this paper proposes a fault location method based on the Archimedes Optimization Algorithm (AOA). By constructing a fault state encoding model for the distribution network, the fault location problem is transformed into a binary optimization problem. Leveraging the global search capability and convergence characteristics of the AOA, rapid and accurate location of faulty sections is achieved. Simulation experiments based on the IEEE 33-node system under various fault scenarios, including single-point and multi-point faults, demonstrate that the proposed method outperforms comparative algorithms in terms of convergence speed.

1. Introduction

As a critical component of the power system, the distribution network directly serves end-users. Its operational reliability and rapid self-healing capability after faults are crucial for power supply quality and user satisfaction [1,2]. In recent years, to address the challenges of energy transition, a high proportion of distributed generation (DG) has been widely integrated into distribution networks, transforming them from traditional radial passive networks into complex networks with multiple power sources and bidirectional power flow [3,4]. While this shift enhances system flexibility, it also increases operational complexity. Particularly during faults, the magnitude, direction, and timing characteristics of fault currents undergo fundamental changes, posing serious challenges to traditional fault location methods [5,6].
In response, researchers worldwide have conducted extensive studies. Current mainstream methods can be broadly categorized into rule-based matrix algorithms and artificial intelligence algorithms. Early rule-based matrix algorithms [7] are structurally simple, relying on network topology to construct fault information matrices and structural description matrices, with fault determination matrices derived through logical operations [8]. For instance, Liang Yingda et al. [9] constructed a fault information matrix by identifying overcurrent presence and direction to achieve fault discrimination. However, such methods have poor fault tolerance and adaptability to information distortion (e.g., errors or missing signals from Feeder Terminal Units (FTU)), and their positioning accuracy and computational efficiency decrease with complex distribution network structures [10]. Subsequently, swarm intelligence optimization algorithms such as the Genetic Algorithm (GA) [11] and Particle Swarm Optimization (PSO) [12] were introduced. These methods formulate an optimization model that minimizes the difference between FTU-uploaded information and actual fault states, transforming fault location into a combinatorial optimization problem. These approaches are model-simple and highly fault-tolerant, overcoming some drawbacks of matrix methods [13]. However, they have their own limitations: GA suffers from complex encoding, slow convergence, and premature convergence; PSO is prone to local optima, and its performance heavily depends on parameter settings [14,15]. To improve these algorithms, researchers have proposed various solutions such as the immune binary particle swarm algorithm [16], electromagnetism-like mechanism [17], and beetle colony antennae search algorithm [18]. For example, Zhao Qiao et al. [16] introduced an antibody concentration adjustment mechanism and immune selection operations into the binary PSO to maintain population diversity and enhance global search capability. Zou Yuqi et al. [19] improved the ant colony algorithm with an optimal individual strategy to enhance convergence efficiency. Zhang Lian et al. [20] incorporated differential mutation perturbation factors and adaptive weights into the traditional whale optimization algorithm to improve optimization precision and convergence speed. Although these studies have achieved good results, there is still room for improvement in balancing global exploration and local exploitation when handling high-dimensional, nonlinear fault location problems in active distribution networks. It is worth noting that some of metaheuristic algorithms and their improved versions have recently been introduced to solve the fault location problem in active distribution networks, demonstrating excellent performance [21,22]. This confirms the development potential of this research direction.
The Archimedes Optimization Algorithm (AOA), proposed by Hashim et al. in 2021 [23], is a novel metaheuristic algorithm inspired by Archimedes’ principle. It simulates the physical behavior of objects submerged in fluid, iteratively updating parameters such as density, volume, and acceleration to achieve global optimization. Due to its intuitive principles, few parameters, strong global exploration capability, and fast convergence, AOA has demonstrated excellent performance in various fields such as engineering optimization design. Its application potential in power systems is increasingly being explored. For example, Wang Junwei et al. [24] integrated the Archimedean spiral concept into the whale optimization algorithm, effectively enhancing local search capability and successfully applying it to the optimal configuration of distributed generation in microgrids, improving both economy and environmental friendliness. Another study improved AOA itself using chaotic sine mapping (CAOA) and applied it to distribution network reconfiguration, significantly reducing system network losses and voltage deviations, verifying the algorithm’s effectiveness and robustness in solving complex engineering optimization problems [25]. These successful applications indicate that AOA has significant advantages in handling high-dimensional, nonlinear engineering optimization problems. However, standard AOA is inherently designed for continuous space optimization, while distribution network fault location is a typical discrete binary combinatorial optimization problem. Therefore, directly applying AOA to fault location is incompatible, necessitating discrete improvements, a key focus of this study.
Based on the above analysis, this paper focuses on the applicability of AOA in distribution network fault location and its improvement. The main contributions are as follows: (1) constructing a fault state encoding and optimization model suitable for active distribution networks, precisely transforming the fault location problem into a binary optimization problem, and discretizing the standard AOA to effectively handle discrete variables; (2) designing a fitness function capable of performing distribution network fault location; (3) using the IEEE 33-node system as a simulation platform, constructing typical fault scenarios including single-point and multi-point faults, and comparing the proposed Archimedes optimization algorithm with traditional intelligent algorithms such as GA, PSO, and Differential Evolution (DE) to comprehensively verify its superiority in positioning accuracy and convergence speed.

2. Archimedes Optimization Algorithm

The Archimedes Optimization Algorithm is inspired by Archimedes’ principle, simulating the process where objects submerged in liquid continuously adjust their properties through collisions or buoyancy until reaching equilibrium. It is a population-based optimization algorithm. AOA simulates the force process of objects in fluid, updating the population using three parameters: density (den), volume (vol), and acceleration (acc). Its iterative process includes initialization, parameter update, and position update stages [7]. In the initialization phase, AOA randomly generates an initial population of a certain size, evaluates it, and selects the best individual to guide the population. Next, it sets transfer operators and density factors to control and balance the global exploration and local exploitation phases. The algorithm repeatedly updates individual positions and the optimal solution until termination conditions are met.
(1)
In the initialization phase, AOA initializes the population position as shown in Equation (1):
X i = l b i + r a n d × u b i l b i , i = 1 , 2 , , N
where [lbi,ubi] represents the search space.
The density (den), volume (vol), and acceleration (acc) of each individual are initialized as shown in Equation (2):
d e n i = r a n d v o l i = r a n d a c c i = l b i + r a n d × u b i l b i
In this phase, AOA evaluates the population, selects the current best individual (xbest), along with its density (denbest), volume (volbest), and acceleration (accbest). It then updates the volume and density of other individuals using the best individual’s density and volume:
d e n i t + 1 = d e n i t + r a n d d e n best d e n i t v o l i t + 1 = v o l i t + r a n d v o l best v o l i t
Next, the transfer operator TF and density factor d are set:
T F = exp t T max T max d t + 1 = exp T max t T max t T max
where t is the current iteration number, and Tmax is the maximum number of iterations.
(2)
Global exploration phase (collisions between objects)
If TF ≤ 0.5, AOA performs global exploration, updating individual acceleration as shown in Equation (5):
a c c i t + 1 = d e n mr + v o l mr + a c c mr d e n i t + 1 × v o l i t + 1
where a c c i t + 1 represents the acceleration of the ith individual in generation t + 1; denmr and volmr are the density and volume of random individuals in the current iteration, respectively.
AOA normalizes individual acceleration using Equation (6) for updating individual positions.
a c c i norm t + 1 = u × a c c i t + 1 min a c c max a c c min a c c + l
where a c c i norm t + 1 is the normalized acceleration of the ith individual in generation t + 1; u and l are used to adjust the normalization range.
In this phase, individual positions are updated as shown in Equation (7):
x i t + 1 = x i t + C 1 × r a n d × a c c i norm t + 1 × d × x r a n d x i t
where C1 is a fixed constant, and r a n d 0 , 1 is a random number.
(3)
Local exploitation phase (no collisions between objects)
If TF > 0.5, AOA performs local exploitation, updating individual acceleration according to Equation (8), and normalizing the acceleration.
a c c i t + 1 = d e n best + v o l best + a c c best d e n i t + 1 × v o l i t + 1
In this phase, individual positions are updated via Equation (9):
x i t + 1 = x best t + F × C 2 × r a n d × a c c i norm t + 1 × d × T × x best x i t
where C2 is a fixed constant; T = C 3 × T F , and T C 3 × 03 , 1 ; F is a direction factor determining the position update direction, defined as:
F = + 1 ,   P 0.5 1 ,   P > 0.5
where P = 2 × r a n d C 4 , and C4 is a fixed constant.

3. Fault Location Process Based on AOA for Distribution Networks

Components such as sectionalizing switches, tie switches, and circuit breakers in the active distribution network are treated as nodes. Multiple nodes divide the distribution network into several feeder sections. The fault operation state of each feeder section represents the individual traits of the population in the AOA, generating the expected fault current array for each node. When a fault occurs in a feeder section, FTU devices detect the actual fault current state of each node and report it to form the actual fault current array. The similarity between the expected fault current array of nodes corresponding to population individuals and the actual fault current array reported by terminal devices serves as the evaluation function, guiding the AOA iteration. After population updates through global exploration and local exploitation, if the iteration conditions are met, the global best individual is output. The traits of this individual represent the current operational state of the feeder sections, thereby locating the faulty feeder section.

3.1. Binary Discrete Improvement

The standard AOA is suitable for continuous spaces, while fault location is a discrete problem. Thus, the Archimedes Optimization Algorithm is discretized, and its population individuals are binary encoded. Each dimension of an individual’s position corresponds to the fault state of a feeder section: 1 for faulty, 0 for non-faulty. Therefore, a population individual can be represented as L1, L2,…, Ln, where each Ln is either 0 or 1.
With DG integrated into the distribution network, the network topology, power flow distribution, and direction change. To adapt to this, the positive direction of node fault current detected by FTU devices is defined as follows: when no DG is present in the feeder section, the direction from the system power source to the load is positive; when DG is present, the direction from the system power source to the DG is positive. Based on this, the node fault current encoding has three cases, as shown in Table 1:
During the iterative process of AOA, the discretization is achieved through a probability-based flipping mechanism. The updated rules for individual positions are as follows:
(1)
In the exploration phase, for each dimension, the algorithm decides whether to flip the current binary value (i.e., changing 0 to 1 or 1 to 0) based on a calculated probability.
(2)
In the exploitation phase, based on the value of parameter p, the algorithm sets the value of the current dimension to either the corresponding value of the global best solution or its flipped version, according to a specified probability.
Through this discrete position update mechanism implemented via probability-based flipping, the optimization process of AOA is effectively applied to solve the discrete fault location problem.
The expected fault state of a switch node is closely related to the fault states of feeder sections upstream and downstream, as well as the switch state of downstream DG. An expected switch function is established. For a switch in a feeder section, the feeder sections from the system power source to the switch are defined as upstream, and those from the switch to the DG or load are downstream. The expected fault current state function Si(L)* for each switch node is given by Equation (11):
S i L * = j = 1 n 2 L j j = 1 n D G K j 1 j = 1 n 2 L j j = 1 n 1 L j
where n1 is the total number of feeder sections upstream of the ith switch; n2 is the total number of feeder sections downstream of the ith switch; nDG is the total number of downstream DGs; Kj is the jth DG switch downstream; Lj is the fault state of the jth feeder section in the upstream or downstream area. This generates the expected fault current array.

3.2. Fitness Function Design

When a fault occurs in a feeder section of a distribution network with DG, the fitness is represented by the difference between the actual fault current array detected by FTU devices and the expected function array. The optimal solution is achieved when the similarity between the actual fault current information and the expected function values is highest, minimizing the difference. The inflation function is shown in Equation (12):
E S = W i = 1 N | S i S i L * | + δ i = 1 n L i
where W is a large number (taken as 102) introduced to ensure the evaluation function is always positive, transforming the problem into a maximization problem; N is the total number of switches in the distribution network with DG; Si is the actual fault current array information of the ith switch node detected by FTU devices; Si(L)* is the expected fault current state array information of each switch node; n is the total number of feeder sections in the distribution network with DG; δ is the weight coefficient, taken as 0.5 in this paper to prevent misjudgment; i = 1 n L i is the total number of faulty feeder sections.

3.3. Algorithm Location Process

The fault location process for distribution networks with DG based on AOA is as follows. The flowchart of fault location in distribution network with distributed generation based on the AOA is shown in Figure 1.
(1)
Data collection: FTU devices collect fault current state information of components such as sectionalizing switches, tie switches, and circuit breakers, uploading it to the master SCADA system. Based on the number of nodes, the actual fault current array Si of switch nodes is generated.
(2)
Parameter initialization and population generation: Initialize the population size, maximum iteration count Tmax, variable dimension (number of feeder sections), and adaptive parameters C1 = 2.5, C2 = 4.0, C3 = 1.0, C4 = 2.0; generate the initial binary population, where each individual represents a set of fault operation states for the feeder sections; randomly initialize the density (den), volume (vol), and acceleration (acc).
(3)
Fitness evaluation: Calculate the fitness value for each binary individual according to the fitness function described in Equation (12). This evaluates the degree of agreement between the corresponding expected fault current state array information S(L)* and the actual fault current state array information S.
(4)
AOA iterative optimization: First, select the individual with the highest fitness in the current population as xbest, and record its denbest, volbest, and accbest. Then, update the density and volume of individuals using Equation (3), calculate TF and d using Equation (4). Subsequently, perform global exploration and local exploitation to update the population positions. Calculate the fitness of the new population and update the global best solution.
(5)
Termination check and result output: If the termination criteria are met (the maximum iteration count is reached), output the optimal fault state vector.

3.4. Computational Complexity Analysis

To evaluate the computational efficiency of the proposed method, a time complexity analysis is performed for the binary AOA and the comparison algorithms, namely PSO, GA, and DE. For such population-based algorithms, the computational complexity is primarily determined by three factors: the population size (N), the maximum number of iterations (Tmax), and the dimensionality of the problem (D), which corresponds to the number of feeder sections.
The standard AOA’s operations, including population initialization and the iterative updates of density, volume, acceleration, and position, result in a baseline time complexity of O(Tmax × N × D). The binary variant proposed in this study incorporates additional steps for discrete encoding and fitness function evaluation. Specifically, the process of computing the expected fault current array during fitness evaluation introduces a complexity that scales with the number of switches (Nswitch) and feeder sections (D), approximated as O(Tmax × N × D × Nswitch). Since the number of switches and feeder sections in a distribution network is typically comparable, the overall time complexity for the binary AOA can be generalized as O(Tmax × N × D2).
The classical algorithms used for comparison—PSO, GA, and DE—share a similar fundamental per-iteration complexity of O(Tmax × N × D). It is important to note that the fitness function evaluation is identical across all algorithms in this study and constitutes the most computationally demanding component. Consequently, the theoretical computational load for all methods belongs to the same order of magnitude.
Despite this theoretical similarity in per-iteration cost, the critical factor influencing practical computational efficiency is the convergence speed. The simulation results presented in Section 4 demonstrate that the proposed AOA consistently reaches the global optimum in fewer iterations than PSO, GA, and DE across diverse fault scenarios. This accelerated convergence directly translates to reduced computation times in practical applications, underscoring the superior computational efficiency of the AOA for the fault location task.

4. Simulation Experiments and Result Analysis

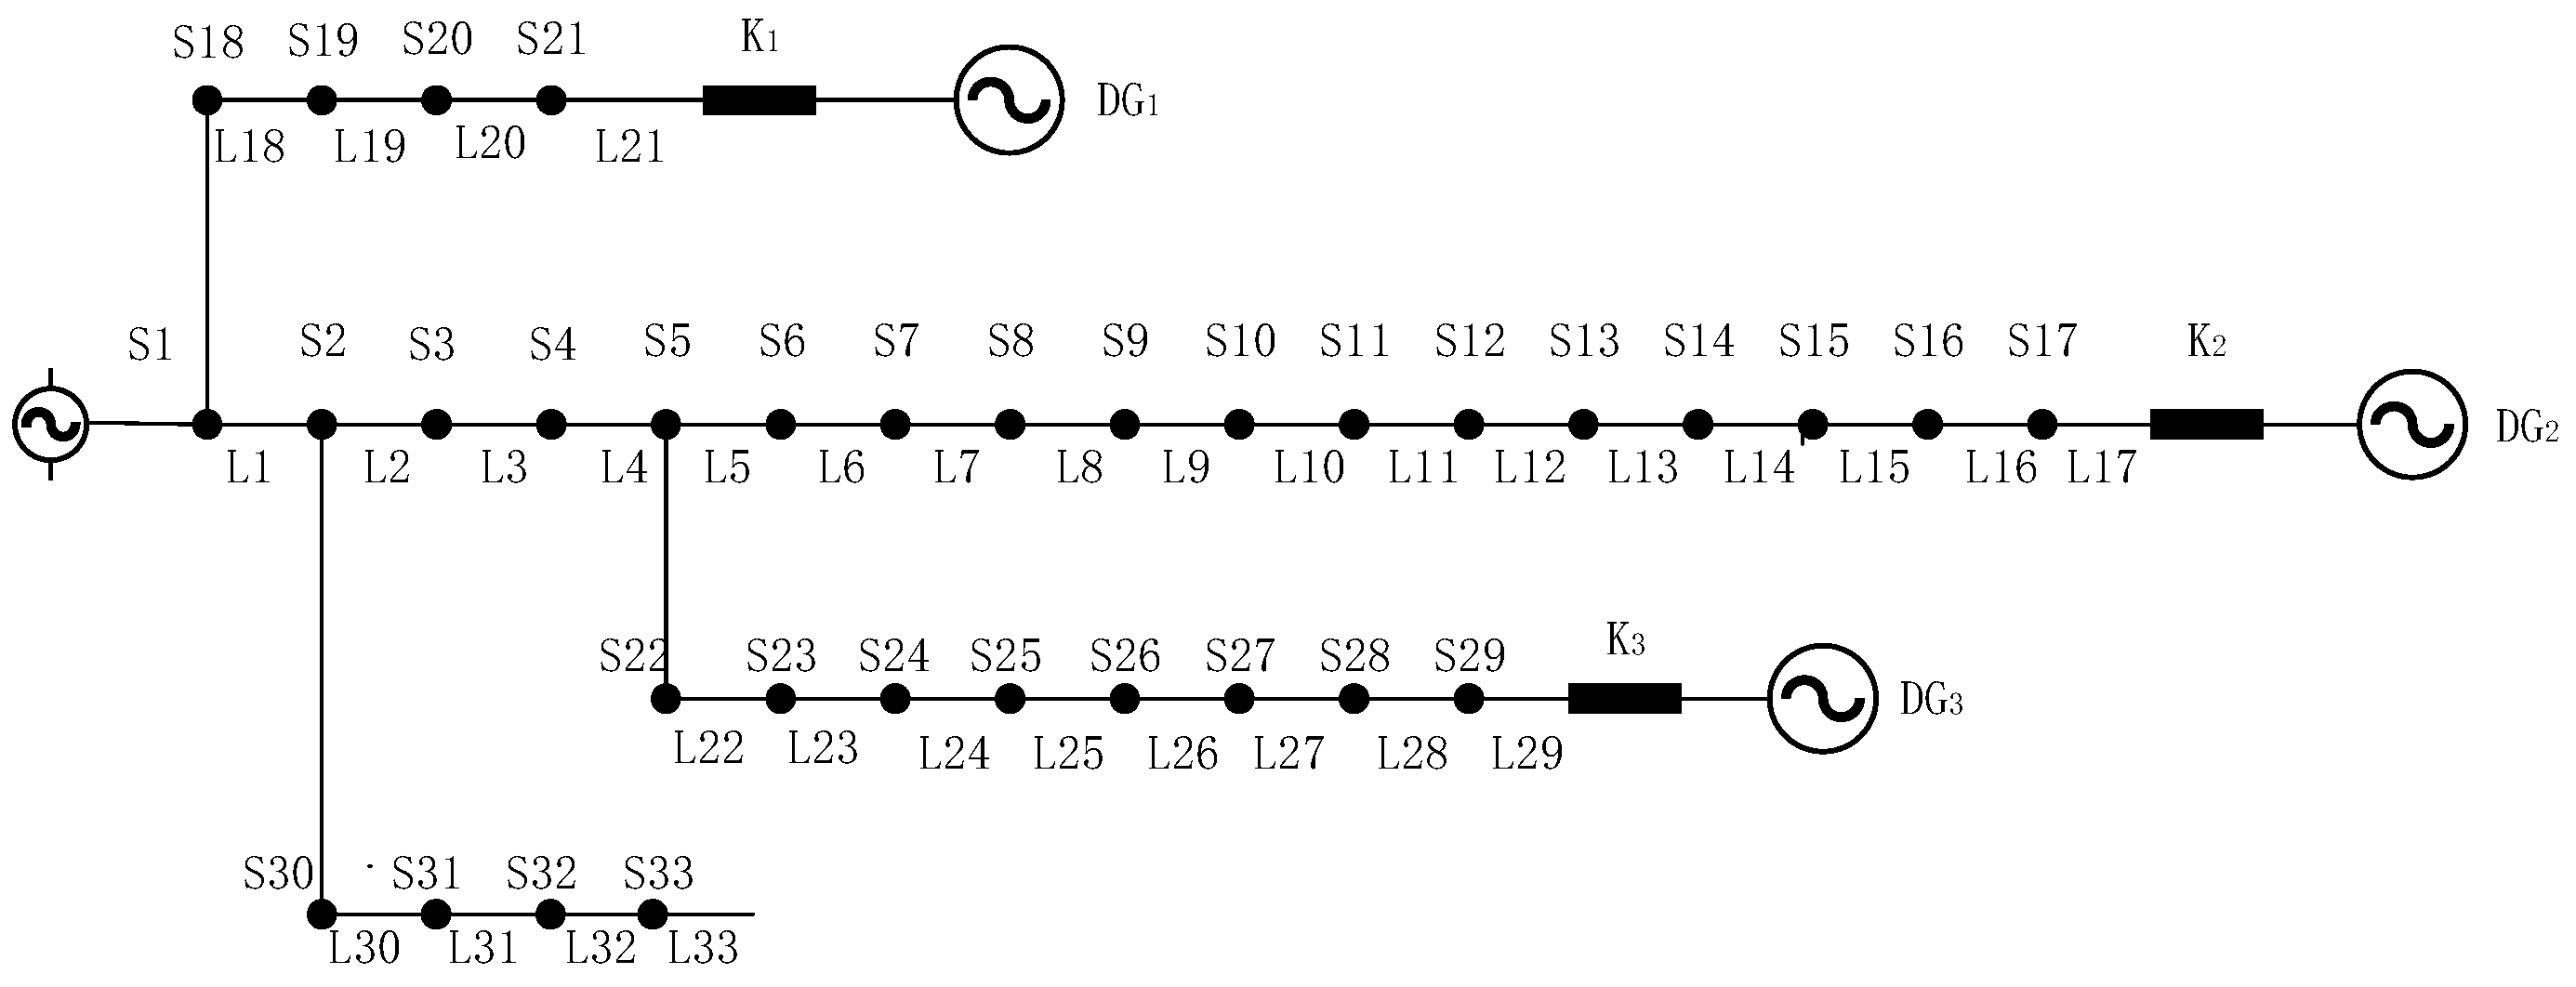
The simulation experiments were conducted on the MATLAB R2020b platform on a computer with an Intel Core i7-9750H CPU and 8 GB of RAM, building a mathematical model of the IEEE 33-node distribution network structure with DG to verify the effectiveness of the proposed method. The system structure is shown in Figure 2. Here, L1–L33 represent 33 feeder sections, S1–S33 are 33 switch nodes, and K1–K3 are the access switches for each DG. All integrated DGs were modeled as PQ nodes, maintaining constant power output. The variation in DG penetration, achieved by switching K1–K3, modifies the network’s topology and pre-fault power flow. This, in turn, dictates the magnitude and direction of fault currents during a contingency, forming the basis for the fault current signatures used in the location process. Due to the integration of DG, the topology and complexity of fault location increase. In the simulations, DGs of different locations and quantities were randomly integrated to validate the method’s effectiveness. To simulate different DG integration scenarios, three DGs were connected at nodes 17, 21, and 29 through switches K1, K2, and K3, respectively. Different DG penetration scenarios were constructed by controlling the switching states of [K1, K2, K3] (where 1 represents connected and 0 represents disconnected), as shown in Table 2 and Table 3. To comprehensively test the algorithm’s performance, various scenarios including both single-point and multi-point faults were constructed. The fault settings considered combinations of DG connection locations and penetration levels to verify the method’s robustness under different network topologies.
The Particle Swarm Optimization (PSO), Genetic Algorithm (GA), Differential Evolution (DE), and the proposed AOA were used for comparative simulation experiments under single-point and multi-point faults with DGs integrated at different locations and quantities. Positioning accuracy and average convergence generation were used as performance evaluation indicators. The unified parameter settings in MATLAB for all compared algorithms are as follows: the variable dimension is 33, the maximum number of iterations is 100, and the population size is 50. The specific parameters for AOA are set as: C1 = 2.5, C2 = 4.0, C3 = 1.0, C4 = 2.0, with the normalization range [l, u] = [0.05, 0.95].
(1)
Single-point fault
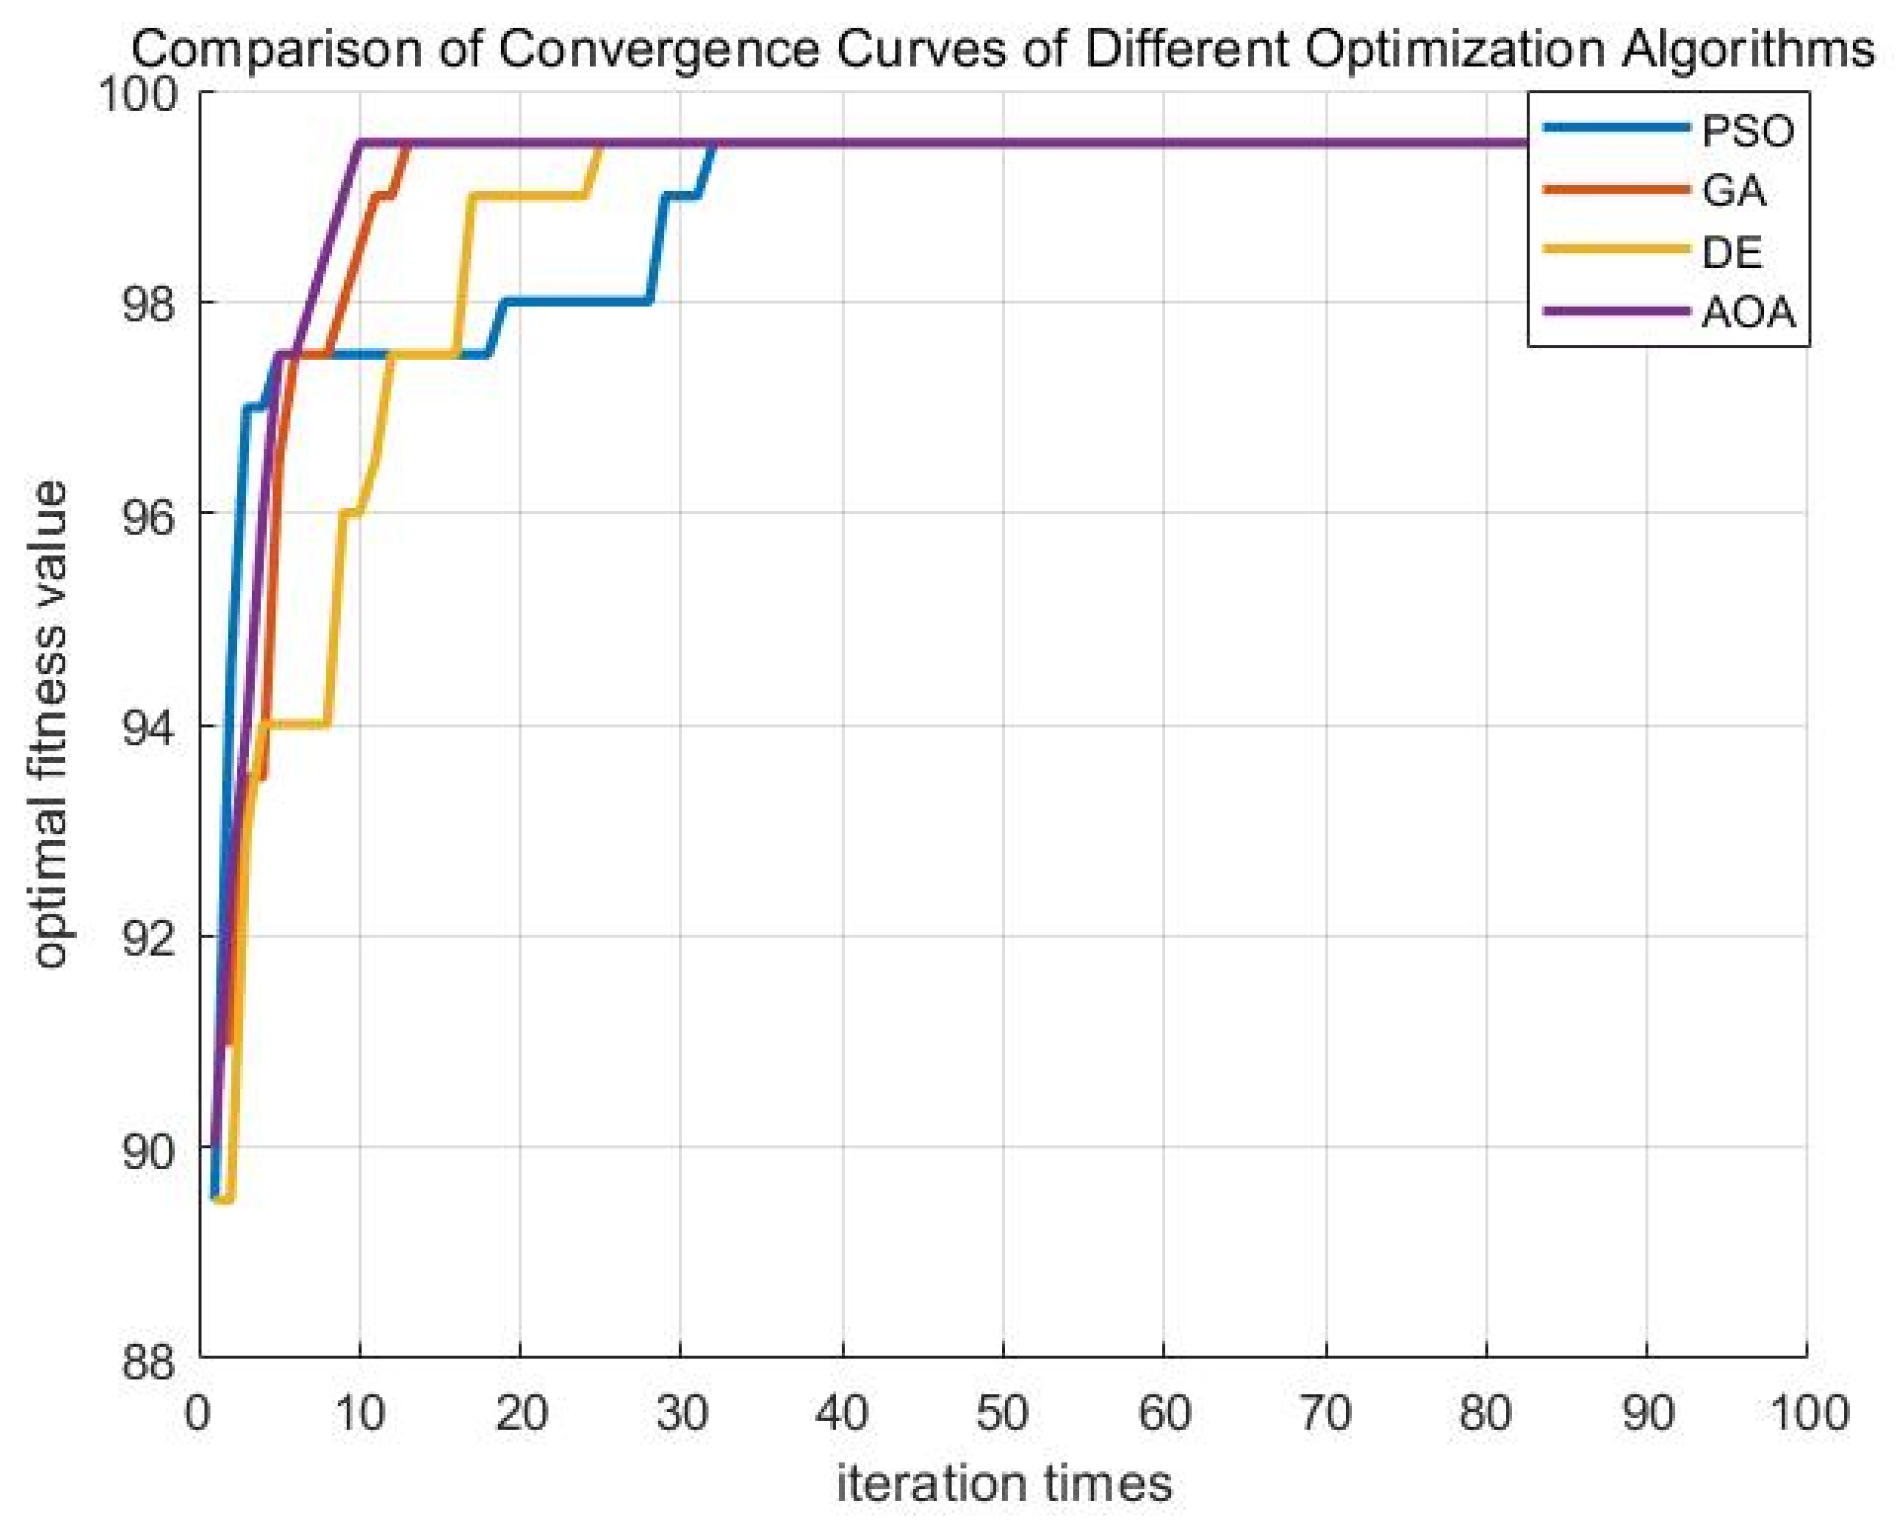
For the multi-DG distribution network model, to simulate scenarios with DGs integrated at different locations and quantities, single-point fault location simulations were categorized into four types, as shown in Table 2. For example, [K1, K2, K3] = [0, 0, 0] means no DG is integrated. If section L11 faults, the FTU-reported information is [1, 1, 1, 1, 1, 1, 1, 1, 1, 1, 1, 0, 0, 0, 0, 0, 0, 0, 0, 0, 0, 0, 0, 0, 0, 0, 0, 0, 0, 0, 0, 0, 0], and the positioning output results is [0, 0, 0, 0, 0, 0, 0, 0, 0, 0, 1, 0, 0, 0, 0, 0, 0, 0, 0, 0, 0, 0, 0, 0, 0, 0, 0, 0, 0, 0, 0, 0, 0]. The algorithm iteration comparison curve is shown in Figure 3. In the single-point fault location simulation experiments, the average values of multiple simulation results based on evaluation metrics are presented in Table 3.
(2)
Multi-point fault
Multi-point fault location simulations were categorized into four types, as shown in Table 4. For example, [K1, K2, K3] = [1, 1, 1], meaning all DGs are integrated. If sections L10, L28 and L32 fault, the FTU-reported information is [1, 1, 1, 1, 1, 1, 1, 1, 1, 1, −1, −1, −1, −1, −1, −1, −1, −1, −1, −1, −1, 1, 1, 1, 1, 1, 1, 1, −1, 1, 1, 1, 0], and the positioning output results is [0, 0, 0, 0, 0, 0, 0, 0, 0, 1, 0, 0, 0, 0, 0, 0, 0, 0, 0, 0, 0, 0, 0, 0, 0, 0, 0, 1, 0, 0, 0, 1, 0]. The algorithm iteration comparison curve is shown in Figure 4. In the multi-point fault location simulation experiments, the average values of multiple simulation results based on evaluation metrics are presented in Table 5.
Based on the above simulation experiments, in both single-point and multi-point fault cases, the AOA converged to the optimum within about 10 generations. As evidenced by the iteration time in Table 3 and Table 5, it also required the shortest computation time. This demonstrates good adaptability to DG integration and changes in distribution network structure, with advantages such as fast convergence and strong adaptability. It shows certain applicability in handling complex optimization problems like distribution network fault location. In comparison, the PSO algorithm required about 17 generations to reach the optimum in single-point fault cases, while its convergence speed improved in multi-point fault cases, converging within about 12 generations. The convergence performance of GA and DE algorithms was also inferior to AOA. Overall, the AOA exhibited better performance across various test scenarios.

5. Conclusions

To more effectively solve the fault location problem in distribution networks and address issues such as slow convergence and susceptibility to local optima in traditional intelligent optimization algorithms for active distribution network fault location, this paper proposes a fault location method based on the Archimedes Optimization Algorithm (AOA). According to the characteristics of the fault location problem, AOA was improved with binary discrete encoding and fitness function design, effectively solving the fault location problem in distribution networks with distributed generation (DG). Simulation experiments based on the IEEE 33-node system show that the proposed AOA achieves significant performance improvements compared to traditional algorithms. In single-point fault location, AOA improves positioning accuracy by approximately 52.6%, 7.4%, and 16.0% compared to PSO, GA, and DE, respectively, while accelerating the average convergence speed by about 58.8%, 36.4%, and 53.3%. In more complex multi-point fault location, AOA also enhances accuracy by approximately 18.9%, 7.3%, and 11.4% against PSO, GA, and DE, respectively, and improves convergence speed by about 53.8%, 33.3%, and 50.0%. The results demonstrate the effectiveness of the AOA optimization algorithm in distribution network fault location, achieving high positioning accuracy and convergence speed under various fault scenarios, and proving its suitability for complex distribution network systems with DG. Future work can focus on exploring the hybridization of AOA with other optimization strategies or local search techniques to enhance its performance for even larger and more complex network topologies.
The research findings presented in this paper hold promising potential for industrial applications. The proposed AOA-based fault location method can be integrated as a core algorithmic module into existing Distribution Management Systems or Supervisory Control and Data Acquisition systems. In practical operation, this module can utilize the real-time FTU data collected by the SCADA system to rapidly and accurately identify fault sections through the DMS. This provides dispatchers with precise fault information, supporting subsequent decision-making for fault isolation and power supply restoration, thereby effectively enhancing the self-healing capability and power supply reliability of the distribution network.

Author Contributions

Conceptualization, J.Z., H.Z., R.L., S.Z., J.Y., J.L. and F.Z.; methodology, J.Z., H.Z., R.L., S.Z., J.Y., J.L. and F.Z.; software, J.Z., H.Z., R.L., S.Z., J.Y., J.L. and F.Z.; validation, J.Z., H.Z., R.L., S.Z., J.Y., J.L. and F.Z.; writing—original draft preparation, J.Z., H.Z., R.L., S.Z., J.Y., J.L. and F.Z. All authors have read and agreed to the published version of the manuscript.

Funding

This research was funded by State Grid Jilin Electric Power Company Limited: “Key Technology Research and Application for Reliability Assessment and Optimization Enhancement of Medium and Low Voltage Distribution Networks Considering Distributed Generation”, grant number 2024JBGS-11.

Data Availability Statement

The original contributions presented in this study are included in the article. Further inquiries can be directed to the corresponding author.

Conflicts of Interest

Authors Jiajun Zhang, Haifeng Zhang, Runzi Lin and Shuyu Zhou were employed by Electric Power Science Research Institute, State Grid Jilin Electric Power Co., Ltd. The remaining authors declare that the research was conducted in the absence of any commercial or financial relationships that could be construed as a potential conflict of interest.

References

  1. Hu, B.A.; Liu, Y.B.; Xu, L.X. Solution of reliability value-added service based on two-level game model considering distribution system reconfiguration strategy. Proc. CSEE 2023, 43, 9496–9509. [Google Scholar] [CrossRef]
  2. Zhang, B.; Gao, Y.; Wang, L. Reactive voltage control strategy of distribution network considering the reliability of photovoltaic power supply. High Volt. Eng. 2023, 49, 2775–2784. [Google Scholar] [CrossRef]
  3. Xiang, Y.; Qin, L.; Tan, T.Y. Power quality characteristics analysis and research progress of AC/DC distribution networks. Power Syst. Technol. 2025, 49, 1585–1605. [Google Scholar] [CrossRef]
  4. Zhao, Y.; Li, Q.; Zhang, Y.X. Optimal configuration of hybrid energy storage considering power supply reliability in distribution network with distributed energy. Smart Power 2024, 52, 25–32+49. [Google Scholar]
  5. He, X.L.; Gao, H.J.; Huang, Y. Fault section location for a distribution network based on one-dimensional convolution and graph neural networks. Power Syst. Prot. Control 2024, 52, 27–39. [Google Scholar] [CrossRef]
  6. Liu, X.M.; Feng, Z.H.; Chen, H. Transient analysis of short-circuit faults in DC distribution network with distributed generations. Proc. CSU-EPSA 2024, 36, 149–158. [Google Scholar] [CrossRef]
  7. Mei, F.; Chen, Z.P.; Pei, X. Fault-tolerant method for fault location of active distribution network based on matrix algorithm. Electr. Power Eng. Technol. 2022, 41, 109–115. [Google Scholar]
  8. Galvez, C.; Abur, A. Fault location in active distribution networks containing distributed energy resources (DERs). IEEE Trans. Power Deliv. 2021, 36, 3128–3139. [Google Scholar] [CrossRef]
  9. Liang, Y.D.; Tian, S.; Liu, M.H. Fault section location of multi-source distribution network based on phasor correction. Power Syst. Prot. Control 2023, 51, 33–42. [Google Scholar] [CrossRef]
  10. Wang, Z.T.; Luo, Y.; Lu, X.J. Fault detection of rare earth production line based on Bayesian secondary discrimination. J. Guilin Univ. Electron. Technol. 2021, 41, 420–425. [Google Scholar] [CrossRef]
  11. Zhang, Z.L.; Gao, Y.; Pan, Q. Research on state estimation algorithm of distribution network based on genetic algorithm. In Proceedings of the 2024 IEEE 7th International Conference on Automation, Electronics and Electrical Engineering (AUTEEE), Shenyang, China, 27–29 December 2024. [Google Scholar] [CrossRef]
  12. Qin, J.; Chu, H.B.; Yu, D.Q. Transmission line fault diagnosis and location system in distribution network based on PSO. In Proceedings of the 2023 2nd International Conference for Innovation in Technology (INOCON), Bangalore, India, 3–5 March 2023. [Google Scholar] [CrossRef]
  13. Haleem, A.M.I.; Sharma, M.; Sajan, K.S. A comparative review of fault location/identification methods in distribution networks. In Proceedings of the 2018 1st International Conference on Advanced Research in Engineering Sciences (ARES), Dubai, United Arab Emirates, 15 June 2018. [Google Scholar] [CrossRef]
  14. Dong, X.F.; Zhu, Y.Y.; Wang, Q.H. Regional fault location and fault tolerance analysis of distribution network based on genetic algorithm. Chin. J. Constr. Mach. 2023, 21, 607–612. [Google Scholar] [CrossRef]
  15. Gao, D.H. Fault location analysis of distribution network based on particle swarm optimization algorithm. Lamps Light. 2024, 1, 89–91. [Google Scholar]
  16. Zhao, Q.; Wang, Z.P.; Dong, W.N. Research on fault location in a distribution network based on an immunebinary particle swarm algorithm. Power Syst. Prot. Control 2020, 48, 83–89. [Google Scholar] [CrossRef]
  17. Guo, Z.Z.; Wu, J.K. Electromagnetism-like mechanism based fault section diagnosis for distribution network. Proc. CSEE 2010, 30, 34–40. [Google Scholar] [CrossRef]
  18. He, J.; Zhou, S.J.; Li, K.C. Study on fault location of distribution network based on beetle colony antennae search algorithm. Power Capacit. React. Power Compens. 2021, 42, 92–97. [Google Scholar] [CrossRef]
  19. Zou, Y.Q.; Li, R.; Li, Z.M. Research on distribution network fault location based on optimal individual ant colony algorithm. Electr. Drive Autom. 2018, 40, 58–62. [Google Scholar]
  20. Zhang, L.; Zhang, S.D.; Jia, H. Fault section location of distribution network based on an improved whale algorithm algorithm. Zhejiang Electr. Power 2022, 41, 63–70. [Google Scholar] [CrossRef]
  21. Wu, X.M.; Han, K.; Dang, B. Fault section location method for active distribution network based on improved sparrow algorithm. Sci. Technol. Eng. 2025, 25, 12059–12067. [Google Scholar]
  22. Shang, L.; Li, Z. Research on fault location method of active distribution network based on improved multiverse algorithm. J. Phys. Conf. Ser. 2024, 2814, 012060. [Google Scholar] [CrossRef]
  23. Hashim, F.A.; Hussain, K.; Houssein, E.H. Archimedes optimization algorithm: A new metaheuristic algorithm for solving optimization problems. Appl. Intell. 2021, 51, 1531–1551. [Google Scholar] [CrossRef]
  24. Wang, J.W.; Yue, Y.T.; Li, B.H. Optimization of microgrid based on archimedes chaotic elite whale algorithm. Sci. Technol. Eng. 2023, 23, 12577–12584. [Google Scholar]
  25. Adegoke, S.A.; Sun, Y.X.; Wang, Z.H. Application of archimedes optimization algorithm for network reconfiguration to minimize power loss and voltage deviation. In Proceedings of the 2024 6th International Conference on Power and Energy Technology (ICPET), Beijing, China, 12–15 July 2024. [Google Scholar]
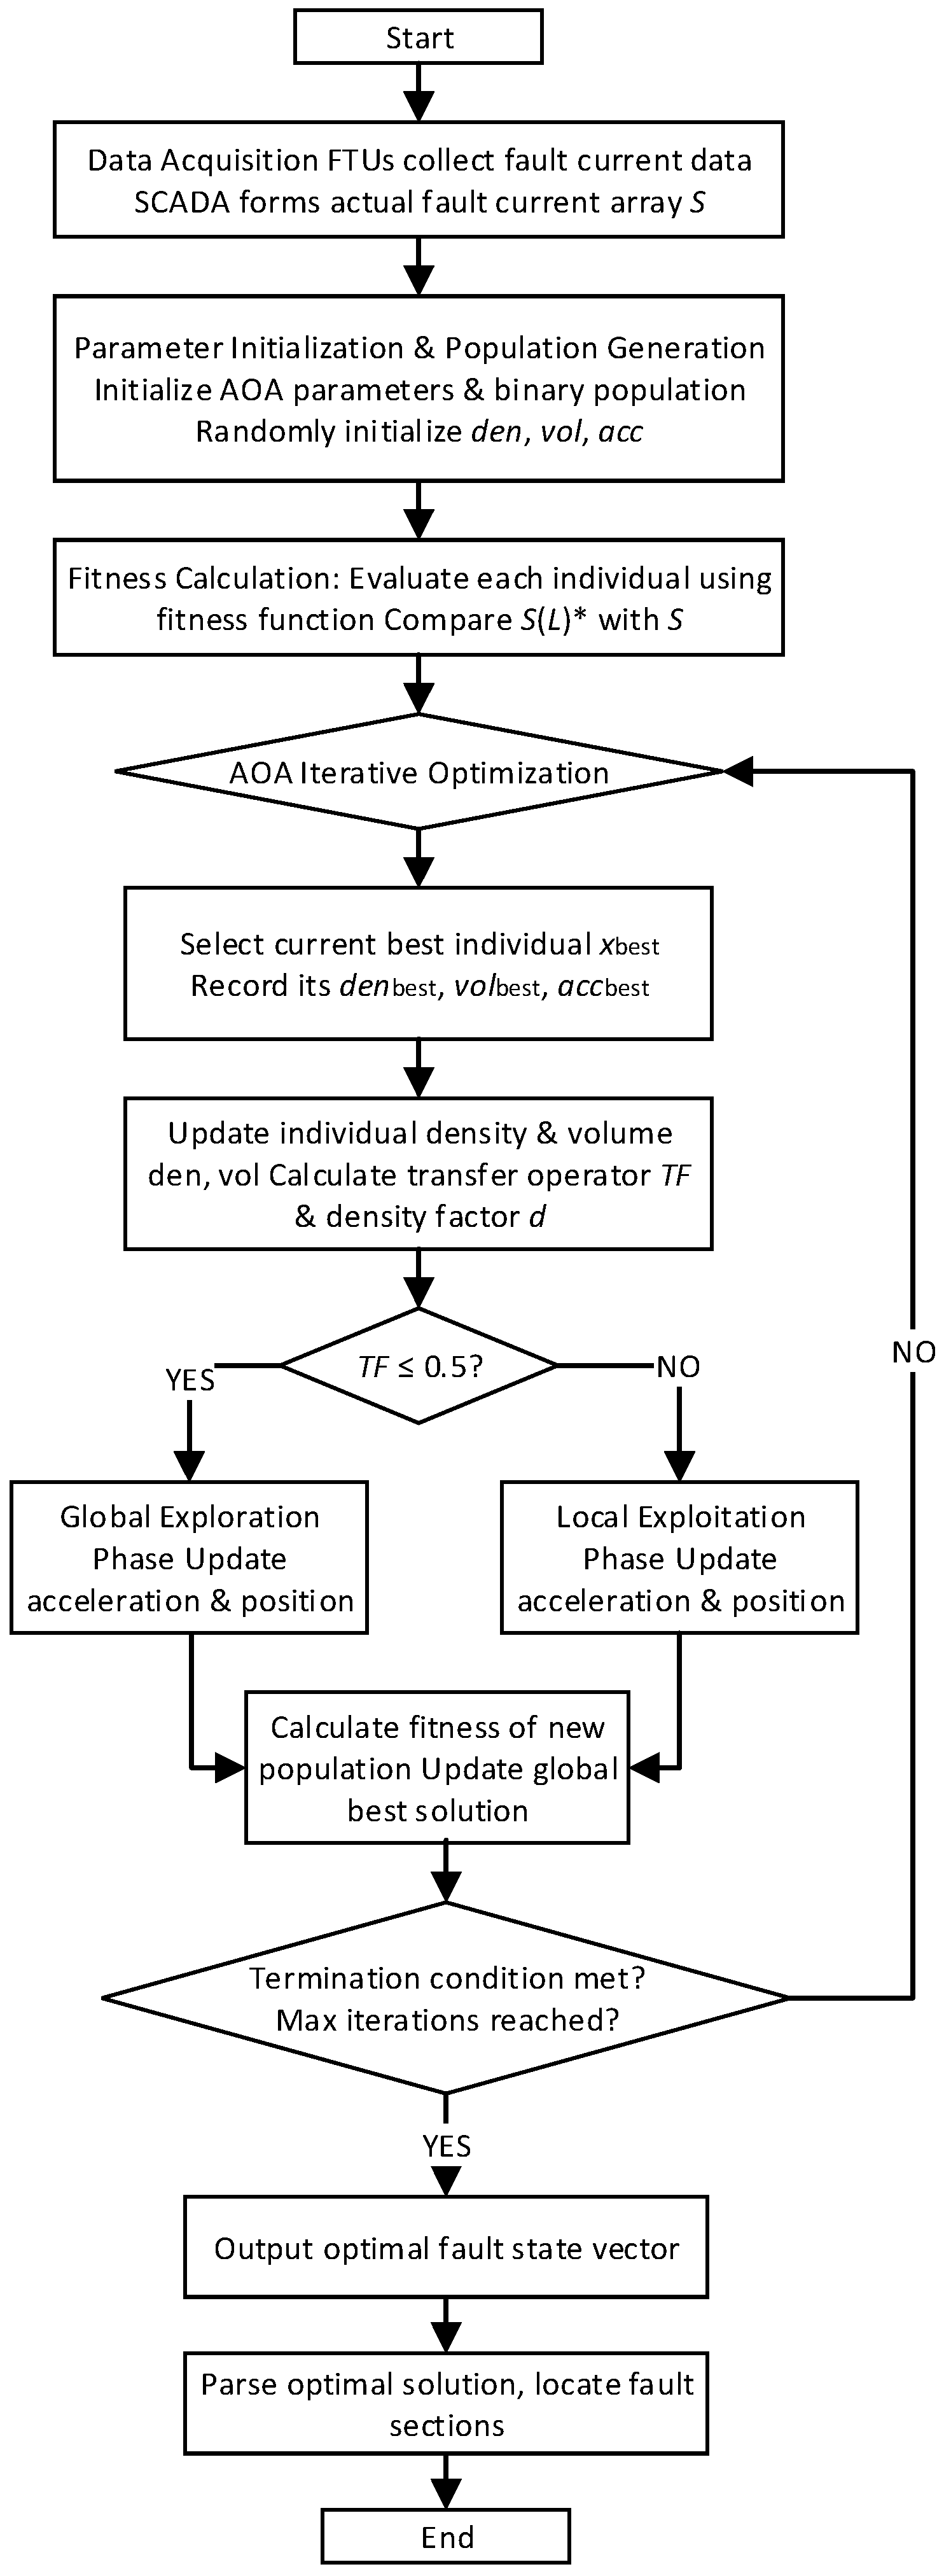
Figure 1. Flowchart of fault location in distribution network with distributed generation based on the AOA.
Processes 13 03715 g001
Figure 2. IEEE 33-node power system diagram.
Processes 13 03715 g002
Figure 3. Algorithm comparison chart for single-point fault location in distribution network.
Processes 13 03715 g003
Figure 4. Algorithm comparison chart for multi-point fault location in distribution network.
Processes 13 03715 g004
Table 1. Coding scheme for fault currents.
Fault Current InformationEncoding Scheme for Actual Fault Current Array Si of Switch Nodes
No fault current or undetectable00
With fault currentSame as defined positive direction1
Opposite to defined positive direction−1
Table 2. Single-point fault location simulation cases.
[K1, K2, K3]Fault SectionFTU-Reported InformationPositioning Output ResultsLocation Results
[0, 0, 0]L11[1, 1, 1, 1, 0, 0, 0, 0, 0, 0, 0, 0, 0, 0, 0, 0, 0,0, 0, 0, 0, 0, 0, 0, 0, 0, 0, 0, 0, 0, 0, 0, 0][0, 0, 0, 0, 0, 0, 0, 0, 0, 0, 1, 0, 0, 0, 0, 0, 0,0, 0, 0, 0, 0, 0, 0, 0, 0, 0, 0, 0, 0, 0, 0, 0]L11
[0, 1, 0]L19[1, 1, −1, −1, −1, −1, −1, −1, −1, −1, −1, −1, −1, −1, −1,−1, −1, 1, 1, 0, 0, 0, 0, 0, 0, 0, 0, 0, 0, 0, 0, 0, 0][0, 0, 0, 0, 0, 0, 0, 0, 0, 0, 0, 0, 0, 0, 0, 0, 0,0, 1, 0, 0, 0, 0, 0, 0, 0, 0, 0, 0, 0, 0, 0, 0]L19
[1, 1, 0]L9[1, 1, 1, 1, 1, 1, 1, 1, 1, −1, −1, −1, −1, −1, −1, −1, −1,−1, −1, −1, −1, 0, 0, 0, 0, 0, 0, 0, 0, 0, 0, 0, 0][0, 0, 0, 0, 0, 0, 0, 0, 1, 0, 0, 0, 0, 0, 0, 0, 0,0, 0, 0, 0, 0, 0, 0, 0, 0, 0, 0, 0, 0, 0, 0, 0]L9
[1, 1, 1]L28[1, 1, 1, 1, 1, −1, −1, −1, −1, −1, −1, −1, −1, −1, −1, −1,−1, −1, −1, −1, −1, 1, 1, 1, 1, 1, 1, 1, −1, 0, 0, 0, 0][0, 0, 0, 0, 0, 0, 0, 0, 0, 0, 0, 0, 0, 0, 0, 0, 0,0, 0, 0, 0, 0, 0, 0, 0, 0, 0, 1, 0, 0, 0, 0, 0]L28
Table 3. Comparison of iterative results of algorithms for single-point fault location (mean values over 30 independent runs).
The Comparison AlgorithmLocation
Accuracy/%
Mean Convergence
Generations
Iteration Time/s
AOA96.6770.520
PSO63.33170.669
GA90.00110.546
DE83.33150.562
Table 4. Multi-point fault location simulation cases.
[K1, K2, K3]Fault SectionFTU-Reported InformationPositioning Output ResultsLocation Results
[0, 0, 0]L8, L19, L25[1, 1, 1, 1, 1, 1, 1, 1, 0, 0, 0, 0, 0, 0, 0, 0, 0, 1, 1, 0, 0, 1, 1, 1, 1, 0, 0, 0, 0, 1, 1, 1, 1][0, 0, 0, 0, 0, 0, 0, 1, 0, 0, 0, 0, 0, 0, 0, 0, 0, 0, 1, 0, 0, 0, 0, 0, 1, 0, 0, 0, 0, 0, 0, 0, 0]L8, L19, L25
[0, 1, 0]L14, L20, L31[1, 1, 1, 1, 1, 1, 1, 1, 1, 1, 1, 1, 1, 1, −1, −1, −1, 1, 1, 1, 0, 0, 0, 0, 0, 0, 0, 0, 0, 1, 1, 0, 0][0, 0, 0, 0, 0, 0, 0, 0, 0, 0, 0, 0, 0, 1, 0, 0, 0, 0, 0, 1, 0, 0, 0, 0, 0, 0, 0, 0, 0, 0, 1, 0, 0]L14, L20, L31
[1, 1, 0]L9, L20, L31[1, 1, 1, 1, 1, 1, 1, 1, 1, 0, 0, 0, 0, 0, 0, 0, 0, 1, 1, 1, −1, −1, −1, −1, −1, −1, −1, −1, −1, 1, 1, 0, 0][0, 0, 0, 0, 0, 0, 0, 0, 1, 0, 0, 0, 0, 0, 0, 0, 0, 0, 0, 1, 0, 0, 0, 0, 0, 0, 0, 0, 0, 0, 1, 0,0]L9, L20, L31
[1, 1, 1]L10, L28, L32[1, 1, 1, 1, 1, 1, 1, 1, 1, 1, −1, −1, −1, −1, −1, −1, −1, −1, −1, −1, −1, 1, 1, 1, 1, 1, 1, 1, −1, 1, 1, 1, 0][0, 0, 0, 0, 0, 0, 0, 0, 0, 1, 0, 0, 0, 0, 0, 0, 0, 0, 0, 0, 0, 0, 0, 0, 0, 0, 0, 1, 0, 0, 0, 1, 0]L10, L28, L32
Table 5. Comparison of iterative results of algorithms for multi-point fault location (mean values over 30 independent runs).
The Comparison AlgorithmLocation Accuracy/%Mean Convergence
Generations
Iteration Time/s
AOA97.7860.519
PSO82.22130.663
GA91.1190.534
DE87.78120.566
Disclaimer/Publisher’s Note: The statements, opinions and data contained in all publications are solely those of the individual author(s) and contributor(s) and not of MDPI and/or the editor(s). MDPI and/or the editor(s) disclaim responsibility for any injury to people or property resulting from any ideas, methods, instructions or products referred to in the content.