Abstract
Geochemical exploration offers a cost-effective means of identifying subsurface oil and gas accumulations through the detection of volatile organic compounds (VOCs), which serve as markers of underlying hydrocarbon systems. These indicators may appear as visible macroseeps or as subtle microseepage, detectable only through advanced analytical methods. A widely used approach involves deploying specialized sorbent materials a few meters below the surface to capture VOCs, followed by gas chromatography–mass spectrometry (GC-MS) for analysis. Given the range of available adsorbents, selecting materials with optimal performance is critical. We developed a laboratory method to evaluate the adsorption affinity of various commercial and custom-made sorbents toward hydrocarbon mixtures, including nitrogen-, oxygen-, and sulfur-containing derivatives. Using natural crude oil in a simulated microseepage setup, we screened a library of sorbents to identify those most effective for capturing oil-related markers. The complexity of the VOC mixtures required advanced separation, for which we employed two-dimensional high-resolution gas chromatography with time-of-flight mass spectrometry (HR-GCxGC-TOF-MS). The screening revealed clear differences in sorbent performance based on analyte diversity and concentration, assessed through thermal desorption/HR-GCxGC-MS and BET surface area analysis. Two custom sorbents, composed of carbon nanomaterials, outperformed a commercial benchmark in both adsorption capacity and analyte diversity, making them strong candidates for future field deployment in surface geochemical exploration.
1. Introduction
Geochemical prospecting for oil and gas refers to the detection of surface or near-surface hydrocarbons and their alteration products, aiding in the identification of subsurface petroleum accumulations [1]. This approach encompasses a broad set of techniques aimed at detecting hydrocarbons migrating from reservoirs or source rocks, as well as secondary geochemical changes in soils, rocks, and microbial communities. A fundamental premise of surface geochemical exploration is that hydrocarbons present at depth can migrate and leak to the surface. These exploration techniques are generally categorized into two groups: direct and indirect methods [2]. Direct geochemical methods focus on quantifying volatile and liquid hydrocarbons within soils or unconsolidated surface sediments. In contrast, indirect techniques investigate seepage-related alterations in soil chemistry, mineralogy, microbial populations, or vegetation.
Hydrocarbon seepage manifests across a spectrum—from trace-level microseepage to conspicuous oil and gas emissions. “Macroseepage” refers to the occurrence of visible oil or gas at the surface, often associated with fault zones or fractured regions where hydrocarbons migrate readily [3,4]. On the other end, “microseepage” describes ultra-trace levels of volatile or semi-volatile hydrocarbons in surface media such as soils, sediments, or groundwater, detectable only through sensitive analytical instrumentation (Figure 1) [5,6].
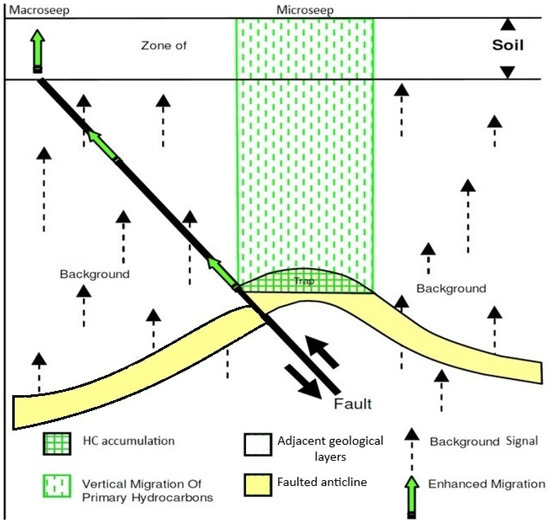
Figure 1.
Schematic representation of the macroseepage and microseepage phenomena.
Many current geochemical exploration approaches emphasize the collection and analysis of soil gases, integrating chemical signals from hydrocarbon microseepage with geological and geophysical (e.g., seismic) datasets [7]. Several methods are employed to detect hydrocarbon microseepage, either by analyzing extracts from soil gas samples [8,9] or through the use of specially engineered materials that can adsorb and subsequently release volatile organic compounds (VOCs) accumulated from the subsurface environment [10,11].
2. Revision of Materials for Volatile Organic Compounds Sensing
Scientific literature has performed attempts to screen commonly used sorbents for optimal sampling of environmental VOCs [12]. Activated coals were by far the most applied sorbents in industrial contexts, followed by porous polymers (mainly Tenax (GL Sciences, GLTechno Holding Inc., Tokyo, Japan), Chromosorb 106 (SKC Ltd., Dorset, UK), etc.), carbon molecular sieves, zeolites, etc. A recent review article [13] analyzed the sorption properties of novel carbonaceous materials with an emphasis on the adsorption type and nature of porosity. It was noticed that the microporous and mesoporous carbons possess superior BET surface areas of up to 3456 m2/g, with high adsorption capacities for hydrocarbons based primarily on the physisorption mechanism. Porous polymers are also known to be among the high performing environmental sampling sorbents [14]. It is important to note that hydrophobic sorbents such as carbon-based porous materials, Tenax, and other porous polymers are much less sensitive to atmospheric humidity [15] and thus are more suitable for the reliable sensing of volatile organic compounds. Additionally, vapor-phase organics should be adsorbed with weak sorbents [15], with the consideration of the thermal stability of materials if further used for thermal desorption of the analytes. Due to the necessity for simultaneous monitoring of the organic steams of multiple polarity, volatility, and nature, environmental passive sampling switched to multi-sorbent tubes and traps [16,17]. The “universal” multi-sorbent sampler [15] should have a bed of weak, medium-strength, and strong sorbents for broad environmental VOC adsorption as, for example, a weak Tenax® TA (GL Sciences, GLTechno Holding Inc., Tokyo, Japan) pad followed by medium graphitized carbon (Carbograph™ 1TD (Markes International Ltd., Bridgend, UK)) and, in turn, backed up by a carbonized molecular sieve (e.g., UniCarb® (LSR Materials GmbH & Co. KG, Neuss, Germany) or Carboxen® 1003 (Markes International Ltd., Bridgend, UK)) that would allow for the sampling of the VOCs and SVOCs ranging from C3 up to C26. A comparison of the adsorption performance of multi-sorbent tubes (Carboxen®-1003 (Markes International Ltd., Bridgend, UK), Carbopack™ B (Markes International Ltd., Bridgend, UK), and Tenax®-TA (GL Sciences, GLTechno Holding Inc., Tokyo, Japan) with single-sorbent tubes (Tenax® TA (GL Sciences, GLTechno Holding Inc., Tokyo, Japan)) clearly demonstrated the advantage of multi-sorbent setups in more accurate and efficient analysis of trace compounds in gas samples [18]. However, these installations mainly work for active sampling of VOCs. It is important to remember [19] that passive sampling of the volatile compounds provides more objective surveillance data with time-weighted average concentrations of the analytes. The paper [20] reported significant differences between performances of the permeation and diffusion passive sampling procedures with sensors based on activated charcoal or Carbograph™ 4 (Markes International Ltd., Bridgend, UK). Switching from broad case environmental VOC sensing towards the soil gas survey [21], a few setups were developed for the subsurface monitoring of total petroleum hydrocarbons that utilize charcoal [22] and ferromagnetic wires, with activated carbon coated to the tip, e.g., the RETREX passive soil gas sampler [23].
Although active development of VOC sensors is ongoing, a conspicuous knowledge gap exists in perfecting the best sorbents for microsepage sensing. This knowledge is proprietary and is utilized by commercial service companies; however, it has not been scientifically or systematically evaluated. Given the typically low concentrations of VOCs and their sensitivity to daily and seasonal variations, extended adsorption periods can improve detection reliability. In this study, we focused on evaluating the adsorption performance of a diverse library of commercial and custom-made materials.
3. Materials and Methods
3.1. Materials
A wide range of adsorbents was examined for their ability to capture volatile organic compounds associated with underlying hydrocarbon systems. These included activated carbons (ACs), porous polymers, composite sorbents combining both, and various types of zeolites.
Commercial activated carbons—SKT, VSK, MeKS, DAS, and FAS—were obtained from JSC “Elektrostal Scientific and Production Association Neorganika” (JSC Neorganika, Elektrostal, Russia). Additional carbon materials such as UPK-B, UNHT, AUkon-s, and a porous polymer sorbent based on cross-linked polystyrene with a crosslinking degree of 150% were synthesized at the Institute of Physical Chemistry, Russian Academy of Sciences (Moscow, Russia) and the Institute of Chemical Technologies IC SB RAS (Omsk, Russia). Single-walled carbon nanotubes (TUBALL™) were supplied by OCSiAl LLC (OCSiAl LLC, Novosibirsk, Russia). A composite sorbent combining activated carbon and porous polymer Tenax GR™ (GL Sciences, GLTechno Holding Inc., Tokyo, Japan) was purchased from Sigma-Aldrich, as were the zeolites/molecular sieves 13X. NaX-type zeolites were obtained from Sorbis Group LLC (Moscow, Russia). Crude oil samples from the Romashkinskoye field were provided by the A.V. Topchiev Institute of Petrochemical Synthesis, RAS, Moscow, Russia.
The volatile organic compounds (VOCs) with purity ≥ 98% used in this study included a homologous series of alkanes (from pentane to docosane), aromatic hydrocarbons (toluene, xylenes, ethylbenzene, propylbenzenes, butylbenzene, hexylbenzene, and octylbenzene), and cycloalkanes (cyclopentane, methylcyclopentane, and methylcyclohexane). All VOCs were sourced from Sigma-Aldrich.
3.2. Method of Determining the Porous Structures of Sorbent Samples
The parameters of the porous structures of the adsorbents were analyzed using data from low-temperature nitrogen adsorption at 77 K (automatic analyzer ASAP 2020) and the equilibrium adsorption of benzene vapor at 293 K (high-vacuum sorption unit with a spring quartz microbalance with a sensitivity of about 20 μg at a load of up to 0.2 g). Before measurements, the samples were preliminarily evacuated to constant weight at a residual pressure of 10−5 Pa and a temperature of 280 °C. The parameters of the microporous structures (micropore volume and size) were determined using the theory of volumetric filling of micropores according to the Dubinin–Radushkevich equation. The specific surface area was calculated in accordance with the BET equation (nitrogen). The parameters of the porous structures of the adsorbents are given in Table 1.

Table 1.
Parameters of the porous structures of sorbent samples.
3.3. Model Mixture of Hydrocarbons for Evaluation of Adsorption Capacities of Sorbents
To determine and evaluate the adsorption capacities of sorbents for hydrocarbons, a model mixture of volatile organic molecules was used for sorbent exposure and the accumulation of VOC vapors. A mixture of standards was prepared using a Sartorius Biohit pipette (Sartorius AG, Göttingen, Germany) for 10–100 µL and a Huawei pipette (Zhejiang Huawei Scientific Instrument Co., Ltd., Taizhou, China) for 1–10 μL.
The composition of the model mixtures includes the following VOC volumes:
Standard Mixture No. 1: methylcyclopentane (10 µL), methylcyclohexane (10 µL), isooctane (15 µL), octane (15 µL), nonane (15 µL), decane (15 µL), benzene (15 µL), toluene (15 µL), ethylbenzene (15 µL), propylbenzene (15 µL), butylbenzene (15 µL), and o-xylene (15 µL).
Standard Mixture No. 2: methylcyclopentane (10 µL), methylcyclohexane (10 µL), heptane (1 µL), isooctane (2 µL), octane (3 µL), nonane (6 µL), decane (8 µL), undecane (10 µL), dodecane (12 µL), tridecane (12 µL), tetradecane (14 µL), pentadecane (14 µL), hexadecane (14 µL), heptadecane (8 mg), octadecane (8 mg), nonadecane (8 mg), eicosane (8 mg), heneicosane (8 mg), docosane (8 mg), benzene (2 µL), toluene (4 µL), ethylbenzene (4 µL), propylbenzene (4 µL), butylbenzene (8 µL), hexylbenzene (10 µL), o-xylene (4 µL), and p-xylene (4 µL).
To identify the most effective sorbents for the sorption and desorption of the model mixture, equal volumes (2 mL) of the sorbents described in the Materials Section 3.1. were used. For comparison, Standard Mixture No. 1—containing compounds with boiling points below 200 °C—was selected. Sampling of the headspace vapors was performed at room temperature (20 °C) using a 1 μL gas-tight syringe.
A high sorbent-to-standard ratio was chosen to help isolate the most promising sorbents. Sorption was carried out over 5 days. Following this, sorbents were preheated for 40 min at 270 °C. Then, 60 μL of the vapors above the sorbents was collected using a gas-tight syringe and injected into the GC-MS system.
3.4. Method of Saturation of Sorbents by Hydrocarbon VOCs
Standards and sorbents were weighed on a Sartorius MC1 Analytic AC 210 S analytical balance (Sartorius AG, Göttingen, Germany). Sorbents with vapor mixtures of standards were kept in a dry-air thermostat. The studied sorbent, with a volume of 1 mL, was placed in a glass bottle with a volume of 28.26 cm3. An aliquot of the standard mixture was taken with a 10 μL dispenser and placed in a 2 mL glass vial. The open vial was then placed in the bottle containing the sorbent. The bottle was sealed with a lid and further isolated from the external environment using parafilm tape. The sealed bottle, containing both the standard and the sorbent, was placed in a thermostat and left for sorption for three days at a temperature of 22 °C, as shown in Figure 2. At the end of the sorption period, the vial containing the mixture of standards was removed from the bottle. The sorbent was weighed to verify consistency in sample volume. Desorption was then performed by placing the sealed vial containing the sorbent on a hotplate preheated to 300 °C. The vial remained sealed to ensure uniform heating. Desorption was carried out over 1.5 h. Before sampling, the gas-tight syringe was preheated on a hotplate to avoid condensation of the standard compounds. A 100 µL gas sample from the headspace above the sorbent was withdrawn using the preheated syringe through the septum of the heated vial. The sample was immediately injected into the injector for analysis.
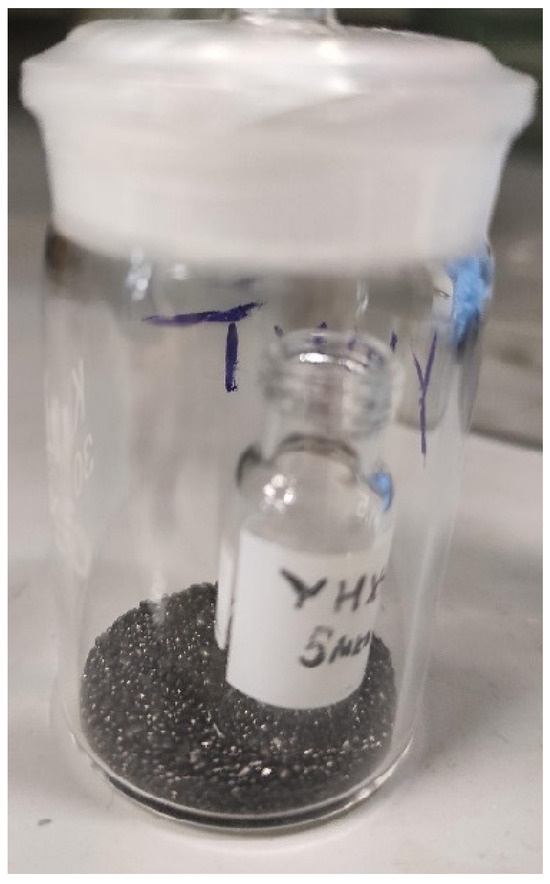
Figure 2.
The setup for exposing the tested absorbent materials to the hydrocarbon mixture.
3.5. Method for GCMS Separation and Detection of Hydrocarbon VOCs Adsorbed on Sorbents
Vapor analysis was carried out using a gas chromatograph coupled with a Shimadzu TQ-8040 mass spectrometer (Shimadzu Corp., Kyoto, Japan) equipped with electron ionization and a quadrupole mass analyzer. An Agilent HP-5MS capillary column (30 m × 0.32 mm, 0.25 μm (Agilent Technologies Inc., Santa Clara, CA, USA); was used for separation. Sampling was performed with a 100 µL gas-tight syringe (Hamilton Co., Reno, NV, USA), and the sorbent was heated on a PL-H heating plate (Primelab, Mytishchi, Russia). For the separation of volatile compounds, the column temperature was held at 30 °C for 5 min. To separate high-boiling oil components, the temperature was increased to 280 °C and held for 4 min. The split ratio was set at 30:1 (sample drop/flow to column). Mass spectrometric detection conditions were as follows: ionization energy 70 eV, ion source temperature 200 °C, interface temperature 250 °C, and injection volume 1 µL. Mass spectra were recorded in scanning mode over a range of 33 to 500 m/z. For analyses involving low-boiling solvents, detection was carried out starting from 2.4 min.
3.6. Passive Sampling of Crude Oil VOCs
All sorption experiments were conducted using crude oil from the Romashkino field. A total of 10 mL of oil was placed at the bottom of a glass container (20 cm in diameter and 50 cm in height). The container was then filled with a 20 cm layer of limestone fragments (5–20 mm fraction) followed by a 20 cm layer of sand. Sorbent samples were enclosed in a Gore-Tex membrane made from thermo-mechanically expanded PTFE (ePTFE) and buried approximately 5 cm deep within the sand layer. The sorbents remained in the container for two weeks. The setup is shown in Figure 3. Passive sampling of VOCs from natural oil vapors was performed by placing a sensor containing activated carbon STK, carbon nanotubes CNTs, sorbents AUkon-s, and Tenax GR on the laboratory microseepage setup loaded with 10 mL of oil and saturating the sorbent with the VOCs for 1–2 weeks. Consecutive GCxGC/MS analysis of the complex mixture of adsorbate allows for the separation, detection, and identification of the mixture composition.
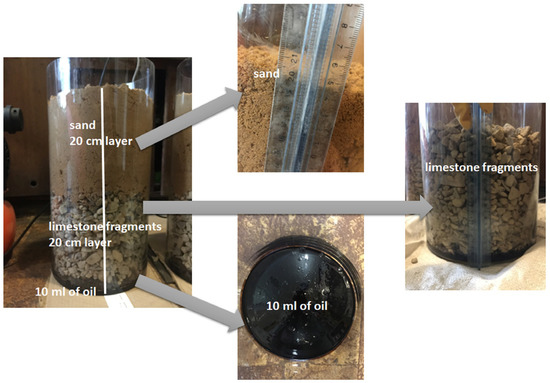
Figure 3.
The laboratory microseepage setup for passive sampling of oil vapors.
3.7. Thermal Desorption and GCxGC/MS Analysis of Crude Oil VOCs
Thermal desorption and two-dimensional gas chromatography–mass spectrometry experiments were performed using a LECO Pegasus BT 4D system (LECO Corp., St. Joseph, MI, USA) equipped with an Agilent 7890A gas chromatograph (Agilent Technologies Inc., Santa Clara, CA, USA) featuring a secondary oven, a flow splitter, a two-stage cryomodulator, and a Gerstel Thermal Desorption Unit (TDU) (GERSTEL GmbH & Co.KG, Mülheim an der Ruhr, Germany). The instrument operated in electron ionization mode (70 eV), the ion source temperature was 200 °C, the mass range was 45–500 Da, the acquisition rate was 100 spectra/s, and the ion extraction rate was 30 kHz. The column configuration included a polar Rxi-17Sil (30 m × 0.25 mm × 0.25 μm) and a non-polar Rxi-5Sil (2 m × 0.10 mm × 0.10 μm). The column oven program was as follows: initial temperature of 50 °C held for 4 min, ramped up to 280 °C at 5 °C/min, and held at the final temperature for 5 min. The temperatures of the secondary oven and the cryomodulator were maintained 20 °C higher than the primary oven temperature. The modulation time was set at 6 s. TDU temperature was set to 300 °C with a desorption time of 120 s. The sample weight was 20 mg. The cooled injection system was maintained at −150 °C, and the transfer line was heated to match the TDU temperature. Compound identification was carried out using the NIST 20 mass spectral database.
4. Results and Discussion
4.1. Selection of the Best Adsorbents from the Library of Porous Materials
To identify the most effective sorbents for the sorption and desorption of the model mixture, equal volumes of the sorbents were used. For comparison, Standard Mixture No. 1 was selected. The TIC chromatographic profile of vapors above the Standard Mixture No. 1 is shown in Figure 4.
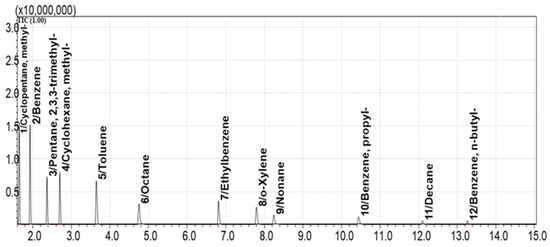
Figure 4.
The total ion chromatogram of Standard Mixture No. 1.
This chromatogram (Figure 4) was compared with the TIC and extracted ion chromatograms (EICs) of vapors collected after sorption on each sorbent from the tested library. EICs were generated for the following characteristic ions: 39, 41, 43, 57, 71, 78, and 91 m/z. These ions correspond to alkanes, cycloalkanes, and aromatic compounds present in Standard Mixture No. 1.
Sorbent selection was based on two key criteria: the number of resolved peaks and the intensity of those peaks. Highly cross-linked polystyrene (Figure 5) showed selective sorption of aromatic compounds (notably, ions 91 and 78 m/z related to xylene); however, more universal sorbents (UNHT, AUkon-s, UPK-B, and DAS) exhibited comparable or greater adsorption of aromatics, and thus polystyrene was excluded from further experiments. Zeolite 13X also showed limited sorption of aromatics, with both the number and intensity of detected compounds being low, so it was not used in subsequent tests. The chromatograms for AUkon-s and DAS (Figure 6 and Figure 7) showed clear signals from aromatics and n-alkanes. Cycloalkanes were also detected in the chromatograms of UPK-B and UNHT (Figure 8 and Figure 9). Based on the preliminary screening, the sorbents selected for further investigation were UNHT, UPK-B, DAS, and AUkon-s.
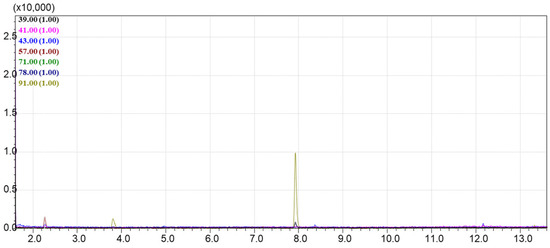
Figure 5.
The extracted ion chromatogram of the vapors over cross-linked polystyrene.
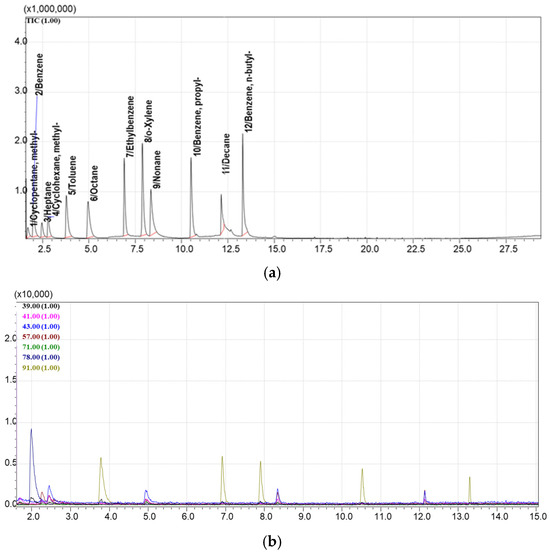
Figure 6.
The total ion chromatogram (a) and extracted ions chromatogram (b) of the vapors over the AUkon-s sorbent.
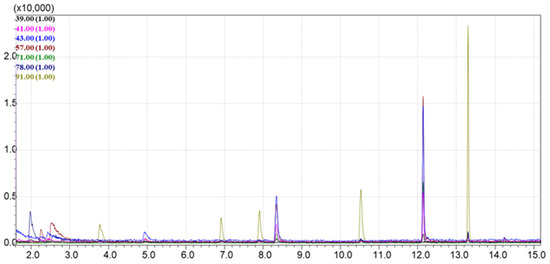
Figure 7.
The extracted ions chromatogram of the vapors over the DAS sorbent.
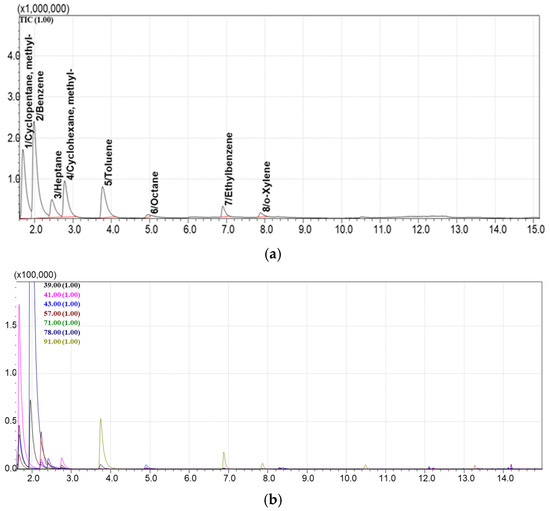
Figure 8.
The TIC (a) and EIC (b) chromatograms of steams over the UNHT sorbent.
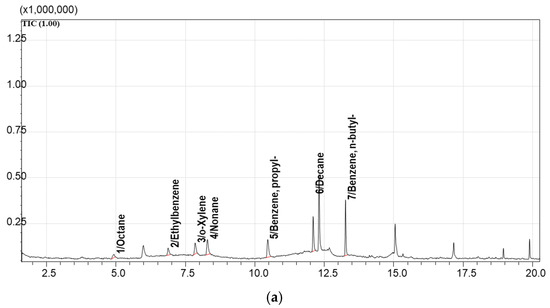
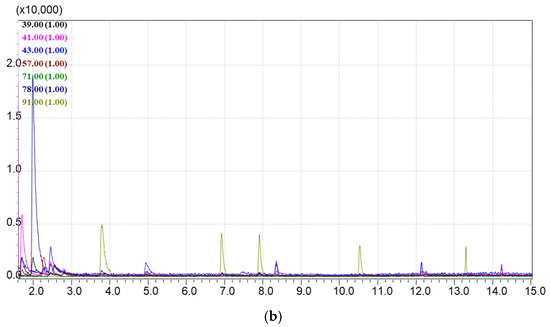
Figure 9.
The TIC (a) and EIC (b) chromatograms of vapors over the UPK-B sorbent.
The chromatogram of the vapors over cross-linked polystyrene (Figure 5) demonstrated very low intensities of analytes adsorbed, except for the extracted pick of xylene. The sorbent was considered as highly specialized and not suitable for monitoring a wide range of hydrocarbons.
The chromatographic profile of the vapors over the AUkon-s sorbent (Figure 6) exhibited good intensity and high adsorption capacity for the model hydrocarbons mixture. This sorbent was ranked as a potential candidate for further exploration.
The chromatographic profile of the vapors over the DAS sorbent (Figure 7) showed moderate-to-good capacity for the model mixture of hydrocarbons, with better selectivity towards aromatic compounds.
The chromatographic profile of the vapors over the UNHT sorbent (Figure 8) showed moderate-to-good adsorption capacity for the model mixture of hydrocarbons with selectivity towards alicyclic and aromatic compounds.
The chromatographic profile of the vapors over the UPK-B sorbent (Figure 9), with a low intensity for the model mixture of hydrocarbons and selectivity towards heavy hydrocarbon derivatives.
The lowest signal intensity in the TIC chromatogram was observed for the DAS sorbent; no significant volatile compounds were detected in the TIC mode, and only the EIC showed low peak intensities, mainly for benzene derivatives and decane (Figure 7). The UPK-B sorbent also showed low intensity in the TIC chromatogram, with a bias toward heavier-molecular-weight compounds (Figure 9).
Among all tested materials, AUkon-s demonstrated the best performance, showing all 12 volatile compounds from Standard Mixture No. 1 in the TIC chromatogram (Figure 6). It exhibited balanced selectivity for both light and heavy components. The UNHT sorbent showed 8 out of 12 compounds from the standard mixture in TIC mode (Figure 8). Thus, the most promising sorbents selected from the screening were AUkon-s and UNHT, which were used in subsequent experiments.
Based on nitrogen adsorption data, AUkon-s is a microporous activated carbon with negligible mesoporosity and a high specific BET surface area of 940 m2/g. The UNHT adsorbent, in contrast, features a well-developed mesoporous structure with an average mesopore diameter of 31 nm (according to the BJH method) and moderate microporosity (Table 1).
4.2. Evaluation of the Adsorption and Desorption Parameters for the Best Selected Sorbents
Varying the VOC adsorption duration for the AUkon-s and UNHT materials—using one-day and multiple-day exposures to Standard Mixture No. 1—revealed that after one day, only a small number of compounds were detected in the chromatogram for extracted ions for the UNHT sorbent. In the chromatogram obtained for the AUkon-s sorbent, the peaks corresponding to the standard compounds were practically absent. When the sorbents were kept for three days and above, the chromatograms for both sorbents showed peaks corresponding to compounds from the standard mixture (Figure 10).
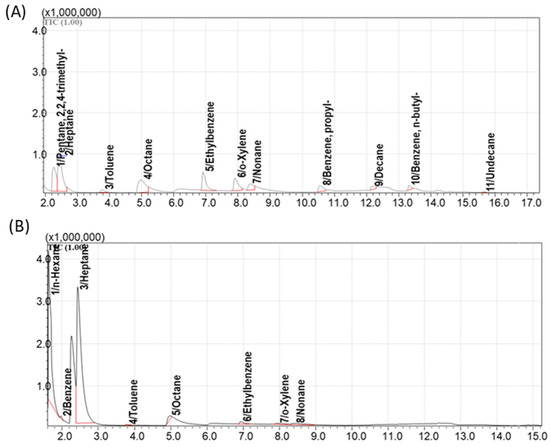
Figure 10.
The profiles for the total ion chromatogram (A) for the sorbent AUkon-s for 3 days and (B) for the sorbent UNHT for 3 days.
To evaluate desorption kinetics, VOC-saturated sorbents exposed to Standard Mixture No. 1 were heated at 300 °C. Vapor samples were taken periodically and analyzed by GC-MS. The first sample was taken after one hour of heating, with additional samples collected every 30 min. Complete desorption was observed within 1.5 h. The optimum vapor sample volume was found to be 100 μL. The minimum detectable mass of compounds ranged from 1 to 7 µg, depending on their boiling point and ionization efficiency.
To evaluate adsorption capacity over a broader analyte range, a more complex VOC mixture (Standard Mixture No. 2, containing 27 compounds) was used. The TIC chromatogram of vapors over this mixture is shown in Figure 11.
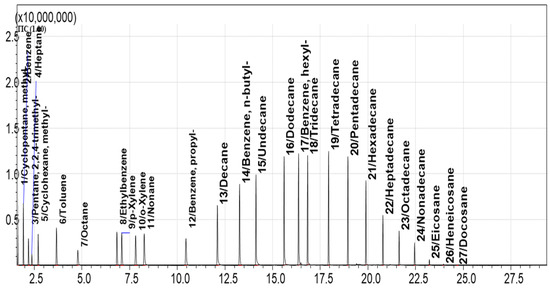
Figure 11.
The TIC chromatogram of Standard Mixture No. 2.
Chromatograms of vapors over the sorbents after exposure to this mixture are compared with that in Figure 11. The EIC chromatogram for AUkon-s showed 16 of the 27 standard compounds. For UNHT, the same compounds were detected, but with peak intensities approximately an order of magnitude lower (Figure 12). The maximum sorbent-to-standard mixture ratio at which qualitative detection was still possible was 1 mL of sorbent per 2 μL of the 27-compound mixture. The minimum detectable mass of compounds adsorbed on AUkon-s under the applied sorption/desorption conditions was approximately 1 μg. For n-alkanes (C7H16 to C12H24), this value ranged from 1 to 7 μg; for aromatic compounds, from 2 to 6 μg. The optimal detection ratio was 1:2 (1 mL of sorbent per 2 μg of analyte).
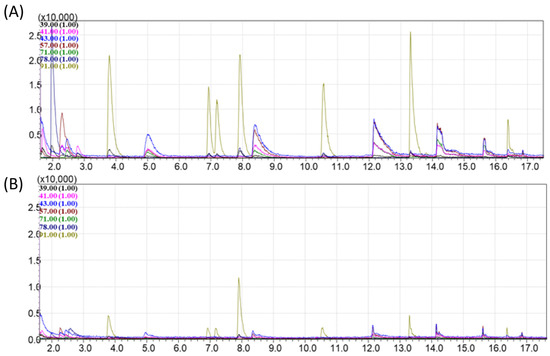
Figure 12.
The EIC chromatograms of vapors adsorbed from Standard Mixture No. 2 with (A) AUkon-s and (B) UNHT sorbents.
Based on this extended screening, AUkon-s was identified as the most effective sorbent and selected for further studies on passive sampling of volatile compounds from crude oil. Additionally, the established VOC sorption and GC-MS analysis protocol was applied to evaluate the performance of the commercial sorbent Tenax GR, which is widely used for VOC monitoring in environmental studies [24,25]. Tenax GR showed good sorption efficiency, confirmed by GC-MS analysis of thermally desorbed vapors after exposure to Standard Mixture No. 2. The TIC chromatogram revealed the detection of 18 out of 27 analytes in the mixture (Figure 13).
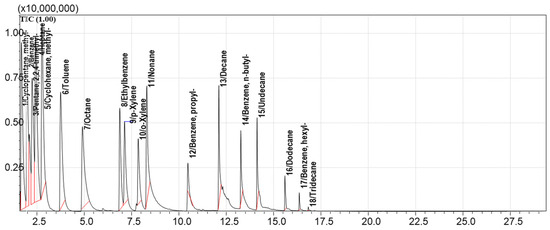
Figure 13.
The TIC chromatogram of vapors adsorbed from Standard Mixture No. 2 with Tenax GR.
4.3. The SEM-Microscopy Characterization of the Surface of the Best-Performing Adsorbents and Their Composition
Scanning electron microscopy was used to investigate the surface of the best-performing absorbents and determine the morphology and variety of textures of the materials. The Tenax GR sorbent demonstrated a uniform granular structure at low magnification, with granules approximately 0.2 mm in size (Figure 14). At high magnification, zones with layered structures and fibrous inclusions were exhibited that could correspond to carbon-based nanomaterials incorporating polymer fibers. This is consistent with the composition of Tenax GR, which contains 2,6-diphenyl-p-phenylene oxide polymer and graphitic carbon.
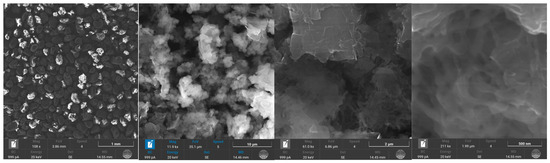
Figure 14.
Scanning electron microscopy of the Tenax GR adsorbent at various magnifications (1 mm, 10 µm, 2 µm, and 500 nm).
AUkon-s exhibited a non-uniform distribution of solid adsorbent particles ranging in size from several hundred to several tens of µm (Figure 15). These particles have well-developed surfaces with layers of amorphous activated carbon.
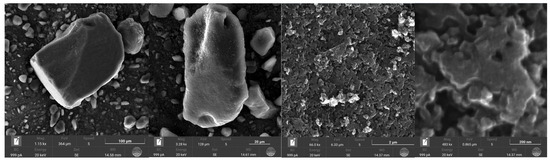
Figure 15.
Scanning electron microscopy of the AUkon-s adsorbent at various magnifications (100 µm, 20 µm, 2 µm, and 200 nm).
Open-sourced SEM data for SWCNTs demonstrated that carbon nanotubes have a diameter of 1.6 (±0.4) nm, a length of > 5 µm, and the composition of single-walled carbon nanotubes consists of graphite (Figure 16).
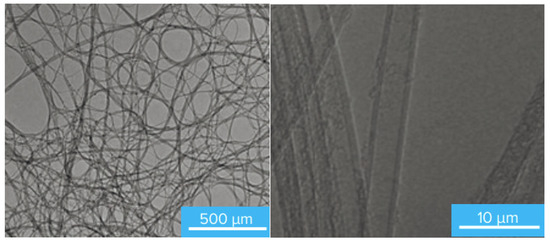
Figure 16.
Open-sourced scanning electron microscopy of the SWCNTs at various magnifications (500 µm and 10 µm). Courtesy of https://ocsial.com/media/file/2024/01/04/CATALOG_ENG_23.12.pdf (accessed on 1 April 2024).
Thus, the best-performing materials—oil and gas VOC adsorbents with a high affinity for aliphatic, alicyclic, and aromatic hydrocarbons—exhibit the nature of carbon-based nanomaterials with a well-developed surface of nano-sized scale.
4.4. The Passive Sampling of VOCs from Natural Oils in Laboratory Conditions
The principle of passive sampling relies on the diffusion-driven transport of VOC molecules from air onto the sorbent, where they are retained due to higher affinity. This enables the accumulation of analytes over time, which is particularly valuable when time-averaged concentrations are low [11].
Passive sampling of VOCs from natural oil vapors and consecutive GCxGC/MS analyses of the complex mixture of adsorbate allows for the separation, detection, and identification of the mixture composition. Three customized sorbents including activated carbon STK, carbon nanotubes CNTs, and AUkon-s were exposed to oil VOCs and compared with the commercial benchmark Tenax GR. The results of the sensing experiments in a simulated microseepage setup showed that all selected sorbents successfully accumulated a wide range of hydrocarbons, including alkanes, cycloalkanes, and aromatic compounds (Table S1, Figure 17). A comparison of the number of identified compounds, as shown in Figure 17 and Table S1, revealed that activated carbon STK exhibited the poorest performance. Experiments involving repeated thermal desorption indicated that the selected desorption temperature did not ensure complete analyte release, as residual compounds were still detected. Since higher desorption temperatures risk degrading thermally labile analytes, the use of this sorbent was considered less favorable. The total number of analytes identified from the tested sorbents increased in the following order: activated carbon STK—24 compounds, commercial Tenax GR—48 compounds, AUkon-s—71 compounds, and TUBALL CNTs—90 compounds.
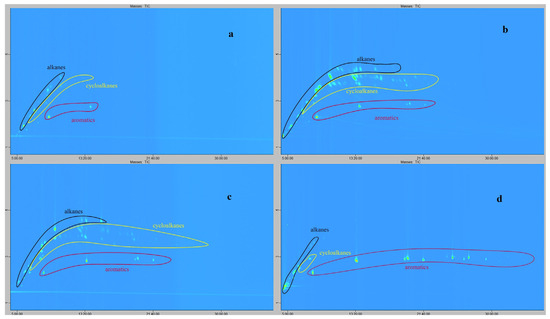
Figure 17.
2D visualization of GCxGC/MS chromatograms of VOCs sorbed from crude oil by sensors with STK (a), CNTs (b), AUkon-s (c), and Tenax GR (d).
The results for Tenax GR demonstrated its superior performance in adsorbing aromatic hydrocarbons. Although CNTs and AUkon-s enabled the detection of a greater total number of organic compounds, Tenax GR exhibited a more diverse profile of aromatic analytes. The hydrocarbon adsorption profiles for CNTs and AUkon-s were similar; however, CNTs enabled the identification of a slightly higher number of compounds.
4.5. Temperature Effects on Sorbent Selection and Thermal Desorption Protocol
Evaluation of the sorbents for the microseepage sensing should consider thermal desorption as the subsequent stage in the workflow for detecting marker analytes. The importance of the thermal stability of the applied sorbents and sealants for sorbent placement results in an adequate survey without contamination by extra signals from decomposed sensor materials. In this regard, carbon nanomaterials are the optimal choice, as their thermal stability exceeds 400 °C [26], which is sufficient for the desorption of common VOCs at 300 °C in the proposed technique. Guidance for thermal desorption should include the following [15]:
- Reliable sealing of the sample before analysis.
- Automated and stringent leak testing.
- Complete desorption of the analytes.
4.6. Laboratory Safety and Environmental Concerns for Sorbent-Based Microseepage Sensing
Highly selective sorbents can detect traces of volatile compounds and contaminants at every stage, from the estimation of VOC sources to VOC sampling and detection protocols. This underscores the importance of pretreating sorbents before sensor placement to ensure that active materials are exposed only to target analytes. Personal protective equipment (PPE) and laboratory safety protocols must be followed at every stage of the sensing workflow. Hermetically insulating samples from external media before and after VOC exposure enables precise exploration and clear detection of the microseep source. Anthropogenic contamination and environmental artifacts could accompany laboratory-conducted analyses and upscaling technologies when applied in the field. Databases of common industrial contaminants, including gasoline (from underground storage tank leaks), technogenic waste, agricultural fertilizers, and household pollutants could clarify background noise and identify areas of interest. Conversely, identifying polluted areas could help map zones in need of ecological remediation and expand the application of this work to industrial piloting for environmental monitoring and oil exploration and production.
4.7. Field Validation and Future Directions for Sorbent-Based Microseepage Detection
Due to the complex composition of crude oil and gas, which includes saturated hydrocarbons, aromatics, resins, and asphaltenes, designing sorbents that can capture the full molecular range remains a critical challenge [27,28]. Our laboratory screening revealed that AUkon-S and TUBALL carbon nanotubes (CNTs) have a broad adsorption capacity and outperform commercial and custom benchmarks. The next phase of our research will involve deploying these sorbents in the field in areas with confirmed hydrocarbon accumulations. This will allow us to evaluate their selectivity, durability, and efficiency under natural conditions. These studies will expand upon earlier field investigations that examined the impact of sampling depth on microseepage detection accuracy [11]. However, the focus will now shift toward understanding how sorbent type and surface properties influence VOC recovery in heterogeneous environments, which is essential for refining material design and operational protocols.
In parallel, integrating sorbent-based VOC detection with elemental geochemical approaches could significantly improve signal interpretation and anomaly resolution. Previous studies have demonstrated that linking biomarkers with trace element patterns can reveal depositional and diagenetic controls on organic matter and hydrocarbon migration [29]. Furthermore, incorporating techniques such as mobile metal ion analysis, which has been successful in mapping near-surface geochemical halos associated with subsurface mineralization, can provide a complementary perspective when applied to petroleum systems [30]. Combining molecular-level hydrocarbon detection with elemental anomalies could enhance our ability to distinguish true seepage from background noise, reduce false positives, and improve targeting accuracy in exploration campaigns.
Beyond their technical implications, these advancements meaningfully contribute to reducing the environmental impact of exploration. Improving the resolution and reliability of geochemical prospecting reduces reliance on risky drilling and can lower the number of dry wells, thereby cutting emissions, operational costs, and surface disturbance. In this context, using high-performance sorbents in passive VOC sensing is a scalable, low-footprint alternative to conventional methods. Coupled with advanced GCxGC/MS analysis, this approach supports a more data-driven, efficient, and carbon-conscious exploration paradigm that aligns with the growing need to balance resource development with environmental responsibility.
5. Conclusions
A comprehensive evaluation of a library of custom-made and commercial sorbents was conducted to identify the most effective porous materials for passively accumulating oil field vapors under laboratory conditions. Microporous carbon-based materials, such as AUkon-S and TUBALL CNTs, demonstrated the highest performance in simulated microseepage environments. These leading sorbents exhibited high hydrocarbon adsorption capacity and well-developed specific surface areas with micro- and mesoporosity. Sorbents with higher specific surface areas accumulated a greater number of analytes, spanning aliphatic, alicyclic, and aromatic hydrocarbon classes. Based on these findings, AUkon-S and CNT-based sorbents were selected as the most promising materials for future deployment in oil and gas exploration settings. Furthermore, the proposed sensing technology could address a broader spectrum of environmental issues. VOC surveillance based on highly selective marker sorbents could benefit soil remediation monitoring, carbon burial site observations, and fossil fuel leakage detection from underground storage and production sites [31]. Complex monitoring schemes could provide a global approach to the exploration and control of hydrocarbon production and storage.
6. Patents
The materials presented in this work and their proposed applications are covered by IP WO2024237802A1 [32].
Supplementary Materials
The following supporting information can be downloaded at: https://www.mdpi.com/article/10.3390/pr13113703/s1, Table S1: The list of VOCs identified from vapors of oil accumulated by STK, CNTs, AUkon-s and Tenax GR sorbents.
Author Contributions
Conceptualization, V.S., M.O. and I.A.; methodology, G.P., V.G. and R.B.; software, R.B.; validation, A.K., I.P. and R.B.; formal analysis, M.A.A.; investigation, I.P. and R.B.; resources, V.S., M.O. and I.A.; data curation, I.A., V.S. and R.B.; writing—original draft preparation, G.P., R.B. and V.S.; writing—review and editing, V.S. and I.A.; visualization, R.B., V.G. and G.P.; supervision, I.A., V.S., R.B. and M.O.; project administration, I.A.; funding acquisition, V.S. and M.O. All authors have read and agreed to the published version of the manuscript.
Funding
This research received no external funding.
Data Availability Statement
The original contributions presented in this study are included in the article. Further inquiries can be directed to the corresponding author.
Acknowledgments
The authors would like to thank Aleksey Konstantinovich Buryak for insightful comments on the project’s implementation and valuable assistance with project discussions.
Conflicts of Interest
Authors Vera Solovyeva, Maxim Orlov and Vyacheslav Grokhovsky were employed by Aramco Innovations LLC. The remaining authors declare that the research was conducted in the absence of any commercial or financial relationships that could be construed as a potential conflict of interest.
References
- Schumacher, D. (Ed.) Hydrocarbon Migration and Its Near-Surface Expression. In Proceedings of the Overgrowth of the AAPG Hedberg Research Conference, Vancouver, BC, Canada, 24–28 April 1994; American Association of Petroleum Geologists: Tulsa, OK, USA, 1996. [Google Scholar]
- Chapter 10. Geochemical Methods of Exploration for Petroleum and Natural Gas. In Developments in Petroleum Science; Elsevier: Amsterdam, The Netherlands, 1975; Volume 1, pp. 307–341. [CrossRef]
- Abrams, M.A. Microseepage vs. Macroseeepage: Defining Seepage Type and Migration Mechanisms for Differing Levels of Seepage and Surface Expressions. In 2019 AAPG Hedberg Conference: Hydrocarbon Microseepage: Recent Advances, New Application, and Remaining Challenges; American Association of Petroleum Geologists: Tulsa, OK, USA, 2019. [Google Scholar] [CrossRef]
- Asadzadeh, S.; De Souza Filho, C.R. Spectral remote sensing for onshore seepage characterization: A critical overview. Earth-Sci. Rev. 2017, 168, 48–72. [Google Scholar] [CrossRef]
- Tedesco, S.A. Concepts of Microseepage. In Surface Geochemistry in Petroleum Exploration; Springer: New York, NY, USA, 1995; pp. 18–31. [Google Scholar] [CrossRef]
- Solovyeva, V.; Orlov, M.; Atwah, I.; Abu Alreesh, M. Custom-Made Sorbent-Based Sensors for Subsurface Microseepage of Volatile Organic Markers of Oil and Gas Fields. Presented at the 3rd International Electronic Conference on Processes—Green and Sus-tainable Process Engineering and Process Systems Engineering (ECP 2024). Proceedings 2024, 105, 137. [Google Scholar] [CrossRef]
- Schumacher, D. Integrating Hydrocarbon Microseepage Data with seismic Data Doubles Exploration Success. In Proceedings of the 34th Annual Convention of the Indonesian Petroleum Association (IPA), Jakarta, Indonesia, 18–20 May 2010. [Google Scholar] [CrossRef]
- Horvitz, L. ON GEOCHEMICAL PROSPECTING—I. Geophysics 1939, 4, 210–228. [Google Scholar] [CrossRef]
- Conolly, J.R.; Moffitt, R.S.; Adams, N.P. Soil-Gas Microseepage Surveys Help Locate New Oil and Gas Accumulations; Petroleum Exploration Society of Australia (PESA): Beaumaris, VIC, Australia, 2012. [Google Scholar]
- Schrynemeeckers, R. Combining Surface Geochemical Surveys and Downhole Geochemical Logging for Mapping Hydrocarbons in the Utica Shale. In Proceedings of the AAPG Annual Convention and Exhibition, Houston, TX, USA, 6–9 April 2014; AAPG Publisher: Tulsa, OK, USA, 2014. [Google Scholar]
- Atwah, I.; AlSaif, M.; Yeadon, A.; Srinivasan, P. Depth dimension in seepage detection: Insights for exploration and geological gas storage surveillance. Geoenergy Sci. Eng. 2024, 243, 213242. [Google Scholar] [CrossRef]
- Harper, M. Sorbent trapping of volatile organic compounds from air. J. Chromatogr. A 2000, 885, 129–151. [Google Scholar] [CrossRef]
- Kyriakopoulos, G.L.; Tsimnadis, K.; Sebos, I.; Charabi, Y. Investigating the Effect of Pore Size Distribution on the Sorption Types and the Adsorption-Deformation Characteristics of Porous Continua: The Case of Adsorption on Carbonaceous Materials. Crystals 2024, 14, 742. [Google Scholar] [CrossRef]
- Kyriakopoulos, G.; Doulia, D.; Anagnostopoulos, E. Adsorption of pesticides on porous polymeric adsorbents. Chem. Eng. Sci. 2005, 60, 1177–1186. [Google Scholar] [CrossRef]
- Woolfenden, E. Sorbent-based sampling methods for volatile and semi-volatile organic compounds in air. Part 2. Sorbent selection and other aspects of optimizing air monitoring methods. J. Chromatogr. A 2010, 1217, 2685–2694. [Google Scholar] [CrossRef]
- Brown, V.M.; Crump, D.R. An investigation into the performance of a multi-sorbent sampling tube for the measurement of VVOC and VOC emissions from products used indoors. Anal. Methods 2013, 5, 2746. [Google Scholar] [CrossRef]
- Ho, S.S.H.; Wang, L.; Chow, J.C.; Watson, J.G.; Xue, Y.; Huang, Y.; Qu, L.; Li, B.; Dai, W.; Li, L.; et al. Optimization and evaluation of multi-bed adsorbent tube method in collection of volatile organic compounds. Atmospheric. Res. 2018, 202, 187–195. [Google Scholar] [CrossRef]
- Choi, Y.; Kim, K.; Lee, T.; Kim, D. Practical Application of a Multi-Bed Adsorbent Tube Coupled with GC-MS for Low-Level VOCs Identification to Achieve Comprehensive Odor Management. Atmosphere 2022, 13, 1457. [Google Scholar] [CrossRef]
- Smith, P.A. Intra-workday fluctuations of airborne contaminant concentration and the time-weighted average. J. Occup. Environ. Hyg. 2022, 19, 742–758. [Google Scholar] [CrossRef]
- Zabiegała, B.; Sărbu, C.; Urbanowicz, M.; Namieśnik, J. A Comparative Study of the Performance of Passive Samplers. J. Air Waste Manag. Assoc. 2011, 61, 260–268. [Google Scholar] [CrossRef]
- Odencrantz, J.E.; O’Neill, H. Passive to active tie-in for soil gas surveys: Improved technique for source-area, spatial variability, remediation-monitoring, and vapor-intrusion assessment. Remediat. J. 2009, 19, 71–83. [Google Scholar] [CrossRef]
- Marrin, D.L.; Kerfoot, H.B. Soil-gas surveying techniques. Environ Sci Technol. 1988, 22, 740–745. [Google Scholar] [CrossRef] [PubMed]
- Gomes, D.C.; Alarsa, M.; Salvador, M.C.; Kupferschmid, C. Environmental Soil and Ground Water Assessment Using High Resolution Passive Soil-Gas Samplers—Petrex Method: Methodology and Results of a Case Study Performed in Brazil. Water Sci. Technol. 1994, 29, 161–172. [Google Scholar] [CrossRef]
- Tolnai, B.; Gelencsér, A.; Gál, C.; Hlavay, J. Evaluation of the reliability of diffusive sampling in environmental monitoring. Anal. Chim. Acta 2000, 408, 117–122. [Google Scholar] [CrossRef]
- Gelencsér, A.; Kiss, G.; Hlavay, J.; Hafkenscheid, T.L.; Peters, R.J.B.; De Leer, E.W.B. The evaluation of a tenax GR diffusive sampler for the determination of benzene and other volatile aromatics in outdoor air. Talanta 1994, 41, 1095–1100. [Google Scholar] [CrossRef]
- Bannov, A.G.; Popov, M.V.; Kurmashov, P.B. Thermal analysis of carbon nanomaterials: Advantages and problems of interpretation. J. Therm. Anal. Calorim. 2020, 142, 349–370. [Google Scholar] [CrossRef]
- Atwah, I.; Sweet, S.; Pantano, J.; Knap, A. Light Hydrocarbon Geochemistry: Insight into Mississippian Crude Oil Sources from the Anadarko Basin, Oklahoma, USA. Geofluids 2019, 2019, 2795017. [Google Scholar] [CrossRef]
- Srinivasan, P.; Arguello, E.M.E.; Atwah, I. Evaluating the reliability of solid phase extraction techniques for hydrocarbon analysis by GC–MS. J. Chromatogr. A 2024, 1737, 465435. [Google Scholar] [CrossRef]
- Atwah, I.; Adeboye, O.O.; Zhang, J.; Wilcoxson, R.; Marcantonio, F. Linking biomarkers with elemental geochemistry to reveal controls on organic richness in Devonian-Mississippian mudrocks of Oklahoma. Palaeogeogr. Palaeoclimatol. Palaeoecol. 2023, 611, 111355. [Google Scholar] [CrossRef]
- Mann, A.W.; Birrell, R.D.; Mann, A.T.; Humphreys, D.B.; Perdrix, J.L. Application of the mobile metal ion technique to routine geochemical exploration. J. Geochem. Explor. 1998, 61, 87–102. [Google Scholar] [CrossRef]
- Belousov, A.; Lushpeev, V.; Sokolov, A.; Sultanbekov, R.; Tyan, Y.; Ovchinnikov, E.; Shvets, A.; Bushuev, V.; Islamov, S. Experimental Research of the Possibility of Applying the Hartmann–Sprenger Effect to Regulate the Pressure of Natural Gas in Non-Stationary Conditions. Processes 2025, 13, 1189. [Google Scholar] [CrossRef]
- Atwah, I.; Solovyeva, V.; Orlov, M. Methods and Systems for Detecting Hydrocarbon Microseepage from Deep Geological Formations. Patent WO/2024/237802, 21 November 2024. [Google Scholar]


Disclaimer/Publisher’s Note: The statements, opinions and data contained in all publications are solely those of the individual author(s) and contributor(s) and not of MDPI and/or the editor(s). MDPI and/or the editor(s) disclaim responsibility for any injury to people or property resulting from any ideas, methods, instructions or products referred to in the content. |
© 2025 by the authors. Licensee MDPI, Basel, Switzerland. This article is an open access article distributed under the terms and conditions of the Creative Commons Attribution (CC BY) license (https://creativecommons.org/licenses/by/4.0/).