Article

Dynamic Escape Path Optimization Model Study Based on Spatio-Temporal Evolution of Coal Mine Water Inrush

1
General Research Institute of Coal Science, Beijing 100013, China
2
China Coal Science and Industry Xi’an Research Institute Co., Ltd., Xi’an 710065, China
3
Faculty of Engineering, China University of Geosciences, Wuhan 430074, China
*
Author to whom correspondence should be addressed.
Processes 2025, 13(11), 3666; https://doi.org/10.3390/pr13113666 (registering DOI)
Submission received: 15 September 2025 / Revised: 7 November 2025 / Accepted: 10 November 2025 / Published: 12 November 2025
(This article belongs to the Topic Green Mining, 3rd Edition)

Abstract

To reduce the risk of coal mine water inrush, a dynamic escape path optimization model based on the spatio-temporal evolution of the water inrush is studied. The actual coal mine is simplified into roadway nodes and segments to meet the real-time simulation of the coal mine water inrush, where the computational cost is reduced significantly while the accuracy is acceptable. To solve the control equations of the open channel flow and full channel flow efficiently, the lattice Boltzmann method is adopted to simulate the spatio-temporal evolution of the water inrush. Different from the previous studies, the spatio-temporal evolution of the water inrush is taken into account, which is closer to the actual case. The escape speed is not static, which is affected by the water depth dynamically; meanwhile, the effect of the physical energy reduction is considered. To validate the dynamic escape path optimization model based on the spatio-temporal evolution of the coal mine water inrush, three case studies are conducted. In the first case, there is one water inrush point and one person, while in the second case, there are two water inrush points and four persons; the third case is an actual coal mine with multiple water inrush points. We defined two indicators to evaluate the risk of the escape path quantitatively; they are the window escape time and rescue priority. By conducting the dynamic programming of the escape path, the optimal escape path is selected, where the effectiveness of the dynamic escape path optimization model is validated. The present work is helpful in reducing the risk of coal mine water inrush and improving the safety of the early warning system.

1. Introduction

Nowadays, coal resources are more and more irreplaceable with the development of industrialization and urbanization [1,2]. Therefore, it is important to pay attention to coal mine water hazards, which seriously threaten coal mine production safety [3,4,5,6]. Adopting experimental analysis and numerical simulation, coal mine water inrush is studied widely [7,8,9,10,11,12,13,14,15,16]. Wu et al. [7] analysed the research progress of coal mine water inrush, including basic theory, hydrogeology exploration, and advanced detection and monitoring. Wang et al. [8] adopted advanced techniques to investigate the water movement in mining environments, utilized hydrostratigraphic imaging to identify preferential flow paths of water inrush in coal mining areas. Zhang et al. [9] conducted a risk assessment of water inrush in coal mines by using the variable-weight model, which showed the importance of risk assessment in the mitigation of water inrush. Zhu et al. [10] assessed the risk of water inrush in the Ordos basin using the FAHP-EM method, which emphasized the importance of understanding the risk of water inrush in specific geological formations. Huang et al. [11] studied the mechanism of water inrush in tunnel fracture zones in Karst areas under the action of the fluid–solid coupling field, emphasizing the effect of tunnel excavation on the rock seepage field. Li et al. [12] assessed the risk of water inrush at the top slab offshore, emphasizing the importance of considering geological factors in risk assessment models to prevent offshore water inrush accidents.
To prevent and control water-related disasters in coal mine production, it is important to understand influencing factors on coal mine water inrush [17,18,19,20]. Gu et al. [17] studied key indexes to evaluate the risk of water inrush, suggesting values for the average water-resistance strength of different lithologies. Hou et al. [18] provided a comprehensive risk evaluation method by considering the aquifer thickness, lithology structure index and permeability coefficient. Liu et al. [19] studied geostress conditions in the Kailuan mine area, understanding that the geostress field was necessary for the prevention and control of water inrush events. Wang et al. [20] developed a multi-factor identification model for the real-time monitoring and early warning of water inrush in mines, which was used to predict and prevent water-related disasters in mining operations.
The previous studies contribute to the understanding of influencing factors of coal mine water inrush and provide valuable insights for the development of water disaster prevention strategies in mining operations. To reduce the risk of water inrush accidents and improve coal mine production safety, it is necessary to study the escape path optimization in the event of coal mine water inrush [21,22,23,24]. Cai et al. [21] presented a mine water inrush rescue route model, where the undirected map and adjacency list were used to describe and store the mine roadway network. Li et al. [22] developed a reference technical framework for the emergency evacuation of underground space workers, which combined mixed reality technology. To optimize the traditional Dijkstra algorithm, Xie et al. [23] introduced the time equivalent length. To overcome limitations of conventional static topological models, Chen et al. [24] simplified underground mine tunnels to construct a graph structure model, which achieved the rapid automatic generation of escape routes. However, the previous studies are limited. Firstly, the spatio-temporal evolution of coal mine water inrush is not taken into account; in the event of water inrush, the water depth is not static, but varies with the position and time dynamically, affecting the escape path optimization significantly. Secondly, the escape speed is not constant, which is affected by the water depth; when the water depth is above the critical water depth, the path is uncrossable. Without considering the two influencing factors, the previous studies are inevitably inconsistent with the actual case. To reduce the risk of coal mine water inrush, a dynamic escape path optimization model based on the spatio-temporal evolution of the coal mine water inrush is studied, which is closer to the actual case. Firstly, the spatio-temporal evolution of the coal mine water inrush is introduced. Next, the lattice Boltzmann method is adopted to solve the control equations of the open channel flow and full channel flow efficiently. Then, the relationship between the escape speed and water depth is discussed; meanwhile, the effect of the physical energy reduction is considered. Lastly, to validate the effectiveness of the dynamic escape path optimization model, two case studies are conducted; one is a single-person case while the other is a multiple-person case.

2. Spatio-Temporal Evolution of Coal Mine Water Inrush

During the process of water spreading in the mine roadway, different patterns are presented with different locations of the mine. Figure 1 shows the open-channel flow and full-channel flow. When the water depth at a certain location in the mine is less than the height of the mine, the movement of the water presents a one-dimensional open-channel flow. When the water depth is greater than the height of the mine, the flow of the water presents a one-dimensional full-channel flow. The control equations of the open-channel flow and full-channel flow are established, respectively, which reflect the spatio-temporal evolution of the coal mine water inrush.
The non-constant flow control equations of the open-channel flow satisfy the laws of mass conservation and momentum conservation. It is assumed that the surge water is incompressible and distributed along the section of the roadway section uniformly; the head loss along the course caused by the friction is expressed according to the constant flow equation. Based on the laws of mass conservation and momentum conservation, the continuity equation and motion equation of the open-channel flow are
H t + 1 B Q x = 0
Q t + x β Q 2 A + A g Z x + g n 2 Q 2 A R 4 / 3 + α Q 2 2 A = 0
where A = B H is the cross-sectional area of the water, B is the width of the mine roadway, H is the water depth, Q is the instantaneous flow, R is the hydraulic radius, Z = H + Z 0 is the water level, Z 0 is the bottom plate elevation, g is the gravity constant, n is the roadway wall roughness coefficient, t is the time, x is the distance along the course, α is the energy loss coefficient, and
β = 1 , Fr 0.5 2 ( 1 Fr ) , 0.5 < Fr < 1 0 , Fr 1
is the Froude number Fr adjustment factor [25,26]. When the water depth in the roadway is greater than the height of the roadway section, the water flow in the roadway presents a pressurized state. According to mass conservation and momentum conservation, the continuity equation and motion equation of the full channel flow [27,28] are
H * t + 1 B * Q x = 0
Q t + x β Q 2 A + A g H * x + g n 2 Q 2 A R 4 / 3 + α Q 2 2 A = 0
where B * = A g / a 2 is the effective width of the mine roadway, H * = P / ( ρ g ) is the effective water depth, P is the pressure of the water under the full-channel flow,
a = 1 / ρ 1 ρ d ρ d P + 1 A d A d P
is the water strike wave under the full-channel flow, and ρ is the density of the water.
To solve the control equations of the open-channel flow and full-channel flow efficiently, the lattice Boltzmann method is adopted to simulate the spatio-temporal evolution of the water inrush, which is validated by the previous studies [29,30,31,32]. Instead of discretizing the macroscopic governing equations directly, to solve the fluid flow, the lattice Boltzmann method traces the evolution of the distribution function representing the fluid element, namely,
f i ( x + c i δ t ) = f i ( x , t ) 1 τ ( f i f i e q )
where f i ( x , t ) is the distribution function at position x and time t, f i e q is the equilibrium distribution function, τ is the dimensionless relaxation time, and δ t is the time step. The D1Q5 (1-dimension and 5-velocity) model is adopted for the one-dimensional simulation, while the D3Q19 (3-dimension and 19-velocity) model is adopted for the three-dimensional simulation. The fluid density and velocity are calculated by
ρ = i f i
u = 1 ρ i c i f i
where ρ and u are the fluid density and velocity, respectively. Through the Chapman–Enskog analysis, the control equations of the coal mine water inrush are recovered.
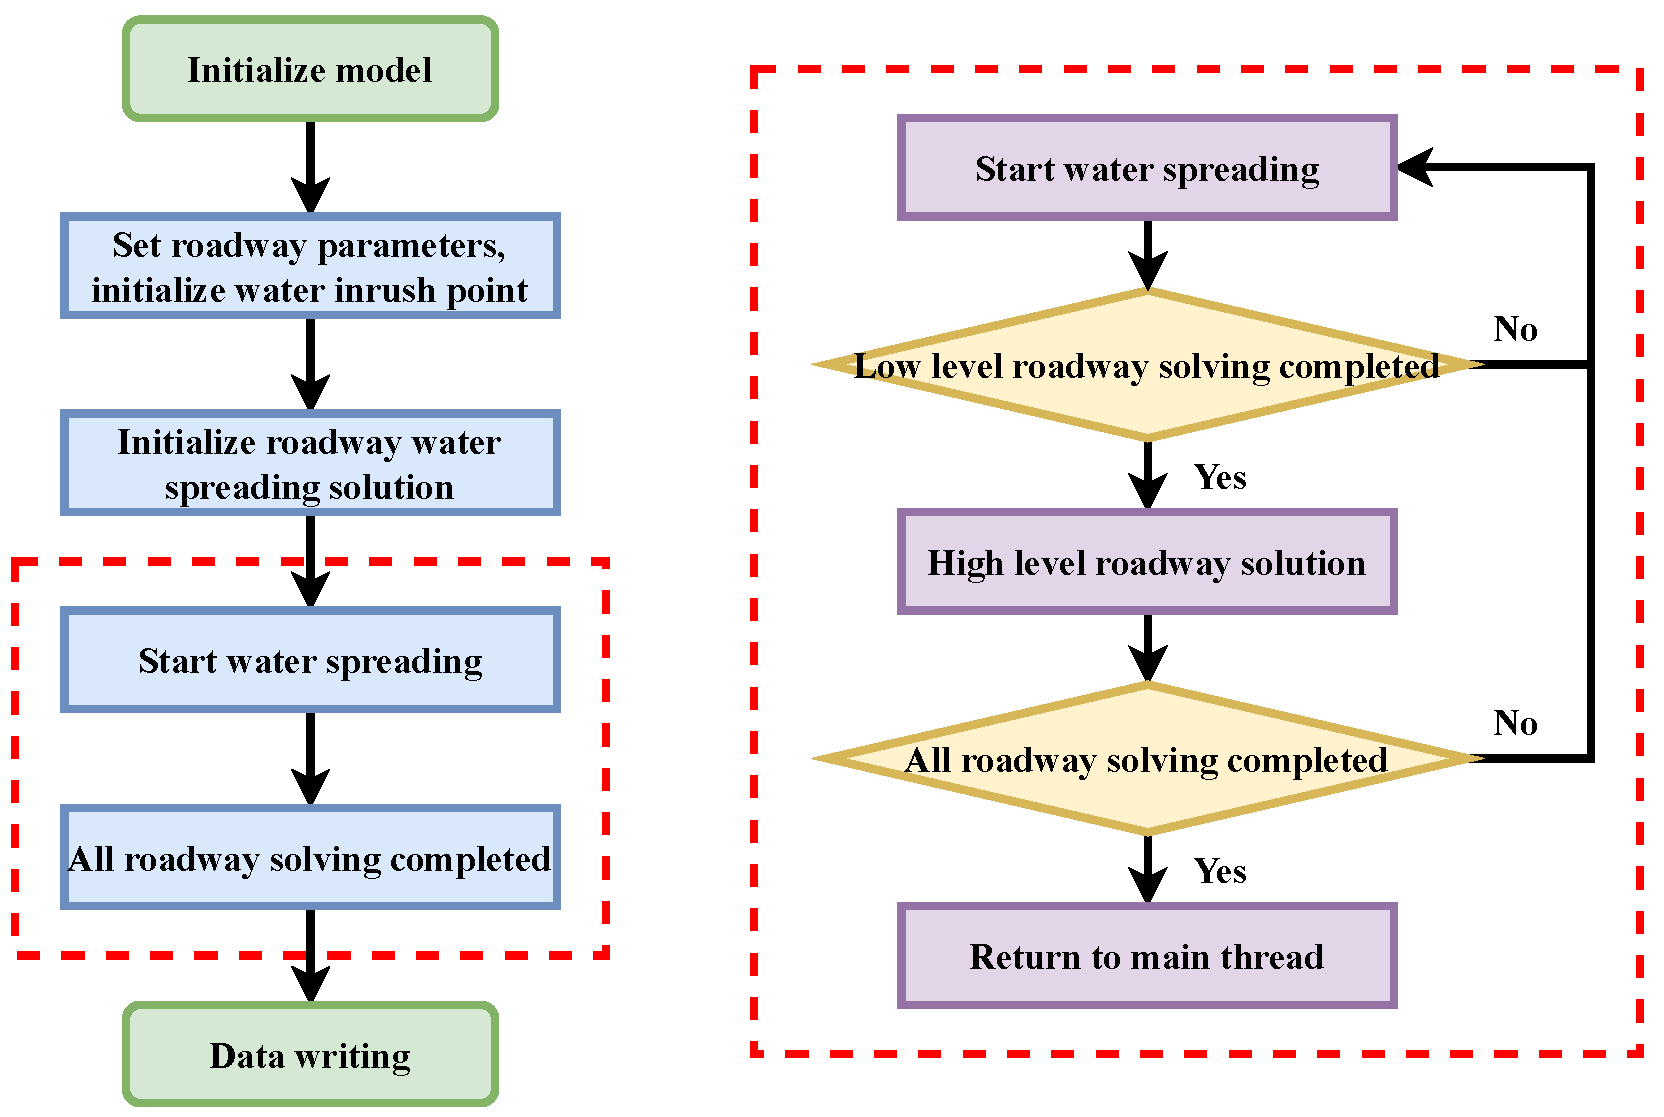
Figure 2 shows the flow chart of the spatio-temporal evolution of the coal mine water inrush. Firstly, initialize the mine roadway model; extract coordinates, elevation, section shape and roadway connection of the key sections in the mine; and assign the extracted data to the roadway nodes and segments. Secondly, initialize the water inrush point; set the water inrush point water influx volume, flow curve, and spatial coordinates. In the initial roadway spreading solution stage, the surge water spreads to the two ends of the roadway. After entering the step of assigning threads, assess the roadways adjacent to the end of the roadway with spreading water; the water surge spreads to the low-level roadways in priority, followed by the high-level adjacent roadways. When all roadways are solved, return to the main thread and write out the data.
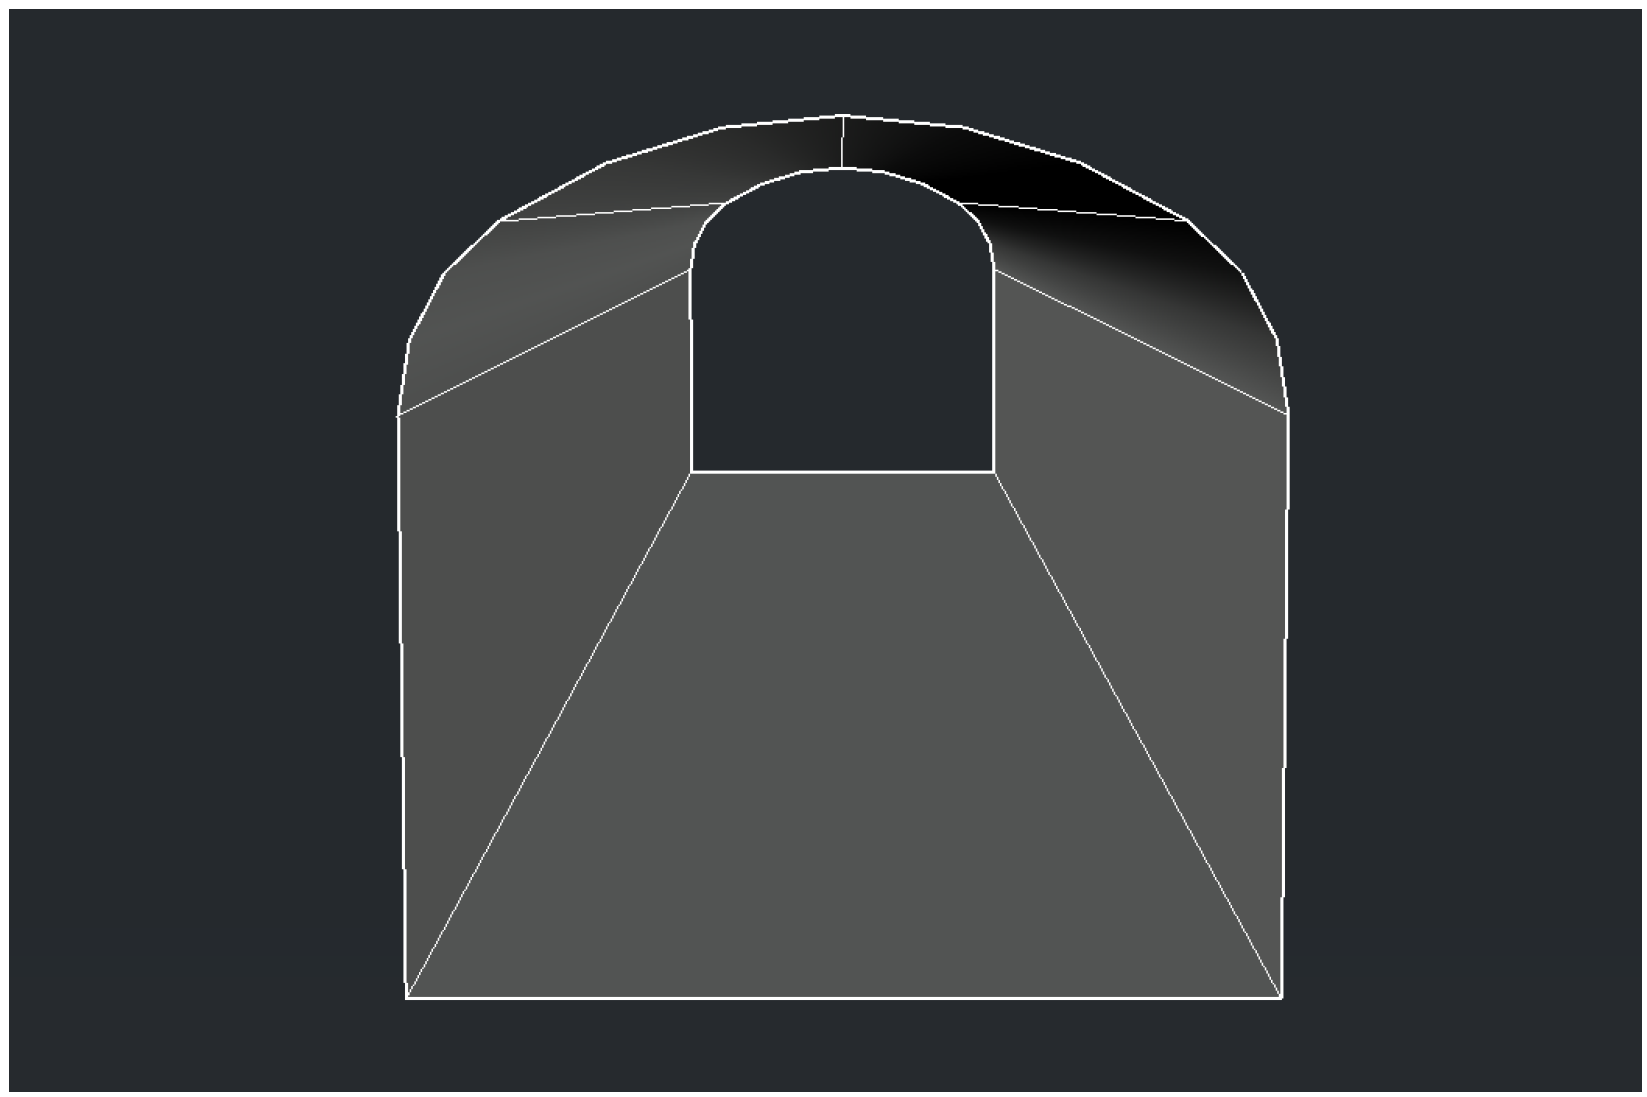
The three-dimensional simulation of the coal mine water inrush is computationally expensive, making it difficult to meet the real-time requirement. To reduce the computational cost significantly, the actual coal mine is simplified into roadway nodes and segments; namely, the three-dimensional simulation is reduced to a one-dimensional simulation. To check the accuracy of the one-dimensional simulation, a case validation is conducted, where the one-dimensional simulation result is compared to the three-dimensional simulation result. Figure 3 shows the three-dimensional model of the coal mine roadway, where the roadway width is 3 m and the roadway height is 3 m. In the one-dimensional simulation, the actual coal mine is simplified into roadway nodes and segments. Figure 4 shows the evolution of the water depth with the time, where the results of the one-dimensional simulation and three-dimensional simulation are compared. We should point out that the structure of the actual coal mine is complicated, including curves and junctions; when the 3-D structure is simplified into 1-D structure, the complex structures are lost, causing error between the one-dimensional simulation and three-dimensional simulation. To correct the one-dimensional simulation, two typical complex structures are selected, including roadway curves and junctions, where the results of the one-dimensional simulation and three-dimensional simulation are compared. The results of the one-dimensional simulation and three-dimensional simulation are close, proving the effectiveness of the one-dimensional simulation. Table 1 lists the error and computation time of the one-dimensional simulation and three-dimensional simulation. The difference between the one-dimensional simulation result and three-dimensional simulation result is small; namely, the average error is 10.2% for the roadway curve and the average error is 8.34% for the roadway junction, so reducing the three-dimensional simulation to the one-dimensional simulation is acceptable. Though the accuracy of the one-dimensional simulation is worse than that of the three-dimensional simulation, the computational cost is reduced significantly; namely, the computational time of the one-dimensional simulation is around 1 min, while the computational time of the three-dimensional simulation is much longer, making it difficult to meet the real-time requirement. To meet the real-time requirement of the water inrush, according to the computational cost and accuracy, the one-dimensional simulation is selected. To reflect the effect of the complex structure, including curves and junctions, the results of the one-dimensional simulation should be corrected; namely, the error of the water depth from the one-dimensional simulation should be taken into account. Compared to the three-dimensional simulation, the computational time of the one-dimensional simulation is decreased dramatically; namely, the time cost of the one-dimensional simulation is less than 1% of the three-dimensional simulation, making it able to meet the real-time requirement. Meanwhile, the accuracy of the one-dimensional simulation is within the acceptable range; namely, the average error is 10%, while the max error is 15%. Therefore, if the computational resources are limited and the real-time requirement is strict, the one-dimensional simulation is advantageous over the three-dimensional simulation. However, we should point out that the one-dimensional simulation is suitable for simple coal mine structures, like straight roadways. If the coal mine structure is complicated, for example, there are many curves and junctions, the result of the one-dimensional simulation will deviate from the actual case. To reflect the complicated coal mine structure, the one-dimensional simulation result should be corrected, where the effect of curves and junctions should be taken into account. If the computational resources are abundant, the simulation can be coupled with simple structures and complex structures, where simple structures are computed with the one-dimensional simulation, while the complex structures are computed with the three-dimensional simulation.

3. Dynamic Escape Path Optimization

To reduce the risk of coal mine water inrush, escape path optimization is studied widely. However, the previous studies are limited. Firstly, the spatio-temporal evolution of the coal mine water inrush is not taken into account; in the event of water inrush, the water depth is not static, but varies with the position and time dynamically, affecting the escape path optimization significantly. Secondly, the escape speed is not constant, but is affected by the water depth; when the water depth is above the critical level, the path is uncrossable. Without considering the two influencing factors, the previous studies are inevitably inconsistent with the actual case. To reduce the risk of coal mine water inrush, a dynamic escape path optimization model based on the spatio-temporal evolution of the coal mine water inrush is studied, which is closer to the actual case.
In the event of water inrush, the water depth affects the escaping speed directly [33,34,35,36]. By collecting the escaping speed data with the water depth, we construct the relationship between the escaping speed and water depth. The escaping speed data is collected by recording the walking speed of 60 persons under different water depths; the age range of the persons is between 25 and 45, and the height range of the persons is between 165 cm and 185 cm. Figure 5 shows the relationship between the escaping speed and water depth. The deeper the water is, the larger the drag and buoyancy of the water, so it is more difficult for a person to walk through the water; thus, the escaping speed decreases. Furthermore, when the water depth is over 0.3 m, the escaping speed decreases significantly, and the roadway becomes uncrossable; therefore, the critical water depth is set to be 0.3 m. Adopting curve fitting, the relationship between the escaping speed and the water depth is described approximately by
v ( h ) = 3.153 6.307 h , h 0.3 0 , h > 0.3
where the curve goodness of fit is R 2 = 0.996 . By extrapolating the relationship between the escaping speed and the water depth, the escaping speed of a person at zero water depth is v 0 = 3.153 m/s, which is the normal escaping speed in the event of an emergency.
Besides the water depth, the escape speed is affected by the physical energy reduction [37,38,39,40]. For example, Ibrahim et al. [39] tracked individuals’ physical fatigue in real time using a wearable sensor and assessed fatigue’s impact on participants’ hazard recognition performance and safety risk assessment. To assess the physical fatigue, Umer et al. [40] monitored fourteen construction workers’ fatigue onsite by gathering physiological measures and fatigue data simultaneously. We assume that the escape speed is proportional to physical energy; generally, the relationship between physical energy reduction and time is described with an exponential function.
Therefore, to take the physical energy reduction into account, the escape speed is corrected, namely,
v * ( h ) = v ( h ) exp ( β t )
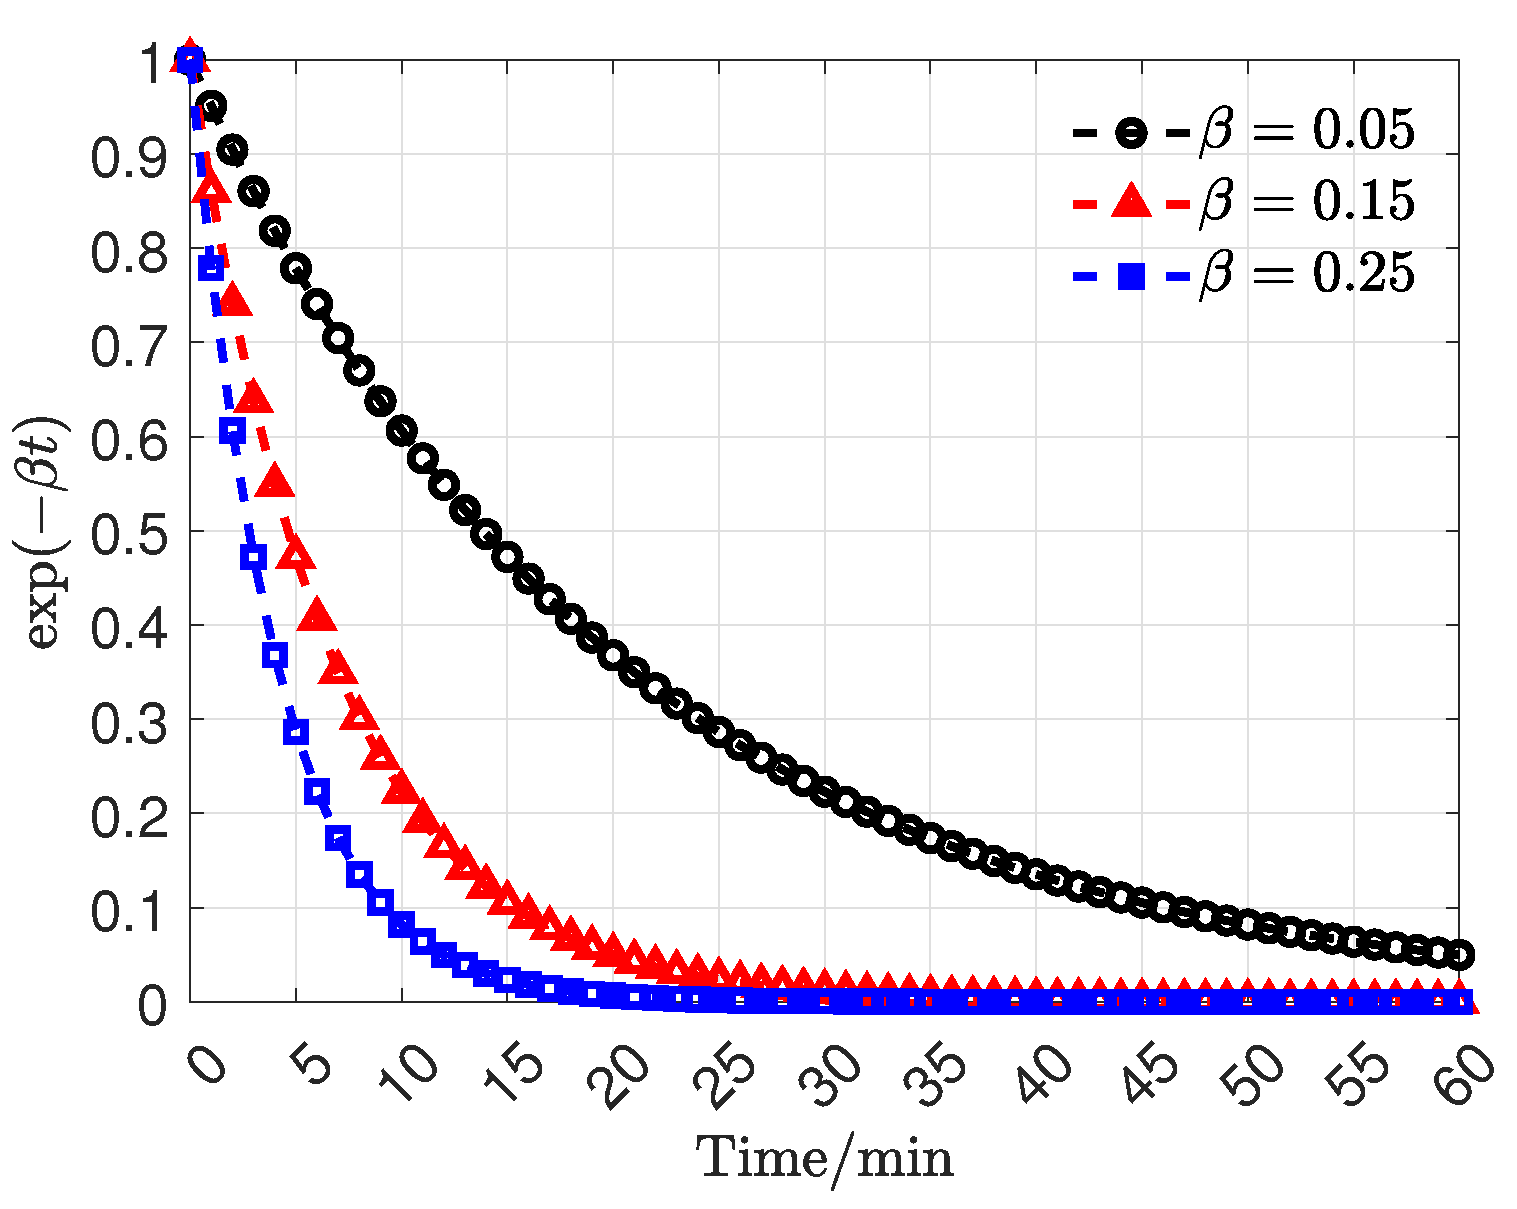
where v * ( h ) is the escape speed considering the physical energy reduction, v ( h ) is the escape speed without considering the physical energy reduction, β is the physical energy reduction factor, and t is the accumulative escape time. As shown in Figure 6, the selection of the physical energy reduction factor is essential, representing the rate of the physical energy decaying. If the physical energy reduction factor is large, the physical energy is reduced to 0 within a short time, while the physical energy is reduced to 0 within a long time if the physical energy reduction factor is small. According to the experimental data, the physical energy reduction factor is set to be β = 0.15 ; namely, around t = 30 min, the physical energy is reduced to 0, which is closer to the actual escape scenario. We should point out that the escape speed correction model is limited, making it only effective on the experimental data of the present study (the age range is between 25 and 45; the height range is between 165 cm and 185 cm). If the experimental data is different, for example, the age range is different and the height range is different, a suitable physical energy reduction factor should be selected. Meanwhile, the complicated structure of the coal mine, including complex interactions and obstacles, is not taken into account, leading to a rapid reduction in physical energy. If there are complex interactions and obstacles, a larger physical energy reduction factor is closer to the actual escape scenario.
To reflect the effect of the water depth on the escaping speed, the escaping difficulty coefficient is defined, which is the normal escaping speed v 0 divided by the actual escaping speed v ( h ) ,
γ = v 0 / v * ( h ) , h 0.3 , h > 0.3
Affected by the water depth and physical energy reduction, the escaping difficulty coefficient γ > 1 ; the larger the escaping difficulty coefficient is, the smaller the escaping speed is, and the more difficult it is for a person to escape. Furthermore, the effective distance of the roadway is calculated, which is the actual distance of the roadway times the escaping difficulty coefficient, namely,
L * = γ L
where L is the actual distance of the roadway; L * is the effective distance of the roadway. When the water depth is less than the critical water depth, though the roadway is crossable, the effective distance of the roadway becomes longer. When the water depth is over the critical water depth, the effective distance of the roadway is infinite; namely, the roadway becomes uncrossable. The water depth affects the escaping speed directly, reflected by the escaping difficulty coefficient; the effective distance of the roadway is related to the water depth, which varies with the position and time dynamically and is closer to the real condition. After the effective distance of the roadway is calculated, the undirected weighted graph of the coal mine is constructed, where the weight of the edge is the effective distance of the roadway; the objective function is to minimize the effective distance of the escape path. We give the water inrush point, person position, and safety exit position, adopting the Dijksta algorithm to conduct dynamic personnel escape path planning.

4. Model Validation

To validate the dynamic escape path optimization model based on the spatio-temporal evolution of the coal mine water inrush, three case studies are conducted. In the first case, there is one water inrush point and one person, while in the second case, there are two water inrush points and four persons; the third case is an actual coal mine with multiple water inrush points.

4.1. Single Water Inrush Point and Single Person

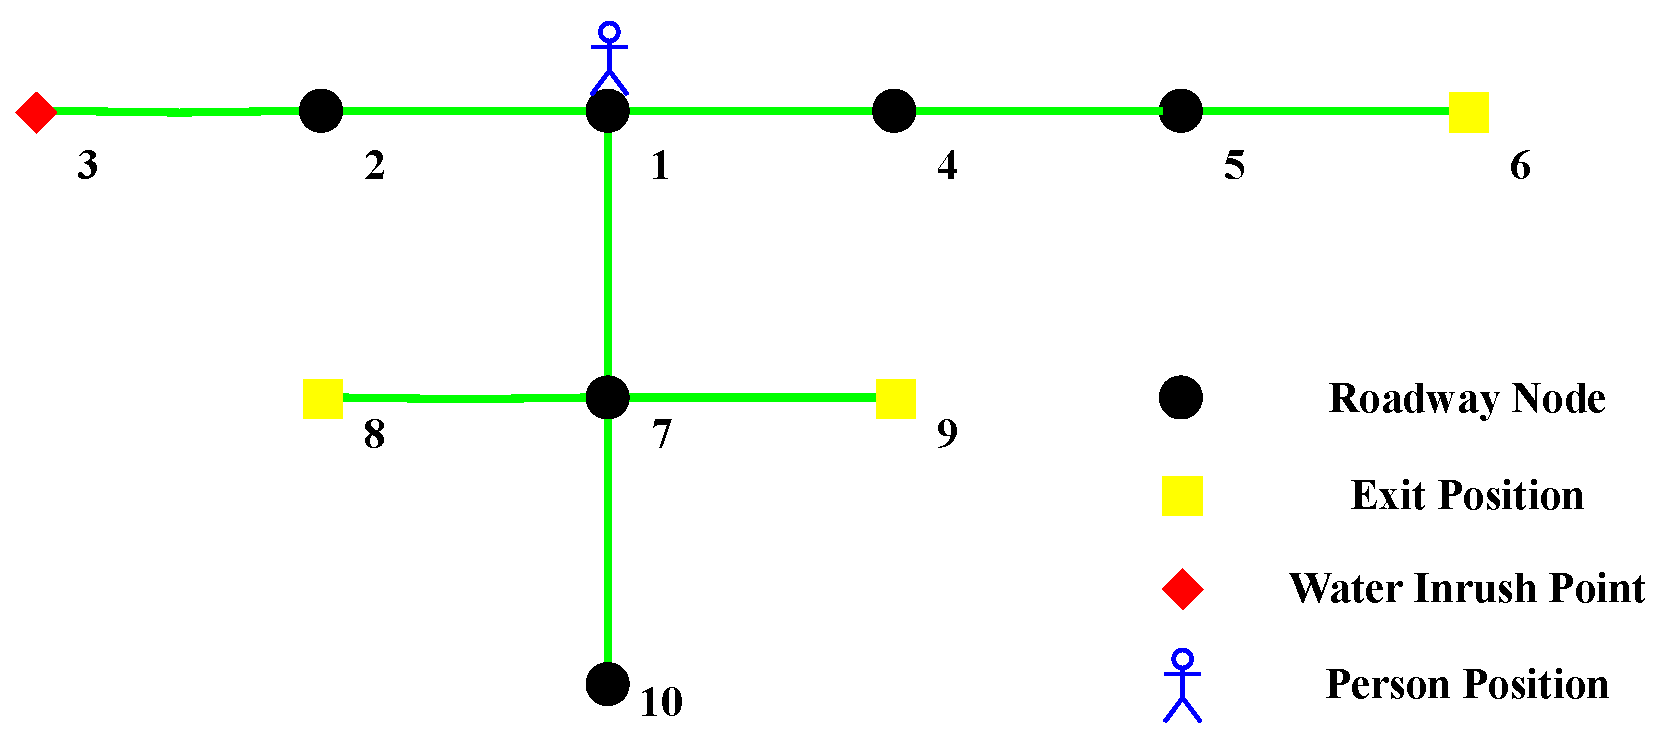
The coal mine is located in the south of Huangling County, China, which is bounded in the west by Shanshenmiao, in the east by Xincunchuan, in the north by a coal-free zone, and in the south by the coal-free zone of the kiln upper backslope. The surface of the well field is cut by gullies; the extension direction of the beams is controlled by the water system, extending from south to north. The surfaces of the beams are covered by residual slope deposits, which are favorable to the formation of groundwater. The spatial model of the coal mine is constructed, including roadway nodes, roadway segments, geometric parameters, initial conditions and boundary conditions. Figure 7 shows the spatial model of the coal mine. Initially, the person is at node 1; node 3 is the water inrush point, and nodes 6, 8 and 9 are three safety exit positions. The shape of the roadway is rectangular; the roadway width is 3 m; the roadway height is 3 m; the roughness coefficient of the roadway is 0.015; the energy loss coefficient along the roadway is 1.5.
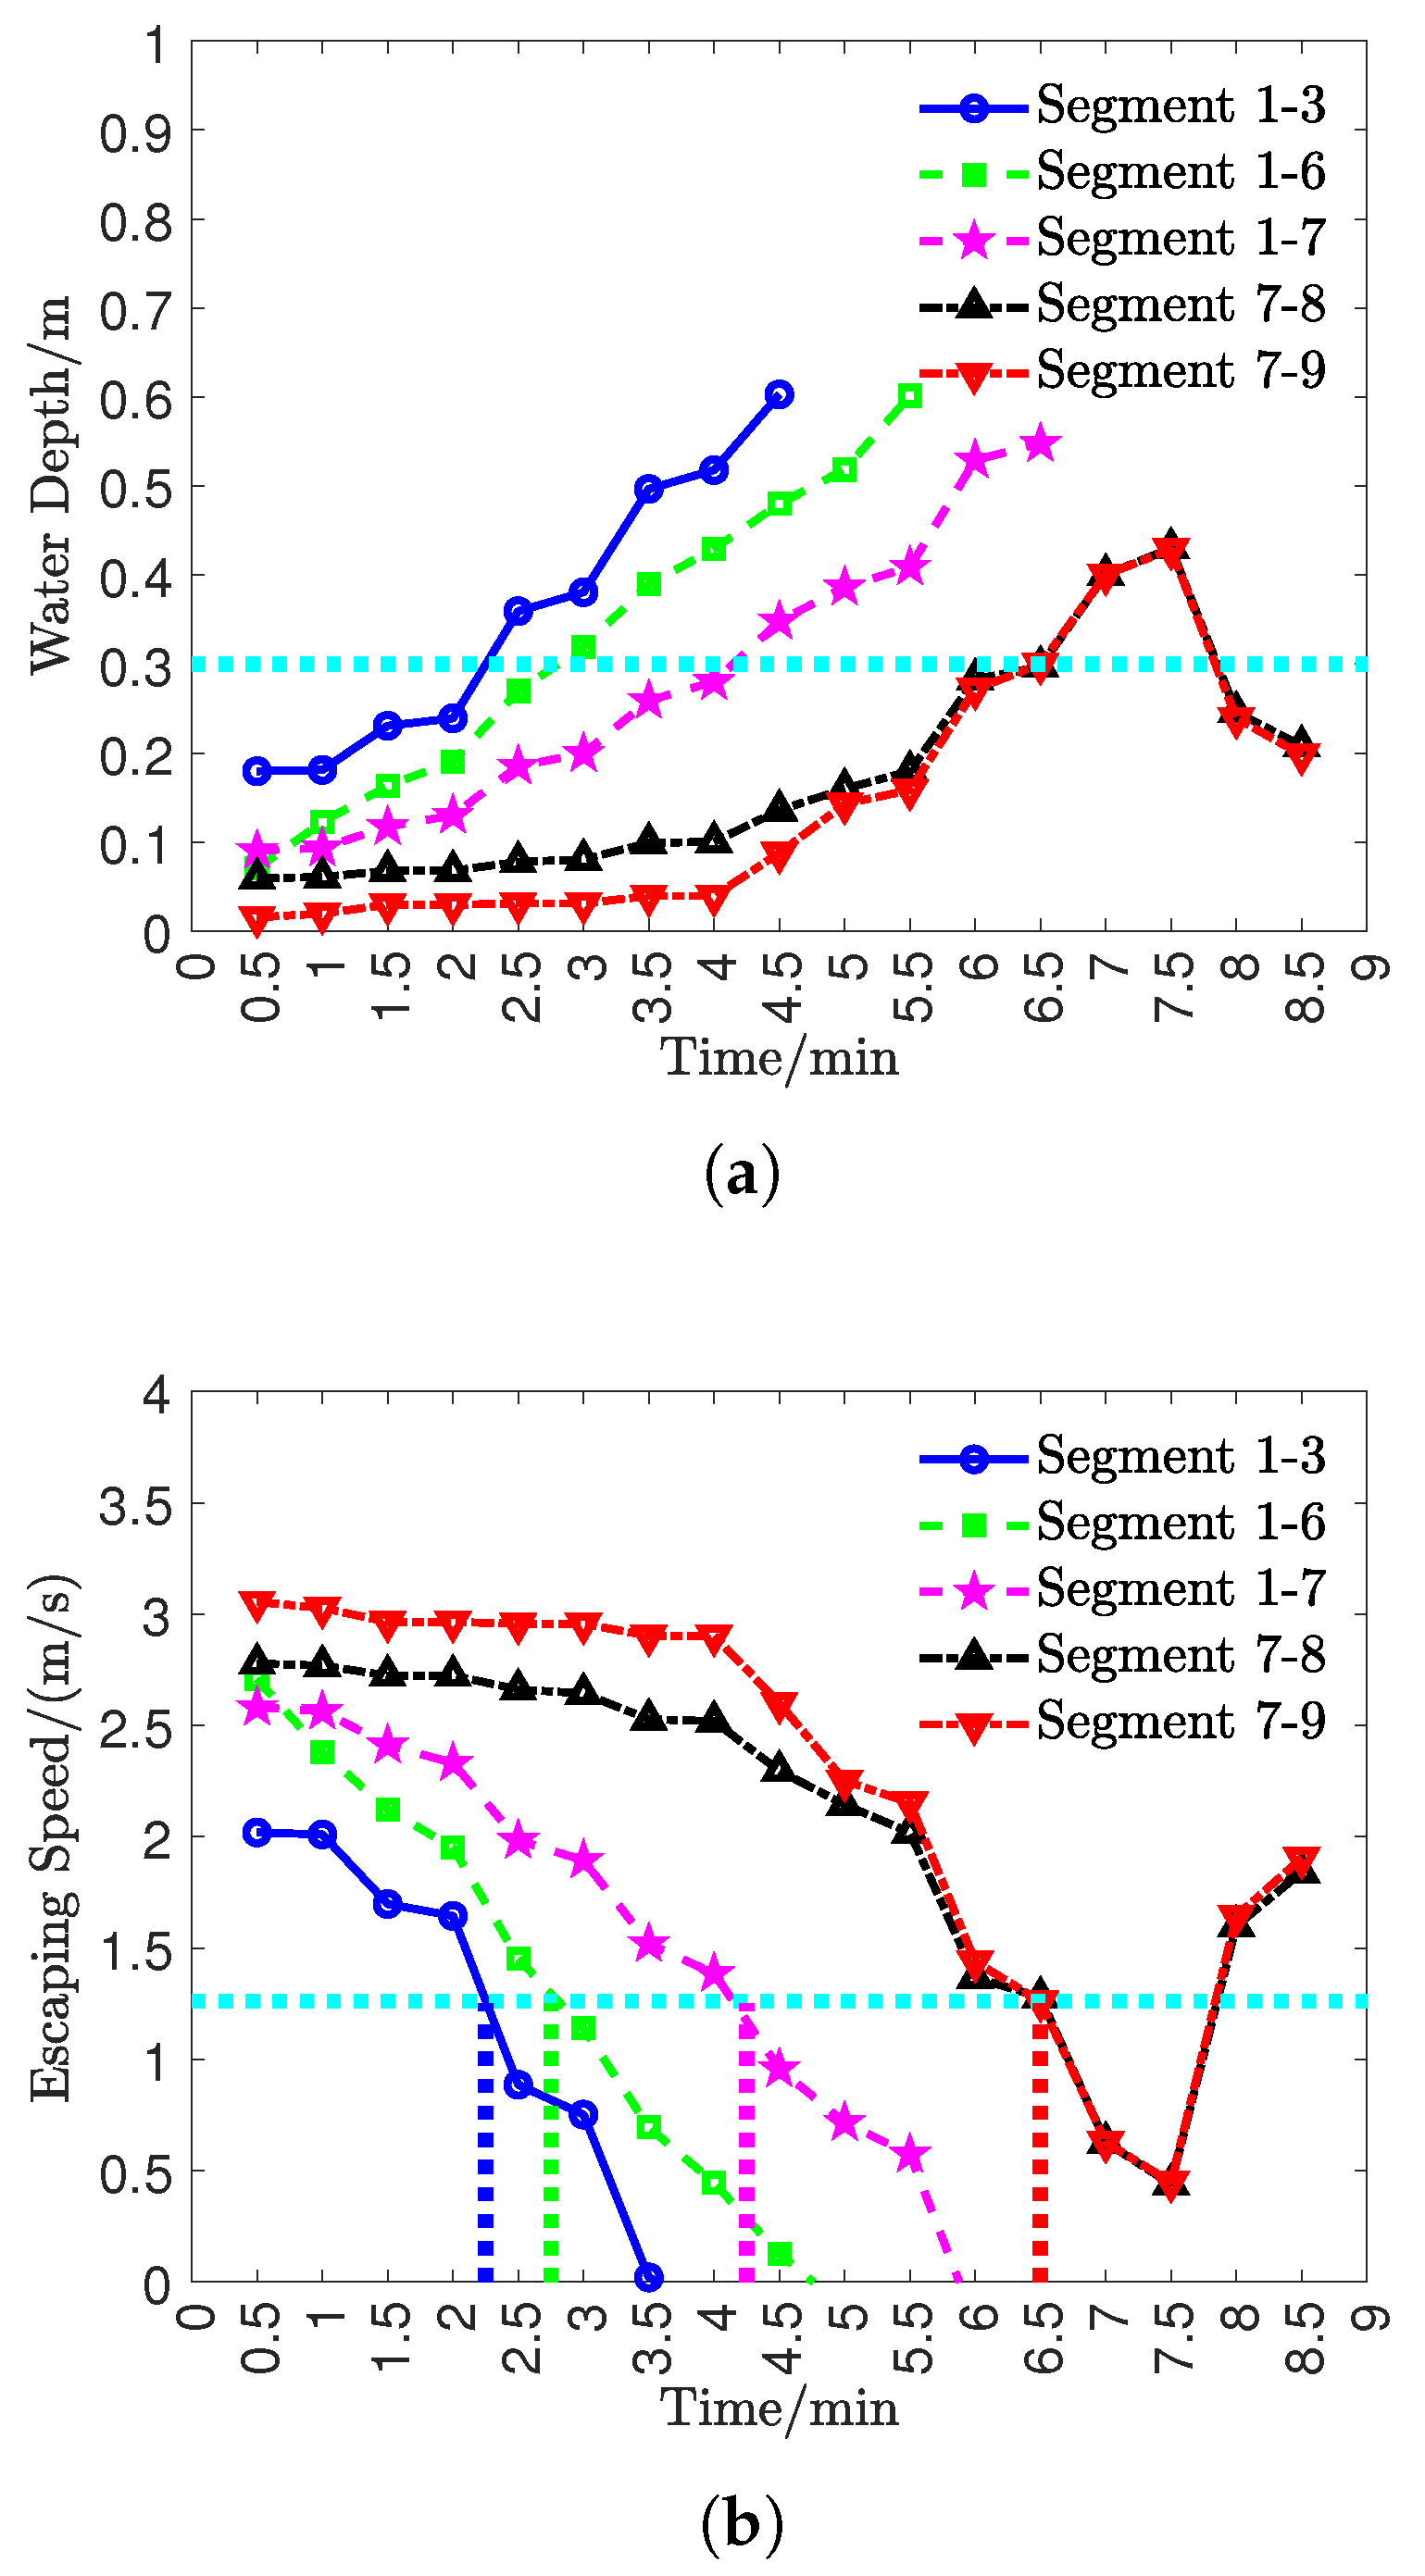
Figure 8 shows the water depth and escape speed with the time, where the roadway segments are different. With the increase in the water depth, it is more difficult for the person to escape, so the escape speed is smaller. The water depth of roadway segments 1-3, 1-6 and 1-7 increases monotonically; as a result, the escape speed of roadway segments 1-3, 1-6 and 1-7 decreases. Different to roadway segments 1-3, 1-6 and 1-7, the water depth of roadway segments 7-8 and 7-9 increases at the first stage; after the maximum water depth is reached, the water depth of roadway segments 7-8 and 7-9 decreases at the second stage. Affected by the water depth of roadway segments 7-8 and 7-9, the escape speed of roadway segments 7-8 and 7-9 decreases at the first stage; after the minimum escape speed is reached, which is below the critical escape speed, the escape speed of roadway segments 7-8 and 7-9 increases at the second stage. Above the critical water depth of 0.3 m, it is difficult for the person to escape; to conduct dynamic programming, the escape window time is defined, which is the time when the water depth is above the critical water depth for the first time. By integrating the escape speed with the time from zero to the window escape time, the escape distance is calculated. If the escape distance is greater than the length of the roadway segment, the person is able to escape from the roadway segment before the escape window time, so the roadway segment is crossable; otherwise, the roadway segment is uncrossable, so it is excluded from the dynamic programming. Table 2 lists the lengths and window escape times of different roadways. To evaluate the risk of crossing the roadway segment, the risk score is defined, which is the escape time divided by the window escape time. The risk score is smaller, so the safety of crossing the roadway segment is higher. If the risk score is greater than 1, the person is unable to escape from the roadway segment before the window escape time; the roadway segment is uncrossable. Roadway segment 1-6 is uncrossable, so it is excluded from the dynamic programming. There are two available escape paths, namely, 1-7-8 and 1-7-9. Though the two escape paths are available for the person to escape from the initial position to the exit position, compared to escape path 1-7-9, the risk score of escape path 1-7-8 is smaller; namely, the safety of escape path 1-7-8 is higher. By conducting the dynamic programming, the optimal escape path is selected; namely, from initial position 1 to node 7 at the first stage, and from node 7 to exit position 8 at the second stage.

4.2. Multiple Water Inrush Points and Multiple Persons

The second case is different from the above case; there are two water inrush points and four persons, which is closer to the real situation. Figure 9 shows the structure of the coal mine water inrush, including two water inrush points and four persons. Nodes 3 and 11 are the two water inrush points; node 1 is the initial person position, where there are four persons; node 13 is the exit position. The flow of the two water inrush points is 600 m3/h; the roadway width and height are the same as the above case; the roughness coefficient of the roadway is 0.015; the energy loss coefficient along the roadway is 1.5.
Different from the single-person case, besides the water depth and physical energy reduction, the escape speed is affected by the person–person interaction. Referring to the previous studies [41,42], a simplified person–person interaction model is presented. The significant difference between multiple persons and a single person is the person–person distance. In the single-person case, the person–person distance is infinite; namely, the escape speed is not affected by the person–person distance. Differently, the person–person distance is finite in the multiple-person case; namely, the person–person distance affects the escape speed significantly. With the increase in the person–person distance, the escape speed increases monotonically; the extreme case is that the escape speed of the multiple-person case is equal to that of the single-person case when the person–person distance is infinite. According to the above discussion, the simplified person–person interaction model is
v i * * ( h ) = v i * ( h ) f ( d i j )
where v i * * ( h ) is the escape speed of the i-th person considering the person–person interaction, v i * ( h ) is the escape speed of the i-th person without considering the person–person interaction, and f ( d i j ) is the indicator function, which is dependent on the person–person distance, namely,
f ( d i j ) = 1 , d i j d i j upper d i j d i j lower d i j upper d i j lower , d i j lower < d i j < d i j upper 0 , d i j d i j lower
where d i j is the minimum distance between the i-th person and surrounding persons, d i j upper is the upper critical distance, above which the escape speed is not affected by the person–person interaction, and d i j lower is the lower critical distance, below which it is too crowded for the person to escape. According to the experimental data, the upper critical distance is set to be d i j upper = 5 m, and the lower critical distance is set to be d i j lower = 0.5 m. During the person escape, the real-time positions of the persons are known; the person–person distance can be calculated conveniently, which is used to correct the escape speed.
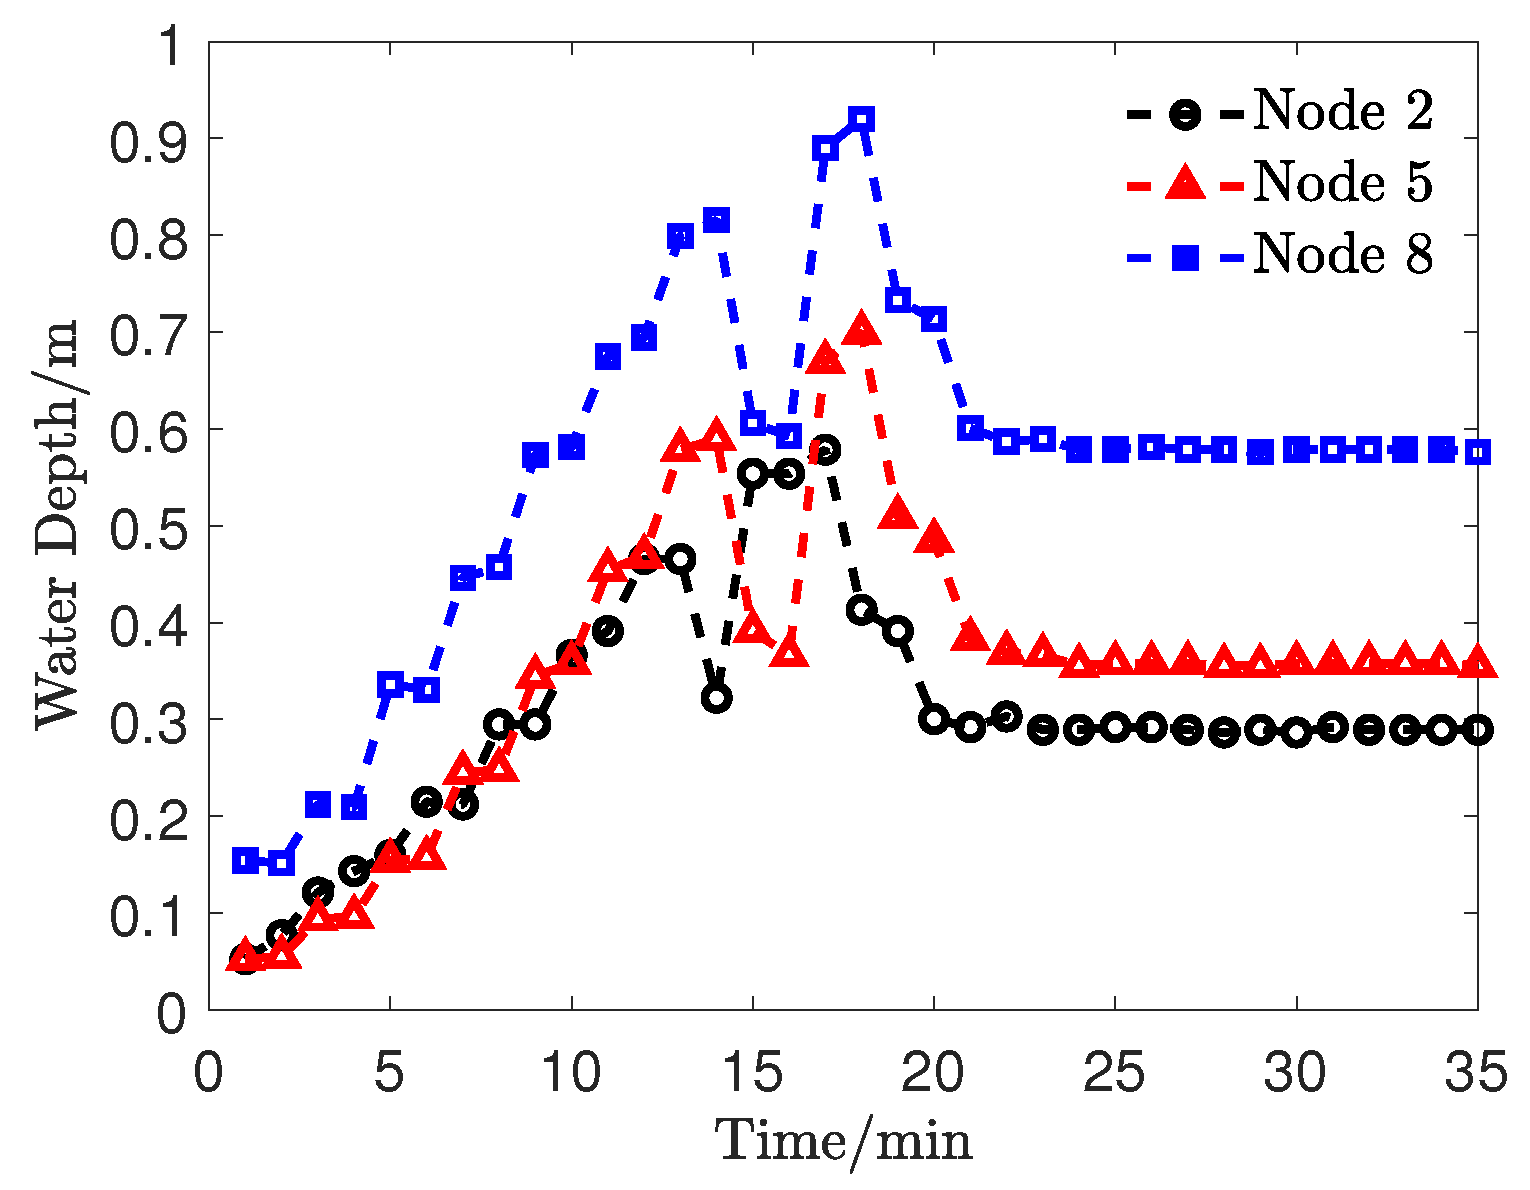
Figure 10 shows the evolution of the water depth with time at different roadway nodes. At the beginning, the water depth increases monotonically; after a period, the whole roadway is filled with water, and there is a fluctuation in the water depth; lastly, the water depth reaches a steady state. Based on the spatio-temporal evolution of the coal mine water inrush, the dynamic programming of the escape path is conducted. Different to the single-person case, during the escape of multiple persons, the escape speed is affected by three factors; they are water depth, physical energy reduction and person–person interaction. To take the person–person interaction into account, the real-time person–person distance is calculated, which is used to correct the escape speed. In addition, there are multiple persons to escape from the initial position to the exit position; the escape speed of each person is different, which is affected by the person–person interaction. To reflect the difficulty during the escape of multiple persons, another indicator is defined, namely, the rescue priority, where the escape speed is smaller, it is more difficult for the person to escape independently, and the rescue priority is higher. We should point out that the rescue priority is higher, so the value of the rescue priority is smaller; namely, the value of the highest rescue priority is 1.
Table 3 lists the risk scores and rescue priorities of different roadways during the escape of multiple persons. According to the definition of the risk score, the risk score is smaller, so the safety of crossing the roadway segment is higher. Besides the risk score, the rescue priority is important; the average escape speed is smaller, and crossing the roadway segment is more difficult, so the rescue priority should be higher. At the first step, there are two available roadway segments, namely, 1-2 and 1-4. Compared to roadway segment 1-2, the risk score of roadway segment 1-4 is smaller; meanwhile, the rescue priority of roadway segment 1-4 is lower, so roadway segment 1-4 is selected. At the second step, roadway 4-7 is selected, because the risk score of roadway 4-7 is much smaller than that of roadway 4-5, while the rescue priority of roadway 4-7 is close to that of roadway 4-5. At the third step, roadway 7-8 is selected; the risk score of roadway 7-8 is 0.39 and the rescue priority of roadway 7-8 is 6. The last step is roadway 8-9; the risk score of roadway 8-9 is 0.52, while the rescue priority of roadway 8-9 is 4, which is relatively high, so much attention should be paid when crossing roadway 8-9.
To ensure the effectiveness of the rescue during water inrush, the design of integrated indicators is essential. Based on the spatio-temporal evolution of the water inrush and the escape speed, two indicators are defined, namely, window escape time and rescue priority. Obviously, the actual rescue scenario is more complex; more factors should be taken into account, including the probability of casualties, rescue priority logic and multi-layered management policies. Firstly, the probability of casualties is determined according to the historical data and expert experience. Based on the nature of the impact, the potential injury severity is categorized with different colors, for example, red representing very severe, yellow representing severe. Meanwhile, the relevant data is updated dynamically, including water depth, person position and escape speed; the rescue priority is dependent on both the emergency level and the likelihood of survival. If the emergency level is high and the likelihood of survival is high, a higher rescue priority is given; otherwise, a lower rescue priority exists. Lastly, to ensure the effectiveness of the rescue, multi-layered management policies are necessary, including resource allocation, department cooperation and after-action reviews. However, we should try to avoid the limitations of the rescue strategies. For example, is equity more important, or is efficiency?During the rescue, we should balance equity and efficiency; the rescue priority is not static, but is adjusted dynamically according to the actual rescue scenario.

4.3. Actual Coal Mine with Multiple Water Inrush Points

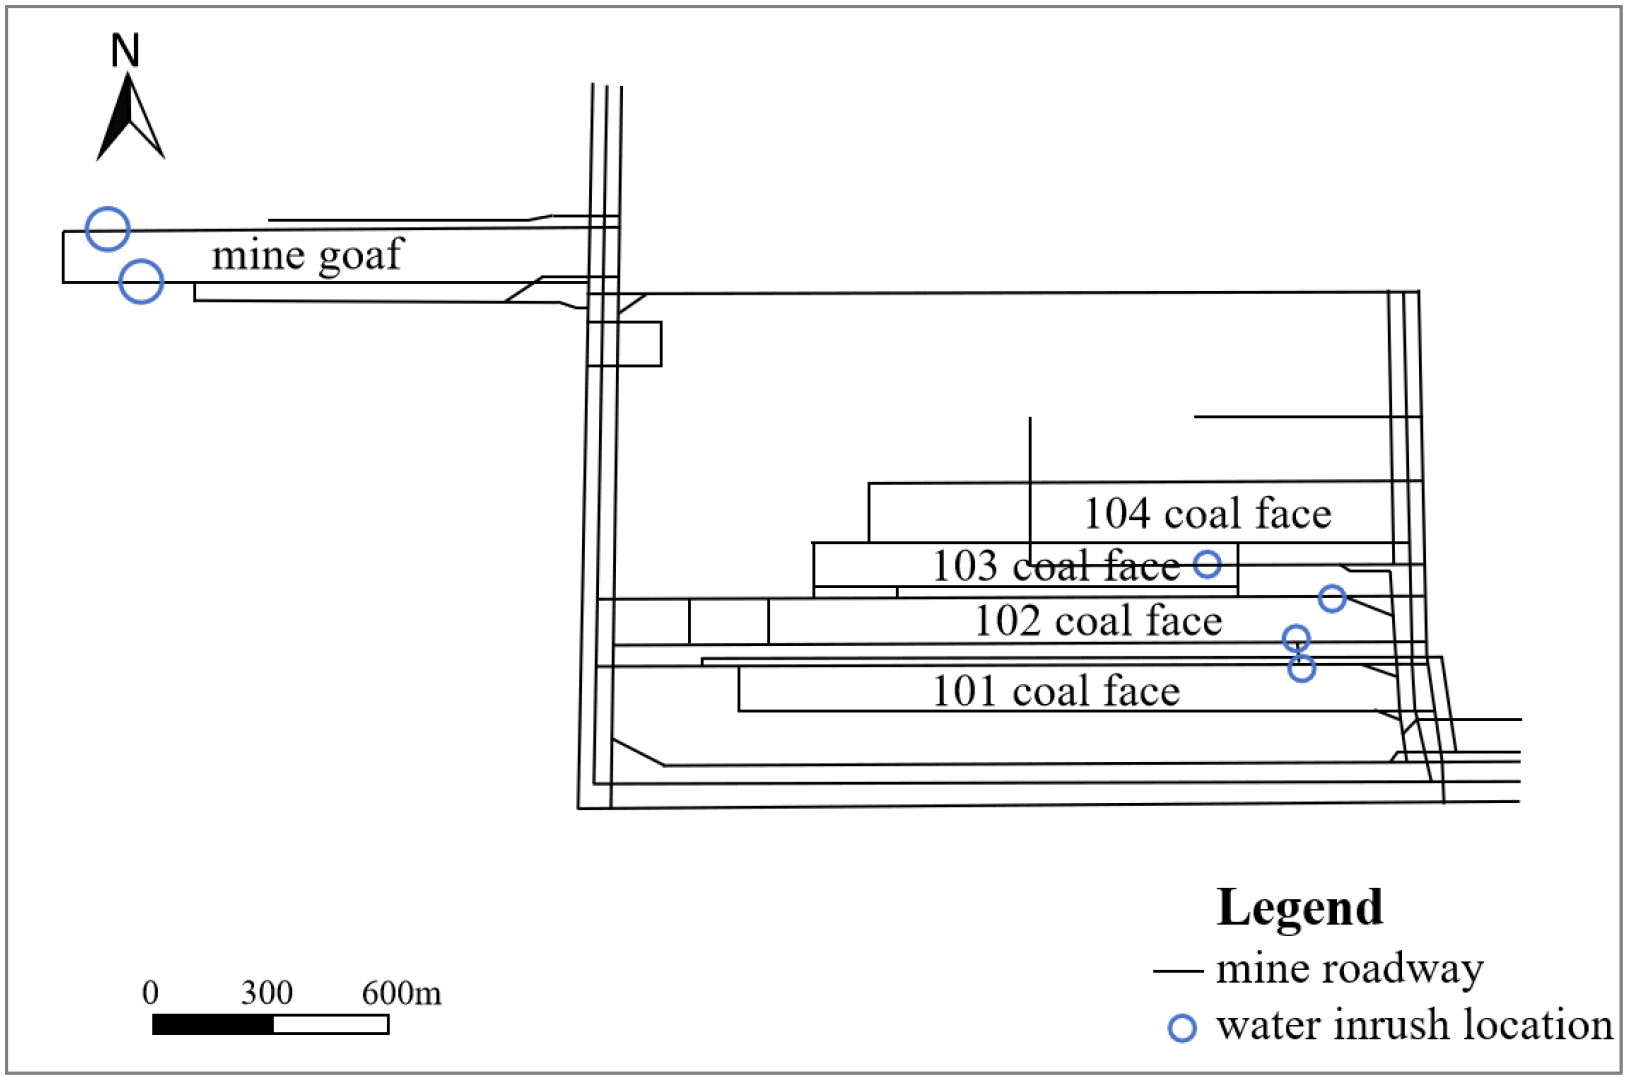
Furthermore, to validate the present water inrush model, the third case is an actual coal mine with multiple water inrush points. The coal mine is located in Huangling County, China, which is out of operation due to a severe water inrush in 2021. As shown in Figure 11, six water inrush points with different elevations were arranged in the study area, among which two water inrush points with different locations were arranged in the mine goaf area, and one water inrush point was arranged in each of the four remaining coal mining roadways. The curve of water inrush is consistent. By controlling the flow rate and time of water inrush location, the roadway flooding under different degrees of flooding is simulated. Figure 12 shows the map of the water spread in the coal mine, where blue is the water spread. It can be found that after the occurrence of the water disaster, the water surge in the mine goaf area keeps spreading with the development of time. In days 1-3, the water in the mine goaf area gradually spread to the main roadway, and a small part of the water flowed back to the roadway of the mine goaf area from the transportation roadway. On the third day, the surge water spread over the whole mine goaf area into the main roadway. Though the coal mine is out of operation, the water surge data was recorded. The simulation result is close to the measured data both qualitatively and quantitatively, proving the effectiveness of the present water inrush model.

5. Discussion

We should point out that there are some limitations of the present work. To validate the dynamic escape path optimization model, two case studies are conducted. In the first case, there is one water inrush point and one person, while in the second case, there are two water inrush points and four persons. However, the actual field application is more complex. The structure of the coal mine is more complicated, including complex interactions and obstacles, affecting the selection of the optimized escape path directly. In the present study, the complicated structure of the coal mine is not taken into account, causing deviation from the actual field application. To apply the present model to the actual field application scenario, the complicated structure of the coal mine, including complex interactions and obstacles, is equivalent to the effective roadway length. To construct the simplified node-segment model of the coal mine, the effect of the complicated structure is reflected by adjusting the effective roadway length. If there are complex interactions and obstacles in one roadway segment, the escape speed is slower and the escape time is longer. To reflect the effect of complex interactions and obstacles, the effective roadway length is longer than the actual roadway length; additionally, the time of crossing the roadway segment with complex interactions and obstacles is longer. Firstly, to meet the real-time simulation requirement, the actual coal mine is simplified into roadway nodes and segments; the three-dimensional structure is reduced to a one-dimensional structure, meaning that lots of structural details are lost, where error is inevitable. To be closer to the actual coal mine, adopting massive parallel computation technology to conduct the three-dimensional simulation is necessary. Secondly, in the multi-person case, the person–person interaction model only takes the person–person distance into account, which is limited. Besides the person–person distance, the environmental and psychological factors affect the escape speed, which should be taken into account to reflect the real multi-person escape scenario. Since the actual field application is more complex, we should point out that it is impossible for the present study to consider all the factors affecting the escape path optimization. However, by correcting the present model, like introducing the effective roadway length to reflect the complicated structure of the actual coal mine, the present model is closer to the actual field application scenario.

6. Conclusions

To reduce coal mine water inrush accidents, a dynamic escape path optimization model based on the spatio-temporal evolution of the coal mine water inrush is presented. By simplifying the coal mine into nodes and segments, the spatial model of the coal mine is constructed. To investigate the spatio-temporal evolution of the coal mine water inrush, the control equations of the open-channel flow and full-channel flow are presented, which are solved with the lattice Boltzmann method. Different to the previous studies, we take two influencing factors of the escape speed into account, namely, the water depth and physical energy reduction, making it closer to the real condition. Three case studies are conducted to validate the effectiveness of the dynamic escape path optimization model; one is the single-person case, the second is the multiple-person case, and the third case is an actual coal mine with multiple water inrush points. To evaluate the risk of the escape path quantitatively, two indicators are defined; they are the window escape time and rescue priority. By conducting dynamic programming of the escape path, the optimal escape path is selected, where the effectiveness of the dynamic escape path optimization model is validated. The present work is helpful in reducing the risk of coal mine water inrush and improving the safety of the early warning system.

Author Contributions

Conceptualisation, W.C. and J.H.; methodology, X.W. and W.L.; software, S.W. and L.M.; validation, T.F. and W.C.; formal analysis, L.A.; investigation, J.H.; resources, Z.L.; data curation, S.W.; writing—original draft, L.A. All authors have read and agreed to the published version of the manuscript.

Funding

The present study is supported by the National Natural Science Foundation of China (42374176), the Key Project of China Coal Science and Industry Group Co., Ltd. (2024-TD-ZD001-01), and the Open Fund Project of Shaanxi Provincial Key Laboratory of Coal Mine Water Hazard Prevention and Control Technology (2021SKMS07).

Data Availability Statement

The original contributions presented in this study are included in the article. Further inquiries can be directed to the corresponding author.

Conflicts of Interest

Authors Lin An, Zaibing Liu, Xinmiao Wang, Wenming Liu, Shaolong Wang, Liang Ma and Tao Fan were employed by the company China Coal Science and Industry Xi’an Research Institute Co., Ltd. The remaining authors declare that the research was conducted in the absence of any commercial or financial relationships that could be construed as a potential conflict of interest.

References

  1. Han, G.; Pei, Z.; Shi, T. Unveiling unprecedented methane hotspots in China’s leading coal production hub: A satellite mapping revelation. Geophys. Res. Lett. 2024, 51, e2024GL109065. [Google Scholar] [CrossRef]
  2. Qian, Q.; Tian, Y.; Lin, L. Modelling the socio-economic impacts of coal production reduction: A macro provincial analysis of China. Energy Rep. 2024, 12, 4306. [Google Scholar] [CrossRef]
  3. Zhou, G.; Liu, Y.; Liu, Z. Study on the characteristics of compound dust source pollution and foam dust suppression technology in coal mine anchor excavation production. Process Saf. Environ. Prot. 2024, 186, 593. [Google Scholar] [CrossRef]
  4. Liu, Q.; Shang, J.; Wang, J. Research on the evaluation of the operating effectiveness of the safety double prevention mechanism of coal mine enterprises based on matter-element extension. Process Saf. Environ. Prot. 2024, 185, 899. [Google Scholar] [CrossRef]
  5. Zhang, P.; Wang, Q.; Xu, S. Early Warning of Coal Mine Production Environment Safety Risks Based on Multi-Source Information Feature Fusion. Sustainability 2025, 17, 2085. [Google Scholar] [CrossRef]
  6. Jia, L.; Wang, L.; Cheng, Y. Enhancing mine safety and mitigating greenhouse gas emissions: A comprehensive analysis of fluid migration dynamics in coalbed methane co-production. Process Saf. Environ. Prot. 2025, 196, 106933. [Google Scholar] [CrossRef]
  7. Wu, Q. Research progress, issues, and prospects of mine water prevention and control and resource utilization in China. J. China Coal Soc. 2014, 39, 795. [Google Scholar]
  8. Wang, X.; Xu, Z.; Sun, Y. Construction of multi-factor identification model for real-time monitoring and early warning of mine water inrush. Int. J. Min. Sci. Technol. 2021, 31, 853. [Google Scholar] [CrossRef]
  9. Zhang, Y.; Shu, P.; Zhai, F. Preparation and properties of hydrotalcite microcapsules for coal spontaneous combustion prevention. Process Saf. Environ. Prot. 2021, 152, 536. [Google Scholar] [CrossRef]
  10. Zhu, T.; Li, W.; Chen, W. Risk assessment of cretaceous water inrush in the Ordos basin based on the FAHP-EM. Water Policy 2021, 23, 1249. [Google Scholar] [CrossRef]
  11. Huang, C.; Dong, W.; Cao, Z. Water inrush mechanism of fault zone in Karst tunnel under fluid-solid coupling field considering effective stress. Geofluids 2022, 2022, 4205174. [Google Scholar] [CrossRef]
  12. Li, X.; Zhang, W.; Wang, X. Evaluation on the risk of water inrush due to roof bed separation based on improved set pair analysis-variable fuzzy sets. ACS Omega 2022, 7, 9430. [Google Scholar] [CrossRef]
  13. Ma, D.; Duan, H.; Zhang, J. A state-of-the-art review on rock seepage mechanism of water inrush disaster in coal mines. Int. J. Coal Sci. Technol. 2022, 9, 1. [Google Scholar] [CrossRef]
  14. Xiao, L.; Li, F.; Niu, C. Evaluation of water inrush hazard in coal seam roof based on the AHP-CRITIC composite weighted method. Energies 2022, 16, 114. [Google Scholar] [CrossRef]
  15. Yang, B.; Shi, W.; Yang, X. Nonlinear seepage erosion model of water inrush considering particle size distribution of Karst collapse column and its engineering applications. Sci. Rep. 2022, 12, 17078. [Google Scholar] [CrossRef] [PubMed]
  16. Dong, L.; Wang, H.; Song, D. Analysis of the catastrophe mechanism and treatment countermeasures of a sudden water inrush disaster in a long and deeply buried tunnel in the Karst area. J. Perform. Constr. Facil. 2023, 37, 4349. [Google Scholar] [CrossRef]
  17. Gu, Q.; Huang, Z.; Li, S. An approach for water-inrush risk assessment of deep coal seam mining: A case study in Xinlongzhuang coal mine. Environ. Sci. Pollut. Res. Int. 2020, 27, 43163. [Google Scholar] [CrossRef]
  18. Hou, E.; Yao, X.; Che, X. Evaluation of the risk of water gushing (inrush) in aquifer of coal seam roof based on three diagram method: A case study in Hujiahe coal mine, China. Preprint 2020. [Google Scholar] [CrossRef]
  19. Liu, Y.; Liu, J.; Yang, B. Assessing water and sand inrushes hazard reductions due to backfill mining by combining gis and entropy methods. Mine Water Environ. 2021, 40, 956. [Google Scholar] [CrossRef]
  20. Wang, W.; Zhao, W.; Qian, J. Potential of hydraulic tomography in exploring the preferential flowpaths of water inrush in coal mine areas. J. Hydrol. 2021, 602, 126830. [Google Scholar] [CrossRef]
  21. Cai, M.; Zhu, X.; Liu, D. Mine water inrush rescue model based on optimized SPFA algorithm. Coal Geol. Explor. 2019, 47, 14. [Google Scholar] [CrossRef]
  22. Li, W.; Wang, Y.; Ye, Z. Development of a mixed reality assisted escape system for underground mine based on the mine water-inrush accident background. Tunn. Undergr. Space Technol. 2024, 143, 105471. [Google Scholar] [CrossRef]
  23. Xie, B.; Zhu, D.; Li, B. Research on optimal emergency evacuation path for mine water inrush based on dynamic D-K algorithm. Saf. Coal Mines 2024, 55, 192. [Google Scholar] [CrossRef]
  24. Chen, Y.; Sun, B.; Xu, M. Design and implementation of an escape route planning system for deep mine water inrush based on graph structure. China Min. Mag. 2025, 34, 126. [Google Scholar] [CrossRef]
  25. Sun, J.; Zou, L.; Govender, N. Coupling SPH-DEM method for simulating the dynamic response of breakwater structures under severe free surface flow. Powder Technol. 2024, 441, 119805. [Google Scholar] [CrossRef]
  26. Luo, P.; Zhang, J. An immersed boundary method coupled non-hydrostatic model for free surface flow. Comput. Fluids 2024, 275, 106241. [Google Scholar] [CrossRef]
  27. Tao, Y.; Wright, D.; Lokhandwala, A. Impacts of rainfall spatiotemporal variability on pressurized flow conditions in urban drainage systems. J. Hydrol. 2025, 662, 133874. [Google Scholar] [CrossRef]
  28. Liu, X. Analysis and mitigation of post-bore noises in modeling mixed flows in closed conduits. Phys. Fluids 2025, 37, 4. [Google Scholar] [CrossRef]
  29. Lallem, P.; Luo, L.; Krafczyk, M. The lattice Boltzmann method for nearly incompressible flows. J. Comput. Phys. 2021, 431, 109713. [Google Scholar] [CrossRef]
  30. Mahdi, A.; Ali, S.; Amin, A. Analysis of radiative heat transfer in two-dimensional irregular geometries by developed immersed boundary-lattice Boltzmann method. J. Quant. Spectrosc. Radiat. Transf. 2022, 280, 108086. [Google Scholar] [CrossRef]
  31. Karimnejad, S.; Amiri, D.; He, F. Coupling immersed boundary and lattice Boltzmann method for modeling multi-body interactions subjected to pulsatile flow. Math. Methods Appl. Sci. 2023, 46, 6767. [Google Scholar] [CrossRef]
  32. Lin, R.; Lan, S.; Wu, X. Effect of perforated cracks on liquid water in microporous layers by lattice Boltzmann method. Renew. Energy 2024, 222, 119900. [Google Scholar] [CrossRef]
  33. Lee, H.; Hong, W.; Lee, Y. Experimental study on the influence of water depth on the evacuation speed of elderly people in flood conditions. Int. J. Disaster Risk Reduct. 2019, 39, 101198. [Google Scholar] [CrossRef]
  34. Wu, Q.; Du, Y.; Xu, H. Finding the earliest arrival path through a time-varying network for evacuation planning of mine water inrush. Saf. Sci. 2020, 130, 104836. [Google Scholar] [CrossRef]
  35. Mathilde, V.; Maciej, D.; Yoann, P. A theoretical and experimental study of a new algorithm for minimum cost flow in dynamic graphs. Discret. Appl. Math. 2021, 296, 203. [Google Scholar] [CrossRef]
  36. Li, X.; Yu, H.; Song, W. Investigation of pedestrian speed in formation evacuating in two specific water depths. Saf. Sci. 2024, 169, 106333. [Google Scholar] [CrossRef]
  37. Zhang, J. The Model-Calculus Subsystem of Short Track Speed Skating Tactical Simulation System. Ph.D. Thesis, Harbin Institute of Technology, Harbin, China, 2011. [Google Scholar]
  38. Jiang, Z. Artificial intelligence athlete training simulation system. Inf. Technol. 2022, 2, 95. [Google Scholar]
  39. Ibrahim, A.; Nnaji, C.; Namian, M. Investigating the impact of physical fatigue on construction workers’ situational awareness. Saf. Sci. 2023, 163, 106103. [Google Scholar] [CrossRef]
  40. Umer, W.; Yu, Y.; Afari, M. Towards automated physical fatigue monitoring and prediction among construction workers using physiological signals: An on-site study. Saf. Sci. 2023, 166, 106242. [Google Scholar] [CrossRef]
  41. Deng, K.; Hu, X.; Li, M. An extended social force model considering the psychological impact of the hazard source and its behavioural manifestation. Phys. A Stat. Mech. Its Appl. 2023, 627, 129127. [Google Scholar] [CrossRef]
  42. Ding, N.; Zhu, Y.; Liu, X. A modified social force model for crowd evacuation considering collision predicting behaviors. Appl. Math. Comput. 2024, 466, 128448. [Google Scholar] [CrossRef]
Figure 1. Open-channel flow (a) and full-channel flow (b).
Processes 13 03666 g001
Figure 2. Flow chart of the spatio-temporal evolution of the coal mine water inrush.
Processes 13 03666 g002
Figure 3. Three-dimensional model of the coal mine roadway.
Processes 13 03666 g003
Figure 4. Evolution of the water depth with the time, where the results of the 1-D simulation and 3-D simulation are compared.
Processes 13 03666 g004
Figure 5. Relationship between the escaping speed and water depth.
Processes 13 03666 g005
Figure 6. Physical energy reduction factor, representing the rate of physical energy decaying.
Processes 13 03666 g006
Figure 7. Spatial model of the coal mine.
Processes 13 03666 g007
Figure 8. Water depth (a) and escape speed (b) with the time, where the roadway segments are different.
Processes 13 03666 g008
Figure 9. Structure of the coal mine water inrush, including two water inrush points and four persons.
Processes 13 03666 g009
Figure 10. Evolution of the water depth with time at different roadway nodes.
Processes 13 03666 g010
Figure 11. Actual coal mine with multiple water inrush points.
Processes 13 03666 g011
Figure 12. Map of the water spread in the coal mine, where blue is the water spread.
Processes 13 03666 g012
Table 1. Error and computation time of the one-dimensional simulation and three-dimensional simulation.
Structure1-D Simu.3-D Simu.Time Cost ↓Max. ErrorAve. Error
Roadway curve0.7 min125 min99.4%15.3%10.2%
Roadway junction1.5 min215 min99.3%14.7%8.34%
Table 2. Lengths and window escape times of different roadways.
RoadwayLength/mWindow Escape Time/minEscape Time/minRisk Score
1-31742.251.760.78
1-63352.752.811.02
1-71334.251.150.27
7-81596.501.310.20
7-91876.501.440.22
Table 3. Risk scores and rescue priorities of different roadways during the escape of multiple persons.
RoadwayLengthEscape TimeRisk ScoreEscape SpeedRescue Priority
1-22557 m29.9 min0.9585.5 m/min#9
1-44350 m50.1 min0.6586.8 m/min#11
2-53927 m45.7 min0.7685.9 m/min#10
4-53682 m44.9 min0.9582.0 m/min#8
4-789 m1.45 min0.1261.3 m/min#7
5-6110 m2.35 min0.2846.8 m/min#3
5-8143 m4.95 min0.8328.8 m/min#2
6-947 m2.60 min0.6218.0 m/min#1
7-855 m1.10 min0.3950.0 m/min#6
8-9133 m2.76 min0.5248.1 m/min#4
9-1364 m1.33 min0.4348.1 m/min#4
Disclaimer/Publisher’s Note: The statements, opinions and data contained in all publications are solely those of the individual author(s) and contributor(s) and not of MDPI and/or the editor(s). MDPI and/or the editor(s) disclaim responsibility for any injury to people or property resulting from any ideas, methods, instructions or products referred to in the content.