Article

Comprehensive Investigation for CO2 Flooding Methodology in a Reservoir with High Water Content

1
Exploration and Development Research Institute, Jidong Oilfield Company, PetroChina, Tangshan 063002, China
2
Petroleum Engineering College, China University of Petroleum, Beijing 102249, China
*
Authors to whom correspondence should be addressed.
Processes 2025, 13(11), 3657; https://doi.org/10.3390/pr13113657
Submission received: 29 September 2025 / Revised: 4 November 2025 / Accepted: 7 November 2025 / Published: 11 November 2025
(This article belongs to the Special Issue Advanced Technology in Unconventional Resource Development)

Abstract

In response to the development challenges caused by the high initial water saturation, low porosity, low permeability, and strong heterogeneity in C tight sandstone reservoirs, a comprehensive study was conducted on the optimization of development methods using a fuzzy model, core flooding experiments, and reservoir numerical simulations. The initial evaluation indicates the good adaptability of CO2 flooding for improving oil recovery in a C reservoir; the experimental result of the CO2 displacement method also performs the best, with a recovery rate of 68.38% at a connate water saturation of about 30%, compared with surfactant flooding and water flooding. However, higher water saturation inhibits the CO2 development effect. The oil recovery factor of pure CO2 huff-n-puff is 32.24% lower than the CO2 displacement method, while surfactant-assisted CO2 huff-n-puff can increase the recovery rate by 0.85% compared to pure CO2. Based on actual geological models, numerical simulations were conducted on Well Block A and B. The results showed that the optimized production pressure is above the Minimum Miscibility Pressure (16.44 MPa); with consideration of the fracture pressure limitation, the CO2 injection rate in Block A should be less than 3000 m3/d, and the recovery rate after 10 years is only 0.48% (oil change ratio is 0.07 t/t), while the CO2 displacement rate of Block B should not exceed 7500 m3/d, and the recovery rate after 10 years can reach 27.39% (oil change ratio is 0.2 t/t). CO2 displacement is an effective development method for a C reservoir, but due to a high water content the oil change ratio is very low, indicating a low potential for further development. The research provides important references for the development of similar oil reservoirs.

1. Introduction

Unconventional resources possess substantial reserves, primarily consisting of shale oil, sandstone oil, heavy oil, and tight oil globally [1]. Tight sandstone reservoirs are a key focus in current oil and gas exploration and development and are a vital component of China’s current energy strategy [2,3,4,5]. However, conventional development methods are difficult to implement economically and effectively for tight sandstone reservoirs, which are characterized by low porosity and low permeability [6]. A C reservoir is a typical high-water-cut tight sandstone reservoir in China, with an average oil saturation of 31.6%, an average porosity of 8.32%, and permeability of 0.78 mD, indicating a low hydrocarbon enrichment. Additionally, the average crude oil viscosity is 4.18 mPa·s. According to the theory proposed by Aladasani and Bai [7], it is preliminarily concluded that CO2 miscible flooding is the most suitable development approach for reservoir C. The mechanisms of CO2-enhanced oil recovery primarily include the following [8,9,10,11,12,13,14]: (1) Microscopic effects: extraction and vaporization effects, molecular diffusion, and convective dispersion (molecular diffusion being the primary factor [15]). (2) Macroscopic effects: dissolution-induced viscosity reduction, interfacial tension reduction, improved fluidity, and macroscopic dispersion.
In 2014, Zhang Li [16] pointed out that, during CO2 miscible flooding, CO2 can extract light components, achieving miscibility between CO2 and crude oil. This effectively reduces capillary forces and lowers oil viscosity, thereby enhancing the recovery efficiency. In 2018, PVT experiments performed by Guo Maolei et al. [17] demonstrated that, at a constant pressure, the reservoir fluid density decreases with increasing CO2 injection concentrations, the volumetric expansion coefficient gradually increases with increased injected CO2 concentrations, and the reservoir fluid viscosity decreases with higher CO2 concentrations. In 2021, Gu Yinlong et al. [18] demonstrated through core flooding experiments that CO2 flooding significantly enhances the production capacity in ultra-low-permeability wells, improving the oil recovery factor with broad application prospects. In 2023, Wang et al. [19] discovered that the CO2 flooding efficiency in tight sandstone reservoirs positively correlates with reservoir permeability and CO2 injection pressure. Flooding efficiency rapidly increases from near-miscible to miscible flooding stages, while it decreases with further increasing injection pressures afterward miscible pressure is reached.
Additionally, numerous scholars have conducted research on CO2 flooding in tight sandstone reservoirs. In 2017, Liu Jianyi et al. [20] demonstrated that CO2 flooding enhances recovery primarily through diffusion, dissolution, and expansion using a self-developed high-temperature, high-pressure microscopic visualization apparatus. This process involved alternating conversions between velocity potential and concentration potential, liberating crude oil trapped in small pores and dead pores. In the same year, Zuloaga, Pavel et al. [21] indicated that, for a permeability between 0.001 mD and 0.01 mD, the incremental recovery from CO2 flooding grew due to the expanded fracture contact area. In 2019, Ma Quanzheng et al. [22] analyzed residual oil distribution across different pore sizes using nuclear magnetic resonance (NMR) technology. The results indicated that the cumulative recovery increment becomes slower with increasing cycle numbers. In 2022, Song Yilei et al. [23] employed NMR technology to demonstrate that CO2 flooding is better than N2. In the same year, Samuel Afari [24] employed the response surface methodology (RSM) to investigate the impact of five key operational parameters—injection rate, injection cycle, steaming cycle, production cycle, and production wellbore pressure—on oil and gas recovery efficiency. The study revealed that the wellbore pressure and production cycle were the most influential parameters affecting recovery rates.
This study compared the displacement efficiency of different displacement media (CO2, water, surfactants) through core displacement experiments. After determining CO2 as the optimal displacement agent, the effects of injection rate, backpressure, water saturation, and other factors on displacement efficiency were also analyzed. Furthermore, based on huff-n-puff experiments, CO2 is also the optimal medium, though the huff-n-puff recovery rate was significantly lower than the displacement recovery rate. Finally, using CMG 2021 numerical simulation software on an actual geological model, CO2 displacement was simulated to assess the feasibility of this method and to optimize production parameters. The findings for the development method of the C reservoir can guide field development practices.

2. Adaptability Analysis of CO2 Flooding Based on the Fuzzy Hierarchical Comprehensive Evaluation Method

The methods for screening and evaluating the potential of CO2-enhanced oil recovery reservoirs mainly include the binary comparison method, proxy model method, and fuzzy comprehensive evaluation method [25,26]. The fuzzy comprehensive evaluation method is based on fuzzy mathematics and hierarchical analysis theory, which can weigh the influence of various parameters. This method requires calculating the suitability of the main evaluation indicators in the CO2 miscible flooding process according to the screening criteria based on fuzzy membership functions.
The latest developed fuzzy analytic hierarchy process is used to obtain weights. In order to make the evaluation results more reliable and comparable, three successful CO2 flooding reservoirs [27], together with reservoir C, were evaluated, as shown in Table 1, with the membership degree calculation shown in Table 2. The computed membership matrix R is obtained, leading to the construction of the fuzzy judgment matrix P. Subsequently, normalization is performed, and, after calculating the weights W, the fuzzy comprehensive evaluation index Z = R × W is obtained (Equations (1)–(4)).
The membership degree matrix is shown below:
R = 0.9836 1 1 1 1 0.9846 1 0.9836 1 1 0.9972 1 1 0.6183 0.9990 1 1 1 0.0907 0.8 0.9987 0.8918 1 1 1 0.0602 1 1
A fuzzy judgment matrix is constructed as follows:
P = 0.5000 0.5000 0.7000 0.6262 0.7930 0.8542 0.8786 0.5000 0.5000 0.7000 0.6262 0.7930 0.8542 0.8786 0.3000 0.3000 0.5000 0.4262 0.5930 0.6542 0.6786 0.3738 0.3738 0.5738 0.5000 0.6668 0.7281 0.7524 0.2070 0.2070 0.4070 0.3332 0.5000 0.5613 0.5856 0.1458 0.1458 0.3458 0.2709 0.4387 0.5000 0.5243 0.1214 0.1214 0.3214 0.2476 0.4144 0.4757 0.5000
The normalized weight is as follows:
W = 0.198051325 0.198051325 0.140905436 0.161996351 0.114336679 0.096792891 0.089865993
The fuzzy comprehensive evaluation index Z is calculated as follows:
Z = R × W = 0.9953 0.9620 0.8763 0.8711
The closer the index Z is to 1, the more suitable the reservoir is for CO2 injection. The Z of reservoir C is 0.8711, slightly lower than that of reservoir 3# in the literature, indicating a strong adaptability for CO2 injection development to enhance the recovery efficiency for targeted reservoir C.

3. Laboratory-Scale Core Experiment Research

3.1. Experimental Equipment and Methods

(1)
Cores: All cores are natural cores collected from the oilfield. They all have a diameter of 2.5 cm and length of about 5–6 cm.
(2)
Gas: CO2, with a purity of 99.99%.
(3)
Formation water: Water-type CaCl2; the total salinity is 23,546 mg/L. The crude oil viscosity at 90 °C is 4.18 mPa·s.
(4)
Surfactants: 0.1% Sodium dodecylbenzenesulfonate (SDBS) at mass concentration, 0.1% Tween 80, and a mixture of the two (SDBS to Tween 80 is 2.5:1).
(5)
Fracturing fluid: Collected from the oilfield.
The experimental flowchart is shown in Figure 1.

3.2. Experimental Procedures

3.2.1. Experimental Procedure for Core Flooding

① The cores are cleaned, dried, and their porosity and permeability are measured. The core data are presented in Table 3.
② The cores are saturated with formation water.
③ The cores are saturated with oil. The connate water saturation is then calculated.
④ The oil is displaced by different media according to the designed parameters. Data are recorded for calculating relative permeability using the unsteady-state method.
As the Minimum Miscible Pressure (MMP) between oil and CO2 is 16.44 MPa (provided from the oilfield), the back pressure is set to be 25 MPa to maintain miscible CO2 flooding.

3.2.2. Experimental Procedure for Huff-n-Puff

① Core cleaning: The core parameters and experimental scheme are shown in Table 4.
② The apparatus is put into a thermo-tank at 90 °C.
③ CO2 is injected (fracturing fluid, surfactant, CO2 + surfactant) into the core at 25 MPa. The soaking time is 5 h.
④ The fluids are allowed flow out from the inlet of the core until the pressure drops to 15 MPa.
⑤ The next huff-n-puff cycle is performed; steps ③ and ④ are repeated. Four cycles are simulated.

3.3. Experimental Results and Analysis

3.3.1. Comparison Between Different Displacement Media and Influencing Factors

(1)
Comparison between Different Displacement Media
The comparison between recovery efficiency and the differential pressure of water flooding (Core N1), surfactant flooding (Core N2), and CO2 flooding (Core N3) at different injected pore volumes is shown in Figure 2. CO2 flooding demonstrated the highest oil recovery factor of 68.38%. Surfactant flooding is also good, with a recovery rate of 62.5%, while water flooding is 51.61%. CO2 flooding also has the advantage of a lower pressure differential needed, which is only about 7.5 MPa, compared to the 35 MPa for water and surfactant flooding. Therefore, CO2 flooding is more suitable for developing the target reservoir.
(2)
Factors Affecting CO2 Flooding
The influencing effects of some key production parameters (injection rate and water saturation) on the recovery efficiency of CO2 flooding are investigated.
① Effect of Injection Rate on Recovery Efficiency
The effects of the injection rate on the recovery efficiency and oil–gas production ratio are shown in Figure 3a and Figure 3b, respectively. At an injection rate of 0.2 mL/min (for core N3), the recovery efficiency exceeds that at 0.1 mL/min (for core N4) by only 0.62%. Furthermore, the gas–oil ratio in 0.1 mL/min is larger than it is in 0.2 mL/min, which is not favorable. The injection rate of 0.2 mL/min is used for the other experiments.
② The Effect of Water Saturation on Recovery Efficiency
Due to high water-cut of the target oilfield, the impact of different water saturations on the recovery efficiency is studied and shown in Figure 4. For Core N5 with a 52.26% water saturation, the resistance for the CO2 flow is largely increased, resulting in a nearly 20% reduction in the recovery efficiency compared to a lower water saturation (Sw = 29.02%).

3.3.2. Comparison Between Different Huff-n-Puff Media and Influencing Factors

(1)
Comparison between Different Huff-n-Puff Media
Huff-n-puff becomes preferable when the CO2 source is limited. Using cores N6, N7, N8, and N9, four huff-n-puff experiments were conducted using different media, including fracturing fluid, surfactant, CO2, and surfactant-assisted CO2, respectively. The results are presented in Table 5. The cumulative recovery rate for CO2 huff-n-puff reached 35.29%, significantly higher than that from surfactant flooding (26.28%) or fracturing fluid flooding (23.59%). Adding surfactants to CO2 huff-n-puff further enhanced the recovery rates by 0.85%.
(2)
Factors Affecting CO2 Flooding
① Effect of Soaking Time on Recovery Efficiency
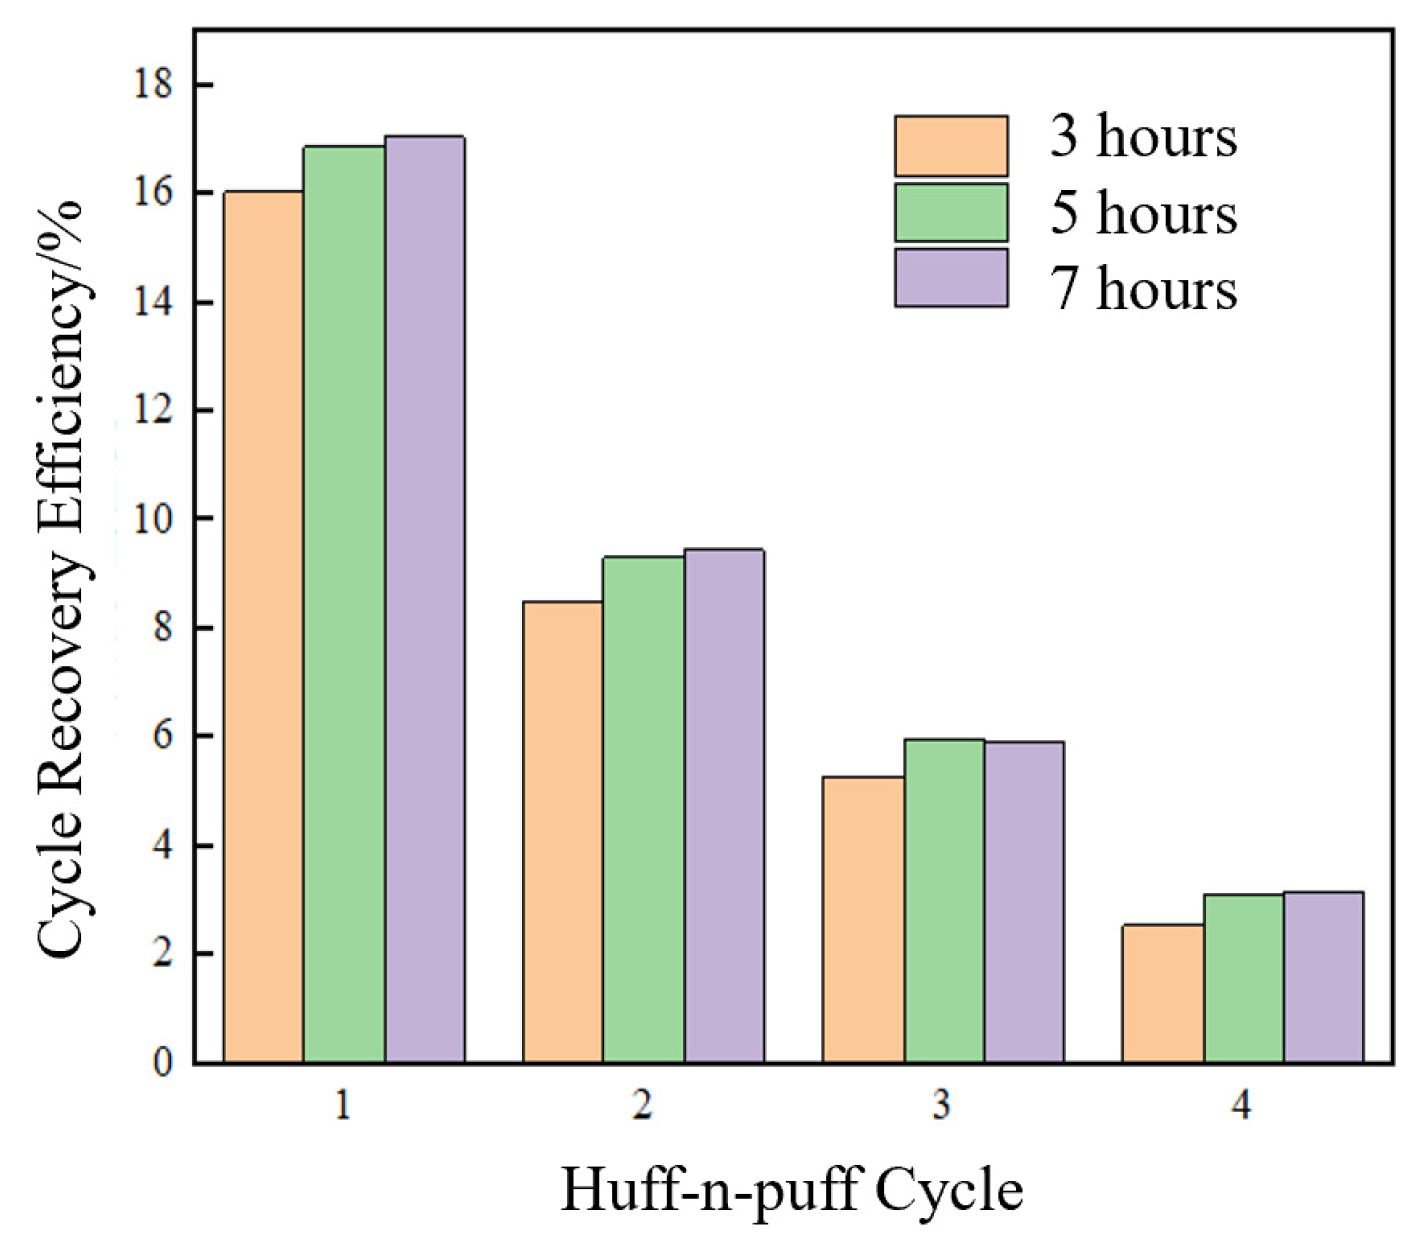
The soaking stage is when the wells are shut in, allowing CO2 and crude oil to fully interact. Figure 5 shows the decline in cyclic recovery efficiency under different soaking times based on Core N9, N10, and N11.
The cumulative recovery rates after 3 h, 5 h, and 7 h of soaking time are 32.40%, 35.29%, and 35.56%, respectively, meaning an increase in recovery efficiency from 3 h to 5 h of 2.89% and from 5 h to 7 h of 0.27%. This indicates that a longer soaking time can enhance crude oil recovery rates, but the effect gradually diminishes after the soaking time reaches a certain value.
② Effect of Cycle on Recovery Efficiency
The recovery rates at different cycles decrease as the number of huff-n-puff cycles increases (as in Figure 5). When the soaking time is 5 h, the recovery rate achieved from the first two cycles accounts for 76.56% of the total recovery rate, which is 35.29%.
However, the recovery rates for CO2 huff-n-puff are significantly lower than for CO2 displacement, which is 68.38%, as shown in Section 3.3.1. So, the reservoir simulation for Well Block A and B was later conducted using CO2 displacement.

4. Reservoir Numerical Simulation and Analysis

The experimental study proved that the target reservoir is more suitable for the CO2 injection method. A numerical simulation was conducted based on the relative permeability curves obtained from experiments, providing a basis for simulating the behavior of CO2 flooding in the target reservoir.
The 3D Field geological model was established by Petrel and then imported to CMG 2021 software to analyze the CO2 flooding effectiveness and optimize the production parameters. Two blocks named Well Block A and Well Block B were intentionally selected, which were representative wells for the whole oilfield. To make it clearer, Well A is a single existing production vertical well with a fracture half-length of 188 m and a conductivity of 10D·cm. Four injection wells are arbitrarily added in the simulation process to make a five-spot well pattern and check the development effect; this is called Well Block A. To enhance computational efficiency, layer merging was used, and, for example, the geological model for Well Block A was merged from 30 layers into 6 layers (Figure 6).
To check this layer merging accuracy and efficiency, daily and cumulative oil production data before and after layer merging were compared (Figure 7), with a very good consistency, showing that the layer merging is necessary and efficient.

4.1. Numerical Simulation for CO2 Flooding

Based on the simplified geological model for Well Block A, fluid composition fitting was performed first, followed by a parameter optimization for CO2 flooding using a five-point well pattern (with Well A as the production well and four injection wells at the corner, with a similar well distance 230 m), which was employed for the CO2 flooding method. Then, the effects of the gas injection rate on the recovery efficiency were investigated.
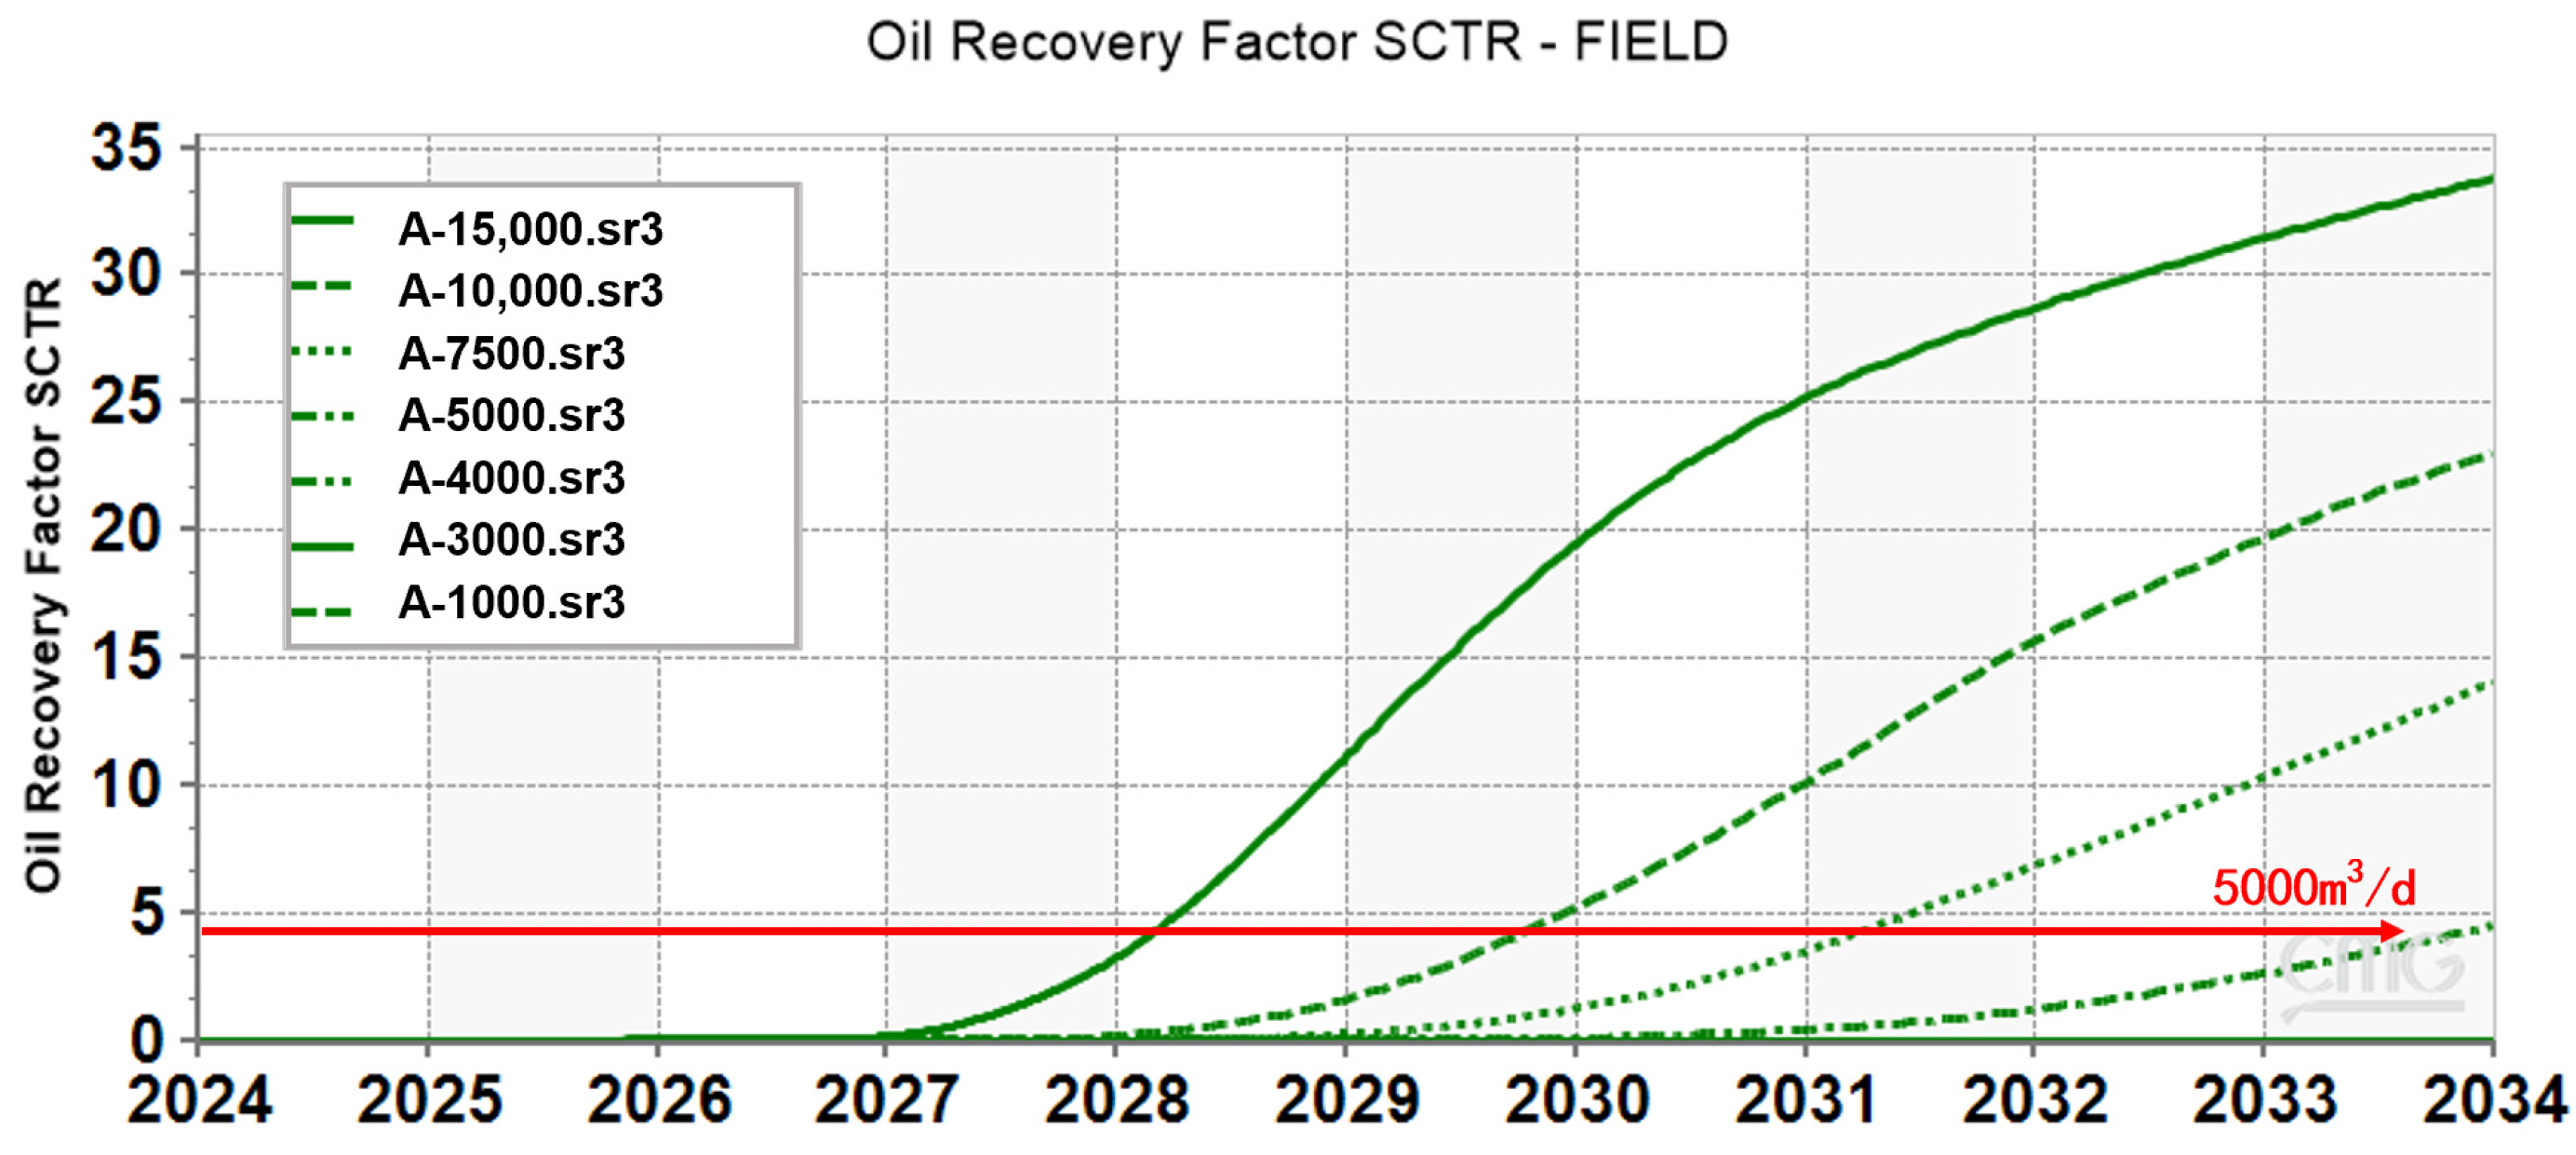
With the production pressure being at the minimum miscibility point, gas injection rates of 1000 m3/d, 3000 m3/d, 4000 m3/d, 5000 m3/d, 7500 m3/d, 10,000 m3/d, and 15,000 m3/d were separately set, with all other parameters held constant for simulation (Figure 8). Similarly to the experimental results, lower injection rates resulted in delayed oil production and reduced recovery rates; therefore, the injection rates should be maximized if possible. The recovery rates at different injection rates are shown in Table 6. Field data indicate that Well A has a fracture pressure of 44.2 MPa, meaning that the injection rate should not exceed 7500 m3/d. As the simulation results show, the recovery rate is below 27.39% after 10 years. Using the same methodology, Well Block B is also evaluated using the CO2 flooding development method. Well B has a fracture pressure of 31.7 MPa, showing that the injection rate should not exceed 3000 m3/d. The recovery efficiency of Well B is only 0.5% after 10 years, which is significantly lower than Well A.

4.2. Oil Change Rate of CO2 Analysis

The oil change rate of CO2 refers to the mass of crude oil displaced per unit mass of injected CO2, indicating the displacement capacity of CO2 during oil recovery. The oil change rate for CO2 flooding at Well Block A and Well Block B was calculated as a function of the daily CO2 injection rates, with the results shown in Figure 9.
Well A exhibits a higher oil change rate of CO2 than Well B, though both remain below 0.2 t/t—lower than other tight reservoirs as reported from the literature (Table 7).
Increasing the injection rates significantly boosts the displacement efficiency; when the daily injection volume rises from 3000 m3/d to 7500 m3/d, enhanced recovery becomes markedly evident. Increasing the daily gas injection rate helps to improve the formation pressure, favor CO2 miscibility, and thereby enhance the recovery efficiency. However, excessive injection rates may induce a severe turbulent flow, which should be avoided. Therefore, in the design of CO2 flooding, the injection rates should be carefully selected based on the reservoir characteristics to achieve an optimal flooding performance.
The CO2 miscible flooding technology is relatively mature and feasible for this type of oil reservoir. However, from an economic perspective, due to the low oil displacement ratio and economic considerations such as drilling new wells and adding gas injection facilities, the input–output ratio is relatively high.

5. Conclusions

(1)
A Fuzzy Hierarchical Comprehensive Evaluation method is firstly applied for the adaptation analysis of CO2 flooding, and the results are compared with the published data for other similar reservoirs. The fuzzy comprehensive evaluation index Z is 0.8711 for target reservoir C, showing the good adaptation of CO2 flooding, and thus more confidence is obtained in determining the development method.
(2)
Core flooding experiments demonstrate that CO2 exhibits the highest oil displacement efficiency, outperforming surfactants and formation water. At an injection rate of 0.2 mL/min, the core recovery slightly exceeds that at 0.1 mL/min. An increased water saturation elevates oil displacement resistance, so the recovery rate of CO2 significantly decreases.
(3)
Under identical CO2 flooding conditions, surfactant-assisted CO2 huff-n-puff demonstrated the highest recovery rate, 0.85% higher than the recovery rate of only CO2 huff-n-puff. Considering the cost of the surfactant, CO2 is the optimized medium for huff-n-puff. The experimental study also shows that the recovery factor increases when the soaking time increases, while the increment rate drops, and 5 h in lab conditions is the optimized soaking time. Similarly, the cumulative recovery rate increases with huff-n-puff cycles, while the cyclic recovery rate decreased with increased flooding cycles.
(4)
Based on the geological models of Well A and B, a CO2 flooding simulation was conducted. Layer merging significantly enhances computational efficiency, while maintaining calculation accuracy. For reservoir C, CO2 miscible flooding using a five-spot well pattern can effectively enhance the oil recovery rate if an optimal injection rate can be achieved. However, constrained by the formation fracture pressure, the CO2 flooding injection rate for Well A should not exceed 7500 m3/d, resulting in a 10-year recovery rate of 27.39% and an oil replacement rate of 0.2 t/t, with an oil change rate of 0.2 t/t. For Well Block B, the CO2 injection rate should be less than 3000 m3/d, corresponding to a recovery rate of only 0.48% after 10 years and an oil change rate of 0.07 t/t.
(5)
The C reservoir’s tight sandstone formation exhibits a very low initial oil saturation, which is 30–50%. Although various methods have demonstrated the effectiveness of CO2 flooding compared to other methods, the oil recovery rate remains low. Considering the cost in drilling new wells and expanding gas injection facilities, the future development of the C reservoir is highly challenging.

Author Contributions

Writing-original draft, S.C.; Methodology, S.C.; data acquisition, B.W.; investigation, B.W. and J.M.; Formal analysis, Q.W. and H.K.; Funding Acquisition, J.M., Writing-review and editing, Supervision, X.W. All authors have read and agreed to the published version of the manuscript.

Funding

This research received no external funding.

Data Availability Statement

The original contributions presented in this study are included in the article. Further inquiries can be directed to the corresponding authors.

Conflicts of Interest

Authors Shaoyong Chen, Bo Wang, Qiong Wu, Jing Miao, and Haijun Kang were employed by the Exploration and Development Research Institute, Jidong Oilfield Company. The remaining authors declare that the research was conducted in the absence of any commercial or financial relationships that could be construed as a potential conflict of interest.

References

  1. Li, Q.; Xing, H.; Liu, J.; Liu, X. A review on hydraulic fracturing of unconventional reservoir. Petroleum 2015, 1, 8–15. [Google Scholar] [CrossRef]
  2. Pan, B.; Fang, C.; Guo, Y.; Zhang, L.; Lei, J.; Fan, Y. Logging Evaluation and Production Capacity Prediction of Sulige Tight Sandstone Reservoirs Based on Rock Physics Conversion Models. Chin. J. Geophys. 2018, 61, 5115–5124. [Google Scholar]
  3. Han, Y.; Xie, J. Review of the Mechanism of Water Lock Damage in Tight Sandstone Reservoirs. Petrochem. Technol. 2018, 25, 222. [Google Scholar]
  4. Zhang, S.; Abdallah, K.B.; Li, L.; Hamdi, E.; Liu, J. Multiphase flow controlled by synergistic injection-production pressure: Enabling CO2 geo-sequestration with additional gas recovery from vertically heterogeneous depleted shale reservoirs. Fuel 2025, 398, 135591. [Google Scholar] [CrossRef]
  5. Gao, H.; Sun, W.; Pang, Z.; Zhang, R.; Ma, E. Study on the Saturation of Mobile Fluids in Low-Permeability Tight Gas Reservoirs: A Case Study of the Box 8 Reservoir in the Sulige Su 48 Block. Adv. Geophys. 2014, 29, 324–330. [Google Scholar]
  6. Chengzao, J.I.A. On the breakthroughs and significance of unconventional oil and gas in classical petroleum and natural gas geology theory. Pet. Explor. Dev. 2017, 44, 1–10. [Google Scholar]
  7. Al Adasani, A.; Bai, B. Analysis of EOR projects and updated screening criteria. J. Pet. Sci. Eng. 2011, 79, 10–24. [Google Scholar] [CrossRef]
  8. He, Y.; Zhao, S.; Ji, B.; Liao, H.; Zhou, Y. Selection and Potential Evaluation of Sandstone Reservoirs for CO2 EOR. Oil Gas Geol. Recovery Rate 2020, 27, 140–145. [Google Scholar]
  9. Wang, G.; Zheng, X.; Zhang, Y.; Lü, W.; Wang, F.; Yin, L. Screening method for low-permeability reservoirs suitable for carbon dioxide flooding. Pet. Explor. Dev. 2015, 42, 390–396. [Google Scholar] [CrossRef]
  10. Wang, Y. Mechanism Study on CO2 EOR in Tight Sandstone Reservoirs. Ph.D. Thesis, Northwest University, Xi’an, China, 2019. [Google Scholar]
  11. Lan, J.; Tang, F.; Xie, D.; Liang, X.; Mao, J.; Wang, G. Experimental Study on CO2 EOR in Tight Reservoirs. Contemp. Chem. Ind. 2023, 52, 997–1001. [Google Scholar]
  12. Shu, X. The Effect of Interfacial Tension on the Relative Permeability Curve of CO2 EOR in Low-Permeability Reservoirs. J. Pet. Nat. Gas 2013, 35, 122–123. [Google Scholar]
  13. Sun, C.; Wang, W.; Chen, G.; Ma, C. Experimental Study on the Interfacial Tension of Oil/Water and Oil/Gas Interfaces in CO2-Injected Oil and Gas Reservoir Fluid Systems. J. China Univ. Pet. Nat. Sci. Ed. 2006, 30, 109–112. [Google Scholar]
  14. Wang, H.; Wang, R.; Lu, Z.; Lyu, C.; Luo, M.; Zhao, C. High-temperature and high-pressure CO2/crude oil interfacial tension and its effect on oil displacement efficiency. Sci. Technol. Eng. 2017, 17, 38–42. [Google Scholar]
  15. Alfarge, D.; Wei, M.; Bai, B. Factors Affecting CO2-EOR in Shale-Oil Reservoirs: Numerical Simulation Study and Pilot Tests. Energy Fuels 2017, 31, 8462–8480. [Google Scholar] [CrossRef]
  16. Zhang, L. Feasibility analysis of carbon dioxide enhanced oil recovery technology in low permeability Fuyou oil reservoirs. Inn. Mong. Petrochem. Ind. 2014, 40, 108–109. [Google Scholar]
  17. Guo, M.; Huang, C.; Dong, X.; Zhou, Y.; Tang, R. Study on the Mechanism of CO2 Enhanced Oil Recovery in Tight Sandstone Reservoirs of Yanchang Oilfield. Pet. Nat. Gas Chem. 2018, 47, 75–79, 88. [Google Scholar]
  18. Gu, Y. Carbon Dioxide Flooding Technology for Ultra-Low Permeability Reservoirs to Greatly Enhance oil Recovery. IOP Conf. Ser. Earth Environ. Sci. 2021, 859, 012066. [Google Scholar] [CrossRef]
  19. Wang, C.; Cui, M.; Wang, K.; Wei, Y.; Wang, K.; Gao, H. Full-Scale Experimental Study on the Effect of CO2 Flooding on Storage-Seepage Capacity of Tight Sandstone Reservoirs. ACS Omega 2023, 8, 11897–11907. [Google Scholar] [CrossRef] [PubMed]
  20. Liu, J.; Li, M.; Liu, Y.; Zhou, H. Visualization Experiment on the Micro-Mechanism of CO2 Injection and Extraction. Block Oil Gas Fields 2017, 24, 230–232. [Google Scholar]
  21. Zuloaga, P.; Yu, W.; Miao, J.; Sepehrnoori, K. Performance evaluation of CO2 Huff-n-Puff and continuous CO2 injection in tight oil reservoirs. Energy 2017, 134, 181–192. [Google Scholar] [CrossRef]
  22. Ma, Q.; Yang, S.; Lv, D.; Wang, M.; Chen, J.; Kou, G.; Yang, L. Experimental investigation on the influence factors and oil production distribution in different pore sizes during CO2 huff-n-puff in an ultra-high-pressure tight oil reservoir. J. Pet. Sci. Eng. 2019, 178, 1155–1163. [Google Scholar] [CrossRef]
  23. Song, Y.; Song, Z.; Zeng, H.; Tai, C.; Chang, X. N2 and CO2 Huff-n-Puff for Enhanced Tight Oil Recovery: An Experimental Study Using Nuclear Magnetic Resonance. Energy Fuels 2022, 36, 1515–1521. [Google Scholar] [CrossRef]
  24. Afari, S.; Ling, K.; Sennaoui, B.; Maxey, D.; Oguntade, T.; Porlles, J. Optimization of CO2 huff-n-puff EOR in the Bakken Formation using numerical simulation and response surface methodology. J. Pet. Sci. Eng. 2022, 215, 110552. [Google Scholar] [CrossRef]
  25. Wang, T.; Zhang, X.; Xu, J. Application of Fuzzy Integrated Evaluation Method in Well Selection for Intra-layer CO2 Enhanced Oil Recovery. Digit. Des. 2016, 5, 56–58. [Google Scholar]
  26. He, Y.; Zhao, S.; Ji, B.; Liao, H.; Zhou, Y. Reservoir Screening and Potential Evaluation for CO2 EOR in Sandstone Reservoirs. Oil Gas Geol. Recovery Rate 2020, 27, 140–145. [Google Scholar]
  27. Yu, M.; Li, X.; Tie, L.; Xu, J.; Liu, W. Establishment and Application of a CO2 Fracturing Screening System for Low-Permeability Reservoirs Based on an Improved Fuzzy Comprehensive Evaluation Method. Math. Pract. Underst. 2017, 47, 114–119. [Google Scholar]
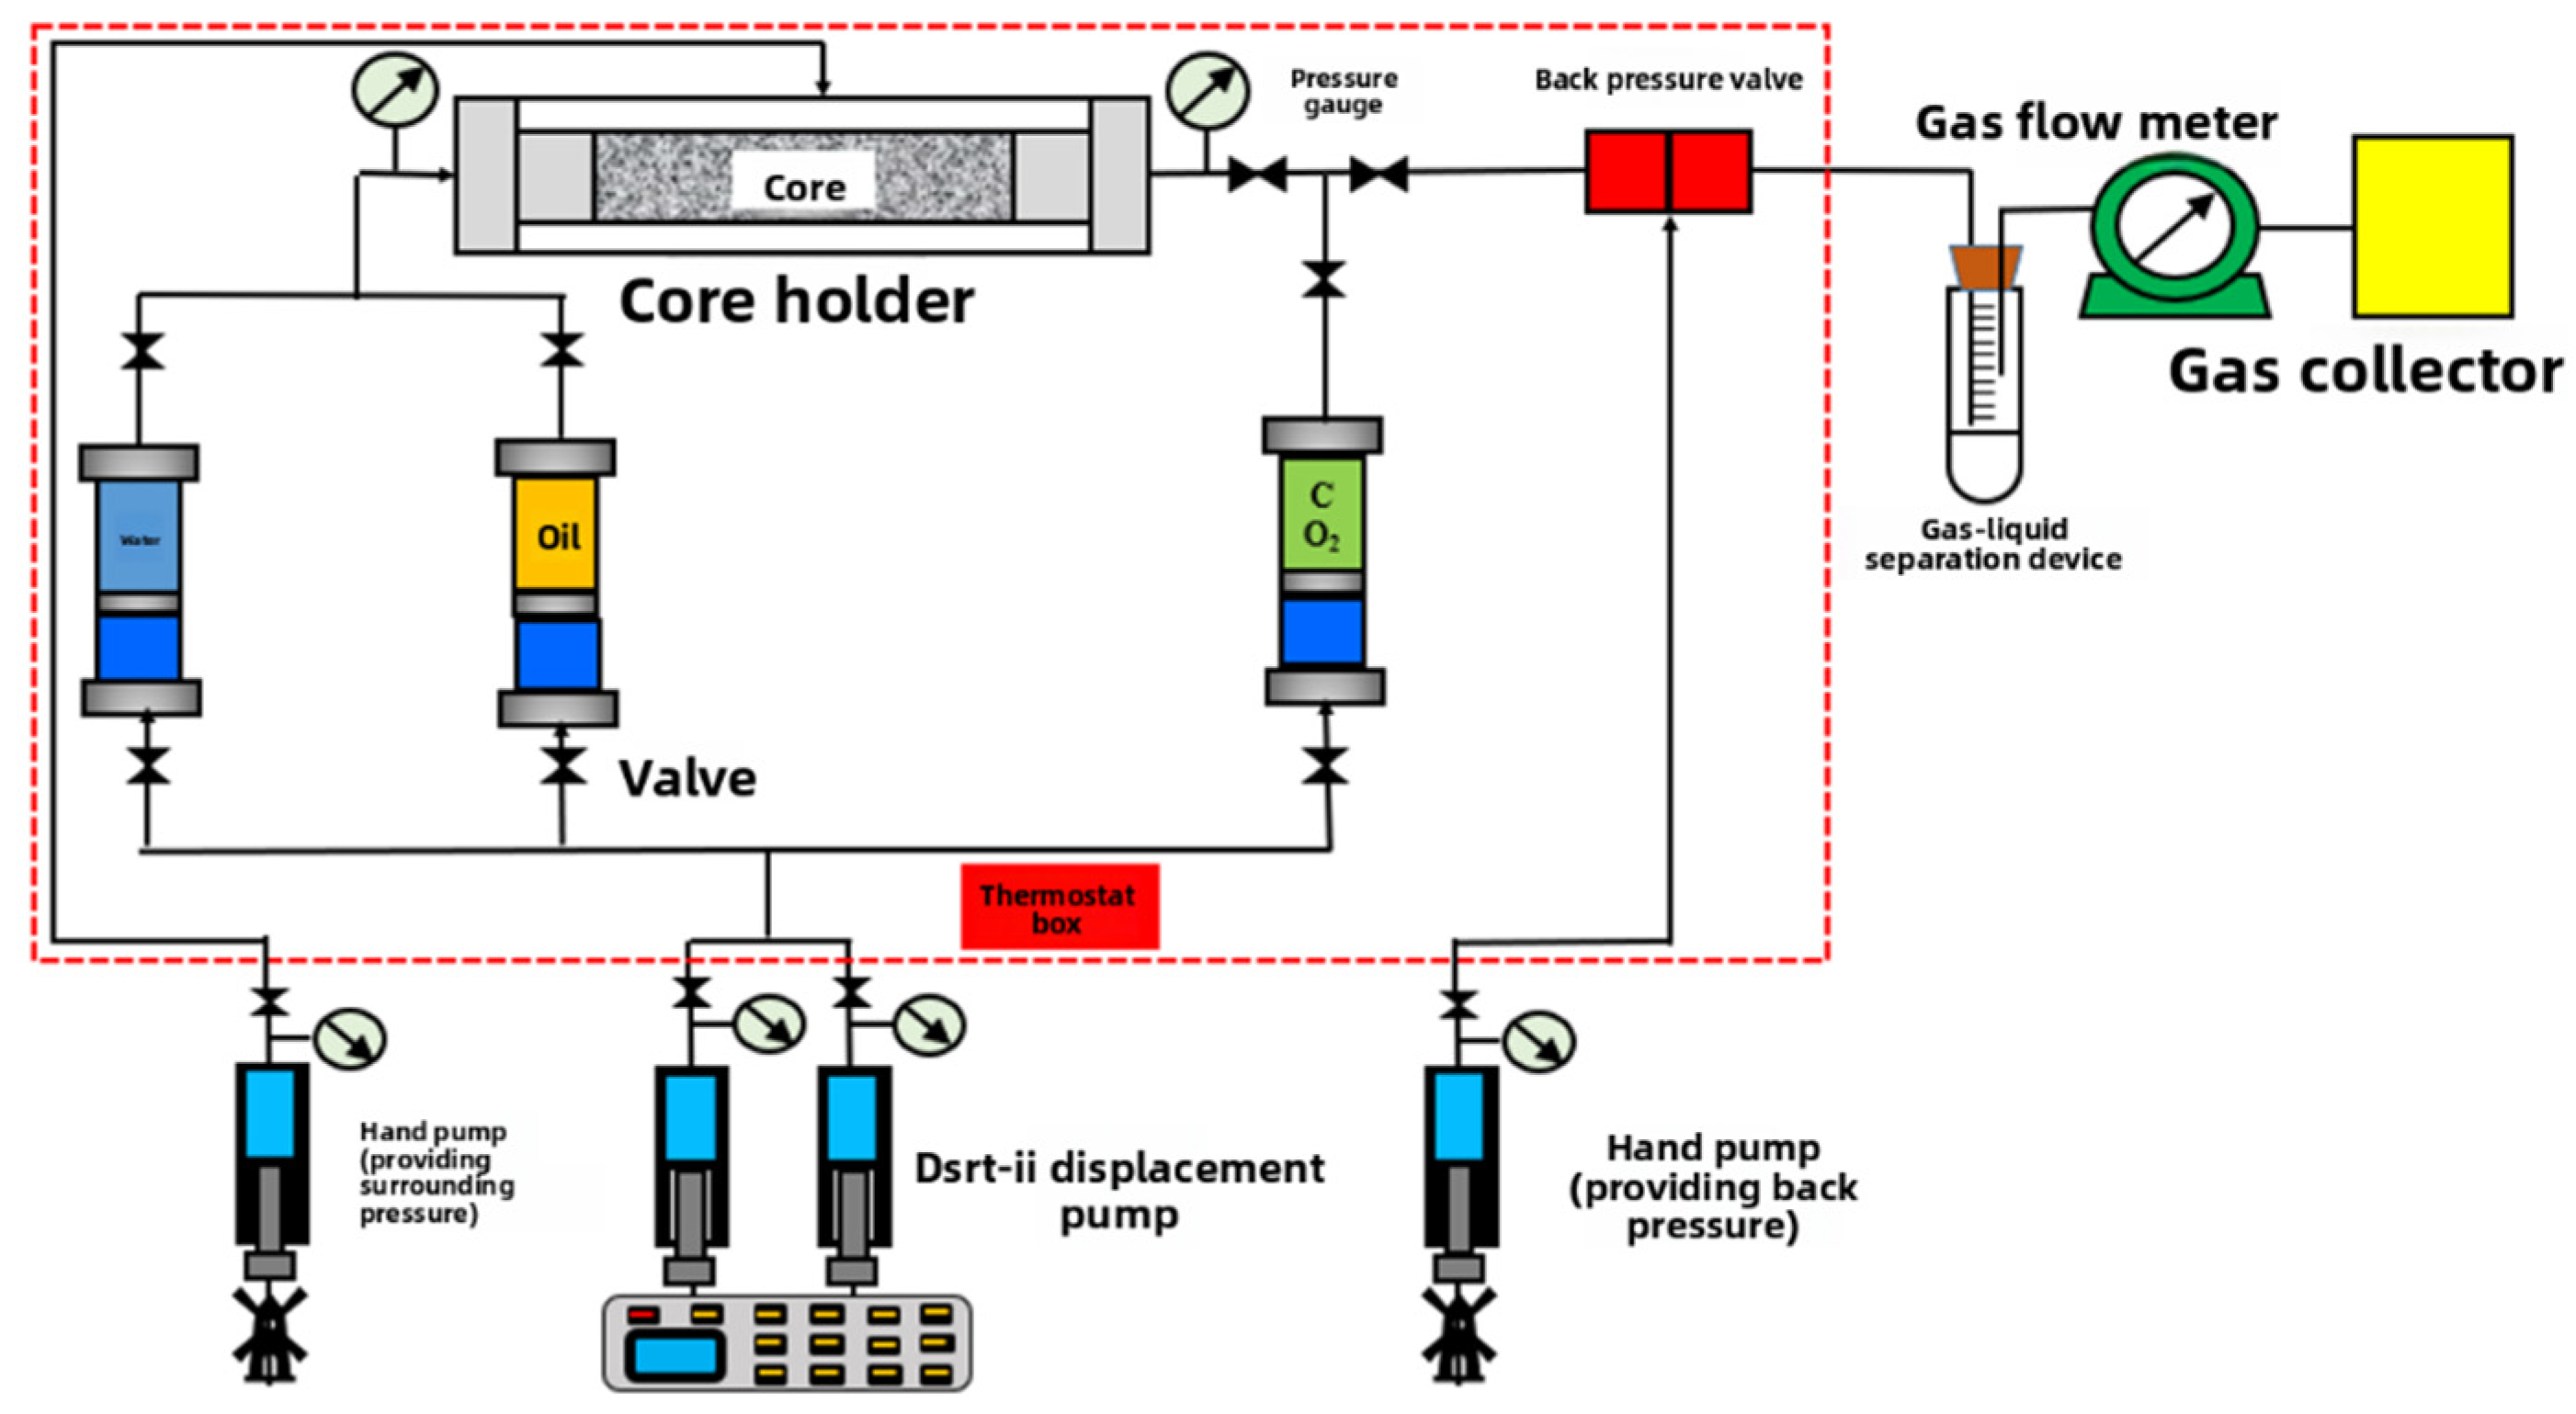
Figure 1. Experimental setup and flowchart.
Processes 13 03657 g001
Figure 2. Comparison of water, surfactant, and CO2 flooding effect.
Processes 13 03657 g002
Figure 3. Effect of injection rate on displacement efficiency and gas–oil ratio.
Processes 13 03657 g003
Figure 4. Effect of water saturation on recovery efficiency.
Processes 13 03657 g004
Figure 5. Recovery rate at different soaking times and huff-n-puff cycles.
Processes 13 03657 g005
Figure 6. Oil saturation distribution of 3D geological model for Well Block A.
Processes 13 03657 g006
Figure 7. Daily oil production curve and cumulative production curve before and after merging.
Processes 13 03657 g007
Figure 8. The influence of CO2 flooding injection rate on the development effect of Well A.
Processes 13 03657 g008
Figure 9. Oil change rate curves for Well Block A and B.
Processes 13 03657 g009
Table 1. Reservoir parameters.
BlockViscosity/mPa·sDensity/(g·cm−3)Oil Saturation/%Temperature
/°C
Permeability/
(10−3 μm2)
Porosity/%Depth
/m
1#3.587140882081676
2#3.587372181618336
3#3.287683391.26579
C4.18832.750900.2610.132673
Table 2. Membership degree calculation result.
BlockViscosity/mPa·sDensity/(g·cm−3)Oil Saturation/%Temperature
/°C
Permeability/
(10−3 μm2)
Porosity/%Depth
/m
1#0.983611110.98461
2#0.9836110.9972110.6183
3#0.99901110.09070.80.9987
C0.89181110.060211
Table 3. Core data from displacement experiments.
Core
Number
Porosity/%Gas Permeability/mDLength/cmDiameter/cmDisplacement
Medium
Pressure
/MPa
Constant Speed/
(min·mL−1)
Back
Pressure
/MPa
Water
Saturation
/%
N19.090.695.7592.505water 35 32.12
N29.490.755.371 2.506Surfactant 35 30.81
N39.790.645.667 2.509CO2 0.22529.02
N49.530.635.6832.508CO2 0.12527.44
N512.350.665.8132.503 CO2 0.22552.26
Table 4. Core data for huff-n-puff experiments.
Core.
Number
Porosity/%Gas Permeability/mDLength/cmDiameter/cmDisplacement
Medium
Injection Pressure/MPaBack
Pressure/MPa
Soaking Time/hCycles
N67.40.345.8152.503Fracturing Fluid251554
N79.50.575.9192.502Surfactant251554
N86.30.305.9602.523CO2251554
N914.740.925.8482.497CO2 + Surfactant251554
N1090.545.7632.526CO2251574
N1111.61.055.9262.501CO2251534
Table 5. The recovery efficiency of different huff-n-puff media.
Core
Number
Displacement
Medium
First
Round/%
Second Round/%Third
Round/%
Fourth Round/%Cumulative Recovery Rate/%
N6Fracturing fluid12.996.503.130.9623.59
N7Surfactant13.686.843.961.8026.28
N8CO216.879.325.993.1135.29
N9Surfactant + CO216.269.806.703.3836.14
Table 6. Recovery rate and injection pressure of injection wells at different gas injection rates.
Well Block AWell Block B
Gas Injection Rate (m3/d)Recovery Rate (%)Injection Pressure (MPa)Gas Injection Rate (m3/d)Recovery Rate (%)Injection Pressure (MPa)
500014.9236.830000.4832.2
750027.3944.040001.8736.1
10,00037.2550.750004.5739.8
Table 7. Oil change rate statistics of some tight oil reservoirs.
Oilfield TypePorosity (%)Permeability (mD)CO2 Oil Change
Rate (t/t)
Changqing Oilfield6–120.1–100.3–0.5
Daqing Oilfield8–101–50.2–0.4
Xinjiang Oilfield7–120.1–100.25–0.45
C Reservoir6–120.1–100.01–0.2
Disclaimer/Publisher’s Note: The statements, opinions and data contained in all publications are solely those of the individual author(s) and contributor(s) and not of MDPI and/or the editor(s). MDPI and/or the editor(s) disclaim responsibility for any injury to people or property resulting from any ideas, methods, instructions or products referred to in the content.