Article

Numerical Simulation of Gas–Water Two-Phase Seepage During Coalbed Methane Development in ZhengZhuang Block: A Case Study of Well Z29

1
China Coal Research Institute, Beijing 100013, China
2
State Key Laboratory of Digital and Intelligent Technology for Unmanned Coal Mining, Beijing 100013, China
*
Author to whom correspondence should be addressed.
Processes 2025, 13(11), 3593; https://doi.org/10.3390/pr13113593
Submission received: 11 October 2025 / Revised: 29 October 2025 / Accepted: 4 November 2025 / Published: 6 November 2025

Abstract

Coalbed methane (CBM) wells with low production are widespread in China, and the influence of single-water-phase or -gas-phase seepage on CBM development was investigated. The influence of gas–water two-phase seepage on CBM development has rarely been studied. To study the controlling factors of gas–water two-phase seepage on CBM development, stress–strain relationship of coal reservoir, Darcy’s law of gas–water two-phases and the relationship between porosity and permeability were combined to establish a two-phase multi-physics coupling model. The feasibility and rationality of the established model was proven by comparing field CBM well data of Z29 in the ZhengZhuang Block and the simulation curve. Then, the coupling model was solved with COMSOL Multiphysics software (version 3.5), and the effect of Young’s modulus, initial permeability and the drainage system on the process of drainage was discussed. The results of numerical simulation show that the Young’s modulus of a reservoir has limited positive effects on CBM production. When the Young’s modulus of the reservoir increases by 80%, the gas production only increases by 10.71%. The initial permeability has a significant impact on CBM production. The reservoir with a permeability of 0.9 mD had the highest daily gas production of 2183 m3/d on the 162nd day, while the maximum daily gas production of the reservoir with a permeability of 0.1 mD was only 371 m3/d. In addition, a high pressure drop rate inevitably results in lower porosity and permeability, which limits the production of CBM. When the pressure drop reaches 0.1 MPa, the gas production drops sharply, with the daily gas production decreasing by more than 30%. Thus, a sudden change in bottom hole pressure should be avoided in the actual production scenario to extend the stable gas production stage. This simulation research quantifies the effects of Young’s modulus, initial permeability and the drainage system on CBM production, which could provide a basis for understanding CBM drainage and its controlling factor.

1. Introduction

With the increasing global demand for energy, coalbed methane (CBM), as an unconventional natural gas resource, has attracted growing market attention in recent years [1,2,3]. The CBM content in the coal reservoir of the ZhengZhuang Block is high, making it an important CBM development area in China. However, there are many CBM wells with low production, which is significantly related to the fluid transfer mechanism during CBM development. CBM mass transfer has been regarded as a fluid behavior that occurs in a multi-component, nonlinear pore–fracture structure and that is accompanied by multiple dynamic equilibrium processes, such as adsorption/desorption, diffusion, and seepage [4,5,6]. In different CBM drainage processes, the fluid type and flow mechanism are different, and they play an essential role in CBM production.
At present, CBM development always includes a single water flow, a gas–water two-phase flow and a single gas flow. During the single water flow stage, the flow velocity is regarded as an important factor influencing CBM production [7]. The impact of flow velocity on the permeability and porosity of coals was investigated via core flooding and nuclear magnetic resonance, which indicated that an increase in flow velocity could decrease the permeability due to the seepage blocking of coal fines [8]. Based on the three-dimensional fractal model [9] and the Boltzmann method [10], a multi-physics coupled seepage mathematical model was established, which held that the moisture content determined the seepage velocity of the constant-pressure reservoir. For the continuous drainage of water and coal powder, CBM wells with high permeability often adopt a high drainage intensity in the initial stage, while CBM wells with low-permeability generally maintain a low rate of liquid level decline in the initial stage [11,12]. Compared with the single-water-flow stage, many experiments on single gas flow were conducted to investigate the variation in porosity and permeability [13,14,15]. The influence of effective stress and matrix shrinkage on CBM production is widely accepted due to gas production and gas desorption [16,17,18]. In addition, the gas slippage effect occurring in the single gas phase has also been regarded as a factor influencing permeability [19,20,21]. Some scholars have studied the non-Darcy flow of gas in coal reservoirs by introducing equilibrium desorption models and dynamic desorption models, further quantifying the impact of non-Darcy seepage on CBM production, and proposed models for the steady-state and transient seepage of gas in porous media considering the Klinkenberg seepage effect [22,23,24]. In addition to studies on the effect of a single water flow and single gas flow on CBM production, some studies have focused on the gas–water two phase seepage mechanism. A triaxial seepage test system for studying the gas-water two-phase mechanism in coal rock was developed and applied [25]. The characteristics of gas–water flow and wettability variations during CO2 injection were explored with several typical water-bearing pore models [26]. The impact of fracture morphology and complexity on the gas–water two-phase seepage process was explored by employing a fractal theory to model a tree-like fractal bifurcation network that characterizes the fracture–pore network expansion caused by water injection [27]. The gas–water two-phase flow patterns in fracture were investigated with visualized experiments [28]. Only a few of studies established a fully coupled semi-analytical gas–water two-phase productivity model for low-permeability CBM wells, mainly considering pressure and saturation gradients, to investigate the sensitive factors affecting CBM production performance [29,30]. There is still a lack of gas–water coupled seepage models for CBM under the action of multi-physical fields. Therefore, the authors combined Darcy’s law, the Klinkenberg effect equation, the effective stress equation, and the porosity and permeability dynamics equations to obtain a gas–water two-phase multi-physics coupling model, aiming to lay a foundation for the in-depth analysis of the gas and water migration mechanisms and the sensitive factors affecting CBM production during CBM development.

2. Model Construction

2.1. Establishment and Assumptions of Geometric Model

Based on the geological overview of the Zhengzhuang area and the actual geological conditions of Well Z29, an elliptical region centering on the CBM wellbore is established, with a radius of 100 m and a thickness of 5 m, where the wellhead radius is 0.1 m. A three-dimensional geometric diagram is shown in Figure 1a. Due to the large number of grids in the three-dimensional geometric model and the long calculation time for multi-phase fluid coupling, considering that the terrain near the CBM well does not change much, the influence of the vertically upward pressure gradient caused by gravity can be ignored. Therefore, the model is simplified into a two-dimensional plane (Figure 1b), while ensuring the accuracy of multi-phase flow simulation and considering the symmetry of the model. In the simplified two-dimensional model, three detection points are selected to monitor parameters such as pressure, permeability, gas production, and gas-water saturation at different positions. Among them, point A is the CBM well, point C is at the edge of the model, and point B is the midpoint of the straight line, AC.
Most coal reservoirs in China have strong heterogeneity and anisotropy. In actual reservoirs, fluids are affected by various factors. When establishing a multi-phase flow coupling model, the seepage laws of multi-phase fluids should be confirmed, while eliminating unnecessary inter-well interference factors as much as possible. Therefore, the following assumptions are made for the model [31,32,33].
(1)
There are only two types of fluids in the coal reservoir: water and methane.
(2)
The deformation of coal reservoirs is relatively small during CBM development.
(3)
During the development of CBM, the temperature is kept constant. The fluid viscosity in pores and fractures remains unchanged, and the influence of gravity is not considered.
(4)
The compressibility of water is negligible, and methane is an ideal gas.
(5)
The fluid flow in the pores and fractures of coal reservoirs conforms to Darcy’s law.
(6)
The adsorption/desorption of CBM in coal reservoirs conforms to the Langmuir isotherm equation.

2.2. Construction of Numerical Model and Problem Description

The occurrence and production of CBM is governed by the coal structure and in situ reservoir conditions. More than 80% of the methane in coal reservoirs is adsorbed in nanopores, while less than 20% exists as free or dissolved gas [2]. Generally, the extraction of CBM refers to the multi-stage mass transfer process from desorption and diffusion to seepage, which is manifested as CBM flowing from high-pressure areas to low-pressure areas under the action of pressure gradients. The governing equations for CBM seepage in coal reservoirs mainly include the mass conservation equation, Darcy’s law, the Langmuir adsorption/desorption equation, the Klinkenberg effect equation, and the effective stress equation, as well as porosity and permeability dynamics equations.
Coal reservoirs are considered a type of porous elastic–plastic medium. Under the action of external loads, deformation occurs inside the coal matrix, and seepage and diffusion movements take place in the pores and fractures at the same time. Assuming that the side lengths of a unit matrix are dx, dy, and dz, respectively, the internal stress of coal rock follows the continuity equation of the coordinate length [29], and its stress state is shown in Figure 2.
Due to the difference in stress acting on the two parallel surfaces of the unit matrix, the internal stress equilibrium equation of coal and rock can be expressed in Equation (1):
σ x x + τ y x y + τ z x z + F x = 0 τ x y x + σ y y + τ z y z + F y = 0 τ x z x + τ y z y + σ z z + F y = 0
The Equation (1) can be expressed in the form of a tensor.
σ i j + F i = 0 ( i , j = 1,2 , 3 )
The elastic constitutive equation for coal rock deformation is shown in Equation (3):
σ i j = 2 G ε i j + λ ε t δ i j
ε t is the volume strain of the coal reservoir, λ and G are Lame constants shown in Equation (4), and δ i j is the Kronecker symbol shown in Equation (5).
λ = E v ( 1 + v ) ( 1 2 v ) ,   G = E 2 ( 1 + v )
δ i j = 0 1 ( i = j ) ( i j )
In the three-dimensional space coordinate system, for continuous and single-valued functions of coordinates, the displacements in the x, y, and z directions are represented by u ( x , y , z ) ,   v x , y , z , and   w ( x , y , z ) , respectively. The strain components and displacement components satisfy the following equation:
ε x = u x , γ y z = w y + v z = 2 ε y z ε y = u y , γ x z = u x + w z = 2 ε x z ε z = u z , γ x y = v x + u y = 2 ε x y
Equation (6) can be abbreviated as follows:
ε i j = 1 2 ( u i , j + γ i , j )
Among them, ε i j is the normal strain of the unit matrix on the ij plane. u i is the strain of the unit matrix in the i direction. γ i , j is the shear strain of the ij plane.

2.3. Model Governing Equations and Boundary Conditions

2.3.1. Dynamic Permeability Change Model

In coal reservoirs, based on the Carman–Kozeny equation, the relationship between permeability and porosity can be expressed as follows [34]:
k = C ϕ 3 ( 1 ϕ ) 2
The relationship between the permeability and the porosity in the initial state is shown in Equation (9):
k 0 = C ϕ 0 3 ( 1 ϕ 0 ) 2
Combining the above two formulas, Equation (10) can be obtained:
k k 0 = ϕ ϕ 0 3 1 ϕ 0 1 ϕ 2
Since coal reservoirs have extremely low porosity and permeability, the square term that appears later on in Equation (10) is close to 1. Therefore, the final relationship between permeability and porosity can be simplified into Equation (11):
k k 0 = ϕ ϕ 0 3
Coal reservoirs exhibit strong heterogeneity and anisotropy, with well-developed micro-nanopores. To construct a macroscale-equivalent pore and permeability change model, the microscale heterogeneity of pore permeability in coal reservoirs should be ignored. Therefore, in this work, the coal reservoir is assumed to be an isotropic homogeneous reservoir, so the porosity can be expressed as follows:
φ = V p V t = V p 0 + Δ V p V t 0 + Δ V t = 1 V s 0 + Δ V s V t 0 + Δ V a = 1 ( 1 φ 0 ) 1 + ε v 1 + Δ V s V s 0
V p is the pore volume, V s is the skeleton volume, V t is the total volume of rock, ε v is the total volume strain of the coal reservoir, and Δ V s / V s 0 is the volume strain of the coal rock skeleton, which is expressed in Equation (13):
Δ V s V s 0 = p p 0 K s + 2 a ρ c R T l n   ( 1 + b p ) 9 V m K   ( 1 φ 0 )
Combining Equations (10)–(13), the relationship between porosity and permeability can be obtained as Equations (14) and (15):
φ = 1 ( 1 φ 0 ) 1 + ε v 1 p p 0 K s + 2 a ρ c R T l n   ( 1 + b p ) 9 V m K   ( 1 φ 0 )
k k 0 = ( ε v φ 0 ) φ 0 ( 1 + ε v ) 1 p p 0 K s + 2 a ρ c R T l n   ( 1 + b p ) 9 V m K   ( 1 φ 0 ) 3
Since gas–water two-phase flow in the pores and fractures of coal reservoirs follows Darcy’s seepage law, the gas slippage effect needs to be considered. According to Klinkenberg’s research [19], permeability has a linear relationship with the reciprocal of the average pore pressure, and the equation for the relationship between them is described by Equation (16):
K g = K 1 + b k p g
K is the permeability when the gas pressure is infinite, which can be regarded as the liquid-measured permeability, and b k is the slip coefficient.
The gas/liquid permeability corrected by the Klinkenberg effect is shown in Equations (17) and (18):
K g = K 0 K r g 1 + b k p g ( ε v φ 0 ) φ 0 ( 1 + ε v ) 1 p p 0 K s + 2 a ρ c R T l n   ( 1 + b p ) 9 V m K   ( 1 φ 0 ) 3
K w = K 0 K r w ( ε v φ 0 ) φ 0 ( 1 + ε v ) 1 p p 0 K s + 2 a ρ c R T l n   ( 1 + b p ) 9 V m K   ( 1 φ 0 ) 3
Among them, K g is the gas permeability, and K w is the liquid permeability.

2.3.2. Fluid–Solid Coupling Equations

The seepage of gas and water in coal reservoirs follows the law of the conservation of mass. The continuity equation of each phase of fluid can be expressed by Equation (19):
φ ρ i s i t + d i v ρ i v i = Q i ( i = w , g )
s i represents different fluid saturations; ρ i represents different fluid densities; v i represents different fluid velocities. The expression for each fluid velocity corrected according to Klinkenberg is shown in Equations (20) and (21).
v w = K K r w μ w p w
v g = K K r g μ g p g ( 1 + b k p g )
In this simulation study, Q w = 0 , since there is no continuous supply of liquid from the outside. For the continuity equation of gas, the source phase in the coal reservoir is mainly provided by desorbed methane, and the gas source phase can be expressed as follows:
Q g = V t ρ c ρ a i r
In the formula, ρ c is the apparent density of the coal reservoir. ρ a i r is the density of CBM under the standard condition.
According to the Langmuir equation the extent of CBM desorption under the action of the pressure difference when the pressure of the CBM reservoir drops below the critical desorption pressure is expressed in Equation (23):
Δ V = a b p g 1 + b p g a b p 1 + b p
Moreover, since the diffusion of CBM in coal reservoirs follows Fick’s first law, the desorption amount changes with time as follows:
V t = D c δ Δ V = Δ V τ  
Here, τ is the adsorption time constant.
According to the ideal gas state equation, the density of CBM in coal reservoirs is expressed in Equation (25):
ρ g = 16 p g R T
By combining Equations (19)–(25), the continuity equations for the seepage of water and methane in the reservoir can be obtained as Equations (26) and (27), respectively:
ρ w S w ϕ t + ϕ ρ w S w t + k k w μ w ρ w p w = 0
16 p g R T S g ϕ t + 16 ϕ p g R T S g t ϕ S g 16 R T p g t + k k g μ g 16 p g R T p g 1 + b 1 p g = 1 τ a b p g 1 + b p g a b p 1 + b p ρ c ρ a i r

2.3.3. Production Calculation Equation

During the CBM production process, due to the influence of desorption, the differences between coal rock reservoirs and conventional gas reservoirs is obvious. The boundaries and reservoir pressure cannot be clearly defined, which leads to large errors when using the conventional production formula for calculating the gas and water production of CBM wells. In this study, the fluid mass flux at the wellhead boundary is obtained by integrating the well circumference, and then the actual volumes of CBM and the water are obtained by combining the coal reservoir thickness and the physical properties of the gas and water. The calculation formulas are as follows:
q w = h S w ρ w k k r w μ w ρ w P d l
q g = h S g ρ atm   k k r g μ g ρ g P d l
In the formula, ρ atm   is the density of CBM under the standard condition; ρ g   a n d   ρ w are the bulk density of methane and water under the in situ conditions of the reservoir, respectively.

2.3.4. Initial and Boundary Conditions

The initial strain, stress, and gas pressure equations are as follows:
u i 0 = u 0 = 0
σ i j 0 = σ o = 0
p m 0 = p f 0 = p 0 = 10 5
u i 0 and σ i j 0 represent the initial strain and stress; p m 0 is the initial gas pressure.
In the simulation of CBM seepage processes, the fluid pressure field and water saturation field can be expressed by the following functions:
P ( x , y , z ) t = 0 = P 0 ( x , y , z )
S w ( x , y , z ) t = 0 = S w 0 ( x , y , z )
Among them, P 0 x , y , z and S w 0 ( x , y , z ) represent the initial pressure field and initial saturation field in the coal reservoir that are not affected by external conditions.
The flow boundary states of fluids include internal boundaries and external boundaries. For different production conditions and extraction systems, their boundary conditions are different. The internal boundary conditions include two types, a fixed flow rate and fixed bottom-hole flowing pressure, which are expressed as follows:
q r r = r w = f ( t )
p w r r = n v = f ( t )
The main external boundary conditions include a constant-pressure external boundary, constant-flow external boundary, and mixed external boundary. Because the mixed-external-boundary condition is relatively complex and the calculation process is lengthy, this simulation mainly considers the first two boundary conditions, which are expressed as follows:
p Γ = f p ( x , y , z , t )
p n Γ = f ( x , y , z , t )

3. Model Validation

Figure 3 shows the actual and simulated drainage processes of CBM for the evaluation of Well Z29 in the Zhengzhuang area. The CBM drainage process is mainly divided into four stages: the single-phase water flow stage, initial gas production stage, stable production stage, and production decline stage. In the single-phase water flow stage, the theoretical water production and actual water production align well. With the increase in drainage time, the theoretical water production decreases rapidly. However, the actual water production decreases relatively slowly and maintains a high level for a long time, mainly due to the supply of other additional water sources in the coal reservoir. For gas production, the theoretically predicted first appearance of gas occurs 13 days after pressure reduction, which is 18 days earlier than the actual first appearance of gas at 31 days. This is mainly because the gas can be observed once the reservoir pressure drops below the critical desorption pressure in the simulation. However, in the actual production process, factors such as CBM content, reservoir heterogeneity, and engineering factors will affect the desorption of CBM, leading to desorption hysteresis [35,36]. Nevertheless, this has little impact on the overall prediction of CBM productivity. From Figure 3, the simulation results of this model fit well with the field data and can be used to reasonably predict the CBM drainage process, which also indicates that the three-phase multi-physics field coupling model established is relatively reasonable.

4. Results and Discussion

Using the three-phase multi-physics field coupling model established, the influence of reservoir properties (Young’s modulus and initial permeability) and the drainage system on CBM production is investigated and discussed. The simulation range can been seen in Section 2.1. The simulation parameters can be seen in Table 1, and the simulation variable can be seen in Table 2.

4.1. Influence of Young’s Modulus on the CBM Production

Young’s modulus, which quantifies a rock’s resistance to deformation, directly governs the porosity change and reservoir pressure distribution in coal reservoirs during CBM development. Figure 4 shows the reservoir pressure distribution under different Young’s moduli at different drainage times (100 days, 200 days, 400 days, 800 days). Through horizontal comparison, the difference in the pressure near the well bore zone (point A) of coal reservoirs with different Young’s moduli is the smallest. The range of critical desorption pressure contour lines of coal reservoirs with different Young’s moduli is not significantly different. The critical desorption pressure contour lines are all limited to a range of 0~10 m from the CBM well (Figure 4a–c), while the difference in the pressure in the zone away from the well bore (B, C) becomes bigger, the largest at point C. This result may be because the drainage system has a more important effect on the pressure near the well bore zone and the Young’s modulus mainly affects the pressure in the zone away from the well bore. In our vertical comparison of coal reservoirs (Figure 4a,d,g,j), when the production time increased from 100 days to 200 days, the formation pressure differences at points A, B, and C were 0.17 MPa, 1.20 MPa, and 1.34 MPa, respectively. On the other hand, when the production time increased from 400 days to 800 days, the formation pressure only decreases by 0.04 MPa, 0.06 MPa, and 0.05 MPa. This result indicates that as the drainage time of the CBM well increases, the drop rate of the formation pressure slows down, which has also been proven by previous studies [37].
As shown in Figure 4j–l, the trends of the formation pressure exhibit a generally consistent pattern under different Young’s moduli. Thus, the variations in porosity, formation pressure, water saturation and daily gas yield for different Young’s moduli at 800 days are further presented in Figure 5. From Figure 5a, the porosity ratios at 1.5 GPa, 2.1 GPa and 2.7 GPa are 88.7%, 92%, and 93.8% near the well bore and 94%, 95.3%, and 96.8% away from the well bore, which implies that the porosity decreases slowly when the Young’s modulus of the reservoir is high. This result is because reservoirs with high Young’s moduli can prevent declines in fluid pressure and the deformation of the coal reservoir. As can be seen in Figure 5b, the higher the Young’s modulus of the coal reservoir is, the lower the reservoir pressure is, but this difference is not significant. As can be seen in Figure 5c, at the same position in the formation, the higher the Young’s modulus of the coal reservoir is, the lower the water saturation is. This result can be explained by the porosity variation. The decline in porosity is low at a higher Young’s modulus within the coal reservoir, which makes the water flow out more easily. As can be seen in Figure 5d, as the Young’s modulus of the reservoir increases, the peak daily gas production increases. The maximum daily gas production for the coal reservoir with 2.7 GPa is 1402 m3/d, while that for the coal reservoir with 1.5 GPa is only 1125 m3/d. The stable production time under the three conditions is basically the same, and the final gas production does not differ much. This result implies that Young’s modulus plays a positive role in the process of CBM development. However, considering that the difference in the Young’s modulus in actual reservoirs will not exceed 1 GPa, the Young’s modulus is not the key controlling factor.

4.2. Influence of Initial Permeability on Gas Production

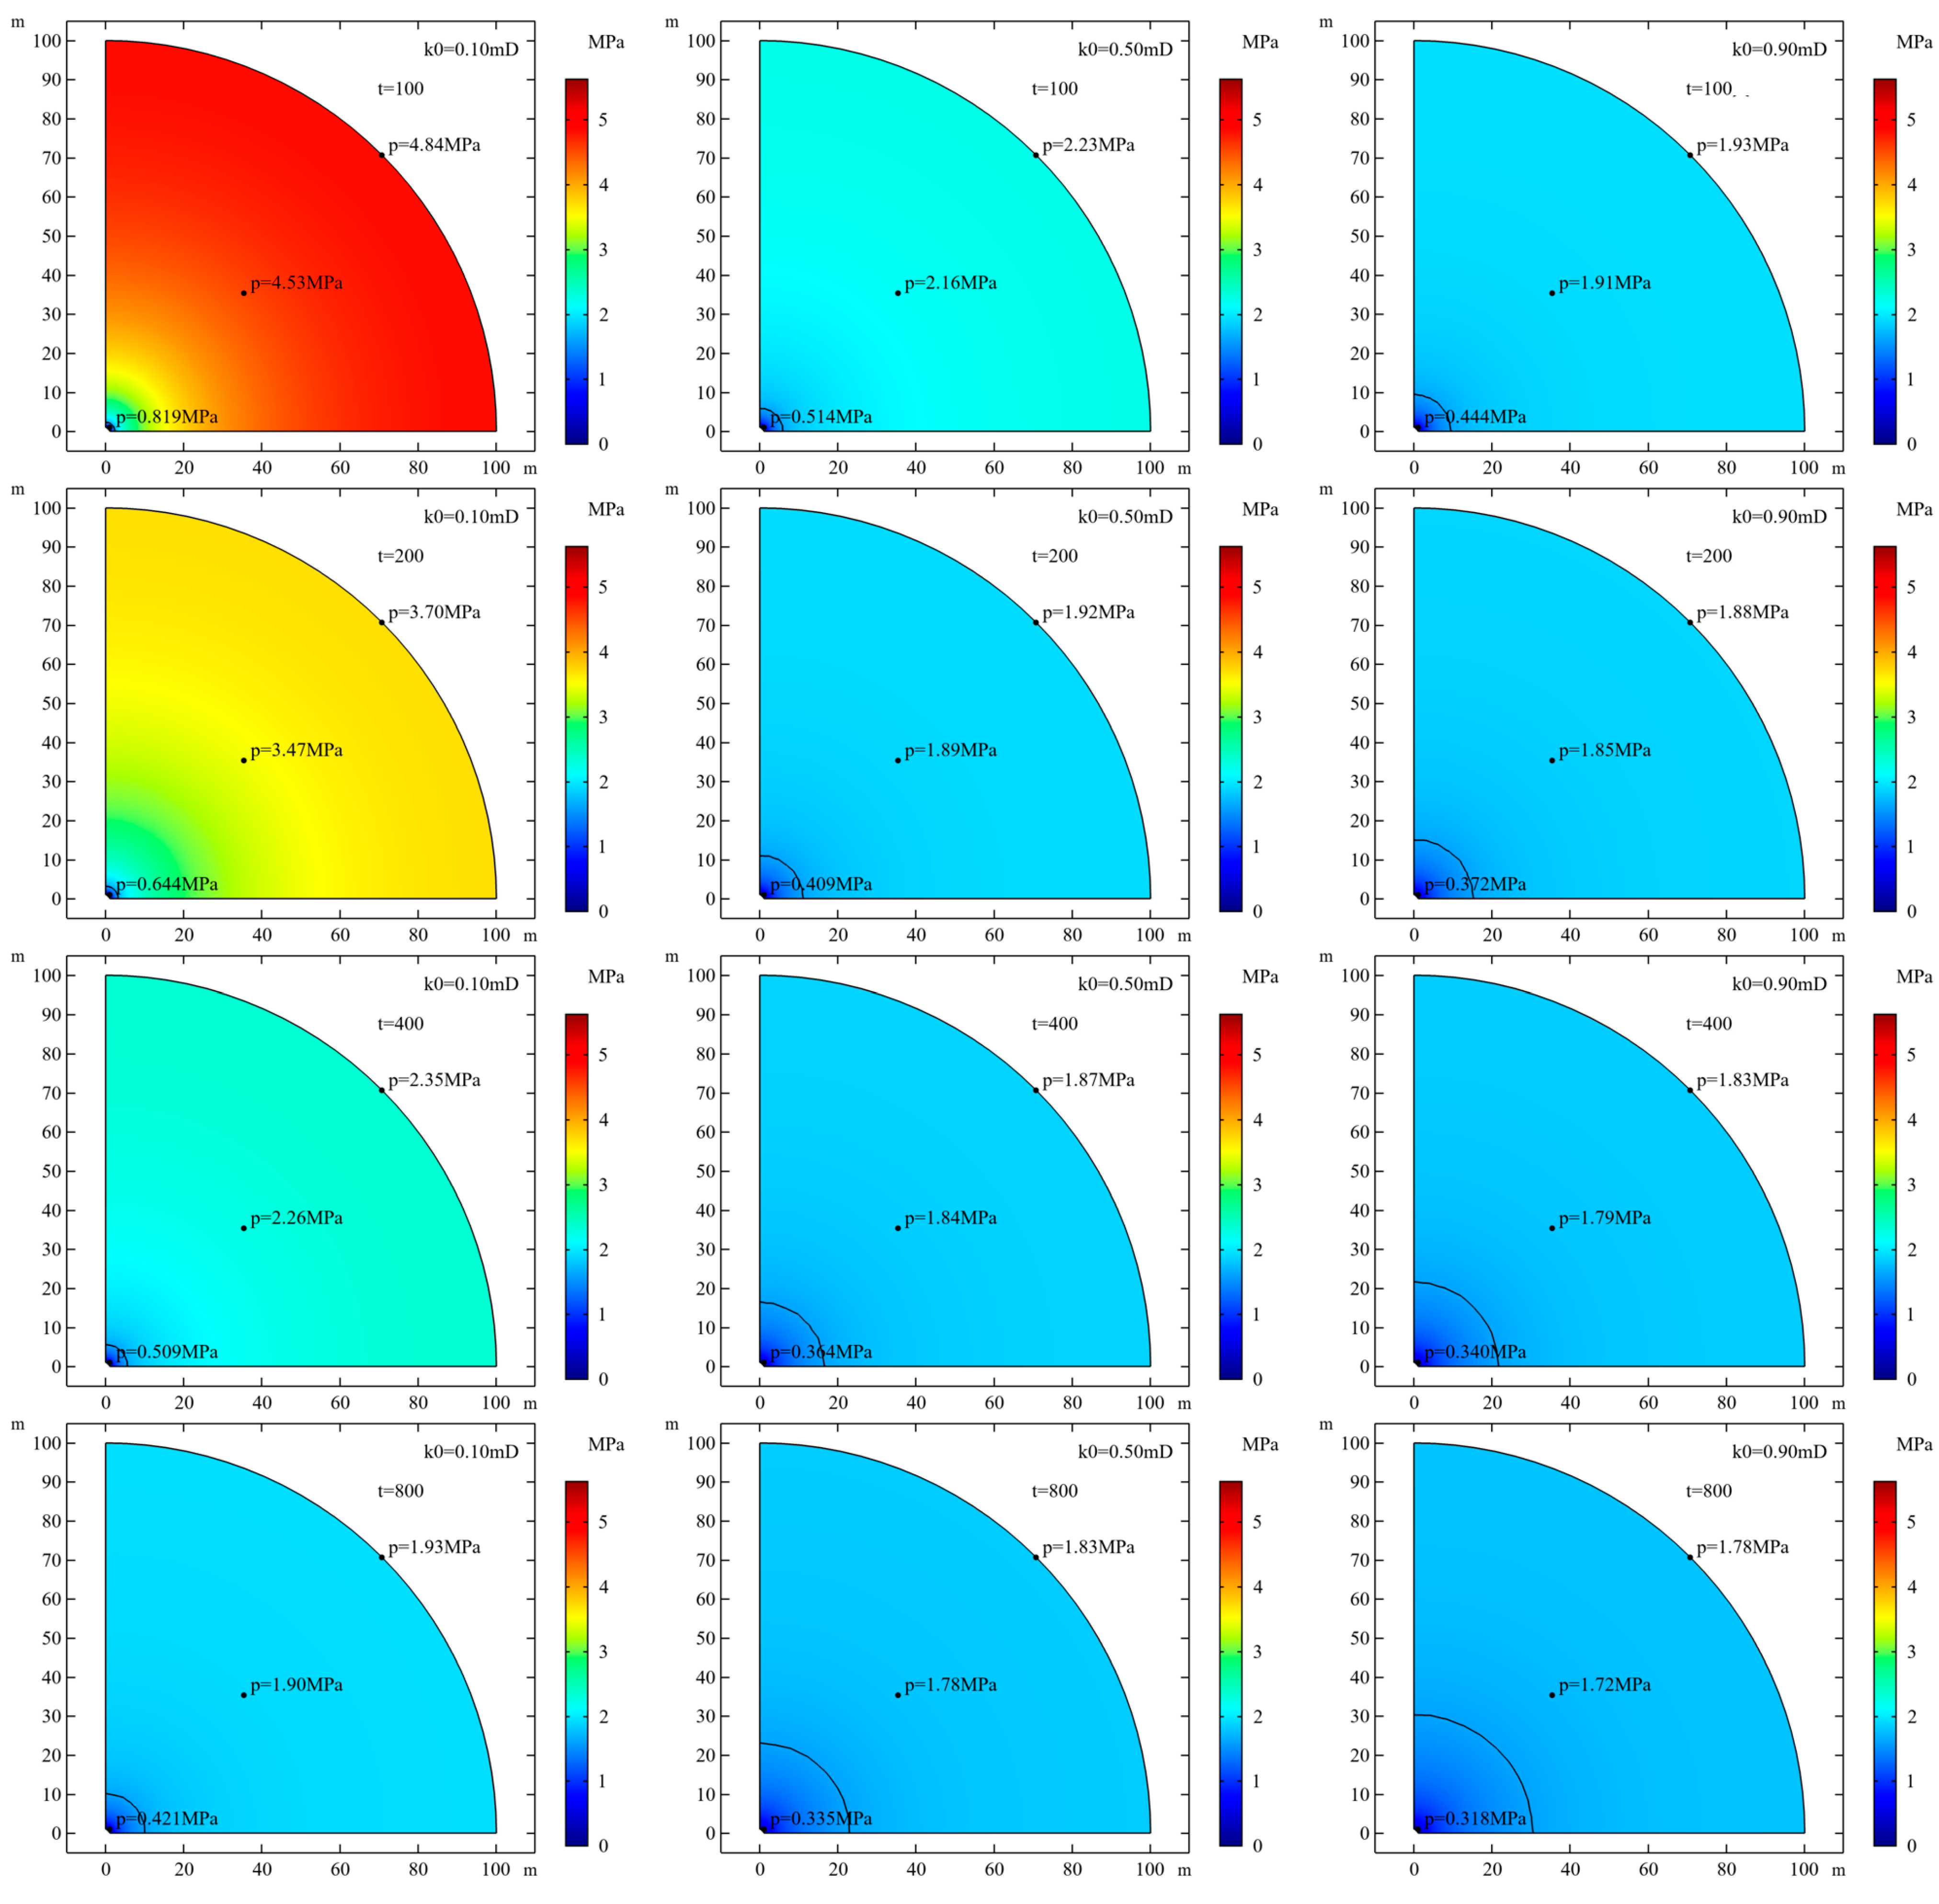
The initial permeability exerts a direct impact on the CBM flow process. Particularly within the two-phase flow regime, the relative permeability of each fluid phase will be lower than the absolute permeability due to the effects of capillary pressure. Figure 6 shows the distribution of reservoir pressure during the drainage process under different initial permeability conditions. When the permeability of the coal reservoir is 0.1 mD, the formation pressure decreases extremely slowly, and the pressure drop only manifests near the CBM well bore. At 100 days of production, the pressure at detection point B and C under different permeability conditions (0.1 mD, 0.5 mD, 0.9 mD) drops to 4.53 MPa, 2.16 MPa, and 1.91 MPa, and 3.70 MPa, 1.92 MPa, and 1.88 MPa, respectively. As the production time increases to 800 days, this gap narrows down to 1.90 MPa, 1.78 MPa, and 1.72 MPa, and 1.93 MPa, 1.83 MPa, and 1.78 MPa. This result is because the low permeability prevents fluid transfer.
To better investigate the impact of permeability on CBM production, detection points A and B were selected to analyze the changes in relevant parameters during the drainage process. From Figure 7a, the reservoir porosity ratio at monitoring point A dropped to a maximum of 92.9%, 93.7%, and 94.2% of the initial value for 0.1 mD, 0.5 mD, and 0.9 mD, respectively, and then all recovered to 94.5%. The porosity recovery times for the three cases were 483 days, 77 days, and 34 days, respectively. This result may be related to the effective stress and matrix shrinkage effect [38]. A high-permeability reservoir environment can quickly balance the effective stress and matrix shrinkage effect, while a low-permeability reservoir will inhibit the desorption of CBM, thereby affecting coal matrix shrinkage. The porosity ratio at point B shows a smooth downward curve without the phenomenon of first decreasing and then increasing, which is because both effective stress and matrix shrinkage effects are relatively weak. As can be seen in Figure 7b, the water saturation at point A dropped to 0.65, 0.5 and 0.4 for the 0.1 mD, 0.5 mD, and 0.9 mD scenarios at 100 days, while the water saturation at point B showed little change. This result indicates that the low-permeability reservoir is bad for CBM production, because the higher water saturation would inhibit the gas desorption. As can be seen in Figure 7c, the reservoir with a permeability of 0.9 mD has the highest daily gas production, reaching the maximum daily gas production of 2183 m3/d on the 162nd day, while the maximum daily gas production of the reservoir with a permeability of 0.1 mD is only 371 m3/d. This result indicates that the initial permeability has a significant impact on CBM production, which is why the hydraulic fracturing method, one of the methods for improving the initial permeability of reservoirs, is widely used to increase CBM production.

4.3. Influence of Drainage System on CBM Production

The impact of different drainage systems on CBM production cannot be ignored. A reasonable drainage intensity can control production costs and increase CBM output. In this study, constant-rate pressure drops of 0.02 MPa/d, 0.04 MPa/d, and 0.08 MPa/d were used to simulate the CBM production and drainage process. The time taken for the corresponding reservoir pressure to drop from 5.63 MPa to the bottom-hole pressure of 0.1 MPa was 276 days, 138 days, and 69 days, respectively.
Figure 8 shows cloud diagrams of the coal reservoir pressure distribution under different drainage systems. When the drainage time is 200 days, the bottom-hole pressure is unstable, at about 1.76 MPa, under the constant-rate pressure reduction scheme, while the bottom-hole pressures of the two schemes of 0.04 MPa/d and 0.08 MPa/d are relatively stable, and the formation pressures do not differ much. When the drainage time reaches 800 days, the formations in all three schemes tend to be in a stable state. The formation pressures at detection point B are 1.8 MPa, 1.79 MPa and 1.78 MPa, respectively. The formation pressure distributions are basically consistent.
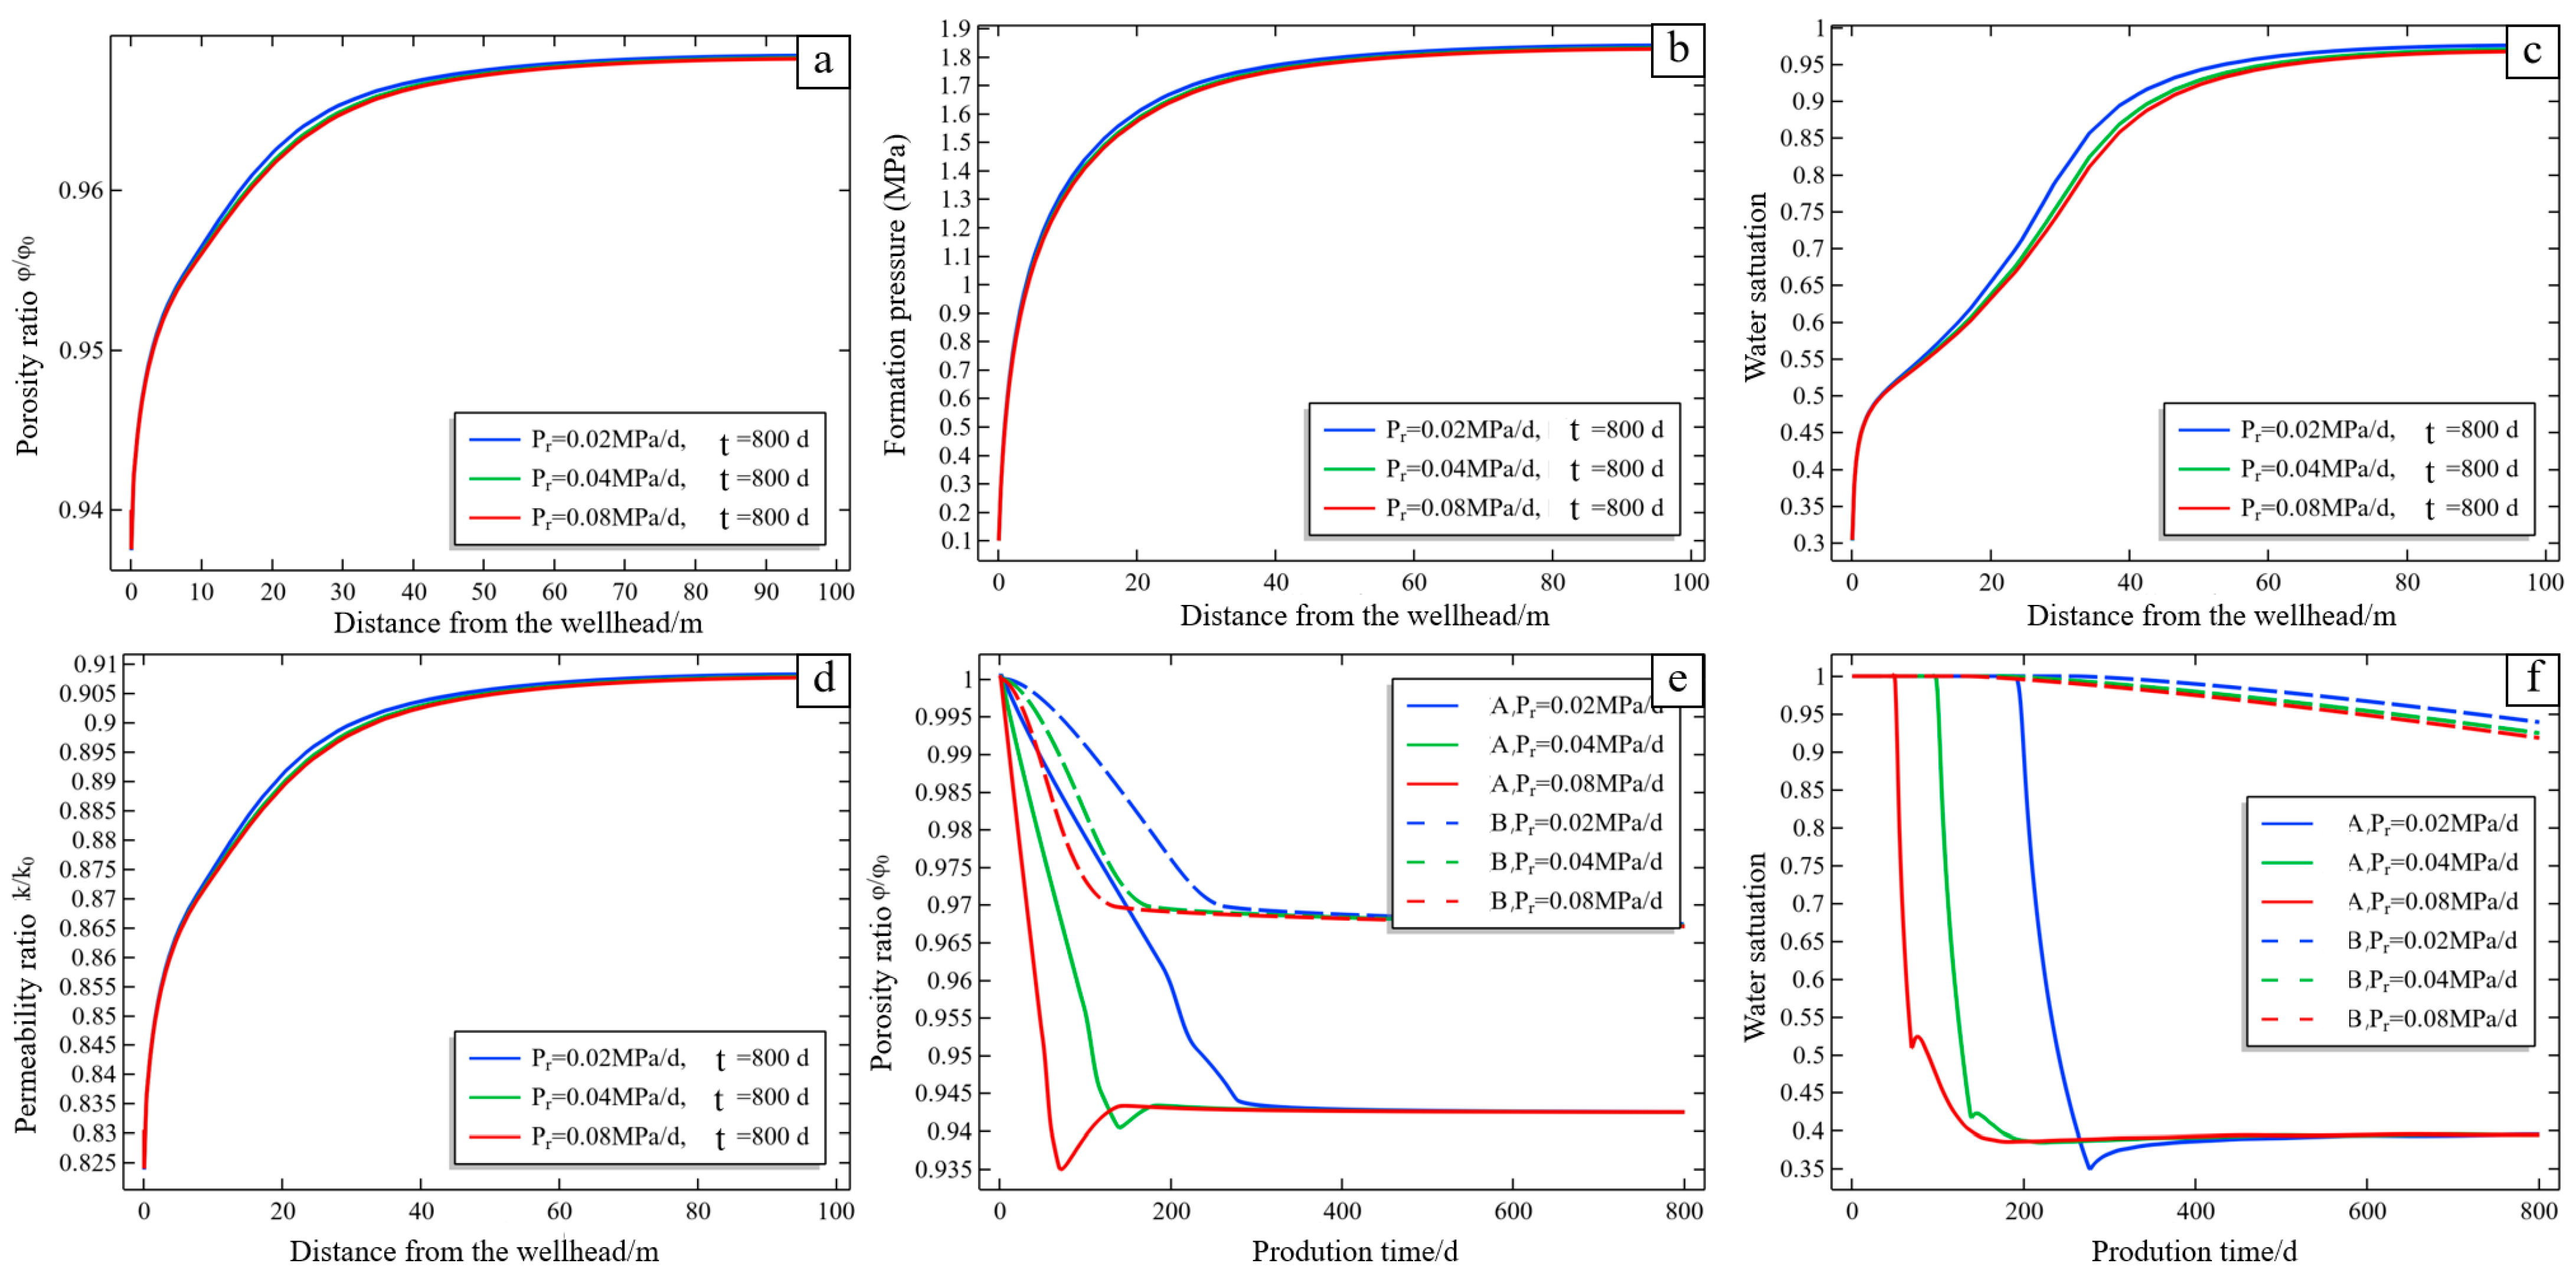
Since the bottom-hole pressure of CBM basically remains stable after 276 days of drainage, the reservoir is not affected by the bottom-hole flowing pressure in the subsequent drainage process. Figure 9a–d show the changes in reservoir porosity, permeability, water saturation and reservoir pressure after 800 days of drainage. The change curves of these four parameters are basically the same. The higher the drainage rate is, the lower the reservoir porosity ratio is, which was also proven by our previous experimental study [8]. Under different drainage systems, the maximum difference in porosity ratio occurred at 29 m from the wellhead, with the corresponding porosity ratios being 96.3%, 96.2% and 96.2%, and the water saturations being 0.79, 0.76 and 0.74, respectively. With the advancement of the drainage process, this gap may continue to narrow until the three curves coincide.
Figure 9e,f show the changes in the porosity ratio and water saturation ratio at detection points A and B over the production time. For point A, the porosity ratio under the high-speed production system is significantly lower than that under the low-speed production, which means that the deformation degree of the reservoir during the production process is more intense. The change in the porosity ratio for detection point B during the production process is relatively slow, and there is no obvious difference at the low point, which is mainly due to the absence of matrix shrinkage. In Figure 9f, the water saturation near the CBM well decreases rapidly. When the formation pressure drops below the critical desorption pressure, CBM is generated, and the water saturation decreases linearly until it reaches a stable state.
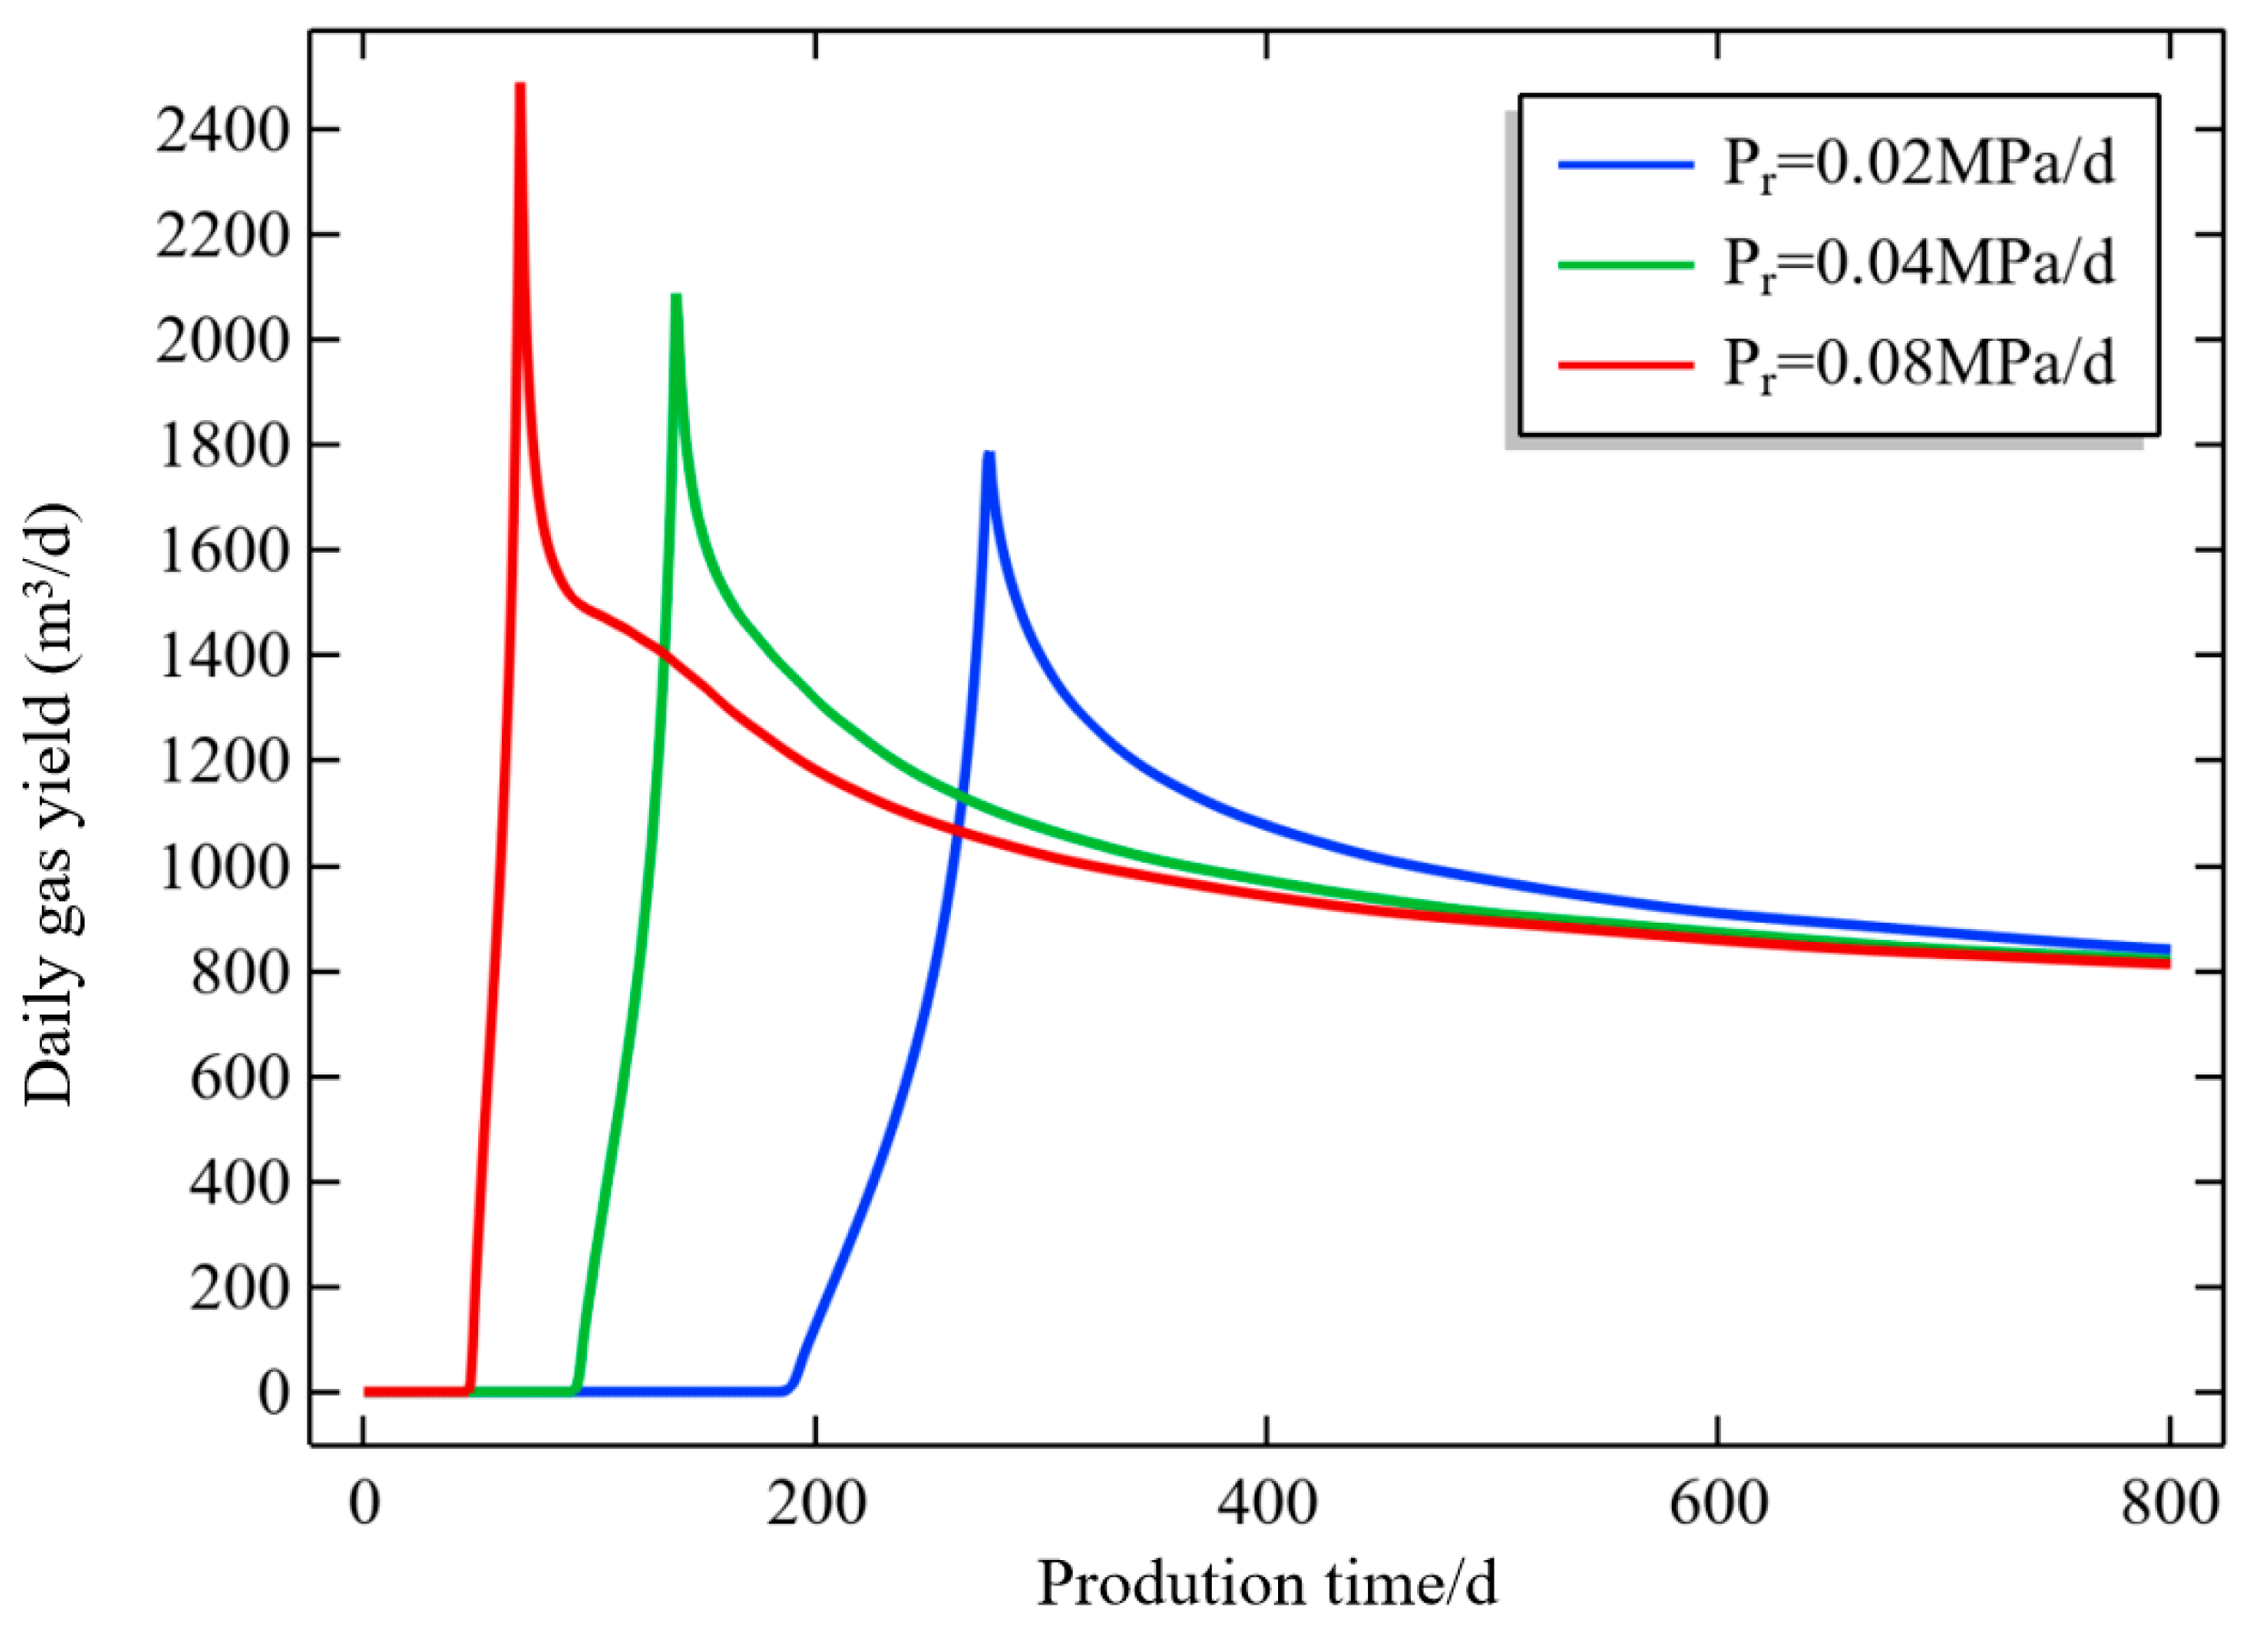
Figure 10 shows the changes in daily CBM production under different drainage systems. From Figure 10, the faster the pressure reduction rate is, the higher the CBM production in the early stage of drainage is. The maximum daily gas production under a drainage intensity of 0.08 MPa/d can reach 2485 m3/d, while the maximum daily gas production under a drainage intensity of 0.02 MPa/d is only 1785 m3/d. When the pressure drop reaches 0.1 MPa, the gas production decreases sharply, with the daily gas production dropping by more than 30%. This has a negative impact on the continuous production of CBM. In the actual production process, sudden changes in bottom-hole flowing pressure should be avoided as much as possible. The duration of the stable gas production stage should be extended to achieve continuous production with high daily gas output.

5. Conclusions

To investigate the reasons for the low production for CBM wells in the Zhengzhuang Block, a three-phase multi-physics field coupling model for the coal reservoir, CBM and water was firstly established by combining the stress–strain relationship of the coal reservoir, Darcy’s two-phase gas–water law and the porosity–permeability variation equation. The feasibility and accuracy of the model were then verified by comparative analysis with the field data of the CBM well, Well Z29, in the ZhengZhuang Block. The controlling factors for CBM production were discussed further with the established model. The following conclusions can be drawn:
(1)
A higher Young’s modulus in coal reservoirs can make the porosity decline slowly in the zone away from the well bore by preventing a decline in fluid pressure and the deformation of the coal reservoir, which has a positive effect on CBM production. The maximum daily gas production for the coal reservoir with 2.7 GPa is 1402 m3/d, while that with 1.5 GPa is only 1125 m3/d.
(2)
The initial permeability of coal reservoirs is a major factor affecting CBM production. A high-permeability reservoir environment can quickly balance the effective stress and matrix shrinkage effect, while a low-permeability reservoir will inhibit the desorption of CBM, thereby affecting coal matrix shrinkage.
(3)
Although the faster the pressure reduction rate, the higher the CBM production in the early stage of drainage, formation framework deformation caused by a high pressure drop rate will lead to a decrease in reservoir porosity and permeability, and such a production system is not conducive to the efficient production of CBM. In the actual production process, sudden changes in bottom-hole flowing pressure should be avoided as much as possible to prolong the stable gas production period and achieve sustainable production with high daily gas output.
Although a three-phase multi-physics field coupling model was established and applied to investigate the factors affecting CBM production, some conclusions still remain qualitative findings. How to decide the pressure reduction rate quantitatively is still worth further research. In addition, future work should aim to incorporate geological features and anisotropy to improve the model’s realism and applicability.

Author Contributions

Z.L.: data curation, formal analysis. writing—original draft. Y.L.: investigation, writing—review and editing. C.C.: investigation, methodology. Z.Y.: formal analysis, investigation. All authors have read and agreed to the published version of the manuscript.

Funding

This research was funded by the National Natural Science Fund of China (Grant nos. 52304223, 52304224).

Data Availability Statement

The original contributions presented in this study are included in the article. Further inquiries can be directed to the corresponding author.

Acknowledgments

The authors would like to the China Coal Research Institute and State Key Laboratory of Digital and Intelligent Technology for Unmanned Coal Mining for providing software support to carry out the research work.

Conflicts of Interest

Author Zhengshuai Liu was employed by China Coal Research Institute and State Key Laboratory of Digital and Intelligent Technology for Unmanned Coal Mining. Authors Yang Li, Cong Cui, and Zhendong Yan were employed by China Coal Research Institute. The remaining author declare that the research was conducted in the absence of any commercial or financial relationships that could be construed as potential conflicts of interest.

References

  1. Sun, X.X.; Wang, H.; Du, F.F.; Yao, Y.B.; Liu, D.M.; Liu, Z. CBM enrichment mechanisms in the Southern Qinshui Basin: A synergistic role of tectonic-lithological-hydrodynamic coupling. Int. J. Coal Geol. 2025, 309, 104861. [Google Scholar] [CrossRef]
  2. Joussineau, G.D. The impact of multiscale cleat geometry on coal’s petrophysical properties in the Lorraine basin, NE France: Implications for coalbed methane (CBM) production and CO2 storage. J. Struct. Geol. 2025, 191, 105346. [Google Scholar] [CrossRef]
  3. Min, C.; Wen, G.Q.; Gou, L.J.; Li, X.G.; Yang, Z.Z. Interpretability and causal discovery of the machine learning models to predict the production of CBM wells after hydraulic fracturing. Energy 2023, 285, 129211. [Google Scholar] [CrossRef]
  4. Wang, K.; Guo, L.; Xu, C.; Wang, W.J.; Yang, T.; Lin, S.S.; Cai, Y.B. Multiscale characteristics of pore-fracture structures in coal reservoirs and their influence on coalbed methane (CBM) transport: A review. Geoenergy Sci. Eng. 2024, 242, 213181. [Google Scholar] [CrossRef]
  5. Li, G.; Qin, Y.; Wang, B.Y.; Zhang, M.; Lin, Y.B.; Song, X.J.; Mi, W.T. Fluid seepage mechanism and permeability prediction model of multi-seam interbed coal measures. Fuel 2024, 356, 129556. [Google Scholar] [CrossRef]
  6. Mazumder, M.; Tripathy, A.; Bal, A.; Liu, S.Q.; Singh, T.N.; Pan, Z.J. Multi-proxy assessment of thermal and microstructural evolution in sub-bituminous coal affected by igneous Intrusion: Implications for CBM storage and transport. Fuel 2026, 405, 136414. [Google Scholar] [CrossRef]
  7. Xu, B.X.; Li, X.F.; Ren, W.N.; Chen, D.; Chen, L.; Bai, Y.H. Dewatering rate optimization for coal-bed methane well based on the characteristics of pressure propagation. Fuel 2017, 188, 11–18. [Google Scholar] [CrossRef]
  8. Liu, Z.S.; Liu, D.M.; Cai, Y.D.; Pan, Z.J. The impacts of flow velocity on permeability and porosity of coals by core flooding and nuclear magnetic resonance: Implications for coalbed methane production. J. Pet. Sci. Eng. 2018, 171, 938–950. [Google Scholar] [CrossRef]
  9. Liu, Z.; Han, J.; Yang, H.; Lv, J.L.; Dong, S. A new model for coal gas seepage based on fracture-pore fractal structure characteristics. Int. J. Rock Mech. Min. Sci. 2024, 173, 105626. [Google Scholar] [CrossRef]
  10. Chen, Y.L.; Ren, T.L.; Zhang, X.Q. Flow characteristics in porous media based on fractional order and multiple relaxation time lattice Boltzmann method and improver Ghost Fluid Method boundary processing mode. Int. Commun. Heat Mass Transf. 2025, 169, 109705. [Google Scholar] [CrossRef]
  11. Dang, Z.; Wang, X.M.; Bie, S.Z.; Su, X.B.; Hou, S.H. Experimental study of water occurrence in coal under different negative pressure conditions: Implication for CBM productivity during negative pressure drainage. Energy 2024, 303, 131989. [Google Scholar] [CrossRef]
  12. Li, G.Q.; Meng, Z.P.; Wang, B.Y. Diffusion and seepage mechanisms of high rank coal-bed methane reservoir and its numerical simulation at early drainage rate. J. China Coal Soc. 2014, 39, 1919–1926, (In Chinese with English abstract). [Google Scholar] [CrossRef]
  13. Zhang, J.M.; Hou, X.W.; Liu, S.M.; Zhu, Y.M.; Liu, A.; Fan, L.; Wang, Y.J.; Zhang, H. Quantifying and modeling of coal permeability spatiotemporal response: Implications for gas recovery and CO2 sequestration. Fuel 2025, 388, 134561. [Google Scholar] [CrossRef]
  14. Liu, T.; Liu, S.M.; Lin, B.Q.; Fu, X.H.; Zhu, C.J.; Yang, W.; Zhao, Y. Stress response during in-situ gas depletion and its impact on permeability and stability of CBM reservoir. Fuel 2020, 266, 117083. [Google Scholar] [CrossRef]
  15. Sun, F.R.; Liu, D.M.; Cai, Y.D.; Qiu, Y.K. A micro-macro coupled permeability model for gas transport in coalbed methane reservoirs. Energy 2023, 284, 128604. [Google Scholar] [CrossRef]
  16. Xiao, Z.Y.; Wang, G.; Liu, J.; Deng, H.F.; Jiang, Y.J.; Jiang, F.; Zheng, C.C. Experimental study and model improvement on coal permeability: The influence of effective stress, slip effect, and water content. Int. J. Rock Mech. Min. Sci. 2025, 185, 105972. [Google Scholar] [CrossRef]
  17. Aghighi, M.A.; Cui, T.; Schoning, G.; Espinoza, D.N.; Pandey, S. Subsidence associated with dewatering and gas extraction from coal seams: Contribution of desorption-induced coal shrinkage. J. Hydrol. 2024, 637, 131355. [Google Scholar] [CrossRef]
  18. Gao, R.; Bai, D.; Yu, B.; Tai, Y.; Meng, X.B.; Zhang, W.Y. Ground fracturing of multi-strata for strong ground pressure control in extra-thick coal seams with hard roofs: Numerical simulation and case study. Eng. Fract. Mech. 2024, 303, 110129. [Google Scholar] [CrossRef]
  19. Liu, C.; Yu, B.C.; Zhao, H.G.; Hong, Z.Q.; Tian, Z.C.; Zhang, D.M.; Liu, Y.X. Effective stress effect and slippage effect of gas migration in deep coal reservoirs. Int. J. Rock Mech. Min. Sci. 2022, 155, 105142. [Google Scholar] [CrossRef]
  20. Meng, Y.; Li, Z.P.; Lai, F.P. Influence of effective stress on gas slippage effect of different rank coals. Fuel 2021, 285, 119207. [Google Scholar] [CrossRef]
  21. Cao, Z.Z.; Xiong, Y.; Xue, Y.; Du, F.; Li, Z.H.; Huang, C.H.; Wang, S.R.; Yu, Y.Q.; Wang, W.Q.; Zhai, M.L.; et al. Diffusion evolution rules of grouting slurry in mining-induced cracks in overlying strata. Rock Mech. Rock Eng. 2025, 58, 6493–6512. [Google Scholar] [CrossRef]
  22. Teng, T.; Xue, Y.; Zhang, C. Modeling and simulation on heat-injection enhanced coal seam gas recovery with experimentally validated non-Darcy gas flow. J. Pet. Sci. Eng. 2019, 177, 734–744. [Google Scholar] [CrossRef]
  23. Rui, Z.H.; Deng, H.Y.; Hu, T.; Sheng, G.L.; Wilson, M.; Dindoruk, B.; Patil, S. Coupling mechanism analysis of CO2 non-Darcy flow in multi-scale reservoirs: A case study of the life-cycle process of fracturing-development in shale oil reservoirs. Pet. Sci. 2025, 22, 1171–1199. [Google Scholar] [CrossRef]
  24. Li, X.L.; Huan, H.H.; Lin, H.X.; Li, Z.H.; Du, F.; Cao, Z.Z.; Fan, X.; Ren, H. Determination method of rational position for working face entries in coordinated mining of section coal pillars and lower sub-layer. Sci. Rep. 2025, 15, 29440. [Google Scholar] [CrossRef]
  25. Geng, J.B.; Zeng, G.X.; Liu, C.Y.; Li, X.S.; Zhang, D.M. Development and application of triaxial seepage test system for gas-water two-phase in coal rock. Energy 2023, 277, 127439. [Google Scholar] [CrossRef]
  26. Ma, S.Q.; Lin, B.Q.; Zhao, J.J.; Zhang, X.L.; Liu, Q.; Liu, T. Two-phase flow characteristics of high-temperature CO2 and water and dynamic wettability variations in nano-scale coal pores with different sizes and shapes. Fuel 2026, 404, 136406. [Google Scholar] [CrossRef]
  27. Han, J.; Liu, Z.; Yang, H.; Zhou, Z.; Gu, Q.B. Modeling of water-injected coal with fracture-pore structure and experimental study of gas-water two-phase transport characteristics. Int. J. Rock Mech. Min. Sci. 2025, 195, 106272. [Google Scholar] [CrossRef]
  28. Wang, Q.; Su, X.B.; Feng, Y.L.; Wang, H.; Song, J.X. Experimental study of gas-water two-phase flow patterns in fracture: Implication for enhancing coalbed methane production. J. Pet. Sci. Eng. 2021, 207, 109168. [Google Scholar] [CrossRef]
  29. Sun, Z.; Shi, J.T.; Wang, K.; Miao, T.N.; Zhang, T.; Feng, D.; Sun, F.R.; Wang, S.; Han, S.; Li, X.F. The gas-water two phase flow behavior in low-permeability CBM reservoirs with multiple mechanisms coupling. J. Nat. Gas Sci. Eng. 2018, 52, 82–93. [Google Scholar] [CrossRef]
  30. Sun, Z.; Shi, J.T.; Zhang, T.; Wu, K.L.; Feng, D.; Sun, F.R.; Huang, L.; Hou, C.H.; Li, X.F. A fully-coupled semi-analytical model for effective gas/water phase permeability during coal-bed methane production. Fuel 2018, 223, 44–52. [Google Scholar] [CrossRef]
  31. Shu, L.Y.; Ma, Y.K.; Liu, Z.S.; Li, H.Y. Study and application of a continuous inversion model of coal seam gas pressure in front area of heading face. Int. J. Coal Sci. Technol. 2023, 10, 80. [Google Scholar] [CrossRef]
  32. Sun, Z.; Shi, J.T.; Wu, K.L.; Ma, H.Y.; Li, S.M.; Zhang, T.; Feng, D.; Liu, W.Y.; Liu, Y.S.; Wang, S.R.; et al. Novel optimization method for production strategy of coal-bed methane well: Implication from gas-water two-phase version productivity equations. J. Pet. Sci. Eng. 2019, 176, 632–639. [Google Scholar] [CrossRef]
  33. Li, Z.B.; Ren, T.; Li, X.C.; Cheng, Y.P.; He, X.Q.; Qiao, M.; Yang, X.H. Full-scale pore structure characterization of different rank coals and its impact on gas adsorption capacity: A theoretical model and experimental study. Energy 2023, 277, 127621. [Google Scholar] [CrossRef]
  34. Kong, X.G.; Wang, E.Y.; Liu, Q.L.; Li, Z.H.; Li, D.X.; Cao, Z.Y.; Niu, Y. Dynamic permeability and porosity evolution of coal seam rich in CBM based on the flow-solid coupling theory. J. Nat. Gas Sci. Eng. 2017, 40, 61–71. [Google Scholar] [CrossRef]
  35. Liu, D.M.; Yao, Y.B.; Chang, Y.H. Measurement of adsorption phase densities with respect to different pressure: Potential application for determination of free and adsorbed methane in CBM reservoir. Chem. Eng. J. 2022, 446, 137103. [Google Scholar] [CrossRef]
  36. Zhao, Z.; Liu, D.M.; Cai, Y.D.; Sun, F.R.; Zhou, Y.F. Pathways and challenges of the application of geophysical techniques to multifaceted CBM reservoir characterization. Gondwana Res. 2025, 147, 164–183. [Google Scholar] [CrossRef]
  37. Su, X.F.; Liu, Y.; Cui, Z.Q.; Zhang, J.G.; Yu, L.; Wang, K. Influence of depressurization rate on gas production capacity of high-rank coal in the south of Qinshui Basin, China. Pet. Explor. Dev. 2019, 46, 642–650. [Google Scholar] [CrossRef]
  38. Reisabadi, M.Z.; Haghighi, M.; Sayyafzadeh, M.; Khaksar, A. Effect of matrix shrinkage on wellbore stresses in coal seam gas: An example from Bowen Basin, east Australia. J. Nat. Gas Sci. Eng. 2020, 77, 103280. [Google Scholar] [CrossRef]
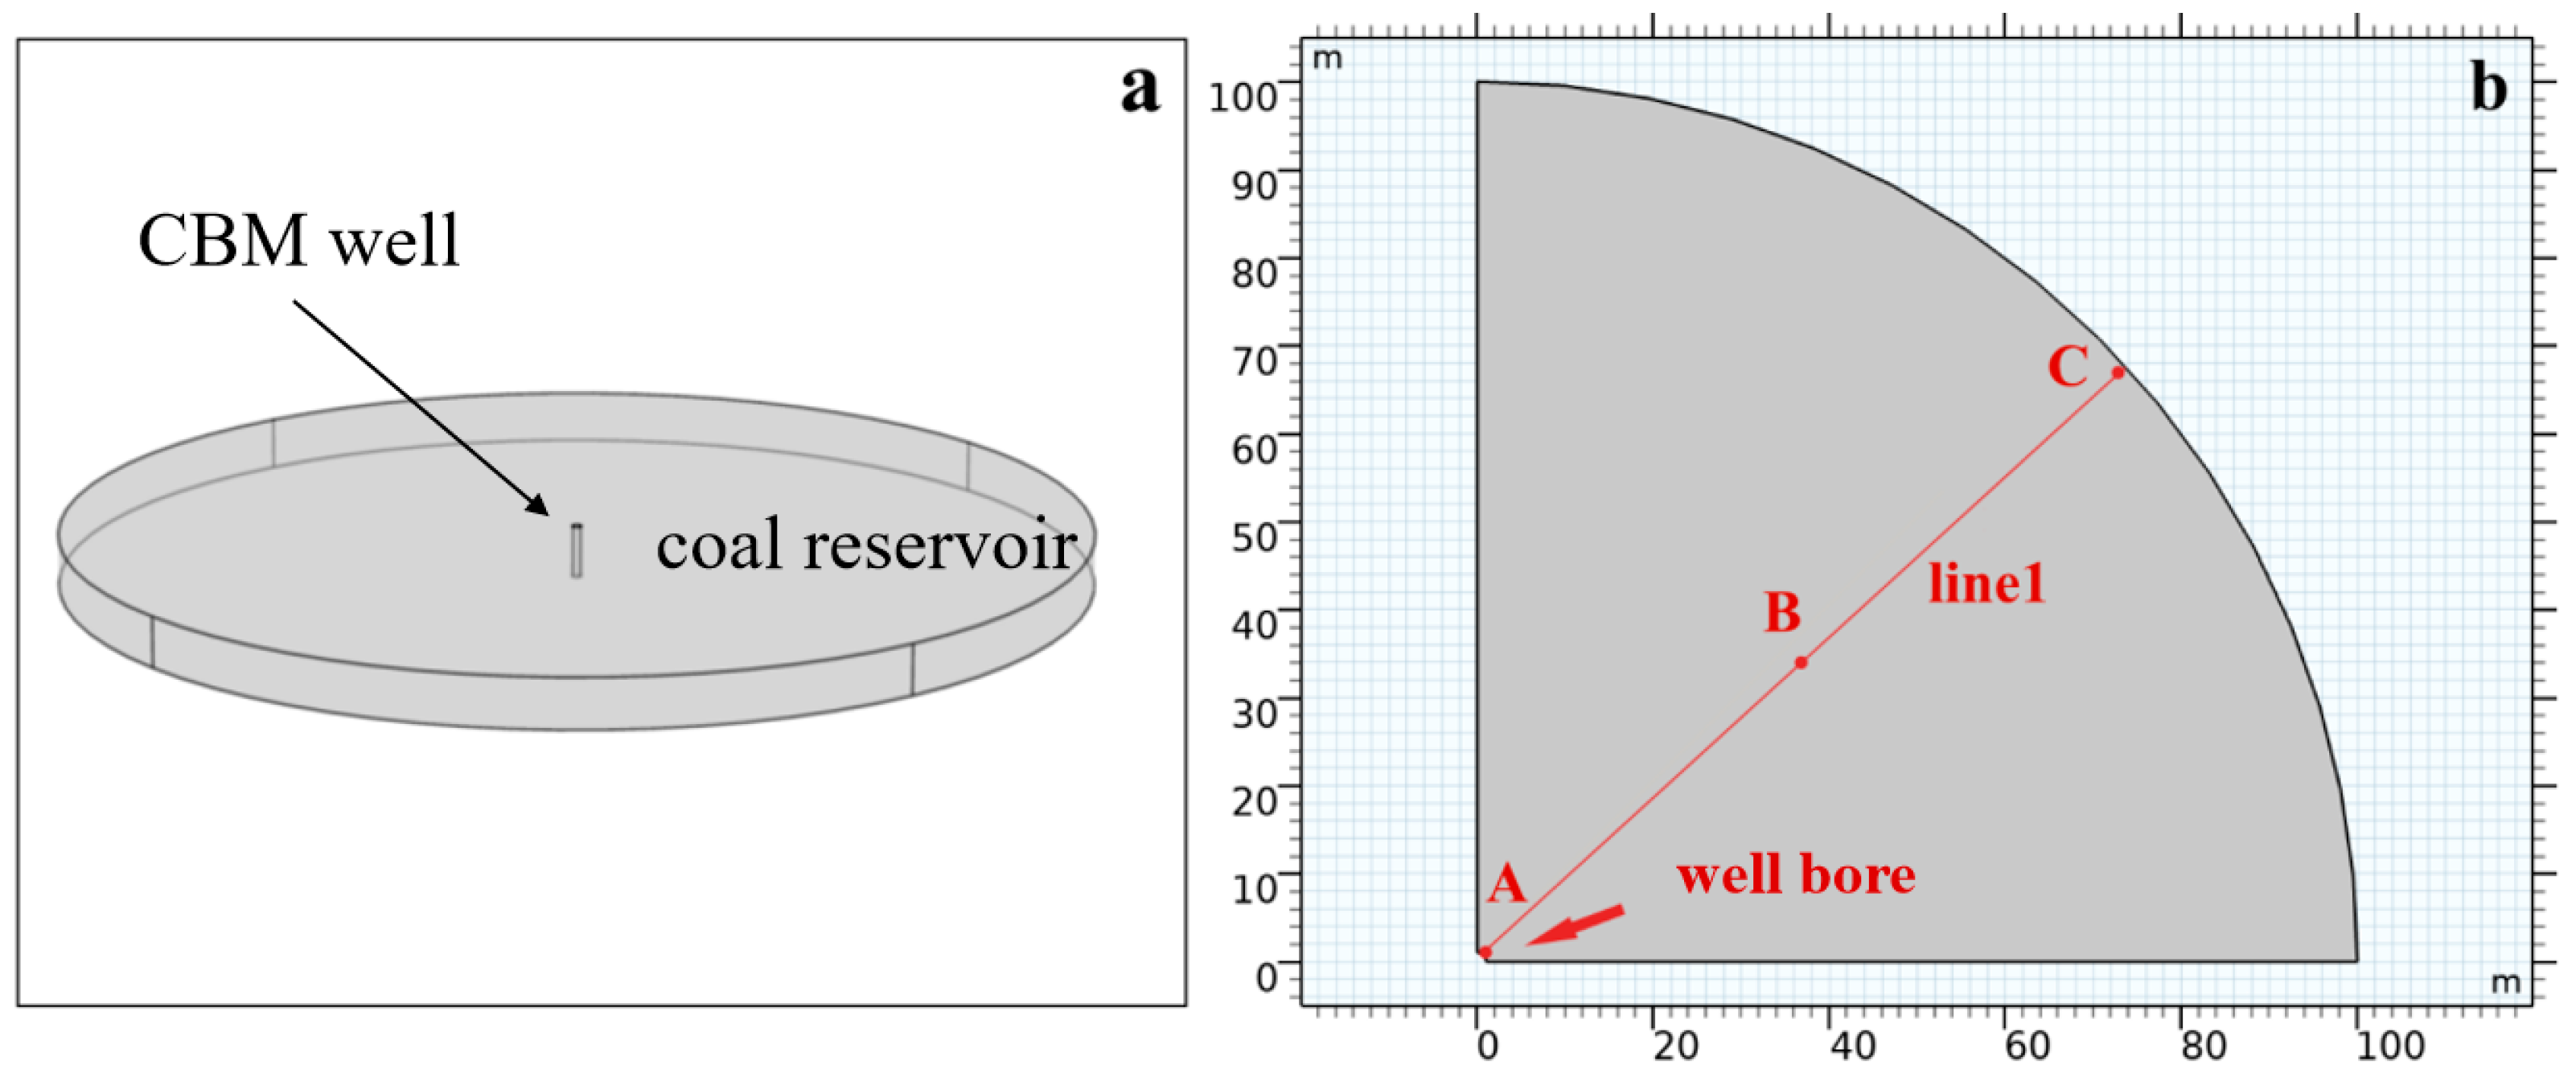
Figure 1. Geometric diagram of the CBM well (a): three-dimensional geometric diagram; (b): two-dimensional plane.
Processes 13 03593 g001
Figure 2. Stress state diagram of unit coal matrix.
Processes 13 03593 g002
Figure 3. Gas/water yield of Well Z29: actual production scenario and simulation results.
Processes 13 03593 g003
Figure 4. Pressure distribution of the coal reservoir at different Young’s moduli (the axis labels represent the distance to the well bore), (a) E = 1.50 GPa, t = 100 d; (b) E = 2.10 GPa, t = 100 d; (c) E = 2.70 GPa, t = 100 d; (d) E = 1.50 GPa, t = 200 d; (e) E = 2.10 GPa, t = 200 d; (f) E = 2.70 GPa, t = 200 d; (g) E = 1.50 GPa, t = 400 d; (h) E = 2.10 GPa, t = 400 d; (i) E = 2.70 GPa, t = 400 d; (j) E = 1.50 GPa, t = 800 d; (k) E = 2.10 GPa, t = 800 d; (l) E = 2.70 GPa, t = 800 d.
Processes 13 03593 g004
Figure 5. The variation of porosity, formation pressure, water saturation and daily gas yield at different Young’s moduli, (a) the variation of porosity at different Young’s moduli; (b) the variation of formation pressure at different Young’s moduli; (c) the variation of water saturation at different Young’s moduli; (d) the variation of gas yield at different Young’s moduli.
Processes 13 03593 g005
Figure 6. The formation pressure distribution of the coal reservoir at different initial permeabilities (the axis labels represent the distances to the well bore).
Processes 13 03593 g006
Figure 7. The change of porosity, water saturation and daily gas yield at different initial permeabilities of the coal reservoir, (a) the change of porosity at different initial permeabilities; (b) the change of water saturation at different initial permeabilities; (c) the change of gas yield at different initial permeabilities.
Processes 13 03593 g007
Figure 8. Formation pressure distribution of coal reservoir in different drainage systems (the axis labels represent the distance to the well bore).
Processes 13 03593 g008
Figure 9. The change in reservoir parameters in different drainage production systems, (a) the change of porosity at 800 d in different drainage systems; (b) the change of formation pressure at 800 d in different drainage systems; (c) the change of water saturation at 800 d in different drainage systems; (d) the change of permeability at 800 d in different drainage systems; (e) the change of porosity with time for point A and B in different drainage systems; (f) the change of water saturation with time for point A and B in different drainage systems.
Processes 13 03593 g009
Figure 10. The change in daily gas yields in different drainage systems.
Processes 13 03593 g010
Table 1. The simulation parameters.
ParameterMeaningValueUnit
ρcApparent density of the coal reservoir1460kg/m3
EYoung’s modulus2.7GPa
vPoisson’s ratio0.30/
TTemperature300K
VLLangmuir volume44.36cm3/g
PLLangmuir pressure3.14MPa
PdCritical desorption pressure1.6MPa
τAdsorption time constant9.5d
φ0Initial porosity0.06/
k0Initial permeability0.5mD
ρwDensity of water1000kg/m3
ρairDensity of gas under standard conditions0.716kg/m3
μwViscosity of water1mPa·s
μgViscosity of CBM0.019mPa·s
pcoalCoal reservoir pressure5.63MPa
bkSlip coefficient0.1MPa
αEffective stress coefficient1/
Table 2. The simulation scheme.
Number of SchemeSchemeVariable Parameter
1Influence of Young’s modulusE = 1.5 GPa
E = 2.1 GPa
E = 2.7 GPa
2Influence of initial permeabilityk0 = 0.1 mD
k0 = 0.5 mD
k0 = 0.9 mD
3Influence of drainage systemPr = 0.02 MPa/d
Pr = 0.04 MPa/d
Pr = 0.08 MPa/d
Disclaimer/Publisher’s Note: The statements, opinions and data contained in all publications are solely those of the individual author(s) and contributor(s) and not of MDPI and/or the editor(s). MDPI and/or the editor(s) disclaim responsibility for any injury to people or property resulting from any ideas, methods, instructions or products referred to in the content.