Article

Analysis of Particle Distribution and Aggregation Characteristics in a Hydrocyclone with a Complex Curved Inlet Structure

1
Henan Longyu Coal Chemical Co., Ltd., Shangqiu 476626, China
2
School of Mechatronic Engineering, China University of Mining and Technology, Xuzhou 221116, China
3
Henan Nengcai Intelligent Technology Co., Ltd., Zhengzhou 450046, China
4
Institute of Intelligent Manufacturing and Smart Transportation, Suzhou City University, Suzhou 215104, China
5
School of Mechanical and Electrical Engineering, Soochow University, Suzhou 215137, China
6
School of Mechanical and Vehicle Engineering, Linyi University, Linyi 276000, China
7
Key Laboratory of Smart Agricultural Equipment in Hilly and Mountainous Areas of Shandong Province, Linyi University, Linyi 276000, China
*
Authors to whom correspondence should be addressed.
Processes 2025, 13(11), 3540; https://doi.org/10.3390/pr13113540
Submission received: 14 October 2025 / Revised: 28 October 2025 / Accepted: 31 October 2025 / Published: 4 November 2025
(This article belongs to the Special Issue Advanced Separation and Purification Processes)

Abstract

The utilization of hydrocyclones dates back more than a century. As the key channel for multiphase flow, the inlet chamber exerts a notable influence on the separation efficiency of hydrocyclones. Conventional feed bodies mainly adopt straight lines as guidelines. During the transition of fluid from linear motion to circumferential motion, significant kinetic energy loss and particle misalignment are exhibited, resulting in relatively low classification accuracy of the hydrocyclone. Therefore, in this study, a hydrocyclone featuring a complex curved inlet chamber structure was designed, and numerical analysis was employed to examine the particle distribution and aggregation characteristics within both the inlet chamber and the hydrocyclone. Supplemented with RSM/VOF/TFM simulations and quartz sand experimental validation, this study compares the separation performance of the complex curved inlet with the conventional linear inlet. The results indicate the following: when particle sizes are small, particles are dispersed throughout the hydrocyclone and inlet chamber, exhibiting a disordered state, which leads to poor classification performance. As particle size increases, particles gradually form layers along the radial direction; larger particles tend to accumulate on the hydrocyclone wall. When the particle concentration is maintained within a specific range, it promotes the migration of fine particles toward the center, thereby reducing the likelihood of fine particles entering the outer vortex and allowing for more precise classification of fine particles. As the particle concentration increases, the cutting ability of the hydrocyclone progressively diminishes; when the concentration exceeds 20%, the maximum underflow recovery rate for particles smaller than 50 µm is only 60%, resulting in significant coarse overflow and a notable decrease in classification precision. Furthermore, as the inlet concentration increases, the dispersion index for 0.5 µm particles ranges from 0.6 to 1.6, for 4 µm particles from 0.6 to 1.4, and for 60 µm particles from 0.6 to 1. The decreasing dispersion index indicates an increasing classification force, which aids in the formation of a coarse particle layer on the wall. The conclusions and data obtained provide a theoretical foundation and empirical support for the design of innovative inlet chamber structures.

1. Introduction

The utilization of hydrocyclones traces back more than a century [1]. Alongside the ongoing advancement of cyclone classification technology, a diverse range of hydrocyclone configurations has been developed. Owing to their inherent advantages—including a compact footprint, high classification efficiency, and lack of moving components—hydrocyclones are extensively employed in industries such as coal separation, petroleum purification, and wastewater treatment [2,3,4,5]. The core operating principle of hydrocyclones lies in the conversion of pressure energy into kinetic energy: when the slurry is injected into the cylindrical section of the hydrocyclone at high pressure, the fluid transitions from linear motion to three-dimensional spiral flow. As the particles descend further, they ultimately enter the primary separation zone (i.e., the conical section), where coarse particles are discharged through the underflow and fine particles via the overflow, thereby completing the particle classification process.
In prior research, the inlet was largely considered merely a channel for slurry conveyance, with limited attention devoted to its in-depth investigation [6,7,8,9]. However, with the advancement of fluid dynamics theory, researchers have revealed that the inlet exerts a crucial influence on particle distribution and flow field stability by integrating numerical simulation and experimental approaches.
The inlet chamber, as a critical conduit for multiphase flow, significantly influences the arrangement of particles within the hydrocyclone. Therefore, a well-designed inlet chamber structure is conducive to enhancing the separation efficiency of the hydrocyclone. With the ongoing evolution of industrialization, various types of inlet bodies have emerged. Meanwhile, researchers have investigated the influence of different inlet structures on hydrocyclone classification performance. Zhao et al. [10] found that adopting a double-symmetric rectangular interface inlet enhances the tangential velocity, enabling particles to acquire stronger centrifugal force and leading to a 3.21% improvement in the overall separation efficiency of the hydrocyclone. Furthermore, as the number of incoming particles increases and the inlet size decreases, the separation efficiency is further enhanced. Liu [11] developed a volute-type inlet configuration, mainly consisting of a spiral structure constructed from straight segments and arcs. This structure exerts a pre-classification function on particles: coarse particles are concentrated on the outer side, while fine particles gather on the inner side, thereby achieving higher classification efficiency. Zhao [12] proposed a boss-guided inlet design, which facilitates the sorting of oil droplets with different densities—oil droplets of varying densities are directed into distinct baffle zones, simplifying the subsequent centrifugal separation process. The co-current oil-water flow in a horizontal serpentine channel was experimentally investigated via high-speed imaging techniques. Distinct flow patterns were induced by independently adjusting the superficial velocities of the two fluids using a dual-drive syringe pump. The findings support the establishment of a flow pattern map, which exhibits substantial discrepancies from the equivalent map obtained for straight microchannels [13,14,15]. While numerous scholars have developed innovative inlet chamber designs, the majority have adopted a single linear profile as the guiding curve, which fails to fully meet the demands of particle motion. Accordingly, the present study introduces a complex curved inlet chamber structure consisting of three successive profiles (linear, involute, and spiral). At the interface between the spiral and involute segments, an arc transition is adopted, and semi-cylindrical protrusions and guiding plates are integrated into the inlet chamber to expedite the formation of the particle layer. The complex curved inlet chamber possesses multiple merits: (1) Multiphase flow is evenly distributed in the linear segment; as particles pass the semi-cylindrical protrusion, the pressure gradient between the upper and lower fluid layers propels more fine particles toward the inner wall of the inlet chamber, thus elevating the proportion of fine particles entering the inner vortex flow. (2) Upon entering the involute segment, particles undergo a transition from disordered dispersion to systematic sedimentation under the action of classification forces, forming a stable particle layer and realizing effective pre-classification. (3) Following pre-classification, particles entering the spiral section experience minimal variation in curvature radii between adjacent segments and maintain tangency with the hydrocyclone column, which reduces particle-wall collisions and results in smoother particle motion, thereby enhancing classification performance.
The methods for investigating particle aggregation and distribution characteristics within a hydrocyclone can be broadly classified into experimental methods and numerical analysis. Although experimental methods provide high measurement accuracy, they are constrained by external disturbances and site limitations [16,17,18,19,20]. In particular, under complex operating conditions, it is often impractical to deploy experimental equipment, which restricts the broader applicability of these methods. Conversely, numerical analysis utilizes appropriate physical models to predict the trajectories of particles within the hydrocyclone, and its results demonstrate a high degree of correlation with experimental data. Furthermore, numerical analysis is not influenced by site conditions or external operating environments, making it widely utilized in this field. The essence of numerical analysis lay in adopting reasonable mathematical models to predict the variation characteristics of the internal flow field and particle motion in hydrocyclones [21,22], thereby obtaining relevant evaluation parameters. Turbulence models and multiphase flow models were commonly used mathematical models for predicting the classification performance of hydrocyclones. Among them, the RSM model within the turbulence model category fully accounted for turbulent anisotropy [23,24,25], and exhibited high prediction accuracy for the high turbulence field generated by the three-dimensional spiral motion inside hydrocyclones. Multiphase flow models were mainly classified into the VOF and TFM models [26]. The VOF model effectively predicted the variation characteristics of the internal flow field in hydrocyclones, which was primarily applied to air-water two-phase simulation. Meanwhile, it accurately captured the dynamic changes in the air core, facilitating the investigation of the dynamic development characteristics of the air core. The TFM model was dedicated to water-particle two-phase simulation [27], which effectively predicted the particle classification characteristics inside hydrocyclones and was also applicable to the prediction of particles in high-concentration slurries.
Drawing on hydrodynamic theory and particle dynamics theory, this study explored the internal flow field and particle classification performance of a hydrocyclone equipped with a composite curved feed body. To begin with, the RSM + VOF model was utilized to characterize the flow field, yielding the flow field variation behaviors under different operating parameters [28,29]. Secondly, the RSM + TFM model was applied to elucidate the motion behaviors of the particle phase. Finally, laboratory experiments were carried out to determine the primary and secondary influencing factors affecting the classification performance of the composite curved feed body hydrocyclone, and the accuracy of the numerical analysis was verified. The findings obtained offer a theoretical foundation and data backing for the structural design of the novel feed body.

2. Mathematical Model

2.1. Model Description

ANSYS Fluent 2021 R2 was employed for the numerical simulations in this study. Considering the complexity of the flow field in the hydrocyclone, the whole numerical simulation process can be divided into two steps [30]. The two-step simulation (clear water flow first, then solid–liquid flow) was designed per hydrocyclone flow characteristics. For 3–20% solid concentrations, solid disturbance to liquid flow was weak (interphase coupling coefficient < 0.1). Tight coupling tripled computation with <3% accuracy gain, while validation against Hsieh’s and Delgadillo’s data (error < 8%) confirmed reliability, consistent with Vakamalla et al. [31]. Firstly, The RSM + VOF model was adopted to obtain the characteristics of the water-air two-phase flow field, with no solid particles involved. Meanwhile, the VOF model effectively captured the dynamic variation characteristics of the air core inside the hydrocyclone, which facilitated the investigation of the air core [32,33].
Next, after the flow field stabilized, particles with different particle sizes were introduced into the Fluent. The TFM model was adopted to obtain the water-particle two-phase characteristics under different concentrations, and the RSM model was still employed for turbulence prediction.

2.2. Geometric Model

This paper designs a hydrocyclone with a complex curved inlet structure, as shown in Figure 1a; the structural parameters and analysis lines are shown in Figure 1b, while top-view parameters are shown in Figure 1c. The inlet consists of three types of curves: a straight line, an involute curve, and a vortex curve. The vortex curve and the involute curve are connected by an arc. Furthermore, a semi-cylindrical boss and a baffle are mounted inside the inlet to expedite the formation of the particle layer. The complex curved inlet offers three key advantages: (1) The multiphase flow is evenly distributed in the straight segment. As particles traverse the semi-cylindrical boss, owing to the pressure difference between the upper and lower fluid layers, more fine particles migrate toward the inner wall of the inlet, enhancing the proportion of fine particles entering the inner vortex flow. (2) Particles entering the involute segment undergo a transition from a randomly dispersed state to regular sedimentation under the action of classification forces, forming a stable particle layer and realizing effective pre-classification of the particles. (3) Following pre-classification, the particles enter the vortex segment. Due to the minimal variation in curvature radius near the vortex curve and its tangential connection with the cylindrical section of the hydrocyclone, the collision between particles and the hydrocyclone wall is mitigated, leading to smoother particle motion and, in turn, improved classification performance.

2.3. Boundary Condition Setup and Mesh Division

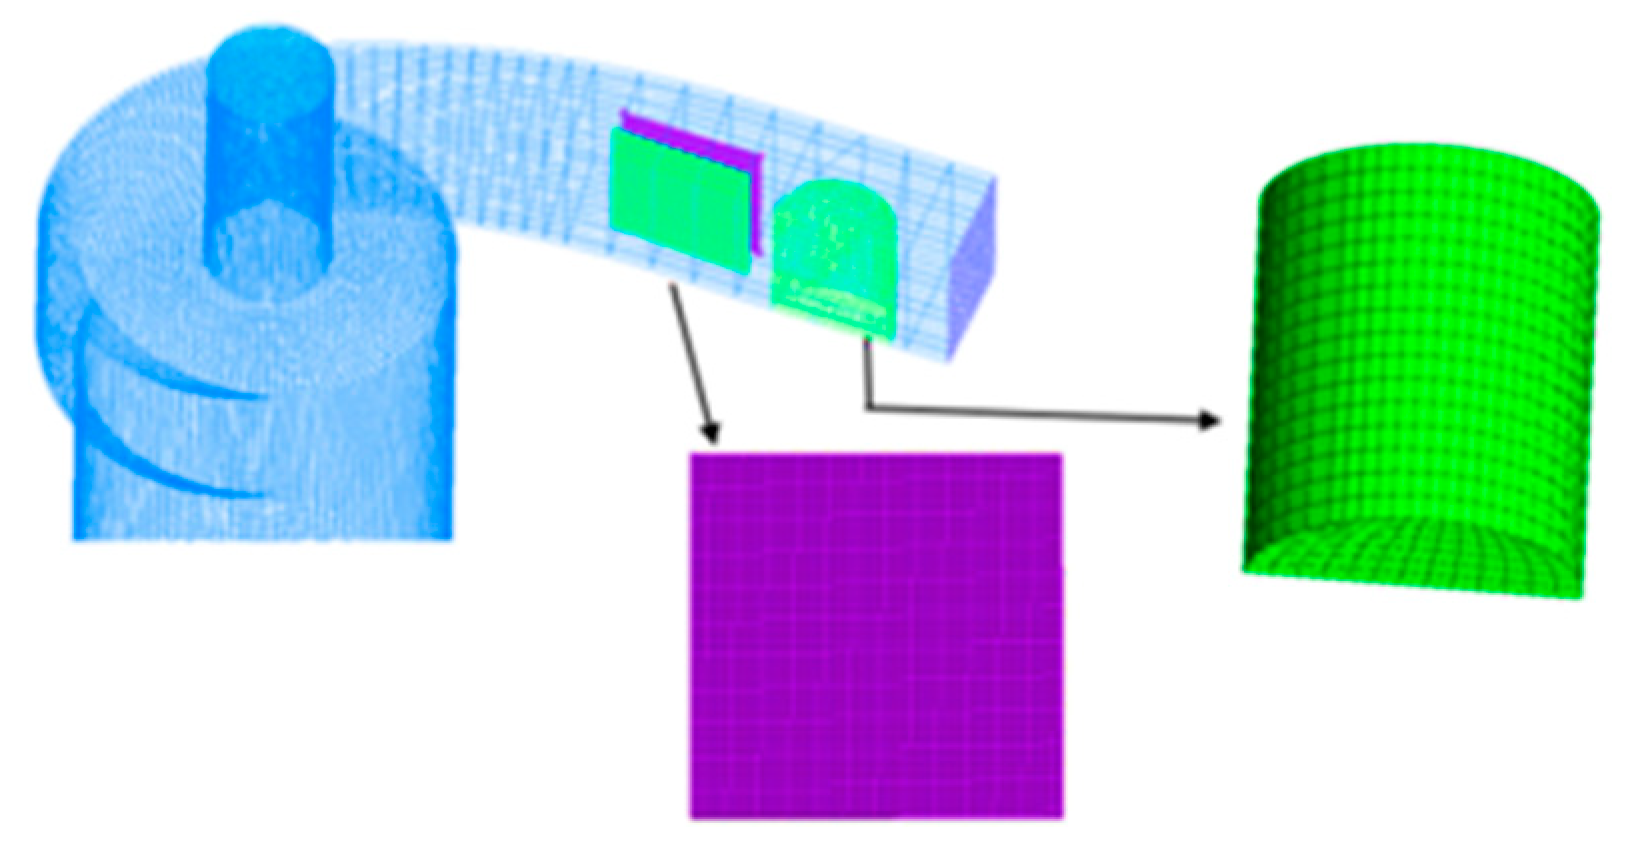
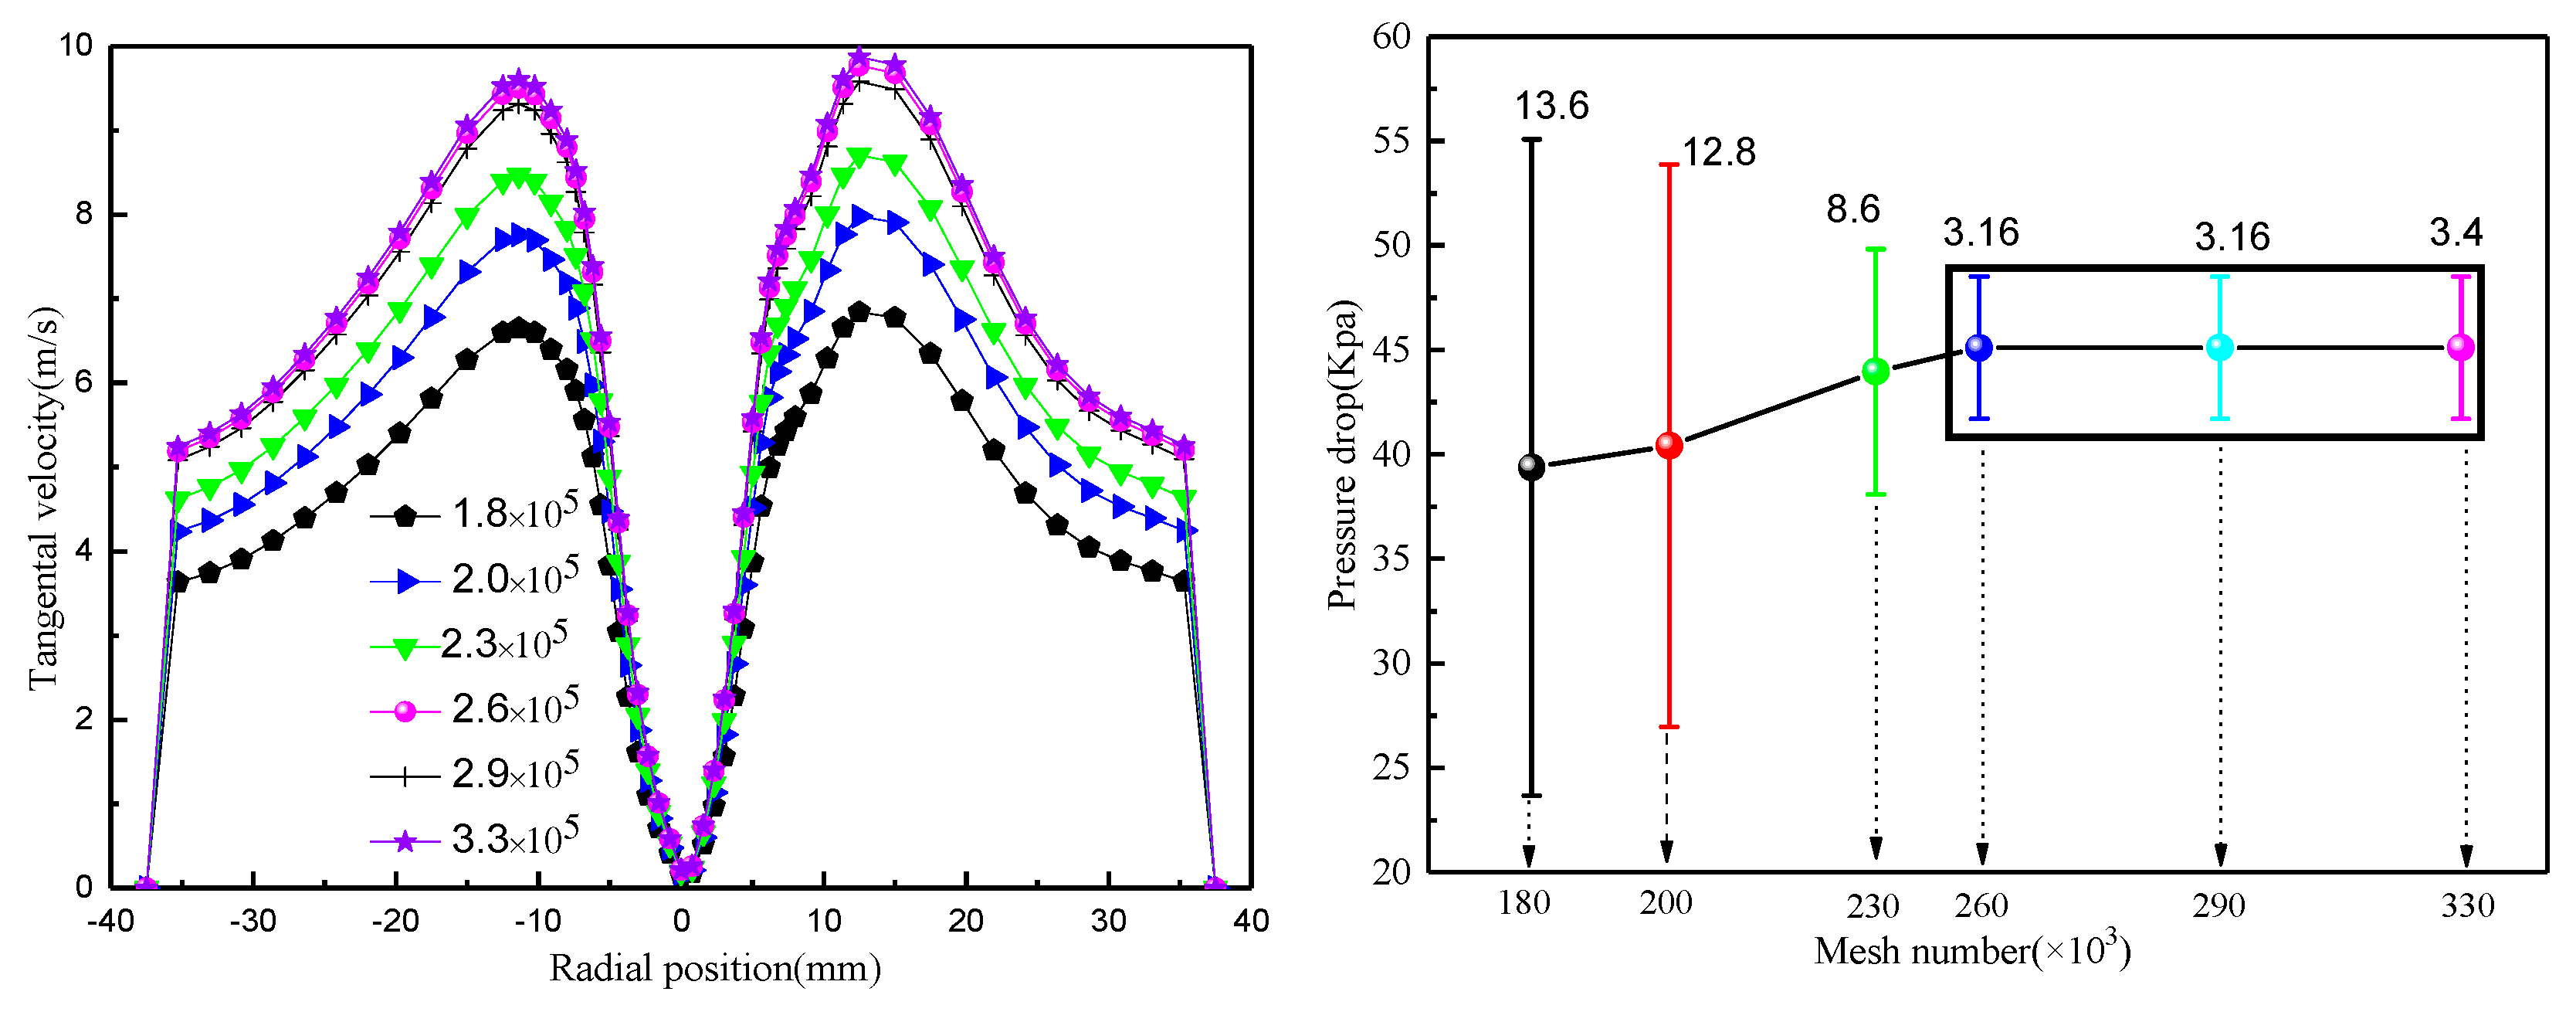
With the exception of the inlet configuration, all other structural components are consistent with those of the classic Hsieh hydrocyclone, and the specific structural parameters are presented in Figure 1. To examine the influence of the inlet configuration on the hydrocyclone’s classification performance, a meshing process is essential. Hexahedral meshes, renowned for their high computational accuracy and rapid convergence, are extensively employed in such numerical studies; thus, they were adopted herein to discretize the hydrocyclone geometry (Figure 2). Given that the overflow pipe’s geometry exerts a notable effect on the hydrocyclone’s classification efficiency, mesh refinement was implemented along the overflow pipe wall to capture subtle flow behaviors. To identify the optimal mesh element count, a grid independence analysis was performed (Figure 3). When the number of mesh elements reached 2.6 × 10⁵, the pressure drop remained stable with additional increases in mesh density, demonstrating that further mesh refinement beyond this threshold would not enhance numerical precision.

2.4. Model Validation

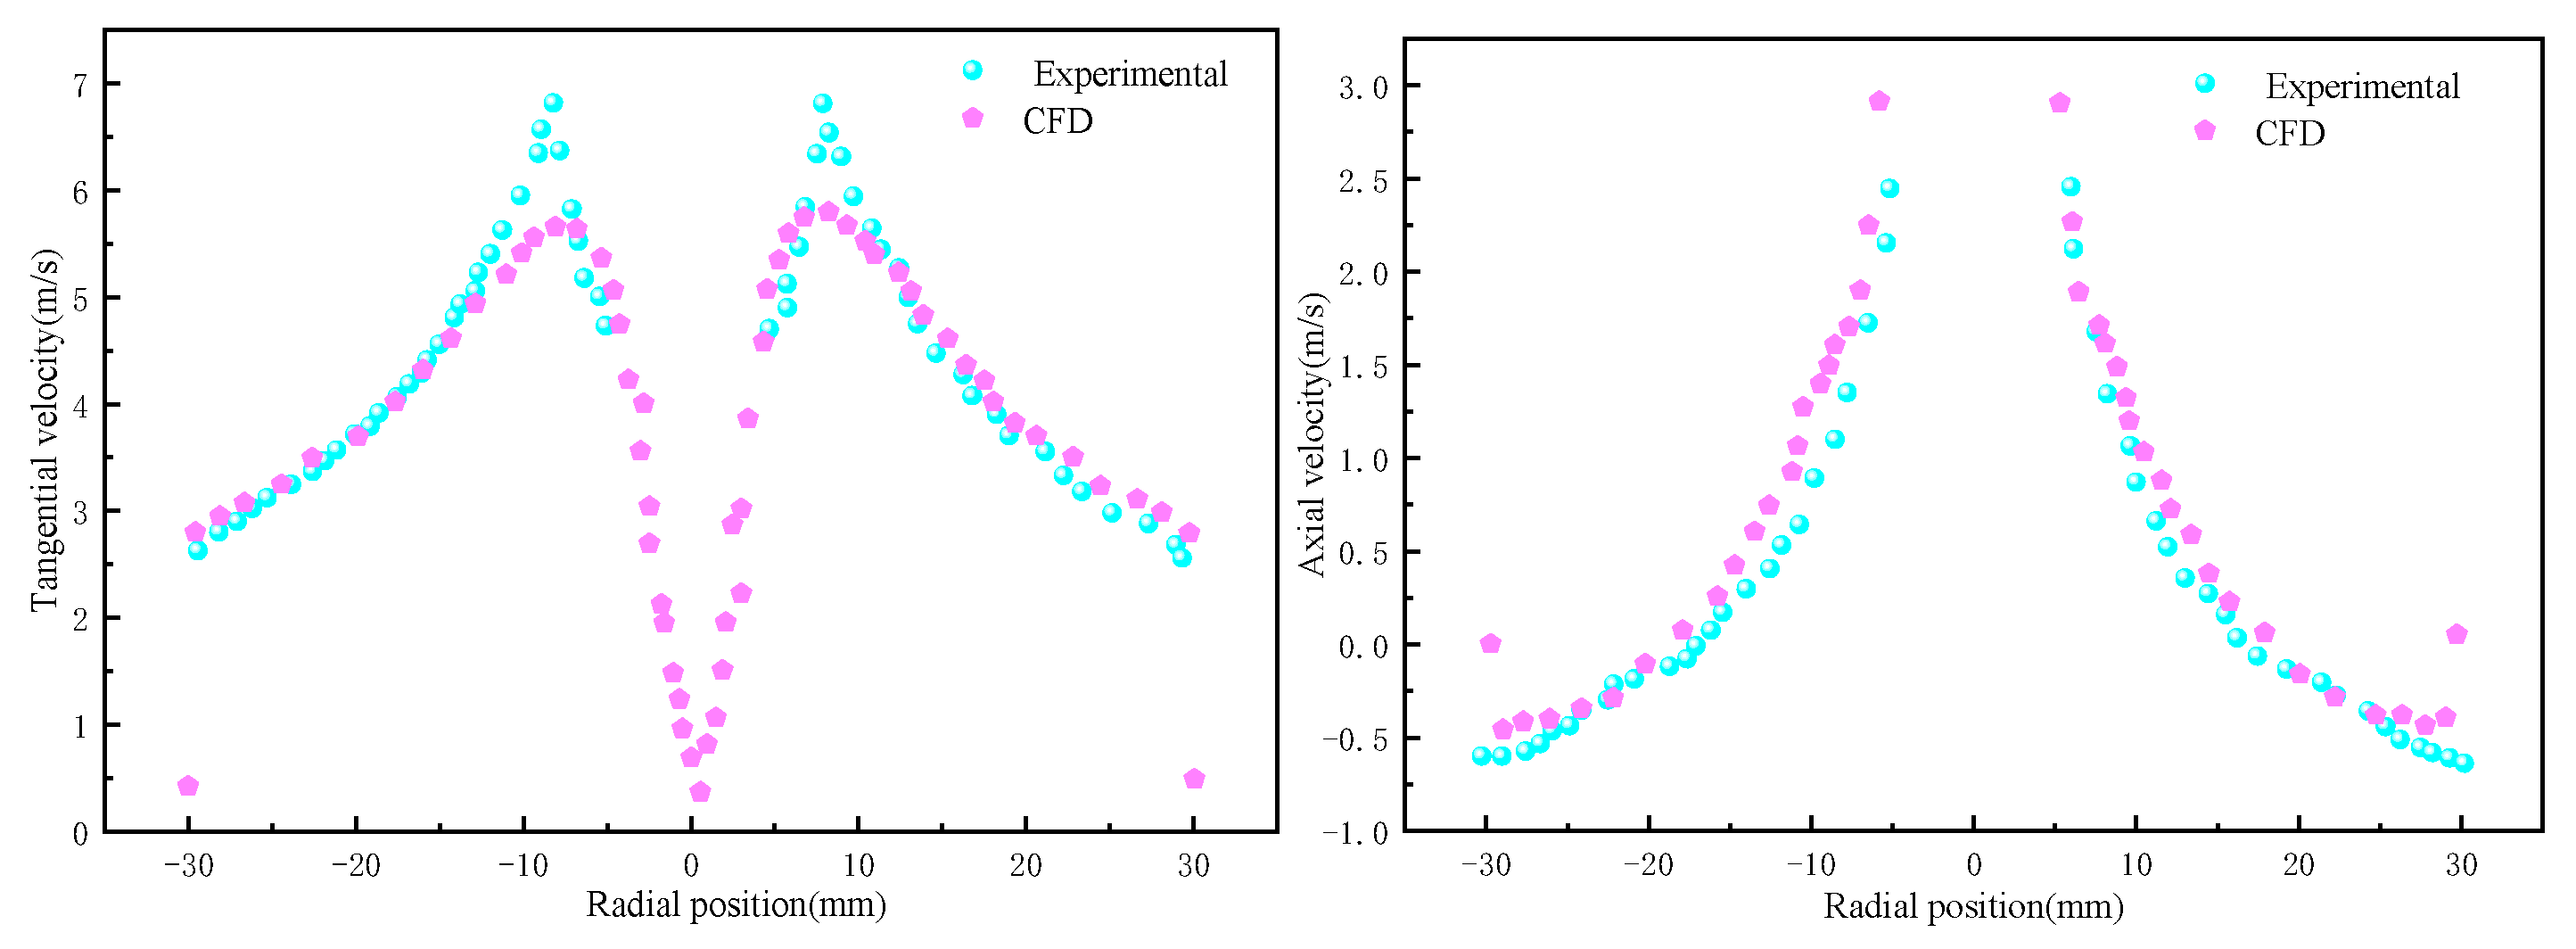
To validate the accuracy of the flow field data derived from the VOF + RSM model and the particle phase data from the RSM + Mixture model, the classical experimental data reported by Hsieh and Delgadillo were compared with the simulation results. In 1988, Hsieh [34] carried out experimental measurements on the internal flow field of a hydrocyclone with a diameter of 75 mm using specialized experimental apparatus, yielding a series of flow field data that are commonly adopted by scholars for validating their physical models. Delgadillo [35] investigated the classification efficiency of solid-phase particles at a concentration of 10.47%, generating numerous classic experimental findings. In the present study, a hydrocyclone model with structural parameters consistent with those in Hsieh’s experiment was first established, and numerical simulations were performed for both the internal flow field and solid-phase particles. The experimental data can be referenced from literature. The comparison results indicate that it is feasible to use numerical analysis methods to investigate the classification performance of hydrocyclones.
Prior to applying mathematical models for numerical analysis, it is imperative to verify their accuracy and reliability. The RSM/VOF model was employed to simulate the internal flow field characteristics of the hydrocyclone, and the simulation results were compared with Hsieh’s [34] experimental data obtained via laser Doppler velocimetry (LDV), as presented in Figure 4. The simulated and experimental data showed excellent consistency, with minor discrepancies observed at the maximum tangential velocity—these are mainly ascribed to operational deviations during the experiment. Overall, the RSM/VOF model proved capable of effectively predicting the internal flow field behaviors of the hydrocyclone.
The RSM/Mixture model was employed to predict the hydrocyclone’s classification performance for the particle phase, with results compared against Delgadillo’s [35] experimental data at a solid concentration of 10.47%. As presented in Figure 5, simulated and experimental data exhibited consistent variation trends, though recovery errors were observed for particles smaller than 5 μm. Specifically, experimental recovery of particles <5 μm was zero, as no such fine particles were present in the experimental material. Furthermore, given the strong hydrophilicity and poor classifiability of fine particles, their discharge rate was nearly equivalent to the liquid split ratio—a phenomenon also observed in Delgadillo’s experiment.

3. Results and Discussion

3.1. The Effect of Particle Size on Particle Aggregation Characteristics

To illustrate the aggregation and distribution characteristics of particles within the hydrocyclone, five particle sizes—0.5 µm, 4 µm, 15 µm, 25 µm, and 60 µm—were selected for investigation.
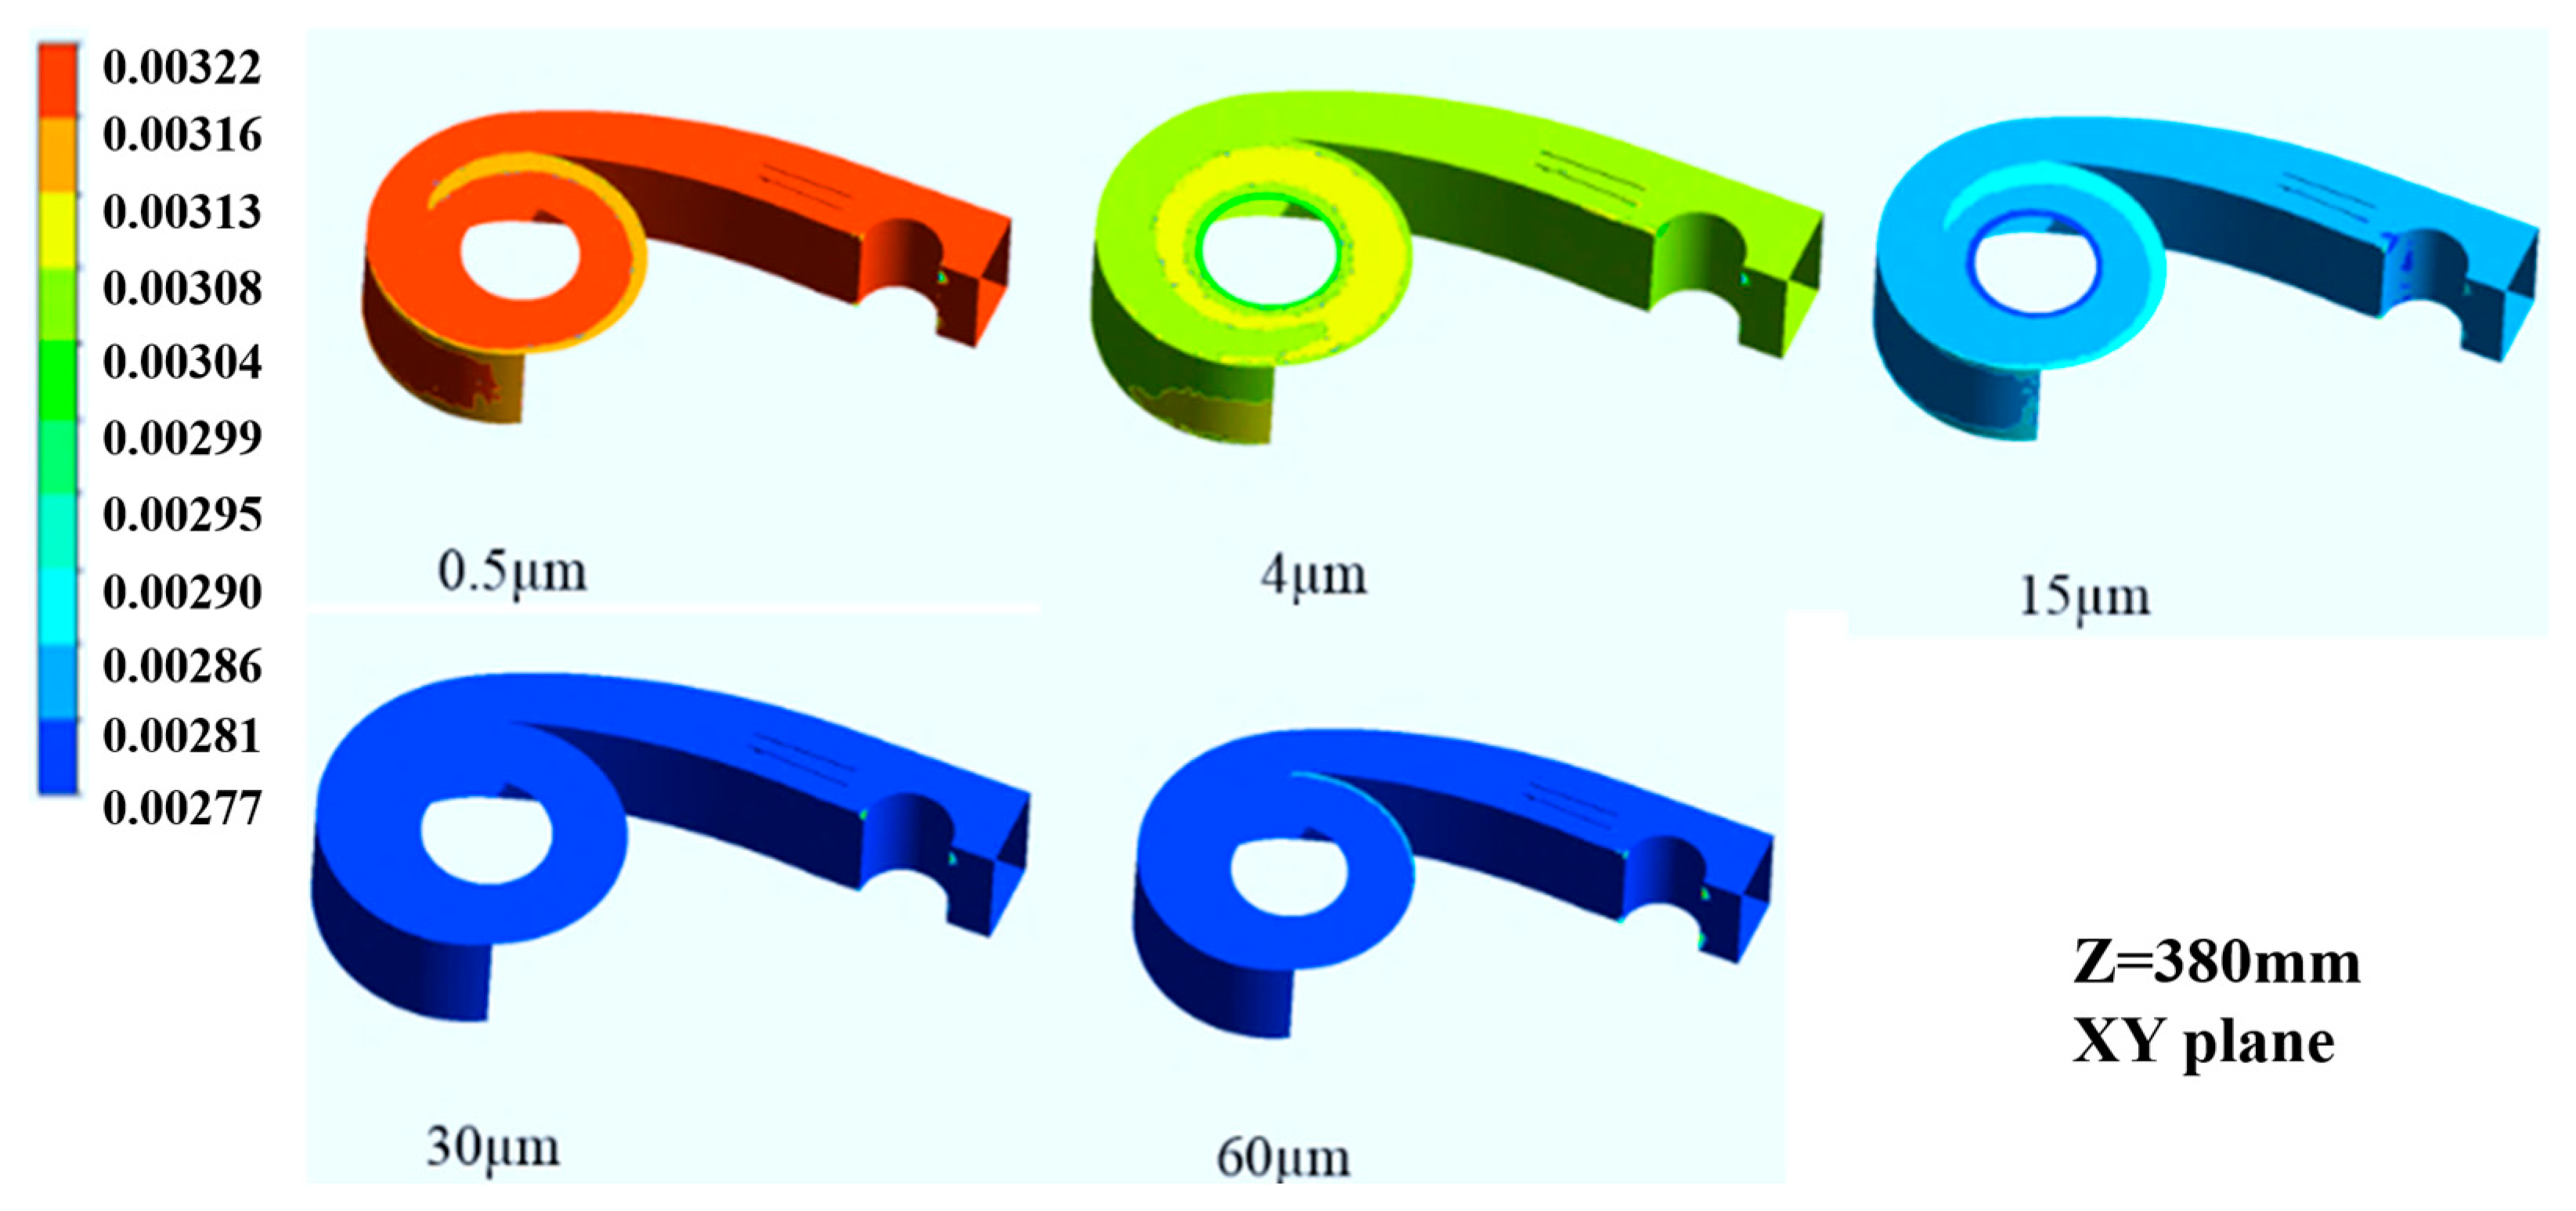
Figure 6 illustrates the distribution of particles of varying sizes within the ZX plane. For relatively small particle sizes (0.5 µm and 4 µm), fine particles are almost uniformly dispersed throughout the hydrocyclone region due to their high affinity for water, which complicates their separation. Medium-sized particles (15 µm) begin to accumulate along the hydrocyclone wall, forming a particle layer in the radial direction, where classification forces become more pronounced. In the case of larger particles (60 µm), they aggregate along the hydrocyclone wall, resulting in the formation of a coarse particle layer. The particle size distribution reveals a layered structure, with larger particles situated near the wall and progressively smaller particles toward the center. Figure 7 presents the distribution of different particles in the XY plane. Fine particles (4 µm) commence the formation of a particle layer within the inlet body, demonstrating the guiding effect and effective classification capability of the complex curved inlet structure for fine particles. Coarse particles (30 µm and 60 µm) tend to accumulate along the outer wall of the inlet body, where the volume fraction is lowest at the center, thereby forming a dense coarse particle layer that facilitates classification. The complex curved inlet hydrocyclone demonstrates high classification accuracy for fine particles, primarily due to the significant pressure gradient force acting on them, which reduces their outflow ratio through the apex and enhances their discharge rate through the vortex finder.
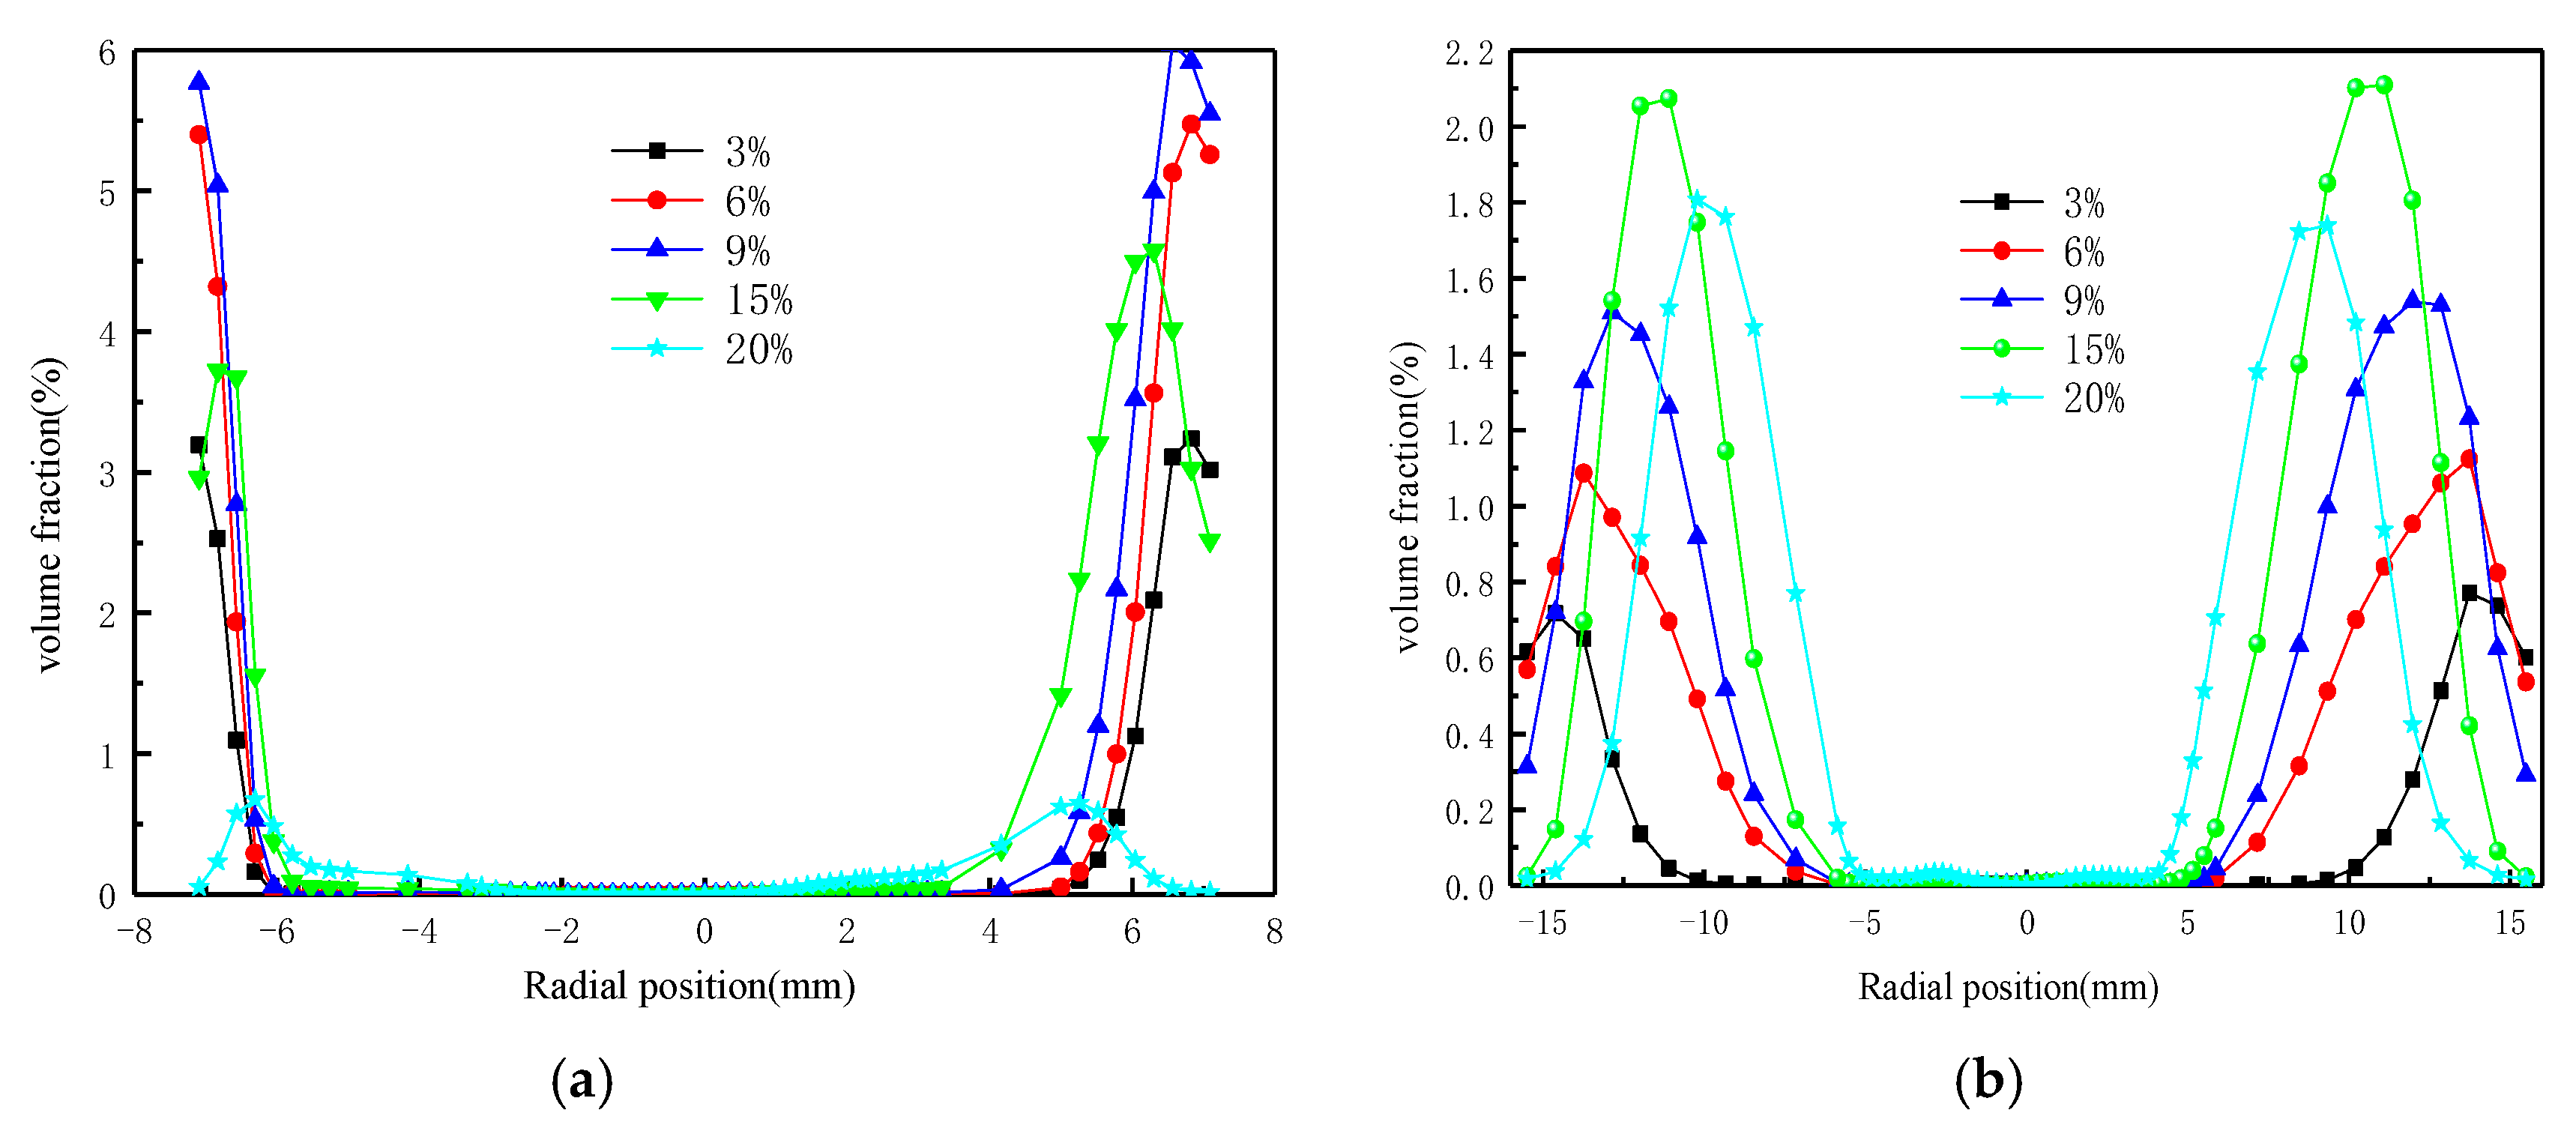
Figure 8 depicts the axial variation of particles across different size fractions along the diametral line. For ultrafine particles (0.5 µm), the volume fraction first rises and then declines along the axial direction from the wall toward the center. This distribution characteristic is comparable to the combined vortex configuration within the flow field, demonstrating that ultrafine particles exist in both the free vortex and forced vortex regions, where turbulent diffusion forces exert a dominant effect. For fine particles (4 µm), the volume fraction first increases and subsequently declines as the axial position changes. At Z = 60 mm, a maximum in particle volume fraction is detected, a phenomenon linked to the circulation and confluence effects inside the hydrocyclone. For sub-coarse particles (25 µm) and coarse particles (60 µm), the particle volume fraction displays distinct regional features, with a volume fraction of zero at the center. This observation is mainly attributed to the air core’s lack of involvement in the particle classification process. As the axial position increases, the maximum particle volume fraction gradually shifts toward the wall, which is a consequence of classification forces. This effect becomes more pronounced with increasing distance from the apex.

3.2. The Effect of Concentration on Particle Aggregation Characteristics

Investigation on the Effect of Particle Concentration on Particle Motion Characteristics: Particle concentration significantly influences the forces acting on particles and their motion behavior within the hydrocyclone. At low particle concentrations, inter-particle interactions are negligible, and the forces within the flow field dominate, resulting in particle trajectories that align with fluid motion. Conversely, at high particle concentrations, particle–particle interactions become predominant, surpassing the influence of flow field forces, which leads to hindered settling as the primary motion mechanism. Thus, to examine the influence of inlet concentration on particle movement characteristics, five particle concentration levels (3%, 6%, 9%, 15%, and 20%) and five particle size fractions (0.5 µm, 4 µm, 15 µm, 30 µm, and 60 µm) were chosen for systematic analysis. This study seeks to elucidate the microscopic mechanisms through which particle concentration modulates particle aggregation behaviors and to clarify the distribution characteristics of different particle sizes inside the hydrocyclone under varying concentration conditions. Figure 9 illustrates the distribution patterns of ultrafine particles (0.5 µm) at varying particle concentrations. At low concentrations (<6%), ultrafine particles are dispersed throughout the hydrocyclone region due to their strong affinity for water, where the pressure gradient force and fluid drag are insufficient to counteract the centrifugal force. As concentration increases, ultrafine particles gradually migrate toward the center of the hydrocyclone, indicating that intensified inter-particle interactions enhance the classification forces acting on fine particles, thereby driving ultrafine particles toward the core region.
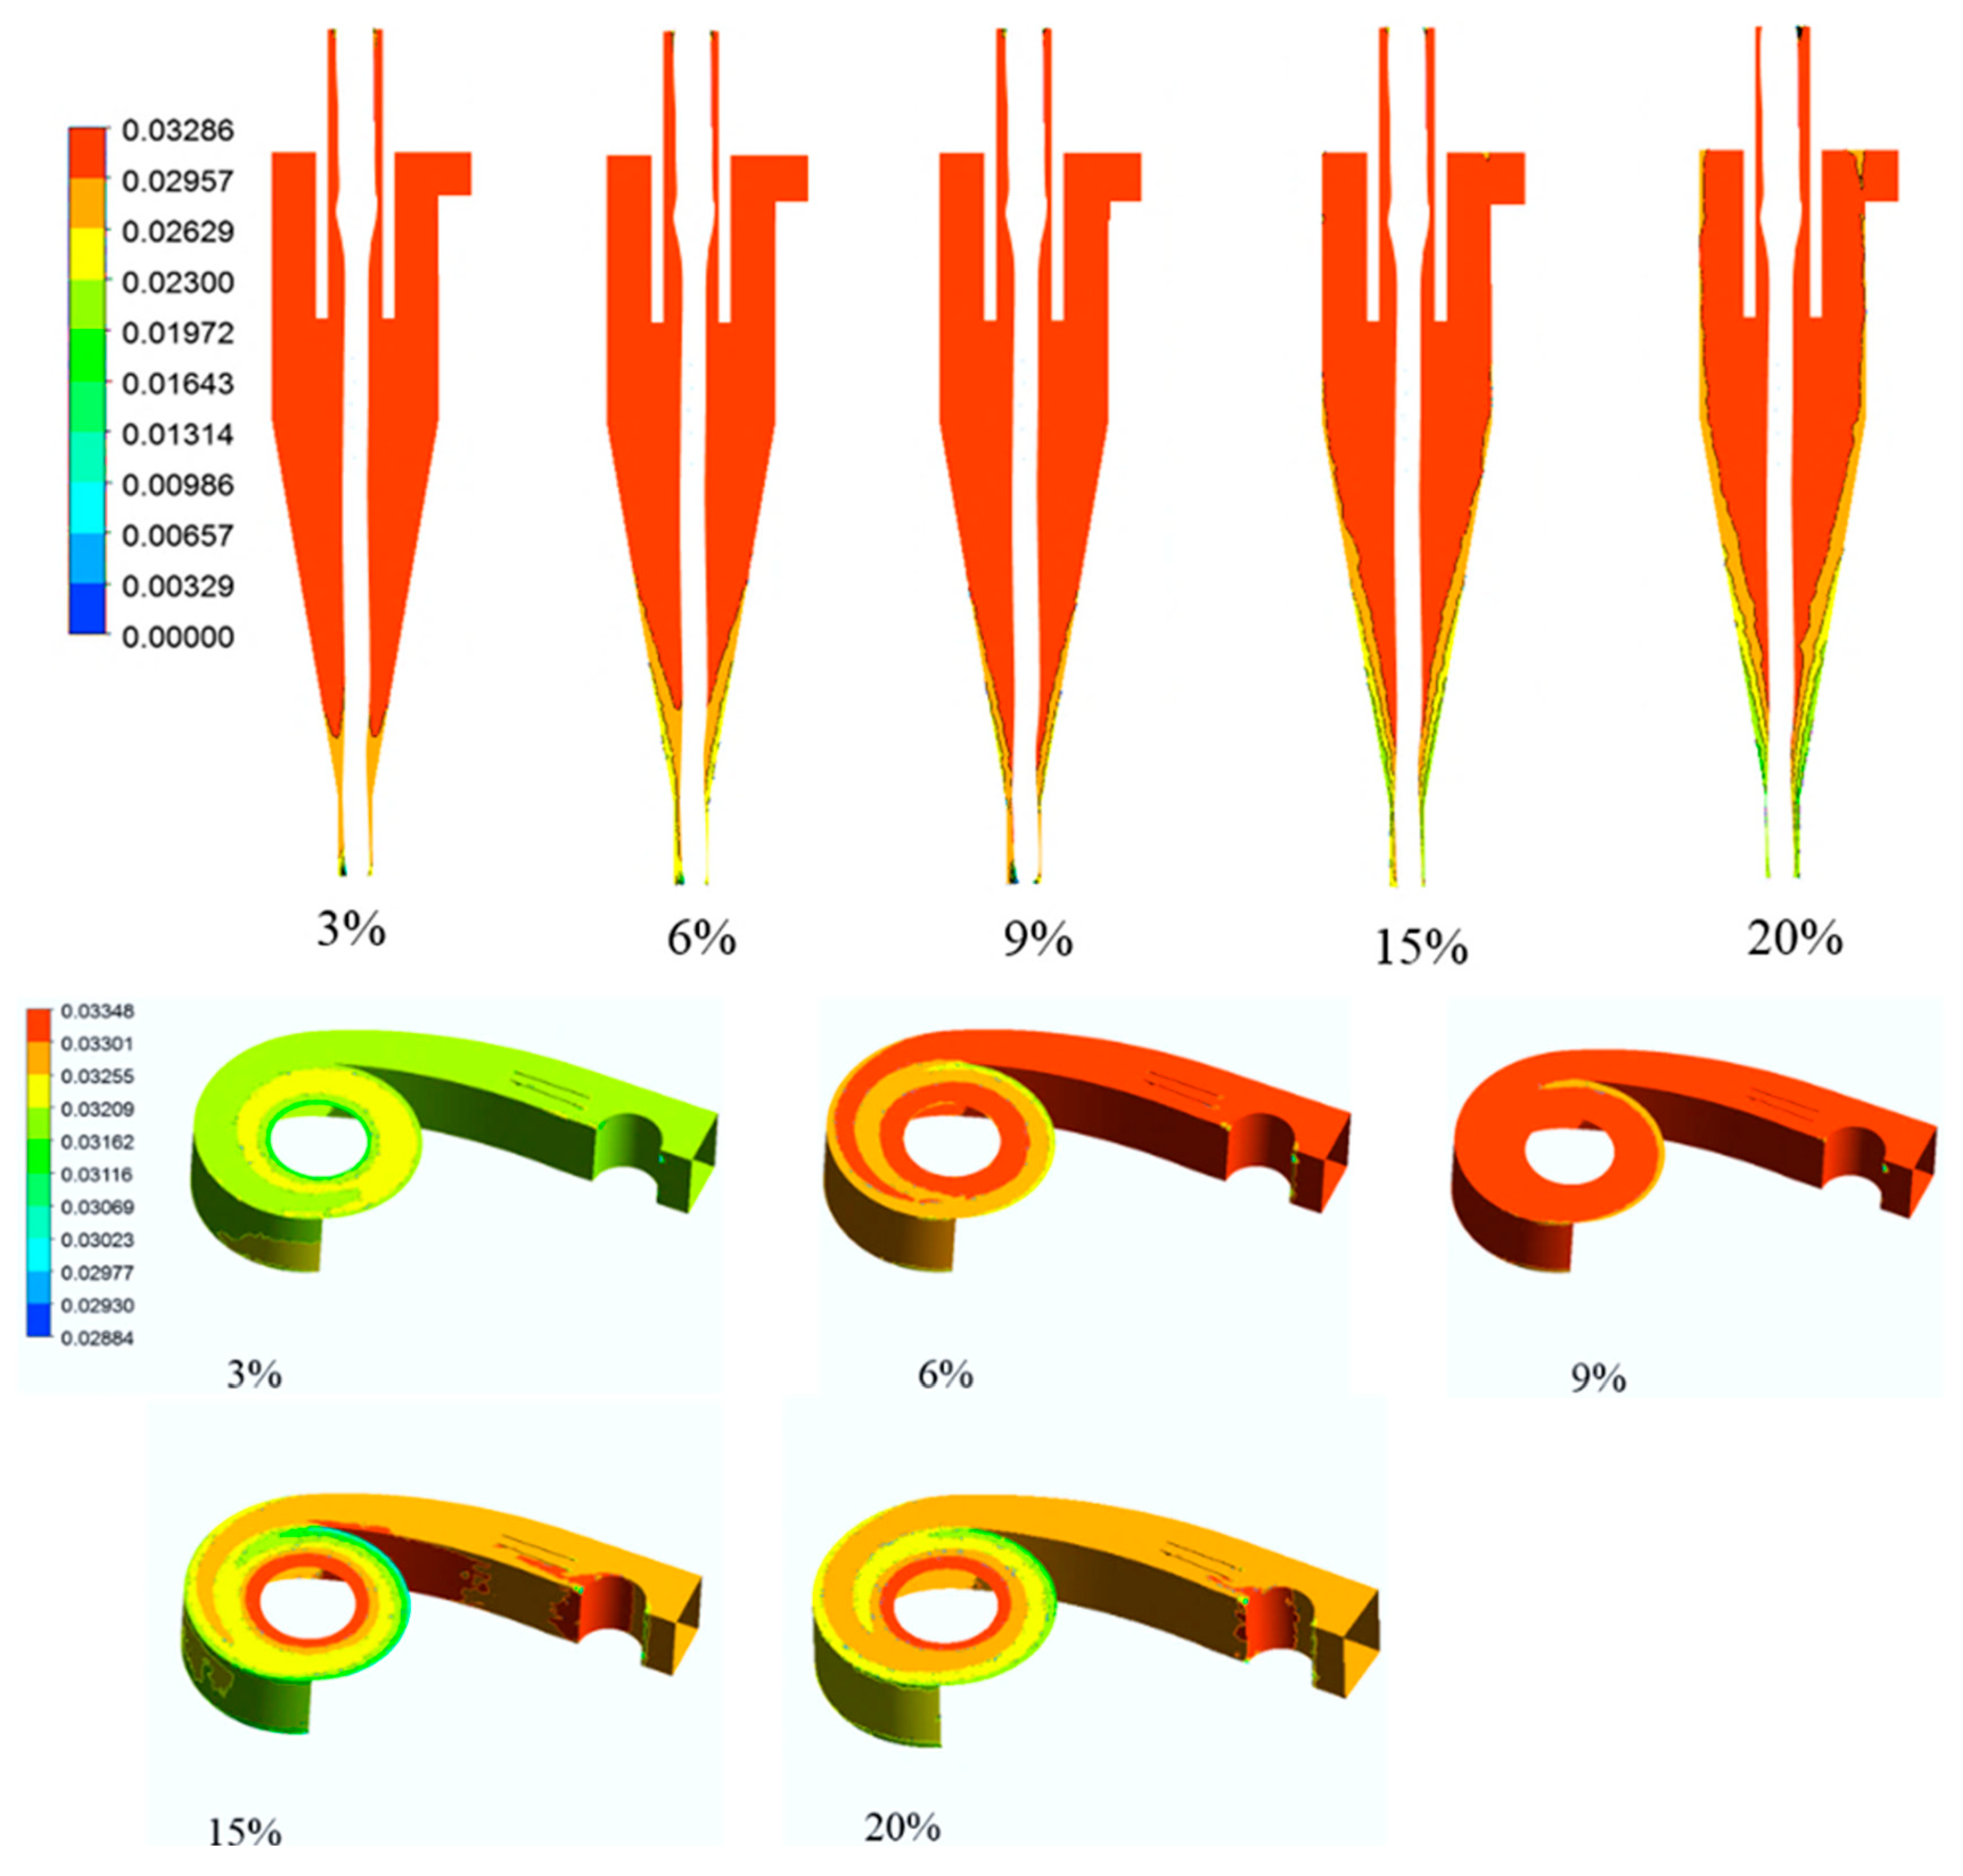
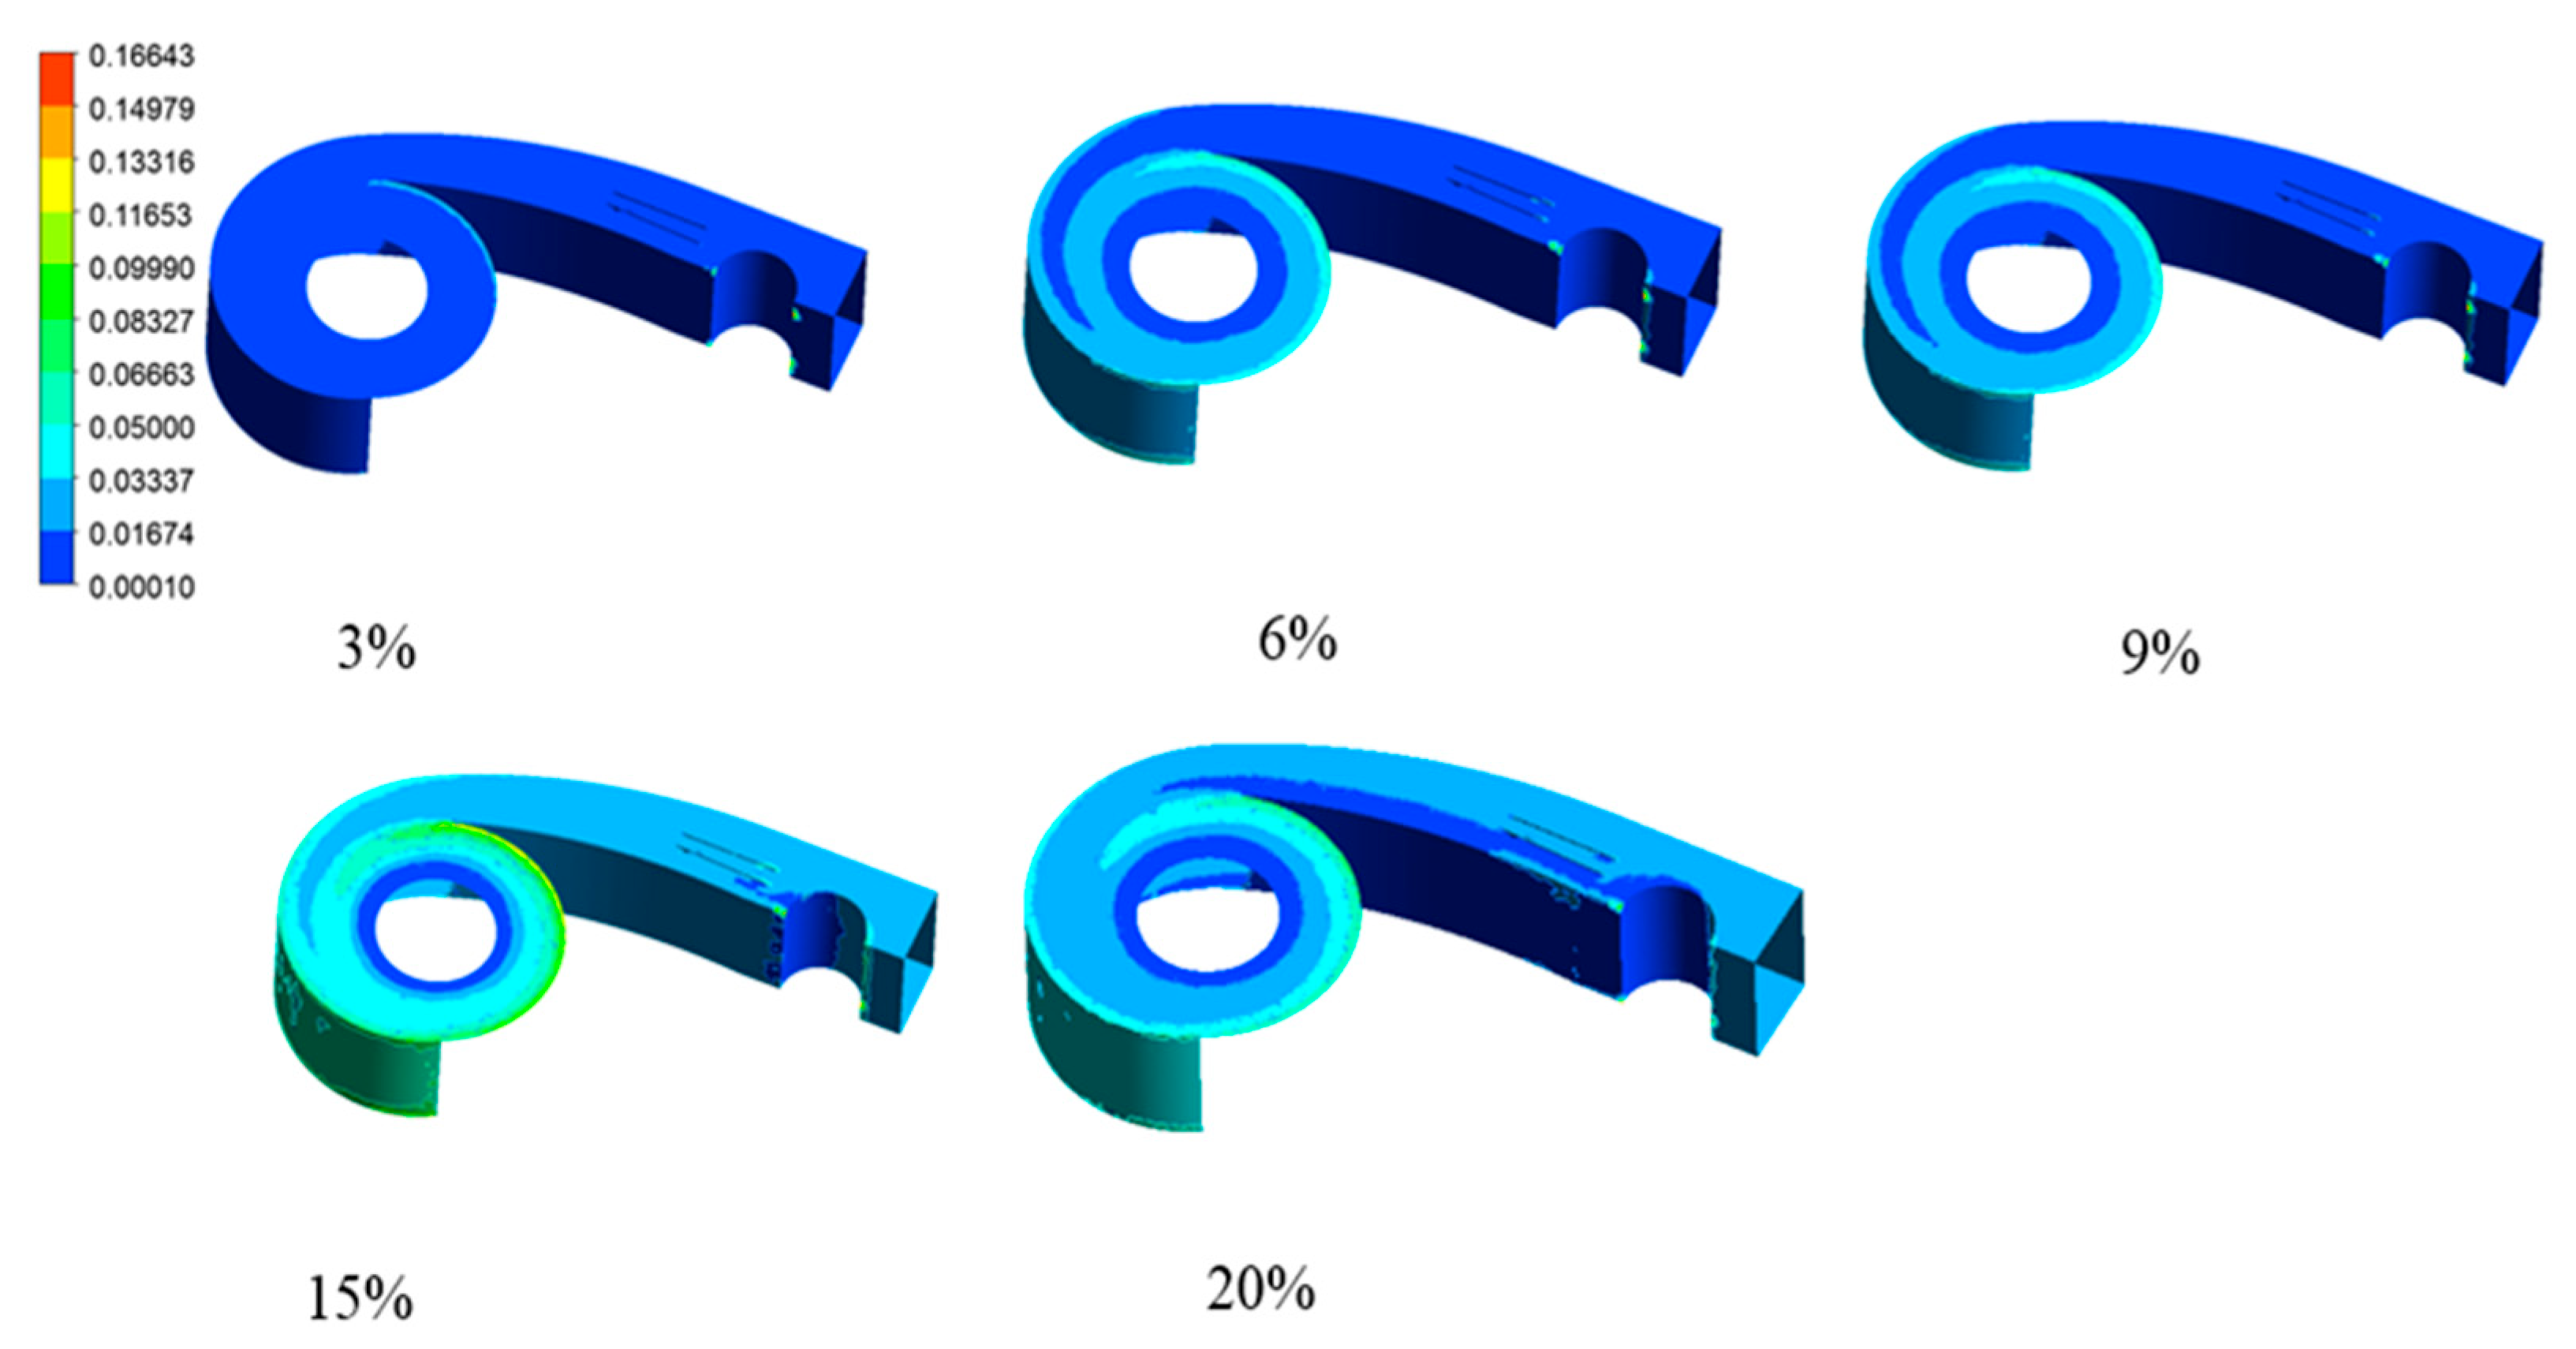
Figure 10 illustrates the distribution patterns of fine particles (4 µm) at varying particle concentrations. As the concentration increases, fine particles gradually migrate toward the center. When the concentration exceeds 9%, the region of particle aggregation shifts upward, with this phenomenon becoming particularly pronounced at a concentration of 20%. In the XY plane, when the concentration ranges from 6% to 9%, fine particles are dispersed throughout the tangential inlet. This dispersion occurs due to the balance between classification forces and turbulent diffusion forces, where lower concentrations impede fine particle classification. As the particle concentration further increases, fine particles migrate toward the inner wall of the tangential inlet. Therefore, an appropriate inlet concentration is more conducive to fine particle classification.
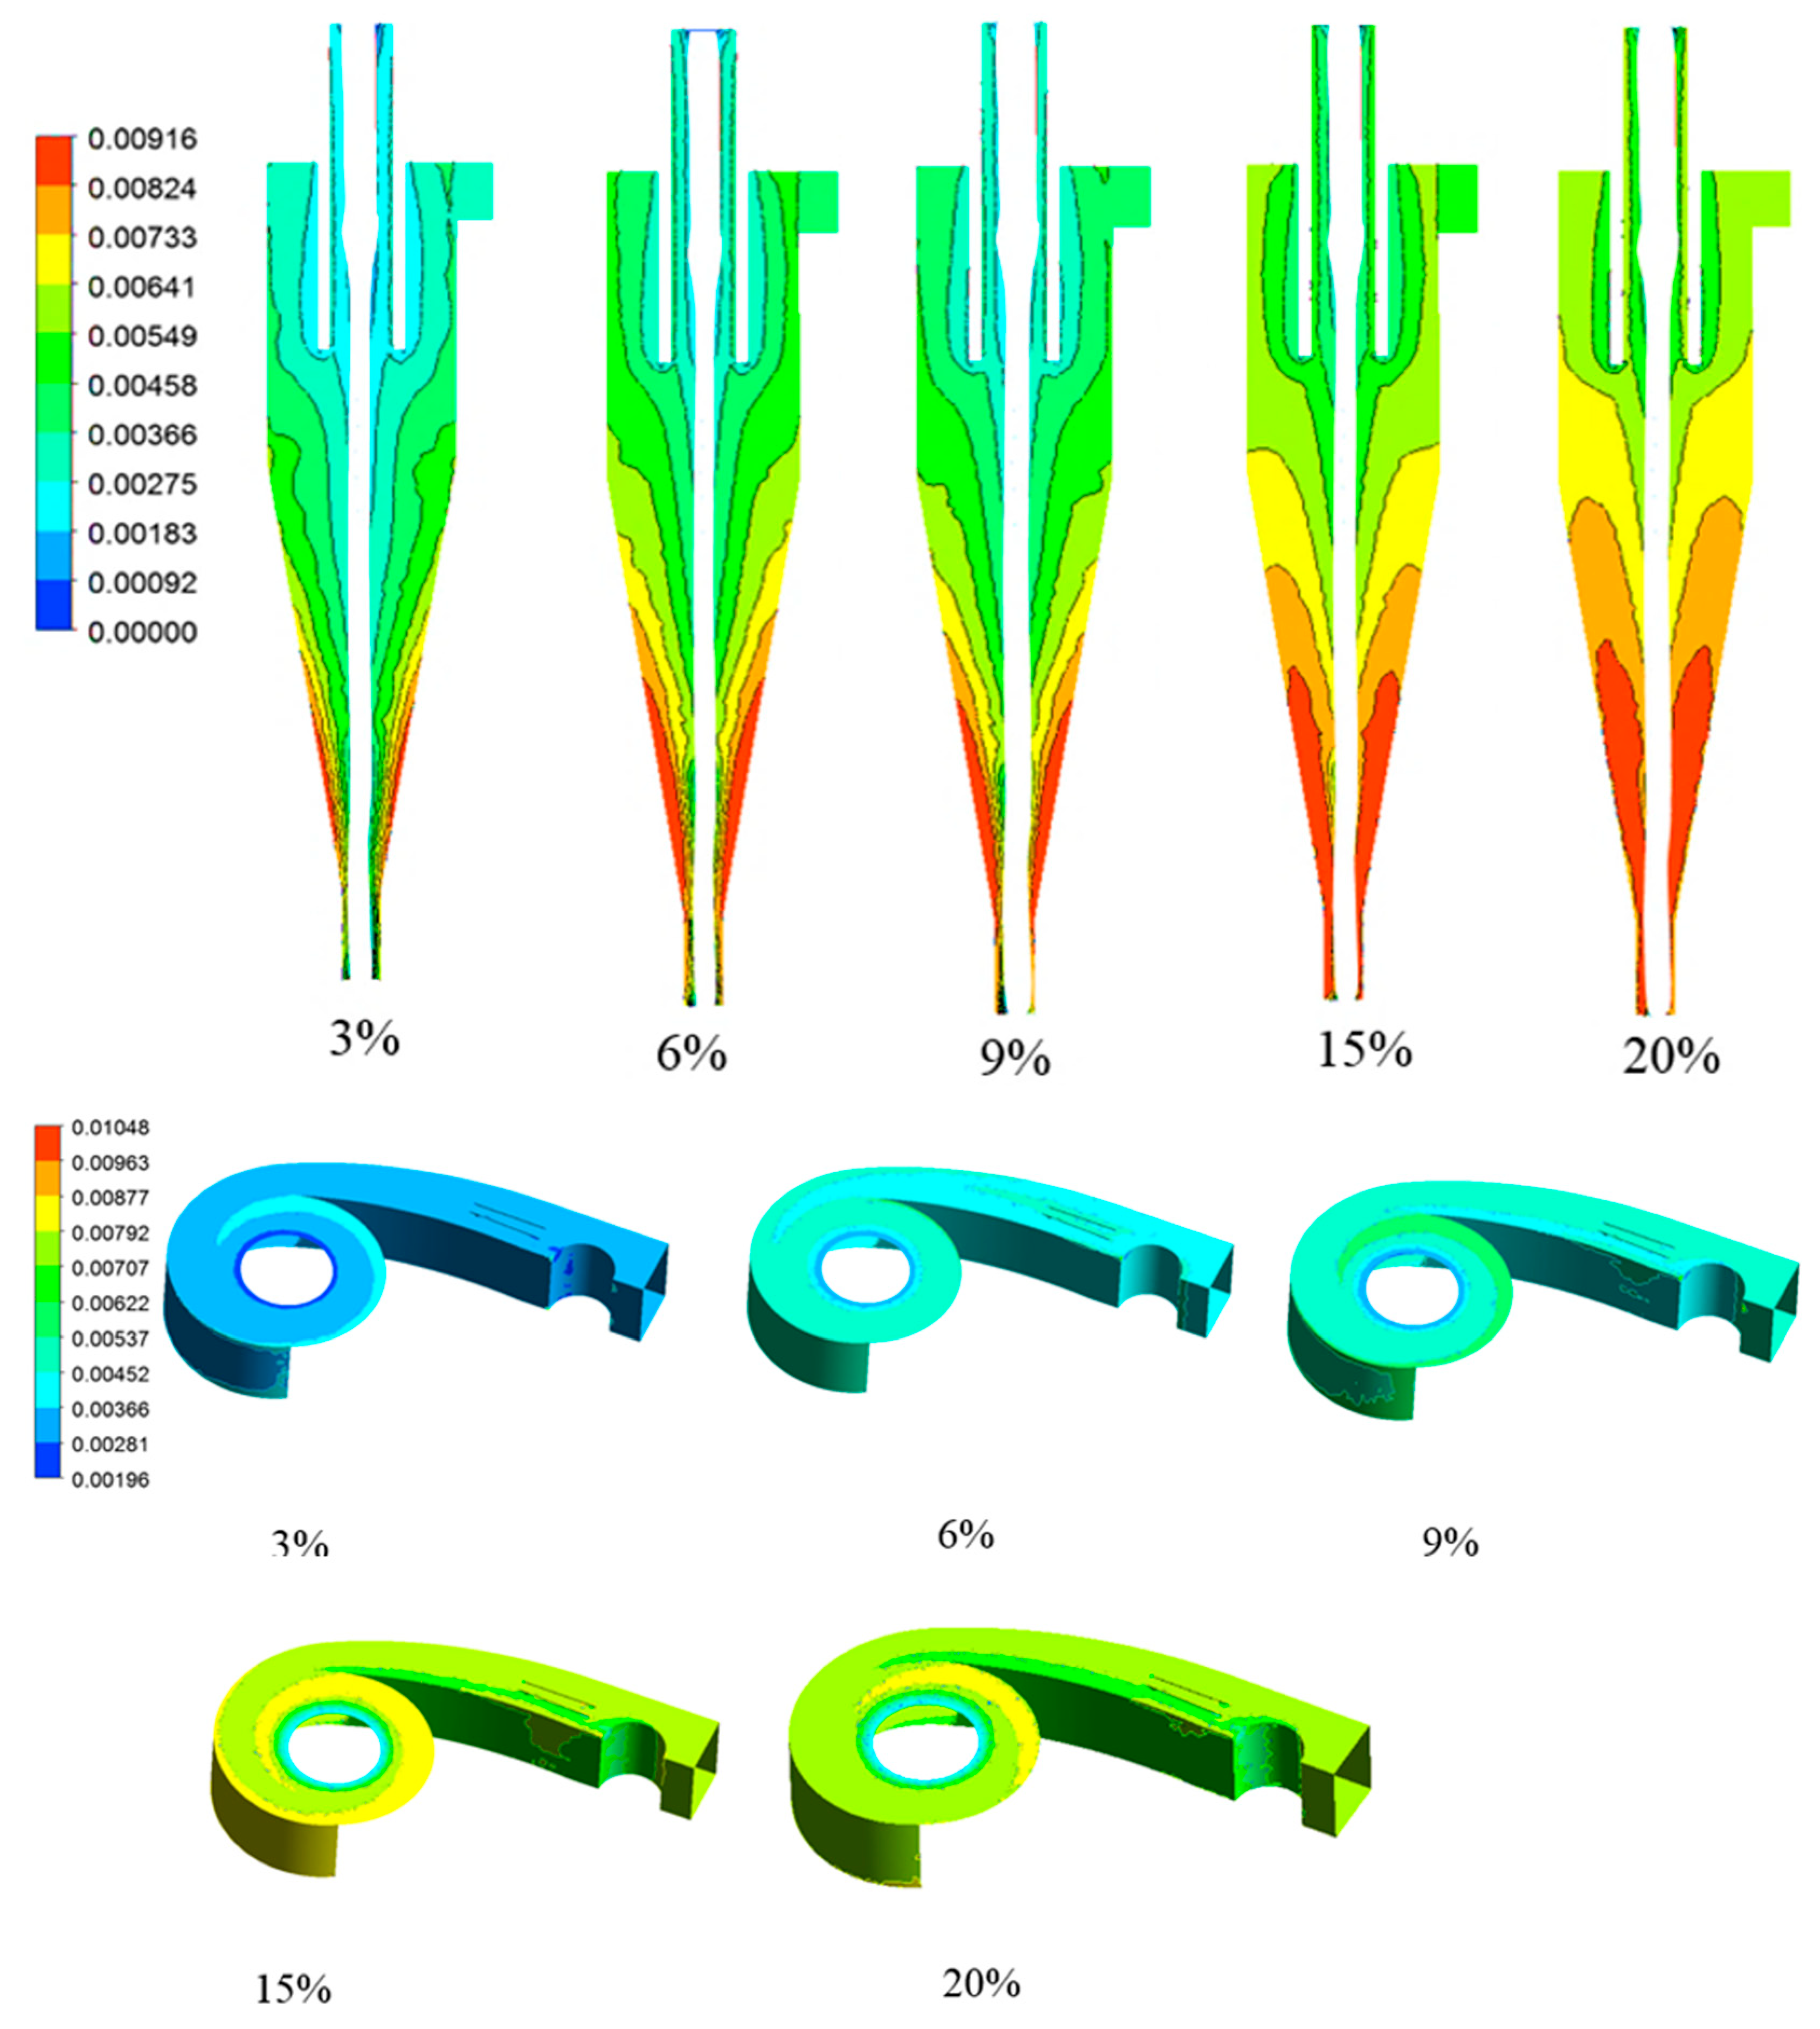
Figure 11 illustrates the distribution patterns of sub-coarse particles (15 µm) at varying particle concentrations. Particle concentration significantly influences the distribution of sub-coarse particles. When the concentration is below 9%, nearly all sub-coarse particles accumulate along the hydrocyclone wall. However, when the inlet concentration exceeds 9%, inter-particle interactions cause a portion of sub-coarse particles to migrate toward the center, resulting in the entrainment of coarse particles in the overflow, which adversely affects the purity of fine particles. When the concentration is below a certain critical value, classification forces dominate the separation process. Conversely, when the concentration exceeds this critical value, inter-particle forces become the primary influencing factor.
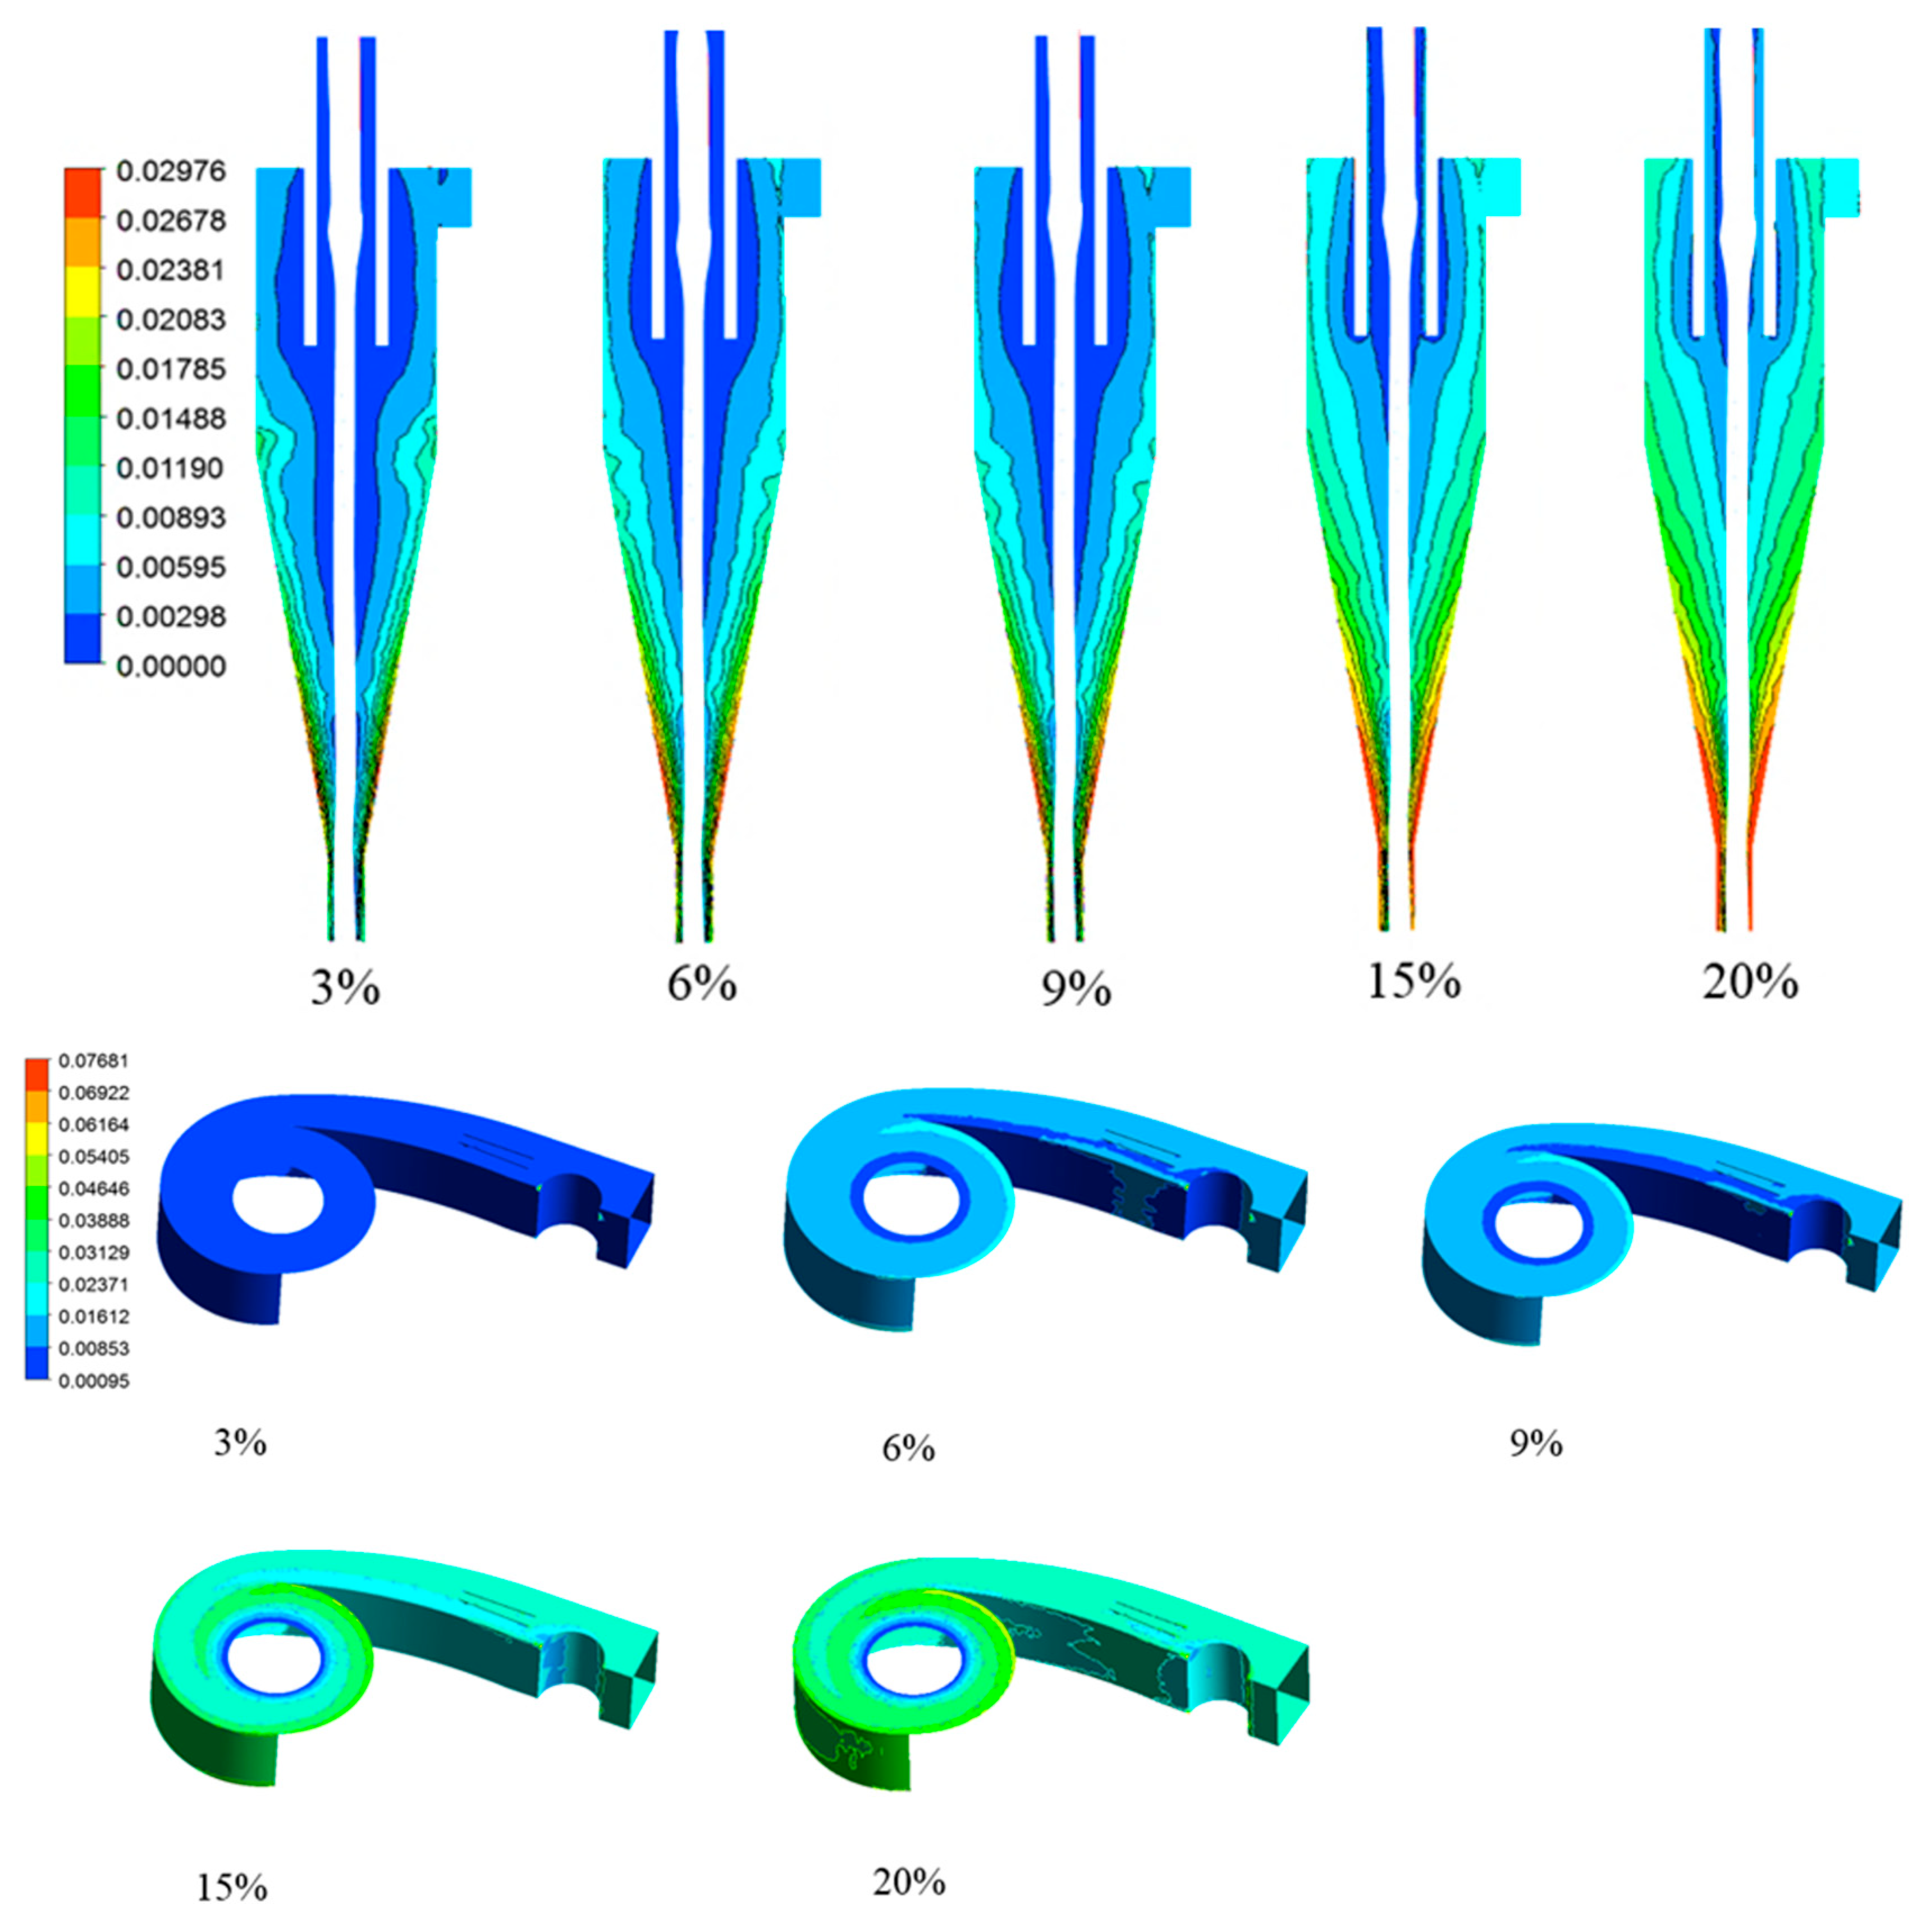
Figure 12 and Figure 13 illustrate the distribution patterns of coarse particles (30 µm and 60 µm) at varying particle concentrations. It is evident that as the concentration increases, the distribution of coarse particles remains largely unchanged, with nearly all particles accumulating along the hydrocyclone wall. This phenomenon primarily arises from the significantly greater centrifugal force acting on coarse particles in comparison to inter-particle interactions. Consequently, particle concentration exerts a negligible effect on the distribution characteristics of coarse particles.
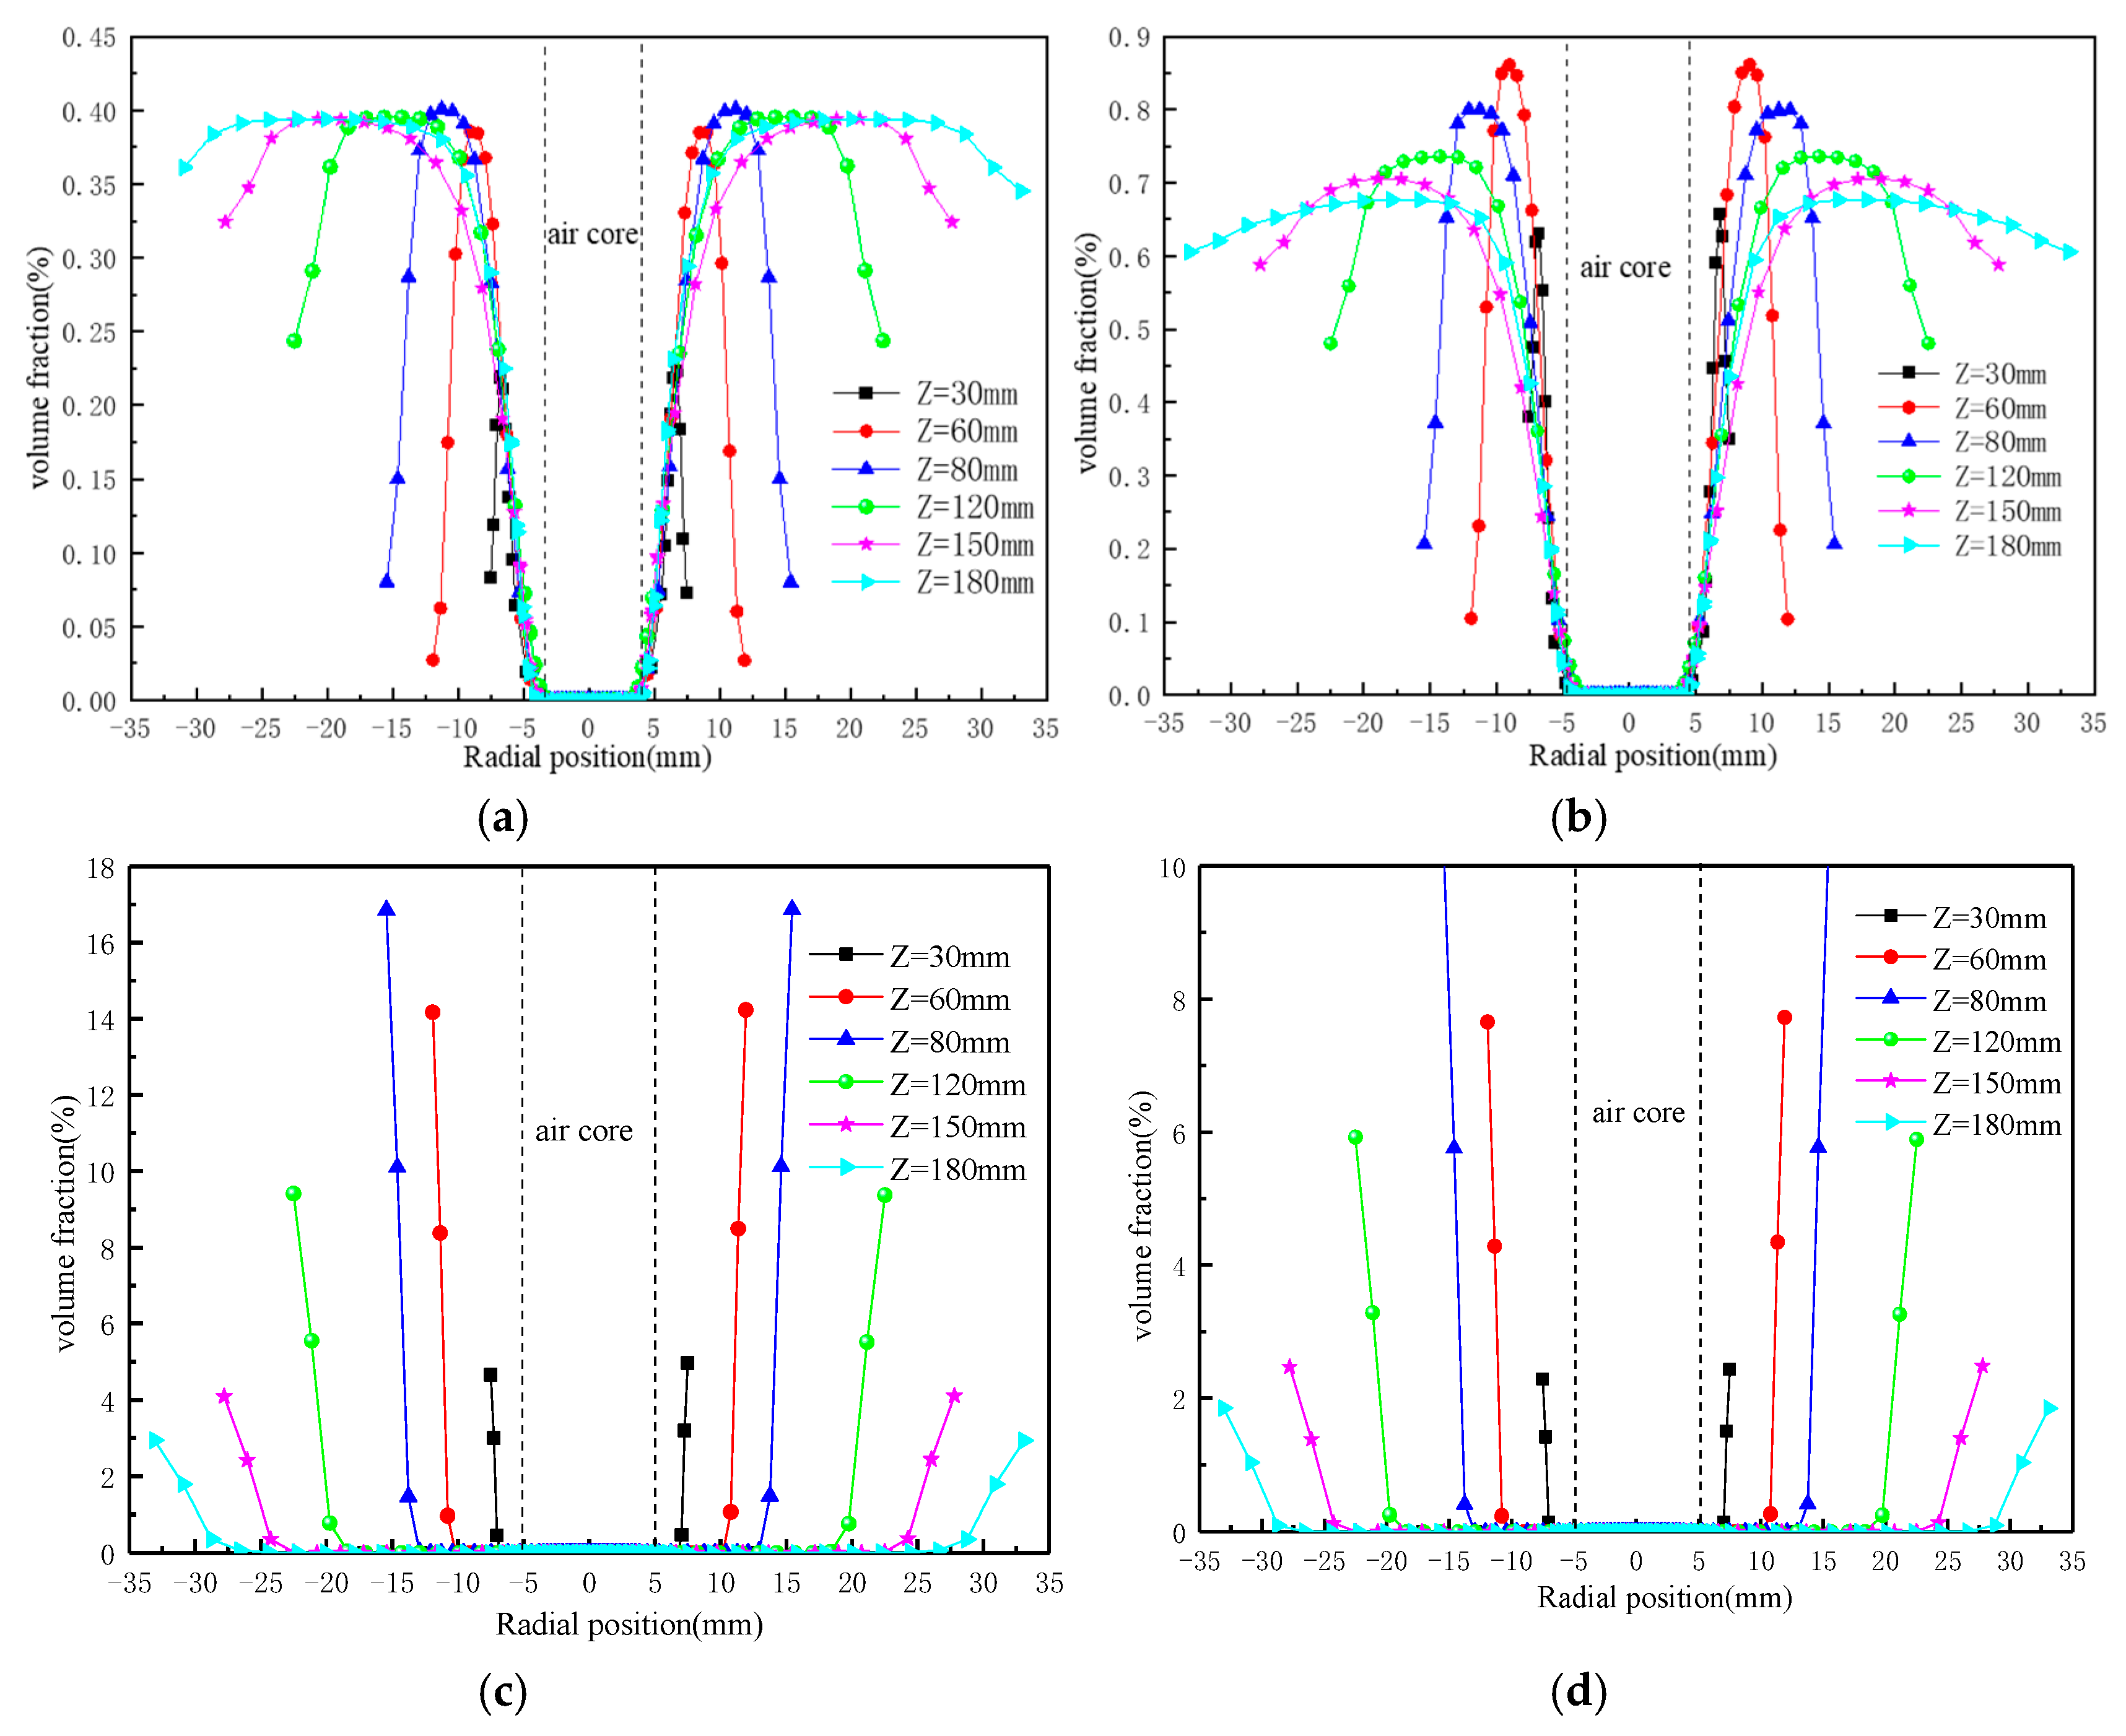
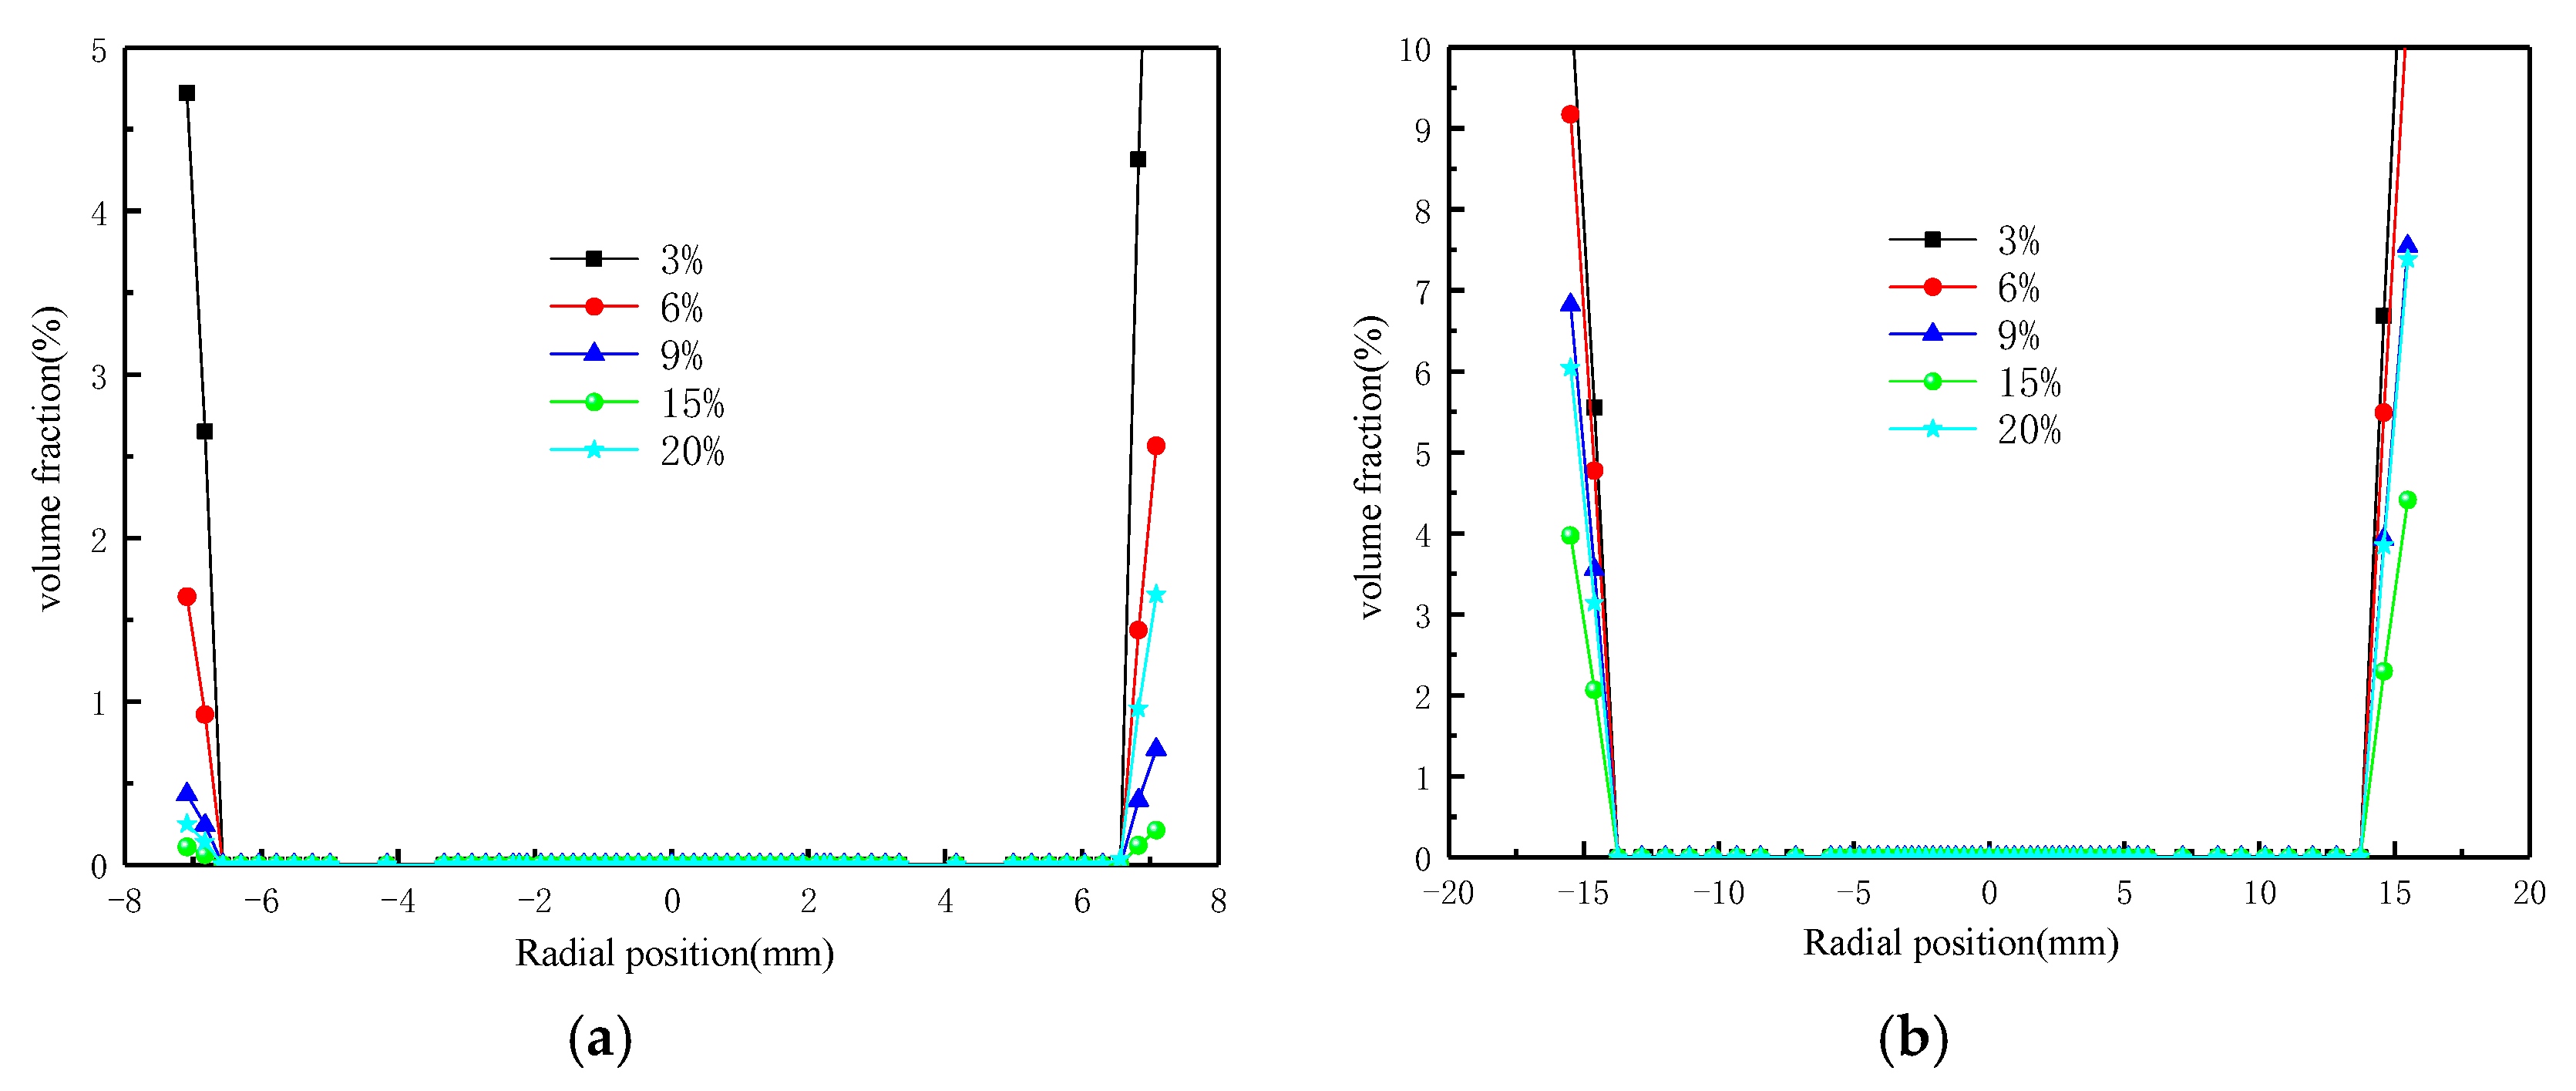
To microscopically delineate the radial variation of particles under varying concentration conditions, the particle distribution along the diametral line at different axial locations was examined. Figure 14 illustrates the concentration-dependent variation of 0.5 µm particles. Close to the apex (Z = 30 mm), the volume fraction of ultrafine particles first rises and subsequently declines as the concentration increases. At a concentration of 20%, the volume fraction of ultrafine particles attains its minimum value, which suggests that a specific particle concentration level promotes the migration of fine particles toward the central region, thus yielding a finer and purer product. With the elevation of axial position, the volume fraction of ultrafine particles increases as the concentration rises. The volume fraction is minimized at the hydrocyclone wall, increases gradually toward the center along the radial direction, and then drops sharply to zero at a specific location adjacent to the center. In the radial interval of −5 mm to 5 mm, the volume fraction of fine particles remains at zero, since the air core is not involved in the particle classification process.
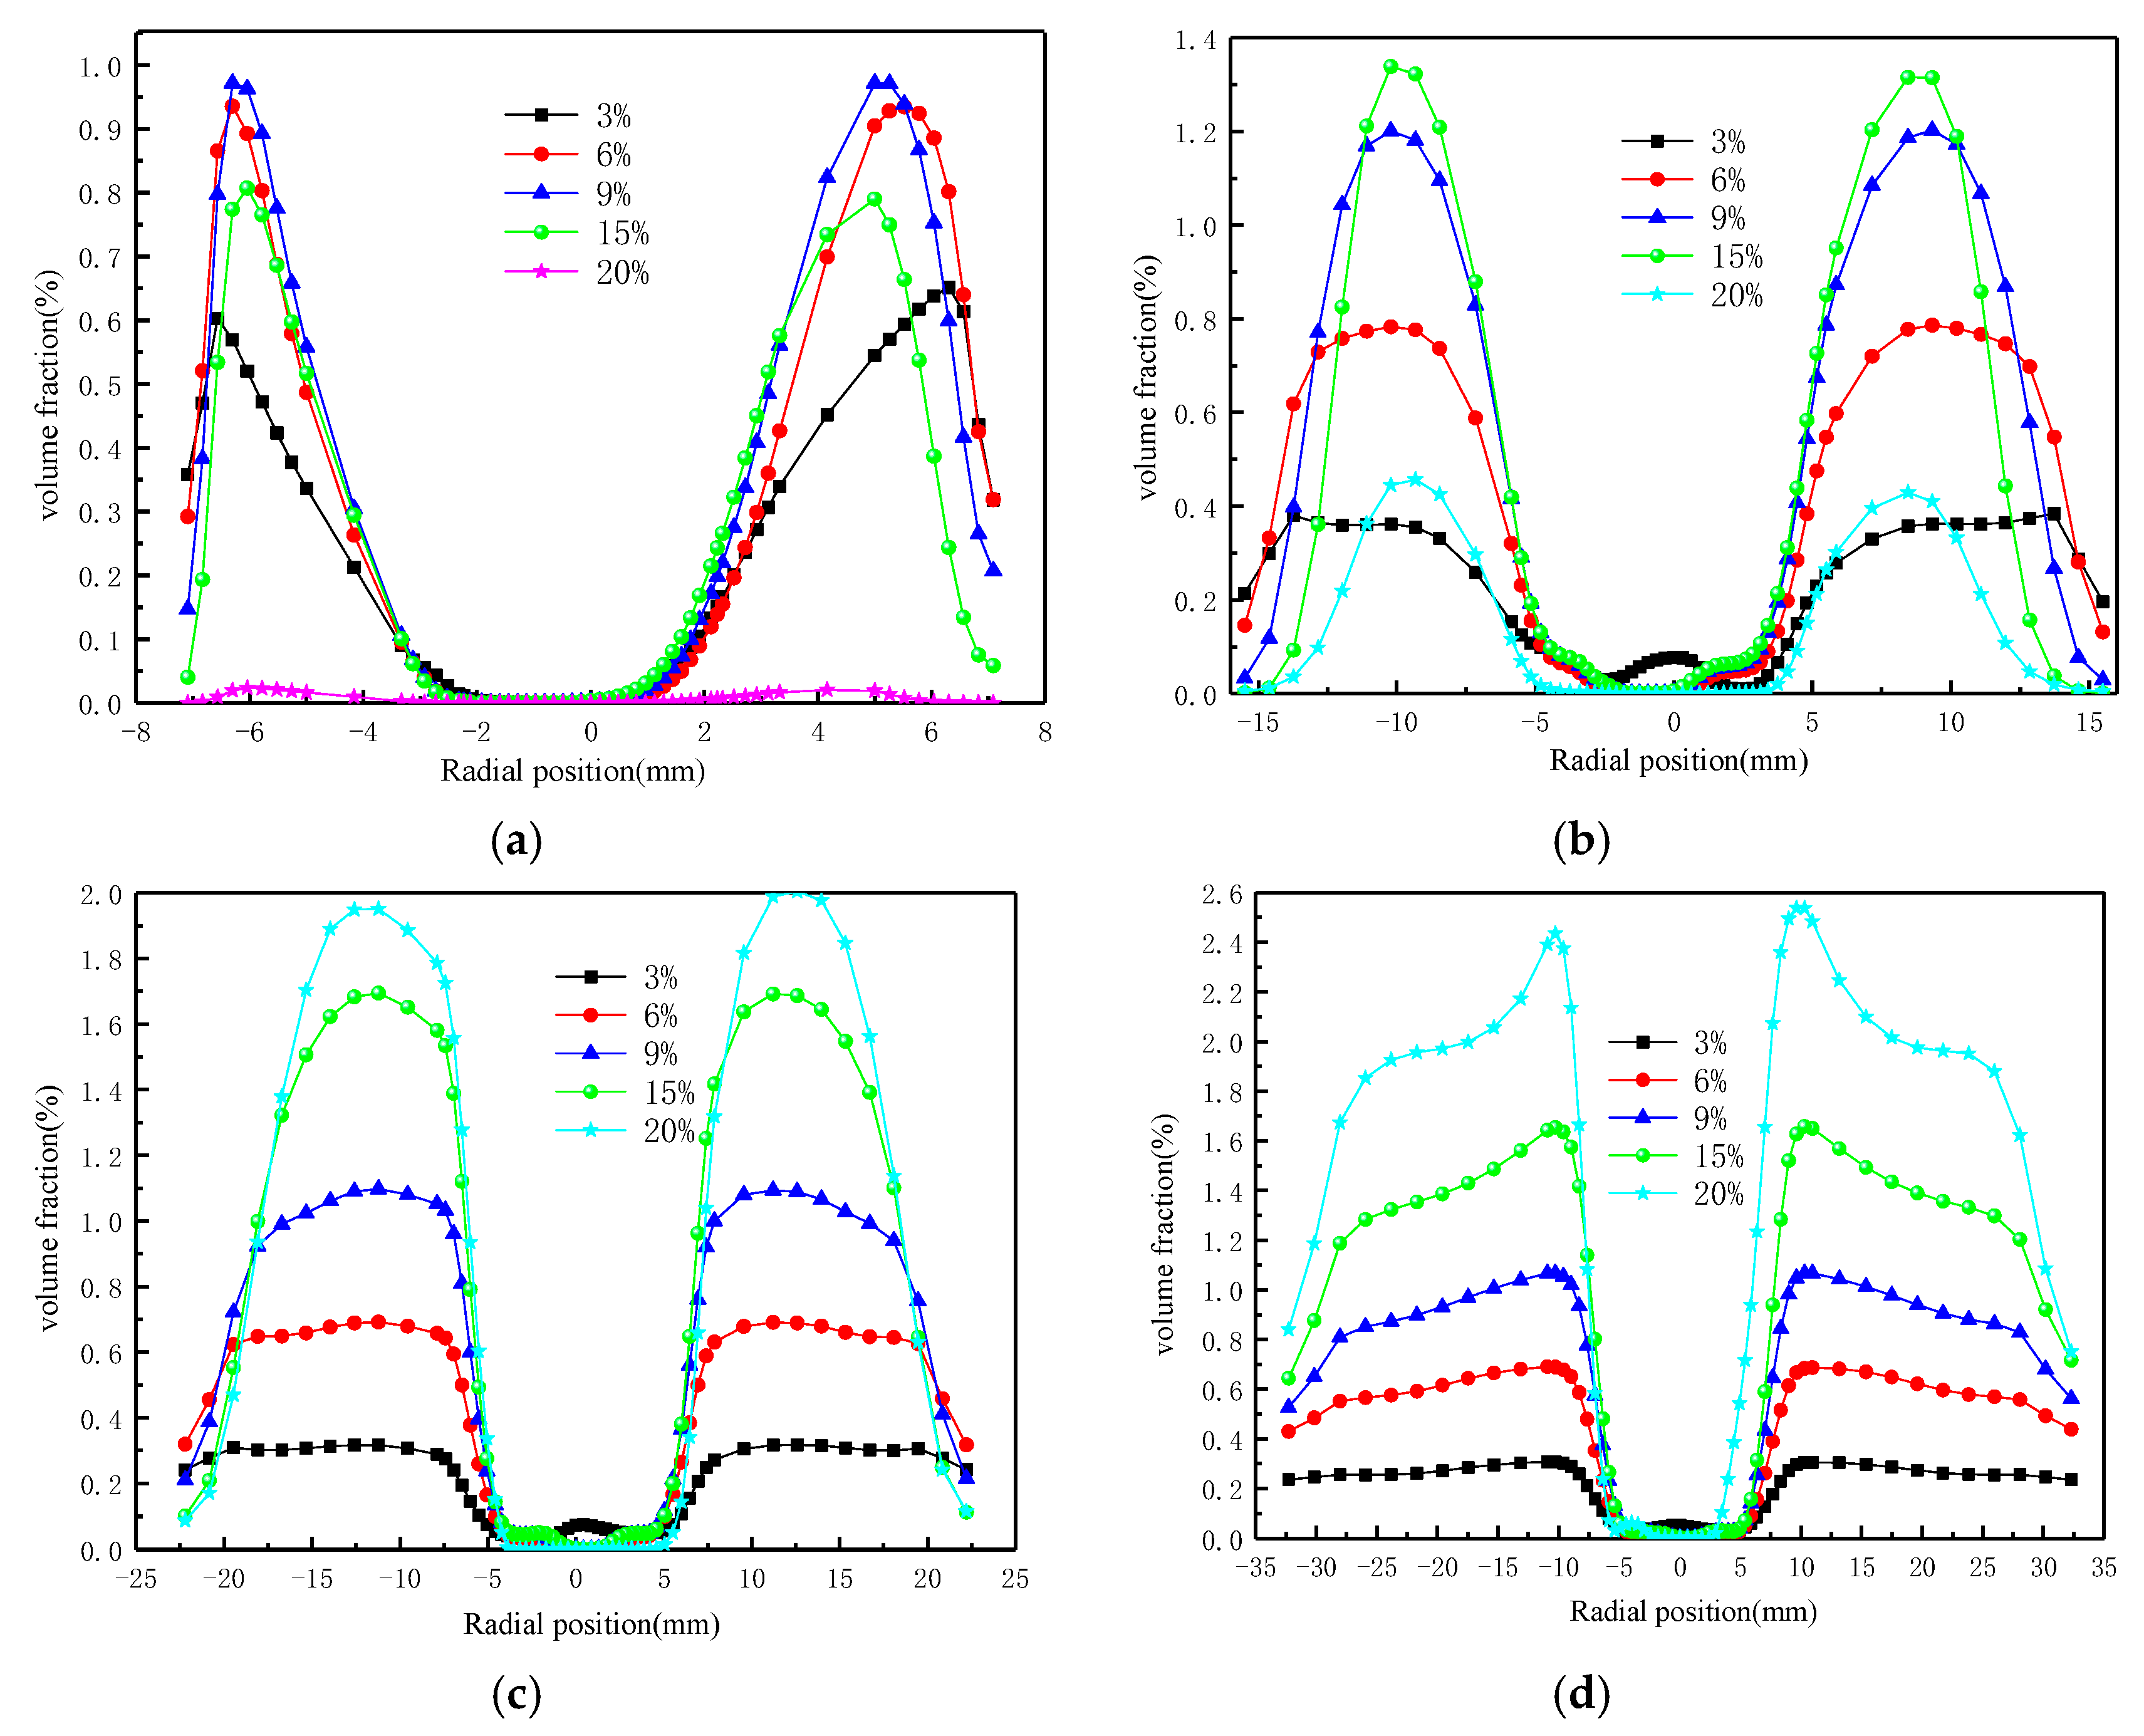
The distribution of 4 µm fine particles is presented in Figure 15, where their aggregation characteristics are markedly more pronounced than those of 0.5 µm ultrafine particles. In the axial range of Z = 120 mm–180 mm, the volume fraction rises as the particle concentration increases, with the peak volume fraction localized at the central region. This observation reveals that fine particles are primarily enriched in the inner vortex, which suggests that a specific range of particle concentration promotes the migration of fine particles toward the center. Conversely, in the axial interval of Z = 30 mm–80 mm, the volume fraction first rises and then declines with increasing particle concentration, while the position of the peak volume fraction undergoes a shift. This finding suggests that inter-particle interactions significantly influence the distribution of fine particles.
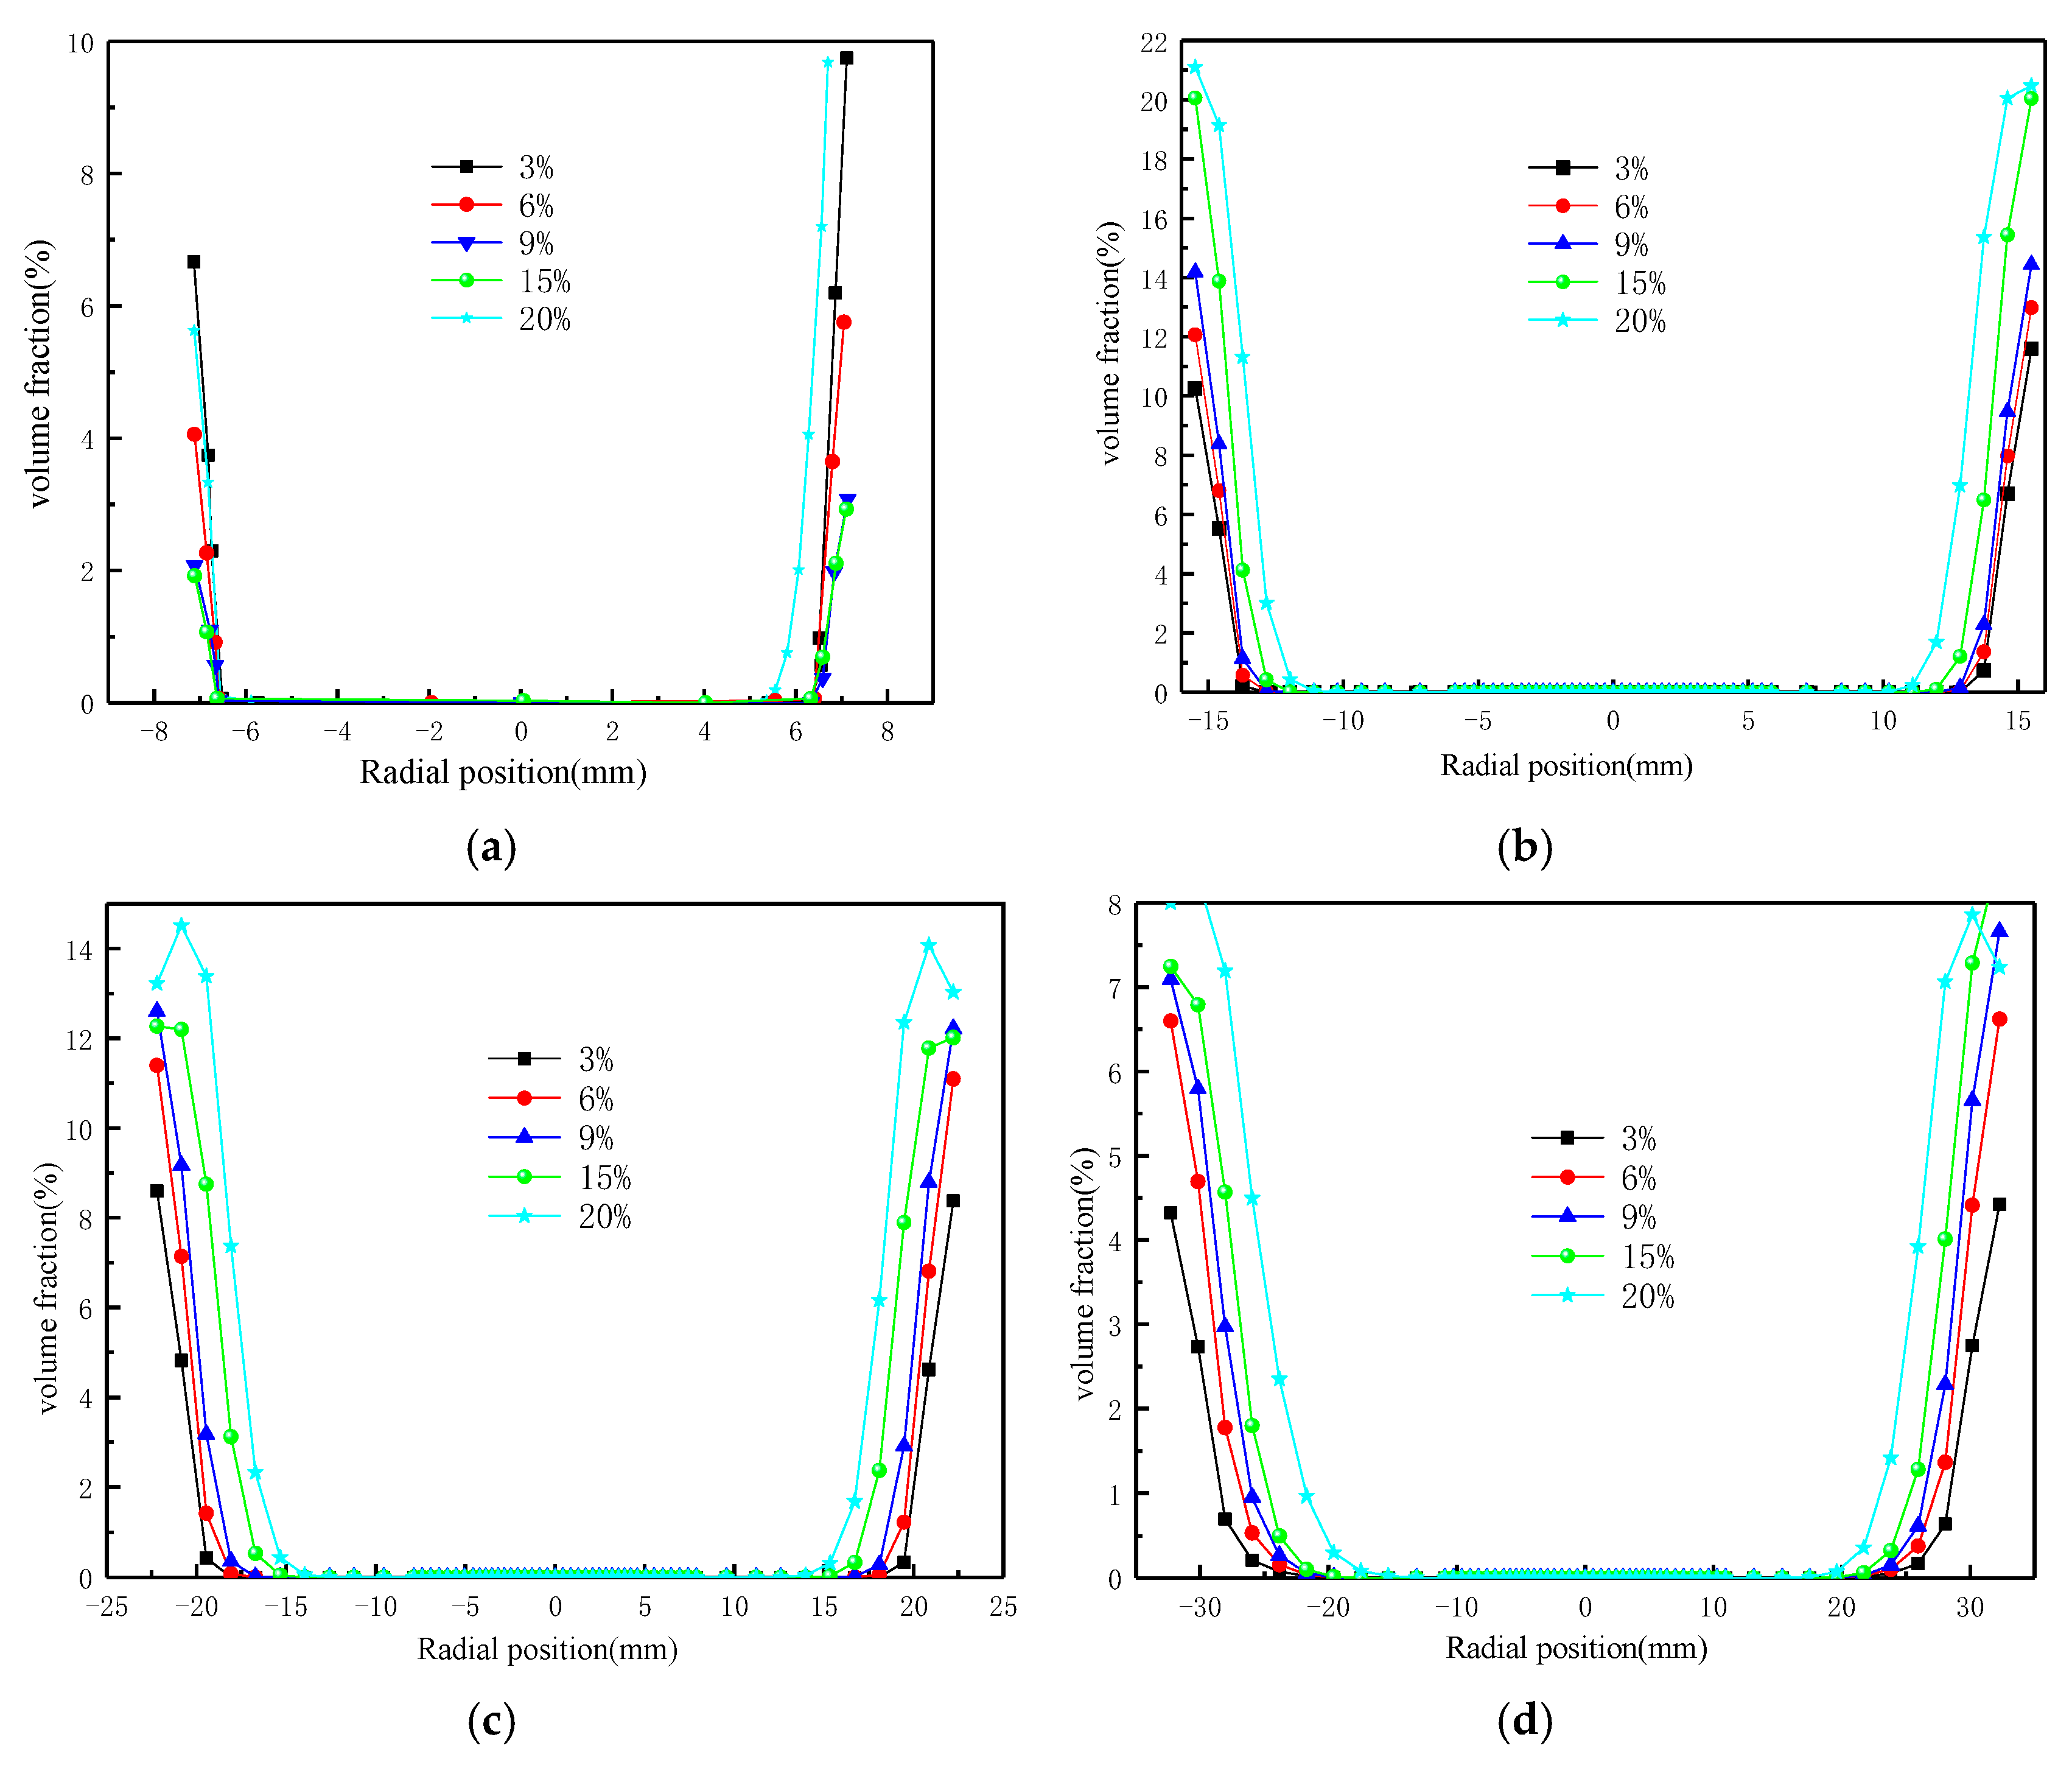
Figure 16 and Figure 17 illustrate the radial distribution characteristics of sub-coarse and coarse particles. Near the apex, the volume fraction decreases as particle concentration increases, while it increases with concentration further from the apex. The volume fraction exhibits a progressive reduction from the hydrocyclone wall to the central region, reaching its peak value at the wall and declining to zero in the central area. This distribution characteristic aligns well with the particle volume fraction contour plots. Coarse particles are subjected to stronger classification forces, with centrifugal forces acting as the dominant driver, leading to the aggregation of the majority of coarse particles adjacent to the wall. A suitable particle concentration promotes the migration of coarse particles toward the wall.

3.3. The Effect of Concentration on Separation Efficiency

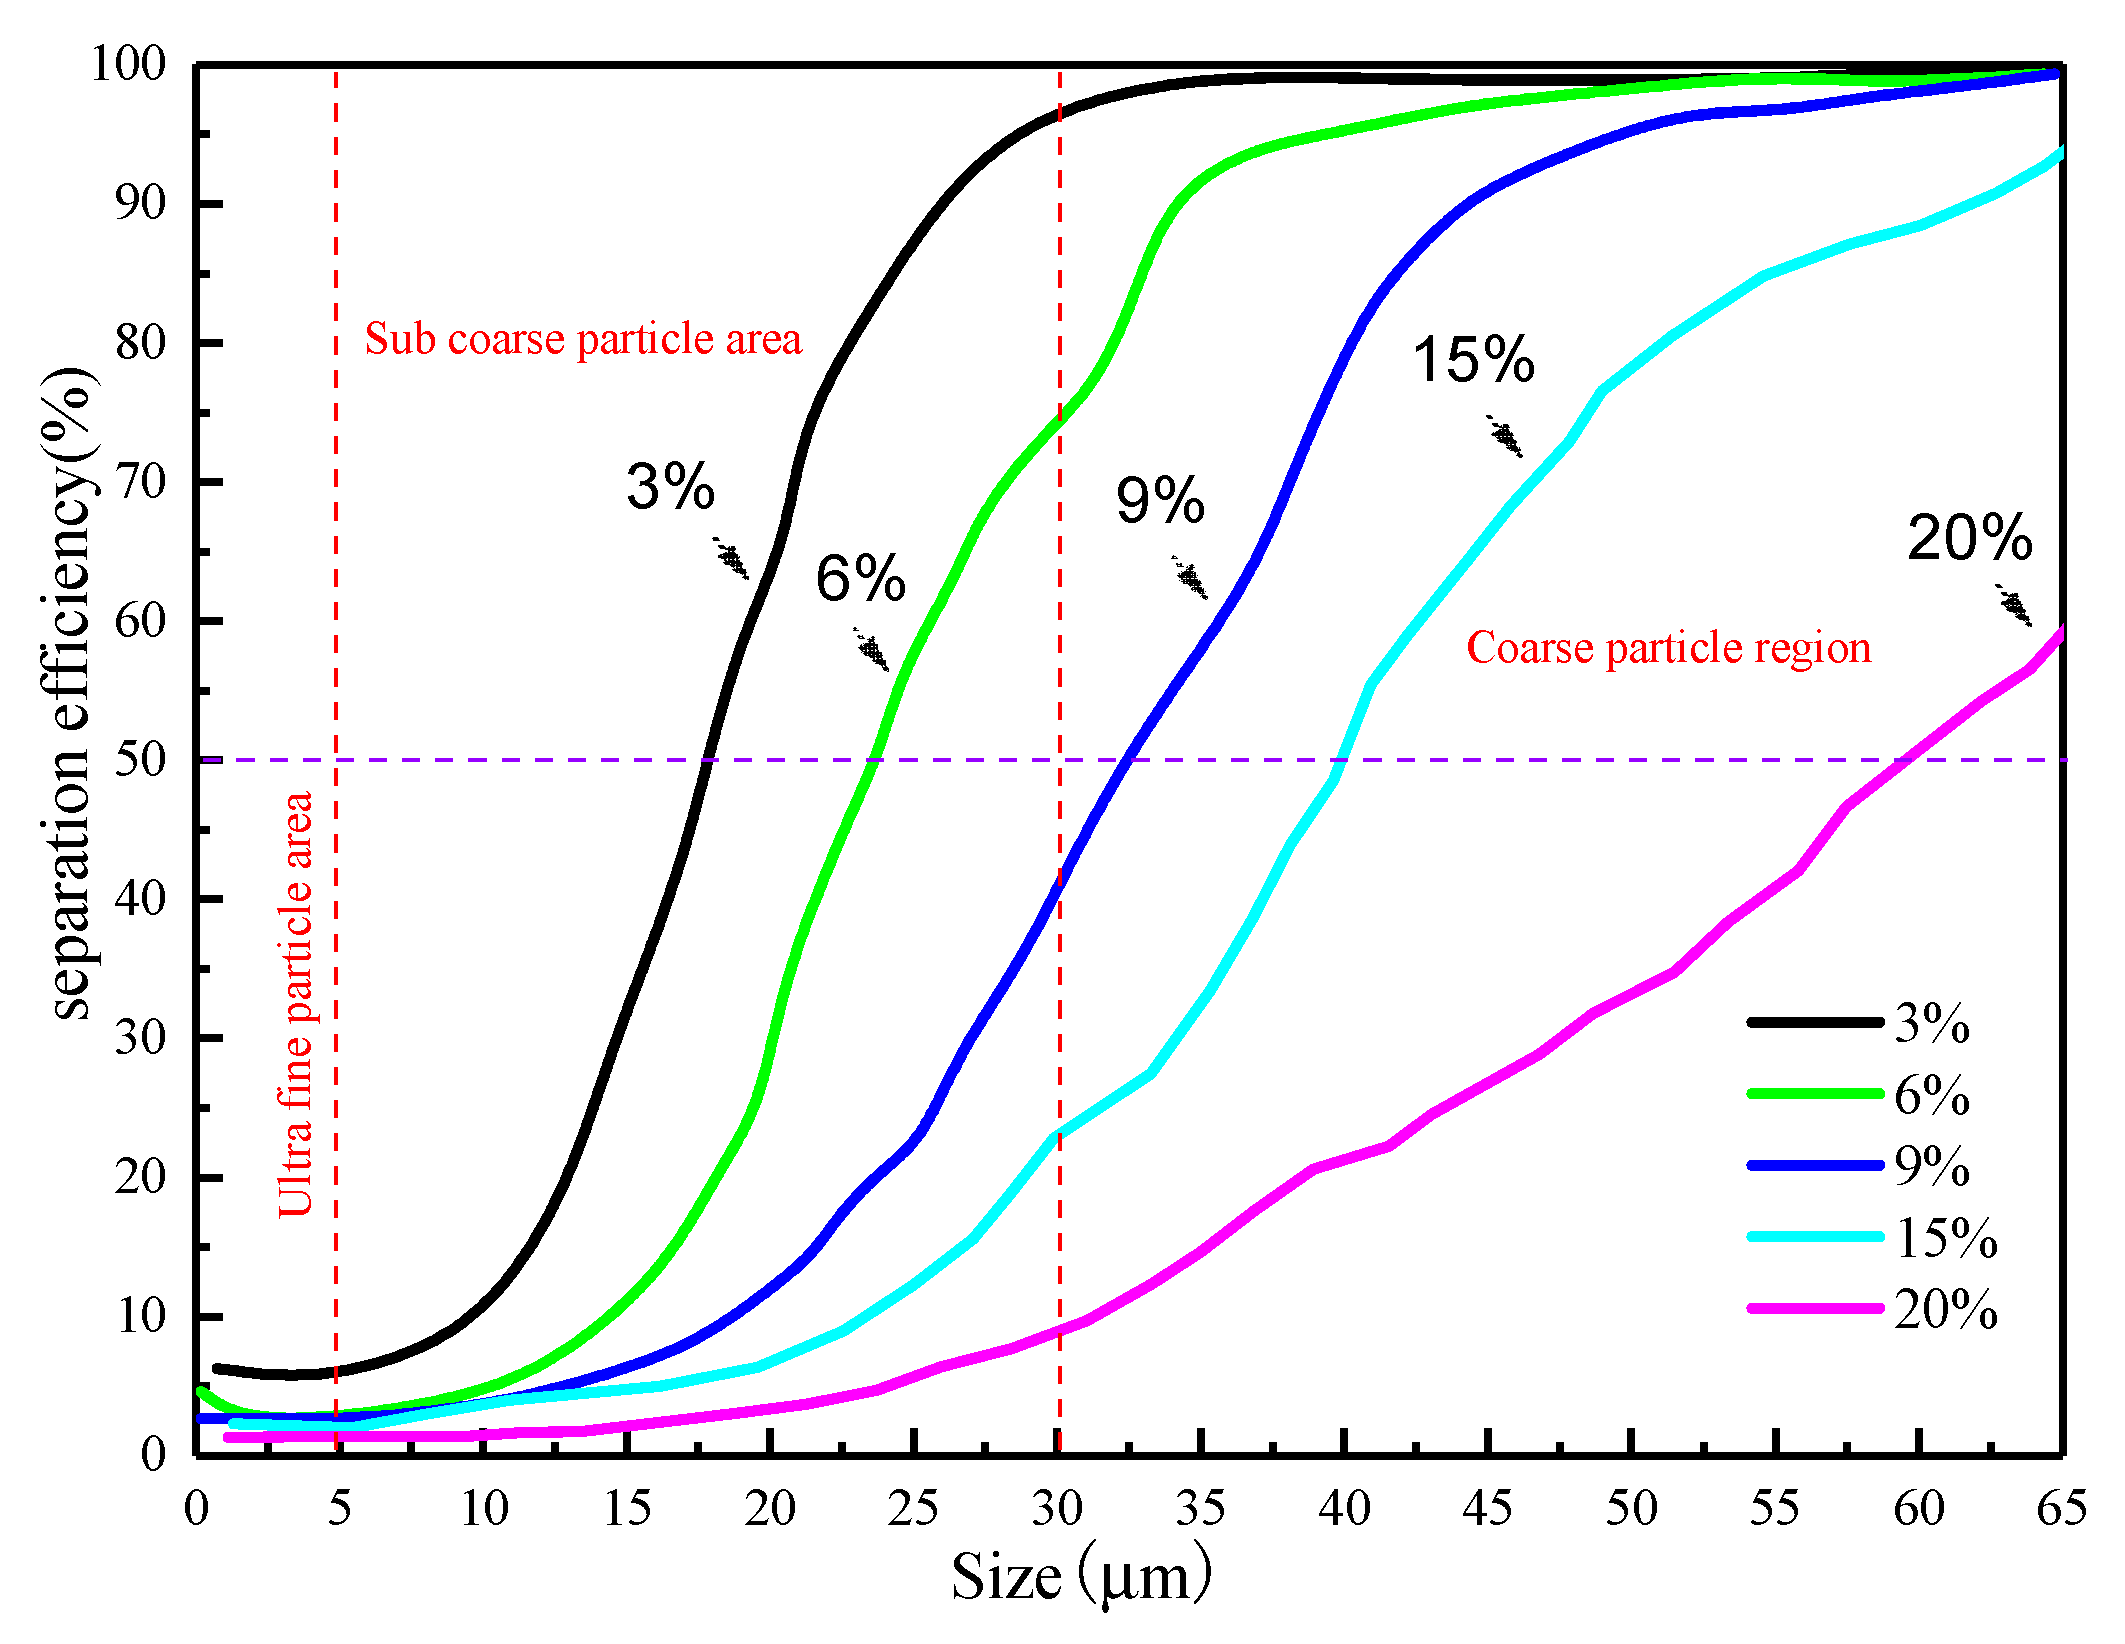
Figure 18 presents the influence of particle concentration on the efficiency curve of the hydrocyclone equipped with a complex curved inlet. The efficiency curve is divided into three distinct regions: ultrafine particles (≤5 µm), sub-coarse particles (5–30 µm), and coarse particles (>30 µm). With the increase in particle concentration, the recovery rate of fine particles at the apex gradually decreases. The efficiency curve shifts progressively to the right as particle concentration rises, indicating a reduction in the hydrocyclone’s cut size. When the concentration exceeds 20%, the maximum recovery rate of particles smaller than 50 µm at the apex is approximately 60%, suggesting that the overflow of fine particles becomes pronounced and the classification accuracy of the hydrocyclone is significantly reduced. The primary reason for this phenomenon is that elevated particle concentration amplifies the interaction forces among particles, while the mutual squeezing and friction during particle motion increase the viscosity of the slurry. This results in the accumulation of coarse particles at the apex, preventing their timely discharge and leading to blockage. Consequently, a greater number of coarse particles must alter their trajectory and exit through the overflow, exacerbating the overflow run-of-the-fines issue and impairing the classification performance of the hydrocyclone. The variation in the steepness index with inlet concentration is depicted in Figure 19. As inlet concentration rises, the steepness index gradually decreases, resulting in a decline in the grading accuracy of the hydrocyclone.
Based on the above analysis, a proper inlet concentration can not only effectively improve the cutting ability of the hydrocyclone but also enhance the classification accuracy, leading to the production of high-quality products. Therefore, it is essential to choose the appropriate particle concentration based on the actual working conditions to ensure efficient operation during the classification process.
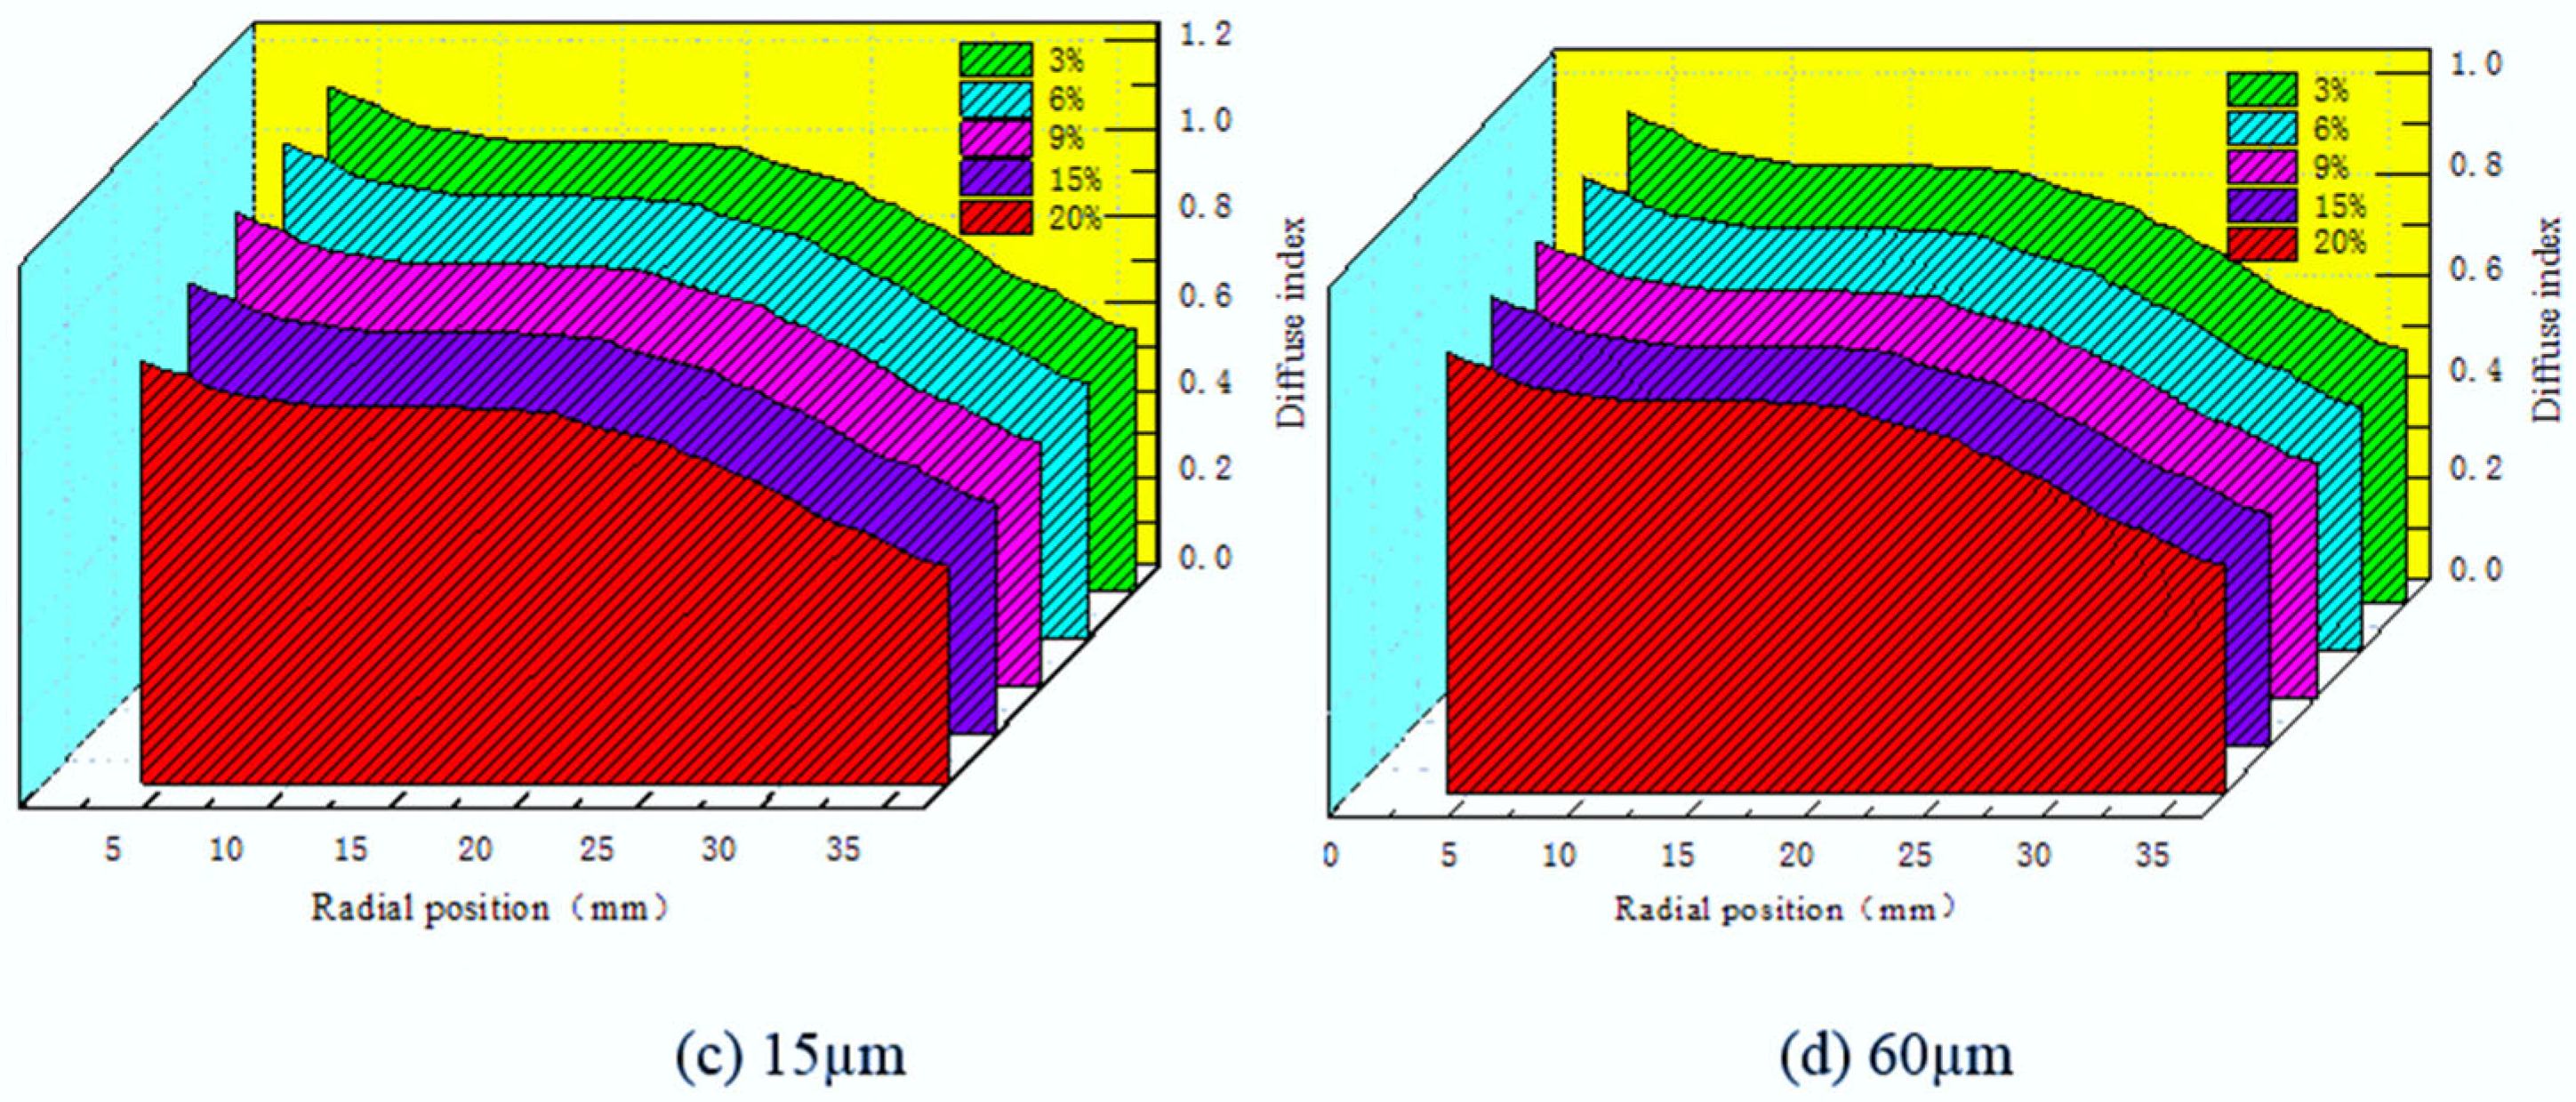
To further investigate the influence of particle concentration on the classification force and turbulent diffusion force, the dispersion index—defined as the ratio of the turbulent diffusion force to the classification force—was analyzed. A value below 1 indicates that the classification force outweighs the turbulent diffusion force, implying that the particles are readily classifiable and possess robust settling characteristics. Conversely, when the turbulent diffusion force exceeds the classification force, the particles are difficult to classify and exhibit weak settling behavior. Thus, the dispersion index of particles with different diameters within the hydrocyclone can be employed to quantify the intensity of their settling performance. The influence of inlet concentration on the dispersion index is presented in Figure 20. It can be seen that with the increase in inlet concentration, the dispersion index decreases gradually, signifying that the classification force becomes more prominent. The dispersion index of ultrafine particles (0.5 µm) ranges between 0.6 and 1.6, and it decreases progressively from the center to the wall. The closer the particles are to the hydrocyclone center, the stronger the turbulent diffusion force; conversely, the closer they are to the wall, the stronger the classification force. This phenomenon explains the difficulties in classifying ultrafine particles within the hydrocyclone.

4. Experimental Test

To validate the accuracy of numerical simulation results and investigate how vortex finder wall thickness affects hydrocyclone separation performance, a laboratory experimental rig was constructed and tested. As shown in Figure 21, the rig included a supply system (slurry pump and feed tank), a measurement system (flowmeter and pressure gauge), a control system (valve), a classification system (hydrocyclone), and a recirculation system (return piping). Initially, quartz sand and water were mixed at a predefined mass ratio in the feed tank with continuous stirring to ensure uniform feed solid concentration. The slurry was then pumped to the hydrocyclone inlet at a constant flow rate via the slurry pump, with flow rate and pressure monitored continuously by the flowmeter and pressure gauge, respectively. Upon blockage, the valve was activated to relieve pressure and protect equipment. Overflow and underflow (spigot) streams were directly returned to the feed tank to maintain cyclic operation. High-purity fine-grained quartz sand (density 2650 kg/m3) served as the test material, with its particle size distribution given in Table 1.
Figure 22 shows the effect of feed solids concentration on cumulative particle distribution in both overflow outlet and spigot streams. With increasing feed solids concentration, particle size distributions in both streams coarsened, and the overflow outlet size curve exhibited irregular shifts due to altered turbulent diffusion and classification forces within the flow field. At low concentration (8%), the overflow outlet curve remained smooth, whereas concentrations above 12% induced pronounced fluctuations, indicating significant particle–particle interference. In contrast, the spigot size curve shifted downward in a regular manner as concentration increased, reducing both fine and coarse particle contents in the underflow; however, coarser particles were entrained into the overflow outlet, causing product coarsening.
Figure 23 shows the effect of feed solids concentration on the partition curve. As feed solids concentration increased, the partition curve shifted to the right and d50 increased, indicating a gradual reduction in cut size and weakening of separation efficiency. The underflow recovery of −10 μm particles decreased from 9.52% to 3.16%, while the recovery of −80 μm particles decreased from 96.18% to 85.13%, demonstrating an increased coarse particle content in the overflow outlet and a decline in hydrocyclone classification performance. The slope at d50 also decreased, indicating a reduction in separation sharpness.
The separation performance for –20 μm particles was further quantified via grade efficiency and recovery rate, as summarized in Table 2. With increasing feed solids concentration, the separation cut size shifted from 56.3 μm to 66.5 μm; overflow recovery decreased by 14.68% (from 60.23% to 51.39%); underflow recovery decreased by 43.13% (from 9.18% to 5.22%); grade efficiency decreased by 35.24% (from 65.83% to 43.28%); and recovery rate increased by 9.17% (from 83.61% to 91.28%). These results demonstrate that over-concentration severely degrades grade efficiency and product quality. A balance between underflow yield and cut size suggests that an optimal feed concentration must be maintained to achieve accurate classification.
To validate the superiority of the complex curve inlet structure, its performance was compared with conventional inlet mechanisms (linear type) using test data. Evaluation metrics included −20 μm underflow recovery rate, pressure drop, quality efficiency, and quantity efficiency. Test results are presented in Table 3.
Table 3 demonstrates that, in comparison with the conventional inlet body, the composite curve inlet body decreases the underflow recovery rate of 20 µm particles by 6.69 percentage points. The fine particle content in the underflow is notably diminished, thereby enhancing the purity of coarse particles in the underflow. Relative to conventional hydrocyclones, the pressure drop is lowered by 1.19 kPa. Under equivalent operating conditions, the hydrocyclone equipped with the composite curve inlet body cuts down on energy consumption and contributes to operating cost savings. Compared with the conventional inlet body, the quality efficiency and quantity efficiency of the composite curve inlet body hydrocyclone are increased by 4.91 and 1.26 percentage points, respectively. This finding indicates that the composite curve inlet body structure not only boosts classification efficiency but also achieves higher classification accuracy.

5. Conclusions

With the increase in particle size, the centrifugal force gradually increased, and the difference in centrifugal force among particles of different sizes promoted the formation of particle stratification within the inlet structure. In contrast, the elevation of particle concentration significantly weakened the centrifugal force, which stemmed from the increase in viscous forces and shear stresses between particles. This finding provided a core basis for the force field regulation of the composite curved inlet structure and facilitated the optimization of industrial classification process parameters.
A specific range of particle concentrations could promote the migration of fine particles toward the center, reduce their probability of entering the outer vortex, and thereby favor the precise classification of fine particles. However, the increase in concentration gradually weakened the classification sharpness of the hydrocyclone. When the concentration exceeded 20%, the maximum underflow recovery rate of −50 µm particles was only 60%, accompanied by severe overflow of coarse particles. This quantitative law provided a clear standard for the control of industrial feed concentration, which was limited to the quartz sand system under conventional operating conditions.
As particle size increased, the dispersion index gradually decreased while the classification force significantly increased, which was conducive to the formation of a coarse particle layer on the wall. This mechanism revealed the intrinsic correlation between particle classification performance and dispersion characteristics, offering critical theoretical support for the structural design of high-efficiency hydrocyclones.
Combined with numerical simulation and cyclic experimental verification, laboratory tests confirmed that the increase in feed concentration led to an increase in cut size and a decrease in classification efficiency, along with improvements in recovery rate and underflow yield. This result provided direct data support for the commissioning and performance optimization of industrial hydrocyclones, and further research on the optimization of inlet geometric parameters could be carried out in subsequent studies.

Author Contributions

Data curation, H.Y., F.L., H.Y., Y.F., L.W. and Y.G.; Investigation, S.W.; Methodology, S.W., L.W., Y.G. and Z.L.; Project administration, Y.F., H.Y., L.W. and Y.G.; Validation, S.W., F.L. and H.Y.; Writing—original draft, H.Y., F.M., S.W., F.L., Z.L., L.W. and Y.G.; Writing–review & editing, H.Y., F.M., S.W., F.L. and Z.L. All authors have read and agreed to the published version of the manuscript.

Funding

This work was financially supported by Shandong Provincial Natural Science Foundation (ZR2024QE381); Shandong Province Key Research and Development Plan (Competitive Innovation Platform) Project (2025CXPT150) and Advanced Perception and Intelligent Equipment Engineering Research Center of Jiangsu Province (2025QXPT136).

Institutional Review Board Statement

Not applicable.

Informed Consent Statement

Not applicable.

Data Availability Statement

The original contributions presented in this study are included in the article. Further inquiries can be directed to the corresponding authors.

Acknowledgments

We are grateful to Chenglei Zhang for funding Support.

Conflicts of Interest

Author Huanbin Yang was employed by the company Henan Longyu Coal Chemical Co., Ltd., Fanping Meng was employed by the company Henan Nengcai Intelligent Technology Co., Ltd. The remaining authors declare that the research was conducted in the absence of any commercial or financial relationships that could be construed as a potential conflict of interest.

References

  1. Amani, A.; Shamloo, A.; Vatani, P.; Ebrahimi, S. Particles Focusing and Separation by a Novel Inertial Microfluidic Device: Divergent Serpentine Microchannel. Ind. Eng. Chem. Res. 2022, 61, 14324–14333. [Google Scholar] [CrossRef]
  2. Bridgwater, L.B.; Ihrke, C.A.; Diftler, M.A.; Abdallah, M.E.; Radford, N.A.; Rogers, J.M.; Yayathi, S.; Askew, R.S.; Linn, D.M. The robonaut 2 hand—Designed to do work with tools. In Proceedings of the IEEE International Conference on Robotics and Automation, St. Paul, MN, USA, 14–18 May 2012; pp. 3425–3430. [Google Scholar]
  3. Chu, L.-Y.; Yu, W.; Wang, G.-J.; Zhou, X.-T.; Chen, W.-M.; Dai, G.-Q. Enhancement of hydrocyclone separation performance by eliminating the air core. Chem. Eng. Process. Process. Intensif. 2004, 43, 1441–1448. [Google Scholar] [CrossRef]
  4. Dueck, J.; Farghaly, M.; Neesse, T. The theoretical partition curve of the hydrocyclone. Miner. Eng. 2014, 62, 25–30. [Google Scholar] [CrossRef]
  5. Flores-Luna, R.I.; Dorador-González, J.M.; Espinosa-Bautista, A. Prosthesis Analysis Based on TRIZ. Key Eng. Mater. 2013, 572, 135–138. [Google Scholar] [CrossRef]
  6. Frausto, J.; Ballantyne, G.; Runge, K.; Powell, M.; Wightman, E.; Evans, C.; Gonzalez, P.; Gomez, S. The effect of screen versus cyclone classification on the mineral liberation properties of a polymetallic ore. Miner. Eng. 2021, 169, 106930. [Google Scholar] [CrossRef]
  7. Gonçalves, S.M.; Ullmann, G.; Morimoto, M.G.; Barrozo, M.A.d.S.; Vieira, L.G.M. Effect of rheology and solids concentration on hydrocyclones performance: A study involving the design variables of an optimized hydrocyclone. J. Pet. Sci. Eng. 2022, 210, 110019. [Google Scholar] [CrossRef]
  8. Hands, D.; Robot, S. Developments in dextrous hands for advanced robotic applications. In Proceedings of the Sixth Biannual World Automation Congress, Seville, Spain, 28 June–1 July 2004. [Google Scholar]
  9. Huang, A.-N.; Maeda, N.; Shibata, D.; Fukasawa, T.; Yoshida, H.; Kuo, H.-P.; Fukui, K. Influence of a laminarizer at the inlet on the classification performance of a cyclone separator. Sep. Purif. Technol. 2017, 174, 408–416. [Google Scholar] [CrossRef]
  10. Zhao, Q.; Hou, D.; Cui, B.; Wei, D.; Song, T.; Feng, Y. Development of an integrated multichannel inlet for improved particle classification in hydrocyclones. Adv. Powder Technol. 2021, 32, 4546–4561. [Google Scholar] [CrossRef]
  11. Liu, P.; Chu, L.; Wang, J.; Yu, Y. Enhancement of Hydrocyclone Classification Efficiency for Fine Particles by Introducing a Volute Chamber with a Pre-Sedimentation Function. Chem. Eng. Technol. 2008, 31, 474–478. [Google Scholar] [CrossRef]
  12. Zhao, B.; Shen, H.; Kang, Y. Development of a symmetrical spiral inlet to improve cyclone separator performance. Powder Technol. 2004, 145, 47–50. [Google Scholar] [CrossRef]
  13. Insperger, T.; Stepan, G. Updated semi-discretization method for periodic delay-differential equations with discrete delay. Int. J. Numer. Methods Eng. 2004, 61, 117–141. [Google Scholar] [CrossRef]
  14. Jacobsen, S.; Wood, J.; Knutti, D.; Biggers, K. The UTAH/M.I.T. Dextrous Hand: Work in Progress. Int. J. Robot. Res. 1984, 3, 21–50. [Google Scholar] [CrossRef]
  15. Ji, L.; He, L.; Chu, K.; Kuang, S. How Particles with Sizes Close to Cut Size Affect the Multiphase Flows and Performance of Hydrocyclones. Ind. Eng. Chem. Res. 2021, 60, 18477–18489. [Google Scholar] [CrossRef]
  16. Kashiwaya, K.; Noumachi, T.; Hiroyoshi, N.; Ito, M.; Tsunekawa, M. Effect of particle shape on hydrocyclone classification. Powder Technol. 2012, 226, 147–156. [Google Scholar] [CrossRef]
  17. Kochan, A. Shadow delivers first hand. Ind. Robot. 2005, 32, 15–16. [Google Scholar] [CrossRef]
  18. Kumar, M.; Reddy, R.; Banerjee, R.; Mangadoddy, N. Effect of particle concentration on turbulent modulation inside hydrocyclone using coupled MPPIC-VOF method. Sep. Purif. Technol. 2021, 266, 118206. [Google Scholar] [CrossRef]
  19. Kyriakidis, Y.N.; Silva, D.O.; Barrozo, M.A.S.; Vieira, L.G.M. Effect of variables related to the separation performance of a hydrocyclone with unprecedented geometric relationships. Powder Technol. 2018, 338, 645–653. [Google Scholar] [CrossRef]
  20. Li, X.F.; Li, D.P.; Zhang, G.X.; Lu, Z.Y. Study on real-time control of humanoid robot using emgs. China Mech. Eng. 2006, 17, 488–492. [Google Scholar]
  21. Li, Z.; Tong, Z.; Zhang, H.; Chu, K.; Li, R.; Miao, H.; Zhao, J.; Yu, A. CFD-DEM simulation of the supercritical water-solid flow in cyclone. Powder Technol. 2023, 418, 118261. [Google Scholar] [CrossRef]
  22. Liu, L.; Zhao, L.; Sun, Y.; Gao, S.; Jiang, M.; Jiang, M.; Rosso, D. Separation performance of hydrocyclones with medium rearrangement internals. J. Environ. Chem. Eng. 2021, 9, 105642. [Google Scholar] [CrossRef]
  23. Mustafa, A.K.Q. Hydrocyclone flow characteristics and measurements. Flow Meas. Instrum. 2020, 73, 101741. [Google Scholar] [CrossRef]
  24. Der, O.; Bertola, V. An experimental investigation of oil-water flow in a serpentine channel. Int. J. Multiph. Flow 2020, 129, 103327. [Google Scholar] [CrossRef]
  25. Olga, V.; Bongers, R.M.; Van, D. Functionality of i-limb and i-limb pulse hands—Case report. J. Rehabil. Res. Dev. 2013, 50, 1123–1128. [Google Scholar]
  26. Otto, A.; Rauh, S.; Ihlenfeldt, S.; Radons, G. Stability of milling with non-uniform pitch and variable helix Tools. Int. J. Adv. Manuf. Technol. 2017, 89, 2613–2625. [Google Scholar] [CrossRef]
  27. Padhi, M.; Mangadoddy, N.; Sreenivas, T.; Vakamalla, T.R.; Mainza, A.N. Study on multi-component particle behaviour in a hydrocyclone classifier using experimental and computational fluid dynamics technique. Sep. Purif. Technol. 2019, 229, 115698. [Google Scholar] [CrossRef]
  28. Pietro, B.; Marco, M. Selective dissolution process featuring a classification device for the removal of fines in crystallization—Experiments. Ind. Eng. Chem. Res. 2021, 60, 15752–15765. [Google Scholar]
  29. Rama, Y.M.; Udaya, K.B. Parametric CFD studies on hydrocyclone. Powder Technol. 2012, 230, 36–47. [Google Scholar] [CrossRef]
  30. Sun, R.; Hou, F.; Ding, Y.; Geng, K.; Yang, Q. Design and performance evaluation of soil washing on heavy metal contaminated soil by hydrocyclone. Chin. J. Environ. Eng. 2018, 12, 1208–1217. [Google Scholar]
  31. Vakamalla, T.R.; Mangadoddy, N. The dynamic behaviour of a large-scale 250-mm hydrocyclone—A CFD study. Asia Pac. J. Chem. Eng. 2019, 14, e2287. [Google Scholar] [CrossRef]
  32. Wang, G. Developing of a new dexterous three fingered hand. Chin. J. Mech. Eng. 1997, 33, 71–75. [Google Scholar]
  33. Ye, J.; Xu, Y.; Song, X.; Yu, J. Numerical modelling and multi-objective optimization of the novel hydrocyclone for ultra-fine particles classification. Chem. Eng. Sci. 2019, 207, 1072–1084. [Google Scholar] [CrossRef]
  34. Hsieh, K.T. Phenomenological Model of the Hydrocyclone. Master’s Thesis, The University of Utah, Salt Lake City, UT, USA, 1988. [Google Scholar]
  35. Delgadillo, J. Modeling of 75-and 250-mm Hydrocyclones and Exploration of Novel Designs Using Computational Fluid Dynamics. Ph.D. Thesis, University of Utah, Salt Lake City, UT, USA, 2006. [Google Scholar]
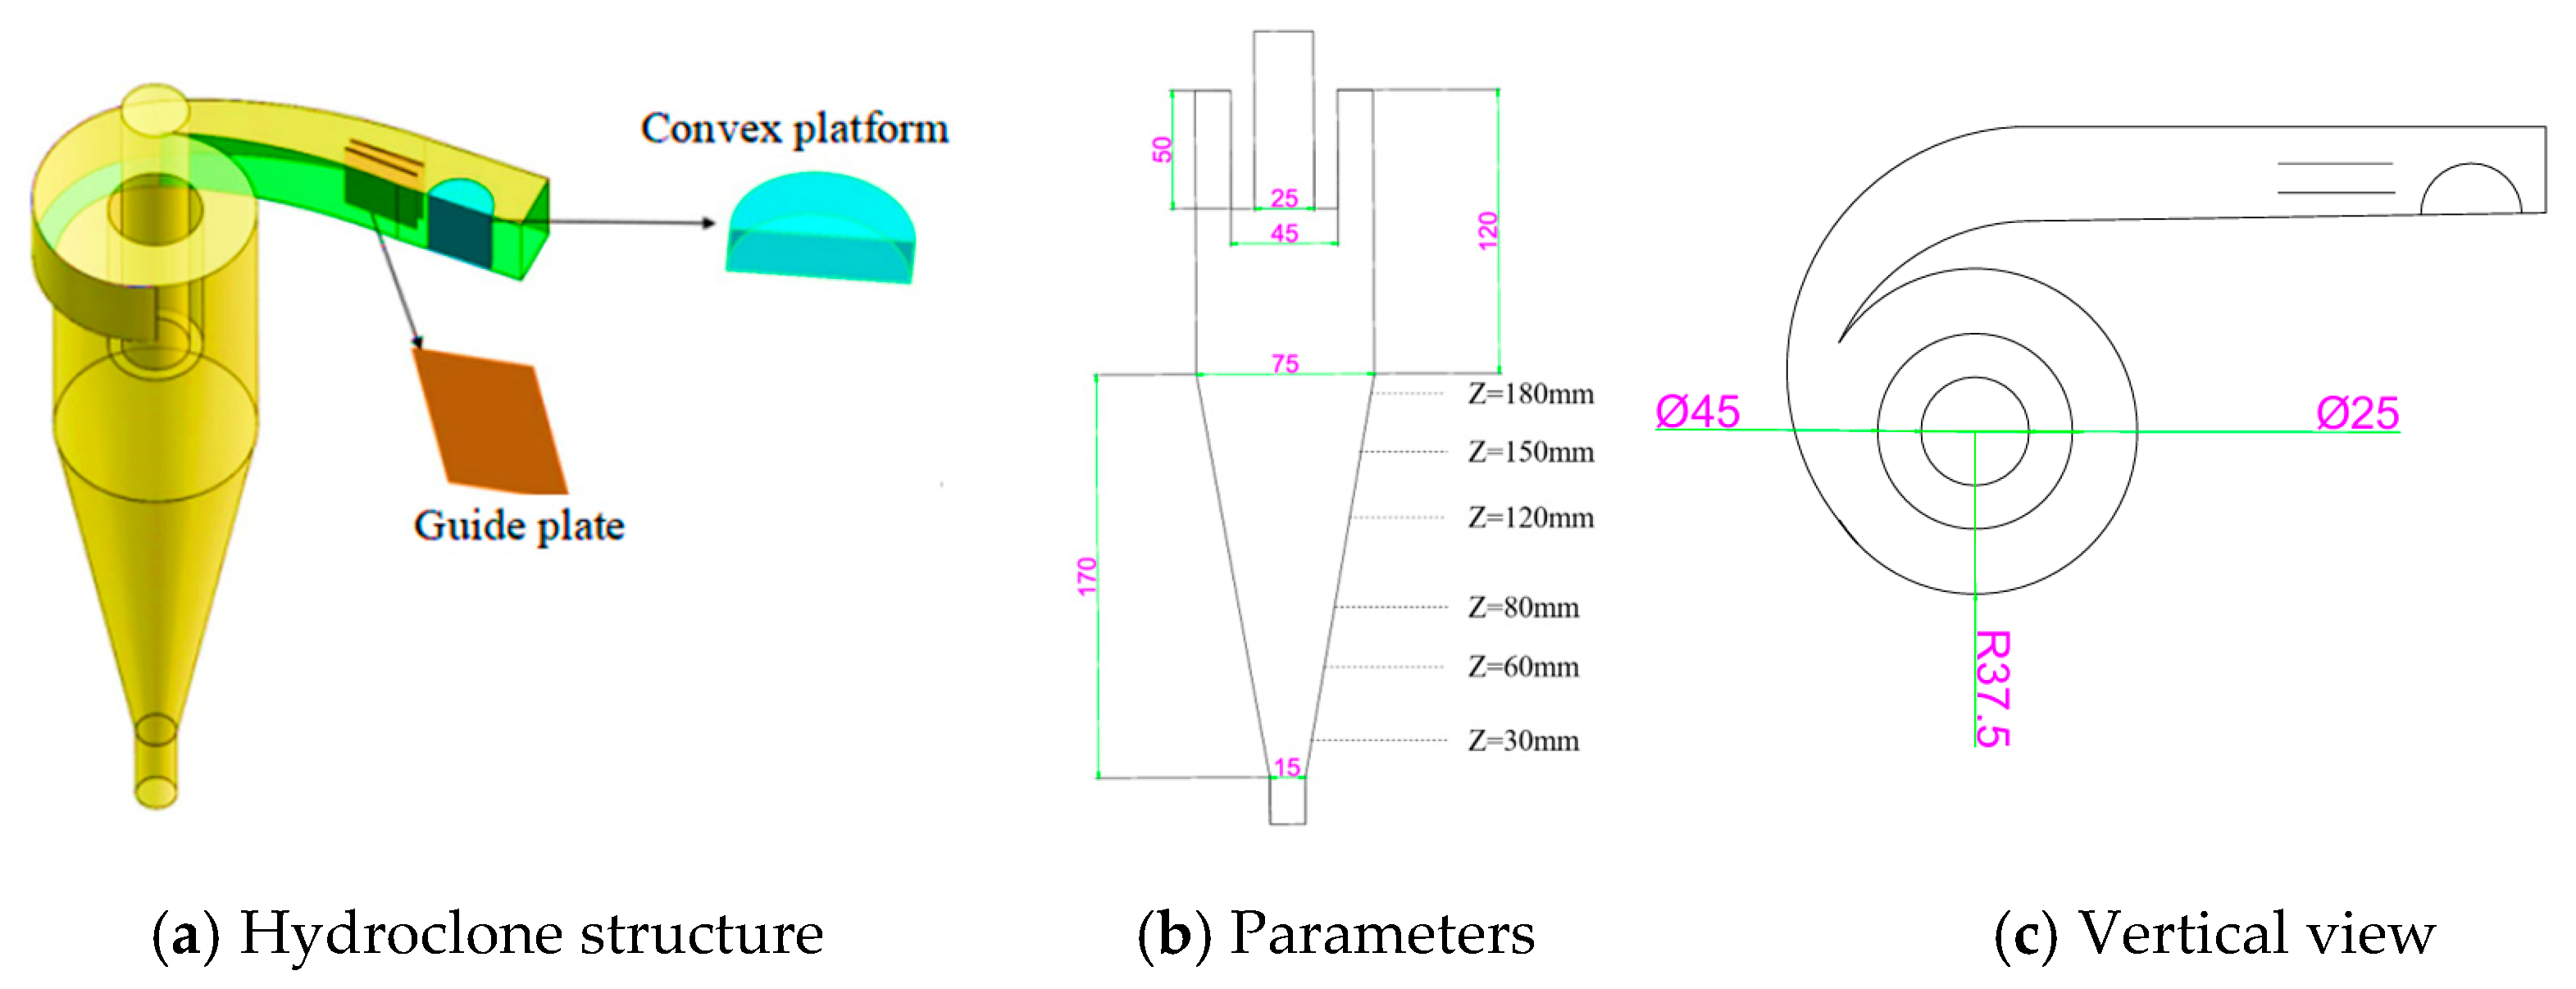
Figure 1. Three-dimensional geometric model of the designed hydrocyclone with complex curved inlet.
Processes 13 03540 g001
Figure 2. Physical Diagram of the Hydrocyclone and Mesh Discretization.
Processes 13 03540 g002
Figure 3. Mesh Independence Verification.
Processes 13 03540 g003
Figure 4. Validation of the numerical simulation for the flow field.
Processes 13 03540 g004
Figure 5. Comparison between experimental and simulated data for the particles.
Processes 13 03540 g005
Figure 6. Distribution characteristics of particles with different particle sizes in ZX plane.
Processes 13 03540 g006
Figure 7. Distribution characteristics of particles with different article sizes in XY plane.
Processes 13 03540 g007
Figure 8. Variation in axial position with different particle sizes on the diameter line. (a) 0.5 µm; (b) 4 µm; (c) 25 µm; (d) 60 µm.
Processes 13 03540 g008
Figure 9. Distribution characteristics of 4 µm particles at different concentrations.
Processes 13 03540 g009
Figure 10. Distribution characteristics of 4 µm particles at different concentrations.
Processes 13 03540 g010
Figure 11. Distribution characteristics of 15 µm particles at different concentrations.
Processes 13 03540 g011
Figure 12. Distribution characteristics of 30 µm particles at different concentrations.
Processes 13 03540 g012
Figure 13. Distribution characteristics of 60 µm particles at different concentrations.
Processes 13 03540 g013aProcesses 13 03540 g013b
Figure 14. Variation of 0.5 µm particles along the diameter line at different concentrations. (a) Z = 30 mm; (b) Z = 80 mm; (c) Z = 120 mm (d) Z = 180 mm.
Processes 13 03540 g014aProcesses 13 03540 g014b
Figure 15. Variation of 4 µm particles along the diameter line at different concentrations. (a) Z = 30 mm; (b) Z = 80 mm; (c) Z = 120 mm; (d) Z = 180 mm.
Processes 13 03540 g015
Figure 16. Variation of 30 µm particles along the diameter line at different concentrations. (a) Z = 30 mm; (b) Z = 80 mm; (c) Z = 120 mm; (d) Z = 180 mm.
Processes 13 03540 g016
Figure 17. Variation of 60 µm particles along the diameter line at different concentrations. (a) Z = 30 mm; (b) Z = 80 mm; (c) Z = 120 mm; (d) Z = 180 mm.
Processes 13 03540 g017aProcesses 13 03540 g017b
Figure 18. Effect of particle concentration on efficiency curve.
Processes 13 03540 g018
Figure 19. Effect of particle concentration on steepness index.
Processes 13 03540 g019
Figure 20. Diffusion index with different particle sizes at different inlet concentrations.
Processes 13 03540 g020aProcesses 13 03540 g020b
Figure 21. Laboratory rig.
Processes 13 03540 g021
Figure 22. Effect of feed concentration on particle size.
Processes 13 03540 g022
Figure 23. Effect of inlet concentration on classification efficiency.
Processes 13 03540 g023
Table 1. Material particle size composition.
Size/μmInterval/%Positive Cumulative Content/%
0~67.577.57
6~2426.8534.42
24~5244.178.52
52~7617.6296.14
>763.86100
Table 2. Effect of different inlet concentrations on separation performance.
Feed ConcentrationSize−20 μm of Overflow−20 μm of UnderflowQuality EfficiencyQuantity Efficiency
/%/μm/%/%/%/%
856.360.239.1865.8383.61
1258.257.198.1661.2684.99
1661.355.367.1356.8187.92
2064.553.896.0953.9389.32
2566.551.395.2243.2891.28
Table 3. Comparison of experimental results.
TypeUnderflow Content of −20 μm/%Pressure Drop/KpaQuality Efficiency/%Quantity Efficiency/%
Base16.31%46.5160.3182.63
Complex inlet9.6245.3265.2283.89
Disclaimer/Publisher’s Note: The statements, opinions and data contained in all publications are solely those of the individual author(s) and contributor(s) and not of MDPI and/or the editor(s). MDPI and/or the editor(s) disclaim responsibility for any injury to people or property resulting from any ideas, methods, instructions or products referred to in the content.