Article

Mechanism of Pressure Fluctuations and Flow Patterns Under Steady Operating Conditions of a Variable Speed Pump-Turbine

1
PowerChina HuaDong Engineering Corporation Limited, Hangzhou 311122, China
2
State Key Laboratory of Water Resources Engineering and Management, Wuhan University, Wuhan 430072, China
3
Department of Hydraulics, Changjiang River Scientific Research Institute, Wuhan 430010, China
*
Author to whom correspondence should be addressed.
Processes 2025, 13(11), 3511; https://doi.org/10.3390/pr13113511
Submission received: 17 September 2025 / Revised: 24 October 2025 / Accepted: 26 October 2025 / Published: 1 November 2025
(This article belongs to the Section Energy Systems)

Abstract

The variable speed pump-turbine is usually used to adjust the rotational speed to improve the efficiency in turbine mode and change the input power in pump mode because its rotational speed can vary within a certain range. In order to explore the evolutions of pressure pulsation and flow patterns caused by changes in the rotational speeds, the steady operating conditions under different rotational speeds in turbine and pump modes were investigated by using three-dimensional numerical simulations. The results show that as the pump-turbine operates with the highest efficiency at the rated rotational speed, the change in the rotational speed leads to the variation in macro-parameters, deterioration of the flow patterns, and increase in pressure pulsations. In addition, under a certain guide vane opening, with the increase in the rotational speed, the torque, power, and discharge increase in the turbine mode, while these parameters decrease in the pump mode. And when the rotational speed is too high or too low, it causes an obvious increase in pressure pulsations.

1. Introduction

The pumped storage power station is a hydropower station that uses excess electricity to pump water from the lower reservoir to the upper reservoir, while releasing water from the upper reservoir to the lower reservoir for power generation during periods of peak electricity consumption. Because the demand for grid stability is increasing with the rapid development of renewable energy, the pumped storage power stations have become the safest stability regulator in the power grid due to their flexible regulation function and complementarity with renewable energy, ensuring security, stability, and high efficiency. However, the pumped storage power station has multiple operating conditions and frequent condition transitions [1], making it difficult for the pump-turbine to maintain optimal efficiency. Due to the presence of the S-shaped region in the turbine mode and the hump-shaped region in the pump mode [2,3], when the working point operates under off-design conditions, the internal flow patterns in the pump-turbine unit are complex and the pressure pulsations are large [4], which can cause unit vibrations [5]. In order to improve operating efficiency under off-design conditions, reduce dynamic loads, and decrease the pressure pulsations, variable speed pump-turbines can make outstanding contributions [6]. They can adjust the rotational speed to achieve appropriate operating efficiency in turbine mode, obtain suitable input based on the power grid demand in pump mode, and ensure the stability of the transient process [7,8]. It should be noted that the design theory of the variable speed pump-turbine is still based on that of constant-speed units, while further considering other factors such as the variation range of rotational speed, head, and power demand [9]. Therefore, the prerequisite for studying variable speed units is to fully understand the internal and external characteristics of constant speed ones.
At present, the existing research mainly focuses on the flow patterns and pressure pulsations at different locations in the constant speed pump-turbine units, including the vaneless space, blade passages, and draft tube, and also pays attention to the variations in the power, discharge, and other parameters under various operating points in the n11Q11 plane, both by using experimental methods and three-dimensional numerical simulation methods [10]. Firstly, regarding the operating conditions in turbine mode, the flow patterns and pressure pulsations in the S-shaped or part-load regions have become popular research topics, and the internal and external characteristics are of high interest. Hasmatuchi [11] demonstrated the amplitude of the pressure pulsations at two guide vane openings in the S-shaped region through experimental methods, and found that as the discharge decreased, the amplitudes of the pressure pulsations and the range of stall vortices both increased. Liu [12] also studied the flow characteristics in the blade channels at two guide vane openings by using experimental methods and found the vortex separations. Sun and Xia [13,14] described the evidence of backflows at the runner inlet in the S-shaped region, and Xia [14] also discussed the relationship between the discharge, inlet radial velocity, and flow patterns, indicating that the backflows at the runner inlet show regular changes with the variation in discharge, which can cause large pressure pulsations. Then the time and frequency characteristics of the pressure in the runner or at the vaneless space can propagate upstream and downstream [15]. Therefore, the pressure pulsations inside the draft tube are simultaneously affected by the flow patterns from the runner and the vortex rope in the draft tube. Kirschner [16] investigated the vortex rope shape and pressure fluctuations in the draft tube at different operating conditions and concluded that with the change in discharge, the vortex rope shape can present spiral and cylindrical characteristics, and the pressure fluctuations also change accordingly. Liu [17] used a laser Doppler velocimeter to test the axial and circumferential velocity at the runner outlet and concluded the relationship between the outlet velocity and the discharge. Moreover, when the downstream water level is low or under partial load conditions, there is a possibility of cavitation vortices occurring at the outlet of the runner or in the draft tube. Pang [18] simulated the development of cavitation vortices in the draft tube under part-load conditions and pointed out that when the shape of the cavitation vortices changes, the main frequency of pressure pulsation also changes. For the pump mode, the hump-shaped region has attracted much attention, and the research methods and contents are similar to those in the turbine mode. Especially, the rotating stalls inside the unit can cause significantly large pressure fluctuations, because a certain number of low-velocity vortices are distributed in the vane region, which are nearly equidistant along the circumferential direction, and the strength and range of them vary with the discharge [19,20]. For example, Zhang [3] used a combination of simulation and experimental methods to study the internal flow characteristics and induced pressure fluctuations in pump mode. It was also found that there were obvious flow separations, backflows, and others. The above results provide a great foundation for further study of variable speed pump-turbines.
The research methods and contents of the internal and external characteristics under steady conditions in variable speed units are similar to those in constant ones. Lv [21] modifies the characteristic curves of a traditional fixed-speed pump-turbine by using the variable speed technology, and the preferred operation curve of the pump working condition is obtained, which means the hydraulic principles of the fixed and variable speed pump-turbines are interconnected. Therefore, the method of analyzing the fixed speed pump-turbine can be used to analyze the characteristics of the variable speed ones, although they also have a different focus. Shang [22] conducted a comparative study on the characteristics of flow patterns and pressure pulsations in variable speed pump-turbines under three different rotational speeds in turbine mode. The results indicate that at low-speed conditions, the maximum pressure pulsations are small, which means that the unit will still maintain better stability during the reduction of process speed. Rode [23] investigated the pressure fluctuations in vaneless space at higher heads and found that the main source of pressure fluctuations is rotor–stator interaction, with the dominant frequency being blade passing frequency and its harmonics. Shang [24] investigated the two kinds of operating conditions in pump mode, including maximum head and minimum discharge conditions, as well as minimum head and maximum discharge conditions. The results pointed out that under the former conditions, the flow velocity in the channel is higher, the flow turbulence is greater, the pressure fluctuation is larger, and the stability of the unit is poorer. Wang [25] simulated the flow characteristics of a variable speed pump-turbine under three conditions in pump modes, and the results show that the higher the speed, the larger the area of the high-pressure region before the runner inlet. Shi [26] focused on the internal flow characteristics and pressure pulsation characteristics of a pump-turbine during the speed reduction period and found that with the change in rotational speed, vortices generate in the runner and draft tube, and also the rotor–stator interactions are enhanced. Also, Luo [27] investigated the transient flow field in a variable speed pump-turbine during the speed reduction and concluded that aggregated vortices lead to significant power oscillations.
In summary, on the one hand, the research mainly focuses on selecting a certain guide vane opening and keeping the rotational speed at the rated one, then studying the internal and external characteristics at different operating points by changing the discharge. On the other hand, the method of changing the rotational speed has also been adopted, but the relationship between the micro-parameters, flow patterns, and pressure pulsation characteristics within the variable speed range are not yet fully understood, and further in-depth research is needed.
This paper selected the steady conditions in turbine mode and pump mode and investigated the internal and external characteristics by using the three-dimensional numerical simulation method. To study the effect of rotational speed changes on the operation of the pump-turbine unit, the conditions at the rated rotational speed in both turbine and pump are close to optimal, while keeping the remaining boundary conditions unchanged. The aim of this paper is to explore the evolution laws of macro-parameters, internal flow patterns, and pressure fluctuations by only changing the rotational speed, and summarize the operation feasibility influenced by the rotational speed changes, then provide a research basis for the regulation of variable speed units under various conditions.

2. Numerical Methods

2.1. Computational Domain and Main Parameters of the Pump-Turbine

The object of the simulations was a model pump-turbine, and the computational domain shown in Figure 1 includes spiral casing, stay vanes, guide vanes, runner, draft tube, and extension pipes. The basic parameters of the pump-turbine are shown in Table 1.

2.2. Three-Dimensional CFD Setup

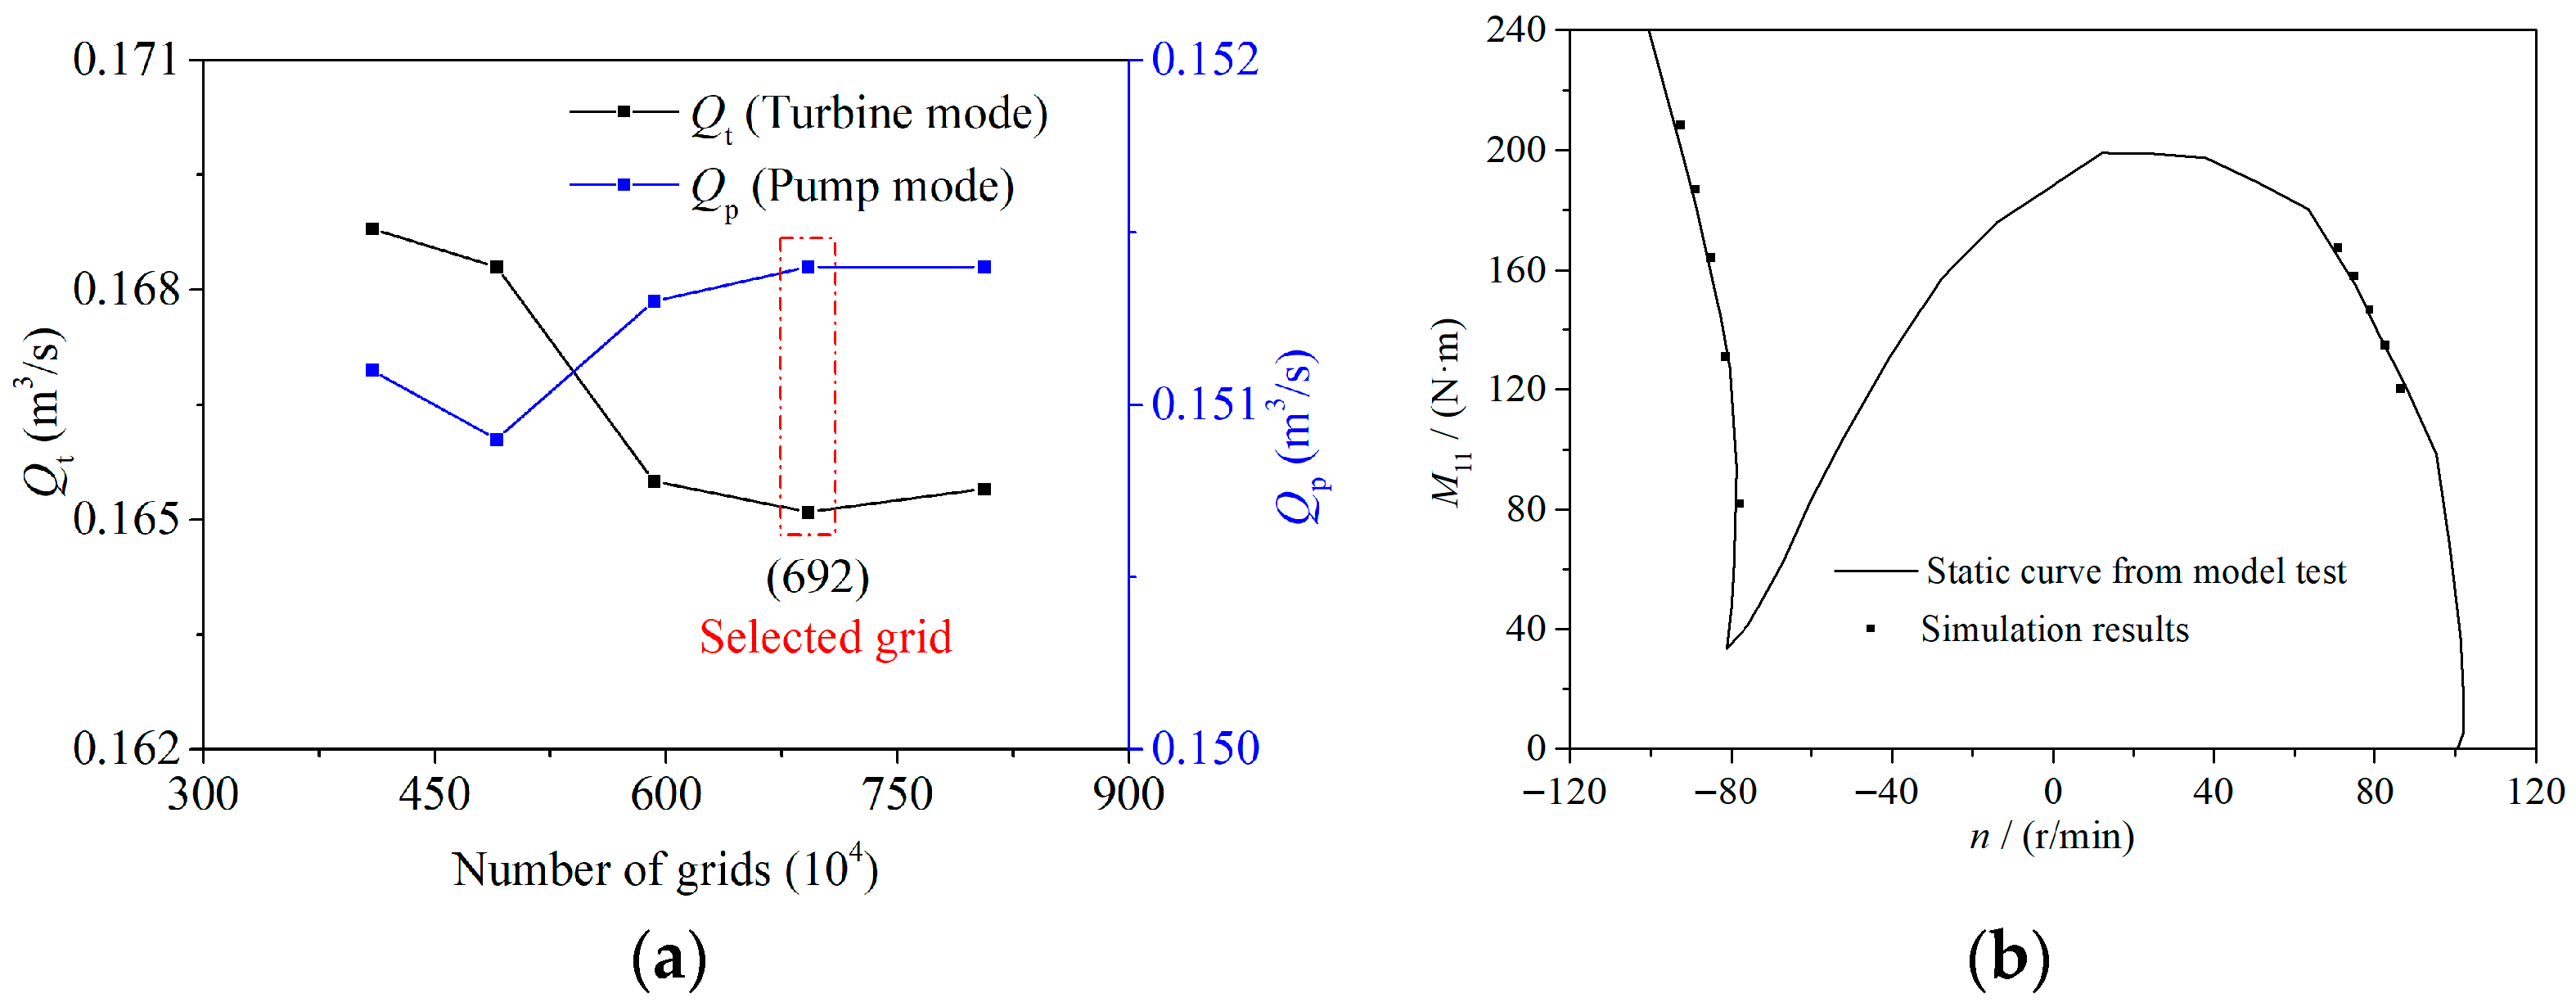
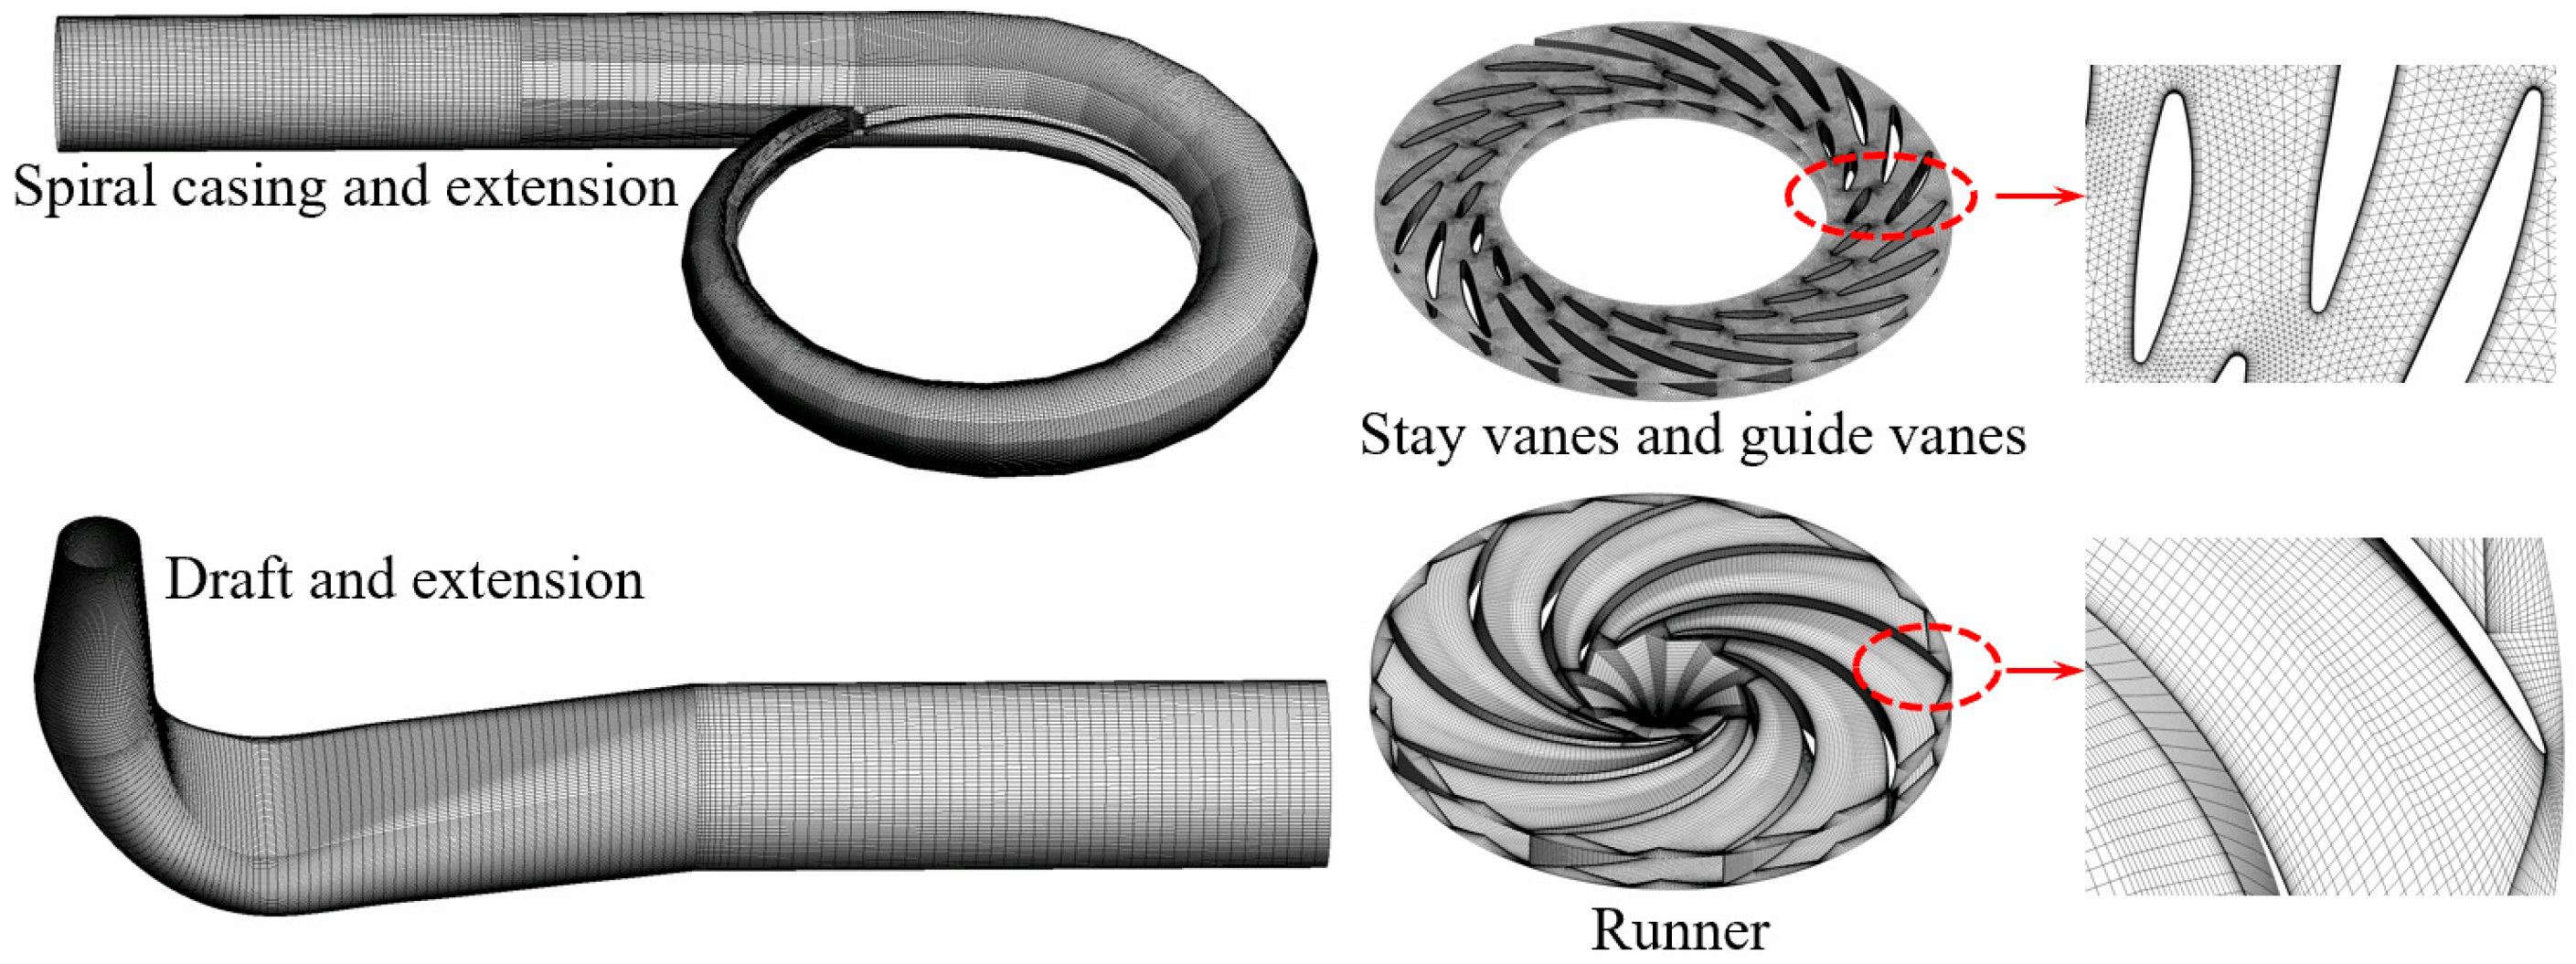
The mesh was generated by using ICEM-CFD 2022R1. The spiral casing, runner, draft tube, and extension pipes were discretized by hexahedral grids, while the stay vanes and guide vanes adopted wedge grids, and the local boundary layers were set in the main regions of stay vanes, guide vanes, and runner blades. ANSYS FLUENT 2022R1 was used to conduct 3D CFD simulations, and the mesh dependencies considering the discharge at the rated rotational speed in turbine mode and pump mode were conducted. The results showed that the discharge no longer underwent significant changes when the grid number exceeded 6.92 million, so the mesh with a grid number of 6.92 million was finally chosen (Figure 2a). The final mesh is shown in Figure 3. In these simulations, the timestep was selected as 0.00025 s, the k-ω SST turbulence model was adopted [28], and the SIMPLEC algorithm was chosen to achieve the coupling solution of the velocity and pressure equations. In addition, the second-order discretization in time and in space was used. The convergence criteria of residuals at each timestep were set to 1.0 × 10⁻⁴, and the maximum number of iterations per time-step was set to 20. For boundary conditions, the upper and lower extension pipes were set as pressure boundaries. For the rotor–stator interface configuration, the multiple reference frame approach was used for the runner zone in steady state simulations, while the sliding mesh approach was used in transient simulations. Therefore, only the rotational speeds were changed in calculations.

3. The Simulation Results and Analysis

In this paper, among the simulated operating conditions, the efficiency is the highest under the condition with the rated rotational speed. Based on these conditions, only changing the rotational speed was adopted to reflect the variation trends of pressure fluctuations and flow patterns. Overall, five simulation points considering different rotational speeds were selected in the turbine and pump modes, respectively, and the rotational speeds corresponding to these conditions include 0.90 nr, 0.95 nr, 1.00 nr, 1.05 nr, and 1.10 nr (nr represents the rated rotational speed). In addition, during the simulations, the boundary conditions of the upstream and downstream remained unchanged, and the guide vane opening also remained constant. Then, the macro-parameters, pressure pulsations, and flow patterns were discussed. Meanwhile, the velocity triangle theory was used to comprehensively reflect the correlation between macro-parameters and flow patterns [29]. If the working point was ideal in turbine mode, it met the requirements of no impact at the runner inlet, no circumferential flow at the runner outlet, and no vortex structures inside the pump-turbine unit. In pump mode, when the water flowed upwards from the draft tube into the runner blade channels, there was no impact on the blades, and when it flowed into the vane region from the runner blade channels, there was no impact on the guide vanes.

3.1. The Results in the Turbine Mode

3.1.1. Variations of Macro-Parameters in the Turbine Mode

Table 2 shows the macro-parameters of five steady operating conditions in turbine mode, including rotational speeds (ω), torque (T), output (N), discharge (Q), head (H), and efficiency (η). It can be seen that as the rotational speed increases from 0.90 nr to 1.10 nr, the torque, output, and discharge gradually decrease. This indicates that if the initial operating point is at the one with the rated rotational speed, reducing the speed will increase the output, and then if it is necessary to ensure the rated output, reducing the guide vane opening can be adopted. In this paper, because the guide vane opening and the upstream and downstream boundaries remained unchanged in the simulation, the five operating conditions all have high efficiency, and the water head has almost no changes. Comparing efficiency in these five conditions, it has the highest value in Case-T-1.00 nr, reaching 90.39%. When the rotational speed increases or decreases, the efficiency decreases, indicating that the decrease in the rotational speed may not necessarily improve efficiency. In addition, the efficiency value (η) in Case-T-0.90 nr is larger than that in Case-T-1.10 nr.

3.1.2. Evolutions of Flow Patterns in the Turbine Mode

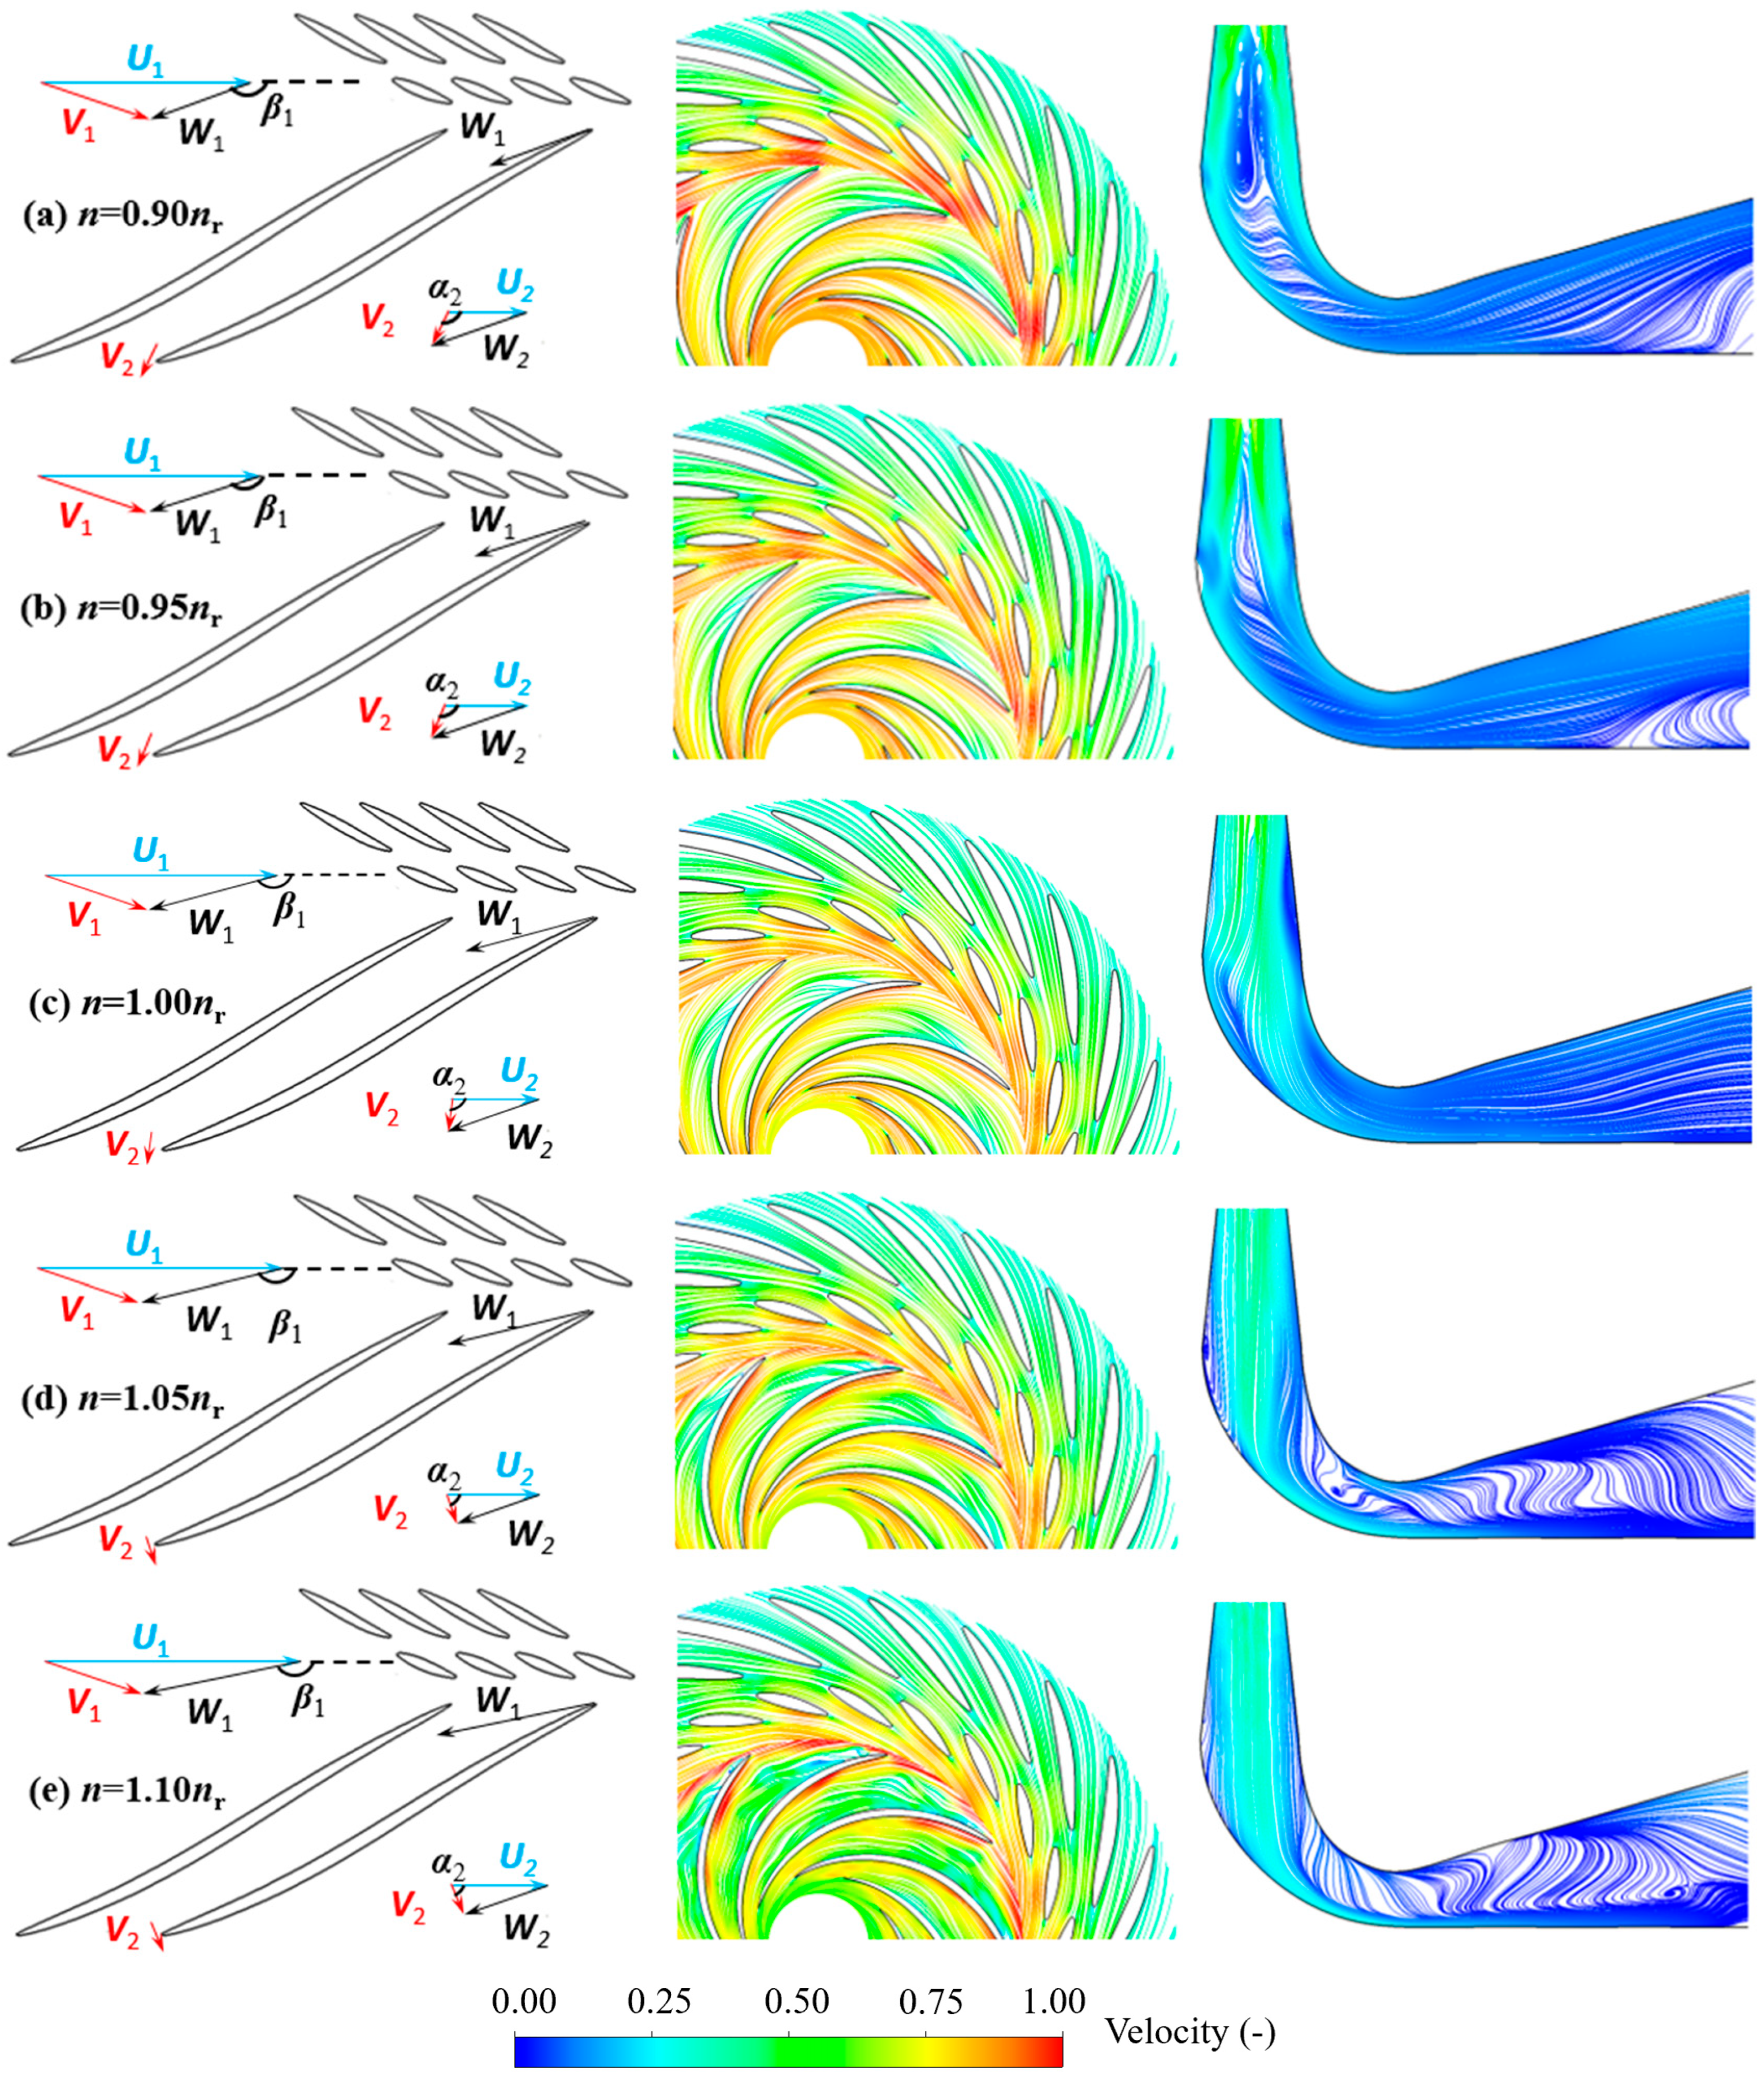
To investigate the internal flow pattern behind macro-parameter changes caused by variations in rotational speeds, the velocity triangle variation laws at the runner inlet and outlet are analyzed, and the flow pattern evolutions at 0.5 Span in the vane and runner region, as well as the vertical section in the draft tube, are combined to achieve the deep mechanism. Firstly, taking Case-T-1.00 nr as an example (Figure 4c), the velocity triangle at the inlet and outlet of the runner does not meet the principle of no impact at the runner inlet and no circumferential flow at the outlet, which indicates the existence of certain head loss and a decrease in efficiency. Furthermore, the relative velocity W1 at the inlet does not strictly follow the bone line of runner blades, namely, the water enters the blade passages, encountering obstacles, which easily leads to flow separations on the blade pressure surfaces. The above phenomenon can also be reflected in the streamline distribution in the runner region at 0.5 Span. At the runner outlet, the direction of absolute velocity V2 leans towards the suction surface of adjacent blades, which easily forms a high velocity region at the side wall and a low velocity region at the center of the draft tube. However, due to the small deviation range of W1 and V2 in this working condition, no obvious vortex structure is generated.
Observing the two operating conditions, in which the rotational speeds decrease (Figure 4a,b), it can be found that compared to the change rate of the rotational speed, the variation in discharge is relatively small. Therefore, the direction and magnitude of W1 and V2 are mainly controlled by the rotational speed. Then, as the rotational speed decreases (From 0.95 nr to 0.90 nr), β1 gradually decreases, indicating that the flow direction of W1 is more likely to cause uneven distribution of velocity before and after the blade inlet. Also, it becomes difficult for water to enter the blade channels, and the flow velocity at the vaneless space will gradually increase, showing an uneven distribution phenomenon, which is particularly evident on the 0.5 Span. It should be noted that on the pressure side, compared to the results in Case-T-1.00 nr condition, the velocity of streamlines in Case-T-0.90 nr partially decreases after the water collides with the inlet blade edge. However, the overall trend still flows along the blade in Case-T-0.90 nr, and it also alleviates the flow separation in the middle of the blade channels compared to those in Case-T-1.00 nr. On the suction side, due to the direction change of W1, the flow velocity increases significantly, indicating that the flow is shifted towards the suction side. In addition, the direction change of V2 at the runner outlet also leads to a regular evolution of the flow patterns in the draft tube. The flow patterns are relatively smooth in Case-T-1.00 nr, but when the speed decreases, the direction change of V2 causes the water to develop towards the side wall of the draft tube, forming a high-velocity region on the side wall and a low-velocity region at the center, generating vortex structures.
For the two working conditions with increasing rotational speeds (Figure 4d,e), the increase of β1 indicates that the water enters the blade channels more towards the suction surface of the next blade. Also, the value of W1 gradually increases, which means the flow velocity at the suction surface increases, while that at the pressure surface decreases, making it easy to form flow separation at the pressure surface. For the streamline diagram on 0.5 Span, compared to the results in Case-T-1.00 nr condition (Figure 4c), the velocity at the blade-leading edge in Case-1.10 nr has a significant increase, but that at the vaneless space is not large. In the draft tube, the increase in the rotational speed forces the direction change in velocity V2 at the runner outlet. Then, the velocity at the center of the draft tube increases, while that at the side wall decreases, and the flow patterns behind the elbow section rapidly become turbulent due to the shear effect caused by the difference in velocity. It should be noted that the efficiency value in Case-T-0.90 nr is larger than that in Case-T-1.10 nr (Table 2). The reason is that comparing the flow patterns of two operating conditions (Figure 4a,e), the flow patterns in Case-T-1.10 nr show relatively large differences in velocity distribution between the pressure surface and the suction surface, leading to high-velocity regions at the suction surface, accompanied by a partial braking effect, which greatly decreases the runner output. Then, under the same head, the factors that affect efficiency include output and discharge, and the decrease rate of output is higher than that of discharge in these two conditions, resulting in the lower efficiency in Case-T-1.10 nr.
Overall, as the rotational speed decreases, the velocity at the vaneless space increases, and low-velocity vortices are generated at the center of the draft tube. As the rotational speed increases, the velocity at the blade-leading edge at the runner inlet and suction surface of the runner blades increases, and the velocity at the center of the draft tube also increases. Also, low-velocity vortices are generated past the elbow section.

3.1.3. Pressure Pulsations and Detail Flow Patterns in the Turbine Mode

To better explore and compare the pressure pulsation characteristics in the five working conditions, the pressure pulsation characteristics at the vaneless space and in the draft tube of each working condition were monitored and normalized using the method shown as Formula (1).
C p = p p ¯ ρ g h
where p is the instantaneous pressure signal, Pa; p ¯ is the average pressure signal, Pa; ρ is the density of water, m3/s; h is the head between the spiral casing inlet and the draft tube outlet.
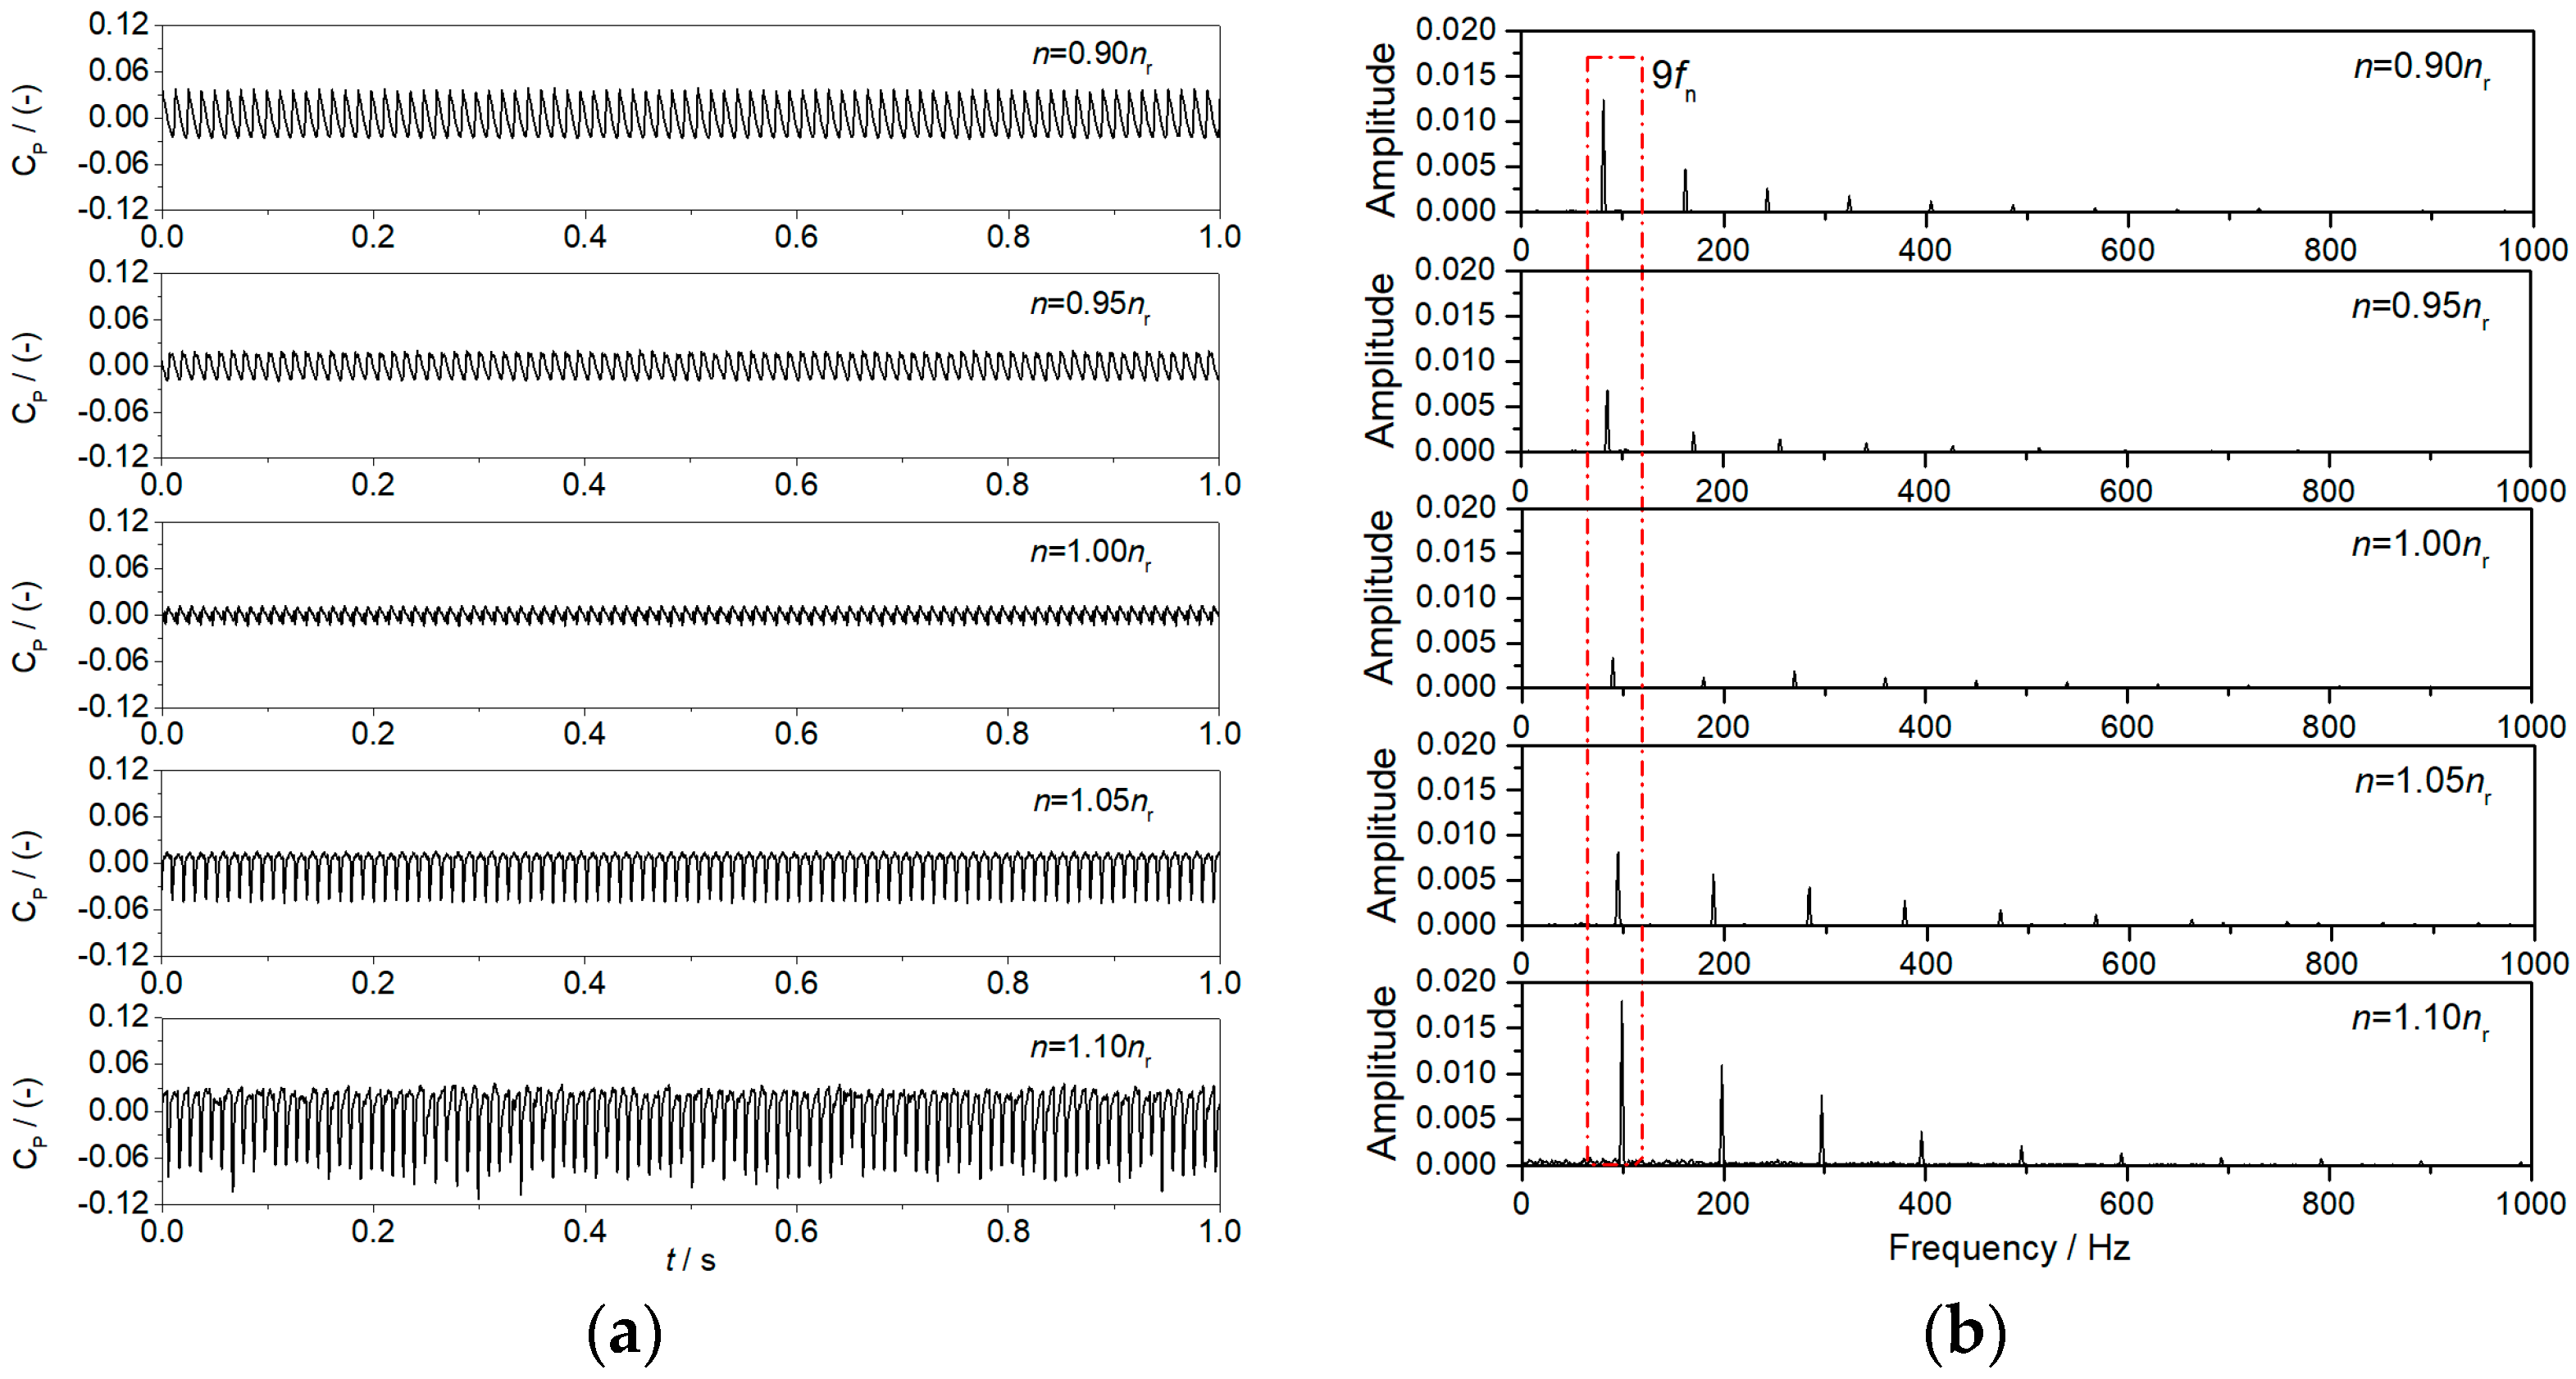
Time-domain and frequency-domain analysis of the pressure pulsation at the vaneless space of five operating conditions are shown in Figure 5. Firstly, from the time-domain diagram (Figure 5a), when the rotational speed is at the rated one (n = 1.00 nr), the pressure pulsation values are the lowest. As the rotational speed increases or decreases, the pressure pulsation value gradually increases, indicating that the operating points start to deviate from the optimal one. However, the difference is that when the rotational speed increases, the amplitude of pressure pulsation increases more.
A fast Fourier transform based on the time-domain values was conducted to investigate the frequency characteristics (Figure 5b). Overall, the amplitude of pressure pulsation is dominated by the blade passing frequency (9fn, fn is the rotating frequency of the runner), while the other harmonics are relatively low. When the rotational speed is at the rated one (n = 1.00 nr), the amplitude corresponding to the blade passing through frequency (9fn) is only 0.00337, followed by the amplitude corresponding to frequency 27fn, and the amplitude corresponding to frequency 18fn is even lower. As the rotational speed decreases to 0.95 nr, the amplitude of the blade passing frequency increases, but only reaches 0.00677 because of the small change in the rotational speed. In this case, the amplitude of the frequency of 18fn exceeds that of the frequency of 27fn, but the amplitudes corresponding to the other frequencies are still low. When the rotational speed further decreases to 0.90 nr, the amplitude of each frequency increases obviously, and the amplitude of frequency 9fn (0.01233) becomes 3.66 times higher than that at rated speed operating condition. On the other hand, as the rotational speed rises to 1.05 nr and 1.10 nr, it is evident that the amplitudes of each frequency increase significantly in varying degrees.
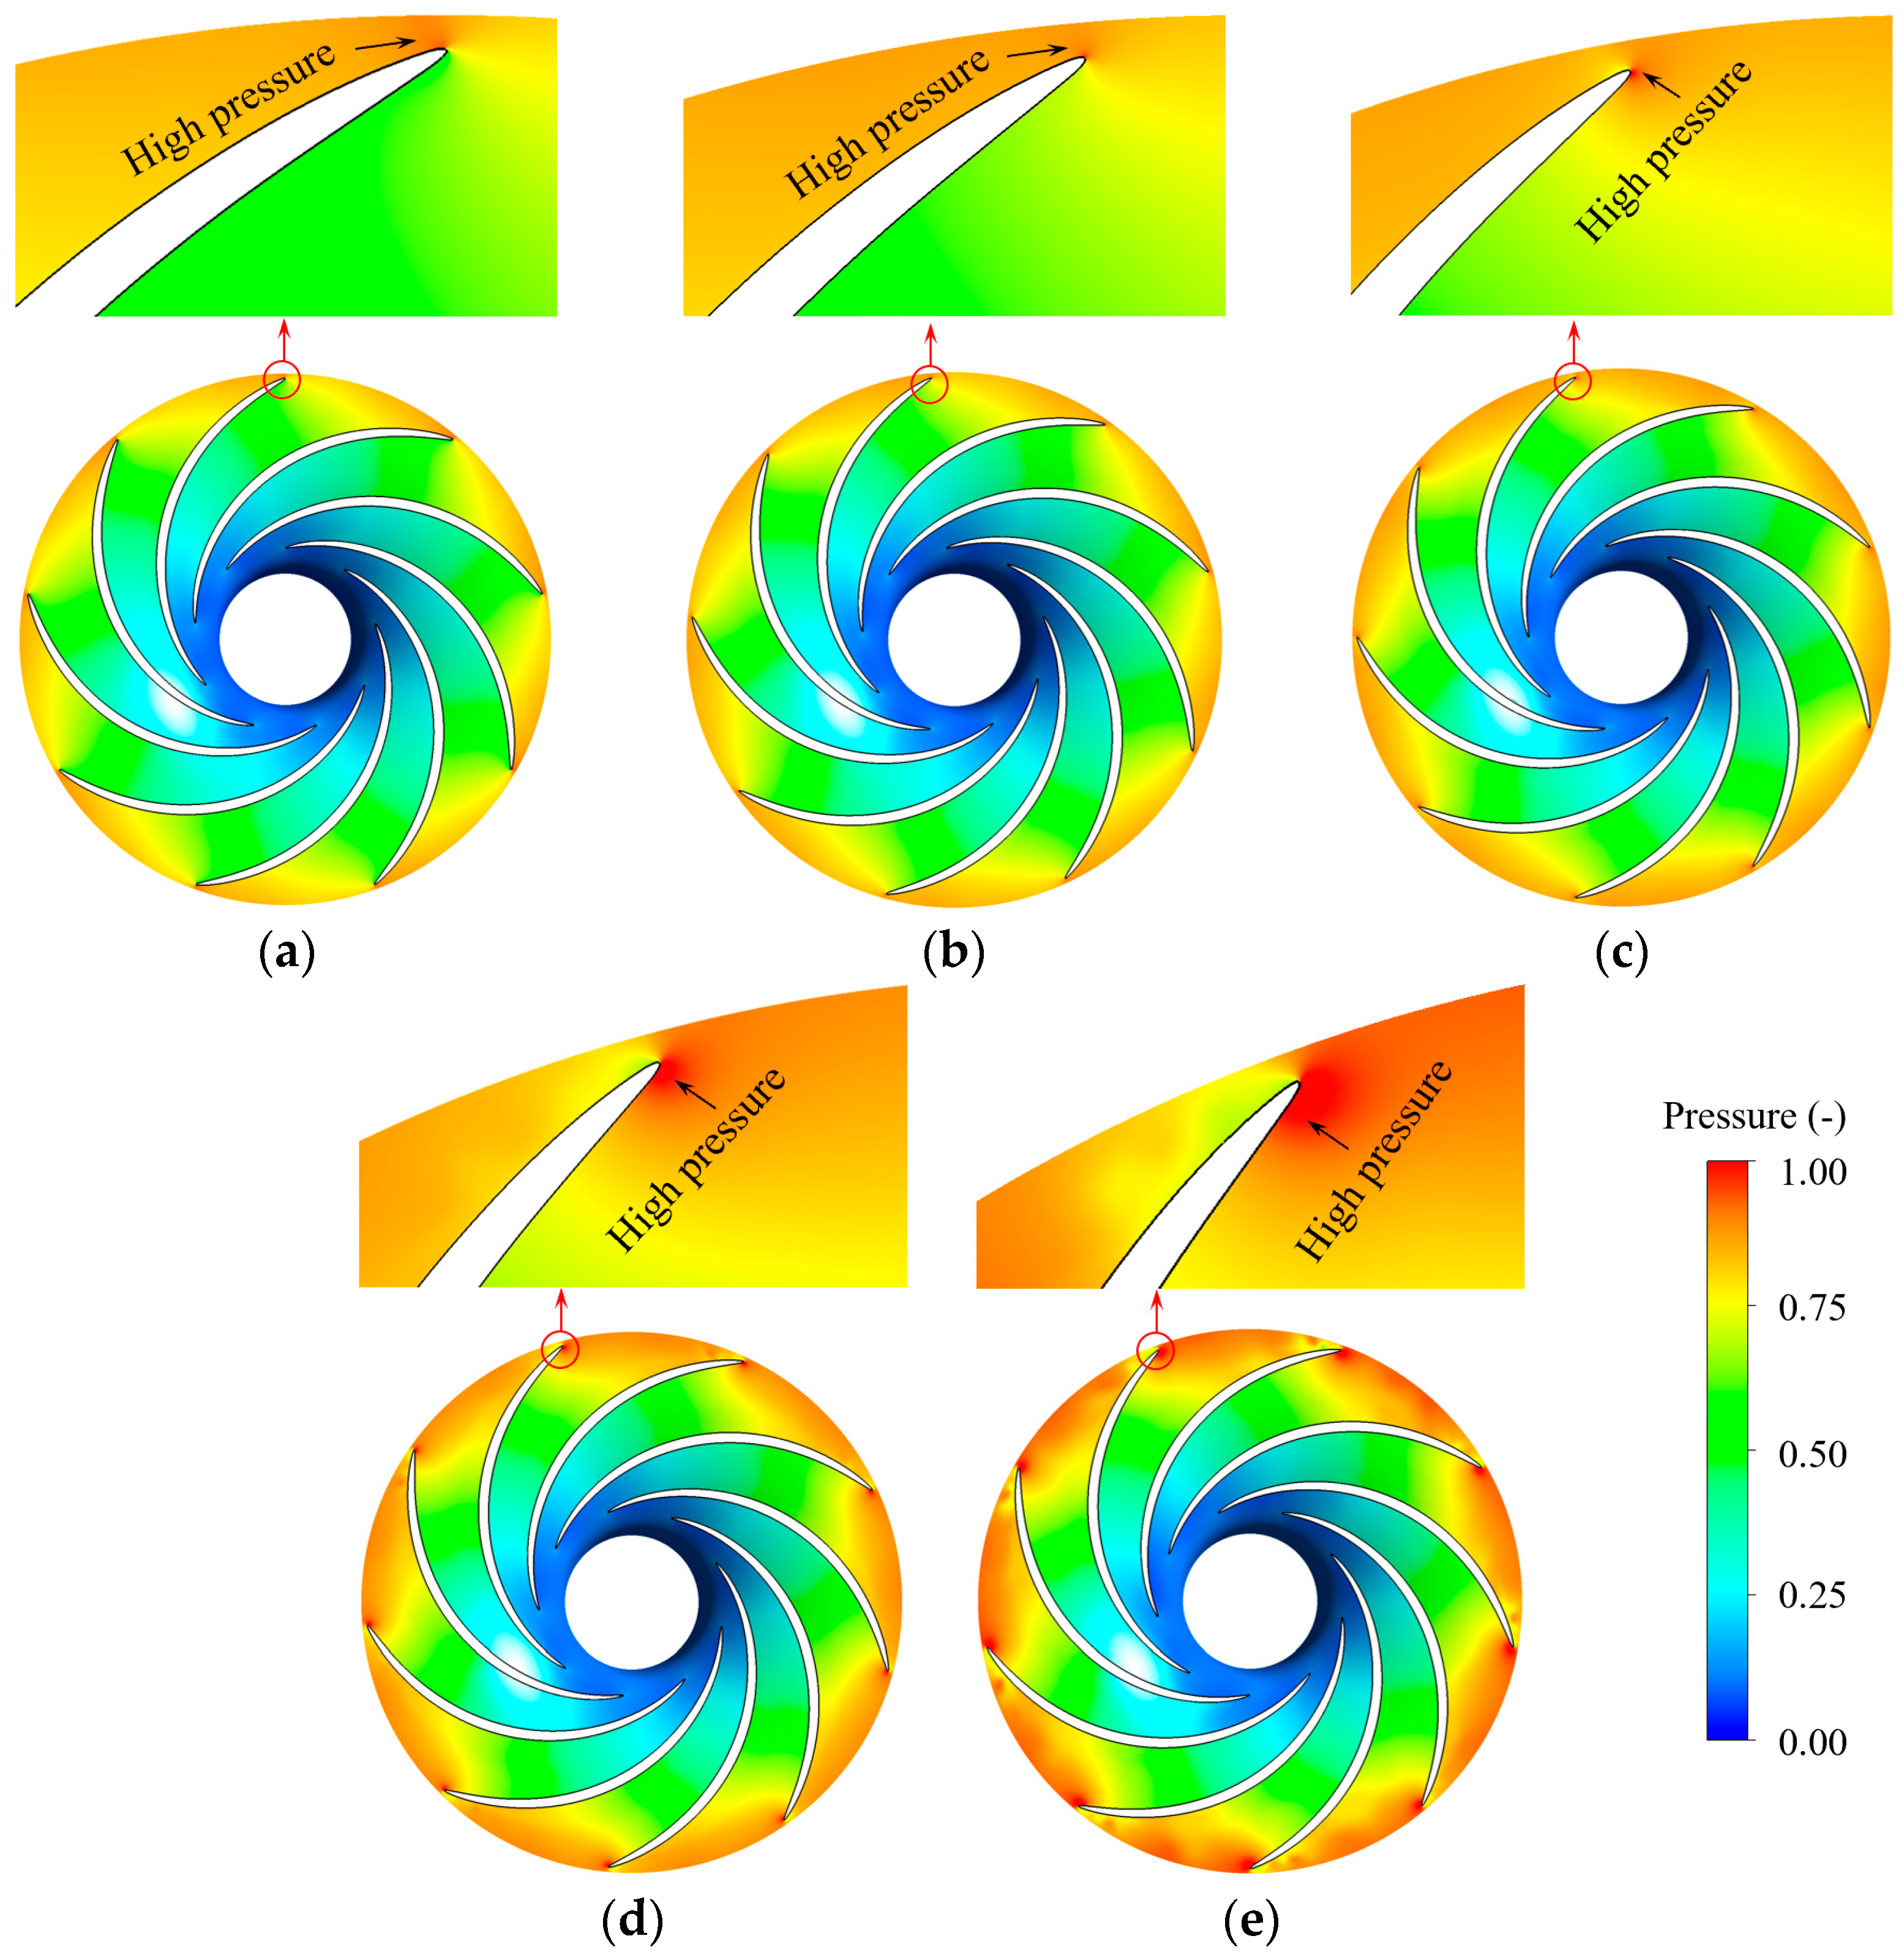
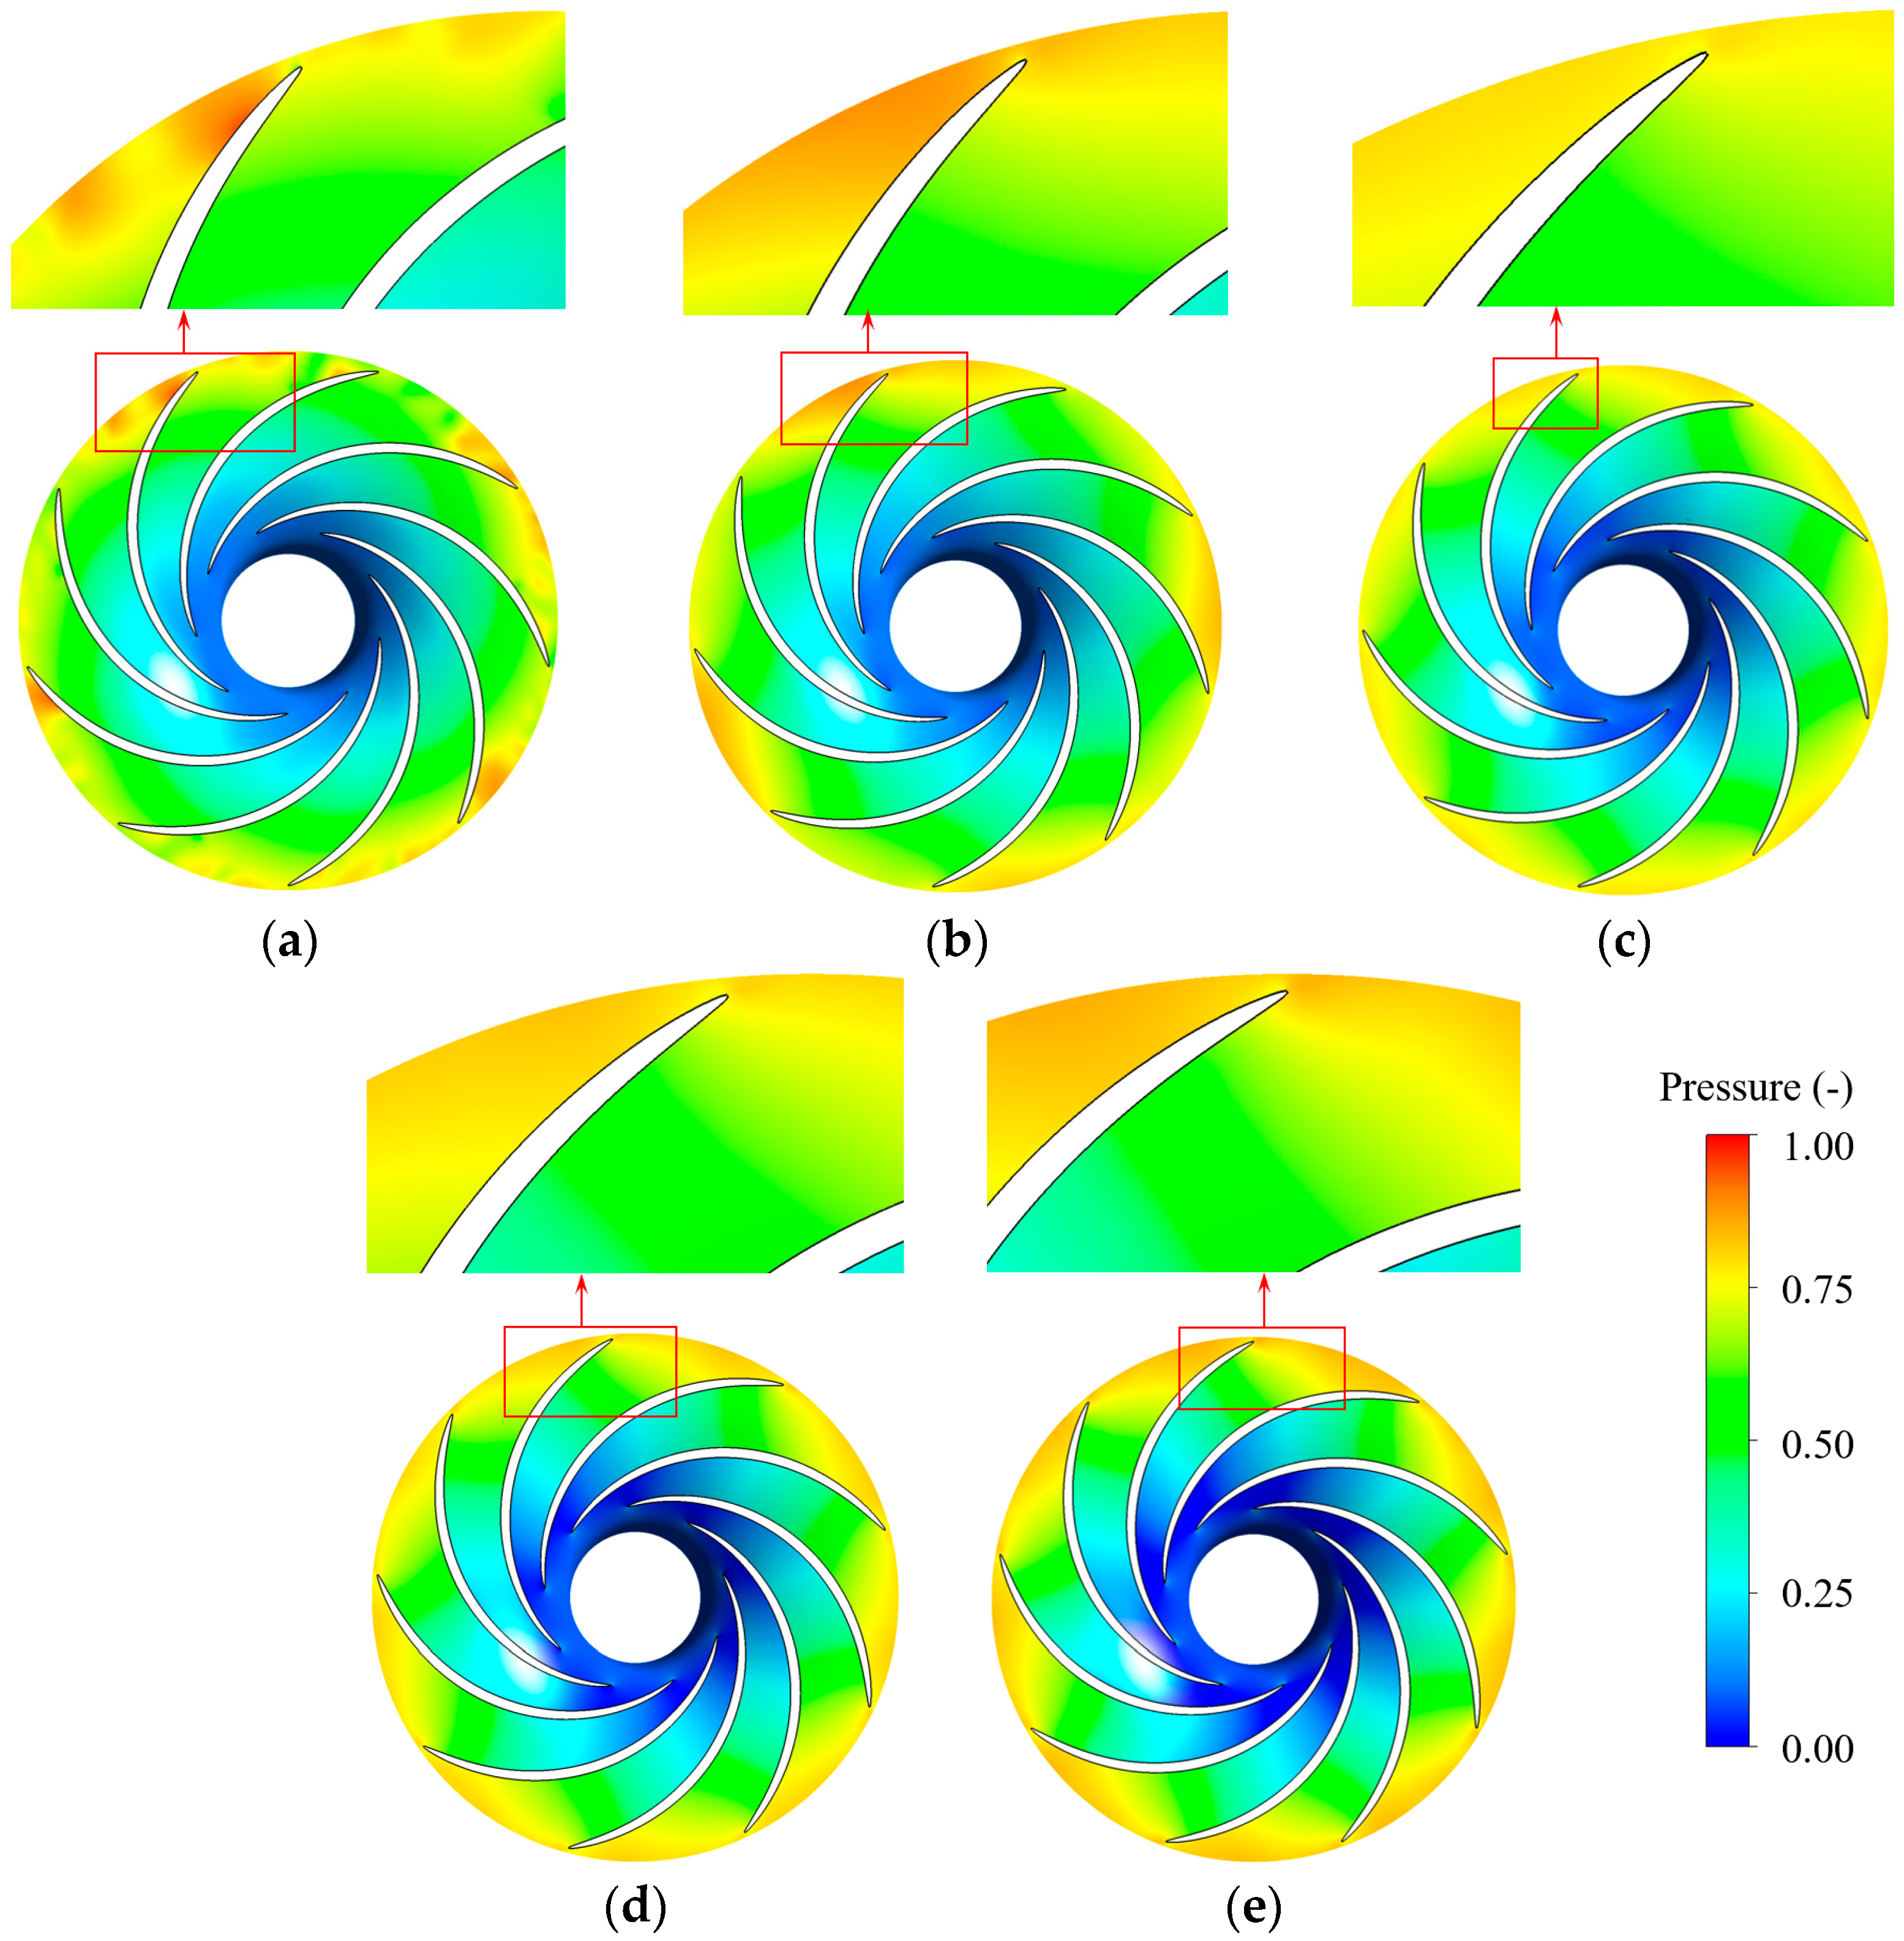
In order to further study the variation law of the pressure pulsation at the vaneless space, the flow patterns at the 0.5 Span in the runner region in each working condition were selected, and the pressure distribution was analyzed by enlarging the blade-leading edge. It is known from previous research that pressure pulsations at the vaneless space are greatly affected by the rotor–stator interaction, and the rotational speed affects the frequency and intensity of the rotor–stator interaction.
As a whole, the pressure distribution at the runner inlet has a significant difference with the change in the rotational speed, and the greater the rotational speed, the broader the high-pressure range. In particular, when the rotational speed is 0.90 nr (Figure 6a), the high-pressure region is concentrated at the side of the pressure surface, and when the rotational speed is 1.10 nr, the high-pressure region almost occupies the entire runner inlet. The reason for these differences is the change in the velocity triangle at the runner inlet.
At the blade-leading edge, when the rotational speed is at the rated one (Figure 6c), because the water enters the blade channels approximately along the blade bone line, and the impact intensity between the water and blade is small. Therefore, there is a slight low pressure on the pressure side, while a slight high pressure on the suction side, and the pressure on the suction side is higher than that on the pressure side. With the decrease in the rotational speed (Figure 6a,b), the water impact on blades is strengthened due to the change in flow incidence angle, and the low-pressure region at the blade-leading edge disappears. When the rotational speed increases (Figure 6d,e), the centrifugal force increases, and the flow capacity decreases. Therefore, the runner blade has a cutting effect on the water, resulting in greater pressure on the suction side than that in Case-T-1.00 nr, and a low-pressure region at the pressure side is generated, which is also consistent with the above-mentioned flow separation reasons (Figure 4d,e).
In general, the change in the rotational speed will lead to uneven distribution of pressure at the runner inlet, and especially the high pressure region at the blade-leading edge will change with the variation in the rotational speed, which indicates that the intensity of the impact between the water and blade is different in different conditions, and then the amplitude of pressure pulsation will be significantly different.
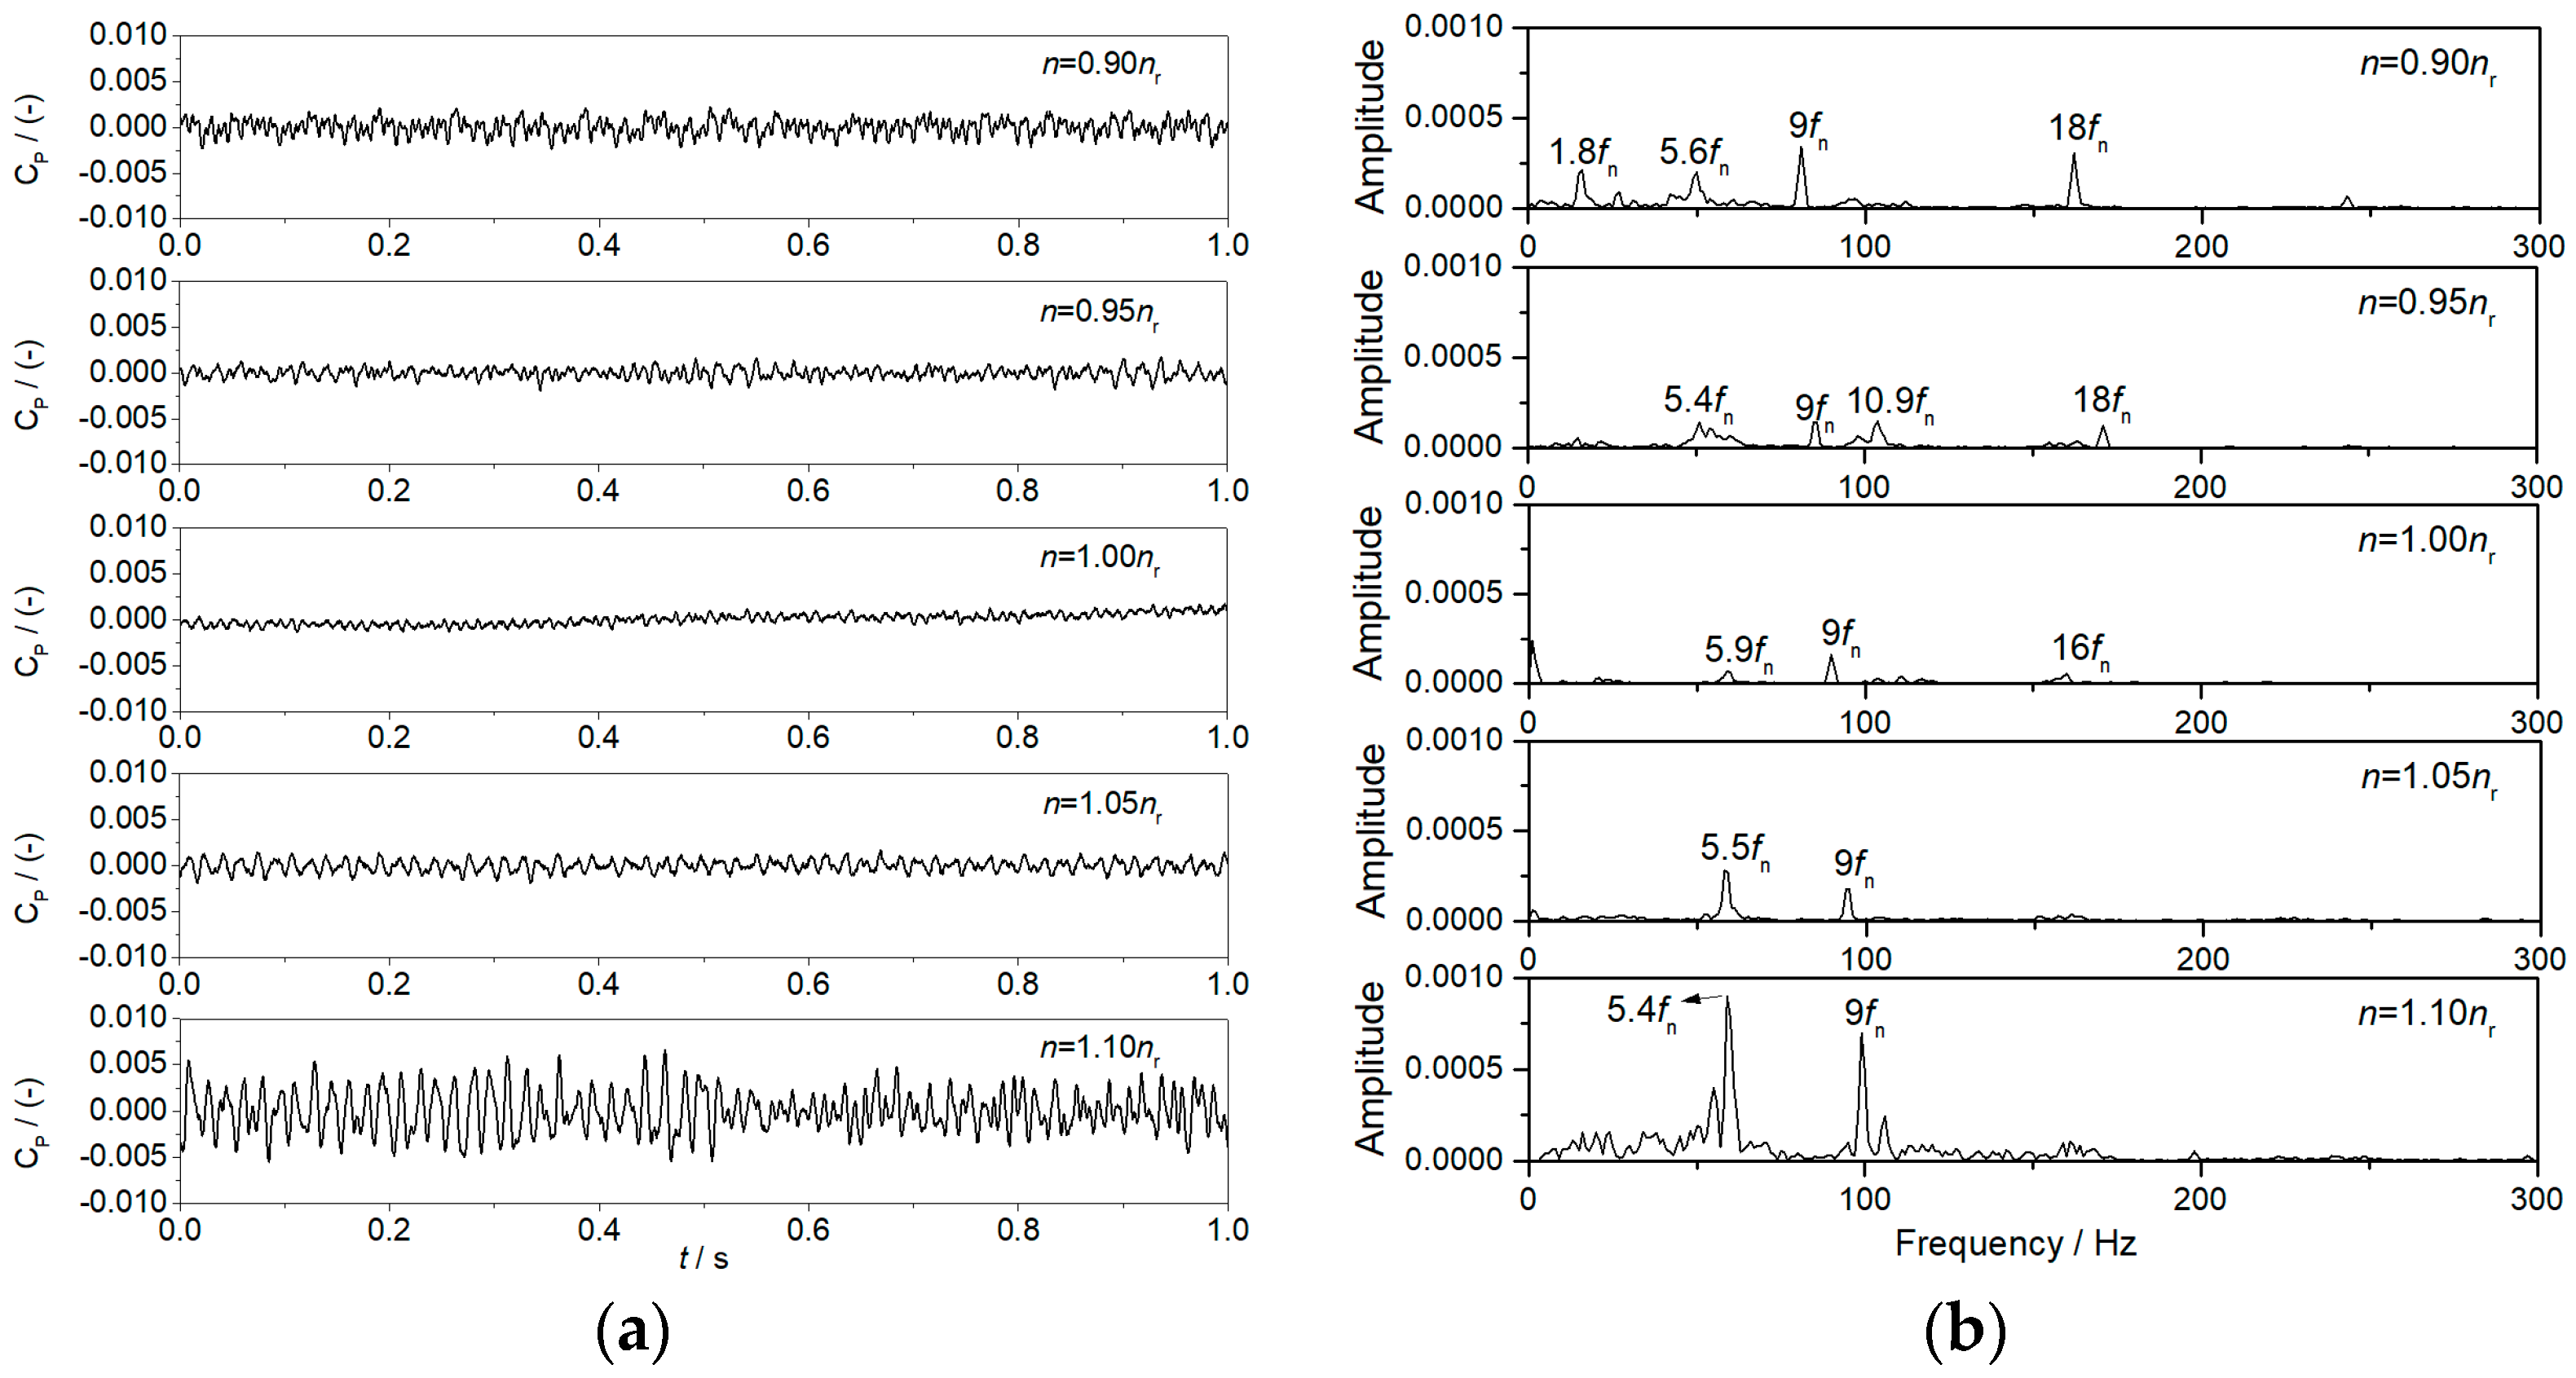
Time-domain and frequency-domain analysis are also used on the pressure pulsation in the draft tube. For the time-domain diagram (Figure 7a), the increase and decrease trends of pressure pulsations are similar to those at the vaneless space, namely, the amplitudes of pressure pulsations in the draft tube are the lowest in Case-T-1.00 nr and the largest in Case-T-1.10 nr, and pulsations in Case-T-1.10 nr are much higher than those in Case-T-0.90 nr. However, the characteristics of pressure pulsations in the draft tube are disorganized, unlike the obvious periodic laws in the vaneless space. For the frequency domain diagram, it can be seen that the pressure fluctuations exhibit rich frequency changes with the variation in the rotational speed. In Case-T-1.00 nr, the dominant frequency of pressure pulsations is the blade passing frequency (9fn), propagated downstream from the pressure pulsation at the vaneless space, accompanied by frequencies of 16fn and 5.9fn. However, these three frequencies are all low, indicating that the operating conditions are near the optimal region. When the rotational speed decreases to 0.95 nr, multiple frequency signals are generated, namely 5.4fn, 9fn, 10.9fn, and 18fn, with the highest amplitude corresponding to frequency 10.9fn. When the rotational speed decreases to 0.90 nr, 1.8fn, 5.6fn, 9fn, and 18fn signals occur, and the blade passing frequency (9fn) becomes the dominant one again. Also, the amplitudes of the other three frequencies significantly increase. For the working conditions with increasing rotational speed, including Case-T-1.05 nr and Case-T-1.10 nr, the frequencies 5.5fn and 5.4fn are the dominant frequencies, respectively. In addition, in Case-T-1.10 nr, the amplitudes of frequencies 5.4fn and 9fn are both the highest, leading to the large pressure pulsations in the draft tube.
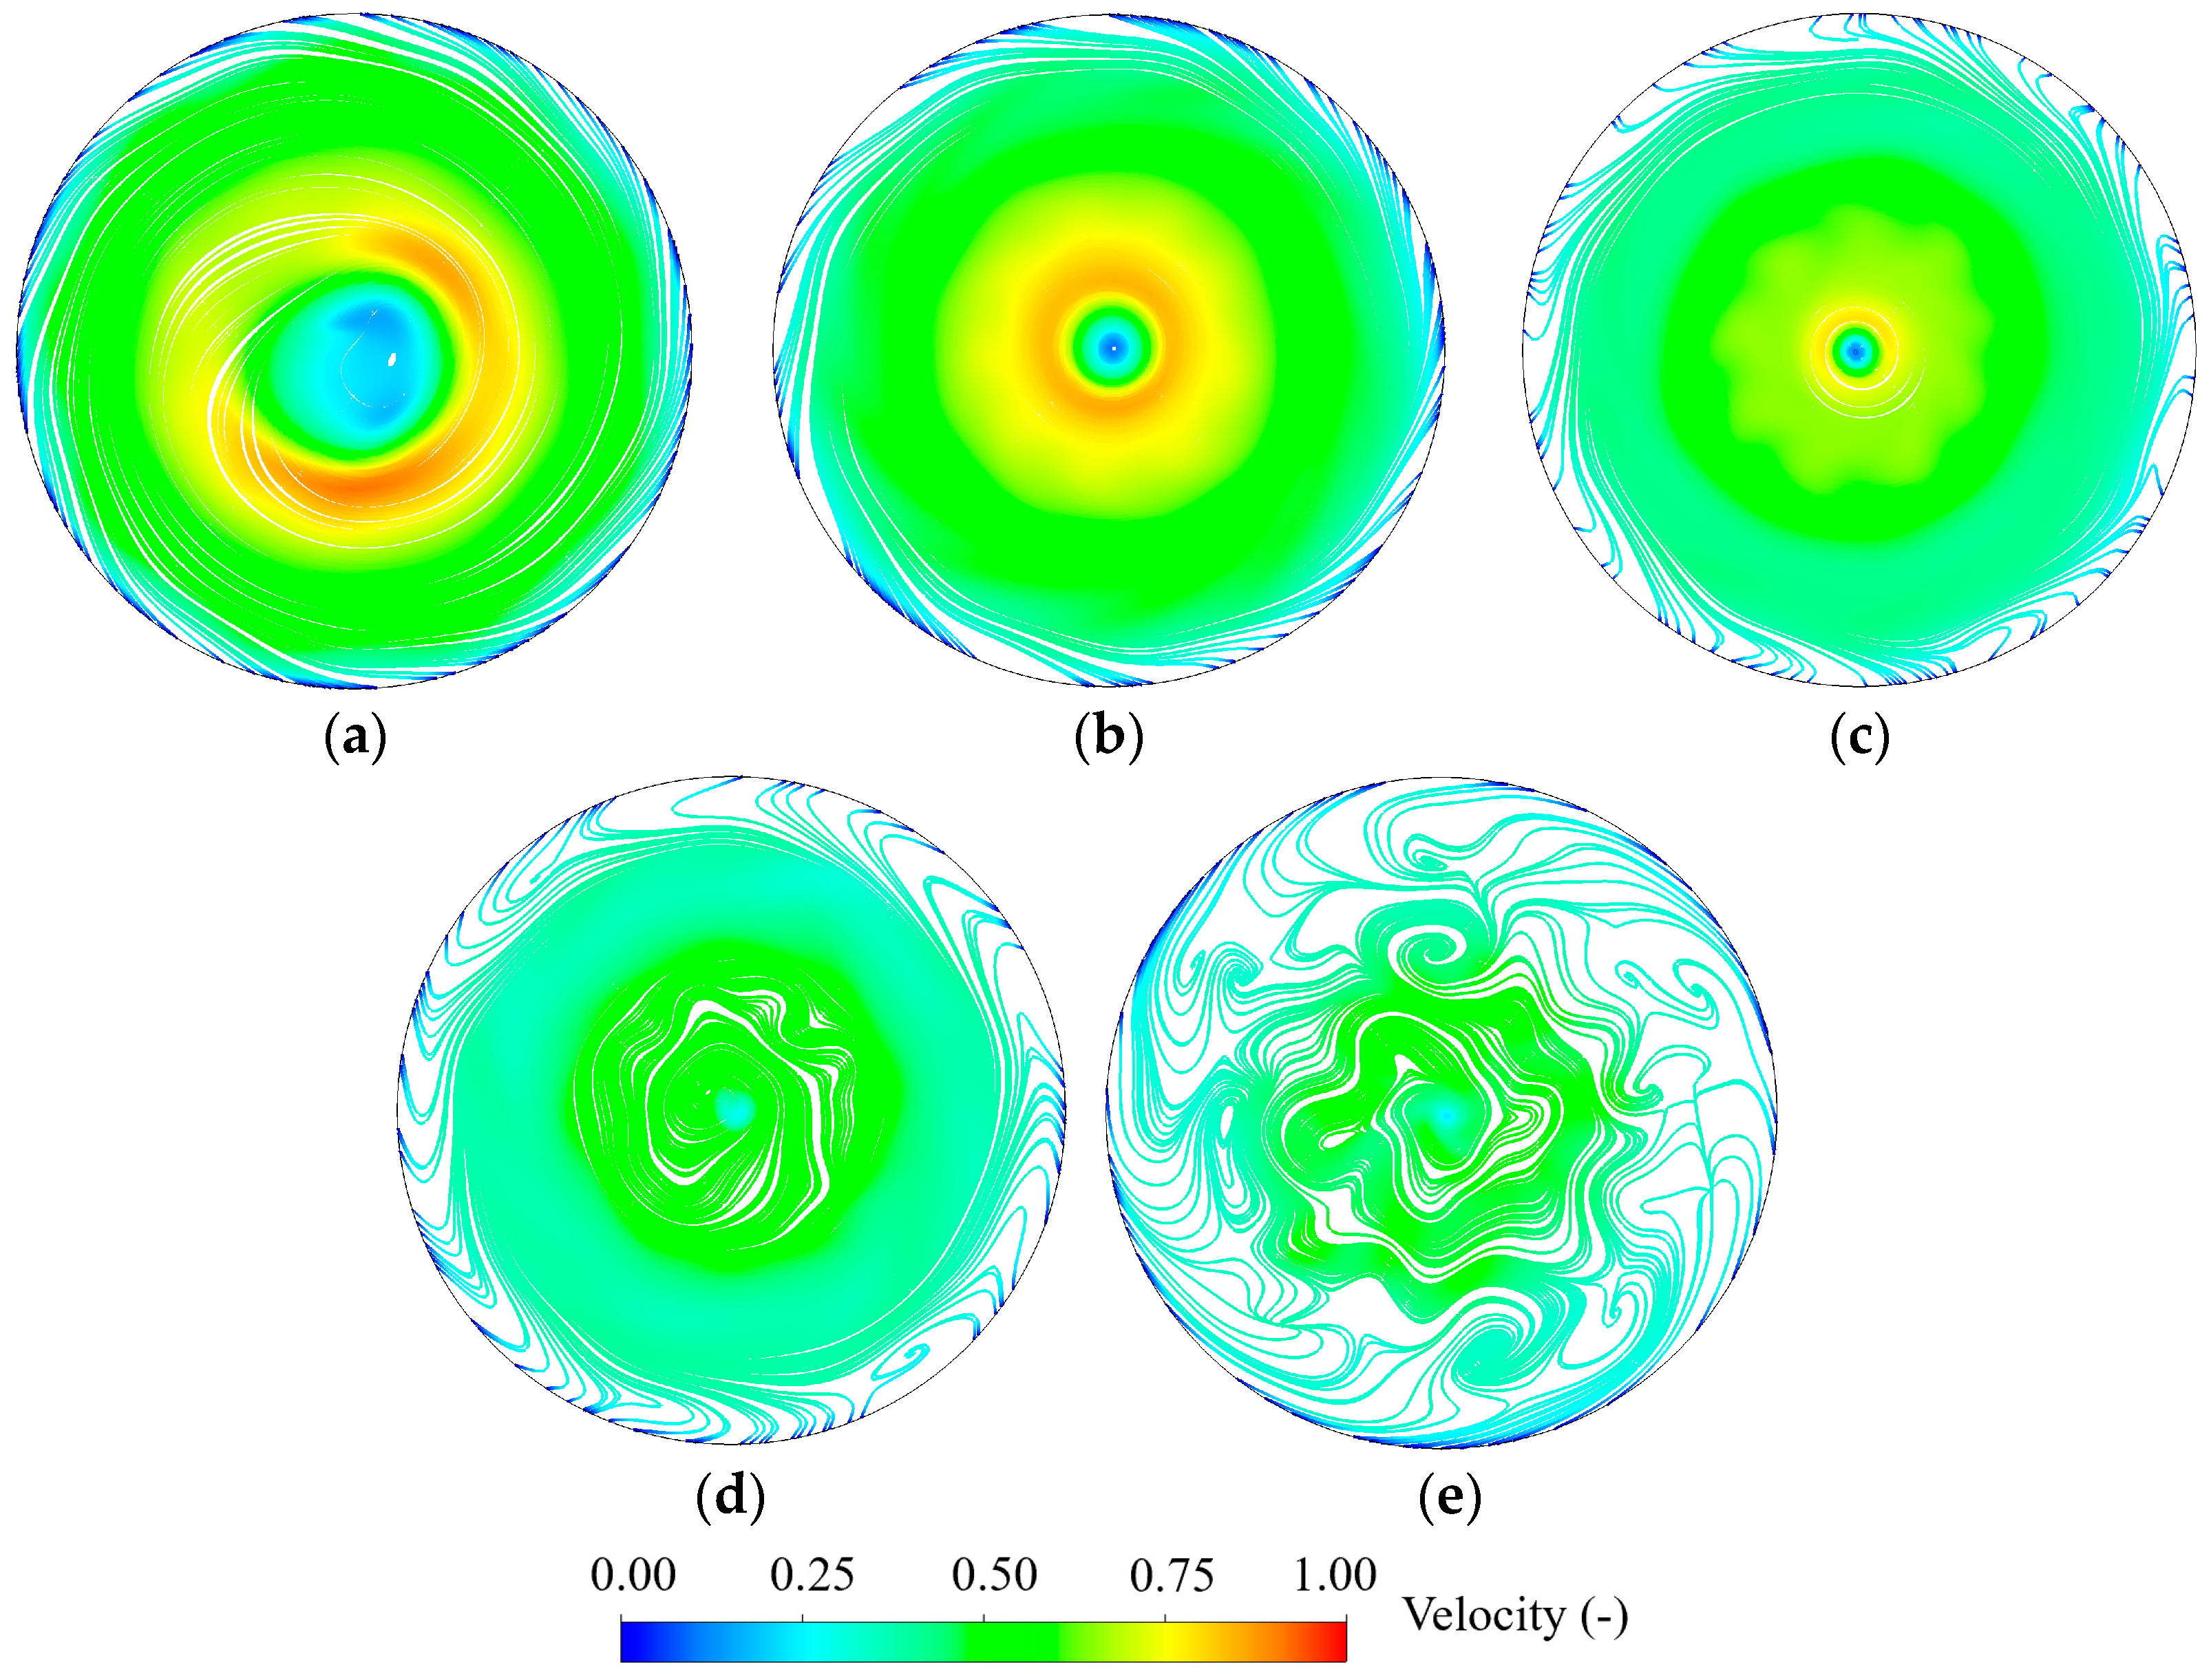
To investigate the reason for the relatively high amplitude corresponding to frequency 5.4fn in Case-T-1.10 nr, the flow patterns at the cross-section of the runner inlet are selected for each operating condition, as shown in Figure 8. By comparison, it can be seen that in the first three operating conditions, the flow patterns are relatively smooth, then the corresponding amplitudes are also low and can be almost ignored (Figure 7). When the rotational speed increases, especially in Case-T-1.10 nr, vortex structures appear with the disturbance of the runner blades, then a relatively high amplitude signal is generated, which is not present in Figure 4e. Of course, because these conditions are all near-optimal, the amplitudes are relatively low compared to those at the vaneless space.

3.2. The Results in the Pump Mode

3.2.1. Variations of Macro-Parameters in the Pump Mode

Table 3 shows the macro-parameters at five steady conditions in the pump mode. As the rotational speed increases, the torque (T), input (N), discharge (Q), and head (H) increase. In contrast, the head only changes slightly, while the input and discharge change significantly. These variations indicate that input regulation can be effectively carried out in the variable speed pump-turbine in the pump mode. Also, it can be seen that the efficiency is the highest at the rated rotational speed, reaching 90.64%. Then, when the rotational speed increases or decreases, the efficiency decreases.

3.2.2. Evolutions of Overall Flow Patterns in the Pump Mode

To investigate the internal flow pattern mechanism of the macro-parameter variations in the pump mode, which is affected by changing the rotational speeds, the same method mentioned in Section 3.1.2 was selected. It should be emphasized that in pump mode, the inlet of the runner is defined as the side close to the draft tube, while the outlet of the runner is defined as the side close to the guide vanes. Taking Case-P-1.00 nr as an example (Figure 9c), the direction of the outlet velocity V1 (pump mode) of the runner is inconsistent with the bone line of the guide vanes, and the flow at the outlet of the runner blades (pump mode) collides with the guide vanes. Therefore, there is an uneven distribution of velocity at the vaneless space, especially at the blade pressure side, where the flow velocity is relatively high, resulting in a certain head loss. At the inlet of the runner (pump mode), the direction of the absolute velocity W2 is almost along the blade bone line, then the flow patterns at the runner inlet (pump mode) are relatively smooth. In addition, the flow in the draft tube is mainly upward, with less circulation affected by the rotation of the runner.
Observing the two cases with rotational speed decreases (Figure 9a,b), because both the rotational speeds and discharge decrease simultaneously, and the decrease in amplitude of discharge is larger, the direction and magnitude of W2 and V1 are mainly controlled by discharge, which is significantly different from those in the turbine mode. For example, when the rotational speed drops to 0.95 nr, although there is a change in the direction of W2 at the runner inlet (pump mode), the effect on the flow patterns is still relatively small. The decrease of W1 at the runner outlet (pump mode) leads to a decrease in α1, then the direction of V1 gradually shifts towards the vaneless space, and the uneven distribution of flow velocity is strengthened, with a clear alternating distribution of high-velocity and low-velocity streamlines in the vane region. When the rotational speed further drops to 0.90 nr, the power of the pump is insufficient, and the flow is difficult to enter the vane region, generating unstable vortices throughout the vane and runner region. For example, the increase of β2 causes the water to collide with the pressure side of the blade inlet (pump mode) along the direction of W2, forming flow separations on the suction side, then part of the water flows back into the draft tube and forms vortex structures at the side wall (Figure 9a). In addition, when the decrease of α1 causes the main flow at the runner outlet (pump mode) along the direction of V1, then the flow disturbances occur at the vaneless space. Especially, the velocity difference between the high-velocity and low-velocity regions is significant, leading to the generation of stall vortices in the guide vane region.
The two working conditions with the rotational speed increase were shown in Figure 9d,e. At the runner inlet (pump mode), the value of W2 increases and the direction deviates from the pressure surface due to the discharge increase, resulting in the flow velocity increase at the suction side. Also, the increase of α1 at the runner outlet (pump mode) leads to the flow velocity increase in the vane region. Therefore, it can be seen that in Case-P-1.10 nr, because this operating condition has the largest rotational speed, the overall flow velocity in the vane and runner region is relatively higher, especially at the blade suction side, the blade-leading edge of the pressure side, and the middle of the guide vanes. Also, it should be noted that the increase in the rotational speed causes the low-velocity wake at the blade-leading edge at the runner outlet (pump mode), but the range is relatively small. In the draft tube, the increase in rotational speed has little effect on the flow patterns, and only the velocity increase occurs.
In general, when the rotational speed decreases, backflow vortices are generated in the taper pipe of the draft tube, and the separation vortices are generated in the runner blade passages. The non-uniformity of flow velocity at the vaneless space increases, while stall vortices are generated in the vane region due to the shearing effect. When the rotational speed increases, there are no obvious vortex structures generated, and the main change is reflected in the overall velocity increase.

3.2.3. Pressure Pulsations and Detail Flow Patterns in the Pump Mode

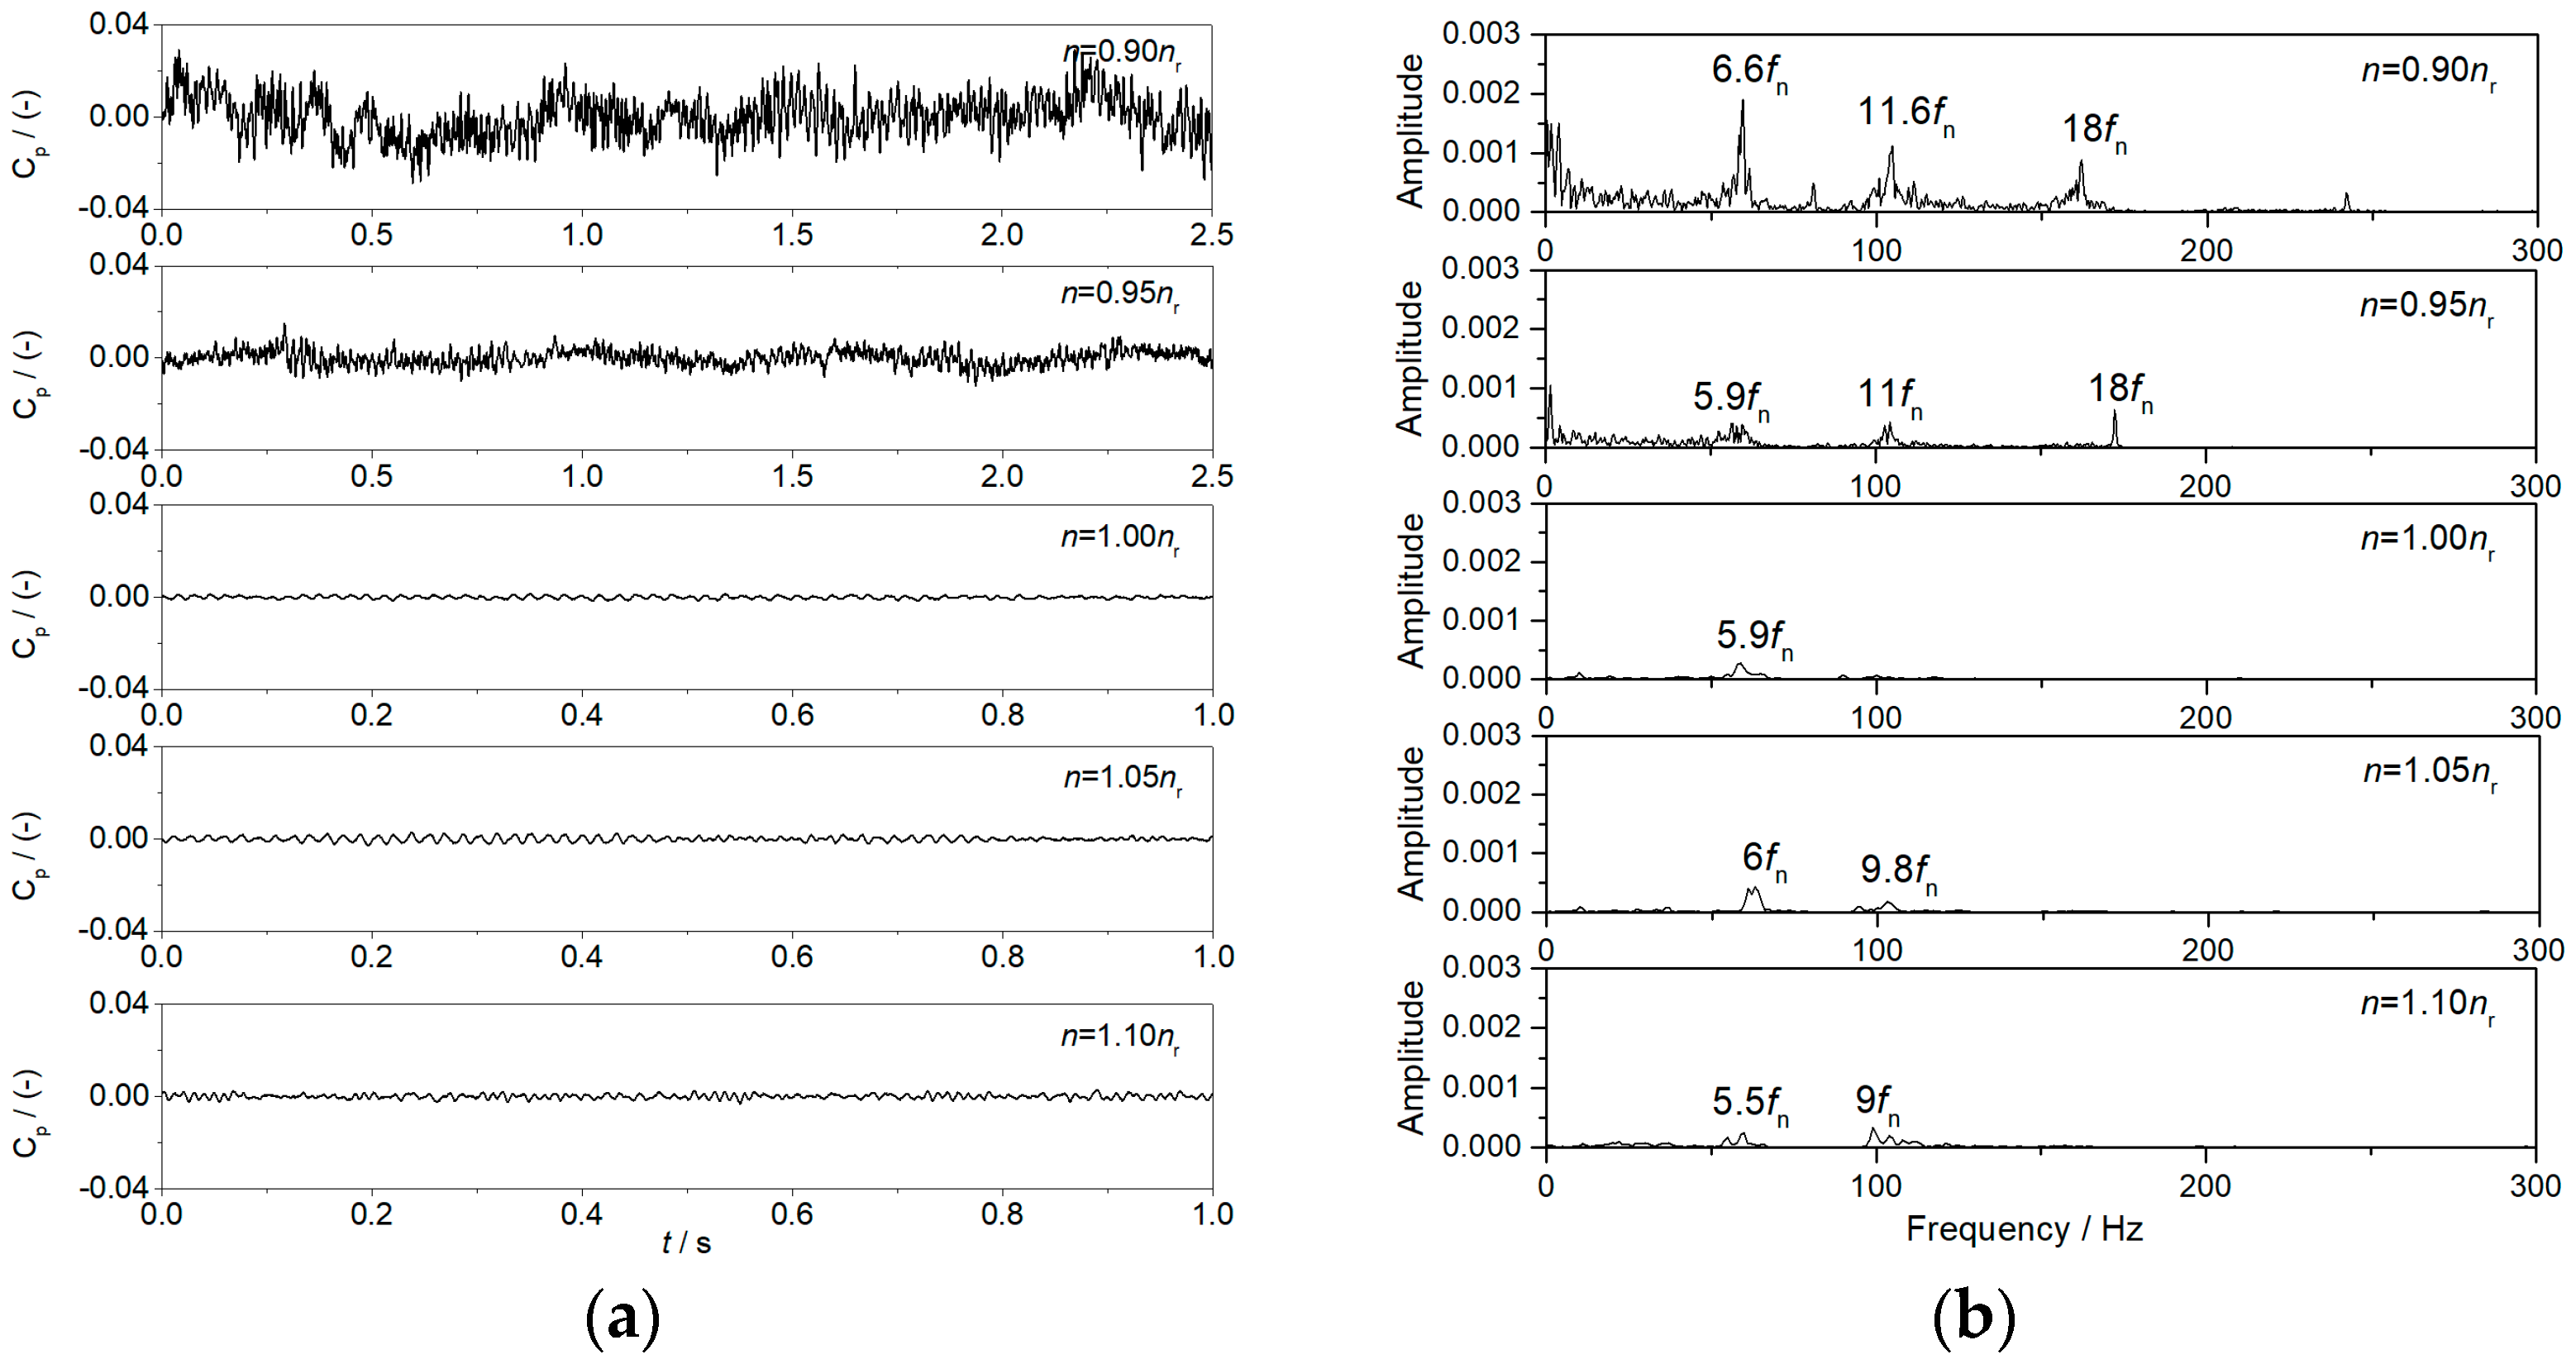
Due to the decrease in the rotational speed, the flow patterns become turbulent, and then the large amplitude and long fluctuation period of the pressure pulsations occur. In Case-P-0.90 nr and Case-P-0.95 nr, the results at the vaneless space within 2.5 s are selected, while in Case-P-1.00 nr, Case-P-1.05 nr, and Case-P-1.10 nr, the results within 1 s are enough to present the periodic characteristics. Firstly, from the time-domain diagram (Figure 10a), it can be seen that due to the smooth flow patterns and high efficiency at the operating point with the rated rotational speed mentioned above, the pressure fluctuation amplitude is low. When the rotational speed decreases, rotating stalls are generated, and pressure pulsations occur with high amplitude and a long fluctuation period. When the rotational speed increases, the amplitudes of pressure pulsation do not change significantly, which means that although the flow velocity increases after the rotational speed increases (Figure 9e), the effect on pressure pulsation is still very small.
A fast Fourier transform on the time-domain values of the five operating conditions in the pump mode was conducted (Figure 10b). Overall, the amplitudes of pressure pulsations are still dominated by the blade passing frequency (9fn), while the other harmonics are relatively low. When the rotational speed is at the rated one, the amplitude corresponding to the blade passing frequency is only 0.00595. When the speed decreases to 0.95 nr, the amplitude of the frequency 9fn decreases to 0.005, and chaotic low-frequency signals are generated, but the amplitude is relatively low. When the speed further decreases to 0.90 nr, the pressure pulsation amplitudes corresponding to each frequency increase, with the amplitude of frequency 9fn reaching 0.0093, which is more than 1.5 times than that in Case-P-1.00 nr. When the rotational speed increases to 1.05 nr and 1.10 nr, the amplitudes of the frequency 9fn do not change significantly, with 0.00551 and 0.00538 in Case-P-1.05 nr and Case-P-1.10 nr, respectively. For the high frequency amplitudes, only a certain degree increases in Case-P-1.10 nr.
Similarly, in the turbine mode, the surfaces at 0.5 span in the runner region for each operating condition were selected, and the blade-leading edge was amplified to analyze the pressure distribution (Figure 11). Firstly, overall, compared to the results in the turbine mode, the pressure distribution at the runner outlet (pump mode) is less affected by the changes in the rotational speed. However, it should still be noted that the lower the rotational speed, the more uneven the pressure distribution, and the greater the pressure difference at the runner blade-leading edge. Especially, in Case-P-0.90 nr (Figure 11a), the range of the high-pressure region decreases and concentrates at the pressure side, corresponding to the unstable streamline distributions in Figure 9a. On the other hand, the higher the rotational speed, the larger and more evenly distributed high-pressure range occupies the entire runner outlet (pump mode).
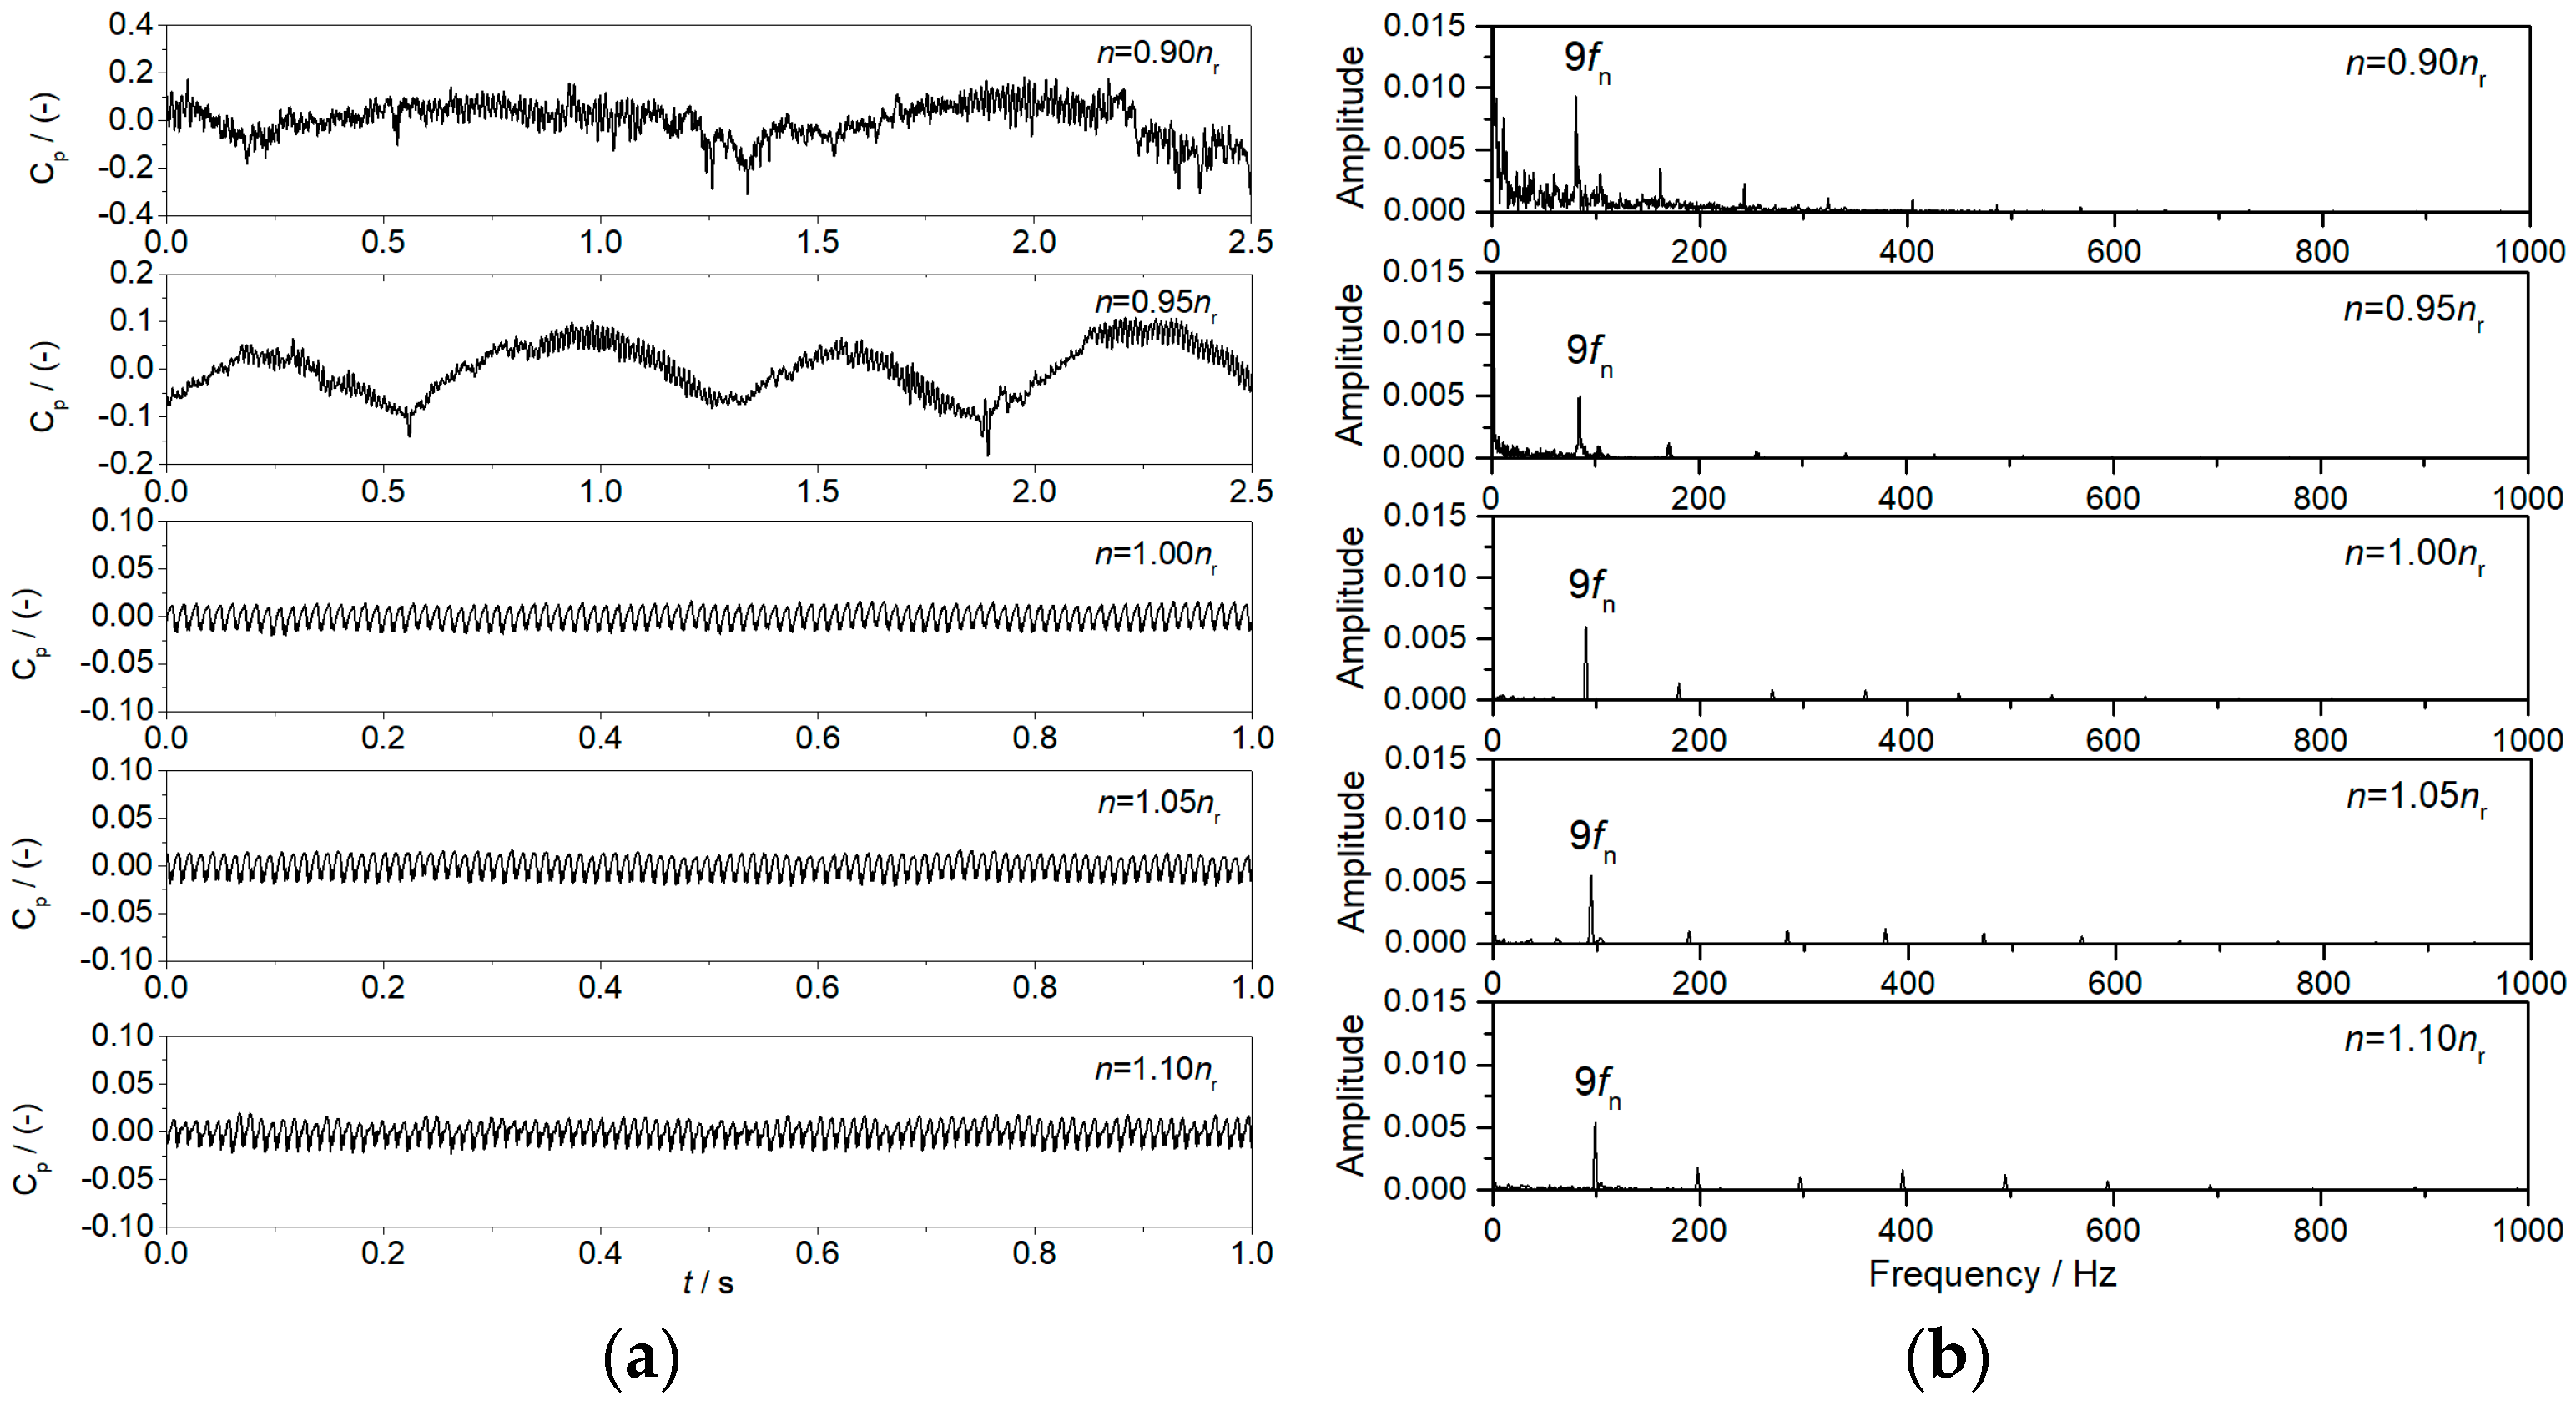
The time-domain and frequency-domain characteristics of pressure pulsations in the draft tube in the pump mode are shown in Figure 12. In the time-domain diagram (Figure 12a), the pressure fluctuation amplitudes in the conditions with low rotational speeds are higher, and especially the amplitudes in Case-P-0.90 nr are much larger than those in Case-P-0.95 nr, which may be induced by the vortex structures in the draft tube in Figure 9a. However, compared to the results at the vaneless space, the amplitudes of the low-frequency pressure signals in the draft tube in all conditions are lower. On the other hand, when the rotational speed increases, the amplitude in the draft tube changes very slightly. In the frequency domain diagram, the dominant frequency of each operating condition is not the blade passing frequency, and the amplitudes of all the frequency signals are very low and can even be ignored, indicating that the pressure in the draft tube is less affected by the rotor–stator interaction in these cases.
To further explore the evolution mechanism of the rotating stalls and the low-frequency pressure in the pump mode, the flow patterns in the guide vane and runner regions from 1.0 s to 1.1 s were selected, as shown in Figure 13. Taking the flow patterns at 1.0 s as an example (Figure 13a), four low-velocity regions are distributed along the circumferential direction in the vane region and are present in the form of vortex structures. At the vaneless space, four high-velocity regions are distributed adjacent to the low-velocity vortex structures. The reason is that when the high-velocity flow at the runner outlet (pump mode) impacts the flow in the vane region, a strong shear effect is formed, resulting in rich vortex structures. In the blade passages, low-velocity vortices almost attach to the suction surface of each blade. As the runner rotates, the vortex structures in various parts begin to change and move, and they nearly pass through a vane passage in a counterclockwise direction from 1.0 s to 1.1 s. Therefore, in Case-P-0.90 nr, pressure pulsations vary with the shape and position of the vortex structures, exhibiting a low-frequency and high-amplitude characteristic.

4. Conclusions

This paper conducted the simulations on the steady conditions under a certain guide vane opening with different rotational speeds of a variable speed pump-turbine, investigated the internal and external characteristics in the turbine and pump modes, and the main conclusions are as follows:
(1)
The rotational speed changes in turbine mode have relatively small effects on output, discharge, and head, and these parameters decrease with the increase in the rotational speed, except that the head remains almost constant. The speed changes in pump mode have significant effects on input, discharge, and head, and these parameters increase with the increase in the rotational speed.
(2)
The rotational speed changes greatly affect the shape of the velocity triangle at the runner inlet and outlet, leading to different forms of vortex structures in the vane region, runner region, and draft tube, such as rotating stalls, low-velocity vortices, and backflows, accompanied by an amplitude increase in pressure pulsations.
(3)
This paper only analyzed the different rotational speed conditions near the optimal operating points; further investigations based on the combinations of different guide vane openings, head, output, or input can be conducted in future research.

Author Contributions

Conceptualization, Z.Y. and C.C.; methodology, Z.Y. and X.H.; validation, B.Z.; data curation, J.F.; writing—original draft preparation, Z.Y. and C.C.; writing—review and editing, C.L. and B.Z.; visualization, C.L. and X.H. All authors have read and agreed to the published version of the manuscript.

Funding

This research was funded by the Science and Technology Project of PowerChina HuaDong Engineering Corporation Limited (Grant No. KY2025-JD-02-01).

Data Availability Statement

The original contributions presented in this study are included in the article. Further inquiries can be directed to the corresponding author.

Conflicts of Interest

Authors Zhiyan Yang, Chunjian Cao, Jie Fang, Baoyong Zhang and Chengjun Li were employed by the company PowerChina HuaDong Engineering Corporation Limited. The remaining author declares that the research was conducted in the absence of any commercial or financial relationships that could be construed as a potential conflict of interest. The authors declare that this study received funding from PowerChina HuaDong Engineering Corporation Limited. The funder was not involved in the study design, collection, analysis, interpretation of data, the writing of this article or the decision to submit it for publication.

References

  1. Xia, L. Mechanism of the S-Shaped Characteristics and the Flow-Induced Dynamic Instability of Pump-Turbines. Ph.D. Thesis, Wuhan University, Wuhan, China, 2017. (In Chinese). [Google Scholar]
  2. Wang, H.; Wang, J.; Gong, R.; Shang, C.; Li, D.; Wei, X. Investigations on Pressure Fluctuations in the S-Shaped Region of a Pump–Turbine. Energies 2021, 14, 6683. [Google Scholar] [CrossRef]
  3. Zhang, F.; Chen, Z.; Han, S.; Zhu, B. Study on the Unsteady Flow Characteristics of a Pump Turbine in Pump Mode. Processes 2024, 12, 41. [Google Scholar] [CrossRef]
  4. Hu, D.; Cheng, Y.; Zhang, P.; Wang, X.; Ding, J.; Zhang, X. Distribution Features of Flow Patterns and Pressure Pulsations of Pump-Turbine in Five Operating Modes on the Four-Quadrant Plane. Front. Energy Res. 2022, 10, 880293. [Google Scholar] [CrossRef]
  5. Yang, X.; Lian, J.; Zhang, Z.; Zeng, Y. Theoretical Analysis of the Attenuation Characteristics of High-Frequency Pressure Vibration in Pumped Storage Power Station. J. Energy Storage 2023, 72, 108341. [Google Scholar] [CrossRef]
  6. Iliev, I.; Trivedi, C.; Dahlhaug, O.G. Variable-Speed Operation of Francis Turbines: A Review of the Perspectives and Challenges. Renew. Sustain. Energy Rev. 2019, 103, 109–121. [Google Scholar] [CrossRef]
  7. Zhao, Z.; Yang, J.; Dong, X.; Chen, M.; Peng, Y.; Yang, J. No-load Characteristics and Variable Speed Evolution of Doubly-fed Pumped Storage Unit Based on Dynamic Experiment Platform. Zhongguo Dianji Gong-Cheng Xuebao/Proc. Chin. Soc. Electr. Eng. 2022, 42, 7439–7450. (In Chinese) [Google Scholar] [CrossRef]
  8. Kou, P.; Zhu, G. Simulation Study of Variable Speed Hydraulic Turbine Operation in Load Adjusting Conditions. Shuili Fadian Xuebao/J. Hydroelectr. Eng. 2022, 41, 87–97. (In Chinese) [Google Scholar] [CrossRef]
  9. Zhang, T.; Wang, H.; Qin, D. Features of Pump Condition Selection for Variable Speed Pump-Turbine. Large Electr. Mach. Hydraul. Turbine 2020, 2, 65–69. (In Chinese) [Google Scholar]
  10. Rode, B.R.; Kumar, A. Unstable Pressure Fluctuations in the Vaneless Space of High-Head Reversible Pump-Turbines—A Systematic Review. J. Energy Storage 2023, 72, 108397. [Google Scholar] [CrossRef]
  11. Hasmatuchi, V.; Farhat, M.; Roth, S.; Botero, F.; Avellan, F. Experimental Evidence of Rotating Stall in a Pump-Turbine at off-Design Conditions in Generating Mode. J. Fluids Eng. Trans. ASME 2011, 133, 051104. [Google Scholar] [CrossRef]
  12. Liu, D.M.; Ma, L.B.; Li, N.; Zhao, Y.Z.; Cheng, H. Experimental Research on Flow Field of High Head Pump Turbine Based on PIV Test. IOP Conf. Ser. Earth Environ. Sci. 2021, 627, 012016. [Google Scholar] [CrossRef]
  13. Sun, H.; Xiao, R.; Wang, F.; Xiao, Y.; Liu, W. Analysis of the Pump-Turbine s Characteristics Using the Detached Eddy Simulation Method. Chin. J. Mech. Eng. 2015, 28, 115–122. [Google Scholar] [CrossRef]
  14. Xia, L.; Cheng, Y.; You, J.; Zhang, X.; Yang, J.; Qian, Z. Mechanism of the S-Shaped Characteristics and the Runaway Instability of Pump-Turbines. J. Fluids Eng. Trans. ASME 2017, 139, 031101. [Google Scholar] [CrossRef]
  15. Xiao, W.; Gui, Z.; Lu, Z.; Xiao, R.; Tao, R. Pressure Pulsation of Pump Turbine at Runaway Condition Based on Hilbert Huang Transform. Front. Energy Res. 2024, 12, 1344676. [Google Scholar] [CrossRef]
  16. Kirschner, O.; Ruprecht, A.; Göde, E.; Riedelbauch, S. Dynamic Runner Forces and Pressure Fluctuations on the Draft Tube Wall of a Model Pump-Turbine. IOP Conf. Ser. Earth Environ. Sci. 2016, 49, 082022. [Google Scholar] [CrossRef]
  17. Liu, D.M.; Zhao, Y.Z.; Zuo, Z.G. Experimental Research on Flow Field in the Draft Tube of Pump Turbines Based on LDV. IOP Conf. Ser. Earth Environ. Sci. 2019, 240, 072030. [Google Scholar] [CrossRef]
  18. Pang, S.; Zhu, B.; Shen, Y.; Chen, Z. Study on Cavitating Vortex Rope Characteristics of Reversible Pump-Turbine under Part Load Turbine Condition. Phys. Fluids 2023, 35, 085131. [Google Scholar] [CrossRef]
  19. Li, D.; Wang, H.; Xiang, G.; Gong, R.; Wei, X.; Liu, Z. Unsteady Simulation and Analysis for Hump Characteristics of a Pump Turbine Model. Renew Energy 2015, 77, 32–42. [Google Scholar] [CrossRef]
  20. Xia, L.S.; Cheng, Y.G.; Zhang, X.X.; Yang, J.D. Numerical Analysis of Rotating Stall Instabilities of a Pump-Turbine in Pump Mode. IOP Conf. Ser. Earth Environ. Sci. 2014, 22, 032020. [Google Scholar] [CrossRef]
  21. Lv, Y.; Li, S.; Wang, Z.; Zhou, L. Study on Pump Mode Cavitation Characteristic of Variable Speed Pump Turbine. Phys. Fluids 2023, 35, 065111. [Google Scholar] [CrossRef]
  22. Shang, L.; Cao, J.; Jia, X.; Yang, S.; Li, S.; Wang, L.; Wang, Z.; Liu, X. Effect of Rotational Speed on Pressure Pulsation Characteristics of Variable-Speed Pump Turbine Unit in Turbine Mode. Water 2023, 15, 609. [Google Scholar] [CrossRef]
  23. Rode, B.R.; Kumar, A.; Segoufin, C.; Laurant, Y. Numerical Study of Pressure Fluctuation in Vaneless Space of Variable Speed Reversible Pump-Turbine in Turbine Mode at Maximum Head. IOP Conf. Ser. Earth Environ. Sci. 2024, 1411, 012028. [Google Scholar] [CrossRef]
  24. Shang, L.; Cao, J.; Wang, Z.; Liu, X. Hydraulic Characterization of Variable-Speed Pump Turbine under Typical Pumping Modes. Processes 2023, 11, 2903. [Google Scholar] [CrossRef]
  25. Wang, Z.; Wang, L.; Yu, S.; Li, S. Research on the Flow Characteristics in the Gap of a Variable-Speed Pump-Turbine in Pump Mode. Processes 2024, 12, 1424. [Google Scholar] [CrossRef]
  26. Shi, G.; Li, B.; Xiao, Y.; Tang, M.; Yang, X. Effect of Speed Linear Decrease on Internal Flow Characteristics and Pressure Pulsations of Variable-Speed Pump Turbine in Turbine Mode. J. Mar. Sci. Eng. 2024, 12, 2243. [Google Scholar] [CrossRef]
  27. Luo, X.; Chen, M.; Zhu, G.; Feng, J. Transient Characteristics Analysis in Variable-Speed Process of Pump-Turbine Based on Rothalpy Change and Vortex Method. Sustain. Energy Technol. Assess. 2025, 76, 104310. [Google Scholar] [CrossRef]
  28. Qin, Y.; Li, D.; Wang, H.; Liu, Z.; Wei, X.; Wang, X. Multi-Objective Optimization Design on High Pressure Side of a Pump-Turbine Runner with High Efficiency. Renew. Energy 2022, 190, 103–120. [Google Scholar] [CrossRef]
  29. Yang, Z.; Cheng, Y.; Xia, L.; Meng, W.; Liu, K.; Zhang, X. Evolutions of Flow Patterns and Pressure Fluctuations in a Prototype Pump-Turbine during the Runaway Transient Process after Pump-Trip. Renew. Energy 2020, 152, 1149–1159. [Google Scholar] [CrossRef]
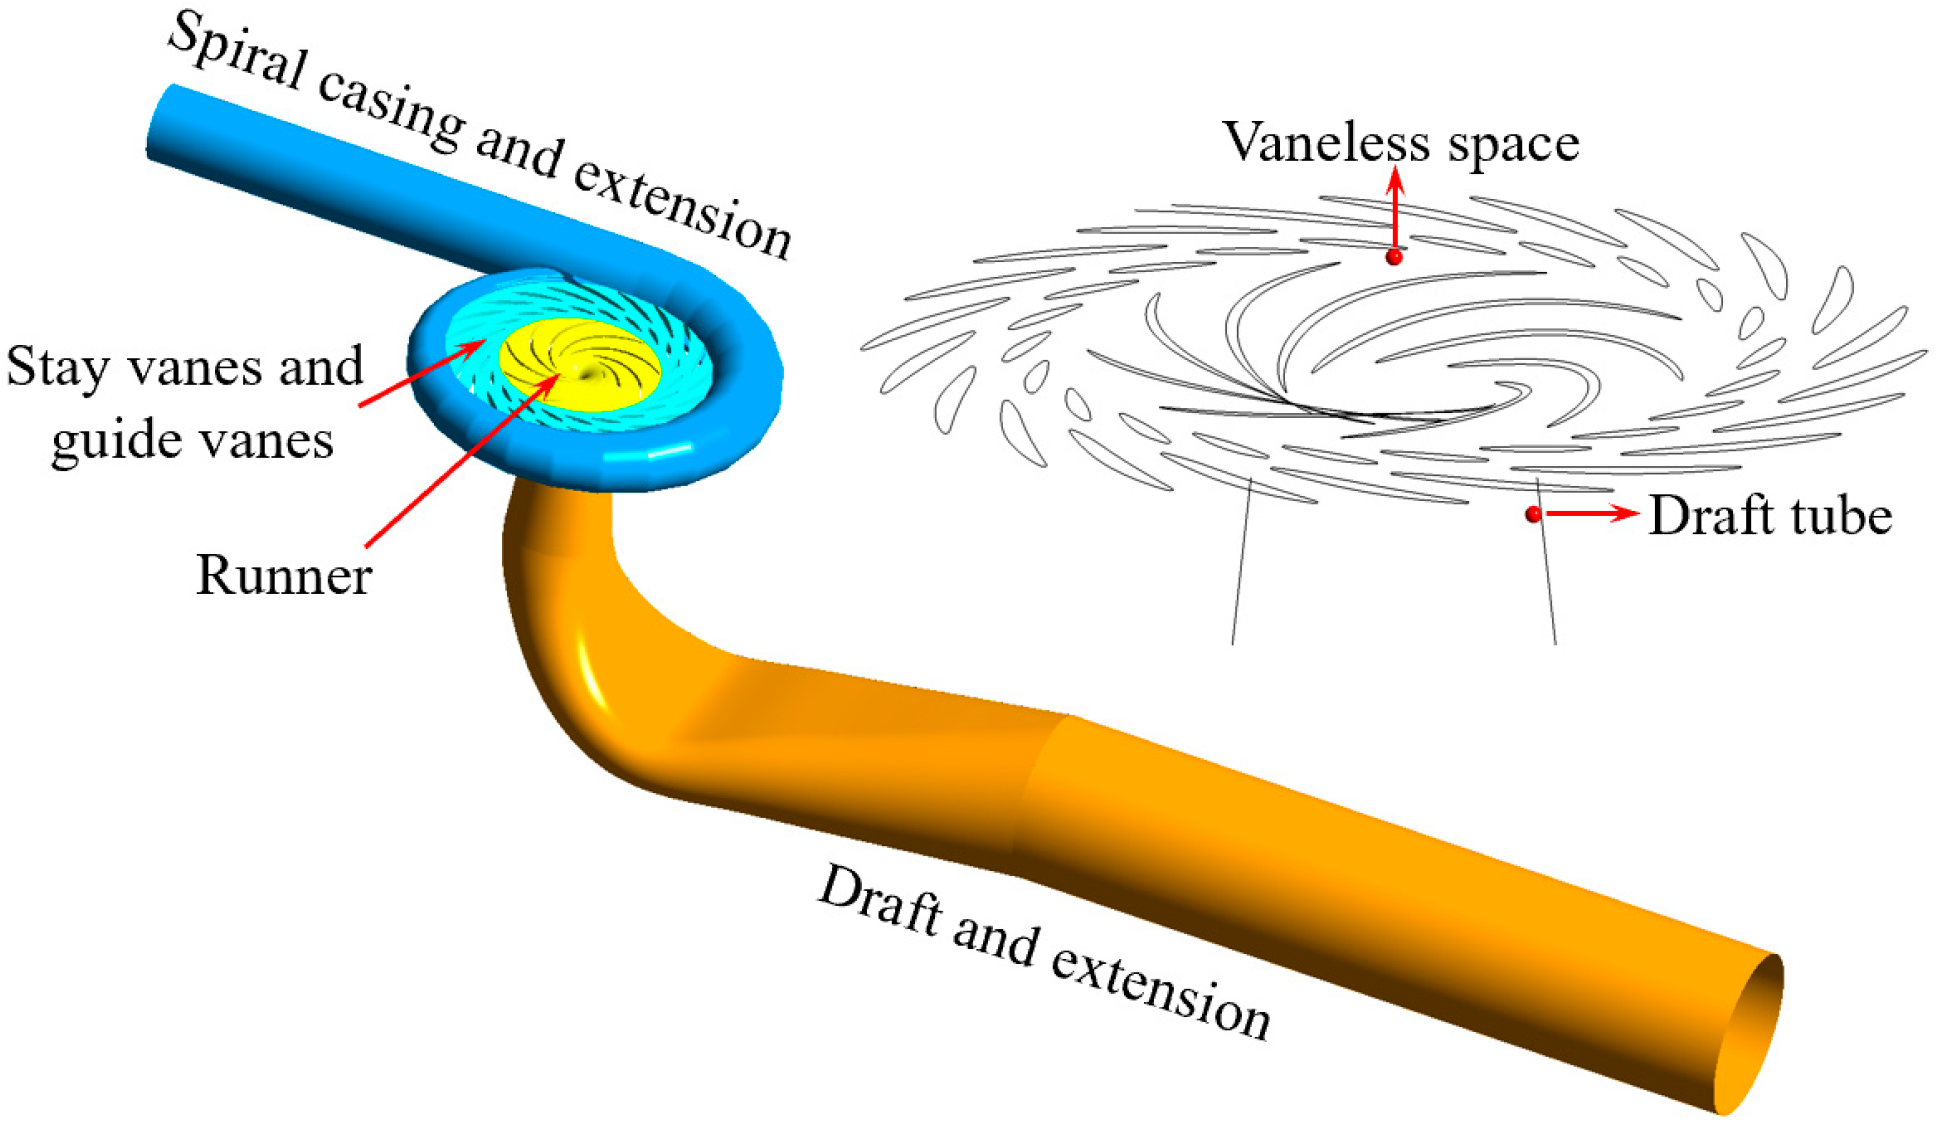
Figure 1. The diagram of the pump-turbine and the locations of monitoring points.
Processes 13 03511 g001
Figure 2. Grid independence verification and simulation model verification. (a) Grid independence verification; (b) Simulation model verification.
Processes 13 03511 g002
Figure 3. The diagram of grids.
Processes 13 03511 g003
Figure 4. Velocity triangles and flow patterns in the turbine mode. (a) n = 0.90 nr; (b) n = 0.95 nr; (c) n = 1.00 nr; (d) n = 1.05 nr; (e) n = 1.10 nr.
Processes 13 03511 g004
Figure 5. Pressure pulsation characteristics at the vaneless space in the turbine mode. (a) Time domain; (b) Frequency domain.
Processes 13 03511 g005
Figure 6. Pressure distribution at the blade-leading edge and inside the runner in the turbine mode. (a) n = 0.90 nr; (b) n = 0.95 nr; (c) n = 1.00 nr; (d) n = 1.05 nr; (e) n = 1.10 nr.
Processes 13 03511 g006
Figure 7. Pressure pulsation characteristics in the draft tube in the turbine mode. (a) Time domain; (b) Frequency domain.
Processes 13 03511 g007
Figure 8. The flow patterns in the draft tube in turbine mode. (a) n = 0.90 nr; (b) n = 0.95 nr; (c) n = 1.00 nr; (d) n = 1.05 nr; (e) n = 1.10 nr.
Processes 13 03511 g008
Figure 9. Velocity triangles and flow patterns in the pump mode. (a) n = 0.90 nr; (b) n = 0.95 nr; (c) n = 1.00 nr; (d) n = 1.05 nr; (e) n = 1.10 nr.
Processes 13 03511 g009
Figure 10. Pressure pulsation characteristics at the vaneless space in the turbine mode. (a) Time-domain; (b) Frequency-domain.
Processes 13 03511 g010
Figure 11. Pressure distribution at the blade-leading edge and inside the runner in the pump mode. (a) n = 0.90 nr; (b) n = 0.95 nr; (c) n = 1.00 nr; (d) n = 1.05 nr; (e) n = 1.10 nr.
Processes 13 03511 g011
Figure 12. Pressure pulsation characteristics in the draft tube in the pump mode. (a) Time-domain; (b) Frequency-domain.
Processes 13 03511 g012
Figure 13. Rotating stalls in the vane and runner region in Case-P-0.90 nr. (a) t = 1.0 s; (b) t = 1.0125 s; (c) t = 1.025 s; (d) t = 1.0275 s; (e) t = 1.05 s; (f) t = 1.0625 s; (g) t = 1.075 s; (h) t = 1.0875 s; (i) t = 1.1 s.
Processes 13 03511 g013aProcesses 13 03511 g013b
Table 1. Main parameters of the model pump-turbine.
ParameterValueParameterValue
The runner inlet diameter D1 (m)0.54The number of runner blades zb9
The runner outlet diameter D2 (m)0.25The number of guide vanes ngv22
The rated speed ω0
(rpm)
600The number of stay vanes
nsv
22
Table 2. Variations in macro-parameters in the turbine mode.
Casesω (rad/s)T (N·m)N (N·m/s)Q (m3/s)H (m)η (-)
Case-T-0.90 nr56.5544925,3900.17316.9588.42%
Case-T-0.95 nr59.6942425,3090.17016.9589.69%
Case-T-1.00 nr62.8339424,7560.16516.9590.39%
Case-T-1.05 nr65.9736223,8820.16016.9589.93%
Case-T-1.10 nr69.1232322,3240.15416.9587.34%
Table 3. Variations in macro-parameters in the pump mode.
Casesn (rad/s)T (N·m)N (N·m/s)Q (m3/s)H (m)η (-)
Case-P-0.90 nr56.5518410,4050.04414.1258.47%
Case-P-0.95 nr59.6929717,7280.11014.3287.01%
Case-P-1.00 nr62.8337723,6880.15114.5290.64%
Case-P-1.05 nr65.9743428,6320.17714.6889.86%
Case-P-1.10 nr69.1248933,7970.20114.8486.42%
Disclaimer/Publisher’s Note: The statements, opinions and data contained in all publications are solely those of the individual author(s) and contributor(s) and not of MDPI and/or the editor(s). MDPI and/or the editor(s) disclaim responsibility for any injury to people or property resulting from any ideas, methods, instructions or products referred to in the content.