Article

Modeling Transient Vaporous Cavitating Flow in Pipelines by a Two-Phase Homogeneous Flow Model

School of Petroleum and Natural Gas Engineering, Southwest Petroleum University, Chengdu 610500, China
*
Author to whom correspondence should be addressed.
Processes 2025, 13(11), 3510; https://doi.org/10.3390/pr13113510
Submission received: 11 October 2025 / Revised: 27 October 2025 / Accepted: 28 October 2025 / Published: 1 November 2025

Abstract

Vaporous cavitating flow may occur in pipelines when a water hammer causes pressure to drop to saturated vapor pressure. This paper presents a two-phase homogeneous flow model for transient vaporous cavitating flows. The homogeneous flow model consists of continuity and momentum balance equations and an equation describing the volume fraction of vapor. A two-step finite difference MacCormack scheme is used to solve the model. The calculated results obtained from the model are compared with those of the classical discrete gas cavity model (DGCM) and with experimental data from the literature. For all test cases, the model converged at a similar number of grids. The numerical results indicate that the model can reproduce cavitation events well, especially for the prediction of the first maximum pressure peak after cavity collapse. The model also provides direct access to the vapor volume fraction at each location as a function of time. Through numerical analyses, the initial vapor volume fraction in the model is selected as 10−7; with this selection, the numerical results are in good agreement with experimental data. The model also exhibits comparable predictive capability with respect to the DGCM and superior performance under some operating conditions. Nevertheless, neither of these two models can appropriately estimate the pressure phase in severe cavitation events.

1. Introduction

In hydraulic systems, pump failure and valve closure can cause water hammer effects [1,2,3], and severe water hammer effects may, in turn, cause cavitation in pipes and generate cavities. The existence and collapse of cavities threaten the safety of hydraulic systems and render it difficult to simulate and analyze hydraulic systems.
There are two transient cavitating flows in pipelines: gaseous [4,5] and vaporous cavitation [6,7,8]. When the pressure drops to the saturation pressure of the dissolved gas in the liquid—but remains higher than the saturated vapor pressure of the liquid—gaseous cavitation occurs, and many small bubbles are generated in the liquid. For vaporous cavitation, the pressure drops to the saturated vapor pressure, and a large number of large vapor cavities are formed. The former type of cavitation does not cause serious damage to the pipeline, while the latter cavitation type can generate a large pressure increase due to the collapse of vapor cavities, which may result in pipeline rupture. Hence, in this study, our main focus is on vaporous cavitation. Furthermore, vaporous cavitation can be divided into column separation and distributed vaporous cavitation [9,10]. Column separation is a localized vapor cavity with a large volume fraction, often occurring near closed valves or at local high points in the pipeline. Distributed vaporous cavitation is a small volume fraction of vapor cavitation that occurs over an extended length of the pipe at a pressure equal to the saturated vapor pressure. For vaporous cavitation, researchers have mainly proposed two models for simulating the location and degree of cavitation—namely, the discrete cavity model [11,12] and the homogeneous flow model (bubble flow model) [13,14].
The discrete cavity model can be subdivided into single-cavity [15,16] and multiple-cavity models [17,18] depending on the number of cavity locations. Since the single-cavity model requires artificial assumptions about the location of the cavitation, its wide applicability is limited. Currently, most researchers turn to the study of multi-cavity models. Streeter [19] proposed the first multi-cavity model, the discrete vapor cavitation model (DVCM), which assumes that when the pressure drops to the vapor pressure, a vapor cavity will be generated at the computing node, and the pressure will remain at the vapor pressure until the cavity collapses. The water hammer wave propagates at a constant speed in the liquid between the computing nodes, and the change in the volume of the vapor cavity is calculated by the difference in the inflow and outflow of the node. This model is solved via the method of characteristics (MOC). Nevertheless, DVCM may generate unrealistic pressures due to the collapse of multiple cavities, and the number of space grids needs to be limited to ensure that the ratio of the maximum void volume to the grid volume is less than 10% [20]. To avoid this deficiency, Wylie [21] introduced physical damping to suppress pressure oscillations. Wylie introduced a small amount of free gas with a gas volume fraction concentrated at the computational node and proposed an improved DVCM—the discrete gas cavity model (DGCM). This model assumes that the free gas at each computing node follows the ideal gas law, and the free gas volume expands and contracts as the pressure changes. Soares, Martins, and Covas [17] compared and analyzed the prediction results of DGCM and DVCM based on experimental data, indicating that DGCM is more appropriate for transient cavitating flows. Ghodhbani proposed an improved DGCM by considering the effects of fluid–structure interaction and gas release. Bergant [22] combined the unsteady friction model with the DGCM to study the effect of unsteady friction on vaporous cavitation. Mousavifard and Norooz [23] extended the DGCM to a quasi-two-dimensional model and observed that the latter had better predictive performance. Chen et al. [24] improved the DGCM prediction results by optimizing the Courant number and adjusting the friction coefficient. Qiu et al. [25] used the DGCM, incorporating unsteady friction to analyze unsteady flow in hydrogen pipelines.
Shu [26] proposed a homogeneous flow model called the two-phase homogeneous equilibrium vaporous cavitation model in order to overcome some deficiencies of the discrete vapor models (e.g., negative cavity volume, discontinuity of flow at the nodes, etc.). The model assumes a homogeneous mixture of liquid and vapor phases, which have the same velocity, and describes the fluid flow characteristics through the continuity and momentum equations of the mixture. The model is solved using the method of characteristics, and the vapor volume fraction is calculated via the right term of the two compatibility equations; moreover, the model predicts pressure values that are in agreement with experimental values. Pezzinga [27] proposed a bubble flow model, which is also based on the continuity and momentum equations of the liquid–vapor mixture and uses an ingenious method to calculate the vapor volume fraction. By deforming the continuity equation, three bubble flow models were ultimately developed [28]. Hadj-Taieb et al. [29] also considered that the flow of liquid–vapor mixtures is controlled by continuity and momentum equations. By analogy with the phenomenon of gas release, their research assumes that vapor release conforms to Henry’s law. The model is solved using the Lax–Wendroff scheme, and the prediction results are satisfactory. Based on the homogeneous flow model, Sumam et al. [30] introduced a vapor-phase transport equation, and the Singhal cavitation model was used as the mass transfer source term in the transport equation. The model is solved using the MacCormack scheme.
Through a literature review, it was observed that the homogeneous flow model proposed by Shu and Pezzinga lacks a physical basis when calculating vapor volume. This study proposes a method for calculating vapor volume from a practical physical perspective.
In this study, the liquid and vapor phases are regarded as a homogeneous mixture, and the continuity and momentum balance equations of the mixture are established. Then, by introducing the calculation equation describing the vapor volume fraction from a practical physical perspective, a complete homogeneous flow model is finally formed. The model is solved numerically with the MacCormack scheme. The simulation results are compared to those of DGCM and experimental data to analyze the features of the model.

2. Mathematical Model

2.1. Governing Equations

For long-distance pipelines, the annular and radial dimensions of the pipeline are too small compared to the axial dimension; thus, the fluid flow in long-distance pipelines can be regarded as one-dimensional flow. Since cavitation is a local phase-change phenomenon, the flow pattern in the pipeline mostly comprises bubbly flow, and vapor is easily carried by the liquid. Hence, cavitating flow can be regarded as a homogeneous flow with no slip between the liquid and vapor phases. The continuity and momentum equations of the mixture flow are as follows [28]:
ρ A t + ρ V A x = 0
ρ V A t + ρ V 2 A x + A P x = f ρ A V V 2 D ρ g A sin θ
where the variables are defined as follows: ρ = mixture density; A = pipe cross-sectional area; t = time; V = fluid velocity; x = length along the pipe axis; P = pressure; f = Darcy friction coefficient; D = inner diameter of the pipe; g = acceleration of gravity; θ = pipe inclination angle.
Specifically, the mixture density is calculated using the following equation:
ρ = ρ l 1 α + ρ v α
where the variables are defined as follows: ρ l = liquid density; ρ v = vapor density; α = vapor volume fraction.
The continuity equation is differentiated to obtain the following equation:
1 ρ d ρ d t + 1 A d A d t + V x = 0
Based on Equation (3), differentiating the mixture density yields the following:
d ρ d t = ρ v ρ l d α d t + α d ρ v d t + 1 α d ρ l d t
We consider the constitutive relations shown in Equations (6)~(8):
d ρ l = ρ l K l d P
d ρ v = ρ v K v d P
1 A d A = D C 1 E e d P
where the variables are defined as follows: K l = liquid elasticity modulus; K v = vapor elasticity modulus; C 1 = parameter related to the pipe support condition and is taken as 1; E = pipe elasticity modulus; e = pipe wall thickness.
Substituting Equations (6)~(8) into Equation (4) yields a continuity equation of the following form:
M P t + V P x + ρ v ρ l α t + V α x + ρ V x = 0
where M = 1 α ρ l K l + α ρ v K v + ρ D C 1 E e .
Combined with the continuity Equation (1), the momentum equation can be written in the following form:
V t + V V x + 1 ρ P x = f V V 2 D g sin θ
Equations (9) and (10) contain three unknowns: P, V, and α. To close the model, an equation for the vapor volume fraction must be added. Inspired by the research of Wylie [21] and the relevant cavitation theory [31], this study assumes that the spherical bubbles contain both vapor and a small amount of free gas. Ignoring surface tension, the spherical bubble wall has the following force balance relationship:
P = P v + P g
where the variables are defined as follows: P v = saturated vapor pressure; P g = free gas partial pressure.
Without considering gas release, the amount of free gas in the spherical bubble is a constant value. When the volume of a spherical bubble changes due to pressure, assuming that the free gas conforms to the ideal gas state equation, the following equation is satisfied:
P g Ψ g = P 0 Ψ 0
where the variables are defined as follows: Ψ = free gas volume; subscript 0 represents the free gas parameters under standard conditions. This study considers standard atmospheric pressure as the standard state.
Specifically, the free gas volume can be expressed as follows:
Ψ = α
where denotes the volume of the pipeline segment. The free gas volume can be expressed using Equation (13) because the vapor and free gas occupy the same space in a spherical bubble; thus, the free gas volume can be calculated from the vapor volume fraction. Combining Equations (12) and (13), the vapor volume fraction calculation equation can be obtained:
P P v α = P 0 α 0
where α 0 denotes the vapor volume fraction under standard conditions, which can be taken as 10−7. The determination of this value is outlined in the Section 4.
Equations (9), (10) and (14) constitute a two-phase homogeneous model for predicting vaporous cavitating pipeline flow.

2.2. Boundary Conditions

Since the accuracy of the model is validated by experimental data from two typical tank–pipeline–valve test cases, there are two boundary conditions: constant upstream pressure and variable downstream velocity; and variable upstream pressure and constant downstream pressure. For the first boundary condition, the upstream boundary of the pipeline is considered to comprise constant pressure with a vapor volume fraction, satisfying Equations (15) and (16); the downstream boundary comprises a velocity that varies linearly with time until it reaches zero, satisfying Equation (17):
P 0 , t = P const
α 0 , t = α const
V L , t = V s V s t / t c 0
where the variables are defined as follows: P const = constant pressure generated by the tank; α const = constant vapor volume fraction, which can be calculated using Equation (14); V s = liquid velocity in steady flow; t c = valve closure time.
For the second boundary condition, the upstream boundary is defined by the tank pressure, which decreases linearly to a constant pressure value, satisfying Equation (18); the downstream boundary is defined by a constant pressure and vapor volume fraction, satisfying Equations (19) and (20):
P 0 , t = P s P s t / t d P u
P L , t = P const
α L , t = α const
where the variables are defined as follows: P s = pressure generated by the upstream tank at steady flow; t d = variation time of the upstream tank pressure; P u = constant pressure after the upstream tank pressure is reduced.

3. Numerical Scheme

The continuity and momentum equations are hyperbolic, and the finite difference method can be adopted to solve these equations. The explicit finite difference scheme has the following advantages: low computational cost, no nonlinear convergence problems, and high accuracy. In contrast, the implicit method may fail to produce successful predictions when simulating cavitating flows due to nonlinear nonconvergence. The MacCormack scheme is an explicit finite difference scheme that is widely used in the numerical solution of vaporous cavitating pipeline flow models. For example, Pezzinga and Santoro [28] and Sumam, Thampi, and Sajikumar [30] used this numerical scheme to solve their individual vaporous cavitating flow models. Hence, this scheme is also used in this study to solve the proposed two-phase liquid–vapor homogeneous flow model.
For numerical calculations, since the MacCormack scheme is an explicit finite difference scheme, the Courant–Friedrichs–-Lewy (CFL) stability criterion needs to be satisfied, and the time step Δ t and space step Δ x need to satisfy the following equation:
Δ t = C Δ x / a mix
where C is the Courant constant, C 1 ; a mix is the maximum water hammer wave speed of the liquid–vapor mixture.
The MacCormack scheme is a two-step numerical scheme consisting of a prediction and a correction step, as shown in Figure 1. In the prediction step, the spatial derivatives are approximated using forward differences:
M i n P i p P i n Δ t + V i n P i + 1 n P i n Δ x + ρ v ρ l α i p α i n Δ t + V i n α i + 1 n α i n Δ x + ρ i n V i + 1 n V i n Δ x = 0
V i p V i n Δ t + V i n V i + 1 n V i n Δ x + 1 ρ i n P i + 1 n P i n Δ x = f V i n V i n 2 D g sin θ
P i p P v α i p = P 0 α 0
In the correction step, the spatial derivatives are approximated using backward differences:
M i p P i c P i p Δ t + V i p P i + 1 p P i p Δ x + ρ v ρ l α i c α i p Δ t + V i p α i + 1 p α i p Δ x + ρ i p V i + 1 p V i p Δ x = 0
V i c V i p Δ t + V i p V i + 1 p V i p Δ x + 1 ρ i p P i + 1 p P i p Δ x = f V i p V i p 2 D g sin θ
P i c P v α i c = P 0 α 0
where superscripts p and c represent the prediction and correction steps, respectively.
For internal nodes, the prediction and correction steps need to be alternated at each time step. For the first boundary condition, at the first node, since the pressure P and the vapor volume fraction α satisfy Equations (15) and (16), only Equations (23) and (26) are needed to calculate the variable V. Referring to Pezzinga’s approach, the spatial terms in both the prediction and correction steps at the first node are forward-differentiated. At the last node, the velocity V is determined using Equation (17), and only Equations (22), (24), (25) and (27) are used to calculate the variables P and α. Similarly, at the last node, the spatial terms in both the prediction and correction steps use the backward difference. For the second boundary condition, the flow parameters at the boundary are calculated similarly to those of the first boundary condition.
For both prediction and correction steps, these difference equations can be easily solved analytically (solving difference equations can eventually be converted to obtaining the roots of a quadratic equation), even though the difference equations obtained from the discretization comprise a nonlinear system of equations (as a result of the nonlinearity of the vapor volume fraction calculation equation).
In summary, the model’s solution process can be summarized as follows (see Figure 2):
Step 1: Determine the time step Δ t and space step Δ x based on CFL conditions;
Step 2: Calculate P, V, and α at each node of the pipeline under steady-state conditions;
Step 3: Calculate the internal nodes P, V, and α of the prediction step;
Step 4: Calculate the boundary nodes P, V, and α of the prediction step;
Step 5: Calculate the internal nodes P, V, and α of the correction step;
Step 6: Calculate the boundary nodes P, V, and α of the correction step;
Step 7: Calculate P, V, and α for each node of the pipeline in the next time level;
Step 8: Verify whether the simulation time exceeds the maximum calculation time. If not, return to step 3 to continue the calculation; otherwise, stop the calculation and print the result.

4. Results and Discussion

In this section, the proposed homogeneous flow model is utilized to analyze two typical tank–pipeline–valve cases—Bergant’s [9] and Sanada’s [32] transient cavitating flow experiments—and the predicted results are compared with the experimental values, in addition to those of the classical DGCM. Bergant’s experiment measured experimental data following cavitating flow caused by downstream valve closure, and Sanada’s experiment measured data following cavitating flow induced by an upstream pressure drop. The experimental data of the two cases can be used to more comprehensively verify the model’s accuracy and broad practicality.

4.1. Comparison with Experimental Results from Bergant

The first validation case is from Bergant, whose experimental apparatus consists of two water tanks and an inclined copper pipe. The total length of the pipe is 37.23 m, the inner diameter is 22.1 mm, and the elevation difference between the two water tanks is 2.03 m. A ball valve was installed downstream of the pipeline, and unsteady flow was induced by the instantaneous valve closure. The pressure history of the valve was recorded, and the measured water hammer wave speed is 1319 m/s.
The experimental data of two typical operating conditions are selected to validate the new model. The initial flow velocities for the two conditions are 0.3 m/s and 1.4 m/s, and the cavitation events generated at the two flow velocities are referred to as moderate and severe cavitation by Bergant. The upstream tank pressure is constant at 22 m for both conditions. The conditions corresponding to this experiment are shown in Table 1. For these conditions, the constant upstream pressure and vapor volume are calculated using Equations (15) and (16), and the ball valve closure is described using Equation (17). The valve closure time was 0.009 s. The initial pressure at each node can be determined by subtracting the steady state’s frictional resistance to that node from the pressure head of the upstream reservoir.
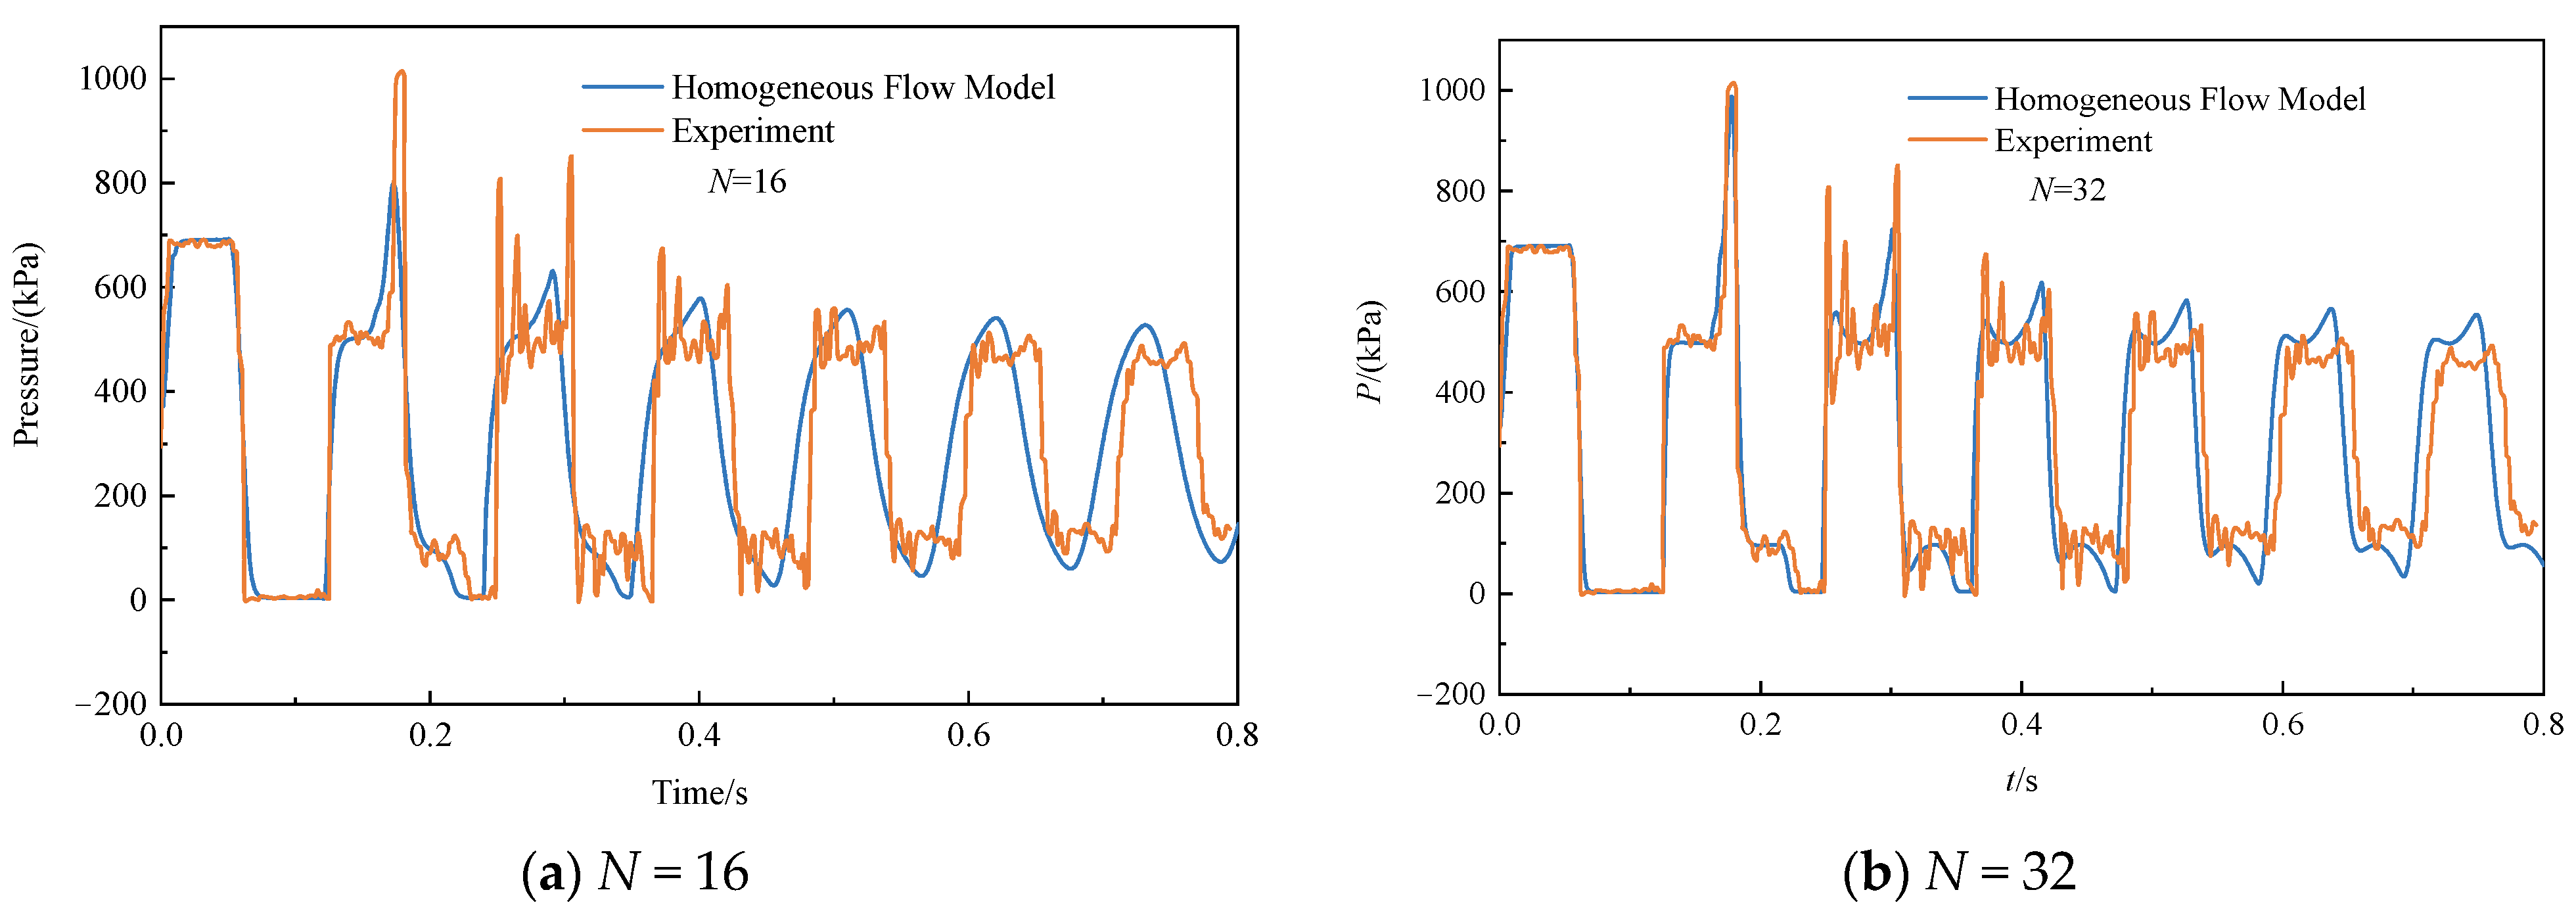
Figure 3 presents the predicted and experimental pressures for an initial velocity of 0.3 m/s using 16, 32, 64, and 128 pipe segments. The results show that when the number of segments is 64, the calculated results no longer change with respect to the number of segments. This is because the simulation has reached mesh independence. When the number of segments is sufficient for capturing all key details of the flow, further increasing the number of segments will not improve the accuracy of the calculation results. Moreover, the predicted pressure at this time is in good agreement with the measured values, and the model effectively simulates a larger pressure peak generated by the collapse of the vapor cavity, exceeding the Joukowsky water hammer rise. The maximum pressure peaks predicted by the model and measured experimentally are 1071 kPa and 1015 kPa, respectively. The predicted pressure times during the subsequent simulation period are also consistent with the measured results. Only the peak pressure deviates slightly from the experimental value, which can be attributed to energy dissipation due to unsteady friction and gas release.
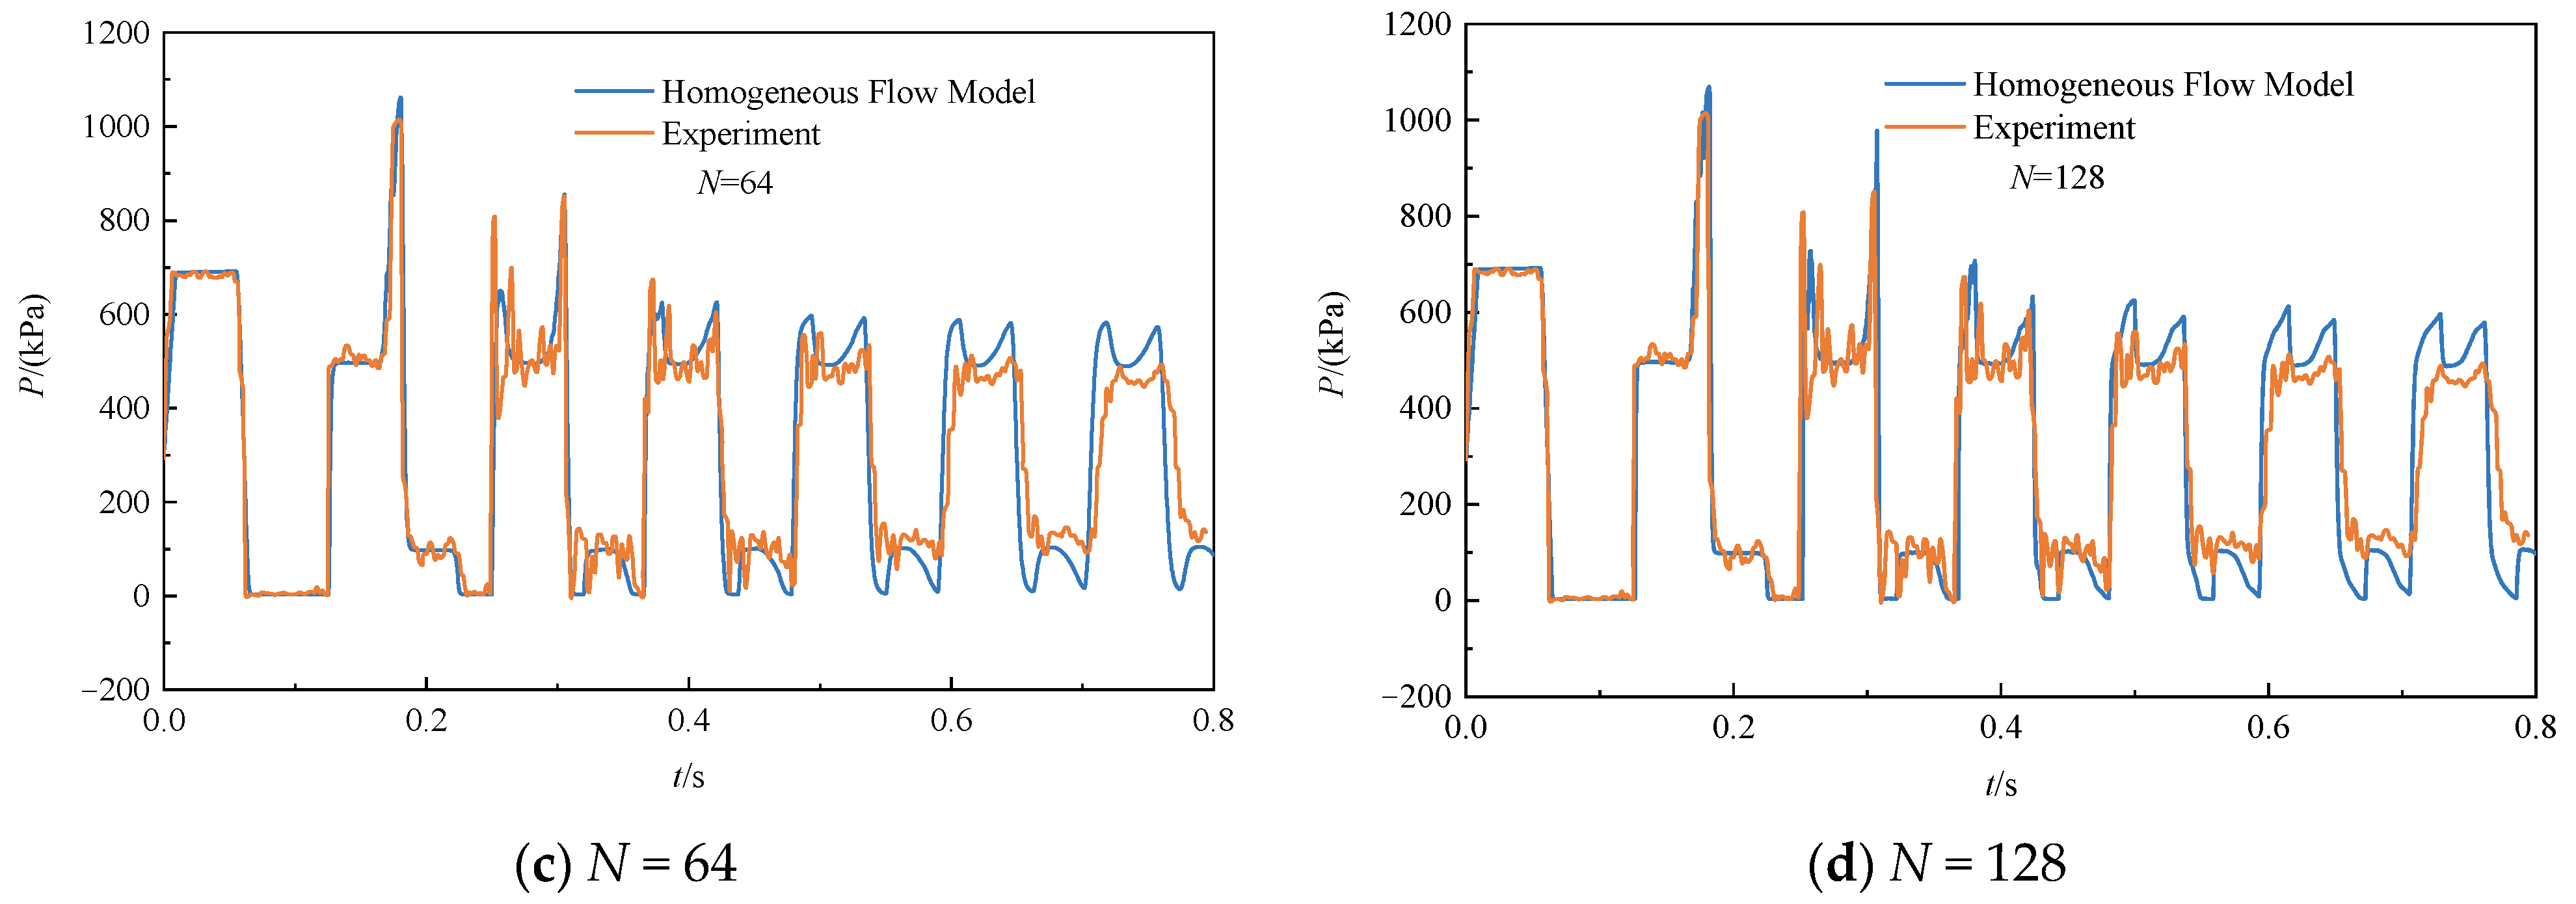
Figure 4 shows the predicted and experimental pressure at the valve for an initial velocity of 1.4 m/s. Similarly, when the number of pipe segments is 64, the simulated pressure hardly varies with the number of segments. It can be observed that several pressure peaks calculated using the new model are satisfactory with respect to the measured results. The second pressure peaks obtained from the model and experiment are 2012 kPa and 2057 kPa, respectively. However, there are some deviations in the predicted time. The model predicts that the first cavity collapse time is 0.02 s earlier than the experimental value.
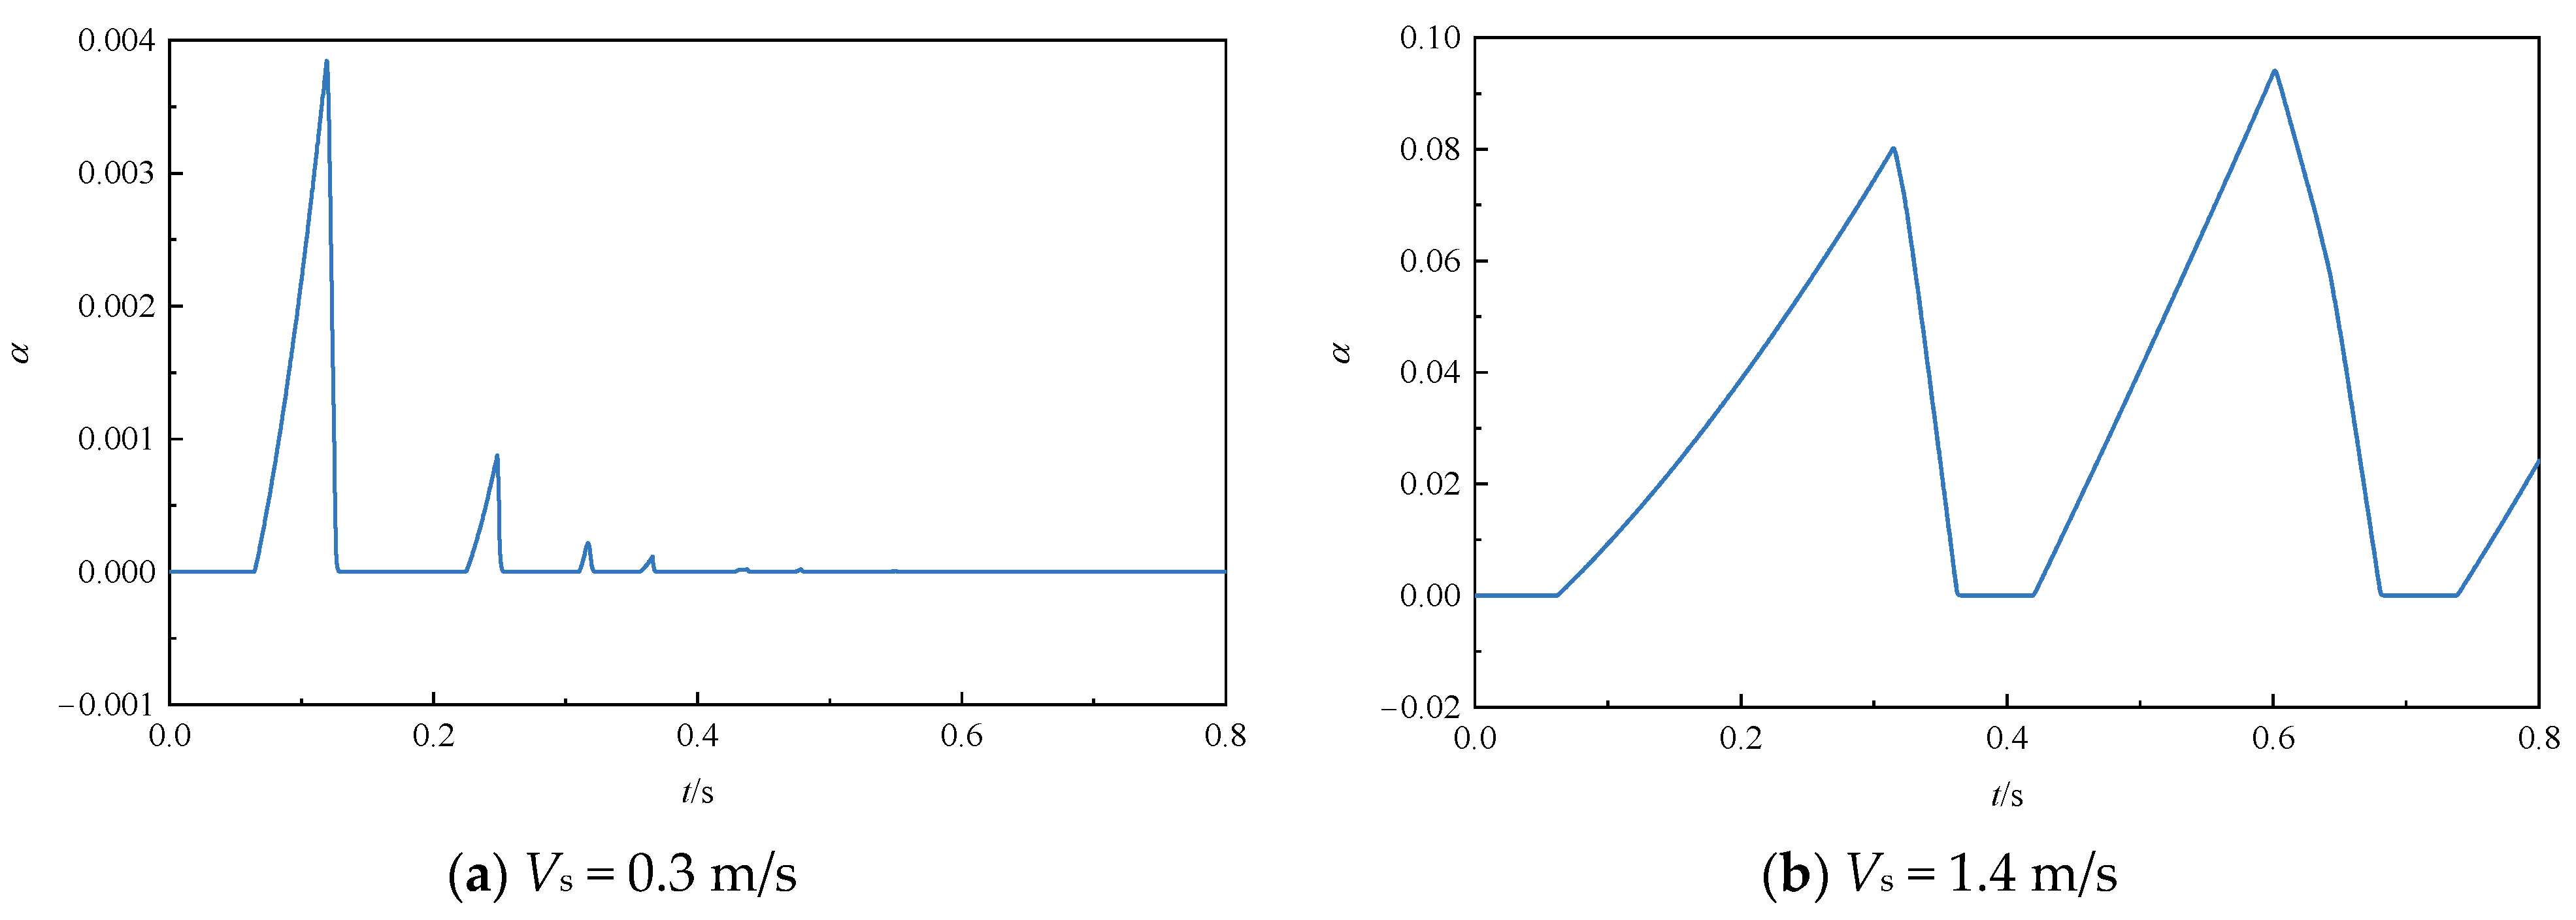
The solution variables of the new homogeneous flow model include the vapor volume fraction, allowing it to be determined directly in the pipeline when cavitating flow occurs. Figure 5 depicts the variation in vapor volume fraction at the valve over time for both operating conditions. It can be observed that vapor starts to form when the pressure is lowered to the saturated vapor pressure; then, the vapor gradually disappears as pressure increases. The difference in the vapor volume fraction at low and high velocities spans several orders of magnitude, and this is because the valve closure at high flow velocities creates severe cavitation and thus produces more vapor.
The vapor volume variation is described in the new model using Equation (14). The initial vapor volume fraction needs to be provided, and this value affects the predicted results. Figure 6 shows the pressure at the valve for two operating conditions with initial vapor volume fractions of 10−6, 10−7, and 10−8. It can be observed that there is a more significant deviation in the predicted values at an initial vapor volume fraction of 10−6 from the other two values, and the simulated values at an initial vapor volume fraction of 10−7 are almost equal to those at 10−8. Hence, it can be assumed that an initial vapor volume fraction of 10−7 is appropriate, which will be further confirmed in subsequent cases.
The classical DGCM is considered to be one of the most suitable numerical models available for vaporous cavitating pipeline flow. The calculated values of the homogeneous flow model are compared with those of the DGCM to further validate their accuracy. Figure 7 presents the pressures at the valve calculated by the new model and the DGCM under the two operating conditions. As observed in the figure, the maximum pressure peaks predicted by the two models are almost equal. When the steady flow’s velocity is 0.3 m/s and 1.4 m/s, the maximum pressure peaks predicted by the homogeneous flow model and DGCM differ by 18 kPa and 100 kPa, respectively. The phases are also consistent throughout the simulation period, with only some deviations in the pressure amplitude. Moreover, the pressures calculated by the DGCM show a large number of small amplitudes, and the DGCM predicts many pressure amplitudes not observed in the experimental data under severe cavitation events. In contrast, the simulation results of the homogeneous flow model are more consistent with the experimental values.

4.2. Comparison with Experimental Results from Sanada

The second validation case is from Sanada, where the experimental apparatus also consists of two water pools and a horizontal pipe. The total length of the pipe is 200 m, with an internal diameter of 15.2 mm. The measured water hammer wave speed is 820 m/s. Different from Bergant’s experiment, the unsteady flow in this experiment is caused by two transient events. The first transient event is a sudden decrease in upstream pressure that results in cavitation at the midstream position of the pipeline, referred to as midstream cavitation. The second transient event is the instantaneous closure of the downstream valve, referred to as downstream cavitation. The specific conditions corresponding to this experiment are shown in Table 2. For the first transient event, the upstream pressure is expressed using Equation (18), the pressure change time is considered to be 0.008 s, and the down pressure and vapor volume fraction are expressed via Equations (19) and (20). For the second transient event, the same boundary conditions as those in Bergant’s experiment were used, and the valve closure time was 0.08 s. Similarly, for both transient events, the pressure at each node under steady flow in the pipeline was calculated using the same method applied in Bergant’s experiment.
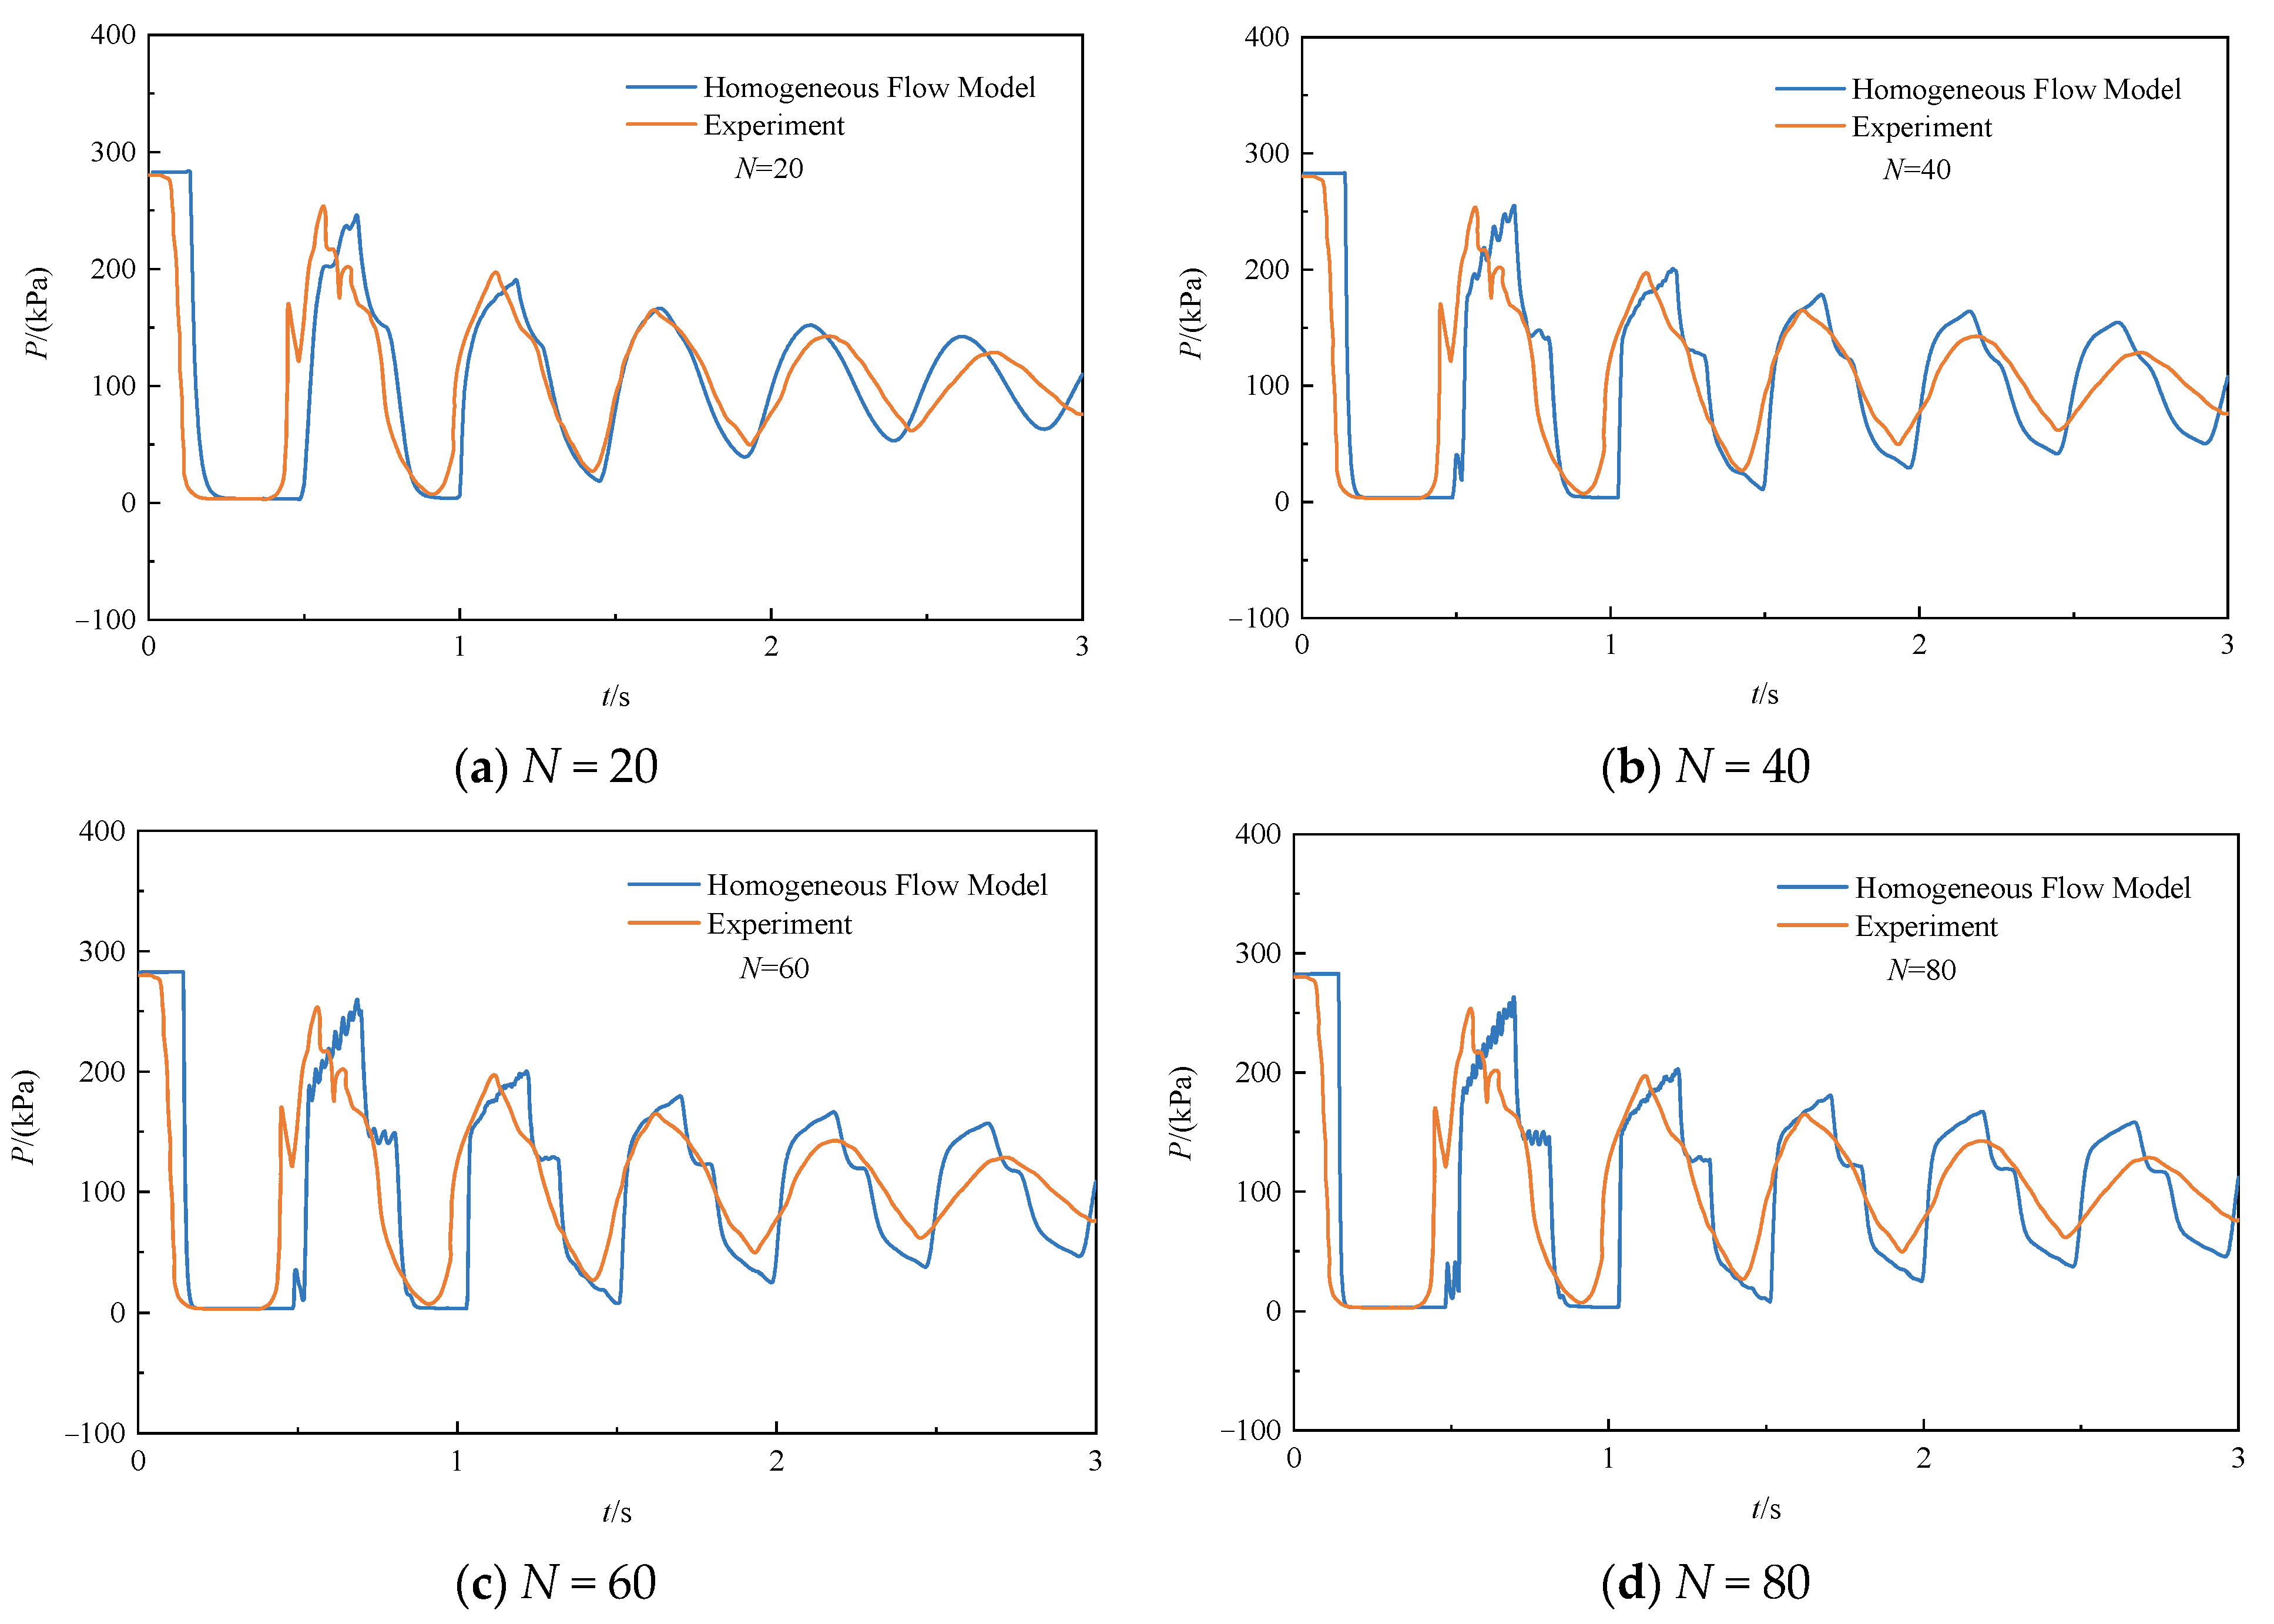
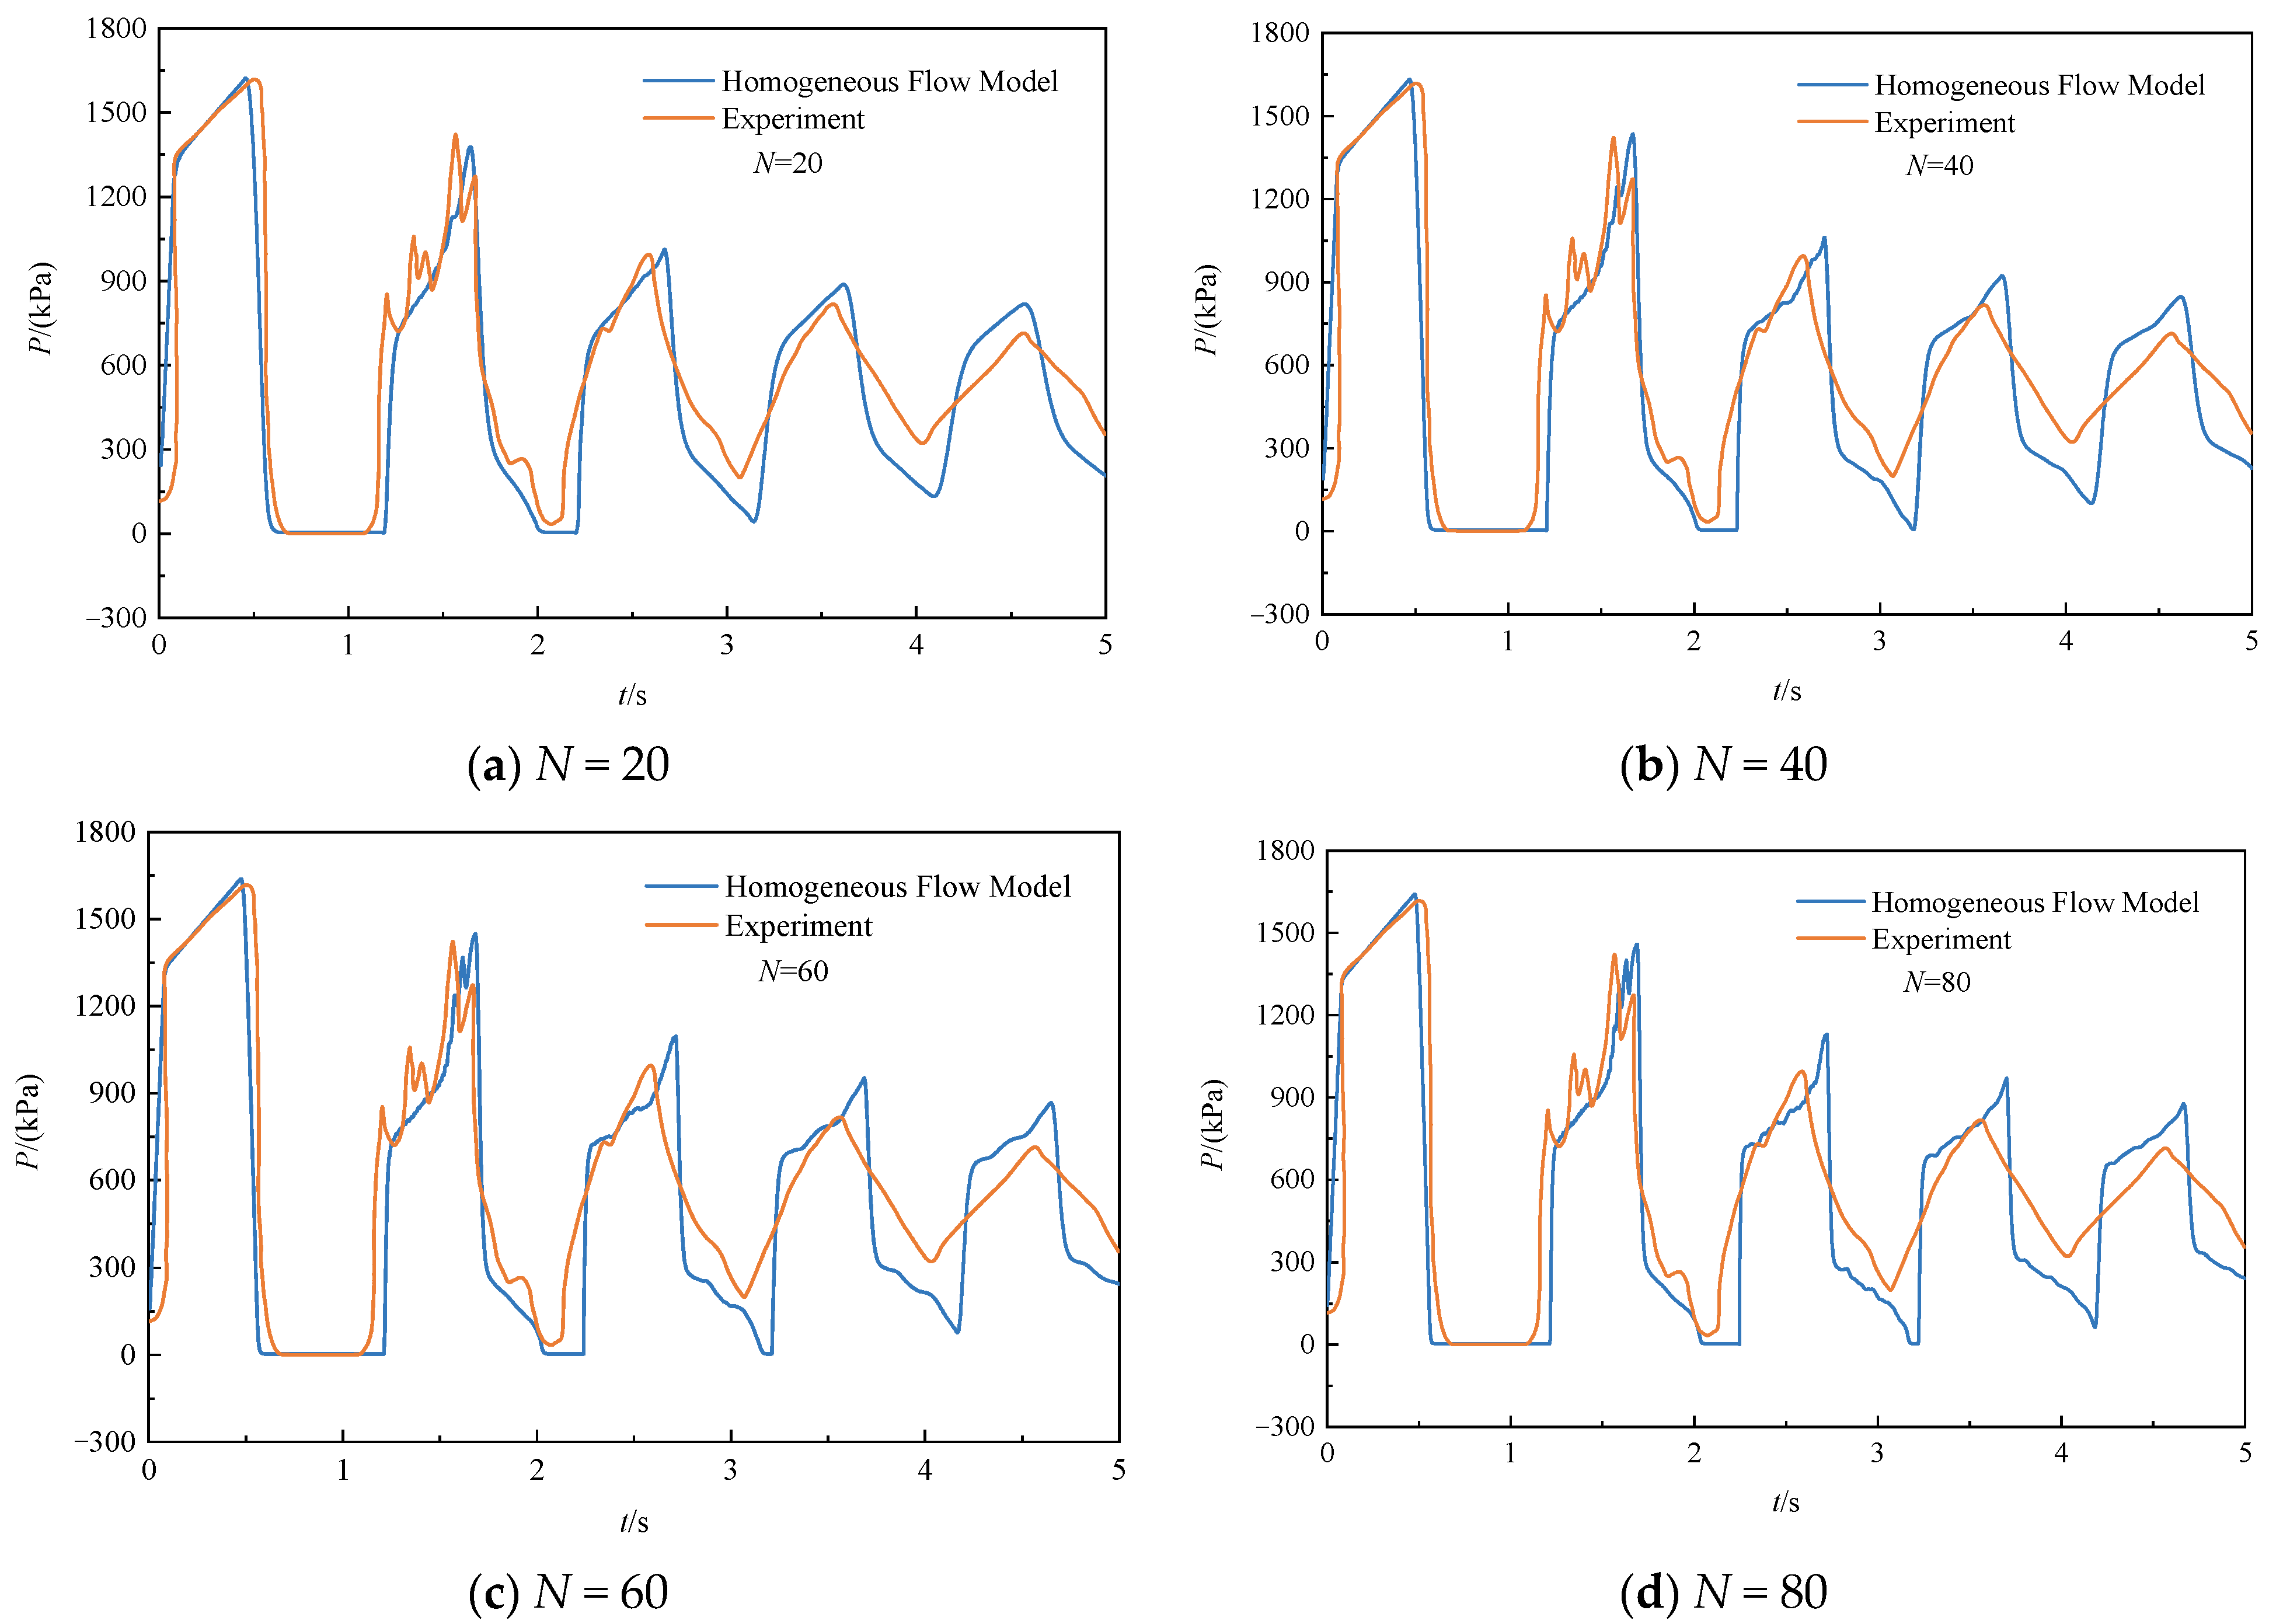
Figure 8 shows the predicted and experimental pressure values at 120 m along the pipeline for midstream cavitation, using 20, 40, 60, and 80 pipeline segments. Analyzing the recorded pressure data, it can be observed that the pressure trajectory under midstream cavitation exhibits a different trend from the pressure trajectory under the downstream valve closure (e.g., Bergant’s experiment). This is attributed to the fact that the unsteady flow in this condition is caused by the upstream pressure change; thus, pressure rapidly drops to the saturated vapor pressure as the decompression wave propagates from upstream. The pressurized wave reflected from downstream causes the cavity to collapse, resulting in a subsequent pressure spike. It is also reflected in the figure that when the number of segments is 60, the simulation results no longer change with the number of segments. Per this phenomenon, the predicted pressure curve matches the recorded curve well, and the calculated first pressure peak of 260 kPa is also consistent with the experimental value of 254 kPa. During the subsequent pressure attenuation, the pressure peaks deviate slightly from the measured data; similarly, this is also attributed to unsteady friction and gas release.
Figure 9 presents the predicted and experimental pressure results at the valves for downstream cavitation. Similarly, when the number of segments is 60, the simulation results no longer change as the number of segments increases. The second pressure peaks obtained from the model and experiment are 1437 kPa and 1420 kPa. The model accurately predicts the Joukowsky water hammer rise, as well as the pressure peaks generated after the collapse of the cavity, and the model reproduces the experimental data.
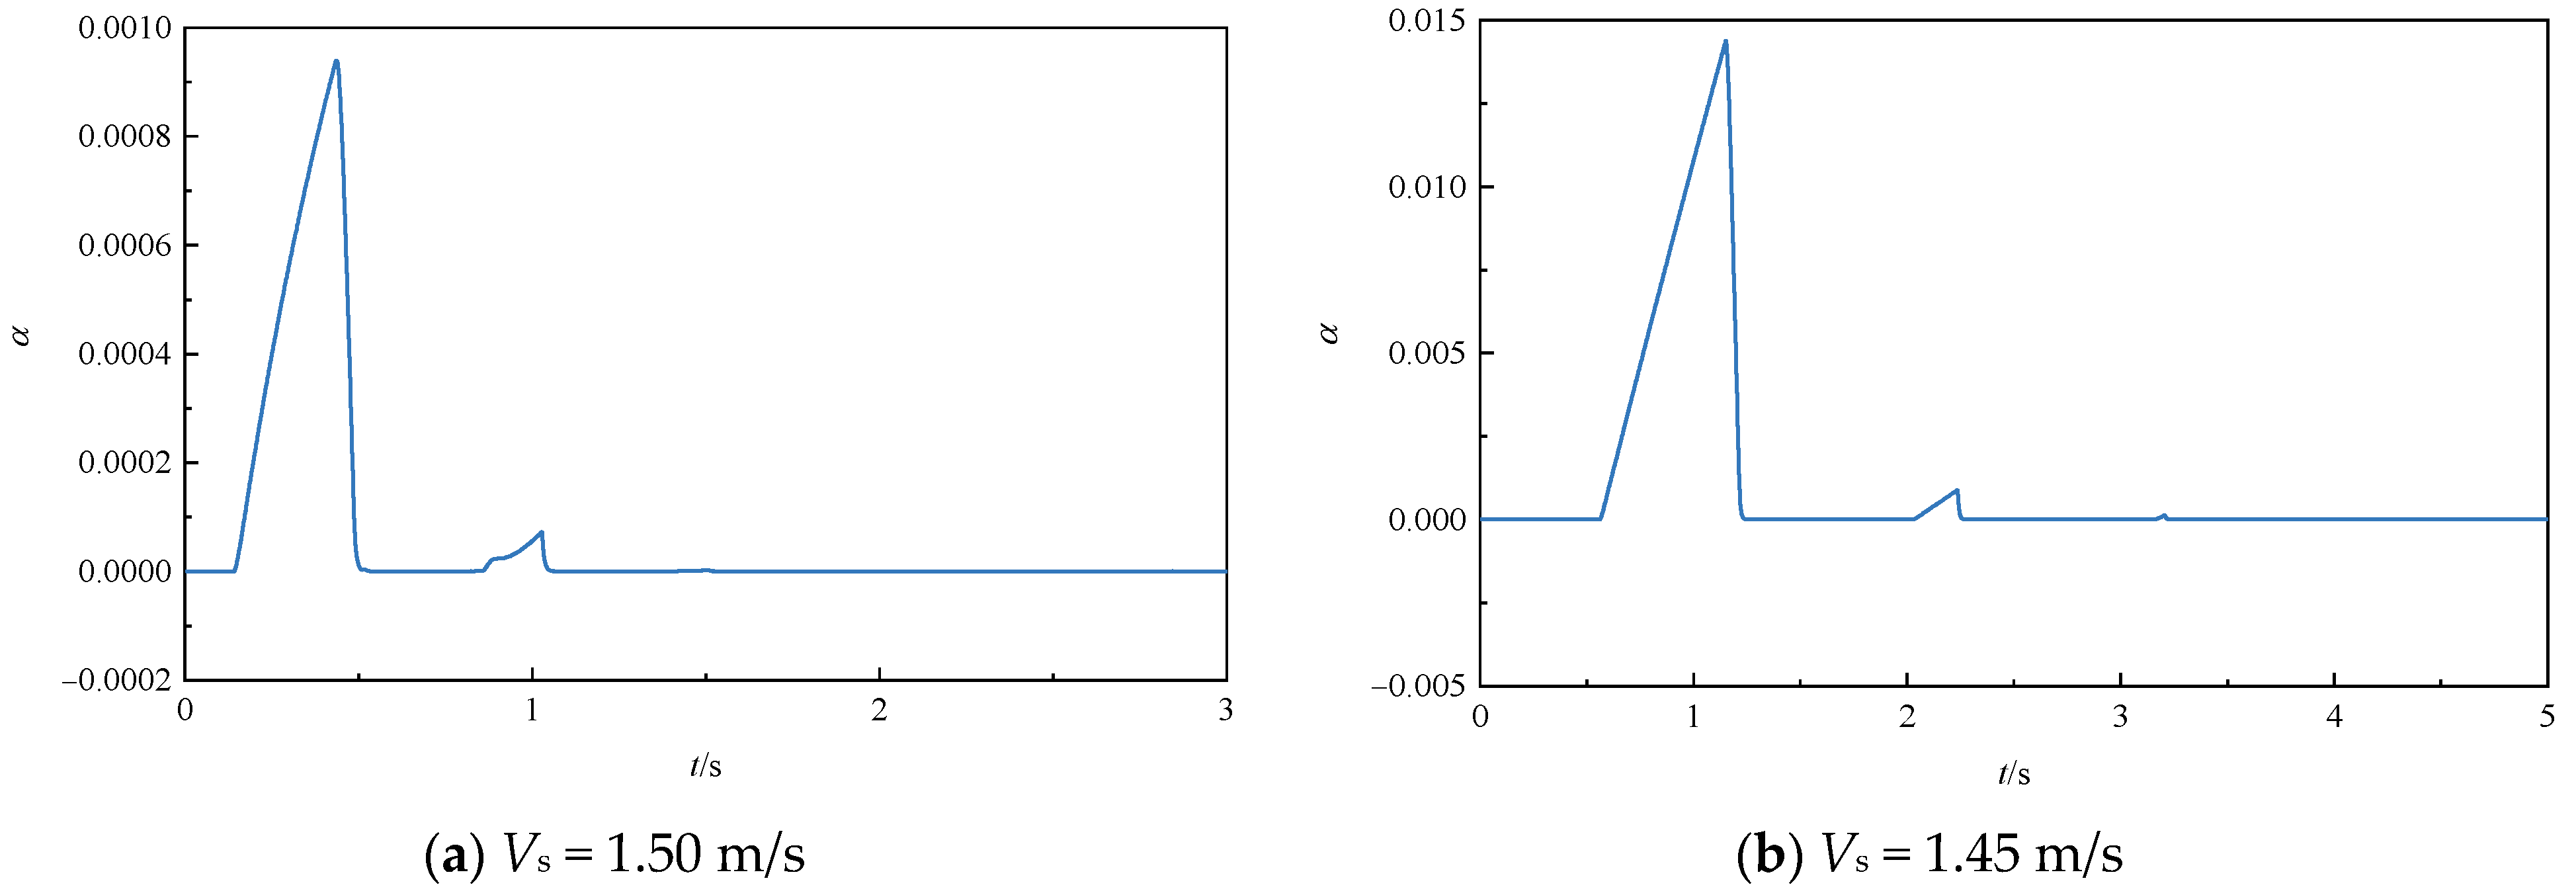
In Figure 10, the vapor volume fractions at 120 m of the pipe and the valve for the two operating conditions are shown. The model responds well to the variation in vapor volume fraction at the two locations. It can also be observed that the amount of vapor generated at the valve is substantially greater than that generated at the middle position of the pipe.
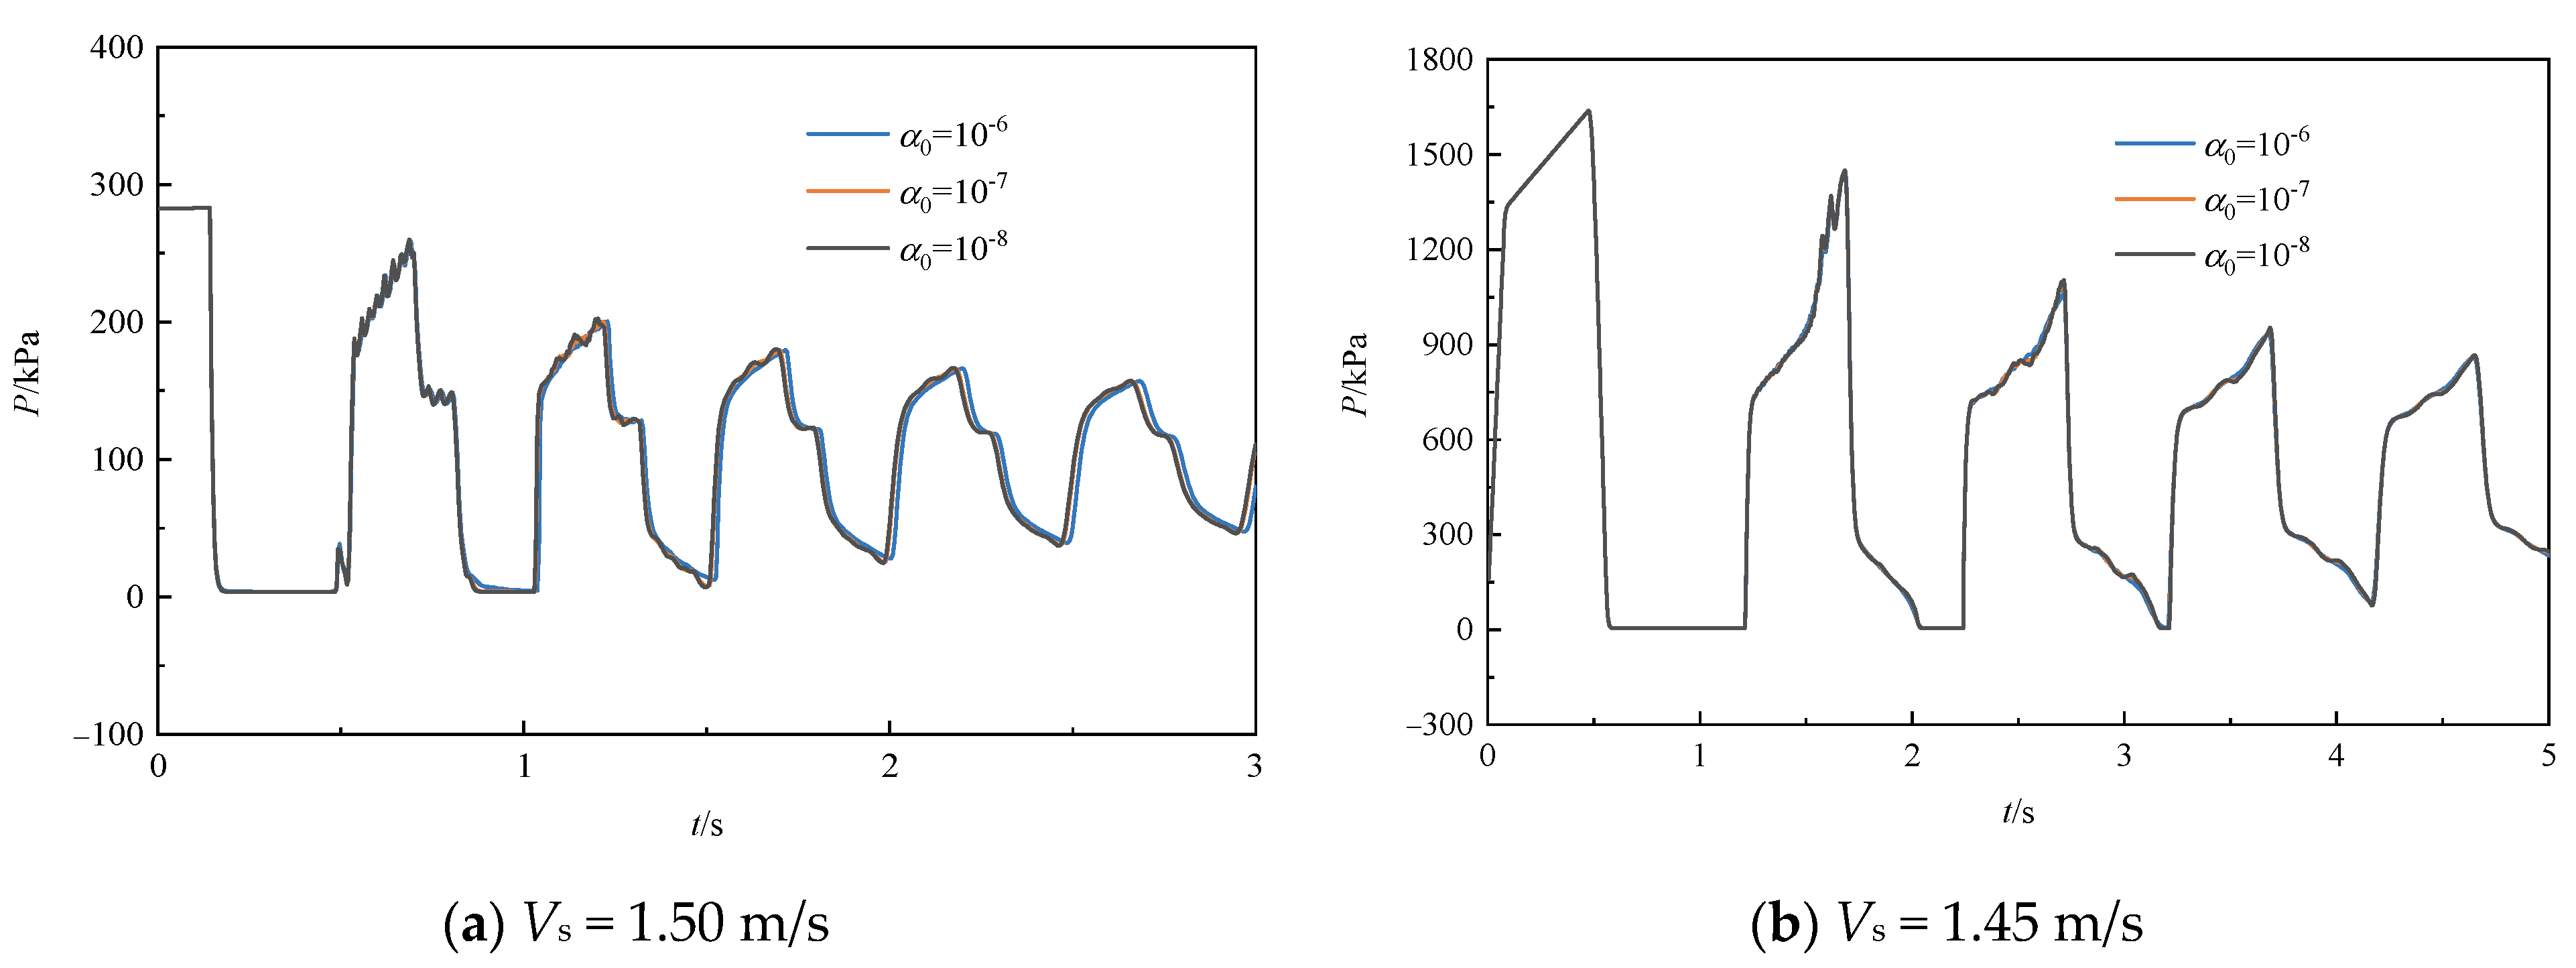
To further determine the initial vapor volume fraction values in the model, two operating conditions are simulated using initial vapor volume fractions of 10−6, 10−7, and 10−8, as shown in Figure 11. The results show that for both upstream pressure variation and downstream valve closure, the pressure for an initial vapor volume fraction of 10−7 hardly changes as the initial vapor volume fraction is further decreased. The selection of an initial vapor volume fraction of 10−7 is justified by this case.
Figure 12 presents the predicted results of the new model and DGCM for the two operating conditions. For the upstream pressure drop condition, the DGCM predicts a larger pressure peak after the collapse of the first cavity compared to the homogeneous flow model, and this pressure is more overestimated compared to the experimental value (see Figure 8 and Figure 9). The proposed model is more consistent with the experimental value. For the downstream closure condition, the DGCM predicts that the pressure profile after the collapse of the first cavity yields a large number of unreasonably small amplitude oscillations, whereas the simulated results of the proposed model are more satisfactory.

5. Conclusions

In this study, a homogeneous flow model is proposed for predicting transient vaporous cavitating flows, which consists of continuity and momentum equations describing the liquid–vapor mixture flow and an equation for calculating the volume fraction of vapor. The model is solved numerically utilizing the MacCormack scheme. Using two water hammer cases, the calculated results are compared to those of the DCGM and experimental data. The main conclusions obtained are summarized as follows:
  • The proposed model is a reliable approach for predicting transient cavitating flow in pipelines. For example, when the steady flow’s velocity is 1.4 m/s for Bergant’s experiment, the maximum pressure peaks predicted using the homogeneous flow model and measured experimentally are 1071 kPa and 1015 kPa, respectively.
  • Compared to the classical model, the proposed model is capable of directly calculating the vapor volume fraction in the pipeline.
  • The proposed model is sensitive to the initial vapor volume fraction, and this study suggests that the initial vapor volume fraction is 10−7 for Bergant’s and Sanada’s experiments.
  • Comparisons of the calculated results with those of the DGCM show that the proposed model’s prediction capability is comparable to that of DGCM. For example, when the steady flow’s velocity is 0.3 m/s and 1.4 m/s for Bergant’s experiment, the maximum pressure peaks predicted by the homogeneous flow model and DGCM differ by 18 kPa and 100 kPa, respectively. The proposed model can be applied to the analysis of various operating conditions, such as valve closure and sudden pressure changes.
Since the proposed model is suitable for predicting cavitating flow in pipelines, it is expected to be implementable in commercial software. Future research needs to further consider the effects of unsteady friction and gas release in the model.

Author Contributions

J.H.: Writing—original draft, writing—review and editing, and methodology; C.L.: conceptualization, methodology, and validation; Y.G.: investigation, data curation, and visualization. All authors have read and agreed to the published version of the manuscript.

Funding

This study was funded by the National Natural Science Foundation of China for the year 2023, grant number [52372344].

Data Availability Statement

The original contributions presented in this study are included in the article. Further inquiries can be directed to the corresponding author.

Conflicts of Interest

The authors declare no conflicts of interest.

Abbreviations

The following symbols are used in this manuscript:
Notation
A Pipe cross-sectional area;
a mix Maximum water hammer wave speed;
C Courant   constant ,   C 1 ;
C 1 Parameter related to the pipe support condition, 1;
D Inner diameter of the pipe;
E Pipe elasticity modulus;
e Pipe wall thickness;
f Darcy friction coefficient;
g Acceleration of gravity, 9.81 m/s2;
K l Liquid elasticity modulus;
K v Vapor elasticity modulus;
P Pressure;
P v Saturated vapor pressure;
P g Free gas partial pressure;
P const Constant pressure generated by the tank;
P s Pressure generated by the upstream tank at the steady flow;
P u Constant value after the upstream tank pressure is reduced;
t Time;
t c Valve closure time;
t d Variation time of the upstream tank pressure;
V Fluid velocity;
x Length along the pipe axis;
α Vapor volume fraction;
α const Constant vapor volume fraction;
θ Pipe inclination angle;
ρ Liquid–vapor mixture density;
ρ l Liquid density;
ρ v Vapor density;
Ψ Free gas volume;
Volume of the pipeline segment;
Δ t Time step;
Δ x Space step.
Subscripts
lLiquid;
vVapor;
sSteady flow;
pPrediction step;
cCorrection step;
0Standard state.

References

  1. Sadafi, M.; Riasi, A.; Nourbakhsh, S.A. Cavitating flow during water hammer using a generalized interface vaporous cavitation model. J. Fluids Struct. 2012, 34, 190–201. [Google Scholar] [CrossRef]
  2. Wylie, E.B.; Streeter, V.L.; Suo, L. Fluid Transients in Systems; Prentice Hall: Englewood Cliffs, NJ, USA, 1993; Volume 1. [Google Scholar]
  3. Fu, Y.; Zhang, S. Comparison of multiple machine learning models for the regression of water hammer with column separation. Phys. Fluids 2025, 37, 023361. [Google Scholar] [CrossRef]
  4. Ivljanin, B.; Stevanovic, V.D.; Gajic, A. Water hammer with non-equilibrium gas release. Int. J. Press. Vessel. Pip. 2018, 165, 229–240. [Google Scholar] [CrossRef]
  5. Pezzinga, G. Gas release and solution as possible mechanism of oscillation damping in water hammer flow. Water 2023, 15, 1942. [Google Scholar] [CrossRef]
  6. Daude, F.; Tijsseling, A.; Galon, P. Numerical investigations of water-hammer with column-separation induced by vaporous cavitation using a one-dimensional finite-volume approach. J. Fluids Struct. 2018, 83, 91–118. [Google Scholar] [CrossRef]
  7. Wan, W.; Zhou, Y.; Geng, C.; He, B. Numerical modeling of cavity collapse water hammer in pipeline systems: Internal mechanisms and influential factors of transient flow and secondary pressure rise dynamics. Phys. Fluids 2024, 36, 087167. [Google Scholar] [CrossRef]
  8. Zhang, Q.; Tian, Z.; Lu, S.; Kang, H. Numerical simulation of water hammer in pipeline system using efficient wave tracking method. Water Resour. Manag. 2023, 37, 3053–3068. [Google Scholar] [CrossRef]
  9. Bergant, A.; Simpson, A.R. Pipeline column separation flow regimes. J. Hydraul. Eng. 1999, 125, 835–848. [Google Scholar] [CrossRef]
  10. Saidani, A.; Fourar, A.; Massouh, F. Influence of temperature on transient flow with cavitation in copper pipe-rig. Model. Earth Syst. Environ. 2022, 8, 2449–2459. [Google Scholar] [CrossRef]
  11. Zhou, L.; Wang, H.; Bergant, A.; Tijsseling, A.S.; Liu, D.; Guo, S. Godunov-type solutions with discrete gas cavity model for transient cavitating pipe flow. J. Hydraul. Eng. 2018, 144, 04018017. [Google Scholar] [CrossRef]
  12. Sun, Q.; Hao, Y.; Cheng, P. Parametric analysis of discrete multiple-cavity models with the quasi-two-dimensional friction model for transient cavitating pipe flows. AQUA—Water Infrastruct. Ecosyst. Soc. 2022, 71, 355–372. [Google Scholar] [CrossRef]
  13. Pezzinga, G. MOC-Z Model of Transient Cavitating Flow in Viscoelastic Pipe. Water 2024, 16, 1610. [Google Scholar] [CrossRef]
  14. Urbanowicz, K.; Bergant, A.; Kodura, A.; Kubrak, M.; Malesińska, A.; Bury, P.; Stosiak, M. Modeling transient pipe flow in plastic pipes with modified discrete bubble cavitation model. Energies 2021, 14, 6756. [Google Scholar] [CrossRef]
  15. Adamkowski, A.; Lewandowski, M. Cavitation characteristics of shutoff valves in numerical modeling of transients in pipelines with column separation. J. Hydraul. Eng. 2015, 141, 04014077. [Google Scholar] [CrossRef]
  16. Adamkowski, A.; Lewandowski, M. A new method for numerical prediction of liquid column separation accompanying hydraulic transients in pipelines. J. Fluids Eng. 2009, 131, 071302. [Google Scholar] [CrossRef]
  17. Soares, A.K.; Martins, N.M.; Covas, D.I. Transient vaporous cavitation in a horizontal copper pipe. J. Hydraul. Res. 2017, 55, 731–736. [Google Scholar] [CrossRef]
  18. Li, C.; He, J.; Jia, W.; Yang, F.; Ban, J.; Qiu, B. Modeling transient cavitating flow in large drop crude oil pipelines. J. Pet. Sci. Eng. 2023, 220, 111241. [Google Scholar] [CrossRef]
  19. Bergant, A.; Simpson, A.R.; Tijsseling, A.S. Water hammer with column separation: A historical review. J. Fluids Struct. 2006, 22, 135–171. [Google Scholar] [CrossRef]
  20. Simpson, A.R.; Bergant, A. Numerical comparison of pipe-column-separation models. J. Hydraul. Eng. 1994, 120, 361–377. [Google Scholar] [CrossRef]
  21. Wylie, E.B. Simulation of vaporous and gaseous cavitation. J. Fluids Eng. 1984, 106, 307–311. [Google Scholar] [CrossRef]
  22. Bergant, A. Investigation of unsteady friction effects in transient two-phase pipe flow. J. Phys Conf. Ser. 2024, 2766, 012074. [Google Scholar] [CrossRef]
  23. Mousavifard, M.; Norooz, R. Numerical analysis of transient cavitating pipe flow by Quasi 2D and 1D models. J. Hydraul. Res. 2022, 60, 295–310. [Google Scholar] [CrossRef]
  24. Chen, W.; Jiang, J.; Long, Z.; Peng, L.; Jiang, Y.; Cheng, W. Numerical Dissipation Compensation in Liquid Column Separation: An Improved DVCM Approach. Water 2025, 17, 805. [Google Scholar] [CrossRef]
  25. Qiu, B.; Wu, J.; He, J.; Chen, R.; Nie, Q.; Zhu, J.; Li, Y. Numerical simulation of water hammer in liquid hydrogen pipeline considering unsteady friction and cavitation. Int. J. Hydrogen Energy 2025, 180, 151771. [Google Scholar] [CrossRef]
  26. Shu, J.-J. Modelling vaporous cavitation on fluid transients. Int. J. Press. Vessels Pip. 2003, 80, 187–195. [Google Scholar] [CrossRef]
  27. Pezzinga, G. Second viscosity in transient cavitating pipe flows. J. Hydraul. Res. 2003, 41, 656–665. [Google Scholar] [CrossRef]
  28. Pezzinga, G.; Santoro, V. Unitary framework for hydraulic mathematical models of transient cavitation in pipes: Numerical analysis of 1D and 2D flow. J. Hydraul. Eng. 2017, 143, 04017053. [Google Scholar] [CrossRef]
  29. Hadj-Taieb, L.; Hadj-Taieb, E.; Thirriot, C. Numerical simulation of transient vaporous cavitating flow in horizontal pipelines. Int. J. Model. Simul. 2007, 27, 347–354. [Google Scholar] [CrossRef]
  30. Sumam, K.; Thampi, S.; Sajikumar, N. An alternate approach for modelling of transient vaporous cavitation. Int. J. Numer. Methods Eng. 2010, 63, 564–583. [Google Scholar] [CrossRef]
  31. Brennen, C.E. Cavitation and Bubble Dynamics; Cambridge University Press: Cambridge, UK, 2014. [Google Scholar] [CrossRef]
  32. Sanada, K.; Kitagawa, A.; Takenaka, T. A study on analytical methods by classification of column separations in a water pipeline. Trans. Japan Soc. Mech. Eng. 1990, 56, 585–593. [Google Scholar] [CrossRef]
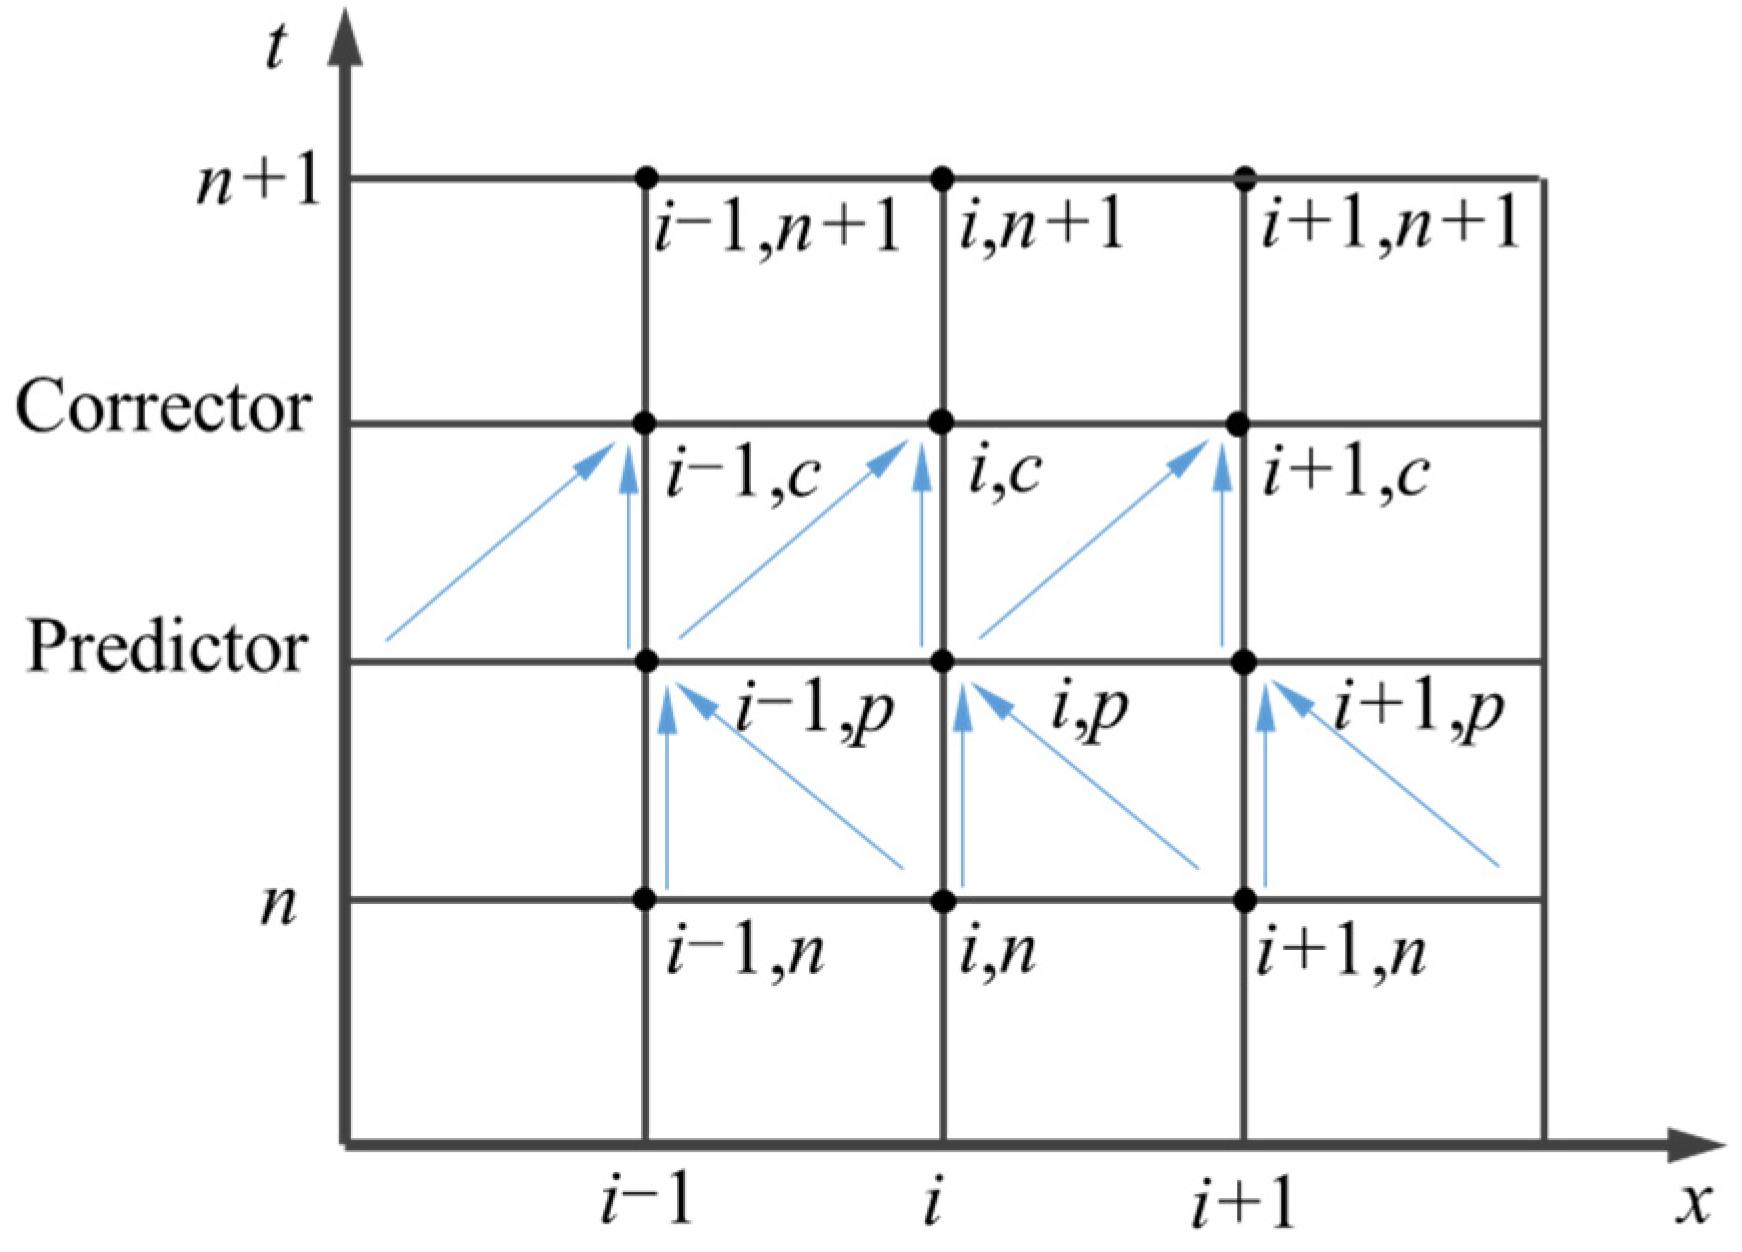
Figure 1. MacCormack scheme grid diagram.
Processes 13 03510 g001
Figure 2. Solution flowchart.
Processes 13 03510 g002
Figure 3. Pressure at the valve with different numbers of segments when the initial velocity is 0.3 m/s.
Processes 13 03510 g003aProcesses 13 03510 g003b
Figure 4. Pressure at the valve with different numbers of segments when the initial velocity is 1.4 m/s.
Processes 13 03510 g004
Figure 5. Vapor volume fraction at the valve.
Processes 13 03510 g005
Figure 6. Effect of different initial vapor volume fractions on pressure at the valve.
Processes 13 03510 g006
Figure 7. Predicted results of homogeneous flow model and DGCM for Bergant’s experiment.
Processes 13 03510 g007
Figure 8. Pressure at 120 m along the pipe for different numbers of segments when the initial velocity is 1.50 m/s.
Processes 13 03510 g008
Figure 9. Pressure at the valve for different numbers of segments when the initial velocity is 1.45 m/s.
Processes 13 03510 g009
Figure 10. Vapor volume fraction at 120 m along the pipe and at the valve.
Processes 13 03510 g010
Figure 11. Effect of different initial vapor volume fractions on pressure at 120 m along the pipeline and at the valve.
Processes 13 03510 g011
Figure 12. Predicted results of the homogeneous flow model and DGCM for Sanada’s experiment.
Processes 13 03510 g012
Table 1. Conditions of Bergant’s experiments.
Cavitation TypeUpstream Pressure (m)Steady Velocity (m/s)
Moderate Cavitation220.3
Severe Cavitation221.4
Table 2. Conditions of Sanada’s experiments.
Cavitation TypeUpstream Pressure
(kPa)
Downstream Pressure
(kPa)
Steady Velocity
(m/s)
Midstream Cavitation558.97198.0651.50
Downstream Cavitation490.32598.0651.45
Disclaimer/Publisher’s Note: The statements, opinions and data contained in all publications are solely those of the individual author(s) and contributor(s) and not of MDPI and/or the editor(s). MDPI and/or the editor(s) disclaim responsibility for any injury to people or property resulting from any ideas, methods, instructions or products referred to in the content.