Abstract
Efficient coalbed methane (CBM) recovery combined with carbon dioxide (CO2) sequestration is a promising strategy for sustainable energy production and greenhouse gas mitigation. However, the molecular mechanisms controlling pressure-dependent CH4 displacement by CO2 in coal nanopores remain insufficiently understood. In this study, molecular dynamics simulations were conducted to investigate CO2-driven CH4 recovery in a slit-pore coal model under driving pressures of 15, 20, and 25 Mpa. The simulations quantitatively captured the competitive adsorption, diffusion, and migration behaviors of CH4, CO2, and water, providing insights into how pressure influences enhanced coalbed methane (ECBM) recovery at the nanoscale. The results show that as the pressure increases from 15 to 25 Mpa, the mean residence time of CH4 on the coal surface decreases from 0.0104 ns to 0.0087 ns (a 16% reduction), reflecting accelerated molecular mobility. The CH4–CO2 radial distribution function peak height rises from 2.20 to 3.67, indicating strengthened competitive adsorption and interaction between the two gases. Correspondingly, the number of CO2 molecules entering the CH4 region grows from 214 to 268, demonstrating higher invasion efficiency at elevated pressures. These quantitative findings illustrate a clear shift from capillary-controlled desorption at low pressure to pressure-driven convection at higher pressures. The results provide molecular-level evidence for optimizing CO2 injection pressure to improve CBM recovery efficiency and CO2 storage capacity.
1. Introduction
Coalbed methane (CBM) is an unconventional natural gas resource, primarily consisting of methane (CH4) adsorbed onto the internal surfaces of coal matrix pores rather than freely occupying the pore space [1,2]. With the growing demand for clean and low-carbon energy, CBM has attracted increasing global attention as both a valuable energy source and a means to reduce greenhouse gas emissions [3,4]. However, the strong adsorption of CH4 on coal surfaces and the complex pore structure of coal reservoirs present significant challenges for efficient CBM extraction [5,6].
At the same time, carbon dioxide (CO2) has emerged as a major contributor to global climate change due to its greenhouse effect [7]. Injecting CO2 into coal seams offers an effective approach for long-term geological storage of CO2 while simultaneously enhancing CH4 displacement, owing to coal’s stronger adsorption affinity for CO2 over CH4 [8,9,10]. This enhanced coalbed methane recovery (ECBM) process offers dual benefits: improving CBM production while mitigating atmospheric CO2 concentrations [11,12]. Gaining insight into the competitive adsorption and desorption behaviors of CH4 and CO2 in coal seams is crucial for optimizing ECBM operations and enhancing gas recovery efficiency [8,13]. A clear understanding of how these gases interact with the coal matrix can help reveal the fundamental mechanisms of displacement, predict gas migration behavior, and assess the long-term storage security of injected CO2 [12,14]. Such knowledge is crucial for guiding field-scale operations and developing effective injection strategies. It also helps promote the sustainable development of CBM exploitation and contributes to global carbon reduction goals [15].
Recent progress in molecular simulations has significantly advanced our understanding of gas adsorption and transport in coal nanopores. For instance, Jia et al. employed grand canonical Monte Carlo (GCMC) coupled with molecular dynamics (MD) on a gas-fat coal macromolecular model. They found that CO2 achieves substantially higher saturation adsorption than CH4 across temperatures of 273–313 K and pressures of 0.01–15 Mpa. Both pore enlargement and increased pressure also enhance molecular mobility [16]. Several studies have clarified how coal’s physical properties and rank control adsorption capacity and selectivity. Dong et al. investigated the influence of pore characteristics and surface functional groups. They showed that micropore volume, specific surface area, and polar groups significantly enhance CO2 adsorption compared to CH4, thereby improving CO2/CH4 selectivity [17]. Li et al. compared coals of different ranks and found that higher-rank coals (and more aromatic/rigid structures) generally favor CO2 adsorption, while moisture further modifies these trends by depressing overall adsorption [18]. The competitive displacement (ECBM-relevant) behavior of CH4 by CO2 has been widely investigated in mixed-component simulations. Zhou et al. used GCMC + MD to study CO2/CH4/H2O mixtures in brown coal, reporting that CO2 preferentially adsorbs over CH4, that moisture substantially reduces both gases’ adsorption and self-diffusion coefficients, and that competitive adsorption substantially alters diffusion pathways—insights directly relevant to CO2-driven CH4 recovery [19].
Work addressing coal-scale and pore-scale transport has also progressed. Confinement and pore size effects on diffusion have been quantified. Combined GCMC/MD and related studies show that nanoconfinement reduces absolute self-diffusivities compared to bulk. High temperatures and lower pressures generally increase CH4 mobility, and pore enlargement tends to favor CH4 surface mobility over CO2, affecting displacement efficiency and timescales in ECBM scenarios [20]. Experimental and field-oriented simulation studies complement molecular work: subbituminous and other coal-type models (e.g., Fagorite et al. [21]) confirm that coal quality and pore morphology control adsorption isotherms under reservoir-relevant temperatures and pressures, while studies of supercritical CO2 interactions report that ScCO2 treatment can alter pore structure (increasing pore volume/surface area) and induce coal swelling or geochemical effects that in turn influence both storage capacity and permeability.
Despite these advances, current research still faces several critical limitations. Most previous studies have focused on the effects of temperature, coal structure, or surface chemistry on CH4–CO2 interactions. In contrast, the influence of pressure—a key thermodynamic and kinetic variable controlling both adsorption equilibrium and displacement driving force—has received comparatively little attention. In realistic coal seams, pressure not only determines the relative adsorption strength between CO2 and CH4 but also governs the energy barriers for molecular diffusion and the efficiency of CH4 displacement. However, the microscopic mechanisms by which pressure regulates competitive adsorption, diffusion pathways, and interfacial substitution dynamics remain largely unresolved. Consequently, the lack of systematic understanding of pressure-dependent displacement behavior represents a major knowledge gap in both fundamental theory and engineering applications of enhanced coalbed methane (ECBM) recovery [22,23].
To bridge this gap, the present study conducts a systematic molecular-scale investigation of the pressure-dependent CH4–CO2 competitive displacement process in coal nanopores. Unlike most previous studies that primarily focused on temperature or coal structure effects, this work uniquely elucidates how varying pressure governs the molecular mechanisms of competitive adsorption, diffusion, and displacement efficiency. The novelty of this study lies in its quantitative exploration of pressure-regulated CH4–CO2 substitution dynamics, the integration of adsorption–diffusion–migration analysis under realistic thermodynamic conditions, and the establishment of pressure–performance correlations relevant to field-scale ECBM operations. By quantitatively analyzing how pressure modifies adsorption selectivity, gas migration behavior, and overall recovery efficiency, this work aims to clarify the mechanistic role of pressure in governing ECBM processes. The insights obtained will not only deepen the molecular understanding of pressure-regulated displacement mechanisms but also provide a theoretical basis for designing pressure-optimized CO2 injection strategies, thereby improving CH4 recovery performance and promoting long-term CO2 sequestration under realistic reservoir conditions.
2. Simulation Methods and Models
2.1. Simulation Models
Molecular dynamics simulations were performed using Gromacs version 5.0.7. The simulation process is shown in Figure 1. A slit-pore model was constructed to represent the coal matrix, consisting of two parallel graphene sheets. The coal matrix was modeled as parallel graphene sheets, which is a widely adopted simplification in molecular simulations of coal–gas systems. This approach effectively captures the essential π–π interactions and adsorption characteristics of the coal aromatic structure. However, this model does not fully capture the chemical and structural heterogeneity of real coals. Examples include cross-linked macromolecular networks, mineral inclusions, and oxygen-containing functional groups. Therefore, the results should be interpreted as reflecting the intrinsic adsorption and displacement behaviors on idealized carbon surfaces rather than the complete complexity of natural coal matrices. The lateral dimensions of each graphene sheet were fixed at 10.8 nm × 5.68 nm, and the sheets were positioned to form a uniform slit pore. The overall simulation box was set to 45 nm × 5.68 nm × 6.18 nm, with sufficient vacuum regions at both ends along the x-direction to eliminate artificial interactions between periodic images [24]. The pore space between the two graphene sheets was initially filled with 8175 water molecules and 2000 CH4 molecules, representing the in situ coalbed methane (CBM) environment. On the left side of the pore, 800 carbon dioxide (CO2) molecules were placed to simulate CO2 injection. An additional graphene sheet was fixed at the far-left boundary, which was employed as a movable piston to apply external pressure and drive the CO2 molecules toward the coal pore, thereby mimicking the displacement of CH4 by injected CO2 (Figure 2). The piston was gradually advanced to achieve target pressures of 15 Mpa, 20 Mpa, and 25 Mpa, corresponding to typical subsurface conditions for enhanced coalbed methane (ECBM) recovery [25,26]. Periodic boundary conditions were implemented along all three axes, with the vacuum layers ensuring that the CO2 injection process occurred without interference from image molecules. This configuration enabled direct investigation of the competitive adsorption and displacement behavior of CO2 and CH4 in confined environments, as well as assessment of CH4 recovery efficiency at different injection pressures.
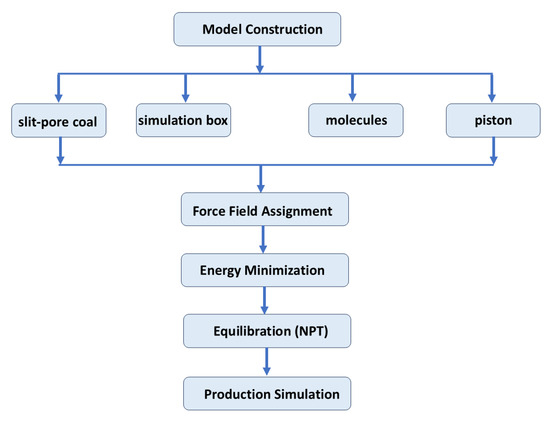
Figure 1.
Simulation flowchart.
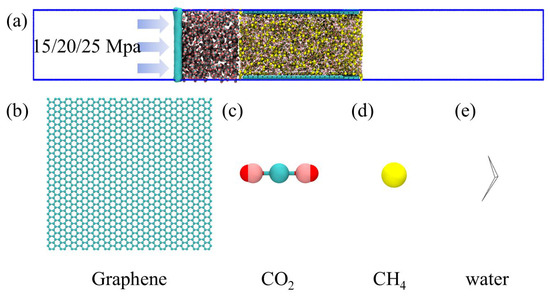
Figure 2.
(a) The initial structure diagram of carbon dioxide displacement of coalbed methane; structural diagram of (b) coal seam, (c) carbon dioxide, (d) CH4, and (e) water.
2.2. Simulation Methods
Graphene sheets were represented using the OPLS-AA force field [27], while water molecules were represented by the TIP4P model [28]. This approach incorporates virtual sites and utilizes the SETTLE algorithm to preserve molecular rigidity. CH4 was described using the OPLS-UA model [29], where all interaction parameters are assigned to the carbon atom to represent the united-atom approximation. Carbon dioxide (CO2) molecules were modeled using the EPM2 force field [30], which accurately captures both intramolecular flexibility and intermolecular interactions.
Lennard–Jones (LJ) interactions between distinct atom types were computed using the Lorentz–Berthelot mixing rule, a standard method for determining cross-interaction parameters in molecular dynamics simulations. Additionally, for the graphene sheet acting as a movable piston to displace CH4, its LJ parameters were substituted with those of the oxygen atom in the TIP4P water model. The acceleration of the graphene sheet is calculated according to the following equation:
where Pn is the pressure exerted along the Z direction; N is the C atom in the graphene sheet; and mc is the mass of the C atom, i.e., 1.9927 × 10⁻²⁶ kg; Ly and Lz denote the box dimensions along the Y and Z axes, respectively. According to the above equation, the pressure of 15/20/25 Mpa corresponds to the acceleration of 0.01835/0.024478/0.030597 nm/ps2 for the graphene sheets. For particle pairs i and j, the Lennard-Jones distance parameter (σ) is computed using Formula (1):
The Lennard–Jones potential energy parameter (ε) is defined by Formula (2):
Short-range non-bonded interactions were truncated at 1.20 nm, while long-range electrostatics were calculated using the Particle Mesh Ewald (PME) method, where the total electrostatic energy is decomposed into real-space, reciprocal-space, and self-interaction contributions, as expressed in Formula (3):
The real-space contribution is given by Formula (5):
The reciprocal-space contribution is given by Formula (6):
The self-interaction correction is given by Formula (7):
In this equation, qi represents the charge of particle i, while rij is the distance between particles i and j. The parameter κ is the Ewald splitting factor that separates real-space and reciprocal-space interactions, and erfc denotes the complementary error function. V corresponds to the volume of the simulation cell, and k is the reciprocal-space wave vector.
Simulations were conducted with a time step of 2 fs, employing periodic boundary conditions in all three directions (x, y, and z). The initial configuration underwent energy minimization using the steepest descent algorithm to remove unfavorable atomic overlaps and high-energy contacts. Thereafter, the system was equilibrated in the isothermal–isobaric (NPT) ensemble for 2 ns at 350 K and 15 Mpa. Temperature and pressure were regulated using the V-rescale thermostat and Berendsen barostat, with coupling time constants of 0.1 ps and 2 ps, respectively. Following equilibration, a 20 ns production run was performed in the canonical (NVT) ensemble to collect data for analysis, during which the Nosé–Hoover thermostat with a 4 ps coupling time ensured accurate canonical sampling. A list of all abbreviations used in this study is provided in Table S1 of the Supporting Information.
3. Results and Discussion
3.1. The Structural Evolution of CO2 Displacement of CH4 Under Different Driving Pressures
At a driving pressure of 15 Mpa (Figure 3a), CH4 first accumulates on the coal surface as cone-shaped bubbles. Some CH4 is also dispersed within the aqueous phase. Under the applied pressure gradient, the free CH4 bubbles in the water phase gradually migrate toward the outlet boundary, while those adsorbed on the coal surface detach and move along it. The displacement process starts from the lower regions, and by approximately 5 ns, most CH4 bubbles have been expelled, leaving only a small fraction dissolved in the aqueous phase. During this period, CO2 mainly accumulates near the coal pore entrance. It forms a curved meniscus at the water interface but penetrates only slightly into the bulk aqueous phase.
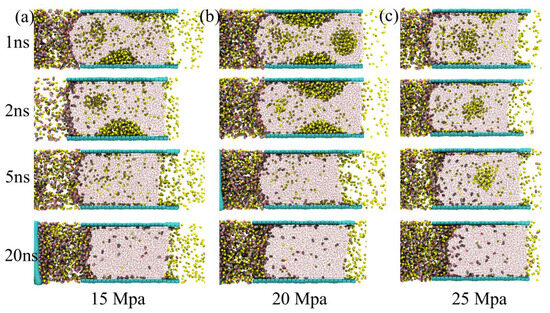
Figure 3.
The structural evolution of CH4 driven by CO2 under driving pressures of (a) 15 Mpa, (b) 20 Mpa, and (c) 25 Mpa.
At a driving pressure of 20 Mpa (Figure 3b), the displacement mechanism remains similar, but bubble interactions become more dynamic. Three distinct CH4 bubbles are formed: two are initially adsorbed on the coal surface, while one moves freely within the water phase. Over time, the free bubble moves upward and merges with the upper adsorbed bubble. This coalescence results in two larger bubbles. These bubbles then migrate along the coal surface and are gradually expelled from the pore space under the applied pressure.
At 25 Mpa, the displacement becomes markedly more intense (Figure 3c). CH4 bubbles are rapidly expelled before they can fully stabilize or form persistent adsorption structures on the coal surface. As a result, only a small, loosely structured CH4 bubble remains transiently within the water phase. The bubble shrinks as CH4 is displaced. It is completely removed by around 5 ns, showing the highest displacement efficiency among the three pressure conditions.
Overall, methane displacement by CO2 strongly depends on the applied pressure. At lower pressure (15 Mpa), capillary-controlled processes dominate, with methane forming well-defined bubbles on the coal surface. Methane detaches from adsorption sites and gradually migrates through the aqueous phase. This reflects a slow, stepwise replacement mechanism. The limited penetration of CO2 into the water phase at this stage suggests that CO2 adsorption is restricted to the coal interface, with insufficient driving force to overcome the interfacial energy barrier between CO2 and water. As the pressure increases to 20 Mpa, the enhanced driving force reduces the stability of individual methane bubbles, promoting bubble coalescence and surface migration. The merging of mobile and adsorbed bubbles facilitates a more continuous displacement pathway, allowing methane to be expelled more efficiently. This behavior reflects a transition from localized desorption to a more cooperative displacement mechanism, in which hydrodynamic forces begin to dominate over capillary resistance, accelerating the expulsion of methane from the coal pore network. At the highest pressure tested (25 Mpa), the displacement process is dominated by pressure-driven convection, leaving insufficient time for methane to reorganize into stable bubble structures on the coal surface. Instead, methane is rapidly swept from the pore space, with only a transient and loosely structured bubble remaining in the aqueous phase before complete removal by approximately 5 ns. This indicates that at high pressures, the driving force overwhelms both adsorption energy and interfacial resistance, enabling near-complete methane displacement. These observations collectively suggest that the efficiency of CO2-driven methane recovery is controlled by the competition between adsorption affinity, capillary forces, and external pressure gradients. At low pressures, adsorption and capillarity dominate, resulting in gradual displacement, while at high pressures, the system shifts to a regime where pressure-driven flow dictates the dynamics. Understanding this transition provides valuable insights into optimizing enhanced coalbed methane (ECBM) operations, allowing for the design of injection strategies that balance recovery efficiency and storage stability.
The temporal evolution of methane distribution under different driving pressures was examined using two-dimensional (2D) density contour maps. These maps were averaged over three time intervals: 1–2 ns, 2–5 ns, and 5–20 ns. These maps illustrate the spatial migration and phase behavior of methane during CO2-driven displacement.
At a driving pressure of 15 Mpa (Figure 4a), the 1–2 ns contour reveals several well-defined methane bubbles, with high-density regions mainly distributed along the lower coal surface and dispersed within the aqueous phase. During the 2–5 ns period, the methane density within these bubbles decreases markedly, reflecting gradual desorption and migration under the influence of CO2 injection. By 5–20 ns, methane in the aqueous phase is almost entirely displaced. No residual bubbles are observed, indicating near-complete replacement of methane by CO2 at this pressure.
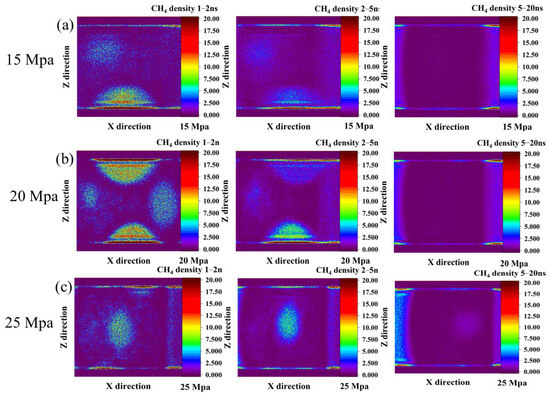
Figure 4.
The evolution of CH4 density cloud maps over time under driving pressures of (a) 15 Mpa, (b) 20 Mpa, and (c) 25 Mpa.
When the driving pressure increases to 20 Mpa (Figure 4b), a more intricate initial methane distribution is observed. In the 1–2 ns map, four distinct methane bubbles appear—two adsorbed on the upper and lower coal surfaces, and two located near the CO2 injection side and the outlet boundary within the aqueous phase. During the 2–5 ns interval, the bubbles near the upper surface, injection side, and outlet exhibit a pronounced decrease in density, with the outlet bubble disappearing entirely. In contrast, the bubble attached to the lower coal surface remains relatively stable, suggesting stronger adsorption at this site. By 5–20 ns, all bubbles are fully removed, demonstrating efficient methane displacement at this intermediate pressure.
At the highest driving pressure of 25 Mpa (Figure 4c), methane removal occurs much more rapidly. In the 1–2 ns density map, only a single, mobile methane bubble is observed within the aqueous phase, surrounded by a low-density region of dispersed methane molecules. During 2–5 ns, this bubble remains as the sole high-density feature, while other methane molecules are quickly stripped from the system. By 5–20 ns, even this last bubble is entirely expelled, leaving no detectable methane in the pore space or water phase.
Overall, the density evolution indicates a clear pressure-dependent displacement mechanism. At lower pressures, methane is removed progressively through desorption and bubble migration. At higher pressures, rapid and direct expulsion dominates. These findings highlight the transition from a gradual, capillary-controlled displacement regime to a fast, pressure-driven convective regime as the driving pressure increases.
3.2. Desorption Data and Structural Evolution of Methane Bubbles
The mean residence time of CH4 on the coal surface exhibits a clear decreasing trend as the driving pressure increases (Figure 5a). At 15 Mpa, the residence time is 0.01039 ns, which decreases to 0.00915 ns at 20 Mpa and further to 0.00873 ns at 25 Mpa. Increasing the pressure from 15 to 20 Mpa reduces the residence time by about 11.9%. A further increase from 20 to 25 Mpa leads to an additional 4.6% decrease, giving an overall reduction of approximately 16.0%. This progressive decrease reflects the enhanced displacement efficiency at higher pressures. At lower pressures, CH4 molecules remain adsorbed on the coal surface for longer periods due to stronger adsorption affinity and the stabilizing effect of capillary forces. As the driving pressure increases, the external force provided by CO2 injection becomes sufficient to overcome these adsorption and interfacial barriers, leading to faster detachment and migration of CH4 molecules. Consequently, CH4 is expelled more rapidly through pressure-driven convective transport rather than slow desorption and bubble migration. This indicates a shift in the dominant displacement mechanism as pressure increases.
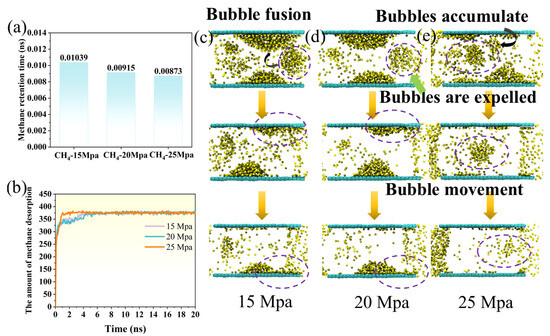
Figure 5.
(a) The retention time of methane on the coal seam surface under different driving pressures; (b) the variation in the number of methane molecules desorbed from the coal seam surface over time under different driving pressures. Dynamic evolution of methane bubbles under driving pressures of (c) 15 Mpa, (d) 20 Mpa, and (e) 25 Mpa.
The number of CH4 molecules desorbed from the coal surface under different displacement pressures shows distinct stage-dependent behavior over time (Figure 5b). In the initial stage (0–1 ns), methane desorption occurs rapidly, and the number of desorbed molecules increases sharply in all three systems. The 25 Mpa system shows a slightly higher desorption rate than the 20 Mpa and 15 Mpa systems, indicating that a higher driving pressure more effectively promotes CH4 desorption from the coal surface at the early stage. During the intermediate stage (1–5 ns), the desorption rate gradually decreases, and the curve flattens. This suggests that most easily desorbed CH4 molecules have been displaced. The process becomes increasingly limited by diffusion and the availability of adsorption sites. In the final stage (5–20 ns), the number of desorbed molecules at the three pressures stabilizes, eventually reaching 375, 373, and 372 molecules, respectively, indicating that the displacement process approaches equilibrium within this timescale. Overall, higher displacement pressure accelerates the early desorption rate. However, the final number of desorbed molecules converges across pressures. This implies that elevated pressure mainly affects the initial desorption kinetics rather than the ultimate desorption capacity.
The dynamic evolution of methane bubbles in coal seams exhibited distinct behaviors under different driving pressures. At 15 Mpa (Figure 5c), free methane bubbles dispersed in the aqueous phase were attracted to the bubbles adsorbed on the coal surface, leading to coalescence. Subsequently, the conical surface bubbles gradually disintegrated from their bases and were released. When the driving pressure increased to 20 Mpa (Figure 5d), the free bubbles in the aqueous phase were no longer in close proximity to the surface-adsorbed bubbles, preventing coalescence; these bubbles were directly released, while the disintegration patterns of the coal surface bubbles remained similar to those observed at 15 Mpa. Under a higher pressure of 25 Mpa (Figure 5e), surface bubbles had not formed before release. Only a single free bubble persisted in the aqueous phase, which disintegrated prior to being expelled. These observations indicate that increasing driving pressure accelerates bubble release and suppresses the formation and coalescence of surface-adsorbed methane bubbles, highlighting the pressure-dependent dynamics of gas migration in coal seams.
The temporal evolution of methane molecules under a driving pressure of 15/20/25 Mpa was systematically analyzed in terms of retained, released, and lost CH4. At a driving pressure of 15 Mpa (Figure 6a), the number of retained methane molecules in the coal gradually decreased from 2000 at 0 ns to approximately 180–200 after 20 ns, indicating a continuous release of methane from the coal matrix. Concurrently, the number of released methane molecules in the aqueous phase increased rapidly during the initial 2–3 ns, from 0 to over 1000 molecules. It then gradually approached a plateau near 1400 molecules. This reflects the main phase of methane migration from coal to the surrounding water. The number of lost methane molecules (representing CH4 mixed with CO2) increased sharply at the beginning, reaching around 480 molecules within 1 ns, and then fluctuated between 400–450 molecules throughout the remaining simulation time.
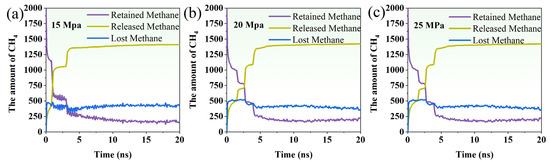
Figure 6.
The variation in the number of retained methane, released methane, and lost methane molecules over time under the driving pressure of (a) 15 Mpa, (b) 20 Mpa, and (c) 25 Mpa.
Under a driving pressure of 20 Mpa (Figure 6b), the number of retained methane molecules decreases steadily from 2000 at 0 ns to approximately 180–200 at 20 ns, similar to the 15 Mpa case but with a slightly slower initial decline, suggesting a more gradual release from the coal matrix. The number of released methane molecules in the aqueous phase rises rapidly during the first 2–3 ns—from 0 to over 700—and continues to increase before leveling off at around 1420–1425 molecules. This indicates that methane release is more temporally distributed than at 15 Mpa, likely due to the weaker interaction between free bubbles and surface-attached bubbles under higher pressure. The number of lost methane molecules—representing those displaced by CO2—rises sharply within the first nanosecond to about 500, then fluctuates moderately around 350–400 throughout the remainder of the simulation, indicating sustained CO2-driven displacement.
At a driving pressure of 25 Mpa (Figure 6c), the number of retained methane molecules decreased rapidly from 2000 at 0 ns to roughly 180–200 by 20 ns, showing a fast depletion of coal-adsorbed methane. The released methane molecules in the aqueous phase increased sharply during the initial 2–3 ns, reaching over 700 molecules, and gradually approached a plateau around 1424 molecules. This indicates that methane was quickly expelled from the coal matrix into the aqueous phase. The lost methane molecules, representing methane displaced and incorporated into CO2, initially rose to approximately 437–525 molecules in the first nanoseconds, and then fluctuated around 350–400 molecules throughout the simulation.
Compared with lower driving pressures (15 and 20 Mpa), the 25 Mpa condition exhibited the fastest depletion of coal-retained methane and the earliest establishment of the quasi-steady state in the aqueous phase, with surface-adsorbed bubbles having minimal opportunity to form or coalesce. These trends demonstrate that increasing the driving pressure accelerates methane release and CO2-driven displacement, while reducing the fraction of methane temporarily adsorbed on the coal surface.
3.3. Root Mean Square Displacements and Radial Distribution Functions of CH4, CO2, and Water Were Analyzed Under Varying Driving Pressures
The mean square displacement (MSD) of CH4, CO2, and water molecules was computed to examine their diffusion behavior over time under driving pressures of 15, 20, and 25 Mpa. Specifically, the MSD at 15 Mpa was analyzed to characterize the initial diffusion dynamics of the system (Figure 7a). As shown in the data, CH4 molecules exhibited the highest MSD, increasing steadily from 0 to approximately 1781 nm2/ns over 20 ns, indicating rapid diffusion through the system. CO2 molecules showed moderate mobility, with MSD values rising from 0 to around 191 nm2/ns, suggesting slower but noticeable diffusion, likely due to interactions with both coal and water phases. In contrast, water molecules displayed the lowest MSD, increasing gradually to about 68 nm2/ns, reflecting their restricted mobility and strong hydrogen-bond network in the aqueous phase.
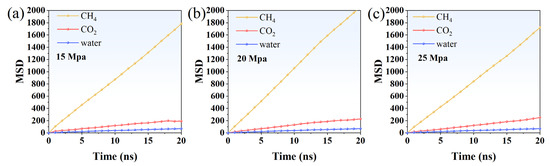
Figure 7.
MSD of CH4, CO2, and water under driving pressure of (a) 15 Mpa, (b) 20 Mpa, and (c) 25 Mpa.
The MSD profiles of CH4, CO2, and water molecules at a driving pressure of 20 Mpa (Figure 7b) reveal distinct diffusion characteristics compared to those observed at 15 Mpa. Initially, CH4 molecules exhibit a rapid rise in MSD, reaching approximately 1058 nm2/ns by 10 ns and continuing to increase to about 2052 nm2/ns at 20 ns. This trend indicates enhanced methane mobility under the higher pressure, suggesting that the driving force is sufficient to overcome adsorption resistance at the coal surface. In contrast, CO2 molecules display a more gradual increase, with their MSD growing steadily to around 227 nm2/ns over the same period. This moderate mobility reflects their role in the displacing phase, where frequent interactions with both methane and water molecules hinder their free diffusion. Water molecules show the most constrained behavior, with the MSD only reaching roughly 70 nm2/ns, highlighting their strong hydrogen bonding and structural confinement within the coal pores. Overall, the elevated pressure not only accelerates methane diffusion but also intensifies molecular competition between CO2 and water within the porous network.
At a driving pressure of 25 Mpa (Figure 7c), the diffusion behavior of CH4, CO2, and water molecules demonstrates a markedly different pattern compared to lower pressures. The MSD of CH4 molecules shows a steady but slightly slower initial increase, reaching approximately 844 nm2/ns by 10 ns and gradually rising to about 1719 nm2/ns at 20 ns. This suggests that under the high driving pressure, methane experiences rapid displacement but is also subject to strong competitive interactions with CO2, which limit its free diffusion during the early stage. In contrast, CO2 molecules display a pronounced enhancement in mobility relative to lower pressures, with their MSD increasing to roughly 251 nm2/ns by 20 ns. This indicates that at 25 Mpa, CO2 not only acts as the dominant displacing phase but also penetrates deeply into the coal pore structure, facilitating methane release. Water molecules, however, remain highly constrained, with their MSD rising slowly to around 69 nm2/ns, reflecting the persistent influence of hydrogen bonding and pore confinement. The overall trend highlights that increasing the driving pressure intensifies molecular competition, accelerates CO2 intrusion, and slightly suppresses methane’s independent diffusion as displacement becomes more aggressive.
The structural evolution of CH4 under different driving pressures was examined by analyzing the radial distribution functions (RDFs) for CH4–CO2, CH4–water, and CH4–graphene (GRA) pairs. RDF analysis provides a quantitative description of local molecular arrangements, revealing how intermolecular interactions and spatial correlations evolve with pressure. By comparing the RDF profiles at 15, 20, and 25 Mpa, insights into the adsorption behavior, competitive interactions, and confinement effects of CH4 within the system can be obtained. This comparison is crucial for understanding the mechanisms governing CH4 displacement and migration during CO2 injection.
For the CH4-CO2 pair, the RDF profile exhibits a pronounced first peak at approximately 3.55 Å, with a peak height of around 2.20, indicating a strong local structuring between CH4 and carbon dioxide molecules (Figure 8a). This suggests that CO2 molecules preferentially aggregate near CH4 within the coal matrix, driven by favorable van der Waals interactions and competitive adsorption processes. Beyond 4.0 Å, the RDF gradually decreases and stabilizes after 6.5 Å, reflecting the transition from a structured local environment to a more random molecular distribution. This behavior implies that CH4 and CO2 molecules form a well-defined first coordination shell, followed by weaker, longer-range interactions. The strong first peak also demonstrates the effectiveness of CO2 in approaching and displacing CH4 molecules from adsorption sites at this driving pressure. In comparison, the CH4–water RDF displays a relatively lower first peak, located near 3.35 Å, with a peak height of about 0.82. This indicates weaker CH4–water interactions, primarily due to the hydrophobic nature of CH4 and the strong hydrogen-bond network among water molecules that limits methane’s proximity. The RDF remains low and decays smoothly, suggesting that water molecules do not form a stable solvation shell around CH4 under these conditions. For CH4-GRA, the RDF increases gradually without a sharp peak, with a slight elevation starting around 3.15 Å and reaching approximately 0.87 by 8.0 Å. This gradual increase indicates that CH4 molecules adsorb onto the graphene surface in a relatively delocalized fashion, without a dominant specific binding distance. Such a profile indicates that the graphene layer acts as a stable substrate, allowing CH4 molecules to distribute relatively uniformly across its surface rather than forming strong, localized adsorption sites. Overall, at 15 Mpa, the RDF results suggest that CO2 exhibits the strongest affinity with CH4, enabling effective competitive adsorption and displacement, while water interacts weakly with CH4, and graphene primarily provides a physical boundary for methane distribution.
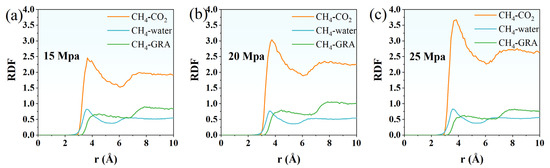
Figure 8.
RDF of CH4-CO2, CH4–water, and CH4-GRA under driving pressure of (a) 15 Mpa, (b) 20 Mpa, and (c) 25 Mpa.
At 20 Mpa (Figure 8b), the RDF profiles of CH4-CO2, CH4–water, and CH4-GRA show similar overall trends to those observed at 15 Mpa but with notable differences in peak intensities and distributions. For the CH4–CO2 pair, the first RDF peak becomes noticeably sharper and higher at 20 Mpa compared with 15 Mpa. The primary peak height increases from approximately 2.20 at around 3.55 Å under 15 Mpa to about 2.75 at the same position when the pressure is raised to 20 Mpa. In addition, the second coordination shell beyond 4.5 Å becomes more pronounced as the pressure increases, indicating a denser and more ordered local packing of CO2 molecules around CH4. These results demonstrate that higher driving pressure promotes closer and stronger interactions between methane and CO2, thereby enhancing the ability of CO2 to displace methane within the pore space. In contrast, the CH4–water RDF exhibits only a slight change with increasing pressure. The first peak height decreases slightly from roughly 0.82 at 15 Mpa to about 0.76 at 20 Mpa, suggesting that CH4–water interactions remain weak and are only marginally affected by pressure. This trend reflects the stable hydrogen-bonded network of water molecules, which limits direct association with methane and maintains a degree of hydrophobic exclusion. The CH4–GRA RDF shows a moderate increase at larger distances, with the value at around 8 Å rising from approximately 0.88 at 15 Mpa to about 1.04 at 20 Mpa. This indicates that methane molecules tend to distribute more uniformly near the graphene surface under higher pressure, which complements the stronger CH4–CO2 association observed at elevated pressures.
Under a driving pressure of 25 Mpa (Figure 8c), the RDF of the CH4-CO2 pair exhibits a pronounced increase in local structuring, with the first peak reaching approximately 3.67 at around 3.75 Å, higher than the 3.37 observed at 20 Mpa. This indicates that elevated pressure strengthens the local interactions between methane and CO2 molecules, facilitating the displacement of CH4 from the coal matrix. The second coordination shell beyond 4.5 Å also becomes more prominent, suggesting a more compact molecular arrangement under higher pressure. For the CH4–water pair, the first peak of the RDF is around 0.82, showing a slight increase compared to 20 Mpa, indicating that the weak interactions between CH4 and water molecules are only marginally influenced by pressure. Water molecules largely maintain their hydrogen-bonded network, limiting direct interactions with CH4. The RDF of CH4-GRA shows a first peak of approximately 0.81, slightly higher than the 0.78 observed at 20 Mpa, indicating that adsorption of CH4 on the graphene surface is moderately enhanced under higher pressure. However, the overall trend suggests that CH4–GRA interactions are relatively insensitive to pressure variations. The RDF of CH4-GRA shows a first peak of approximately 0.78 at 25 Mpa, slightly lower than the 0.81 observed at 20 Mpa, indicating that adsorption of CH4 on the graphene surface is slightly weakened under higher pressure. This suggests that pressure has a limited effect on CH4–GRA interactions, which remain relatively weak compared to CH4-CO2 interactions.
3.4. Dynamic Characteristics of CO2 Driving Behavior
At the initial stage of the displacement process (0–3 ns), the number of CO2 molecules entering the aqueous phase exhibits a pronounced difference among the three pressure conditions (Figure 9a). At 15 Mpa, the CO2 uptake is highly fluctuating and intermittent, with several sharp spikes followed by rapid declines, indicating an unstable and inefficient displacement process at lower driving pressure. In contrast, at 20 Mpa, the increase is more continuous and stable, with reduced oscillations compared to 15 Mpa. Under 25 Mpa, the growth is even more rapid and consistent, suggesting that higher pressure significantly enhances the driving force for CO2 penetration into the aqueous phase. Between 3 and 10 ns, the behavior diverges further. At 15 Mpa, the number of CO2 molecules rises gradually, remaining below 200, and the growth rate slows considerably. At 20 Mpa, the uptake accelerates and crosses the 200 threshold around 8–10 ns, showing a more efficient displacement process. For 25 Mpa, the number of CO2 molecules increases steeply throughout this period, indicating strong and sustained migration of CO2 into the aqueous region. After approximately 10 ns, the systems begin to reach a quasi-equilibrium state. At 15 Mpa, the CO2 count stabilizes near 214 molecules, reflecting a limited displacement capacity at low pressure. At 20 Mpa, the final equilibrium level is higher, around 251 molecules, demonstrating improved CO2 penetration. Under 25 Mpa, the equilibrium plateau is reached at approximately 268 molecules, representing the highest displacement efficiency among the three scenarios (Figure 9b). Overall, increasing the driving pressure not only accelerates the initial CO2 migration but also results in a higher final concentration of CO2 in the aqueous phase, highlighting the critical role of pressure in enhancing methane displacement by CO2.
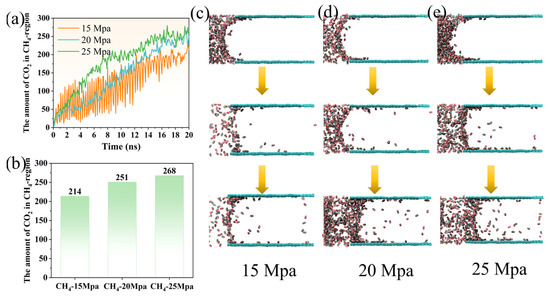
Figure 9.
(a) The variation of the amount of CO2 entering the CH4 coverage area over time; (b) the amount of CO2 that eventually enters the CH4 coverage area under different driving pressures. Dynamic structural evolution of CO2 at (c) 15 Mpa, (d) 20 Mpa, and (e) 25 Mpa.
The structural evolution of CO2 invasion into the aqueous phase exhibits distinct characteristics under different driving pressures. In Figure 9, the terms “retained,” “released,” and “lost” methane are defined to clarify the interpretation of the simulation results. Specifically, “retained” refers to CH4 molecules that remain adsorbed within the coal nanopore after the displacement process, while “released” denotes CH4 molecules that are expelled from the pore under the applied pressure. In contrast, “lost” methane represents CH4 molecules that become mixed with CO2 during the CH4–CO2 displacement process. In Figure 9a, the yellow, green, and blue colors correspond to the number of CO2 molecules entering the coal seam at 15 Mpa, 20 Mpa, and 25 Mpa, respectively. In the structural representations, the dark purple spheres represent CO2 molecules, whereas the green framework denotes the coal matrix. At 15 Mpa (Figure 9c), CO2 molecules initially remain localized near the coal seam entrance, forming a curved interfacial boundary with water due to the influence of the contact angle. During this stage, penetration into the water phase is minimal, and only a few scattered CO2 molecules gradually migrate inward. As time progresses, some CO2 molecules adsorb onto the coal surface, while others disperse randomly within the water phase. The overall rate of invasion remains slow, and the distribution of CO2 is relatively sparse, indicating a weak driving force for displacement under low-pressure conditions. At 20 Mpa (Figure 9d), the process becomes more active and continuous. Even at the early stage, a small number of CO2 molecules are already observed adsorbed at the coal seam entrance, in contrast to the delayed response seen at 15 Mpa. Over time, CO2 begins to continuously dissolve into the aqueous phase, steadily increasing in concentration. Eventually, a substantial number of CO2 molecules accumulate, with a pronounced enrichment near the coal seam interface, forming a semi-dense layer. This behavior suggests that a moderate increase in pressure significantly enhances the diffusion and adsorption of CO2, promoting more efficient methane displacement. At 25 Mpa (Figure 9e), the invasion process is the most dramatic and aggressive. From the very beginning, a highly dense CO2 layer forms rapidly at the coal seam entrance, accompanied by a distinct and large contact angle, indicative of strong wetting and interfacial interactions. As the process advances, this adsorbed CO2 layer progressively penetrates deeper into the coal structure while a large number of CO2 molecules simultaneously disperse throughout the aqueous phase, creating a complex multi-layered structure. Ultimately, a massive influx of CO2 into both the coal matrix and the surrounding water phase is observed, demonstrating that high driving pressure not only accelerates the displacement process but also maximizes the extent of CO2 migration and adsorption.
Overall, the comparative analysis reveals a clear transition from localized and intermittent CO2 penetration at low pressure to continuous and extensive invasion under high pressure. This progression highlights the pivotal role of driving pressure in governing the structural dynamics of CO2 during methane displacement, with higher pressures promoting faster, more uniform, and more efficient replacement of methane in the coal seam.
It is worth noting that, in natural coal seams, CO2 injection may induce complex thermal–hydrological–mechanical–chemical (THMC) couplings. The coal matrix can experience stress redistribution, pore structure variation, and swelling or shrinkage caused by CO2 adsorption. These effects can strongly influence permeability, diffusion pathways, and overall gas displacement efficiency in confined pore environments. Although the present molecular simulations capture the intrinsic interfacial mechanisms of CH4–CO2 displacement at the nanoscale, they do not explicitly include such large-scale structural and stress-related responses. Future work integrating multiscale simulations and experimental validation will be essential to link these molecular-scale findings to realistic reservoir behaviors.
4. Conclusions
This study employed molecular dynamics simulations to elucidate the pressure-dependent mechanisms of CH4 displacement by CO2 within coal nanopores, revealing how external pressure governs the transition from capillary-controlled desorption to pressure-driven convection. The results demonstrate that increasing the driving pressure from 15 to 25 Mpa significantly accelerates methane removal and enhances displacement efficiency through multiple, quantifiable effects: the mean residence time of CH4 on the coal surface decreases by approximately 16%, the CH4–CO2 radial distribution function peak height increases from 2.20 to 3.67, and the number of CO2 molecules invading the CH4 region rises from 214 to 268. These findings collectively indicate that elevated pressure intensifies CH4–CO2 interactions, weakens CH4 adsorption stability, and promotes continuous CO2 penetration across the coal–water interface. The work provides direct molecular-scale evidence that the efficiency of CO2-driven methane recovery is controlled by the dynamic competition among adsorption affinity, interfacial energy, and external pressure gradients—offering a clear mechanistic basis for pressure-optimized enhanced coalbed methane (ECBM) recovery.
While this study provides detailed molecular-level insights into the pressure-dependent mechanisms of CO2-driven CH4 displacement, several quantitative performance aspects remain to be addressed. Methane recovery ratios and CO2 adsorption kinetics, essential for evaluating overall displacement efficiency, were not explicitly calculated due to the molecular-scale scope of this work. Future studies will aim to derive these parameters through longer simulations or by coupling molecular dynamics with mesoscale or continuum models. Furthermore, effective working pressures in field-scale CO2–ECBM operations can vary depending on in situ stress, reservoir depth, and caprock sealing strength, which strongly influence gas migration, storage integrity, and long-term CO2 containment. These factors will be incorporated in future multiscale investigations to establish a more comprehensive understanding linking molecular behavior to field-scale displacement performance.
Supplementary Materials
The following supporting information can be downloaded at: https://www.mdpi.com/article/10.3390/pr13113509/s1, Table S1: Nomenclature.
Author Contributions
Y.L., Investigation, Writing—original draft. J.H., Formal analysis, Methodology. Z.L., Methodology, Writing—review and editing. S.L., Investigation, Writing—original draft. C.C., Conceptualization, Writing—review and editing. Q.C., Data Curation. Y.H., Writing—review and editing. G.W., Formal analysis. All authors have read and agreed to the published version of the manuscript.
Funding
This research received no external funding.
Data Availability Statement
The original contributions presented in this study are included in the article/Supplementary Materials. Further inquiries can be directed to the corresponding author.
Conflicts of Interest
The authors declare no conflicts of interest.
References
- Wang, H.; Sun, L.; Duan, S.; Huang, Q.; Shi, Q. The adsorption and diffusion mechanisms of CH4 and CO2 in heat-treated coal to increase CO2 sequestration potential. Chem. Eng. Sci. 2025, 320, 122385. [Google Scholar] [CrossRef]
- Li, Y.; Yang, Z.; Ju, X.; Zhou, A. Adsorption and diffusion behavior of CH4 and CO2 in closed and open pores from Zhaozhuang coal. Energy Fuels 2022, 36, 2582–2590. [Google Scholar] [CrossRef]
- Li, S.; Gong, Y.; Fu, S.; Wu, N.; Wang, L. CH4 and CO2 adsorption–desorption-diffusion characteristics in surfactant-modified coal under microscopic conditions. J. Mol. Liq. 2024, 410, 125598. [Google Scholar] [CrossRef]
- Gao, Y.; Wang, Y.; Chen, X. Adsorption and diffusion characteristics of CO2 and CH4 in anthracite pores: Molecular dynamics simulation. Processes 2024, 12, 1131. [Google Scholar] [CrossRef]
- Ma, Q.; Li, H.; Ji, K.; Huang, F. Thermal-hydraulic-mechanical coupling simulation of CO2 enhanced coalbed Methane recovery with regards to Low-Rank but relatively shallow coal seams. Appl. Sci. 2023, 13, 2592. [Google Scholar] [CrossRef]
- Hou, Y.; Huang, S.; Han, J.; Liu, X.; Han, L.; Fu, C. Numerical simulation of the effect of injected CO2 temperature and pressure on CO2-enhanced coalbed Methane. Appl. Sci. 2020, 10, 1385. [Google Scholar] [CrossRef]
- Pierre, F.; Michael, O.S.; Luke, G.; Judith, H.; Corinne, L.Q.; Are, O.; Bo, Z. Global carbon budget 2022. Earth Syst. Sci. Data 2022, 14, 4811–4900. [Google Scholar] [CrossRef]
- Wen, H.; Hao, J.; Ma, L.; Zheng, X. Experimental study on replacing coal seam CH4 with CO2 gas. ACS Omega 2021, 7, 1395–1403. [Google Scholar] [CrossRef]
- Zhang, X.; Huang, G.; Shu, Z.; Tong, Y. Study on key influencing factors of competitive adsorption of coalbed CH4 by carbon dioxide displacement. Front. Chem. 2022, 10, 998592. [Google Scholar] [CrossRef]
- Valadi, F.M.; Pasandideh-Nadamani, M.; Rezaee, M.; Torrik, A.; Mirzaie, M.; Torkian, A. Competitive adsorption of CO2, N2, and CH4 in coal-derived asphaltenes, a computational study. Sci. Rep. 2024, 14, 7664. [Google Scholar] [CrossRef]
- Bai, G.; Su, J.; Wang, Y.; Xiao, M.; Zhou, X.; Chen, J. Effect of CO2 injection pressure on enhanced coal seam gas extraction. Sci. Rep. 2024, 14, 25735. [Google Scholar] [CrossRef] [PubMed]
- Fan, C.; Yang, L.; Sun, H.; Luo, M.; Zhou, L.; Yang, Z.; Li, S. Recent advances and perspectives of CO2-enhanced coalbed CH4: Experimental, modeling, and technological development. Energy Fuels 2023, 37, 3371–3412. [Google Scholar] [CrossRef]
- Zhu, Y.; Li, H.; Liu, J.; Zhou, C.; Zhao, Y. Competitive Adsorption Behavior of CO2 and CH4 in Coal Under Varying Pressures and Temperatures. Separations 2025, 12, 75. [Google Scholar] [CrossRef]
- Huang, K.; Du, X.; Li, K.; Zhou, J.; Zhang, D.; Abbas, N.; He, C. Competitive adsorption of CO2/CH4 on coal: Insights from thermodynamics. Alex. Eng. J. 2024, 97, 114–126. [Google Scholar] [CrossRef]
- Budhathoki, S.; Igwe, U.; Huang, Z.; Dangi, M.B.; Thapa, R.B.; Paneru, R.; Urynowicz, M.A. Competitive CO2/CH4 adsorption and desorption in Powder River Basin coals: Implications for carbon storage. Energy 2025, 333, 137426. [Google Scholar] [CrossRef]
- Jia, J.; Xing, Y.; Li, B.; Wu, Y.; Wang, D. Molecular simulation study of adsorption-diffusion of CH4, CO2 and H2O in gas-fat coal. Sci. Rep. 2024, 14, 24131. [Google Scholar] [CrossRef]
- Dong, K.; Zhai, Z.; Guo, A. Effects of pore parameters and functional groups in coal on CO2/CH4 adsorption. ACS Omega 2021, 6, 32395–32407. [Google Scholar] [CrossRef] [PubMed]
- Li, Y.; Yang, Z.; Li, X. Molecular simulation study on the effect of coal rank and moisture on CO2/CH4 competitive adsorption. Energy Fuels 2019, 33, 9087–9098. [Google Scholar] [CrossRef]
- Zhou, W.; Wang, H.; Zhang, Z. Molecular simulation of CO2/CH4/H2O competitive adsorption and diffusion in brown coal. RSC Adv. 2019, 9, 3004e3011. [Google Scholar] [CrossRef]
- Guang, W.; Zhang, Z.; Zhang, L.; Ranjith, P.G.; Hao, S.; Liu, X. Confinement effect on transport diffusivity of adsorbed CO2–CH4 mixture in coal nanopores for CO2 sequestration and enhanced CH4 recovery. Energy 2023, 278, 127929. [Google Scholar] [CrossRef]
- Fagorite, V.I.; Ikechukwu, U.N.; Oluwasola, H.O.; Onyekuru, S.O.; Enenebeaku, C.K.; Ohia, N.P.; Oguzie, E.E. Investigating adsorption properties of CO2 and CH4 in subbituminous coals from Mamu and Nsukka formations: A molecular simulation approach. Carbon Res. 2024, 3, 79. [Google Scholar] [CrossRef]
- Ji, B.; Pan, H.; Pan, M.; Zhou, Y.; Pang, M.; Wang, K.; Zhang, H. Molecular simulation of free CO2 injection on the coal containing CH4 structure and gas replacement. Fuel 2024, 377, 132789. [Google Scholar] [CrossRef]
- Zhang, S.; Zhang, X.; Wang, Z.; Liu, X.; Heng, S.; Li, Y.; Sun, Z. Molecular simulation of CH4 and CO2 adsorption behavior in coal physicochemical structure model and its control mechanism. Energy 2023, 285, 129474. [Google Scholar] [CrossRef]
- Liu, B.; Wang, C.; Zhang, J.; Xiao, S.; Zhang, Z.; Shen, Y.; He, J. Displacement mechanism of oil in shale inorganic nanopores by supercritical carbon dioxide from molecular dynamics simulations. Energy Fuels 2017, 31, 738–746. [Google Scholar] [CrossRef]
- Cao, L.; Yao, Y.; Cui, C.; Sun, Q. Characteristics of in-situ stress and its controls on coalbed methane development in the southeastern Qinshui Basin, North China. Energy Geosci. 2020, 1, 69–80. [Google Scholar] [CrossRef]
- Perera, M.S.A.; Ranjith, P.G.; Ranathunga, A.S.; Koay, A.Y.J.; Zhao, J.; Choi, S.K. Optimization of enhanced coal-bed methane recovery using numerical simulation. J. Geophys. Eng. 2015, 12, 90–107. [Google Scholar] [CrossRef]
- Jorgensen, W.L.; Maxwell, D.S.; Tirado-Rives, J. Development and Testing of the OPLS All-Atom Force Field on Conformational Energetics and Properties of Organic Liquids. J. Am. Chem. Soc. 1996, 118, 11225–11236. [Google Scholar] [CrossRef]
- Jorgensen, W.L.; Chandrasekhar, J.; Madura, J.D.; Impey, R.W.; Klein, M.L. Comparison of Simple Potential Functions for Simulating Liquid Water. J. Chem. Phys. 1983, 79, 926–935. [Google Scholar] [CrossRef]
- Linse, P. Thermodynamic and structural aspects of liquid and solid benzene. Monte Carlo study. J. Am. Chem. Soc. 1984, 106, 5425–5430. [Google Scholar] [CrossRef]
- Norberg, J.; Nilsson, L. Temperature dependence of the stacking propensity of adenylyl-3′, 5′-adenosine. J. Phys. Chem. 1995, 99, 13056–13058. [Google Scholar] [CrossRef]
Disclaimer/Publisher’s Note: The statements, opinions and data contained in all publications are solely those of the individual author(s) and contributor(s) and not of MDPI and/or the editor(s). MDPI and/or the editor(s) disclaim responsibility for any injury to people or property resulting from any ideas, methods, instructions or products referred to in the content. |
© 2025 by the authors. Licensee MDPI, Basel, Switzerland. This article is an open access article distributed under the terms and conditions of the Creative Commons Attribution (CC BY) license (https://creativecommons.org/licenses/by/4.0/).