1. Introduction
China’s rapid economic development has driven continuous expansion and modernization of national transportation infrastructure. The shield tunneling method is widely used in various transportation tunnel projects [
1,
2] due to its advantages, such as fast tunneling speed, high degree of automation, minimal environmental disturbance, and high construction efficiency. As cities grow, shield tunnels are trending toward greater depths and larger diameters to alleviate urban traffic pressure.
Representative projects include the Jiluo Road North Extension Tunnel beneath the Yellow River (outer diameter 15.2 m; segment thickness 0.65 m), the Shanghai Metro Chongming Line river-crossing tunnel (outer diameter 13.0 m; segment thickness 0.55 m), and the Shenzhen Chunfeng Tunnel (outer diameter 15.2 m; segment thickness 0.65 m). Large-diameter shield tunnels commonly encounter complex geological conditions, notably high-water pressure and great burial depth. As the most vulnerable part of the entire tunnel structure, the segment joints pose a significant challenge to the overall structural integrity and waterproofing function of the shield tunnel. To adapt to complex engineering environments, the joint form of shield tunnel segments has gradually evolved from a single-gasket waterproofing arrangement to a double-gasket one [
3]. While different gasket arrangements optimize the tunnel’s waterproofing performance, they also increase the complexity of the segment joint configuration. To enhance the overall functional requirements of shield tunnels under ultra-high water pressure, it is of great significance to study the bending performance of large-diameter shield tunnel joints with different joint forms.
Numerous scholars at home and abroad have studied the mechanical properties of shield tunnel segment joints using a variety of methods, including theoretical analysis, numerical simulation, and experimental research [
4,
5,
6,
7]. Li et al. [
8] conducted a straight-joint model test on both single- and double-gasket waterproofing configurations. They measured the ultimate waterproof pressure of the gaskets under different joint openings and misalignments and explored the different failure modes of double-gasket waterproofing performance. Ma et al. [
9] studied the issue of water leakage through bolt holes in tunnels with both inner and outer double-gasket arrangements. They investigated two double-gasket waterproofing systems—continuous and staggered outer arrangements—and found that the staggered outer arrangement of the double-gasket system provided a certain improvement in waterproofing performance compared to the single-gasket system. The continuous evolution of joint configurations has also made the stress characteristics and failure mechanisms at the segment joints more complex. Feng et al. [
10] conducted a bending performance analysis of the segment joints of the Shi Ziyang Tunnel using finite element simulation and full-scale tests. They obtained the stress characteristics of the segment joints at various stages under compression/bending loads and pointed out that the effect of sealing and waterproofing materials on improving the joint’s bending stiffness is negligible due to their low stiffness. Zuo et al. [
11] performed a full-scale test on a shield tunnel under high water pressure and found that under high-water-pressure loads, as the bending moment increases to resist compressive stress, the stress state of the reinforcement bars under tensile stress changes. Zhang et al. [
12] conducted a bending failure test on segments with inner and outer double-gasket waterproofing configurations under both positive and negative bending moments. Using acoustic emission detection technology, they performed a micro-damage inspection and analysis of the segment joints and discovered that the damage growth exhibited local peaks during the loading process. Ye et al. [
13] used numerical simulations to deeply investigate the mechanical properties of nine types of circumferential joint structures and identified the most effective structure for enhancing the longitudinal stiffness of tunnels. Zhang et al. [
14] systematically studied the damage range and height of tenon-type inter-ring joints under shear, the ultimate shear bearing capacity, and the shear stiffness of the joints. He et al. [
15] conducted a longitudinal bending performance test of a shield tunnel structure, analyzed the vertical deformation and the effective bending stiffness, and proposed an empirical correction formula suitable for determining the effective longitudinal bending stiffness of small-to-medium diameter shield tunnels. Based on the lining structure of a section of the Hangzhou Metro Line 8 shield tunnel, Hu et al. [
16] used the finite element method to study the influence of segment joint stiffness on the stress and deformation of the shield tunnel lining structure. Zhu et al. [
17] used full-scale experiments to investigate the ultimate bearing performance of longitudinal joints with different bolt forms. Zhou et al. [
18] developed a loading device for prototype segment linings and conducted experimental research on the mechanical behavior of shield linings under internal water pressure. They analyzed the change rules of the effective bending stiffness and joint moment transfer coefficient, as well as the limit value of the convergence deformation of the lining ring under internal water pressure. Xue et al. [
19] developed a displacement back-analysis program for shield tunnel segment structures based on a genetic algorithm and verified the feasibility of the algorithm and the program. Zhang et al. [
20] studied the full-process deformation and failure patterns of composite linings under internal water pressure and revealed the bearing mechanism of composite linings under internal pressure. Kou et al. [
21] established a numerical model to study the mechanical characteristics of longitudinal joints of shield tunnels under ultra-high water pressure. Zheng et al. [
22] conducted multiple sets of full-scale tests on a complete ring of stagger-jointed shield tunnels and analyzed the characteristics of the entire process of structural failure.
Further diversifying the research landscape, some scholars have focused on novel joint designs, such as those incorporating dowels, to analyze their unique load bearing and failure mechanisms through prototype experiments [
23]. Concurrently, studies on the mechanical properties of joints under large deformation conditions have provided critical insights into failure modes, such as concrete spalling and bolt failure, which are essential for ensuring structural safety under extreme loads [
24]. More recently, and highly relevant to the present study, the direct influence of the groove arrangement on flexural performance has become a key topic. For instance, recent work has begun to compare the nonlinear characteristics of single- and double-groove configurations, revealing that the joint’s bending resistance is highly sensitive to the groove’s position and height [
25]. In summary, while existing research has provided valuable insights into the bending performance of segmental joints, a detailed review reveals several critical gaps. Firstly, most studies focus on small-to-medium-diameter shield tunnels under conventional water pressure conditions [
26,
27,
28], and their findings may not be directly applicable to the increasingly common large-diameter tunnels situated in ultra-deep, high-water-pressure environments. Secondly, although the evolution to double-gasket systems is a key development for enhancing waterproofing performance, there is a lack of systematic comparative analysis on how different gasket configurations influence the structural bending behavior and failure mechanisms. This leaves a notable void in the theoretical basis for optimal joint design in complex engineering contexts.
Therefore, to address these gaps, this study, based on the Zhujiangkou Tunnel project, establishes a high-fidelity 3D numerical model to (1) investigate the detailed nonlinear mechanical response and phased failure characteristics of double-gasketed joints in large-diameter tunnels under high axial forces simulating high water pressure; (2) elucidate the damage evolution process, particularly at vulnerable locations like gasket grooves and bolt holes; and (3) systematically compare the bending performance of three distinct gasket configurations. The findings are intended to provide a crucial reference for the design and safety assessment of similar underwater tunnel projects.”
3. Three-Dimensional Refined Numerical Model of Segment Joint
Based on ABAQUS, a three-dimensional refined numerical model of a large-diameter shield tunnel’s double-gasket segment joint was established to analyze its bending performance and damage characteristics.
3.1. Three-Dimensional Numerical Model
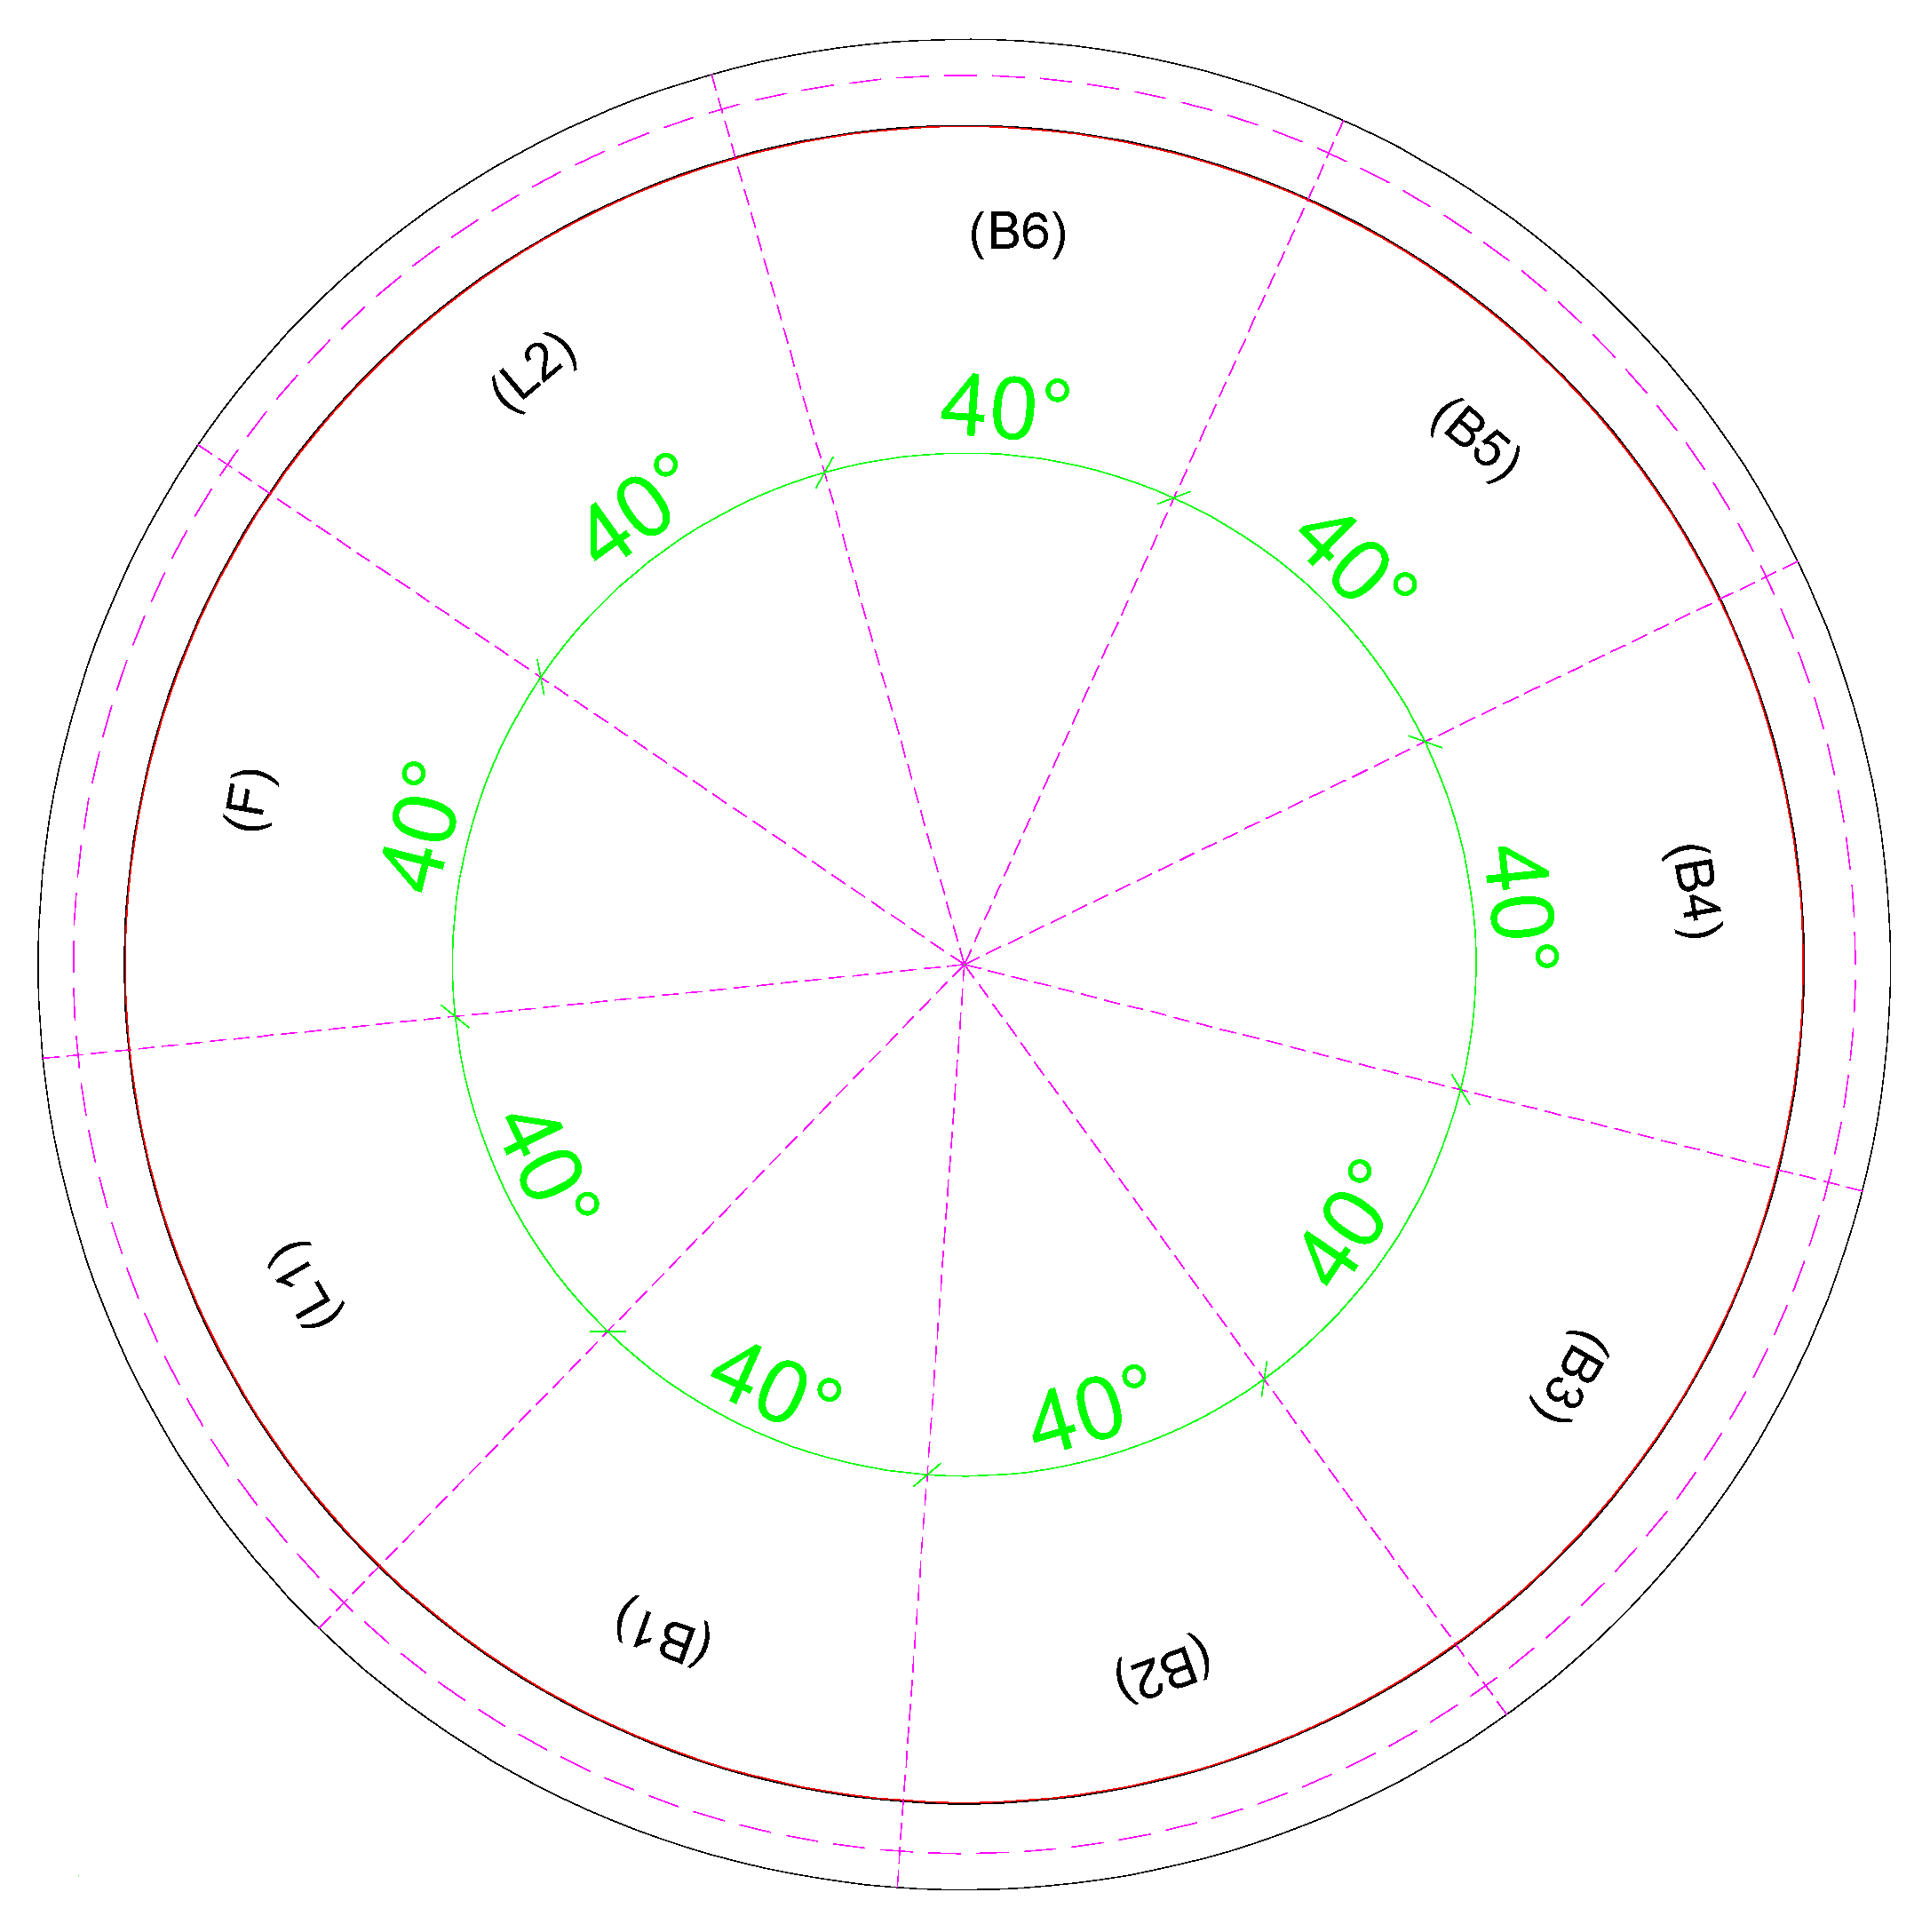
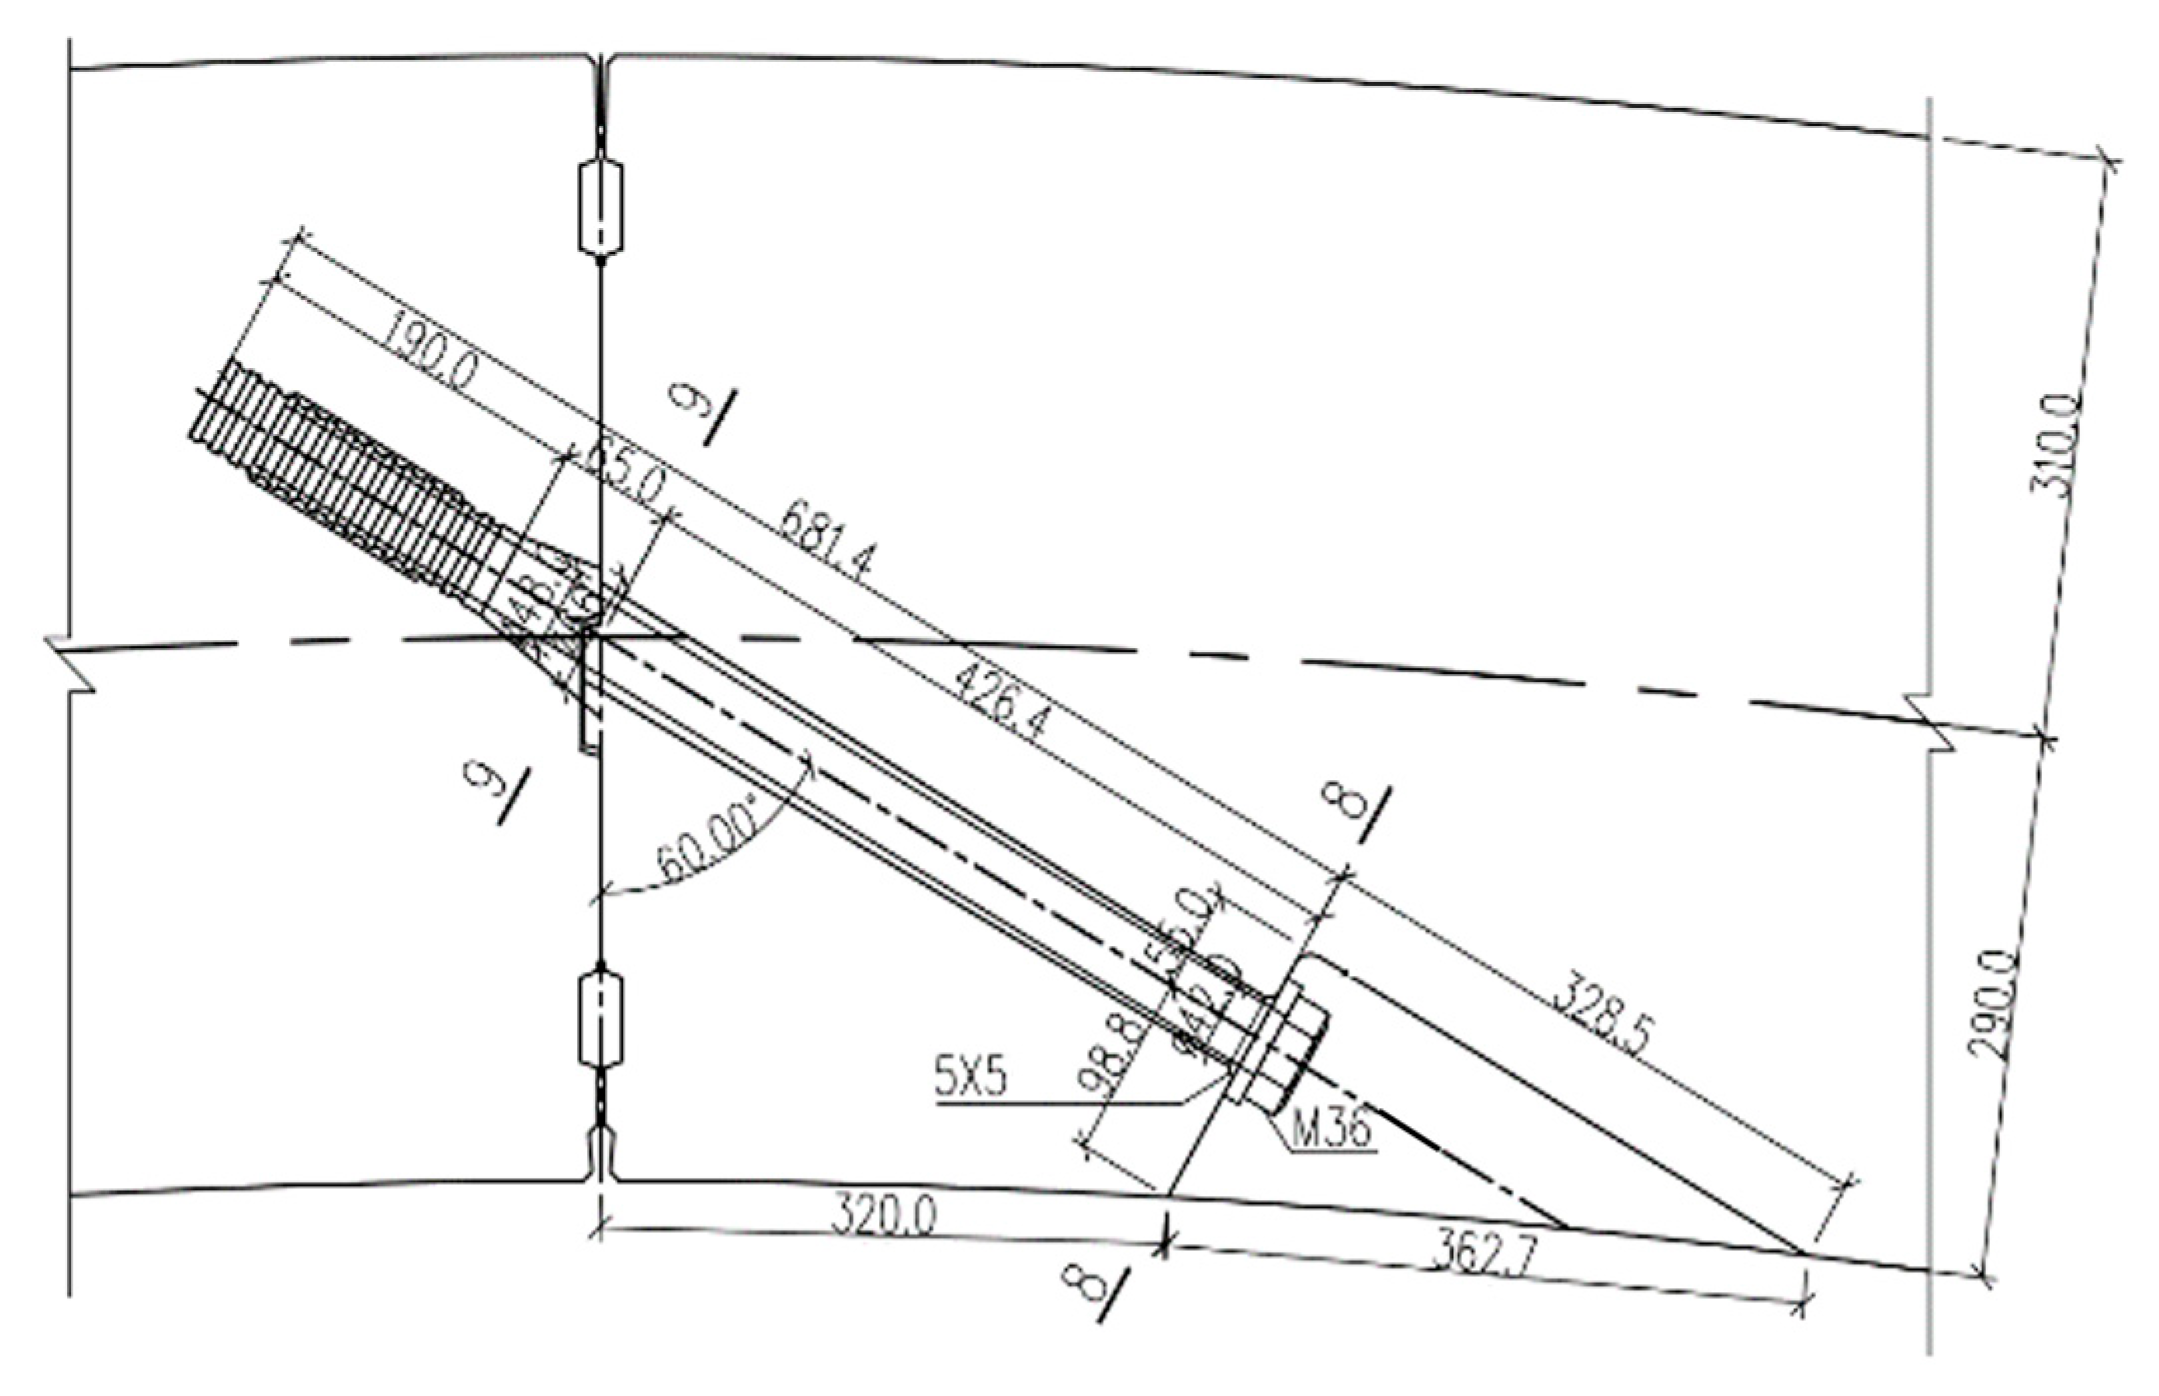
The longitudinal joints of the Zhujiangkou Tunnel segments are connected by three bolts uniformly distributed along the width of the segment. Considering the symmetry of the segment lining’s loading and the joint structure, one-third of the segment width, the actual reinforcement, and a single bolt were selected for calculation and analysis. Furthermore, due to the large tunnel cross-section of this project, the curvature at the segment joints has a minor impact on the numerical simulation results, so the local curved segments can be simplified to rectangular segments [
29]. Since rubber gaskets and joint fillers play an important role in the waterproofing of the segment joints, and their detailed deformation affects the joint’s stress, structural features such as gasket grooves and filler grooves still need to be considered to simulate the actual mechanical performance of the segment joint face. The length, width, and height of a single segment are 800 mm, 666 mm, and 600 mm, respectively. The overall model is shown in
Figure 4In the three-dimensional refined numerical model established in this paper, concrete specimens, bolts, washers, and sleeves are all created using 3D solid elements. The concrete is simulated using 8-node hexahedral reduced integration elements (C3D8R), and the steel reinforcement cages embedded in the concrete are discretized using 2-node linear beam elements (B31).
According to existing research, the anchorage section of the bolt has almost no relative slip with the sleeve during the joint deformation process, so a binding contact is set between the inner side of the sleeve and the bolt anchorage end. The steel bars are embedded in the concrete material using the Embedded method, assuming no slip occurs between the steel bars and the concrete. Surface-to-surface contact is used between each component. In the calculation, it is assumed that the joint satisfies the plane section assumption before and after deformation. Therefore, the normal contact property is set to “hard contact” to prevent node penetration. For the tangential direction, a penalty function is set, and the friction coefficient is considered. The contact properties are shown in
Table 1.
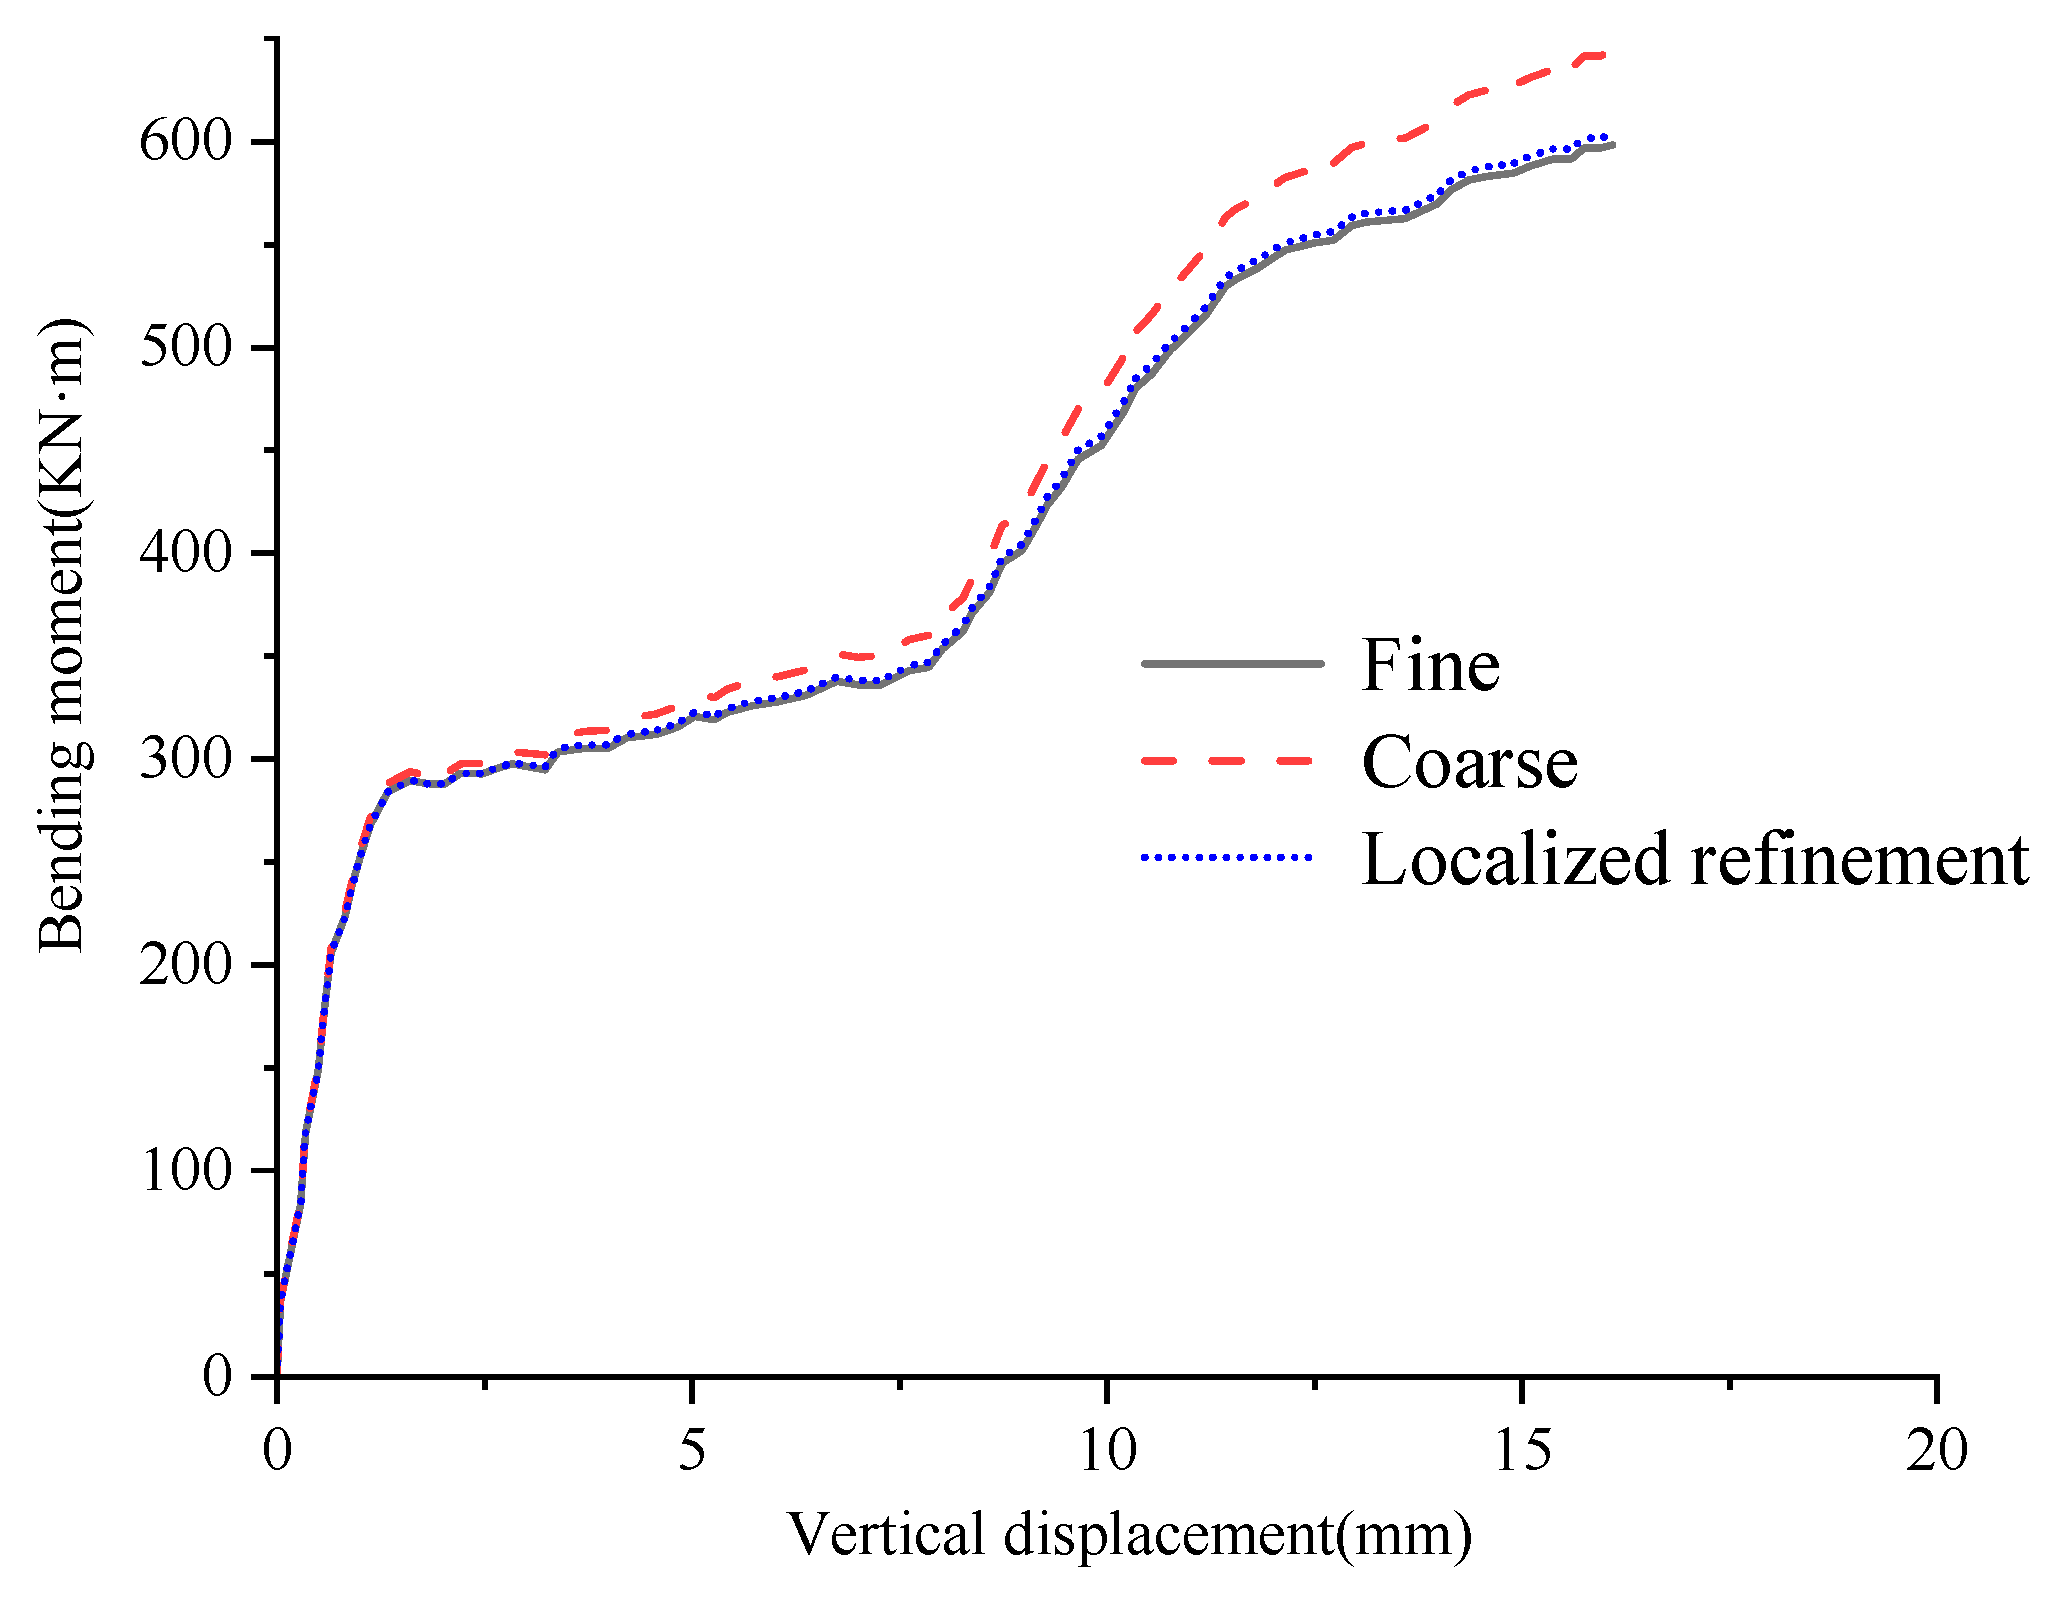
A mesh convergence study was conducted to ensure the numerical results were independent of the mesh density. Three models with different meshing strategies, termed Coarse, Medium, and Fine for clarity—were created. The details, including target representative sizes and the resulting total element counts for the two-block model, are summarized in
Table 2.
The bending moment/joint opening curves for a representative case are plotted in
Figure 5. As shown in the figure, the results from the ‘Medium’ and ‘Fine’ mesh models are in very close agreement, indicating that the solution has converged. To ensure a balance between accuracy and computational efficiency, the Fine mesh strategy was adopted for all subsequent analyses in this study.
3.2. Material Parameters and Constitutive Models
In this model, the material properties for C60 concrete are determined according to the “Standard for Design of Concrete Structures” (GB/T50010-2010) [
30]. The bolt material is specified as grade 8.8 low-carbon alloy steel, and the stirrup material is HRB300 (China Railway Engineering Equipment Group Tunnel Equipment Manufacturing Co., Ltd., Tianjin, China). The specific material parameters are shown in
Table 3.
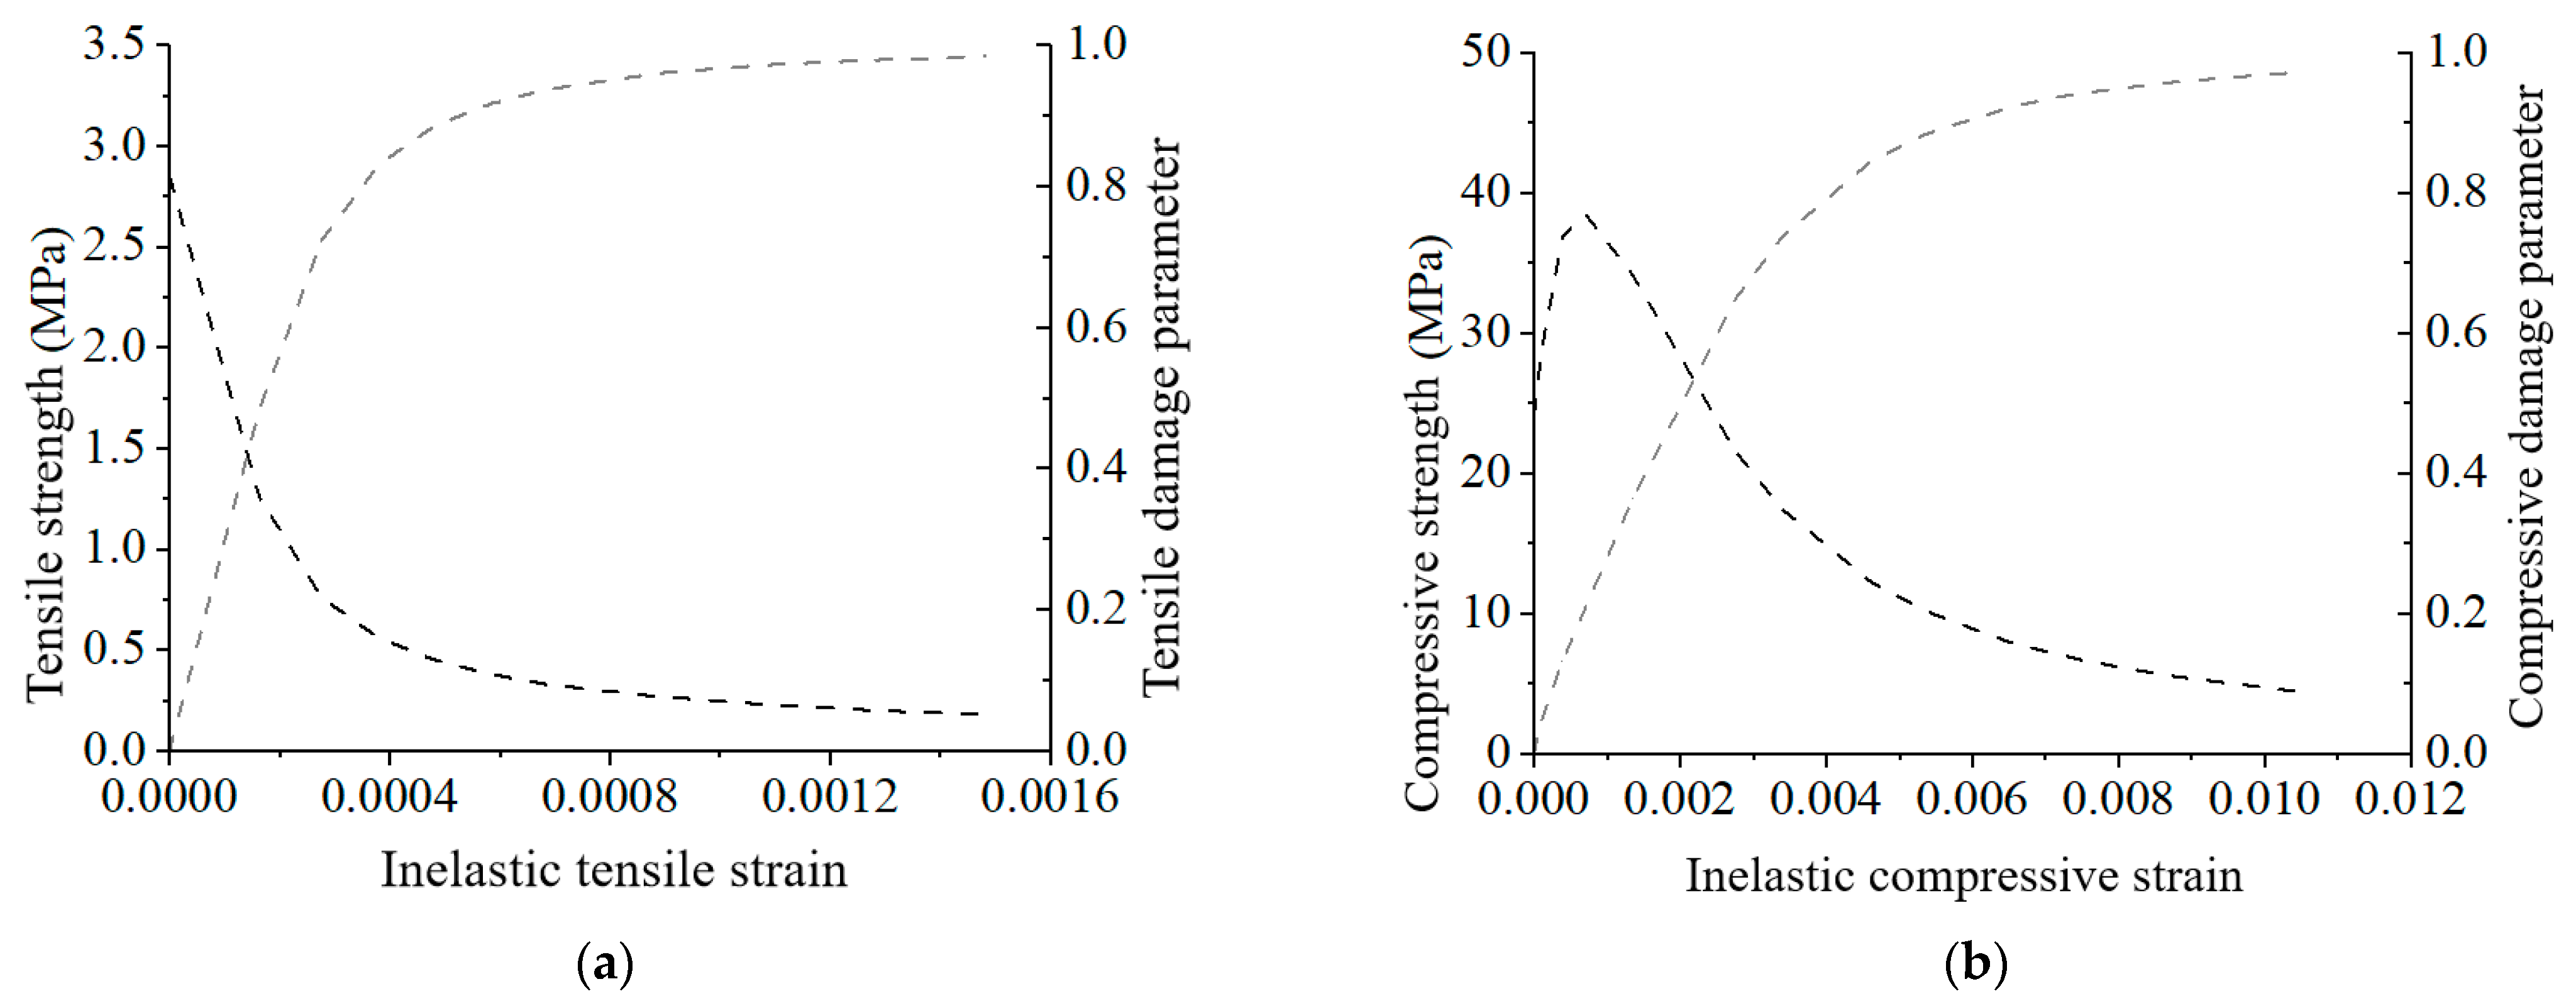
To accurately represent the failure mechanism of the shield tunnel segment structure under stress, it is essential to thoroughly consider both the stiffness degradation and the nonlinear characteristics of the concrete material. This paper adopts the concrete plastic damage constitutive model (CDP model) as the concrete constitutive model and incorporates a concrete damage plasticity factor based on relevant standards. This factor takes into account the historical maximum tensile and compressive damage experienced by the element, with its value reflecting the ratio of the element’s reduced strength to its initial strength. A value of 0 indicates no reduction in element strength, while a value of 1 signifies complete structural failure. The damage factor for C60 concrete is depicted in
Figure 6. In addition to the damage parameters shown in
Figure 6, the Concrete Damaged Plasticity (CDP) model requires several key plasticity parameters to define the failure surface and flow rule. These parameters, determined according to the recommendations in the Chinese standard (GB/T50010-2010) and common practice for C60 concrete, are summarized in
Table 4.
3.3. Boundary Conditions
In the finite element analysis, to ensure the accuracy of the numerical analysis, the boundary constraints are set according to the model boundary conditions in reference [
17]. One side of the segment is constrained for displacement in the x, y, and z directions, while the other side is constrained for displacement only in the y and z directions. All other displacements and rotations are unconstrained. Bending moment is applied by applying a vertical force to the center of the upper surface of both segments. Simultaneously, an axial force N is applied to both ends of the two segments to ensure the joint is in a compression/bending state. The model’s boundary conditions and loading are shown in
Figure 7.
3.4. Bolt Preload Force
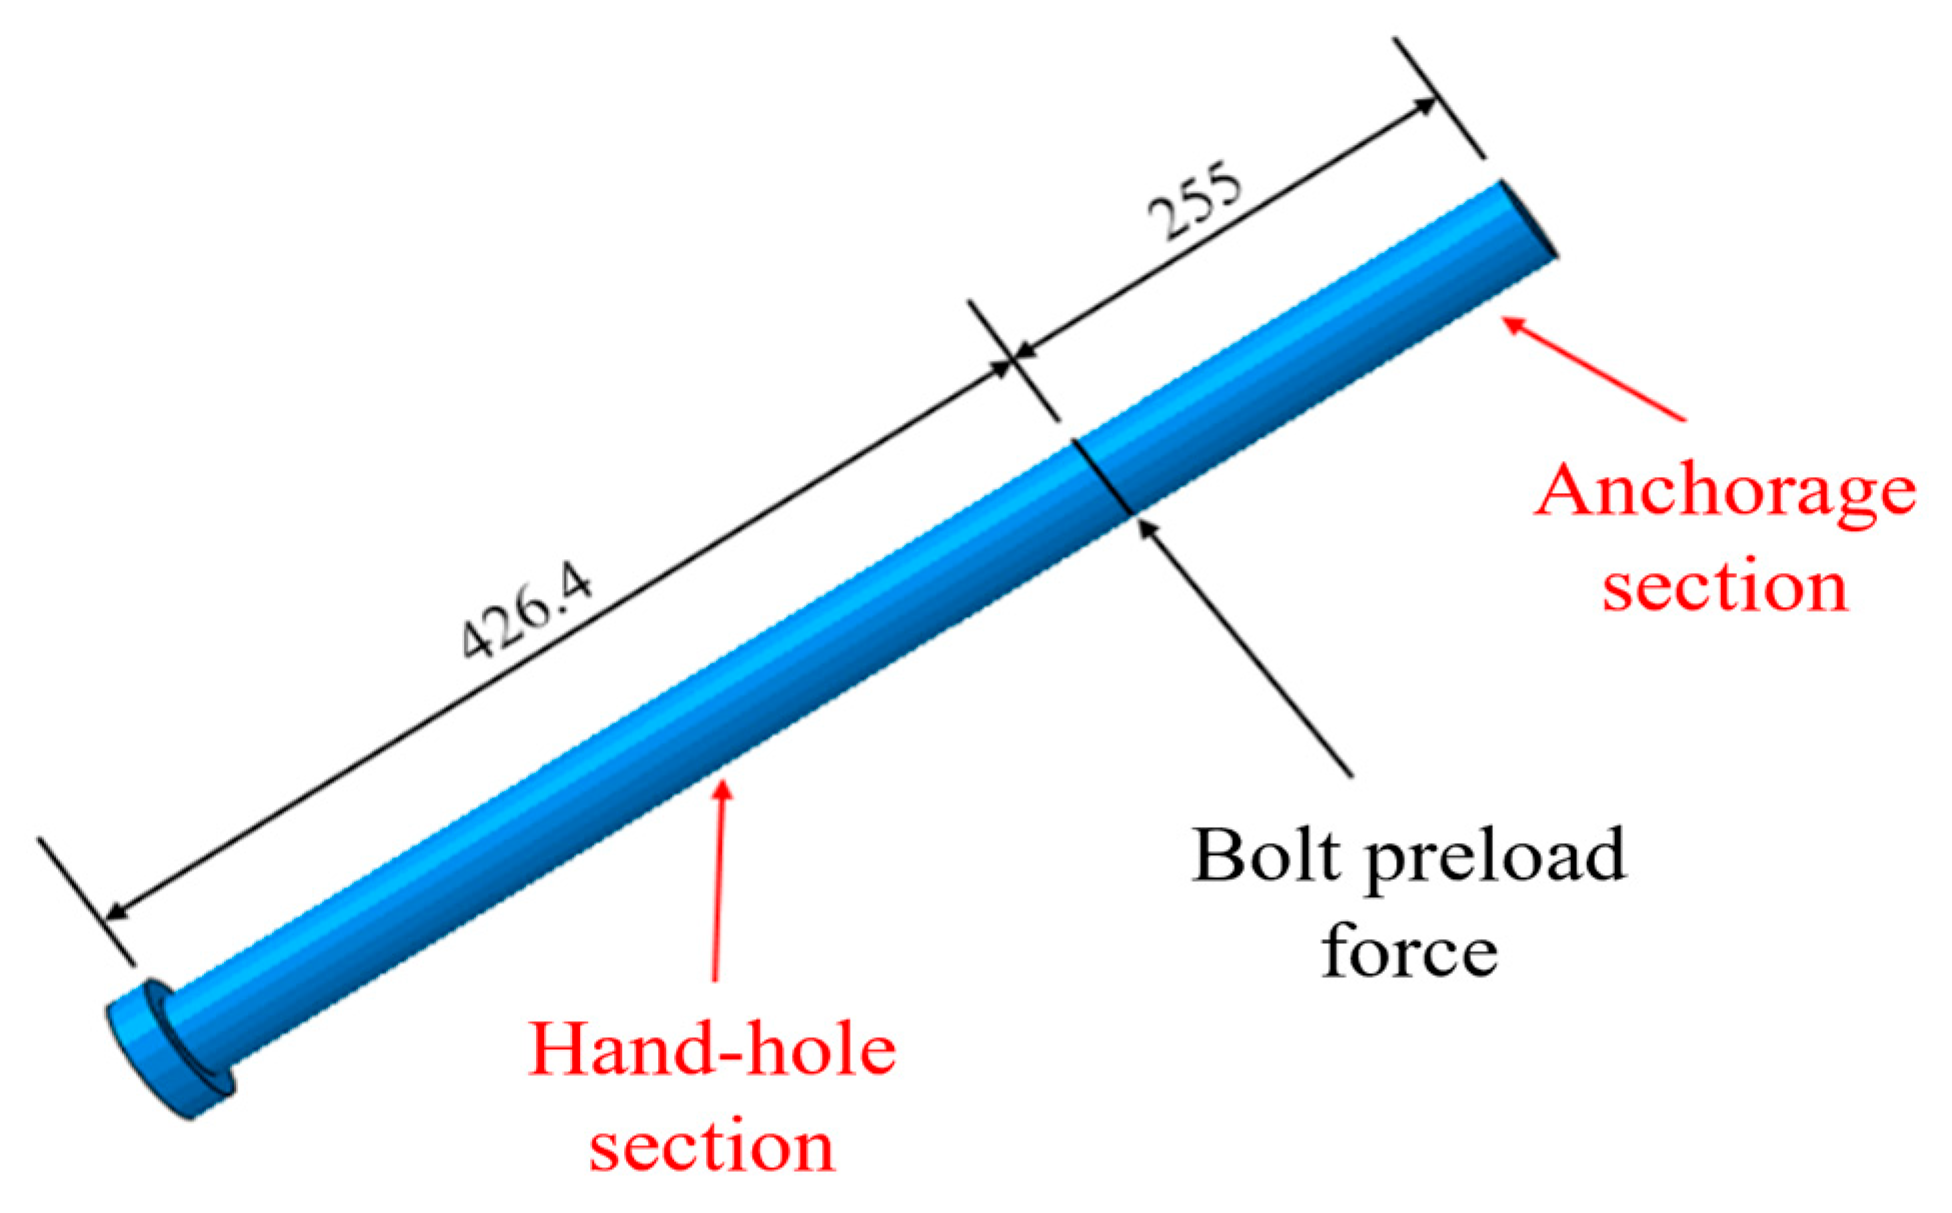
After the segment structure is assembled and the joint bolts are installed, a pre-tightening force needs to be applied to the joint bolts. This increases the contact pressure and prevents the segment structure from loosening and slipping, thereby ensuring the overall stability of the structure. In the numerical model, the bolt pre-tightening force is applied along the bolt’s length direction at the intersection of the bolt and the joint surface to ensure an effective path for pre-tightening force transmission. The application method is shown in
Figure 8.
3.5. Loading Conditions
To investigate the damage modes and bending performance of the double-gasket segment joints in a large-diameter shield tunnel, a detailed study on the bending performance of the shield tunnel joints was conducted under axial forces of 1000 kN, 3000 kN, 5000 kN, and 7000 kN. The axial forces for this study (1000 kN, 3000 kN, 5000 kN, and 7000 kN) were selected based on the engineering parameters. The calculated axial force on the model under the maximum design water pressure of 1.16 MPa is approximately 5000 kN. The chosen range therefore covers various scenarios from low load to the design load and an overloaded condition, allowing for a systematic analysis of the effect of axial force on the joint’s bending performance. The 6000 kN force mentioned in the subsequent validation section was specific to the reference experiment and was not included in this parametric study, as a new set of forces more relevant to the current project was established.
It is important to clarify that in this local model of the segmental joint, the effect of external water pressure is not applied as a surface load. Instead, it is represented by an equivalent axial compressive force (N) applied to the ends of the segments. This is a standard and valid approach, as the primary influence of high water pressure on the bending behavior of a local joint is the significant circumferential hoop stress it induces in the tunnel lining, which manifests as an axial force on the joint’s cross-section.
3.6. Model Validation
To ensure the accuracy and reliability of the three-dimensional refined numerical model constructed in this paper, its calculation results must be compared and verified against existing physical experimental data. This study selects the full-scale bending test results for the Nanjing Yangtze River Tunnel segment joints [
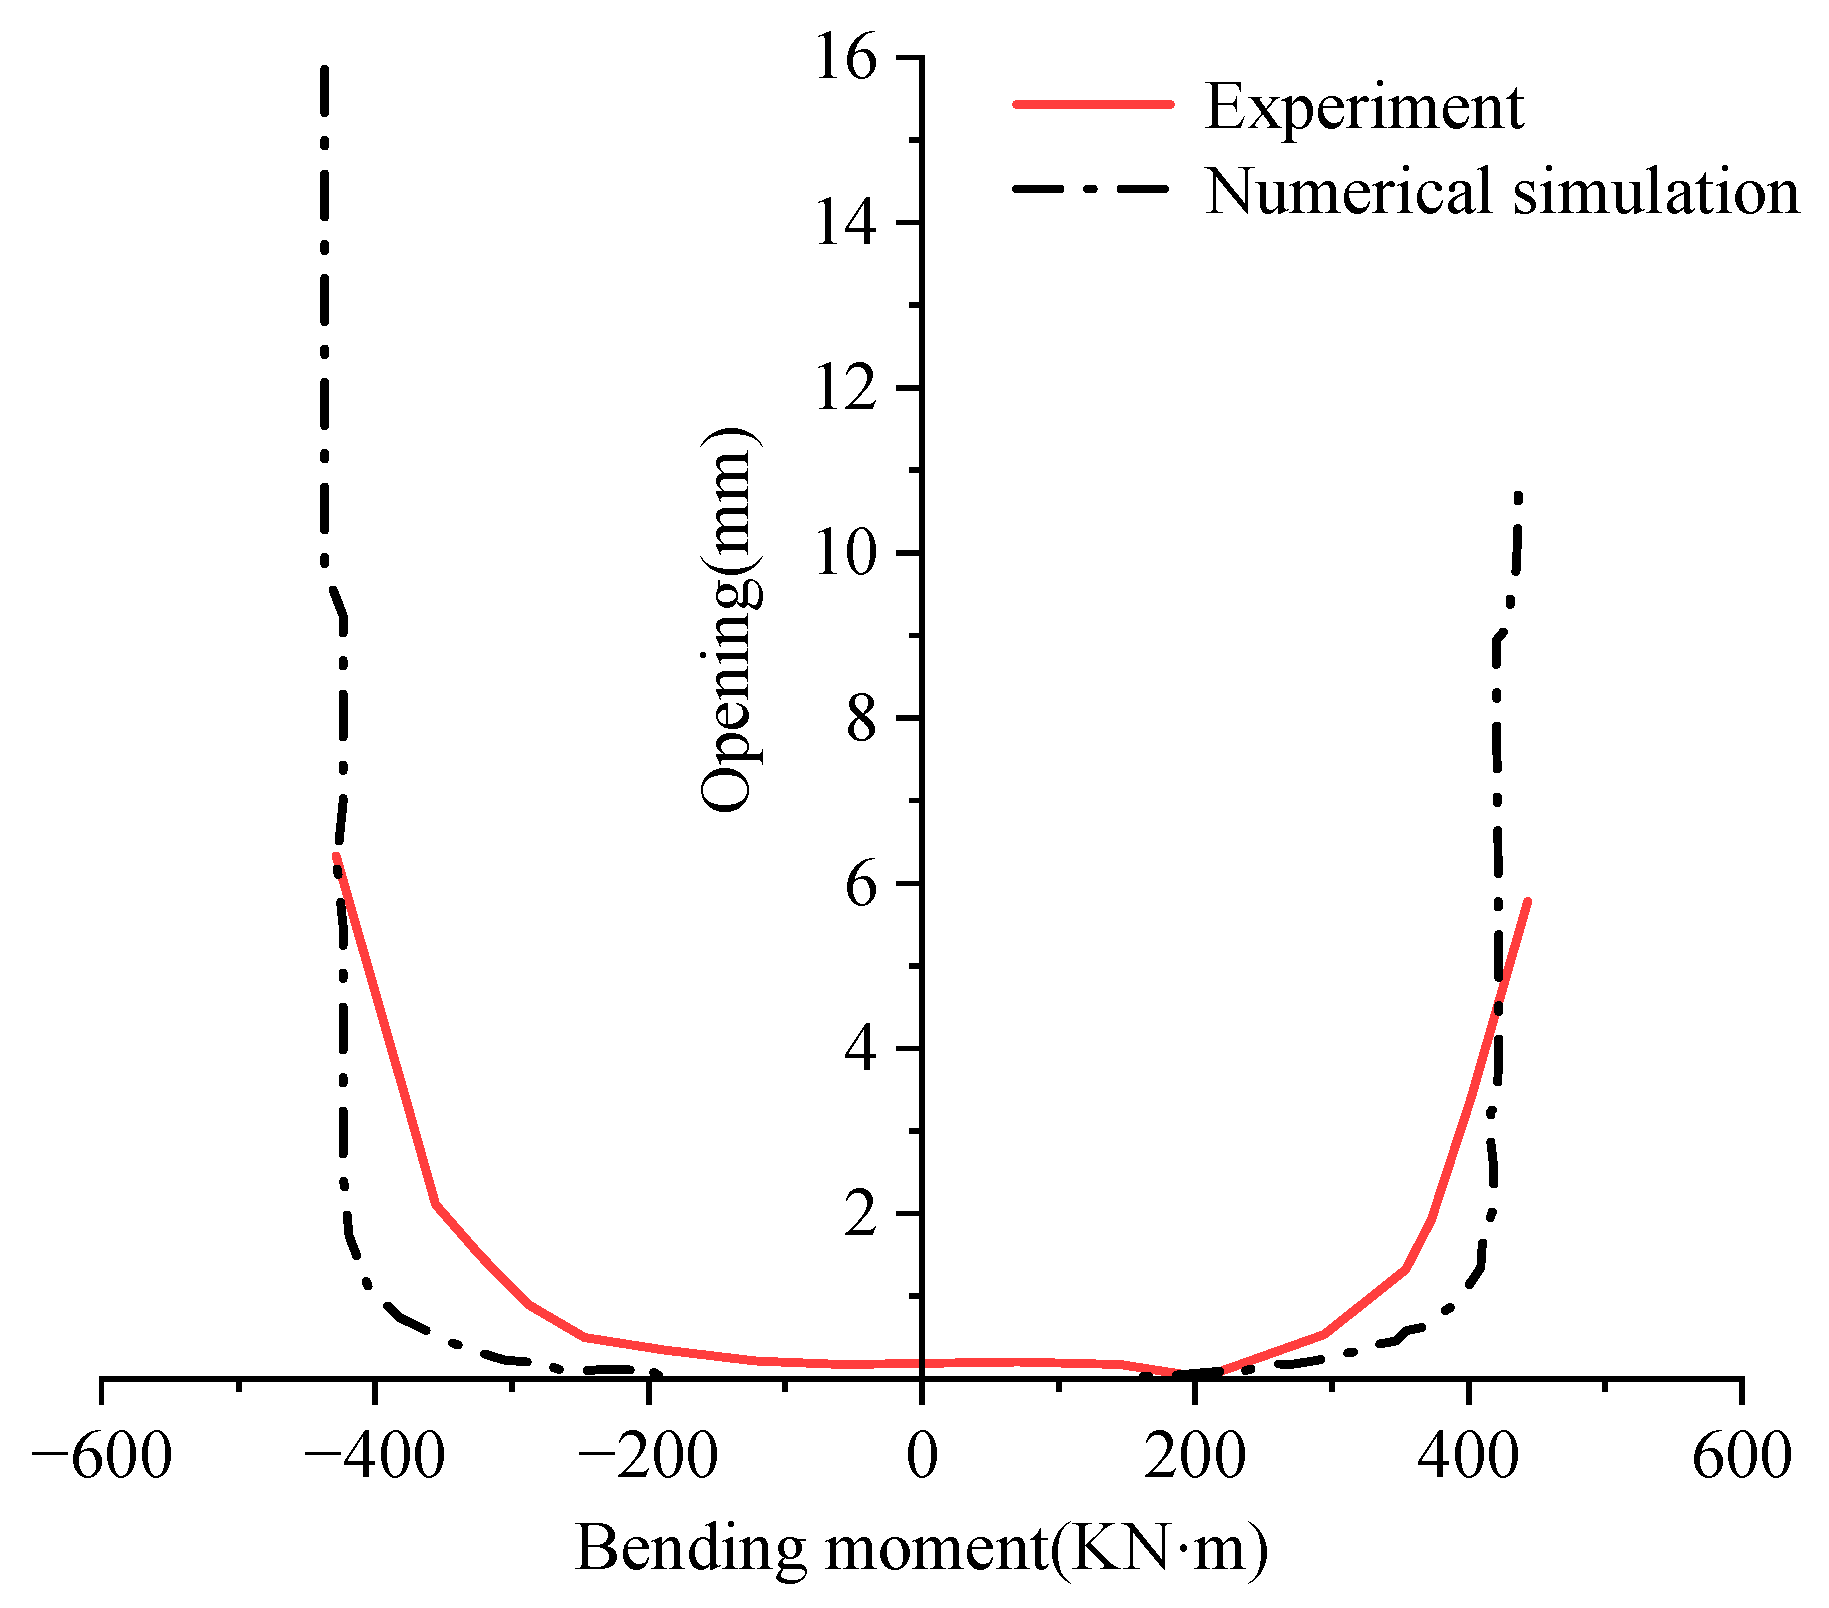
31] for comparison. The segment joints used in that experiment have the following characteristics, which are highly relevant to the model studied in this paper and are suitable for validation: the test joints featured a double-gasket design with inner and outer gaskets, consistent with the double-gasket configuration studied here. The segment thickness and concrete strength grade used in the test were also consistent with the engineering background parameters adopted in this model. It should be noted that the width of the numerical model in this paper is set to 1/3 of the actual ring width (2 m). Therefore, for a fair comparison, the bending moment load from the original physical experiment was proportionally reduced. In the experiment, the deformation development patterns were consistent under axial forces of 3000 kN and 6000 kN. Thus, this paper selects the test data for joint opening under positive and negative bending moments with an axial force of 3000 kN to compare with the simulation results of the numerical model, as shown in
Figure 9. The robustness of this numerical model for simulating both positive and negative bending moments is ensured by its core components. The use of the Concrete Damaged Plasticity (CDP) model allows for a comprehensive simulation of concrete’s distinct behaviors under both tension and compression. Furthermore, the general-purpose contact algorithm accurately manages the opening and closing of the joint interface regardless of the load direction. These features ensure that the model provides a reliable and unbiased analysis for all simulated bending conditions.
The comparative analysis in
Figure 9 shows that the numerical model established in this paper generally matches the physical experimental results in predicting the trend of joint opening with changes in bending moment, thereby validating the model’s effectiveness. However, a certain degree of discrepancy is also observed. In the initial loading stage (elastic deformation stage), when the bending moment is small, the experimental curve and the simulation curve show a high degree of agreement. As the bending moment continues to increase and the nonlinear deformation characteristics of the segment joint become more pronounced, the measured joint opening from the experiment is slightly larger than the numerical simulation results, and the difference between the two curves increases.
This discrepancy arises from multiple factors. Firstly, the constitutive relationships of materials, element types, and contact definitions used in the numerical simulation are idealized. In contrast, the actual experiment is affected by factors such as the non-uniformity of the concrete material, the complex friction of contact surfaces, and manufacturing errors. Secondly, systematic factors in the physical experiment, such as boundary conditions, the precision of loading equipment, and measurement methods, also introduce unavoidable errors.
Despite these differences, the numerical model established in this paper can effectively simulate the nonlinear mechanical behavior and primary deformation patterns of shield tunnel segment joints under compression/bending loads. It can effectively reveal the mechanism of damage evolution at the joint under a bending moment. Therefore, this model can be used for subsequent bending performance analysis.
4. Analysis of Bending Performance of Double-Gasket Segment Joints
4.1. Analysis of Joint Opening Under Compression/Bending Load
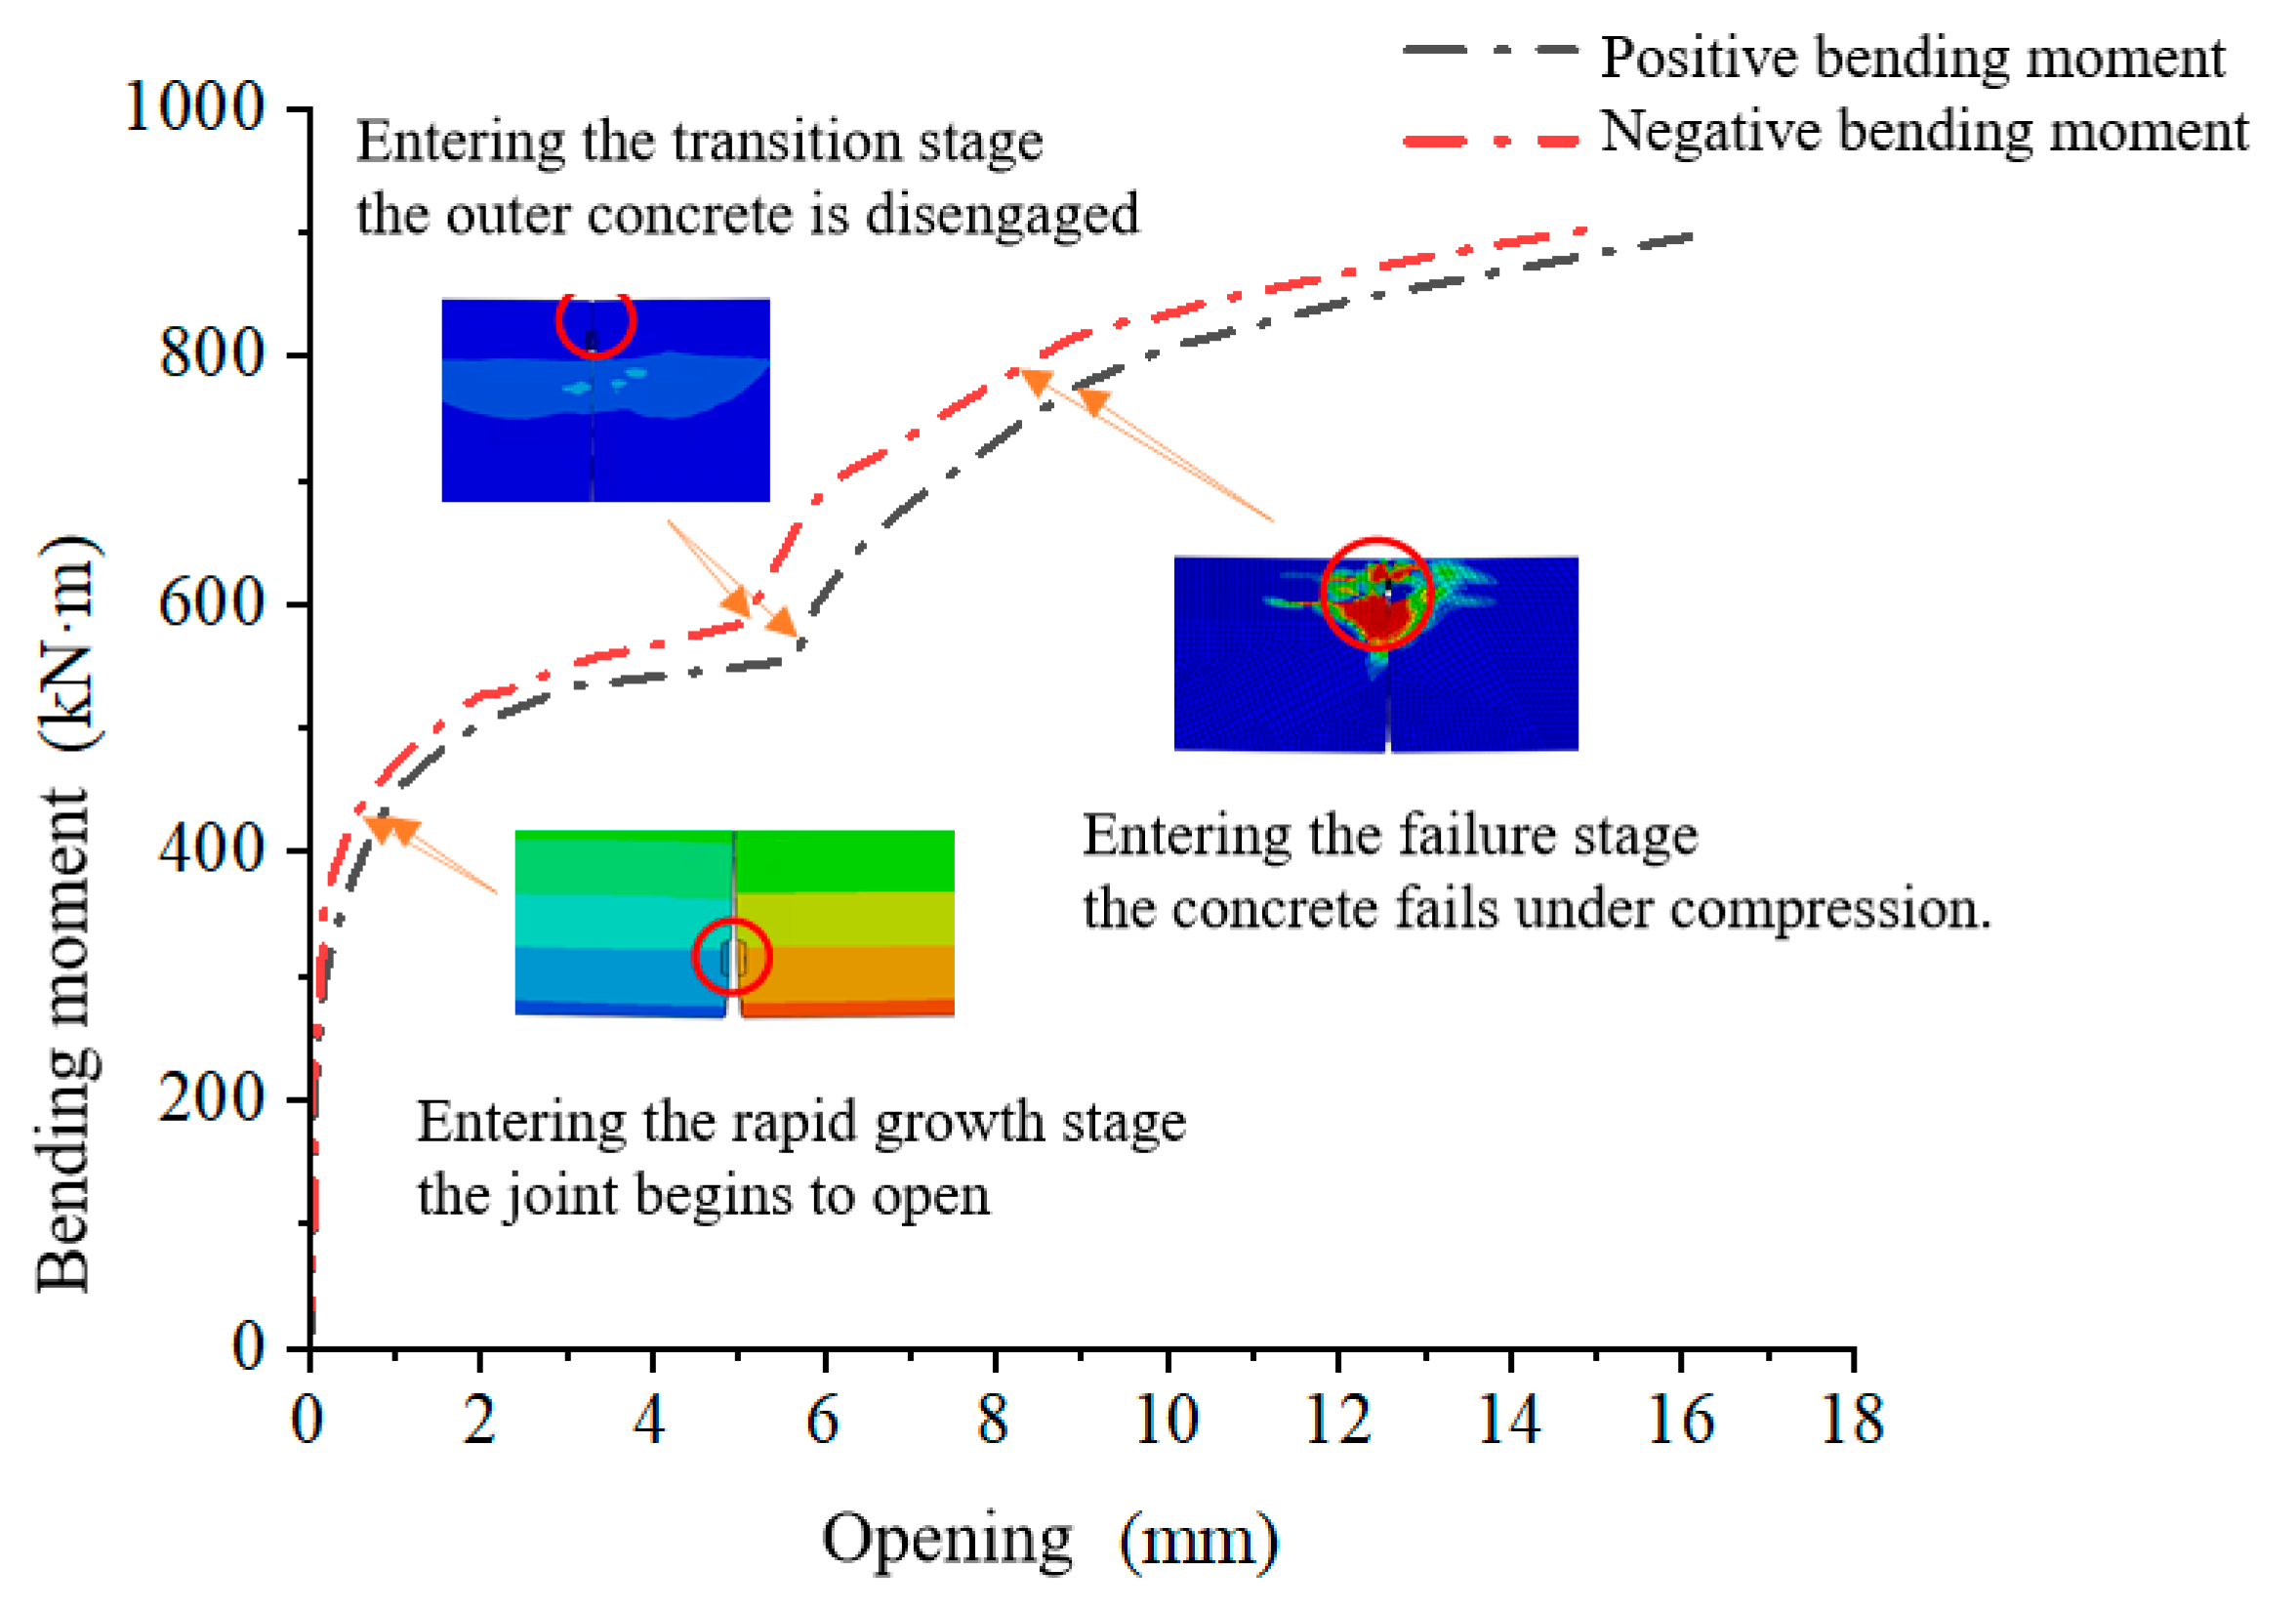
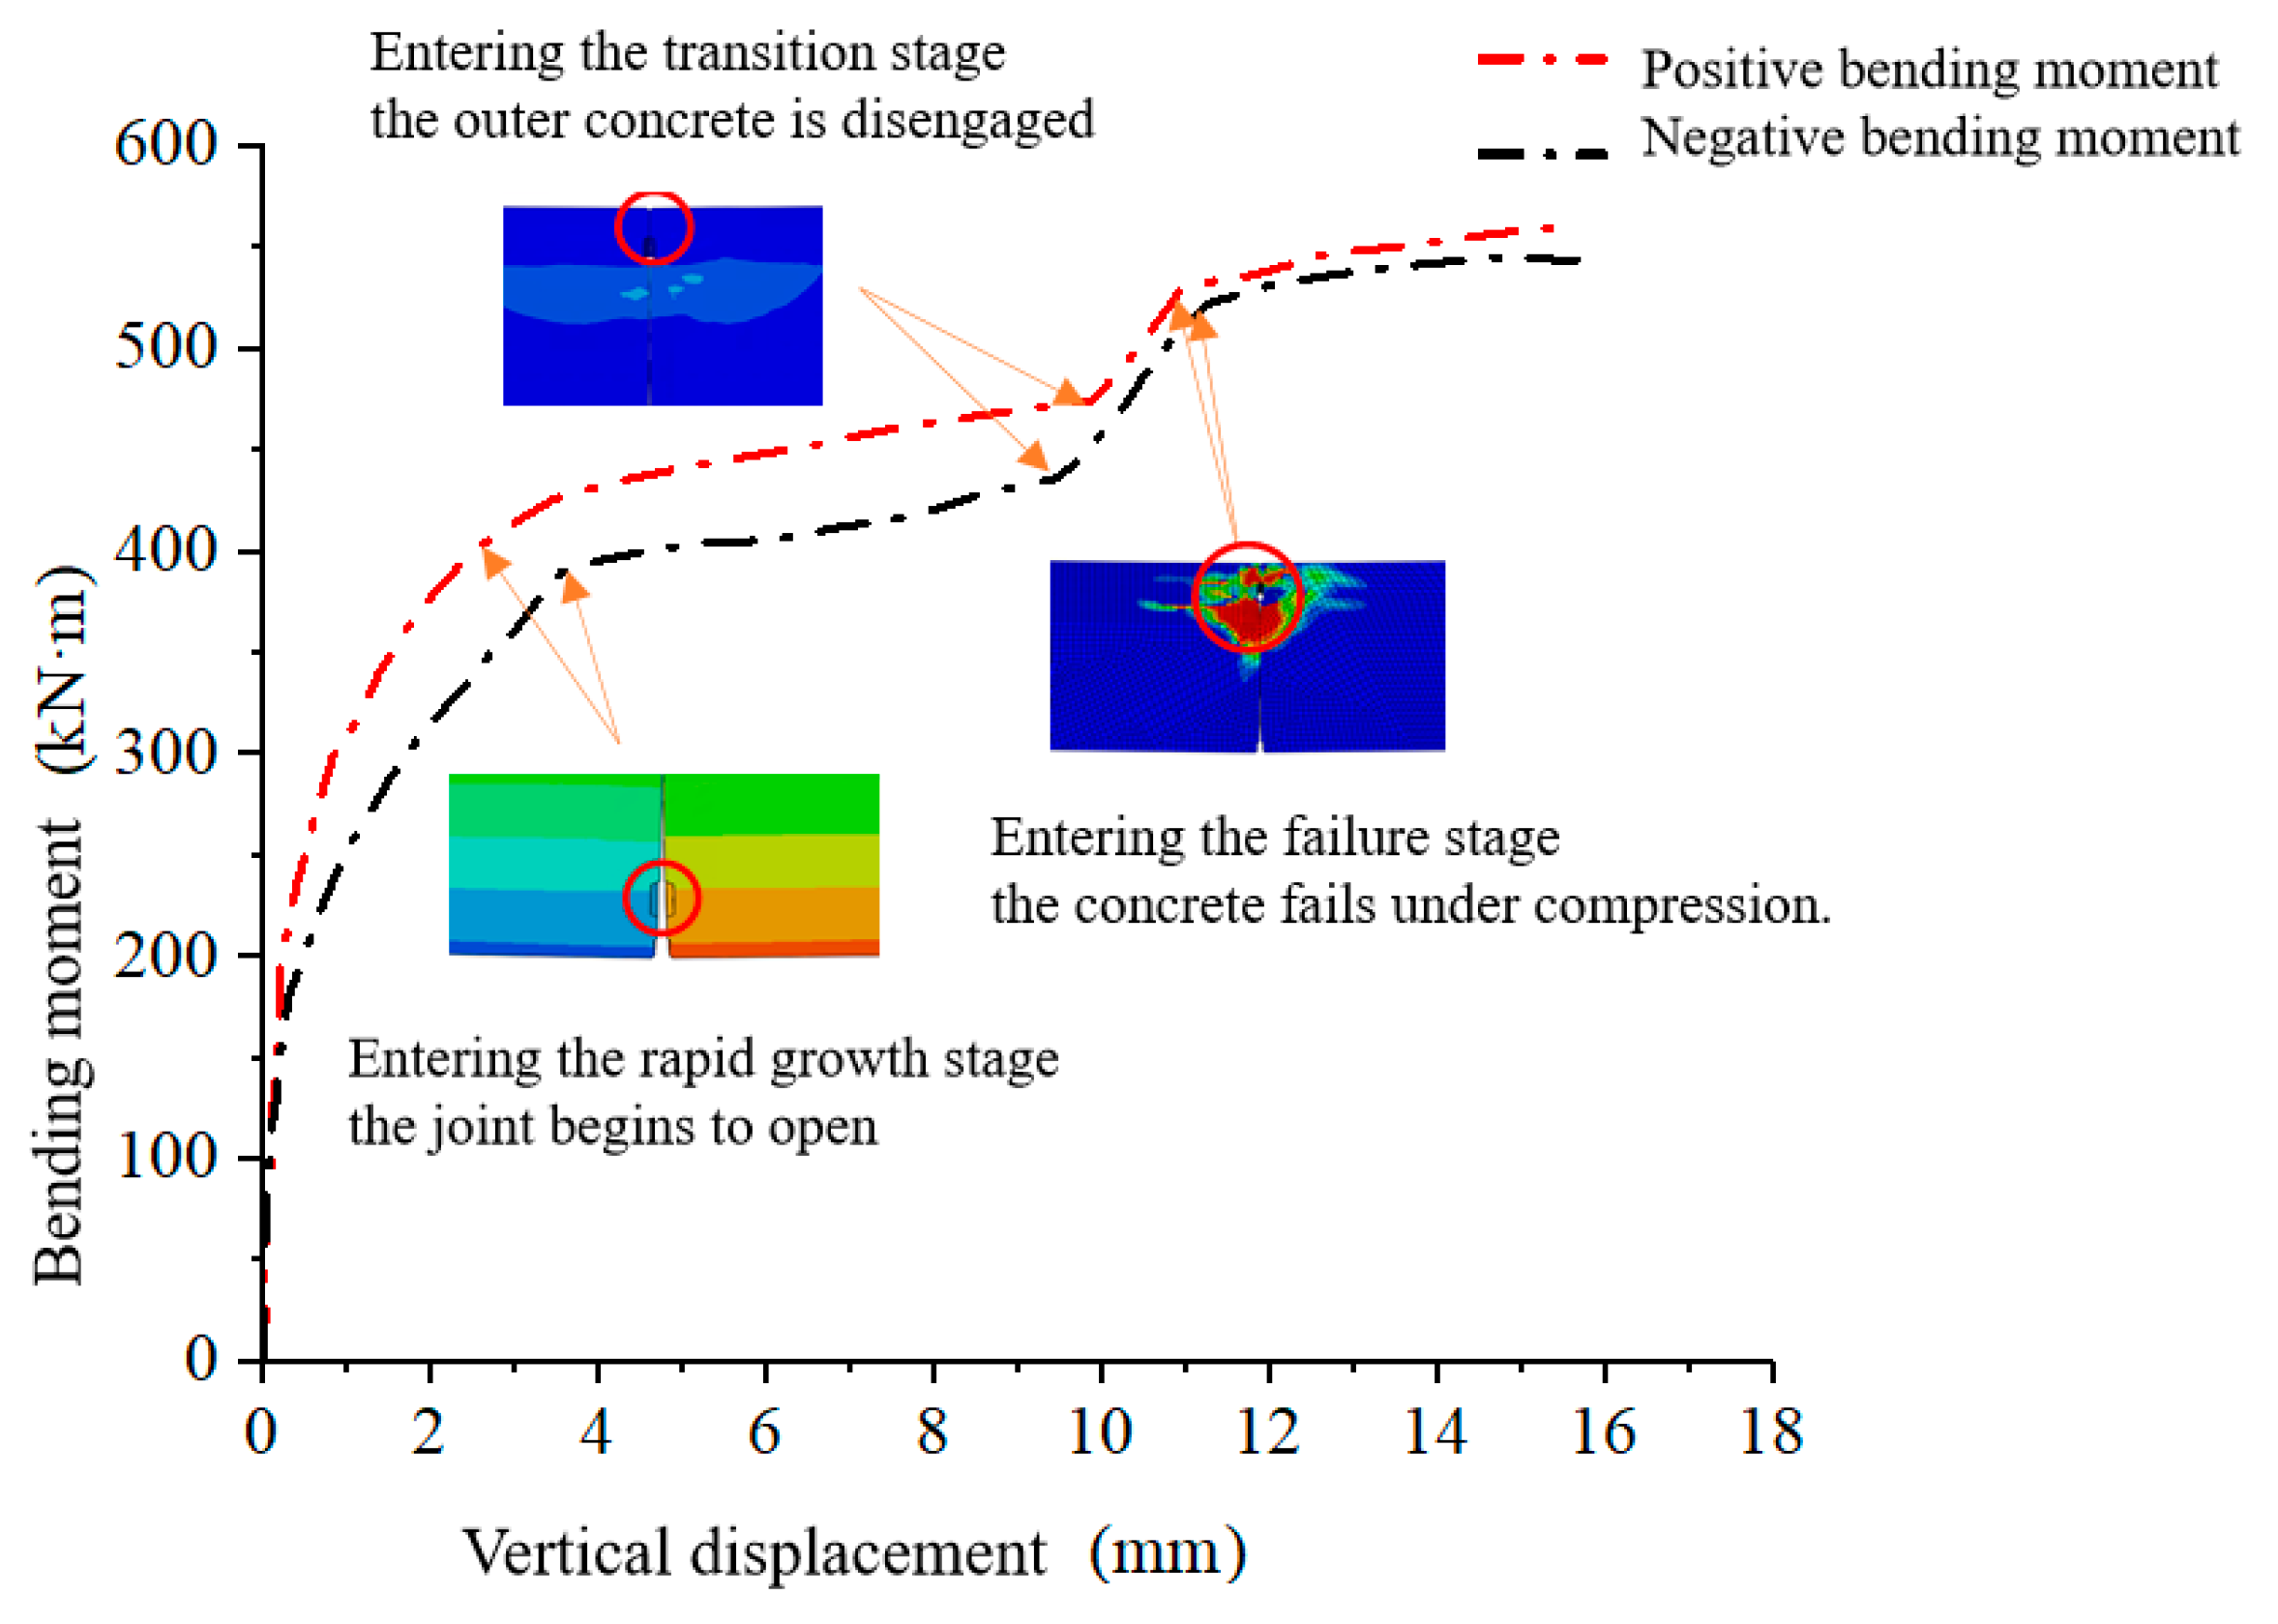
Figure 10 shows the relationship curve between joint opening and bending moment under an axial force of 5000 kN. As the figure indicates, the trend of the joint opening-bending moment curve is approximately the same under both positive and negative bending moments.
In the initial stage of the failure process, the entire cross-section of the segment joint is in compression due to the axial force and bolt pre-tightening force. The joint does not open significantly, bolt stress is low, and the longitudinal joint’s bending stiffness is high, leading to a slow increase in the opening angle.
As the bending moment continues to increase, the failure process enters the rapid growth stage. At this point, the joint begins to open, the area of the joint’s compression zone decreases, and the bolts gradually transition from the compression zone to the tension zone. The bending stiffness of the segment joint decreases, and the joint opening rapidly increases with the increasing bending moment, showing a nonlinear change.
When the bending moment increases further, the failure process enters the transition stage. During this phase, the void in the joint’s compression zone decreases, and the outer concrete of the waterproof grooves comes into contact. The height of the joint’s compression zone changes, the joint’s bending stiffness increases, and the rate of opening slows down.
Finally, when the bending moment reaches the ultimate load, the failure process enters the failure stage. The joint is almost fully open, the outer concrete of the segments is crushed, the compression zone area continues to decrease, the bending stiffness of the segment joint continues to decline, and the joint opening increases rapidly, exhibiting a “step-like” pattern.
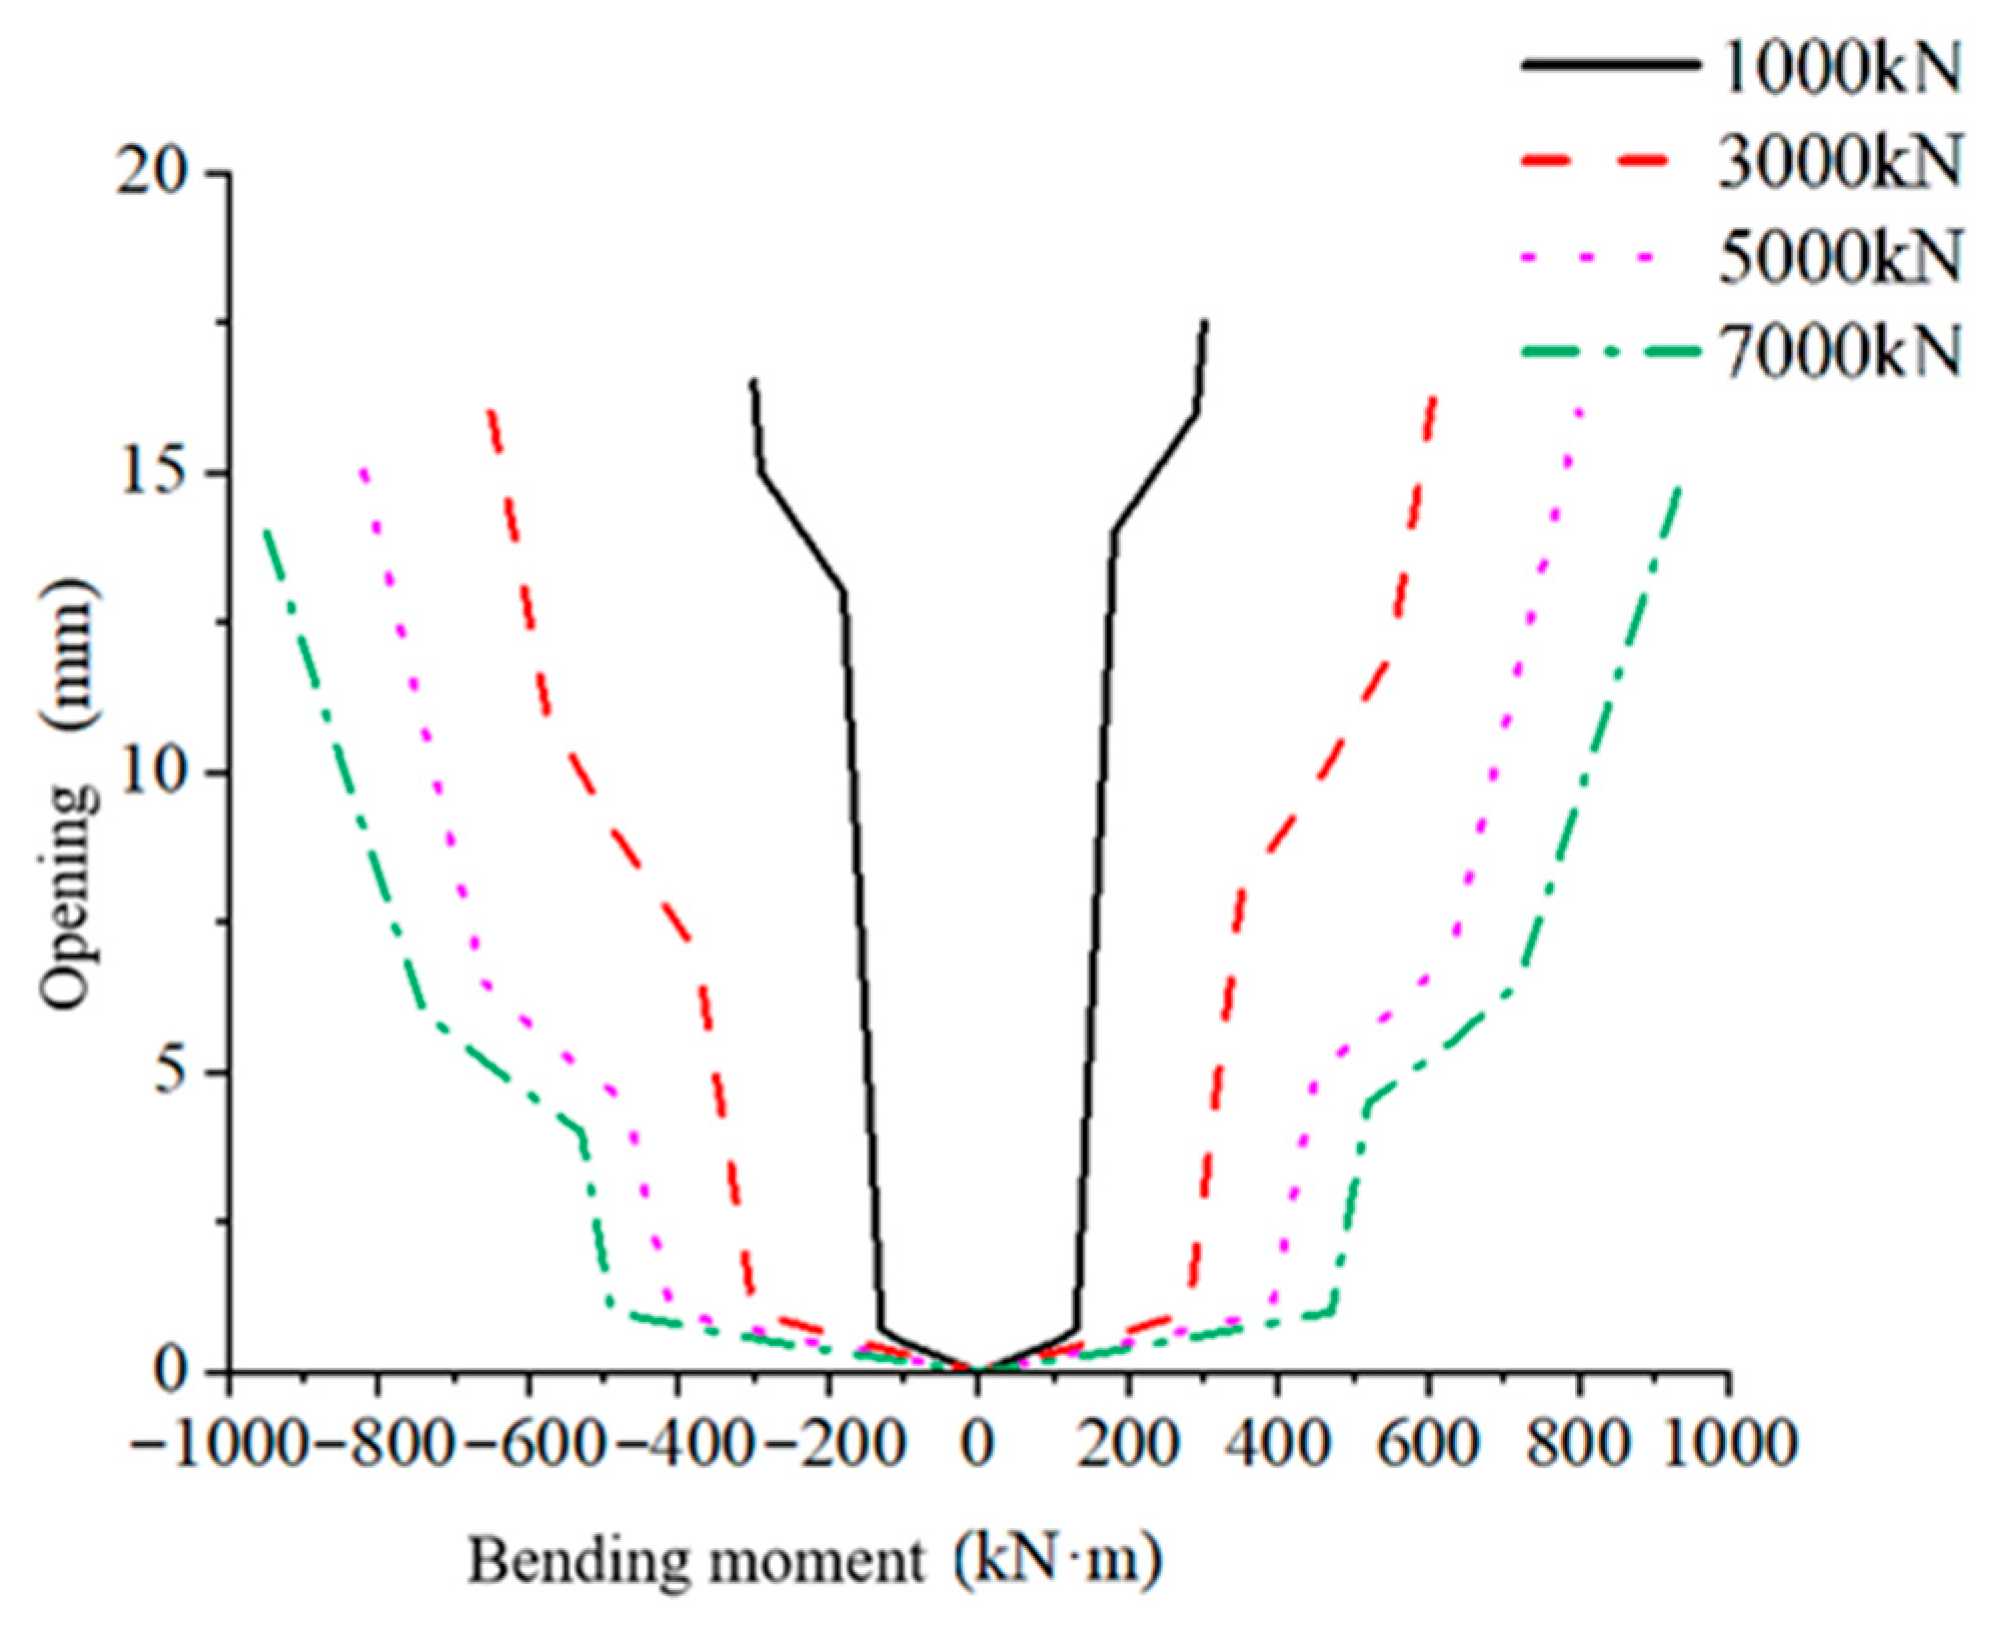
Figure 11 shows the joint opening-bending moment curves under different axial forces.
Table 5 provides the corresponding condensed numerical data, sampled at 100 kN·m bending-moment intervals for each axial-force case (1000, 3000, 5000, and 7000 kN), to facilitate reproducibility and cross-condition comparison. The results indicate that the development patterns of joint opening are generally similar across different axial forces. When the axial force increases from 1000 kN to 3000 kN, the ultimate bending capacity improves by 78.4%. When the axial force rises from 3000 kN to 5000 kN, the ultimate capacity increases by 26.9%. When the axial force goes from 5000 kN to 7000 kN, the ultimate capacity improves by 12.2%. Therefore, a larger axial force corresponds to a greater bending moment required for the joint to open—i.e., the joint is more difficult to open—and, at the same bending moment, a larger axial force results in a smaller joint opening.
4.2. Analysis of Vertical Displacement of Segment Joints Under Compression/Bending Load
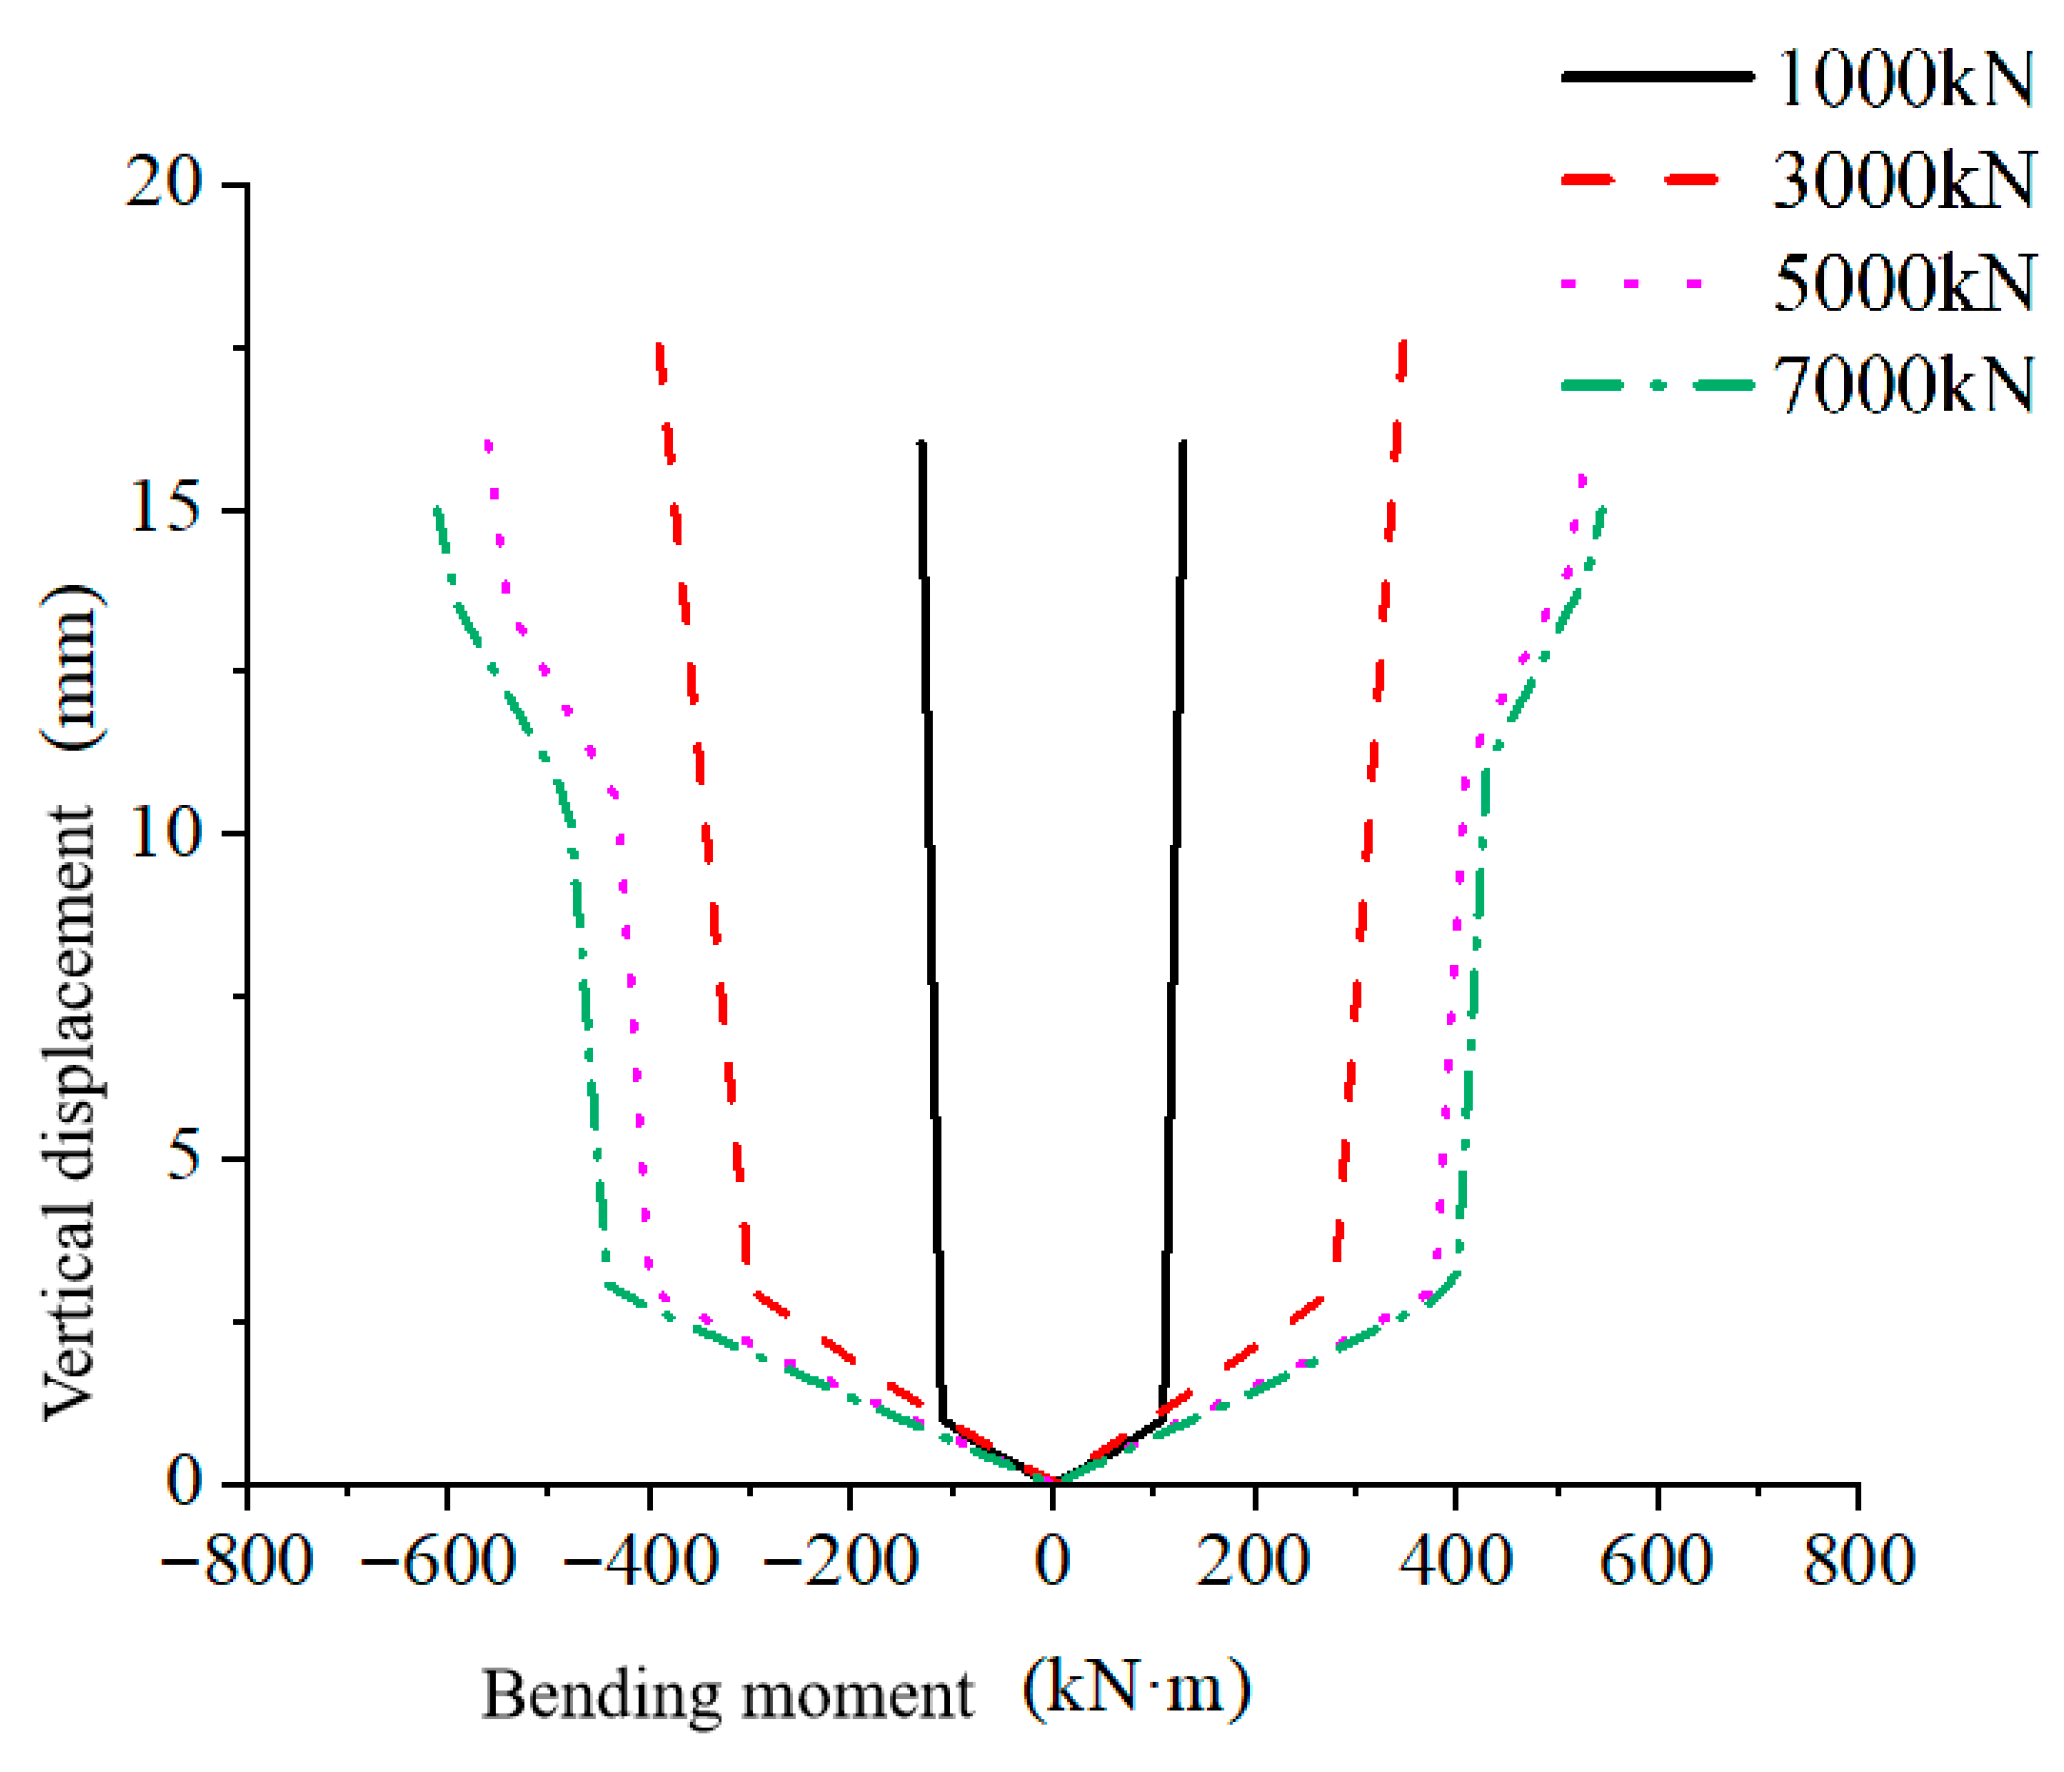
Figure 12 shows the relationship curve between vertical displacement and bending moment under an axial force of 5000 kN. As the figure shows, the vertical displacement/bending moment curve exhibits a similar behavior to the joint opening-bending moment curve, and the trends are largely the same under both positive and negative bending moments.
In the initial stage of the failure process, the entire cross-section of the segment joint is in compression, with no obvious joint opening and low bolt stress. The longitudinal joint has high bending stiffness, and the vertical displacement of the joint increases at a slow rate.
As the bending moment continues to increase, the failure process enters the rapid growth stage. At this point, the joint begins to open, the compression zone area decreases, and the bolts gradually transition from the compression zone to the tension zone. The bending stiffness of the segment joint decreases, and the vertical displacement of the joint rapidly increases with the increasing bending moment, showing a nonlinear change.
When the bending moment increases further, the failure process enters the transition stage. During this phase, the outer concrete of the segment joint comes into contact, the height of the compression zone changes, the joint’s bending stiffness increases, and the rate of increase in vertical displacement slows down.
Finally, when the bending moment reaches the ultimate load, the failure process enters the failure stage. The joint is almost fully open, the outer concrete of the segments is crushed, the compression zone area continues to decrease, the bending stiffness of the segment joint continues to decline, and the vertical displacement of the joint increases rapidly, exhibiting a “step-like” pattern.
Figure 13 shows the relationship curve between the vertical displacement of the joint and the bending moment under different axial forces. The results indicate that the development patterns of the joint’s vertical displacement are generally similar under different axial forces. When the axial forces are 1000 kN and 3000 kN, the segments experience only two stages: after entering the rapid growth stage from the initial stage, the vertical displacement of the joint increases rapidly until the concrete fails. When the axial forces are 5000 kN and 7000 kN, the concrete fails after the segments have gone through four stages. This is because when the axial force is small, tensile stress is generated at the joint, causing a rapid increase in the joint’s vertical displacement, which leads to concrete failure and prevents it from entering subsequent stages. When the axial force is large, compressive stress is generated at the segment joint, which inhibits the joint’s vertical displacement, making it easier for the segment joint’s failure process to enter the transition stage.
4.3. Analysis of Bolt Stress of Segment Joints Under Compression/Bending Load
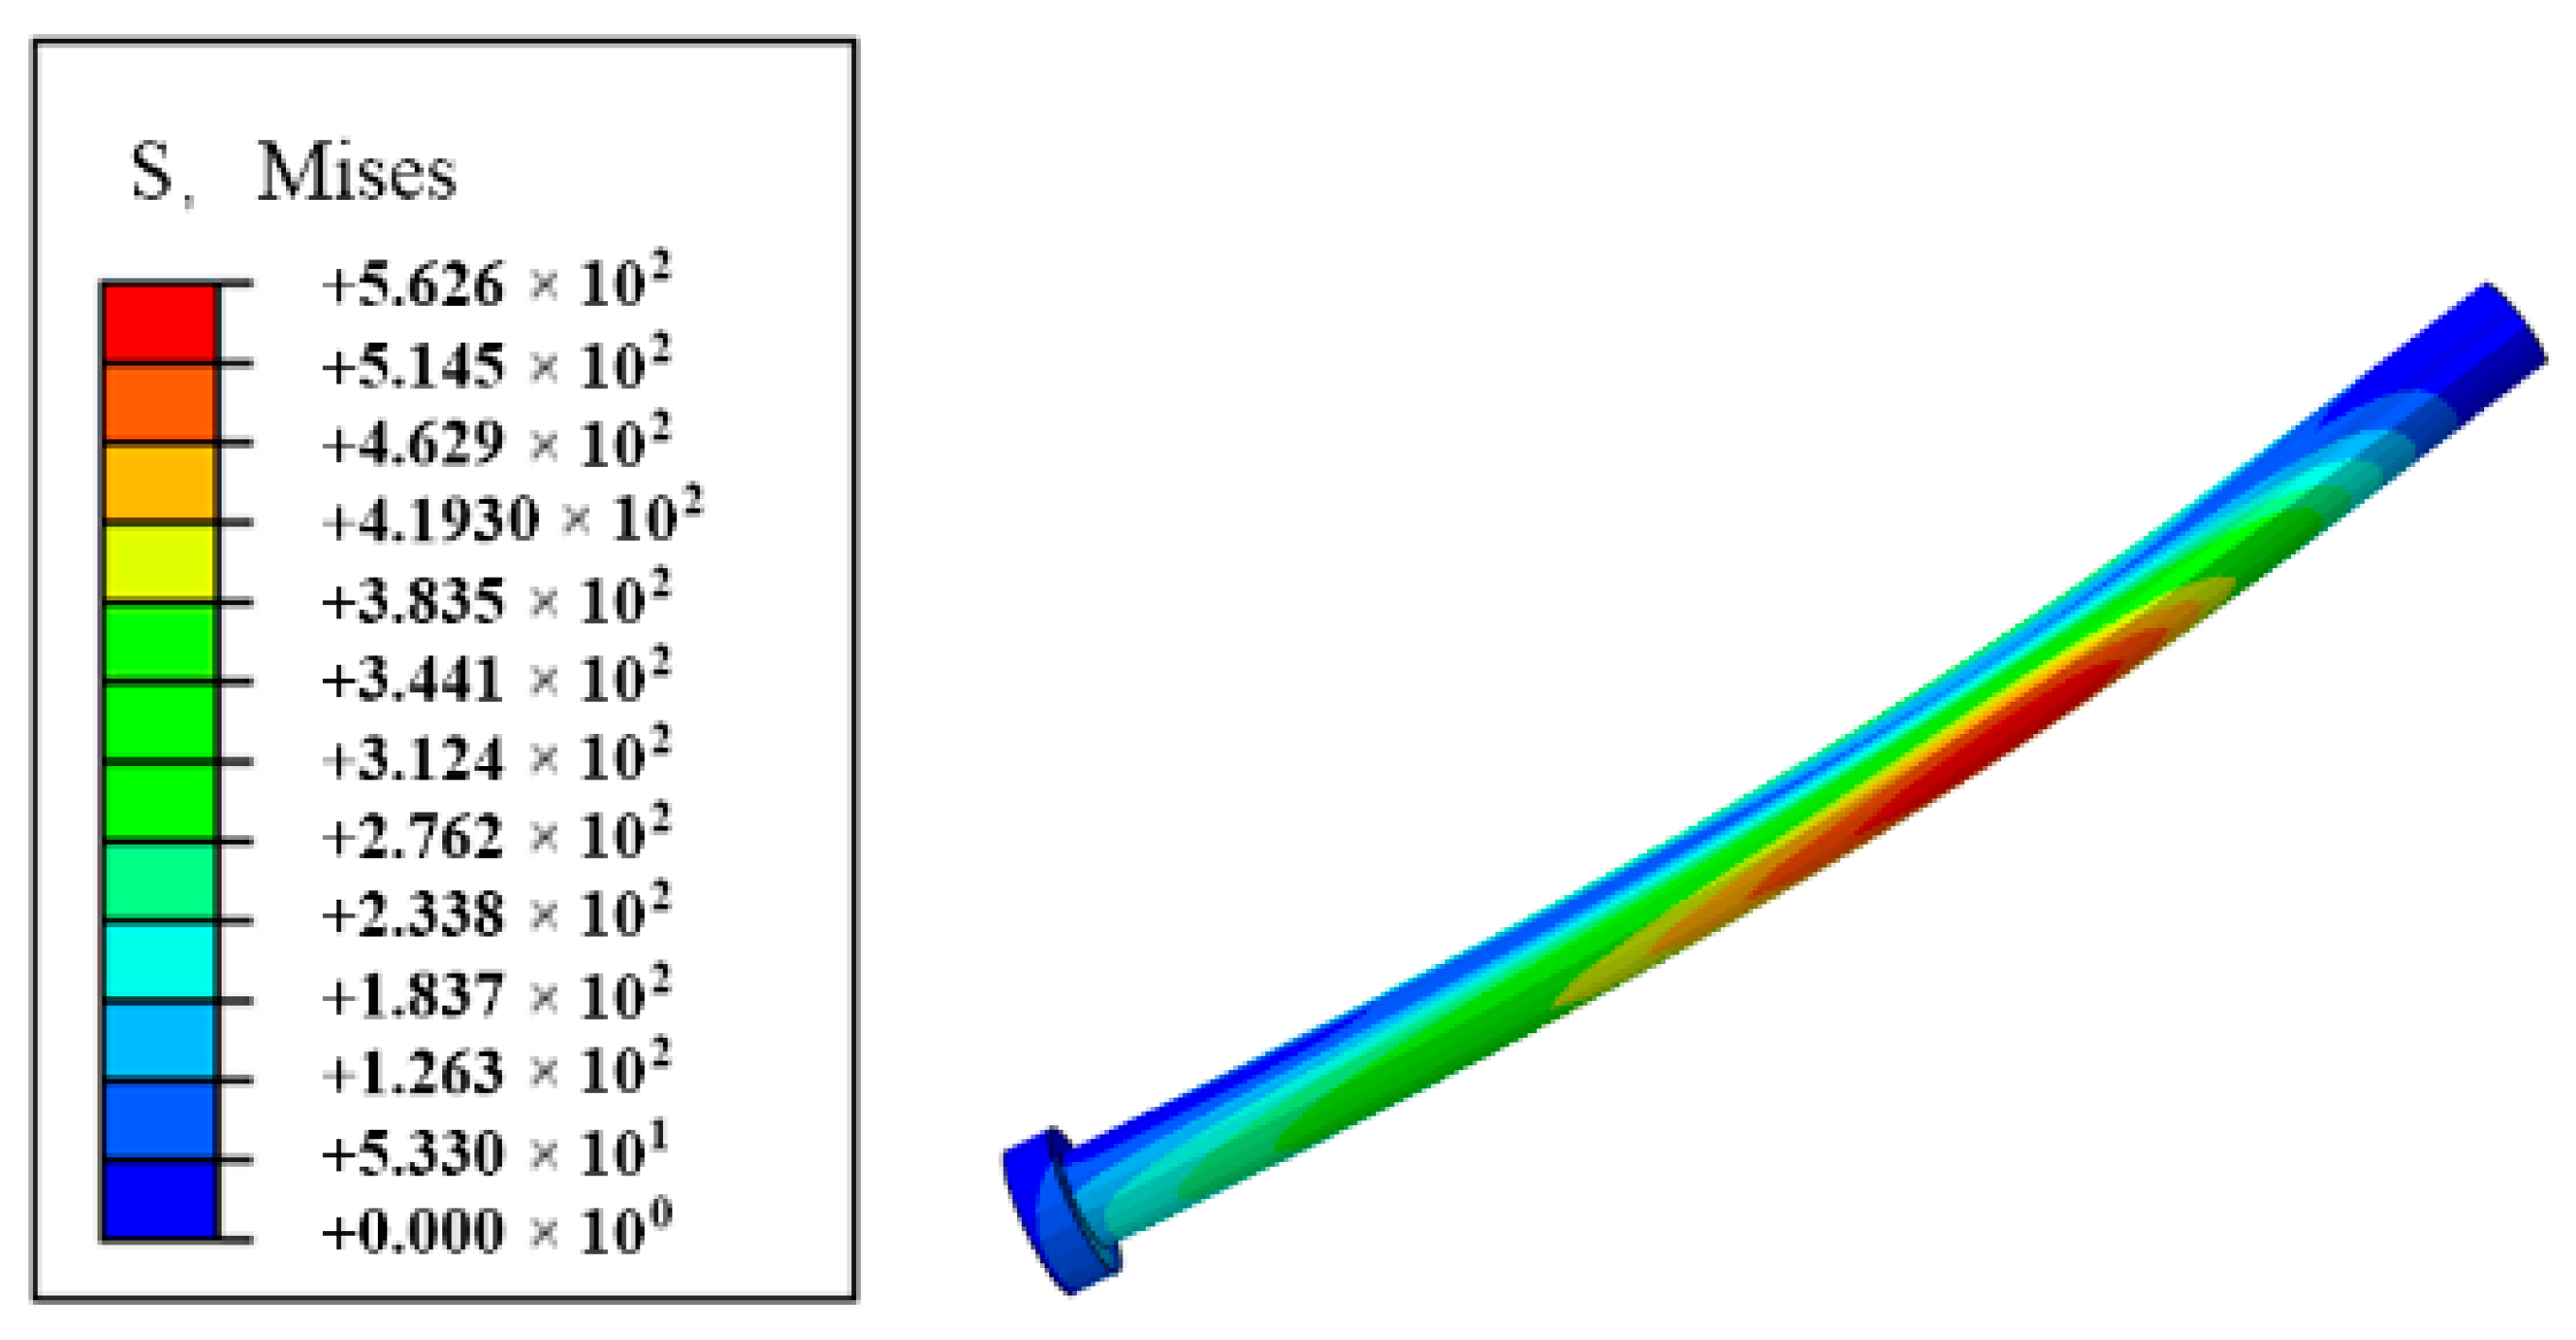
Bolts play a crucial role in connecting segments. During the bending of the segment’s longitudinal joint, they generate tension at the joint surface, which, together with the concrete in the compression zone, resists the bending moment. Therefore, it is essential to analyze the stress on the bolts to understand the mechanical performance of double-gasket segment joints in shield tunnels under high water pressure. This paper focuses on the stress patterns and deformation of the bolts under different bending moments. The Contours of von Mises stress in the bolt under a positive bending moment with an axial force of 5000 kN is extracted and shown in
Figure 14.
Due to the pre-reserved gap in the bolt holes, the bolts do not contact the holes when they deform. At the same time, the bolt’s anchorage section is anchored to the segment, and the hand-hole section is held tightly against the hand-hole by the bolt’s pre-tightening force. This ensures that almost no relative slip occurs between the bolt’s anchorage section and the sleeve. Under a positive bending moment, the opening of the segment joint causes the bolts to generate tensile force to resist, leading to significant bending deformation. There is a clear difference in the bolt stress on the two sides of the segment, with the anchorage section experiencing higher stress and the hand-hole section experiencing lower stress.
To further investigate the distribution pattern of bolt stress, the stress in the inner and outer areas of the bolt near the segment under different positive bending moments is extracted, as shown in
Figure 15. The figure shows that as the bending moment increases, the bolt stress increases nonlinearly and is non-uniformly distributed along the bolt’s length. Before the bolt yields, the stress is greatest at the inner joint face of the segment and lowest at the anchorage section. After the bolt begins to yield, the stress in all other sections, except for the small stress at the bolt’s anchorage end, rapidly increases to the yield stress. The stress is greatest at the inner joint face of the segment, and at this point, the stress distribution in the inner and outer areas of the bolt near the segment is roughly the same. Under a negative bending moment, the bolt deformation and stress distribution are opposite to those under a positive bending moment, with lower stress in the inner area and higher stress in the outer area of the bolt near the segment.
4.4. Analysis of Segment Joint Damage Mode Under Compression/Bending Load
To understand the concrete failure of the longitudinal segment joints under combined compression/bending loads, the compressive damage parameter is used to represent the concrete’s compressive failure when the longitudinal joint is subjected to a bending moment. This paper extracts the Contours of von Mises stress of compressive damage in the concrete joint area under a positive bending moment with an axial force of 5000 kN, as shown in
Figure 16.
As shown in the figure, the concrete failure process can be divided into four stages. When the bending moment is less than 580.44 kN·m, the entire cross-section of the segment joint is in compression, and the concrete’s compressive zone area is relatively large. The damage zone appears slowly, the damage factor is small, and no significant deformation occurs in the concrete.
When the bending moment exceeds 580.44 kN·m, the joint can no longer resist the bending moment under the combined action of axial force and bolt pre-tightening force. The joint opens significantly, the concrete compression zone decreases, and the damaged area of the concrete grows rapidly. When the bending moment reaches 704.32 kN·m, the inner concrete of the waterstop groove is squeezed and fails first.
When the bending moment reaches 714.45 kN·m, the outer concrete of the waterstop groove makes contact, the height of the concrete’s compression zone increases, and the rate of increase in the damaged concrete area slows down. The compressive damage parameter continues to increase, and the concrete in the compression zone is severely damaged.
When the bending moment reaches 958.74 kN·m, the concrete in the compression zone is completely destroyed, and the structure undergoes significant displacement. The outer concrete is severely damaged, and extended cracks appear in the concrete, originating from the joint face and spreading symmetrically at a 45° angle. As observed in the damage Contours of von Mises stress of the simulation results (
Figure 16), this damage originates from the joint face and spreads symmetrically, forming a wedge-shaped fracture network at an approximate 45° angle.
Since the bolt’s load transfer is primarily through the anchorage section and the hand-hole end, the deformation of the bolt when the joint opens affects the concrete in the load transfer zone. In the initial stage of loading, the bolt has little effect on the concrete. As the load increases, the damaged area of the concrete on the anchorage side continues to grow, and damage gradually appears around the sleeve. When the load is further increased to the point of severe damage to the concrete joint face, the concrete on the anchorage side is even more severely damaged, with failure occurring in the sleeve contact area.
4.5. Analysis of Reinforcement Stress in Segments Under Compression/Bending Load
When the bending moment reaches 958.74 kN·m, the concrete in the compression zone is completely destroyed, and the structure undergoes significant displacement. The outer concrete is severely damaged, and extended cracks appear in the concrete, originating from the joint face and spreading symmetrically at a 45° angle.
Reinforcement bars are a vital part of the lining segments. Working with the concrete, they play a complementary role, significantly enhancing the segment’s bearing capacity and seismic performance. Therefore, studying the stress performance of reinforcement bars when the segment joint is in a bending state is crucial for guiding future design optimization of the segment structure.
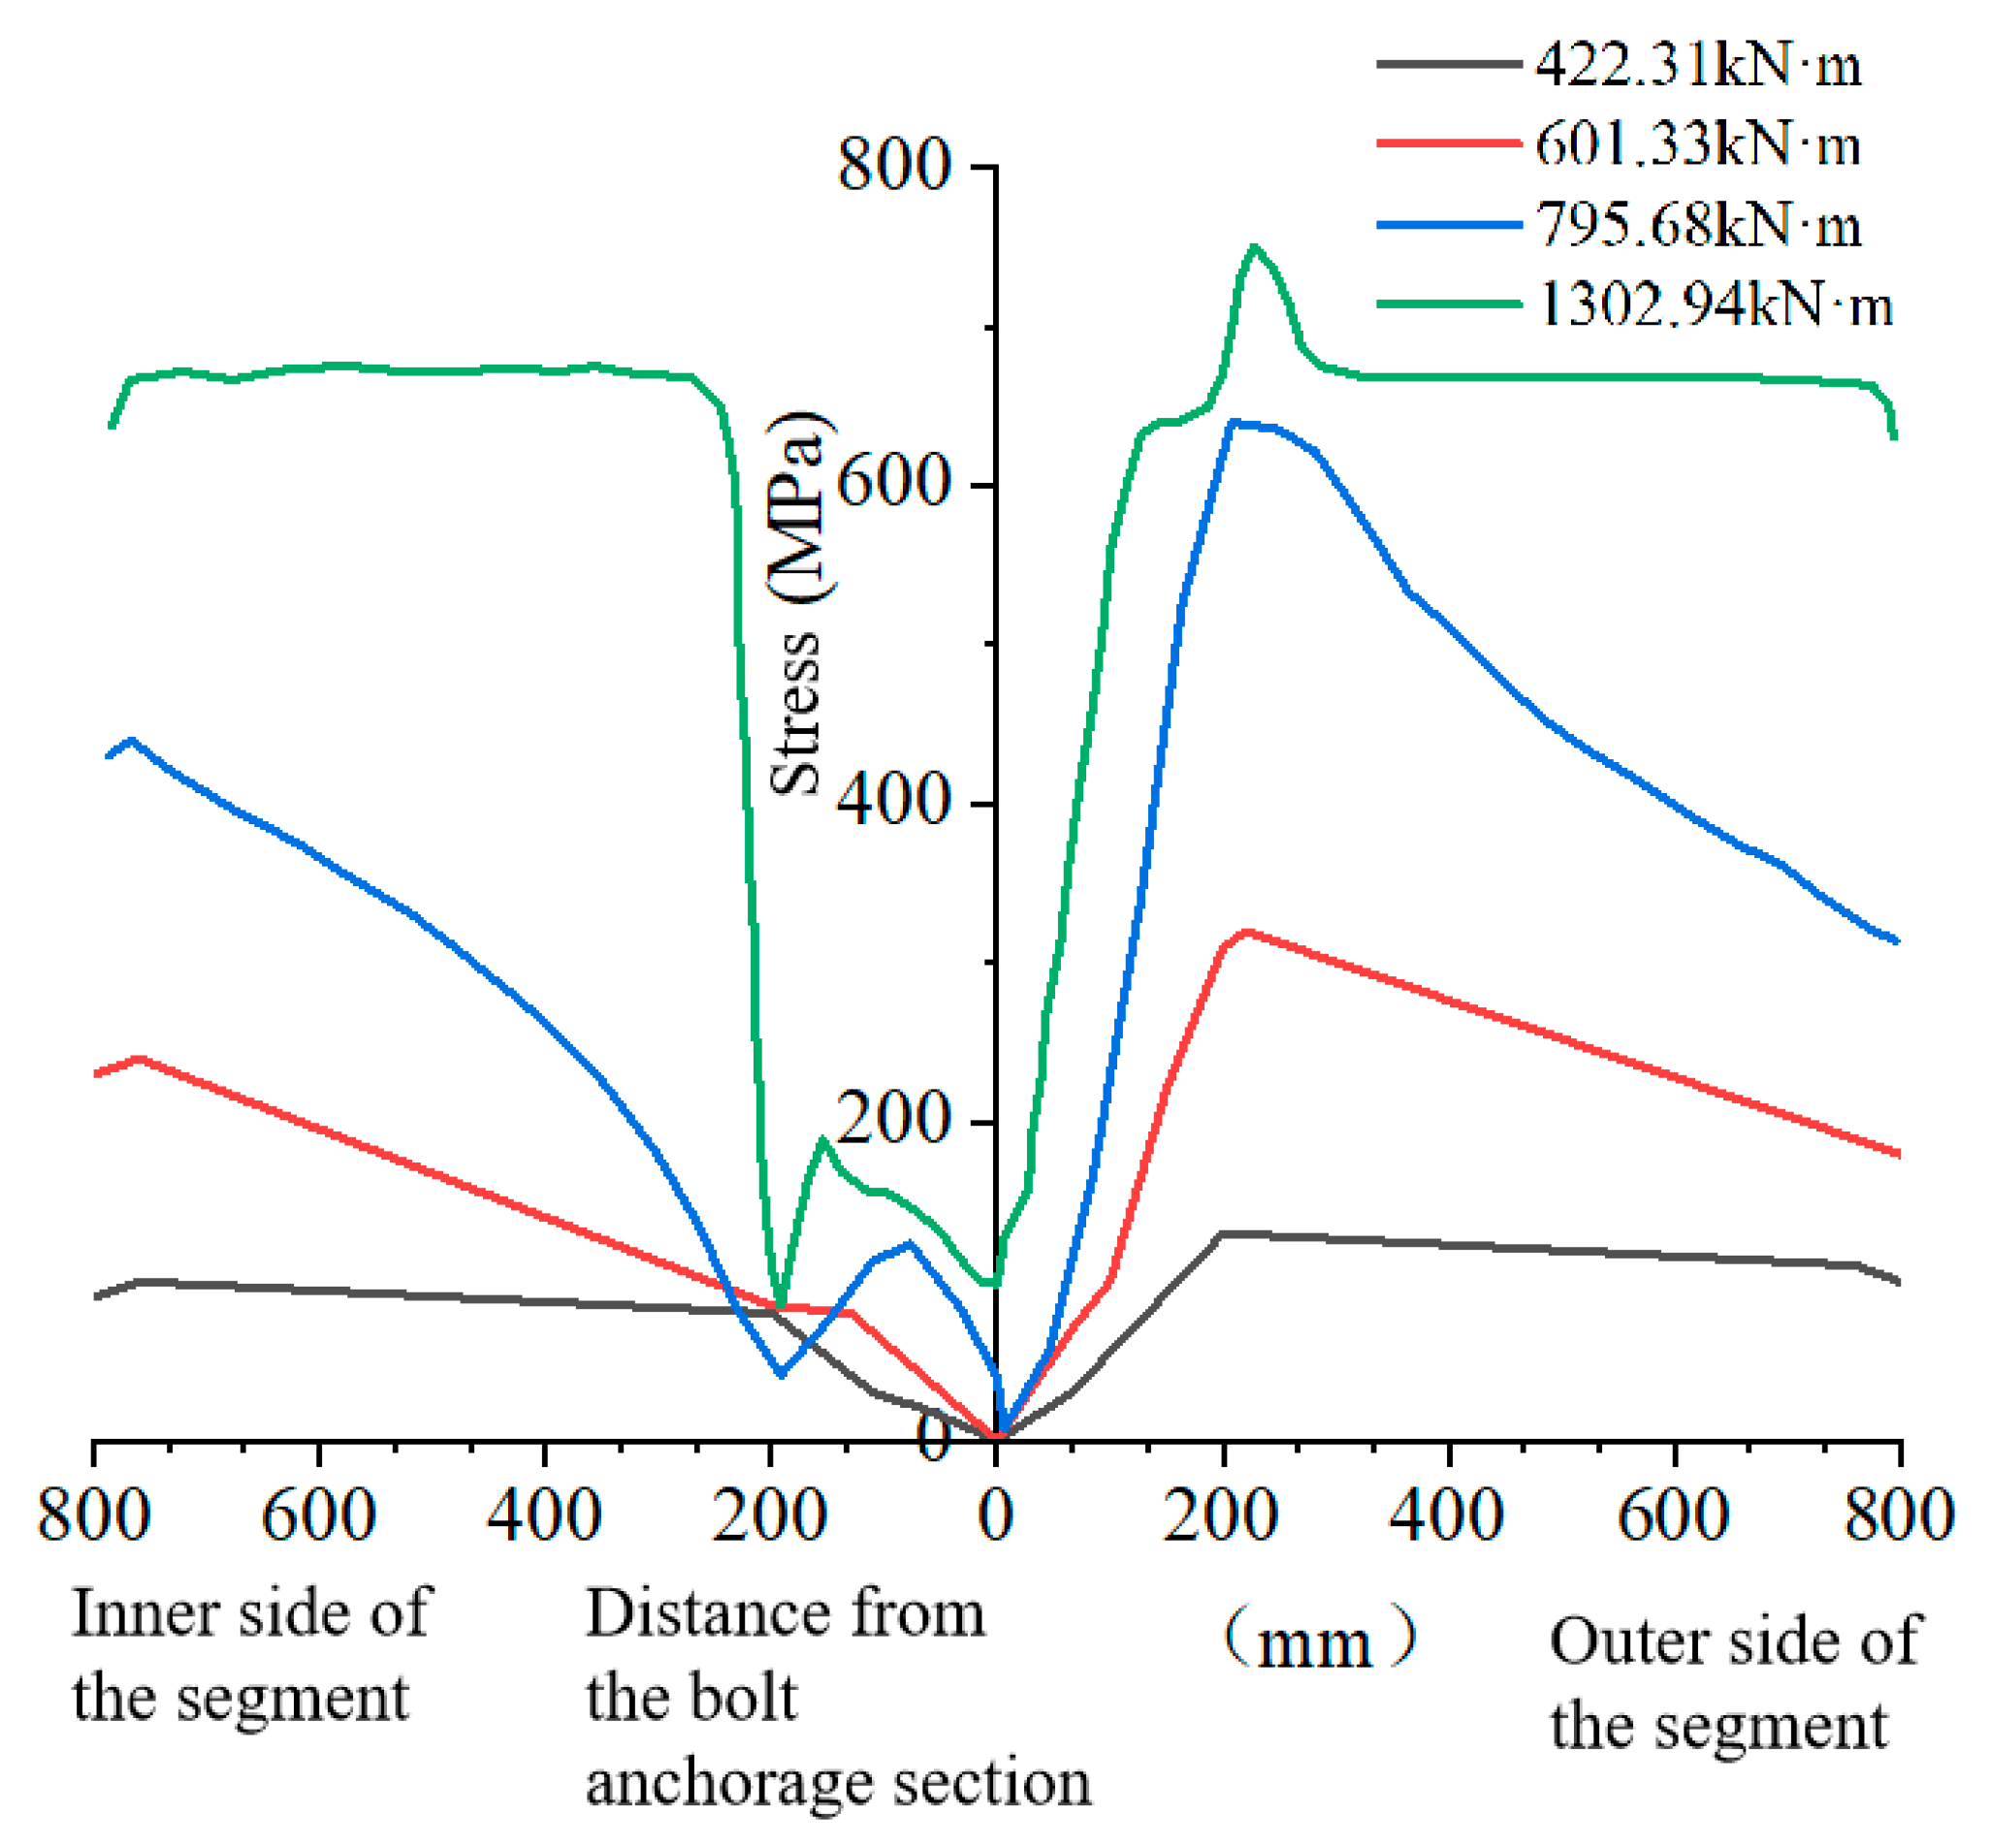
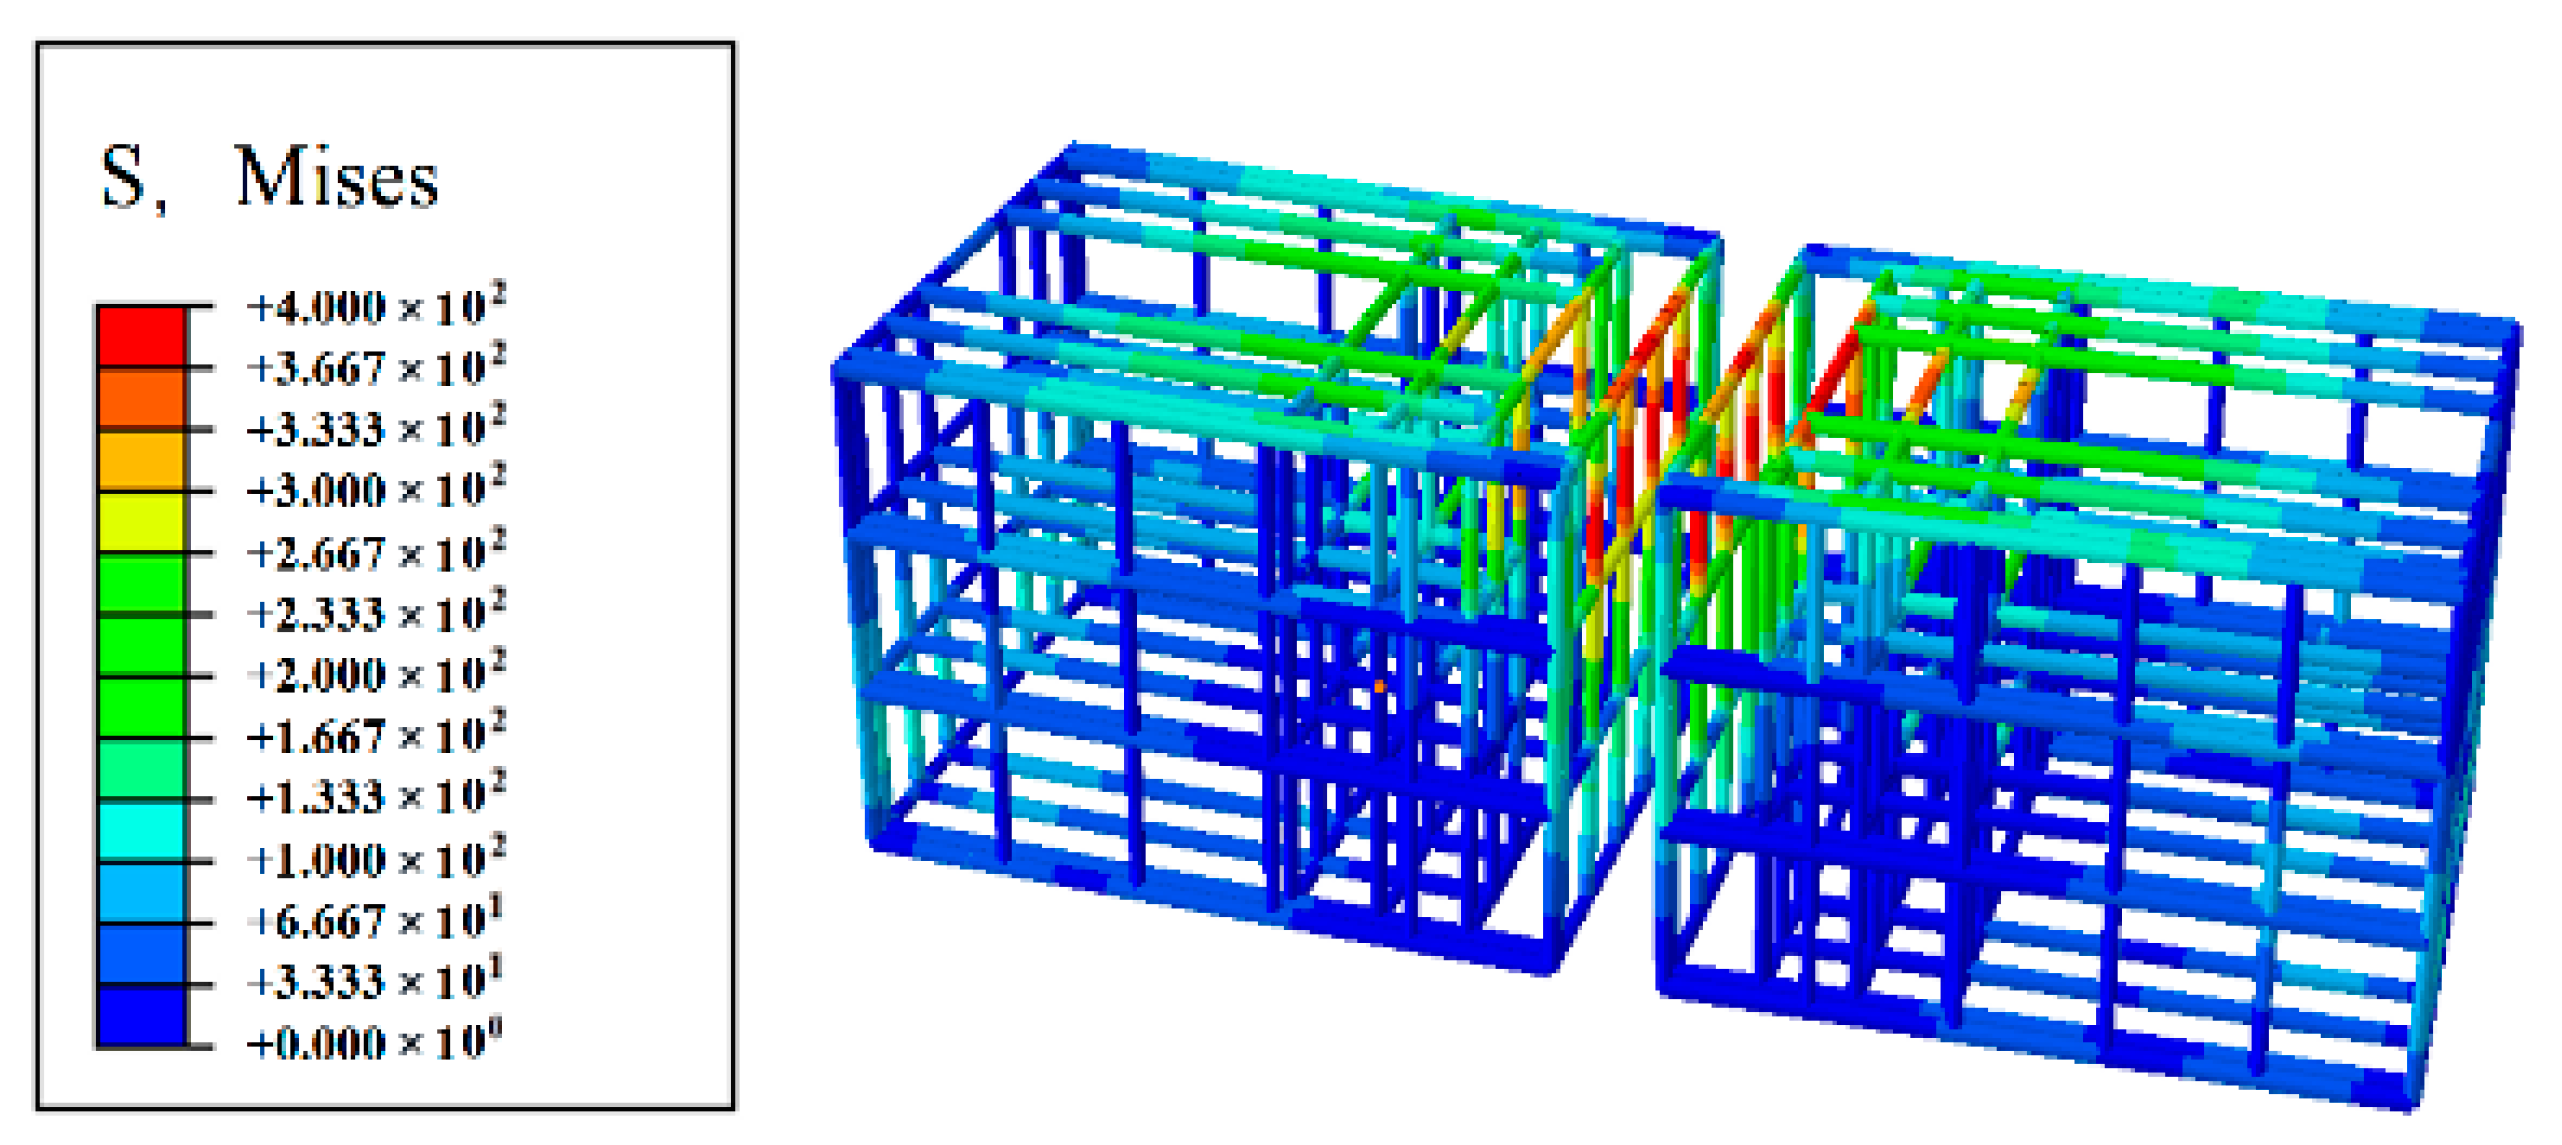
Figure 17 shows the Contours of von Mises stress of the reinforcement bars under a positive bending moment. From the figure, it is clear that the stress is highest in the reinforcement bars at the segment joint face and on the outer side of the segment. The location of the maximum stress in the reinforcement bars coincides with the concrete’s compressive failure zone. This indicates that when concrete undergoes compressive failure, the reinforcement can work together with the concrete to resist deformation, thereby delaying the development of the concrete’s failure zone. Additionally, the stress in the reinforcement bars at the segment joint face reaches the yield stress when the concrete fails in compression. Therefore, using higher-performance reinforcement at the joint face could enhance the bending performance of the segment joint.
Figure 18 shows the stress change curves of reinforcement bars at different locations under various bending moments. The figure shows that under a positive bending moment, only the stress in the reinforcement bars at the joint face and the outer side of the segment increases significantly with the bending moment. The stress in the reinforcement bars closer to the inner side of the segment does not change notably. The reinforcement bars at the joint faces on both sides of the segment yield when the bending moment reaches 1033.63 kN·m, while the outer reinforcement bars begin to yield when the bending moment reaches 1302.94 kN·m. Furthermore, it can be observed that the stress in the outer reinforcement and the joint face reinforcement on the hand-hole side is less than that on the anchorage side. This is because the bolts primarily transfer stress through the anchorage and hand-hole sections, which makes the stress on the outer reinforcement and joint face reinforcement on the anchorage side greater than on the hand-hole side.
5. Analysis of Bending Performance of Joints with Different Gasket Arrangements
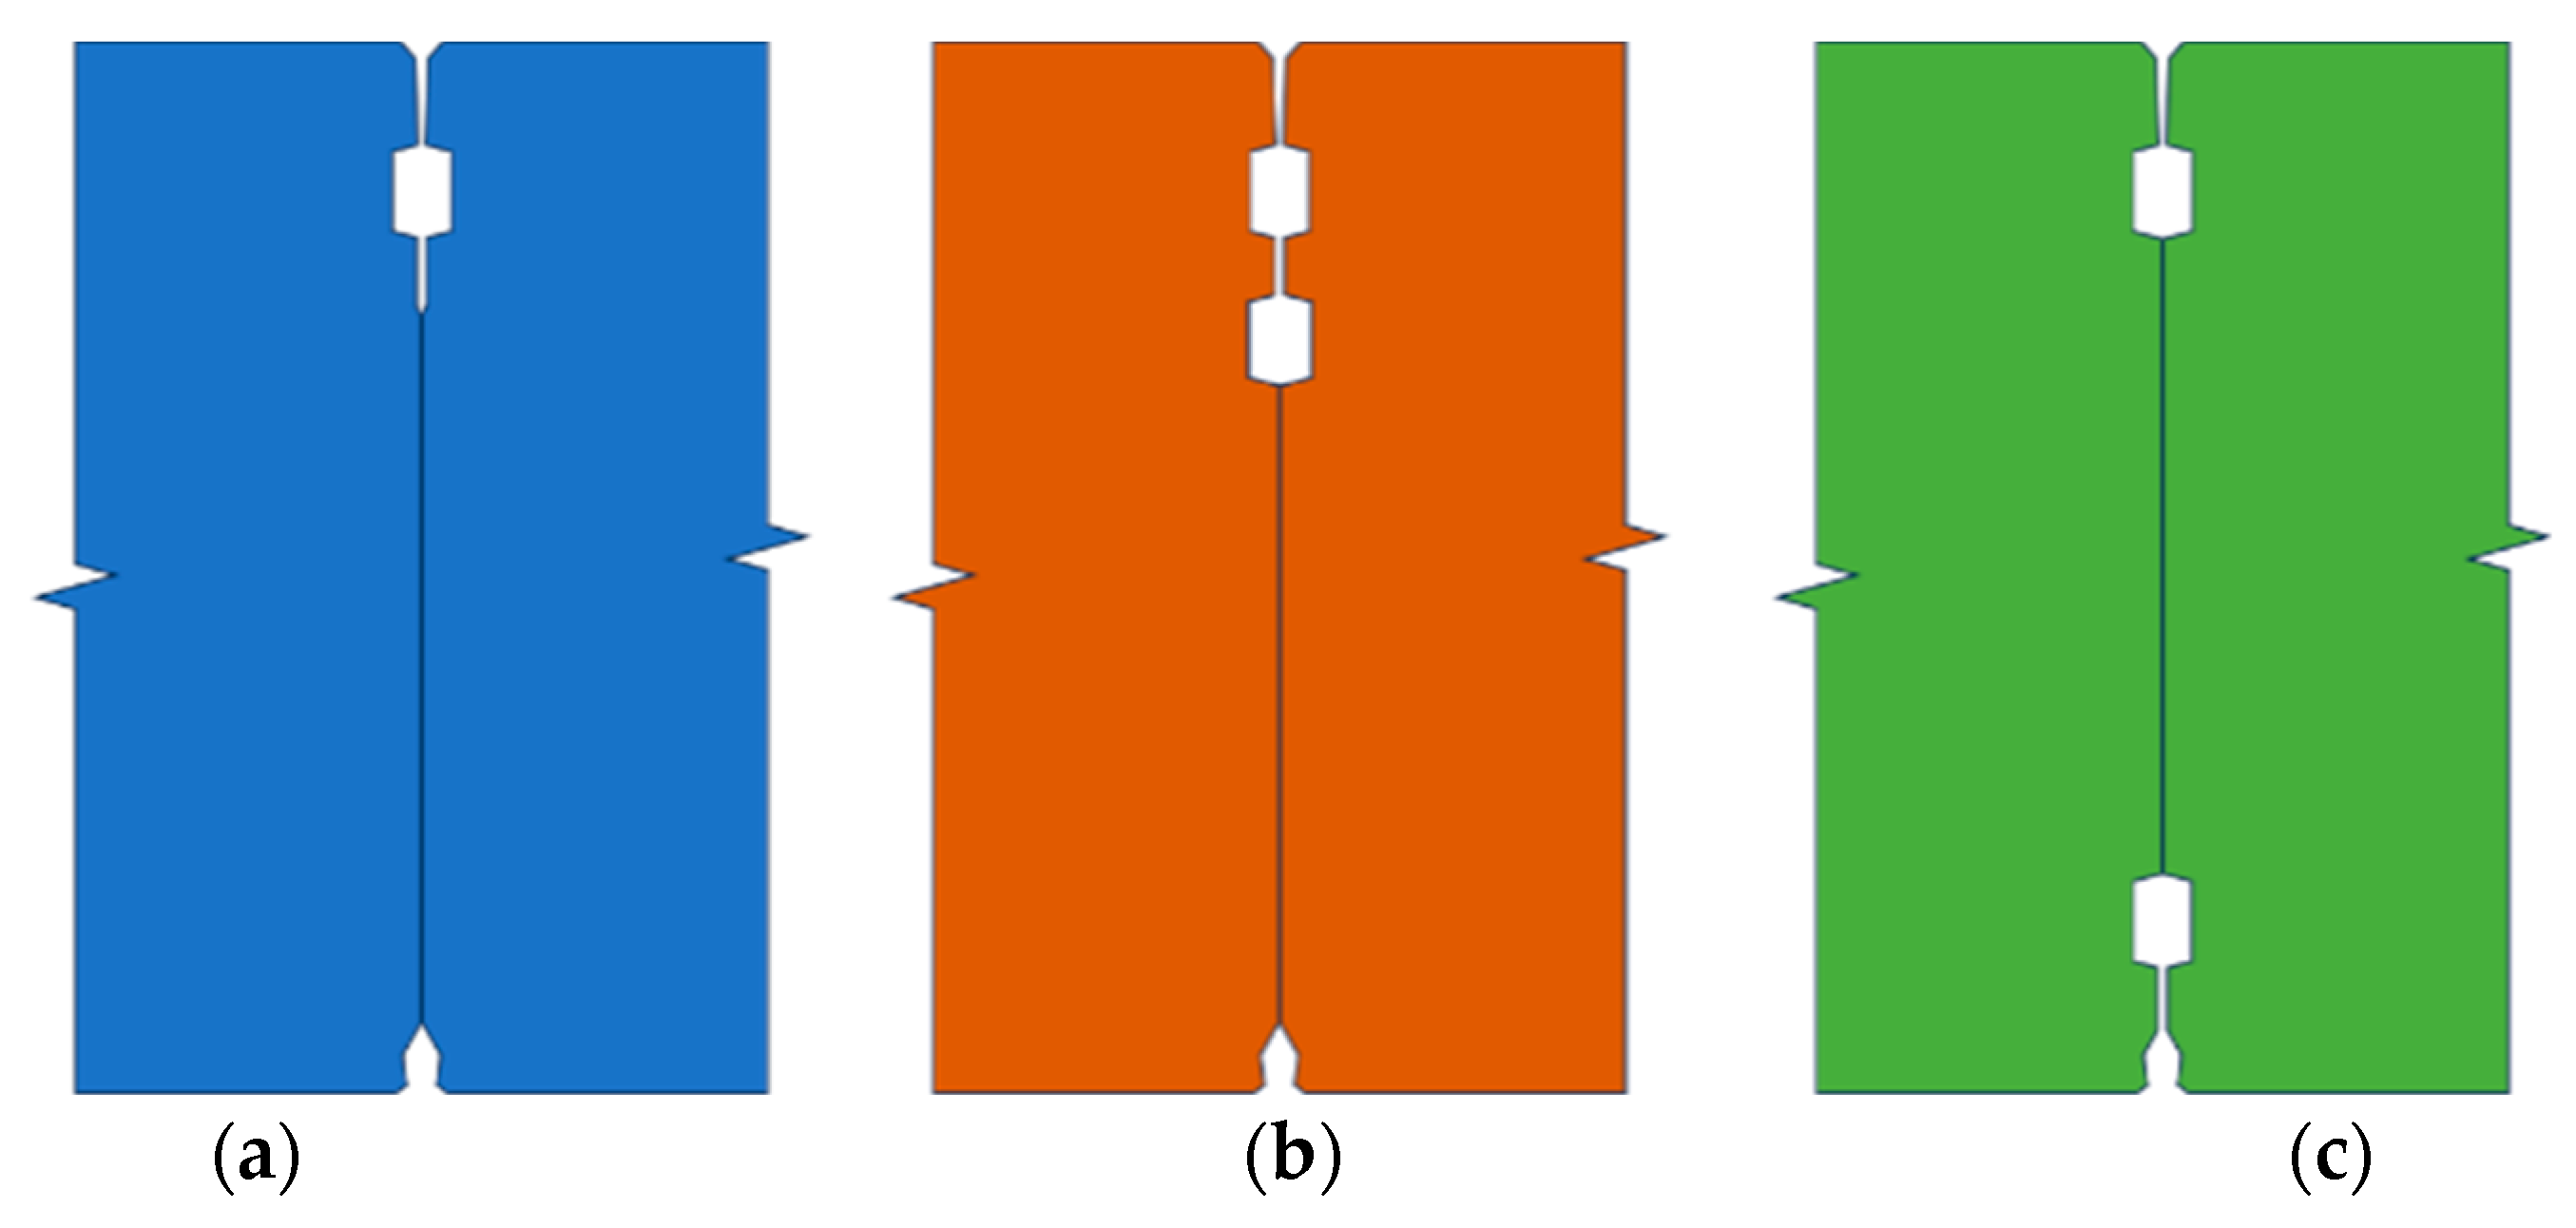
To further investigate the effect of the double-gasket configuration on bending performance, a single-gasket joint and another double-gasket configuration were selected for comparison, in addition to the double-gasket inner-and-outer waterproofing form used in this project. The schematic diagrams of their joint configurations are shown in
Figure 19.
Using the same loading method as described earlier, the three-dimensional numerical models of segments with two different joint structures were subjected to positive and negative bending moments under different water pressures. This yielded the full-process mechanical performance changes in both models under different conditions. An analysis of the numerical simulation results was conducted to obtain the characteristics of segment joint opening with increasing bending moment under different water pressures.
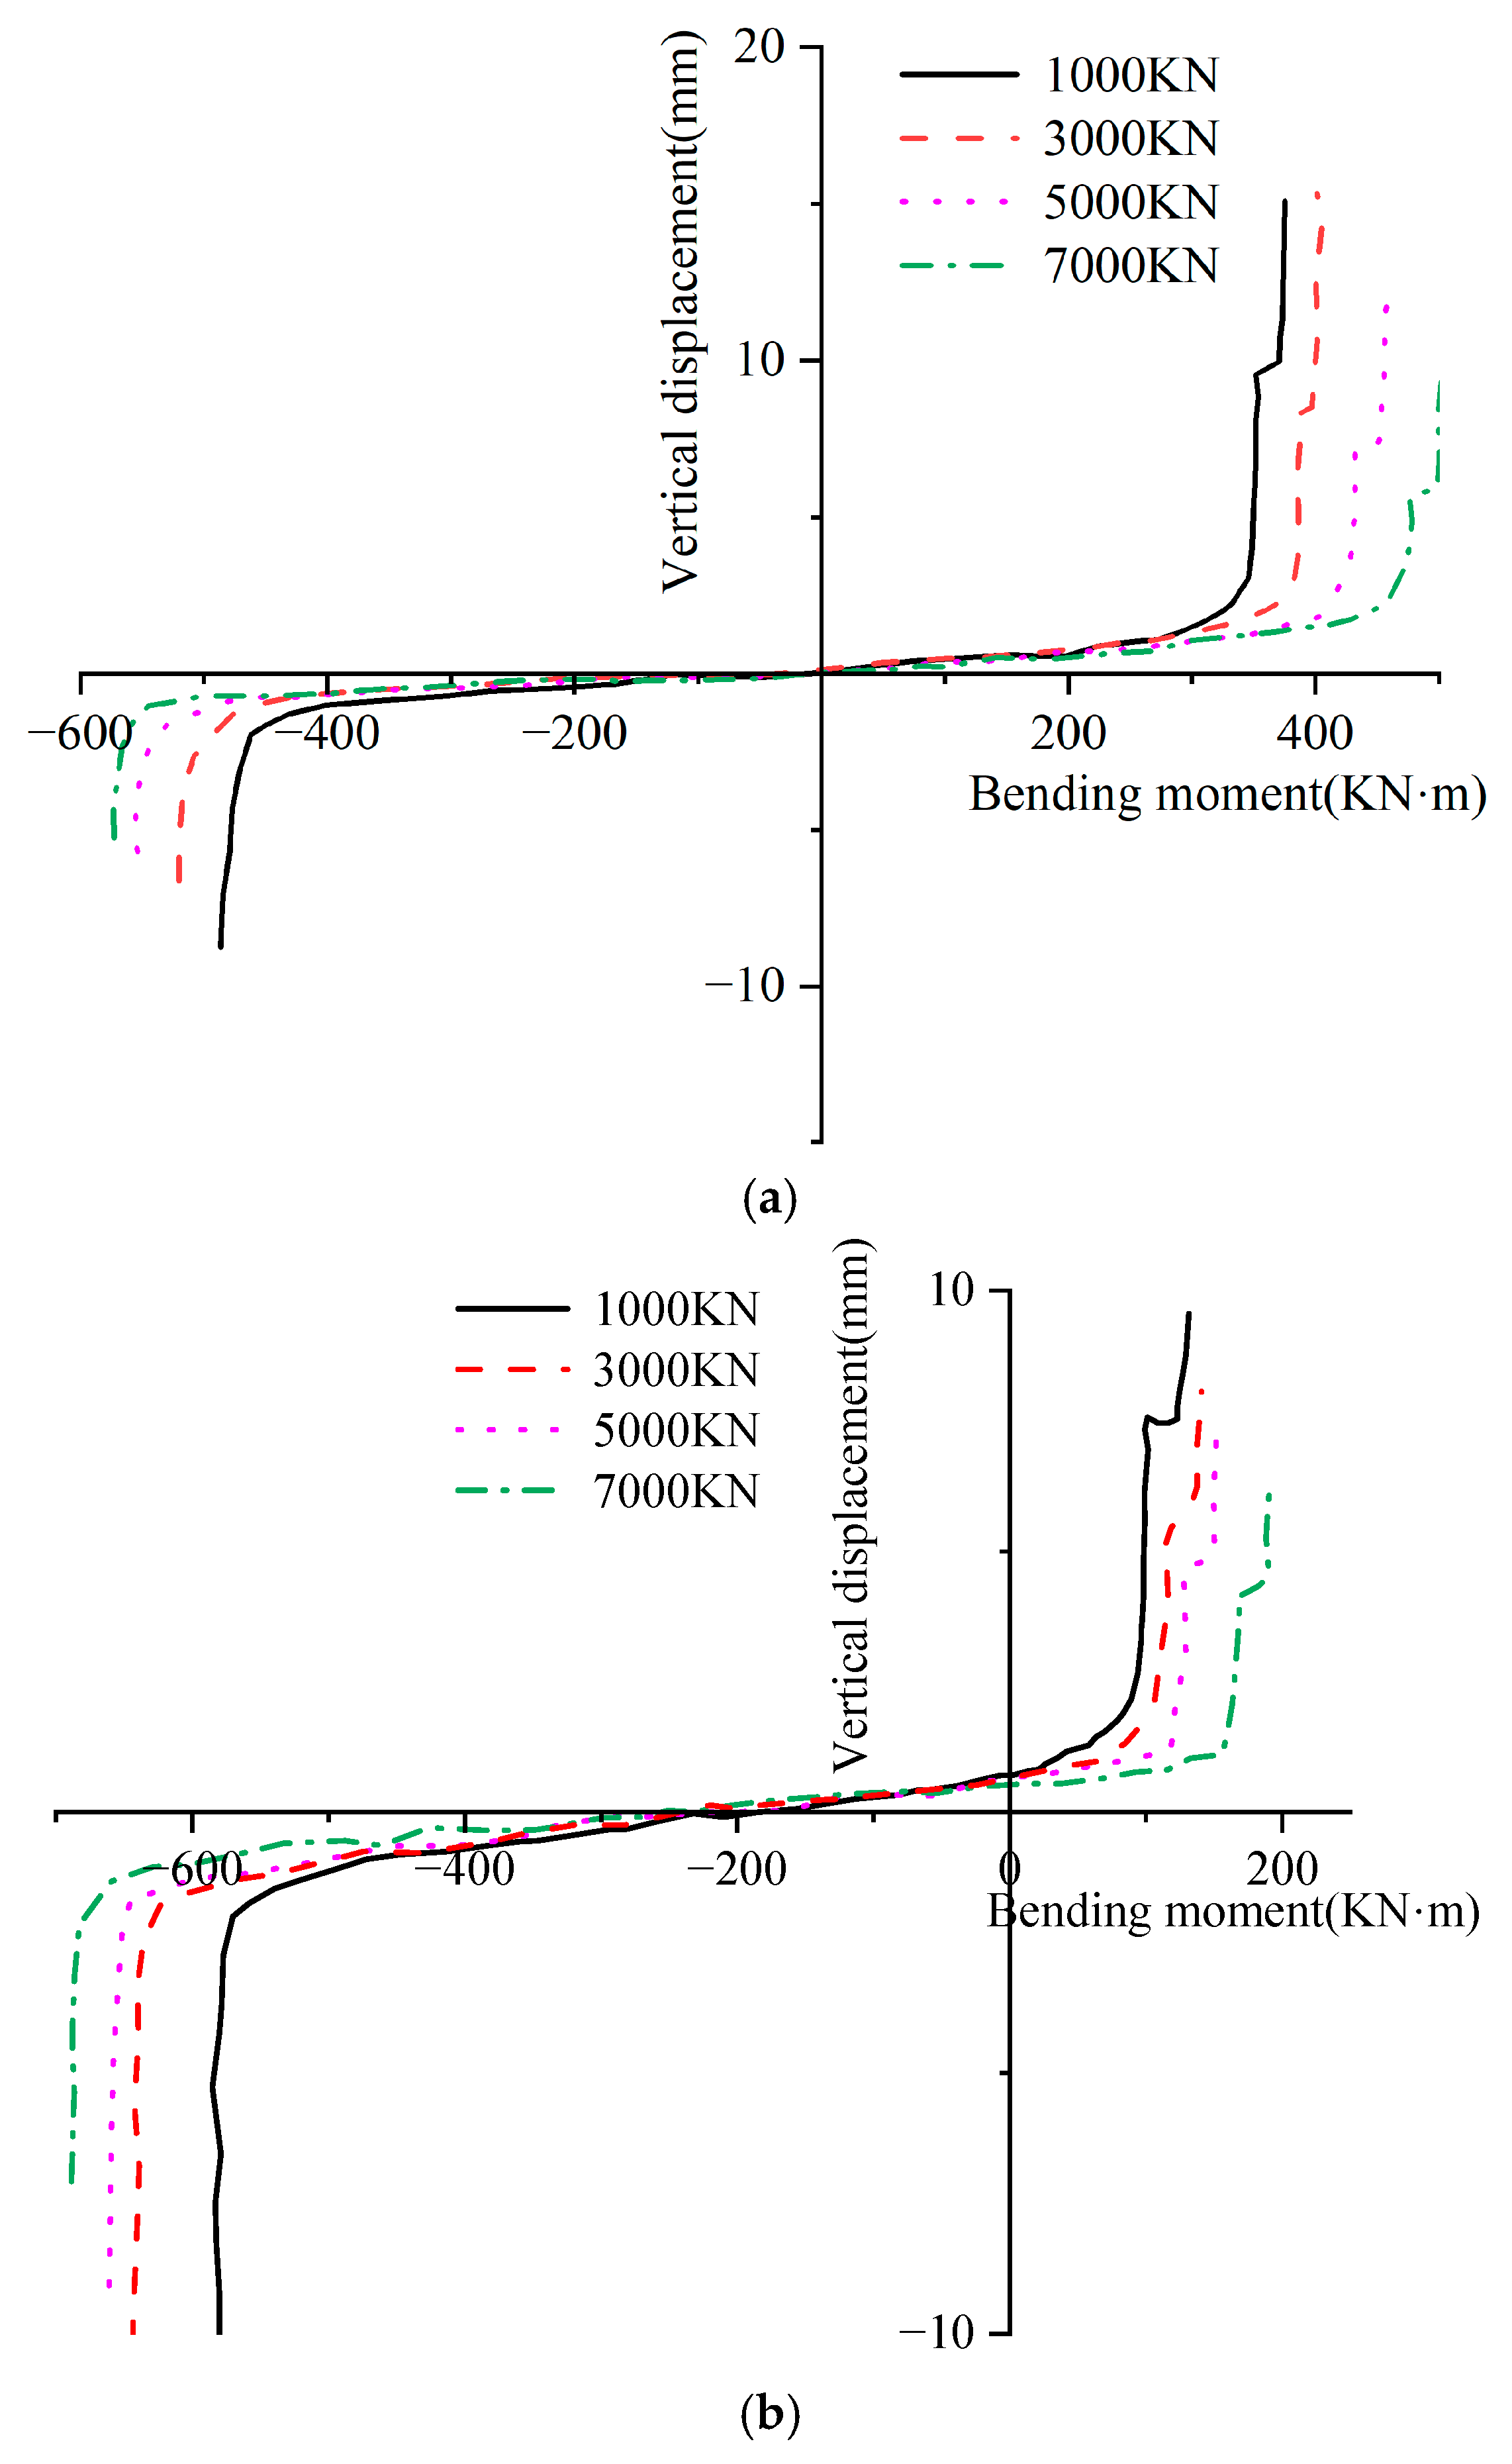
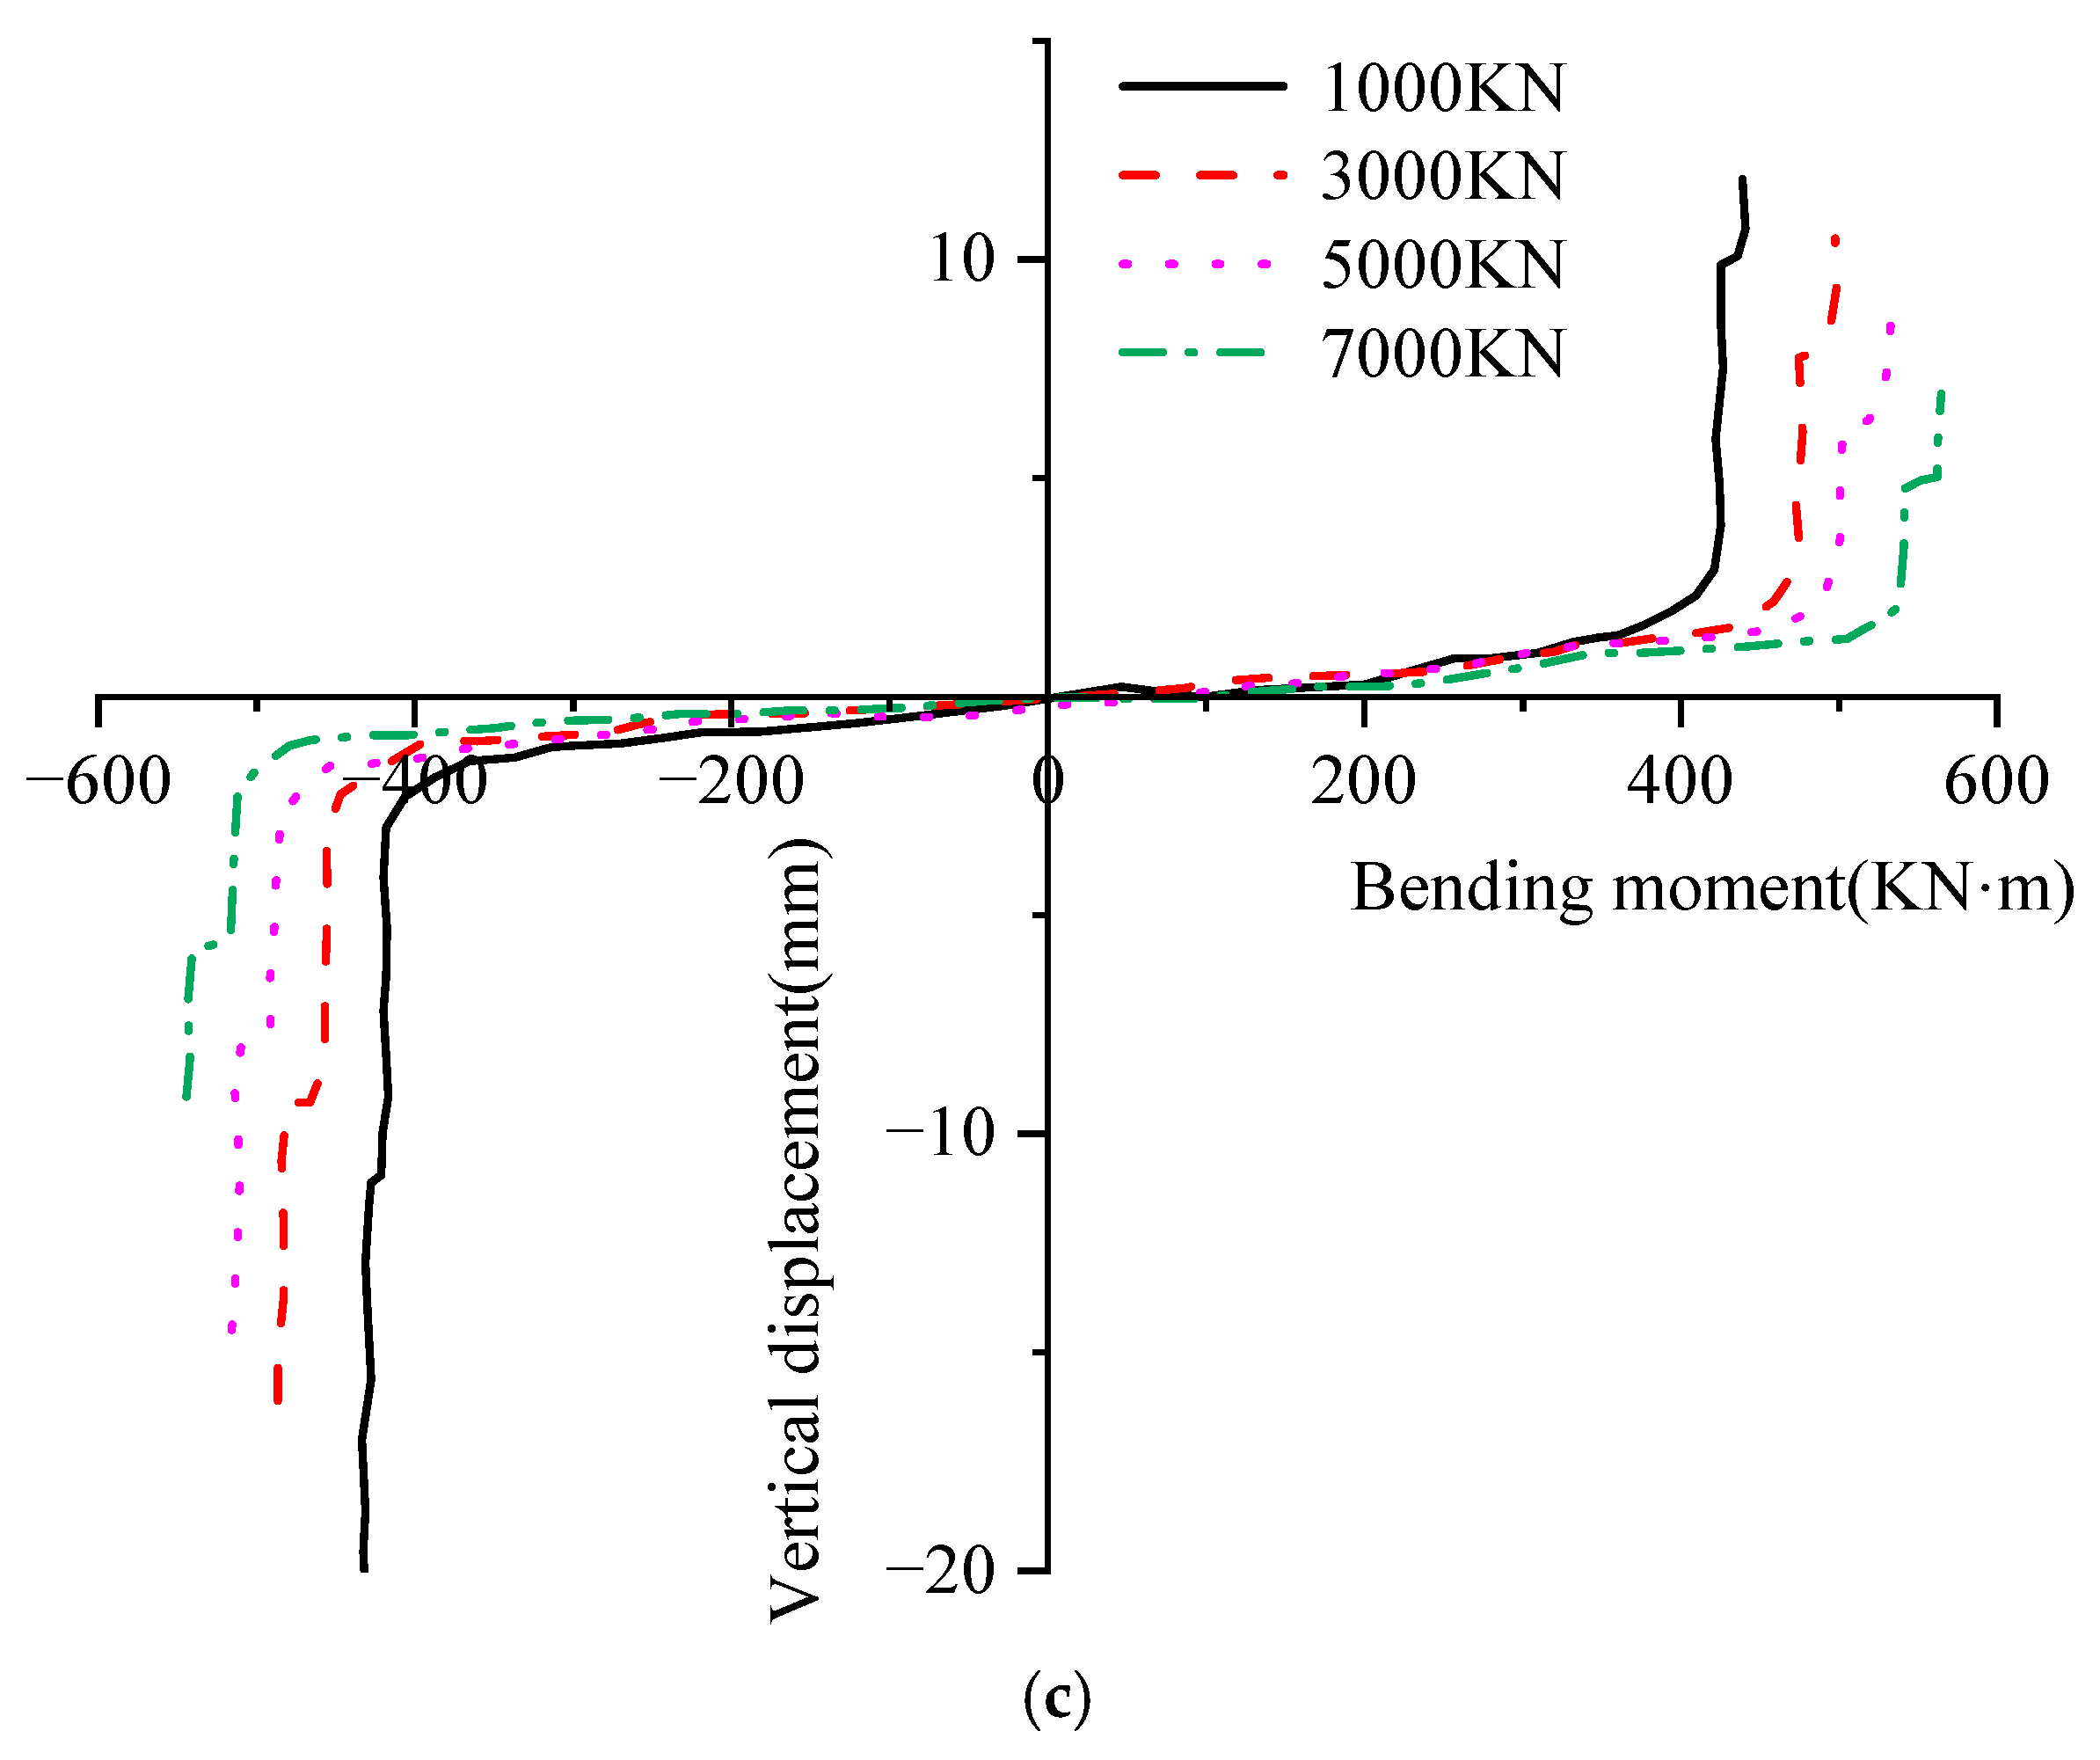
To investigate the effect of different waterproofing configurations on joint bending performance, the vertical displacement curves of three types of joint models were extracted for the entire loading process of positive and negative bending moments under four axial force conditions, as shown in
Figure 20.
From
Figure 20, the vertical displacement of the three models shows a high degree of consistency with changes in bending moment load. The displacement curves exhibit significant nonlinear and staged characteristics, which can be divided into four stages:
Initial elastic stage: When the applied bending moment is small, the joint is in a state of full-section compression or minor tension, and its overall stiffness is high. The vertical displacement curve grows very slowly.
Rapid development stage: As the bending moment gradually increases and exceeds a certain threshold, the joint opens, the height of the compression zone decreases, and the joint’s bending stiffness rapidly degrades. At this point, the slope of the vertical displacement curve increases sharply, and the displacement value rises quickly.
Transition strengthening stage: When the bending moment continues to increase to another threshold, the concrete in the compression zone of some models (e.g., the outer side of the waterstop groove) begins to come into contact. The height of the compression zone increases, causing a temporary recovery in joint stiffness, and the growth rate of vertical displacement slows down.
Failure stage: As the load further increases, the concrete in the compression zone is severely damaged and ultimately crushed, the reinforcement yields, and the structure completely loses its bearing capacity. The vertical displacement again increases rapidly until the structure fails.
Furthermore, the applied axial pressure has a significant impact on the joint’s bending performance. As a comparison in
Figure 20 shows, as the axial force increases from 1000 kN to 7000 kN, there are clear differences in the vertical displacement growth curves of the joints. Under the same bending moment, the segment’s vertical displacement is smaller in high-axial-force conditions. This indicates that an increase in axial force restrains the joint’s opening, effectively enhancing the joint’s bending stiffness and ultimate bearing capacity. This strengthening effect is particularly critical in engineering environments that simulate ultra-high-water pressure.
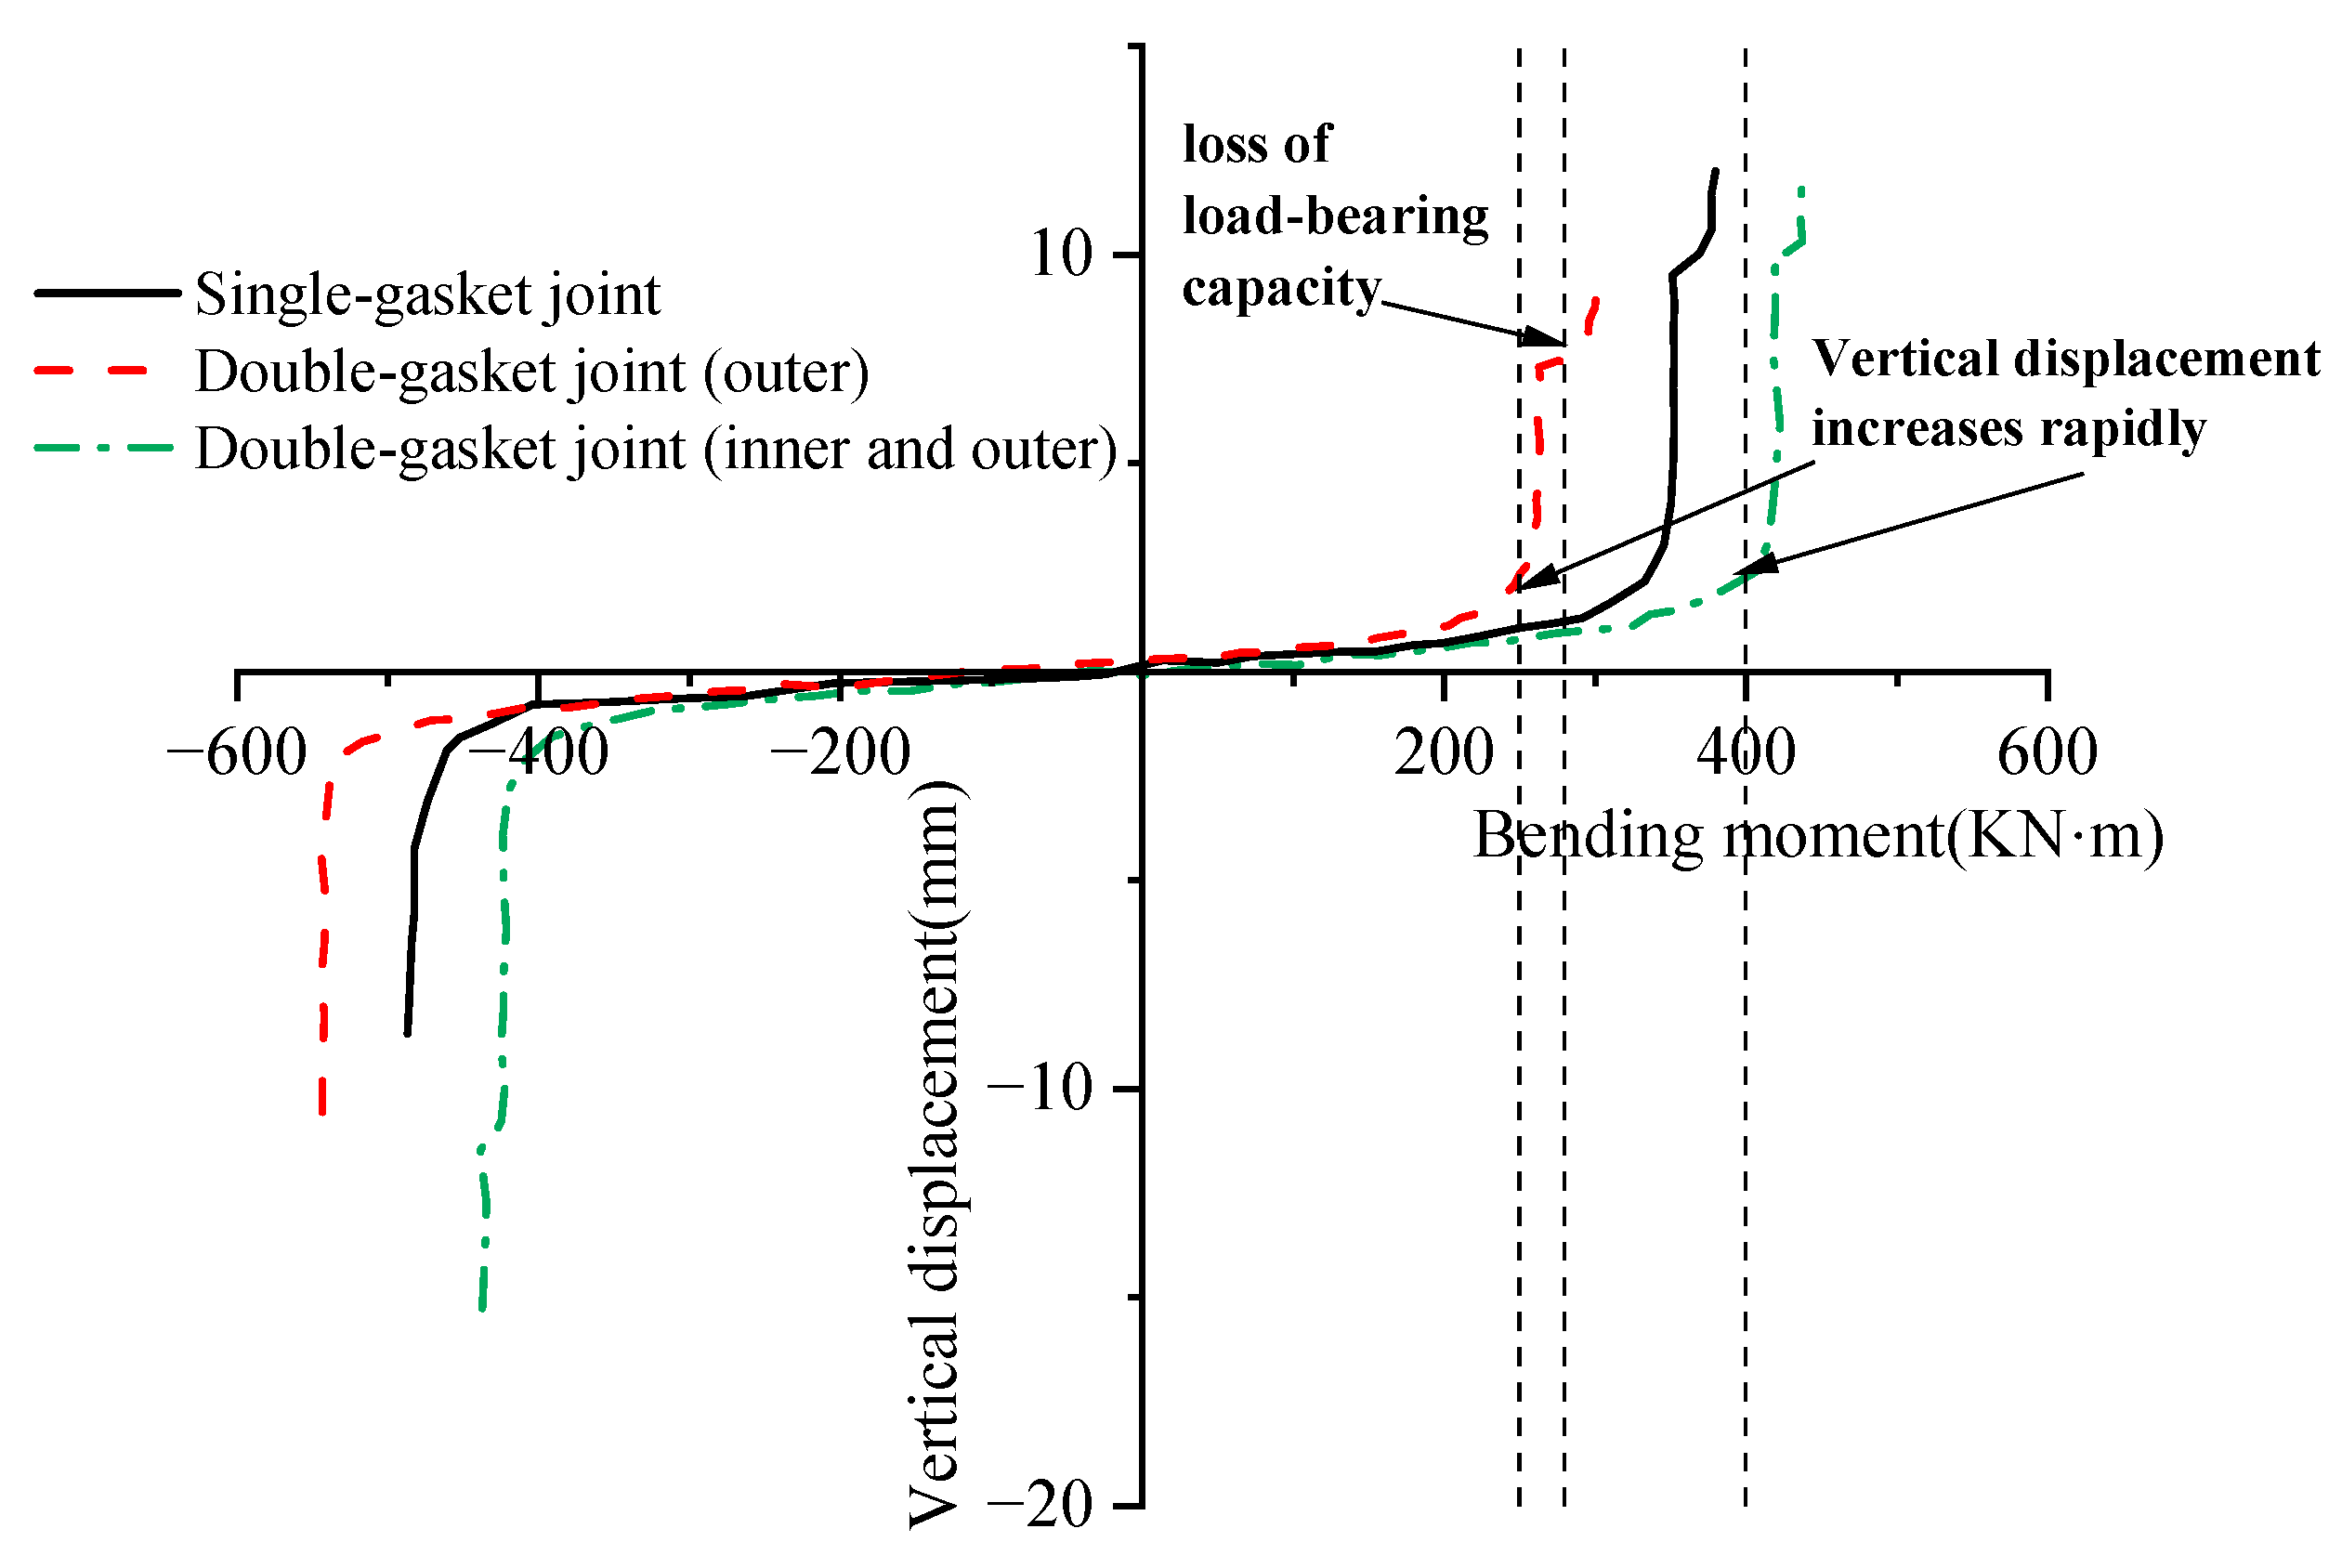
To more clearly compare the differences among the three waterproofing configurations, the vertical displacement/bending moment curves of the three joint models were extracted and plotted separately in
Figure 21, using the horizontal axial force
N = 3000 kN as an example.
From
Figure 21, it is clear that under the same axial force conditions, there are distinct differences in the bending performance of the three waterproofing configurations, especially under a positive bending moment:
The double-gasket outer configuration exhibits the weakest bending performance. Its vertical displacement begins to increase sharply at a bending moment of only 250 kN·m, quickly entering the nonlinear stage. Soon after, when the bending moment reaches approximately 290 kN·m, the structure loses its bearing capacity due to excessive deformation. Compared to the other two configurations, its ability to resist positive bending moments is clearly insufficient. The double-gasket inner-and-outer configuration demonstrates the optimal bending performance. Its vertical displacement growth rate only begins to accelerate significantly when the bending moment reaches 400 kN·m, indicating that its initial stiffness and bearing capacity are superior to the other two forms. The single-gasket configuration’s performance falls between the two. Its bending performance under a positive bending moment is weaker than that of the double-gasket inner-and-outer configuration but significantly stronger than the double-gasket outer configuration. The significant difference in performance, particularly under positive bending moments, can be explained by the mechanical effect of the groove arrangement on the joint’s compression zone. Under a positive bending moment, the bottom of the joint is subjected to compression. The double-gasket inner-and-outer configuration (c) places both grooves away from this critical bottom edge, thus preserving a solid and continuous concrete compression zone. This maximizes the height of the compression area, increases the lever arm for the internal resisting forces, and consequently leads to the highest bending capacity.
In contrast, the double-gasket outer configuration (b) features a groove directly within the primary compression zone for a positive bending moment. This groove acts as a significant structural weakness, reducing the effective concrete area, causing stress concentrations, and leading to premature crushing failure at a much lower bending moment. The performance of the single-gasket joint (a) is intermediate, as its single central groove has a less detrimental effect on the bottom compression zone compared to the outer-groove design.

