Article

Workplace Exposure to Dust Emissions in Additive Manufacturing with an FFF Method

Faculty of Mechanical Engineering, Poznan University of Technology, Piotrowo 3, 60-138 Poznan, Poland
*
Author to whom correspondence should be addressed.
Processes 2025, 13(11), 3470; https://doi.org/10.3390/pr13113470
Submission received: 4 October 2025 / Revised: 21 October 2025 / Accepted: 23 October 2025 / Published: 29 October 2025

Abstract

This article presents the results of research on dust emissions generated by the additive manufacturing process (3D printing) using an FFF method and its impact on the human work environment. The study utilized filaments from three manufacturers in three color variants: neutral, yellow, and black, all made from polylactic acid (PLA), one of the most commonly used polymers in FFF processes. The findings indicated that dust emission levels vary significantly depending on the selection of printing process parameters and the type of filament used. Among the process parameters, the extruder temperature and nozzle diameter have the greatest influence on emission levels. It was shown that at high temperatures and with a small nozzle diameter, the emission level can exceed values hazardous to human health within a short printing time. The maximum recorded Dust Emission Intensity Index (DEII) reached 1058 µg/h when printing with black PLA filament under high-temperature conditions (225 °C, 0.4 mm nozzle). Under these parameters, the predicted dust concentration in a 29 m3 room without ventilation exceeded the WHO limit of 50 µg/m3 for PM10 after approximately 98 min of continuous operation. These results indicate that even desktop-scale FFF printing can pose a measurable risk to indoor air quality when unfavorable process settings are applied.

1. Introduction

Additive manufacturing, also known as 3D printing, is an innovative and one of the most significant technologies of Industry 4.0. It involves the cyclic layering of material, typically a polymer, but also metals, ceramics, and even organic materials, to create a specific object designed and recorded in the form of a CAD model [1,2]. Additive manufacturing has found numerous applications across industries, medicine, architecture, and other fields, enabling rapid prototyping and the production of customized, non-standard products, especially those with complex shapes [3,4].
As the use of additive technologies becomes more widespread, assessing their environmental impact is gaining importance, both globally and locally, including their effect on the human work environment. The number of publications in this area is steadily increasing. Based on studies [5,6,7,8,9,10,11], Table 1 presents the hazards generated by 3D printing technologies. Considerations included exposure to chemicals, burn risks, and environmental hazards associated with material recycling, volatile organic compound emissions, and energy consumption.
The data in Table 1 show that the type and environmental impact of emissions depend on the additive manufacturing method and materials used. The greatest hazards are associated with Selective Laser Sintering (SLS), Binder Jetting, and Electron Beam Melting (EBM), which generate dust emissions and volatile organic compounds (VOCs). Additionally, these technologies pose challenges in recycling used materials.
Certain additive technologies, such as Stereolithography (SLA) and Digital Light Processing (DLP), are highly energy intensive, requiring substantial energy input for the resin curing process.
Among the additive manufacturing technologies listed in Table 1, FFF technology is the most commonly used. This is due to its availability and the ability to use a variety of thermoplastic materials. The low cost of equipment and tools, along with the ease of operation and quiet operation, make FFF printers suitable for use in offices or home environments.
Compared to technologies such as SLA or SLS, FFF is less energy intensive. It also generates less waste, although attention should be given to the difficulties associated with recycling the used filaments. For example, polylactic acid (PLA), one of the most commonly used polymers in FFF printing, requires specific composting conditions.
However, FFF manufacturing can pose a threat to the human work environment. Two main groups of pollutants are emitted during FFF processes:
  • Volatile organic compounds (VOCs).
  • Dust (particulate matter).
Volatile organic compounds (VOCs) are a group of substances that easily transition into a gaseous state, releasing into the surrounding environment and spreading into the atmosphere. VOCs are characterized by low water solubility and high vapor pressure. At normal pressure (1013 hPa), their boiling point ranges from 50 °C to 250 °C. VOCs include substances such as aromatic and aliphatic compounds, alcohols, esters, ketones, and others. These compounds can pose a health hazard to humans because they are toxic and may cause respiratory irritation. Prolonged exposure to certain VOCs, such as benzene or formaldehyde, can increase the risk of cancer.
During an FFF process, solid particles are also produced, forming a mixture of fine dust particles suspended in the air, which may include dust, dirt, soot, and smoke elements. These particles are generated as a result of chemical changes that occur first during the heating of the filament in the heat block and then after it exits the printer’s nozzle. Sudden thermodynamic changes (high temperature and pressure) lead to the formation of solid particles and pollutant emissions. Factors contributing to the creation of solid particles include: the evaporation of additives, thermal depolymerization, chemical compound decomposition, coagulation of smaller particles, and fragmentation of materials used for printing [7,12,13,14,15,16].
Solid particles vary in size. Depending on the particle diameter, dust is categorized as PM1 (<1 µm), PM2.5 (<2.5 µm), and PM10 (2.5 µm—10 µm). All dust particles are harmful to the human body, but PM1 particles, also known as nanoparticles, are particularly dangerous. These ultrafine particles, often smaller than 100 nanometers, can penetrate deep into the respiratory system and bloodstream, potentially leading to inflammation, lung tissue damage, and even affecting the function of other organs in the body. Moreover, nanoparticles may have the ability to cross the blood–brain barrier, increasing their potential impact on the human nervous system [14,17,18,19,20,21,22,23].
In practice, only the emissions of PM2.5 and PM10 dust particles are measured. There is a lack of widely available, standard methods for the precise detection of PM1 emissions in industrial environments.
Control of dust emissions in 3D printing workspaces is crucial for ensuring workplace safety and developing an effective health protection strategy. Therefore, standards for particulate matter concentrations in indoor environments are established, taking into account specific working conditions and public health protection objectives [24,25,26,27].
Examples of permissible concentrations of dust pollutants, expressed in [mg/m3], in workplaces and the environment, are presented in Table 2.
In recent years, research has increasingly focused on nanoscale and ultrafine-particle phenomena during the Fused Filament Fabrication (FFF) process. For instance, Tang and Seeger [28] measured sub-4 nm particle emissions from FFF printing using a TSI Nano Enhancer and an Airmodus Particle Size Magnifier, revealing that the smallest fractions of emitted particles remain largely under-studied. Tang et al. [29] proposed a standardized emission test method for FFF filaments, enabling reproducible and comparable evaluation of particulate emissions. More recently, Durai and Ashok [30] introduced a hybrid ANN–NSGA-II optimization framework that integrates surface quality and VOC emission control in real-time, emphasizing the increasing significance of emission mitigation in additive manufacturing. These developments highlight the need to address emission control at both macro- and nanoscale levels and reinforce the novelty of the present work, which links quantitative dust-mass emission metrics (DEII) with workplace exposure thresholds.
Table 3 presents the particle emission levels, expressed as the number of particles emitted per minute during FFF printing using different polylactic acid (PLA) filaments (distinguished by filament color) and varying extruder temperatures. The data indicate that, depending on the filament color and printing time, the emission rate for PLA filament ranges from 4.27 × 10⁸ to 1.6 × 10¹⁰ particles per minute.
However, based on the data from Table 3, it is not possible to determine the mass of dust emitted per unit of time, which would enable the prediction of the suspended dust mass in the air after a specified printing duration. Having this data would allow for the formulation of recommendations aimed at preventing potential hazards generated by FFF printing for the human work environment, as well as the development of detailed recommendations to reduce these risks. Filling this gap is the goal of the research described in this article. While previous studies have mainly characterized particulate and gaseous emissions qualitatively or focused on particle number concentration during additive manufacturing, this work introduces a novel quantitative approach through the Dust Emission Intensity Index (DEII). This index enables the estimation of dust mass emission per unit of time and allows for forecasting pollutant accumulation in indoor environments. Unlike earlier studies, which provided emission data without direct correlation to workplace exposure limits, this research links experimental results to WHO standards and assesses threshold exceedance times. Therefore, the present study advances the understanding of how FFF process parameters translate into measurable health risks in real working conditions.
Based on this identified research gap, the study was designed to verify the hypothesis that the level of dust emissions generated during the FFF process is influenced by selected printing parameters. Specifically, it was assumed that parameters such as printing temperature, printing speed, and layer thickness, as well as the color and manufacturer of the PLA filament, may significantly affect the emission intensity. The research question therefore focuses on identifying which of these variables has the greatest impact on the Dust Emission Intensity Index (DEII) and determining their relative contributions to overall emission variability.

2. Objective and Research Methodology

2.1. The Objective of the Research

The objective of the research presented in this article is to determine the intensity of dust emissions during FFF printing using PLA, including identifying the factors that affect their level:
  • Dyes added by manufacturers to the polymer from which the filament is made;
  • Printing process parameters.
PLA was chosen for the study because, due to its ease of processing, biodegradability, and low production costs, it is one of the most commonly used materials in FFF 3D printing.

2.2. Methodology

The PLA used in the study was purchased from three different manufacturers. The material from Manufacturer 1 is classified in the lowest price tier, the material from Manufacturer 2 in the middle tier, and the material from Manufacturer 3 in the highest tier.
As shown in Figure 1, three filament colors were selected: neutral, black, and yellow. The neutral-colored filament contains no coloring agents, while the black and yellow filaments contain various dyes.
Organic pigments, such as Diarylide Yellow, and inorganic pigments, such as iron oxide or the less commonly used lead chromate, are employed as colorants in filaments. Organic pigments, such as Diarylide, are typically non-toxic, but at temperatures above 200 °C, they may degrade into carcinogenic compounds. However, the present study lacks detailed information on the specific colorants used in the filaments, as this information is considered proprietary by the manufacturers. It is only known that the black filament contains substances based on soot.
The study used an Anycubic i3 Mega S 3D printer. The printer features an open print chamber with a single print head and a bed that moves along the Y-axis. It is commonly used in schools, small offices, and by individuals.
The printing model used in the experiment was standardized. All tests were carried out using the same “dogbone” specimen geometry, commonly applied in mechanical testing, to ensure repeatability and comparability of results. The dimensions and shape of the model were identical in all trials, meaning that only process parameters—such as temperature, nozzle diameter, and filament characteristics—varied between experiments. While model size and geometry can influence total emission due to changes in printing time and exposed surface area, these factors were intentionally kept constant to isolate the effect of the studied parameters on emission intensity.
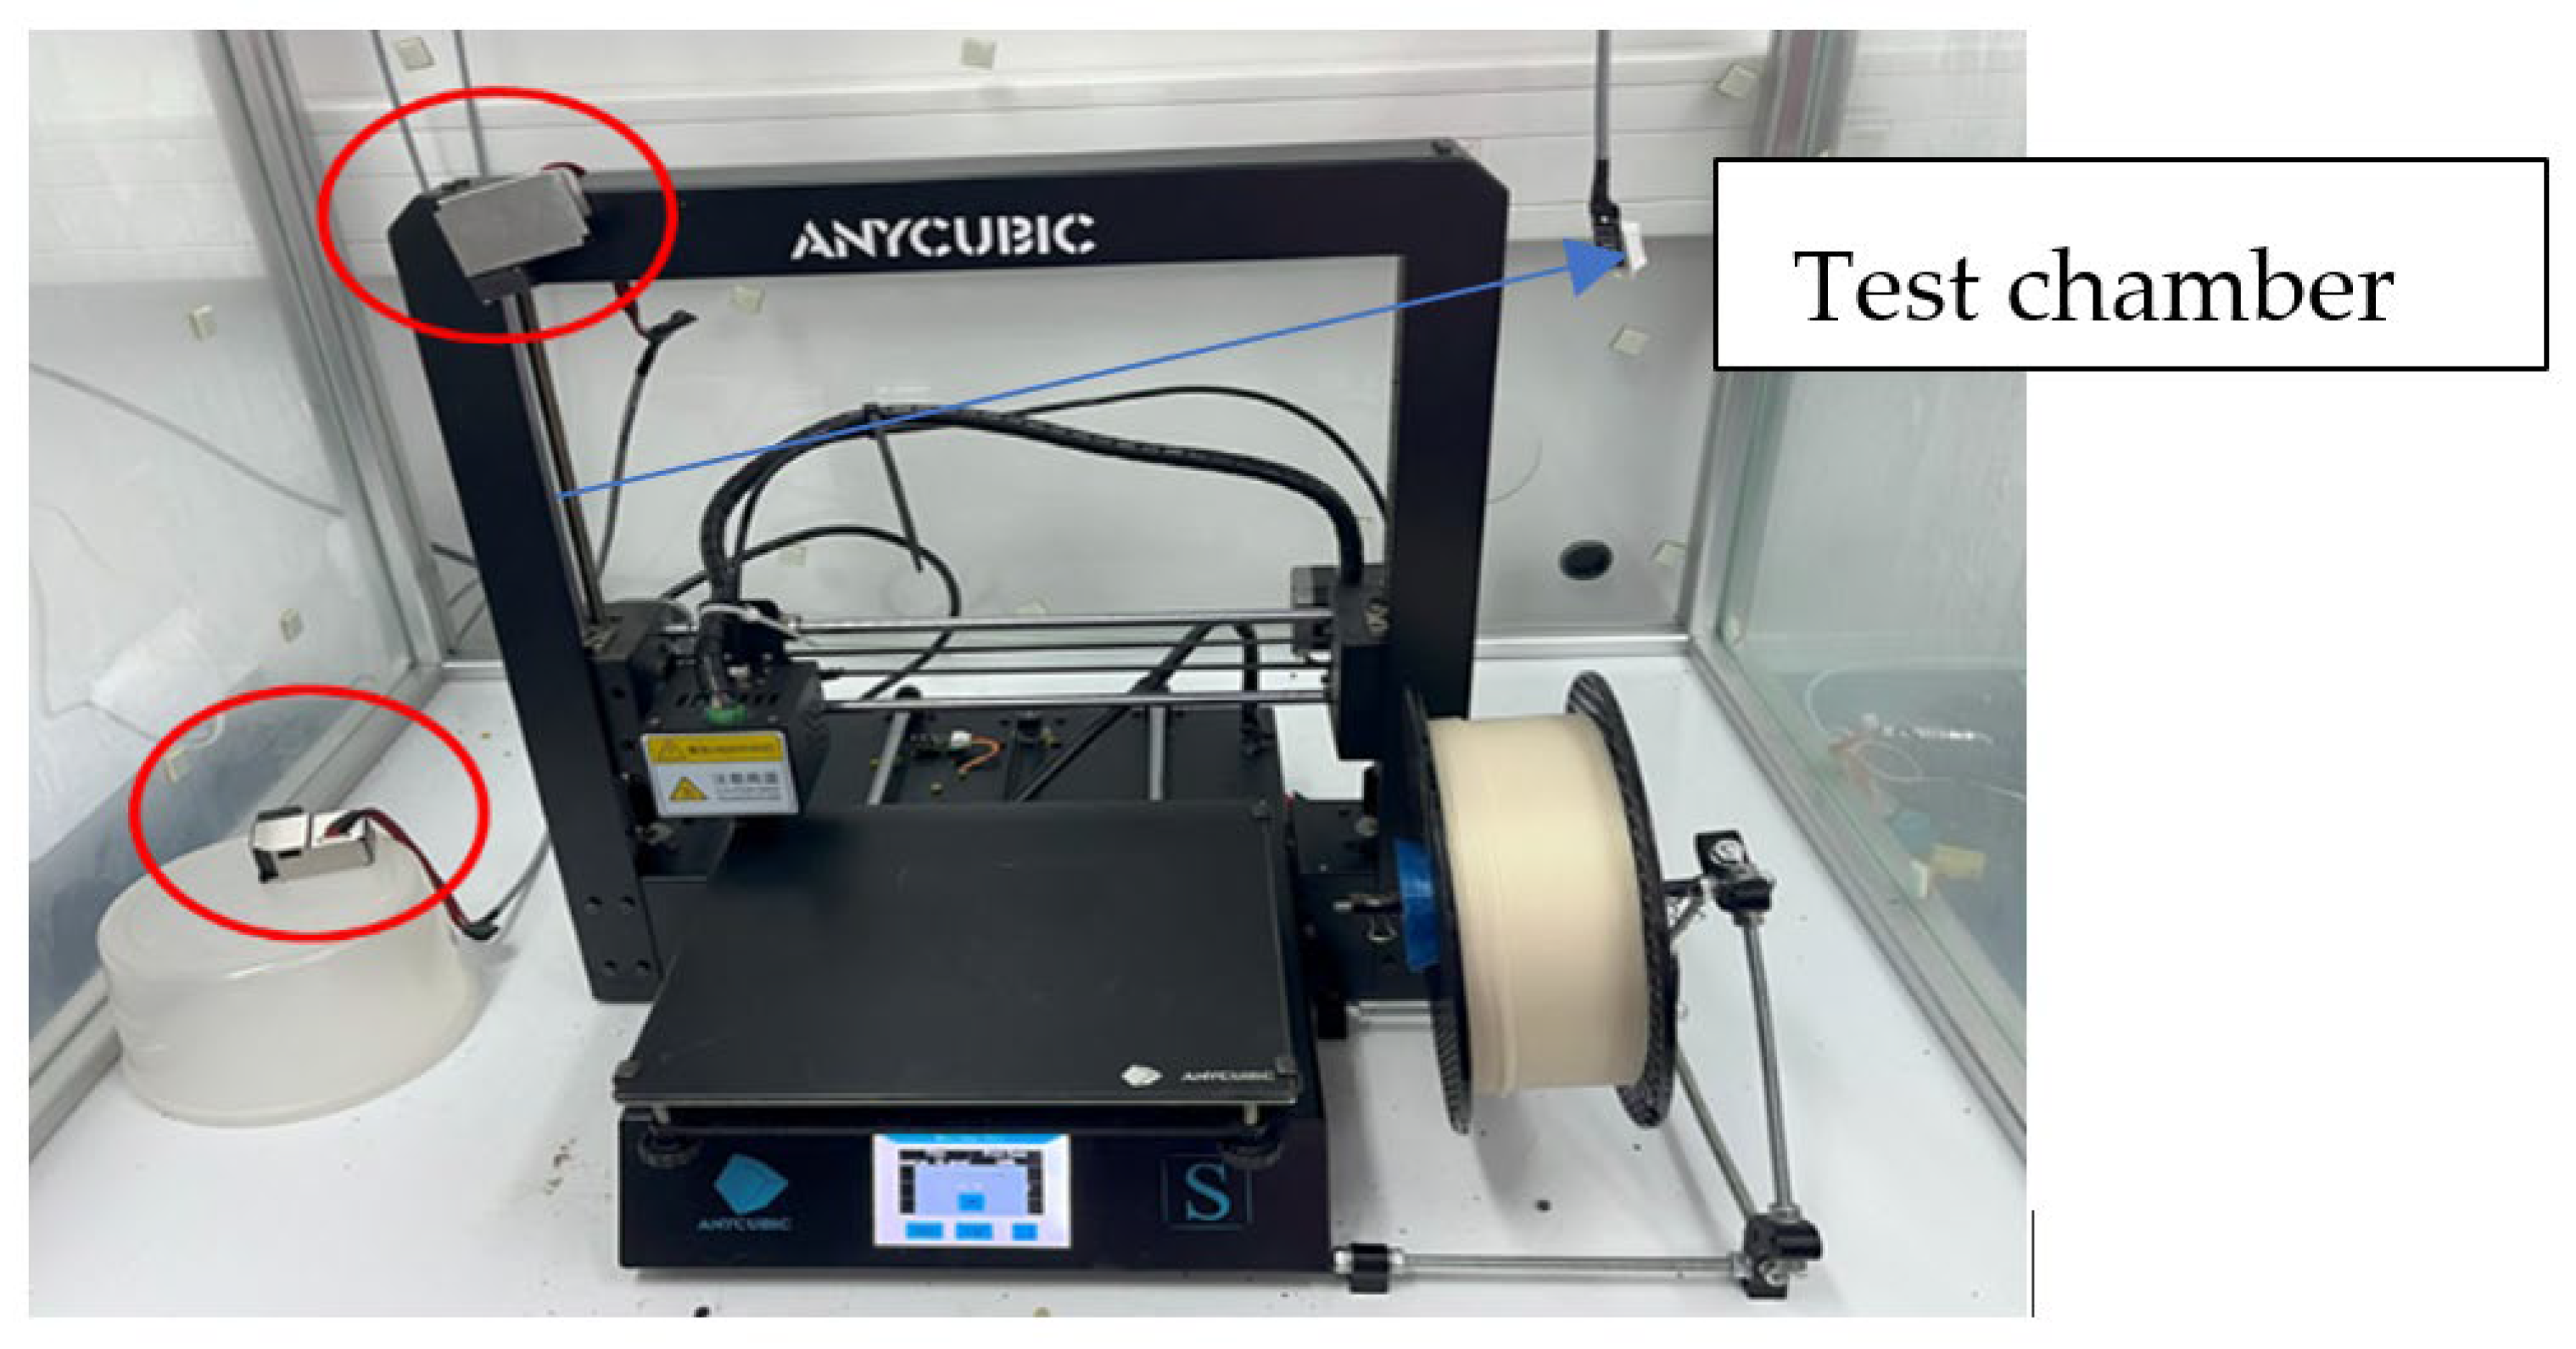
For research purposes, the printer was placed in a specially prepared chamber with a volume of Vc = 1 m3. This setup allowed for the study of particulate emissions during printing and the determination of their concentration inside the chamber. A schematic view of the chamber is shown in Figure 2.
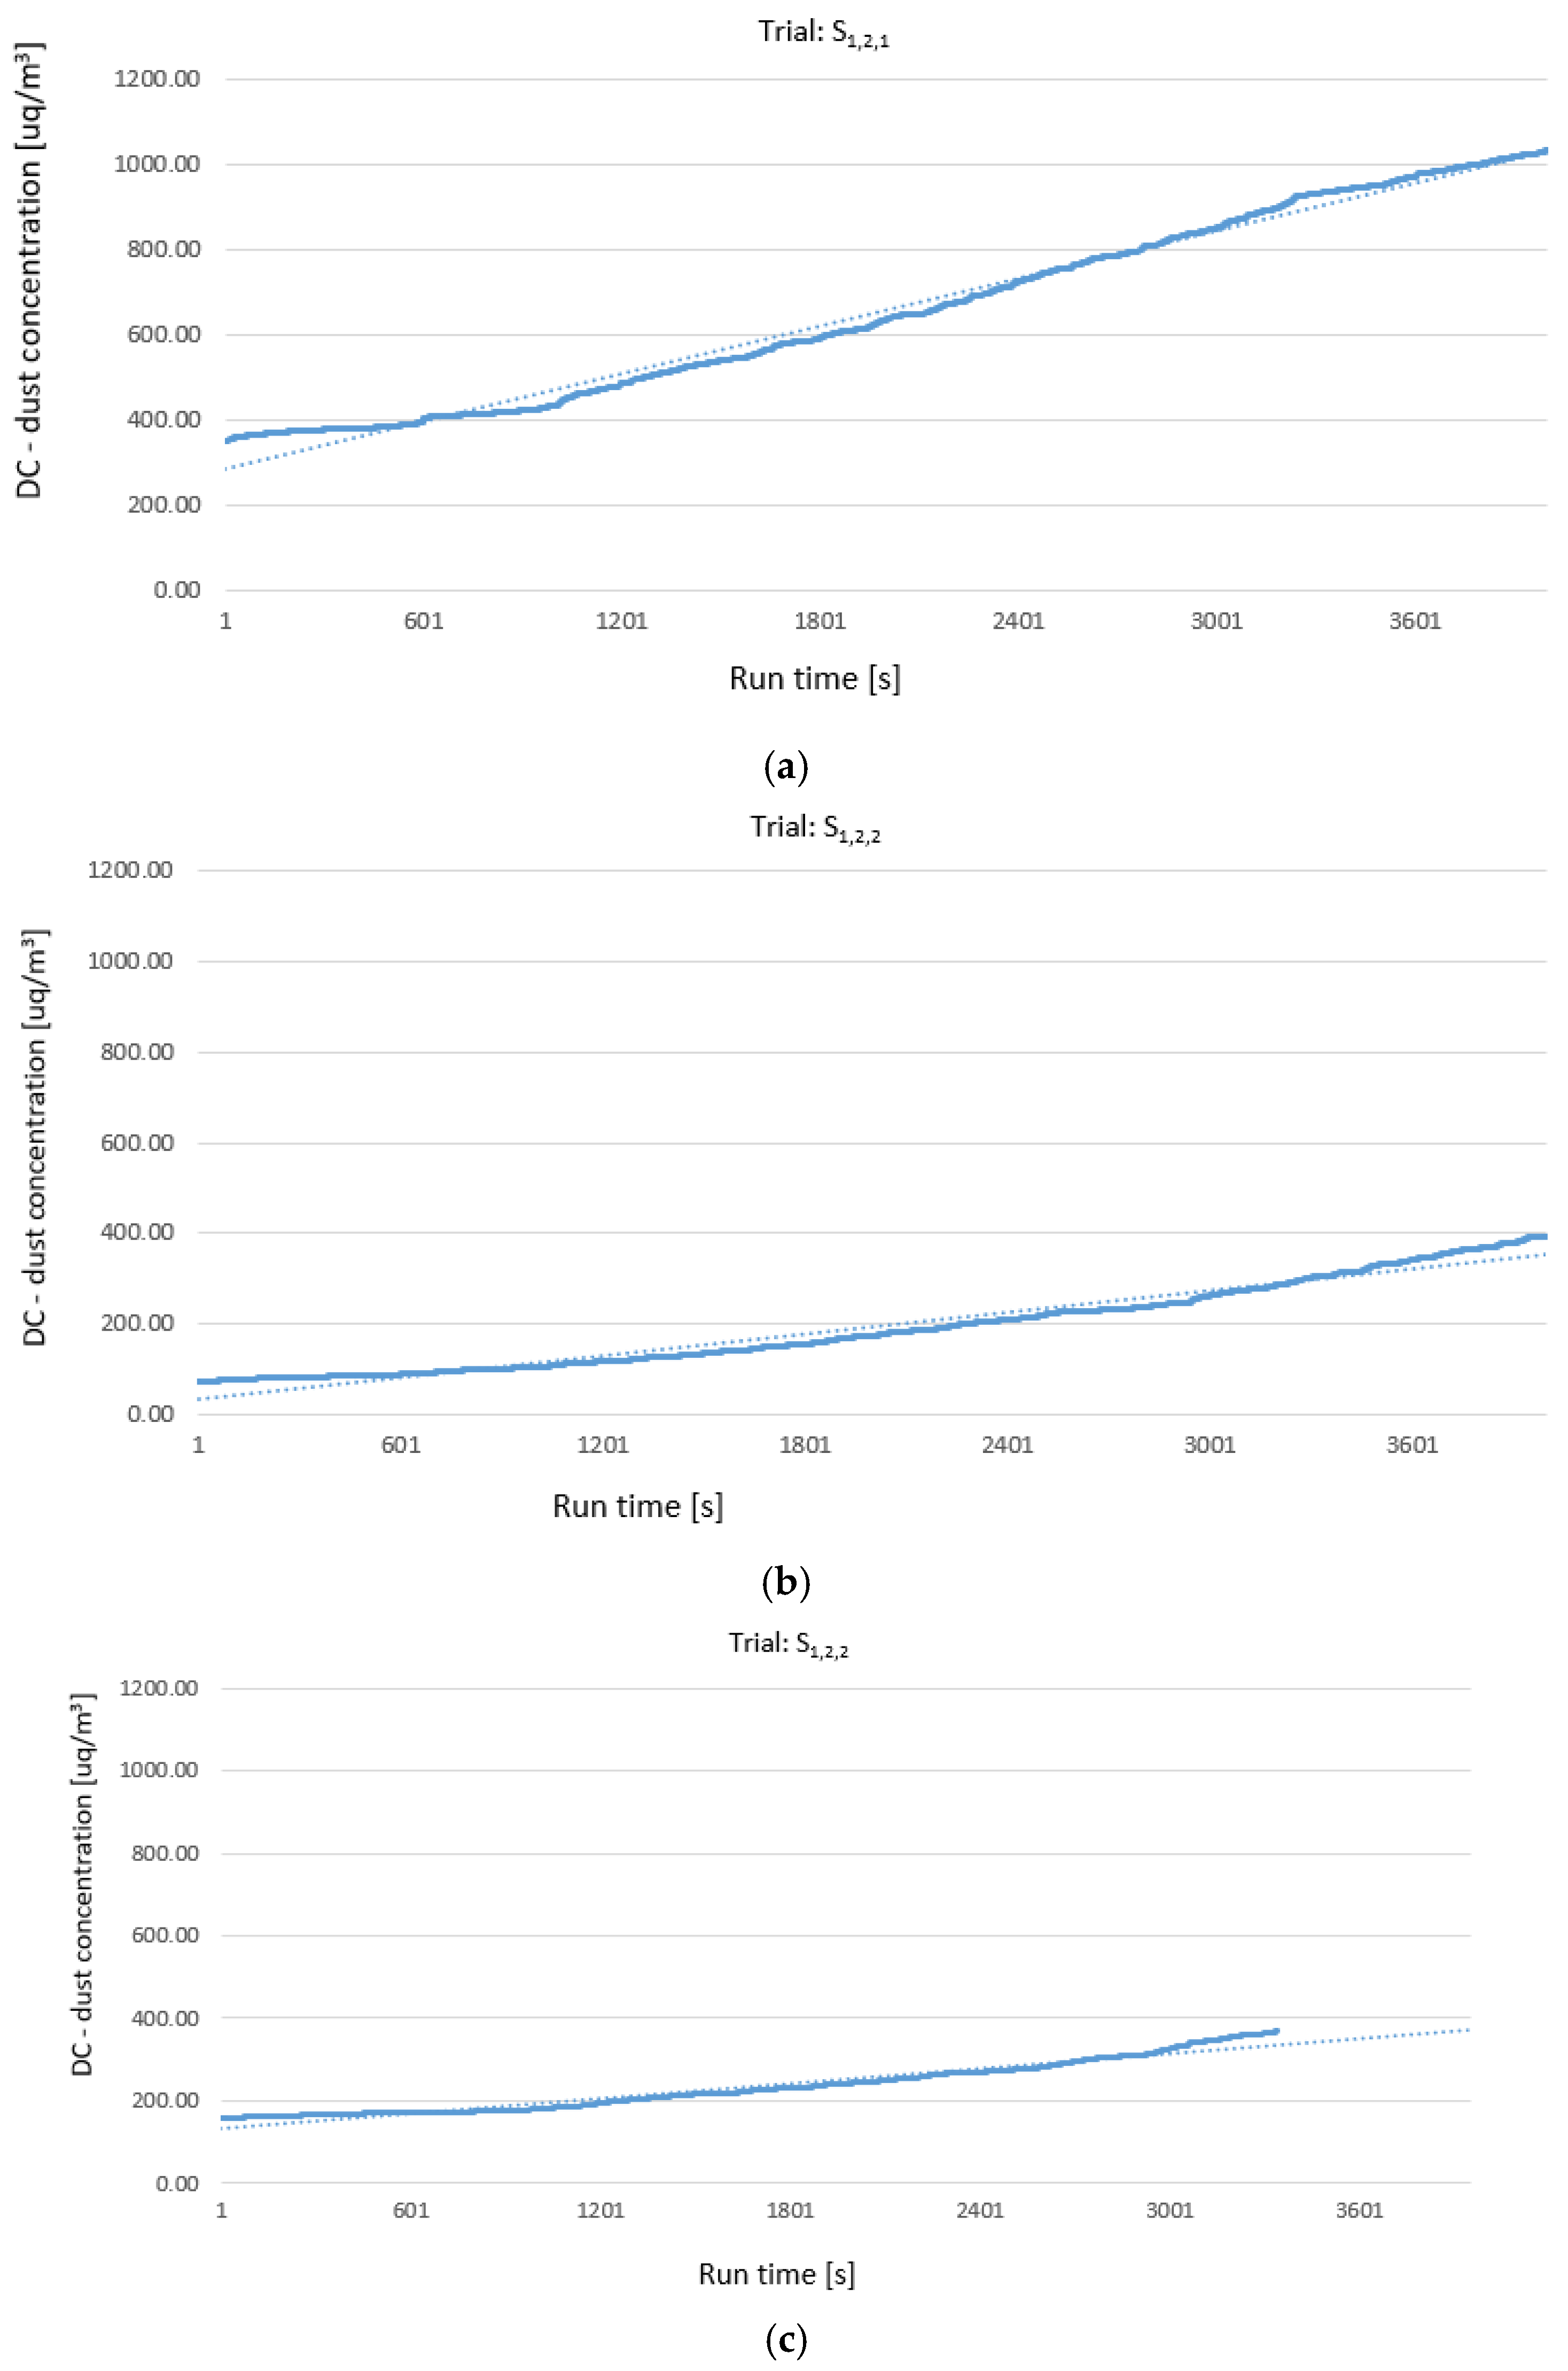
The measurement chamber was a closed system, which allowed the accumulation of emitted particles during each test cycle. This feature enabled the observation of dust concentration dynamics over time, as shown in Figure 3. The initial environmental conditions corresponded to typical room parameters, with an ambient temperature of approximately 21 °C and relative humidity of about 50%, as indicated by a calibrated hygrometer. Due to the closed configuration of the chamber and the heat released by the printer, the temperature gradually increased during printing, while relative humidity decreased. Although these parameters were recorded as part of the measurement data, they were not presented individually for each test, as their variation remained within a narrow range and did not significantly affect the comparability of the results.
The dust concentration was measured using the PMS3003 sensor. This laser sensor measures dust concentration by passing a laser beam through the air sample. As the solid particles pass through the beam, they scatter the light. The concentration of particles is calculated based on the amount and intensity of the scattered light. In the study, the concentration analysis was performed at a frequency of 1/second. The sensor analyzed dust concentration in the environment across three particle size ranges (PM): 0.3 μm–1.0 μm, 1.0 μm–2.5 μm, and 2.5 μm–10 μm. The study focused solely on PM10 without distinguishing between the individual fractions. This allowed for the comparison of the obtained results with the applicable legal standards, which are presented in Table 2.
Emission Intensity Index (Dust Emission Intensity Index—DEII) was determined as the increase in dust mass per unit of time, according to this formula:
D E I I ( t ) = D C t D C ( t + Δ t ) Δ t · V c [ µ g h ]
DC(t); DC(t + Δt)—The Dust Concentration indicated by the sensor in the chamber at moments t and t + Δt µ g m 3
Δt—time frame [h]
Vc—test chamber volume Vc = 1 [m3]
The increase in concentration was determined during the printing period when the emission intensity had stabilized (Section 4).
Two sensors were placed inside the chamber—one at the level of the print bed and the other above the print head (Figure 2). Additionally, a third sensor was placed outside the chamber, near the door, to monitor both background pollution (the level of contaminants before printing) and the chamber’s seal integrity.
Since one of the objectives of the research was to determine the influence of FFF process parameters on dust emission intensity, the experiments were conducted according to an experimental design with systematic factor variation [34,35]. The following FFF process parameters were chosen as experimental factors:
  • Extruder temperature [factor A];
  • Bed temperature [factor B];
  • Layer thickness [factor C];
  • Head movement speed/printing speed [factor D];
  • Nozzle diameter [factor E];
  • Cooling fan speed [factor F].
The selection of factors was based on the current knowledge about the influence of process parameters on the emission of particulate matter [5,6,7,8,9,12,13,14,15]. Each factor (process parameter) was set at two levels in the experiment: (+) and −(−). The choice of two levels for each process parameter was based on both technical feasibility and literature recommendations for typical desktop−scale FFF printers. The lower temperature of 190 °C corresponds to the lower bound commonly used for PLA extrusion, ensuring sufficient melting without thermal degradation, while 225 °C represents the upper range recommended by filament manufacturers for maximizing flow stability. Similarly, the nozzle diameters of 0.4 mm and 0.6 mm were selected to represent the most frequently used configurations in practical applications, covering the typical range of deposition widths without altering printer hardware. This approach ensured that the tested parameters reflected realistic and reproducible printing conditions while allowing clear differentiation of emission trends. The values for the factor levels are detailed in Table 4. It was assumed that an FFF process with a given factor set at the (+) level theoretically emits more dust than the process with the factor set at the −(−) level.
Fourteen runs were planned according to the design presented in Table 5.
The following notations were used in the experimental design:
All (+)—all factors were set to (+) level,
All (−−)—all factors were set to the (−) level,
All (−) All (+)—factor A at (−) level, all others at (+) level.
Each run of the experiment was conducted for each of the 9 types of filaments (3 colors from three suppliers), resulting in 126 combinations of factor levels, manufacturer, and filament color. Each combination was referred to as a trial. The list of trials is presented in Table 6. The trials were labeled with the symbol Tr,m,c, Where
r—run number (1–14)
m—manufacturer (1–3)
c—color (1–3)
In each trial, measurements were taken from a cold start (with the extruder and bed at room temperature, ~21 °C). The chamber was sealed after the printing started, before the extruder heated up. Dust concentration was measured from the time the extruder and bed reached the set temperature until the extruder returned to its starting position.
After each trial, the machine was cooled to room temperature, and the chamber was ventilated (until identical dust concentrations were achieved for the sensors placed inside and outside the chamber). To avoid distortion of results caused by potential secondary dust suspension, the surface of the print bed and the interior of the chamber were wiped with a cleaning cloth soaked in isopropyl alcohol.

3. Results

Dust Emission Intensity Index

The graphs in Figure 3a–c present changes in dust concentration in the chamber for trials T1,2,1; T1,2,2; T1,2,3 (all factors set at the (+) level, with three different filament colors from manufacturer 2). Similar graphs were prepared for all 126 conducted trials, allowing for a comprehensive analysis of dust concentration changes under various experimental conditions.
In all trials, during the initial phase, the dust concentration increases exponentially, and after reaching stabilization, it increases linearly. The slope of the regression line in the stabilized phase represents the rate of change in the dust mass within the chamber volume and serves as a measure of the Dust Emission Intensity Index (DEII).
The obtained DEII values from the experiment for all 126 trials are presented in Table 7.
Table 7 presents the average values of the Dust Emission Intensity Index ( D E I I ¯ ) for all experimental runs. The results show a wide variation in emission levels depending on the printing parameters—from only a few µg/m3·h in the “All (−)” configuration (Run 8) to over 1000 µg/m3·h in the “All (+)” setup (Run 1). This large difference confirms that process parameters, especially nozzle temperature and diameter, have a major effect on dust generation. The following section provides a detailed analysis and interpretation of these results.
The interpretation of the obtained results in terms of:
  • forecasting dust concentration in a room of a given volume,
  • the impact of printing parameters on emission intensity,
  • the relationship between emission intensity and filament type,
is the subject of analysis and discussion in Section 4.

4. Analysis and Discussion of the Experimental Results

4.1. Forecasting of Dust Concentration in a Room

The dust concentration in a room with a specified volume V was calculated using the formula:
D C = t p · D E I I V r           µ g m 3
where
  • DC—dust concentration in a room of a volume Vr
  • tp—process time
  • DEII—Dust Emission Intensity Index
  • Vr—room volume [m3]
Since the tests were conducted on a household-grade device, conditions similar to the volume of an average single-room apartment were assumed, i.e., a room with a volume of Vr = 29 m3 [35], without additional ventilation.
Table 8 presents the results of dust concentration calculations in the room after 1 h of printing with parameters as in runs 1 (All+) and 8 (All−) with differentiation by filament color. Although this study primarily focused on PM10 fraction, it should be noted that particles smaller than 1 µm (PM1) and ultrafine particles below 100 nm are considered even more hazardous to human health. Due to their small size, they can penetrate deep into the alveolar regions of the lungs and enter the bloodstream, contributing to systemic oxidative stress and inflammation. Future research will therefore include the analysis of PM1 and nanoparticle fractions to better characterize the complete emission profile associated with the FFF printing process.
The results presented in Table 8 indicate that under the most unfavorable conditions (printing with black filament, with factors set at the (+) level, in a room with a volume of approximately 29 m3 without ventilation), the printing process can lead to the exceedance of the permissible PM10 dust concentration limits set by the World Health Organization (WHO) in just 98 min from the start of operation.
Although this article does not focus in detail on PM2.5 data, in each test the PM2.5 fraction represented approximately 40–60% of the corresponding PM10 concentration, indicating that exceedances of PM2.5 limits would occur even earlier. It is worth noting that acceptable levels for PM10 are stricter in Poland and the USA (40 µg/m3) than those recommended by the WHO (50 µg/m3), while for PM2.5 they range from 10 µg/m3 in the USA to 20 µg/m3 in Poland and under WHO guidelines. Therefore, the predicted concentrations from FFF printing could surpass these environmental thresholds relatively quickly in enclosed or poorly ventilated spaces, even though they remain far below occupational exposure limits for total dust (10–15 mg/m3).
Based on the data from Table 7, it can be inferred that in several other cases (when DEII > 600), the limits may be exceeded after just two hours of printing. This means that exposure to pollutants generated during 3D printing may pose a health risk to workers. It also suggests that to minimize the risk of negative health impacts on users in the work environment, the use of appropriate ventilation and air filtration systems is necessary.

4.2. The Impact of Process Factors on the Dust Emission Intensity Index

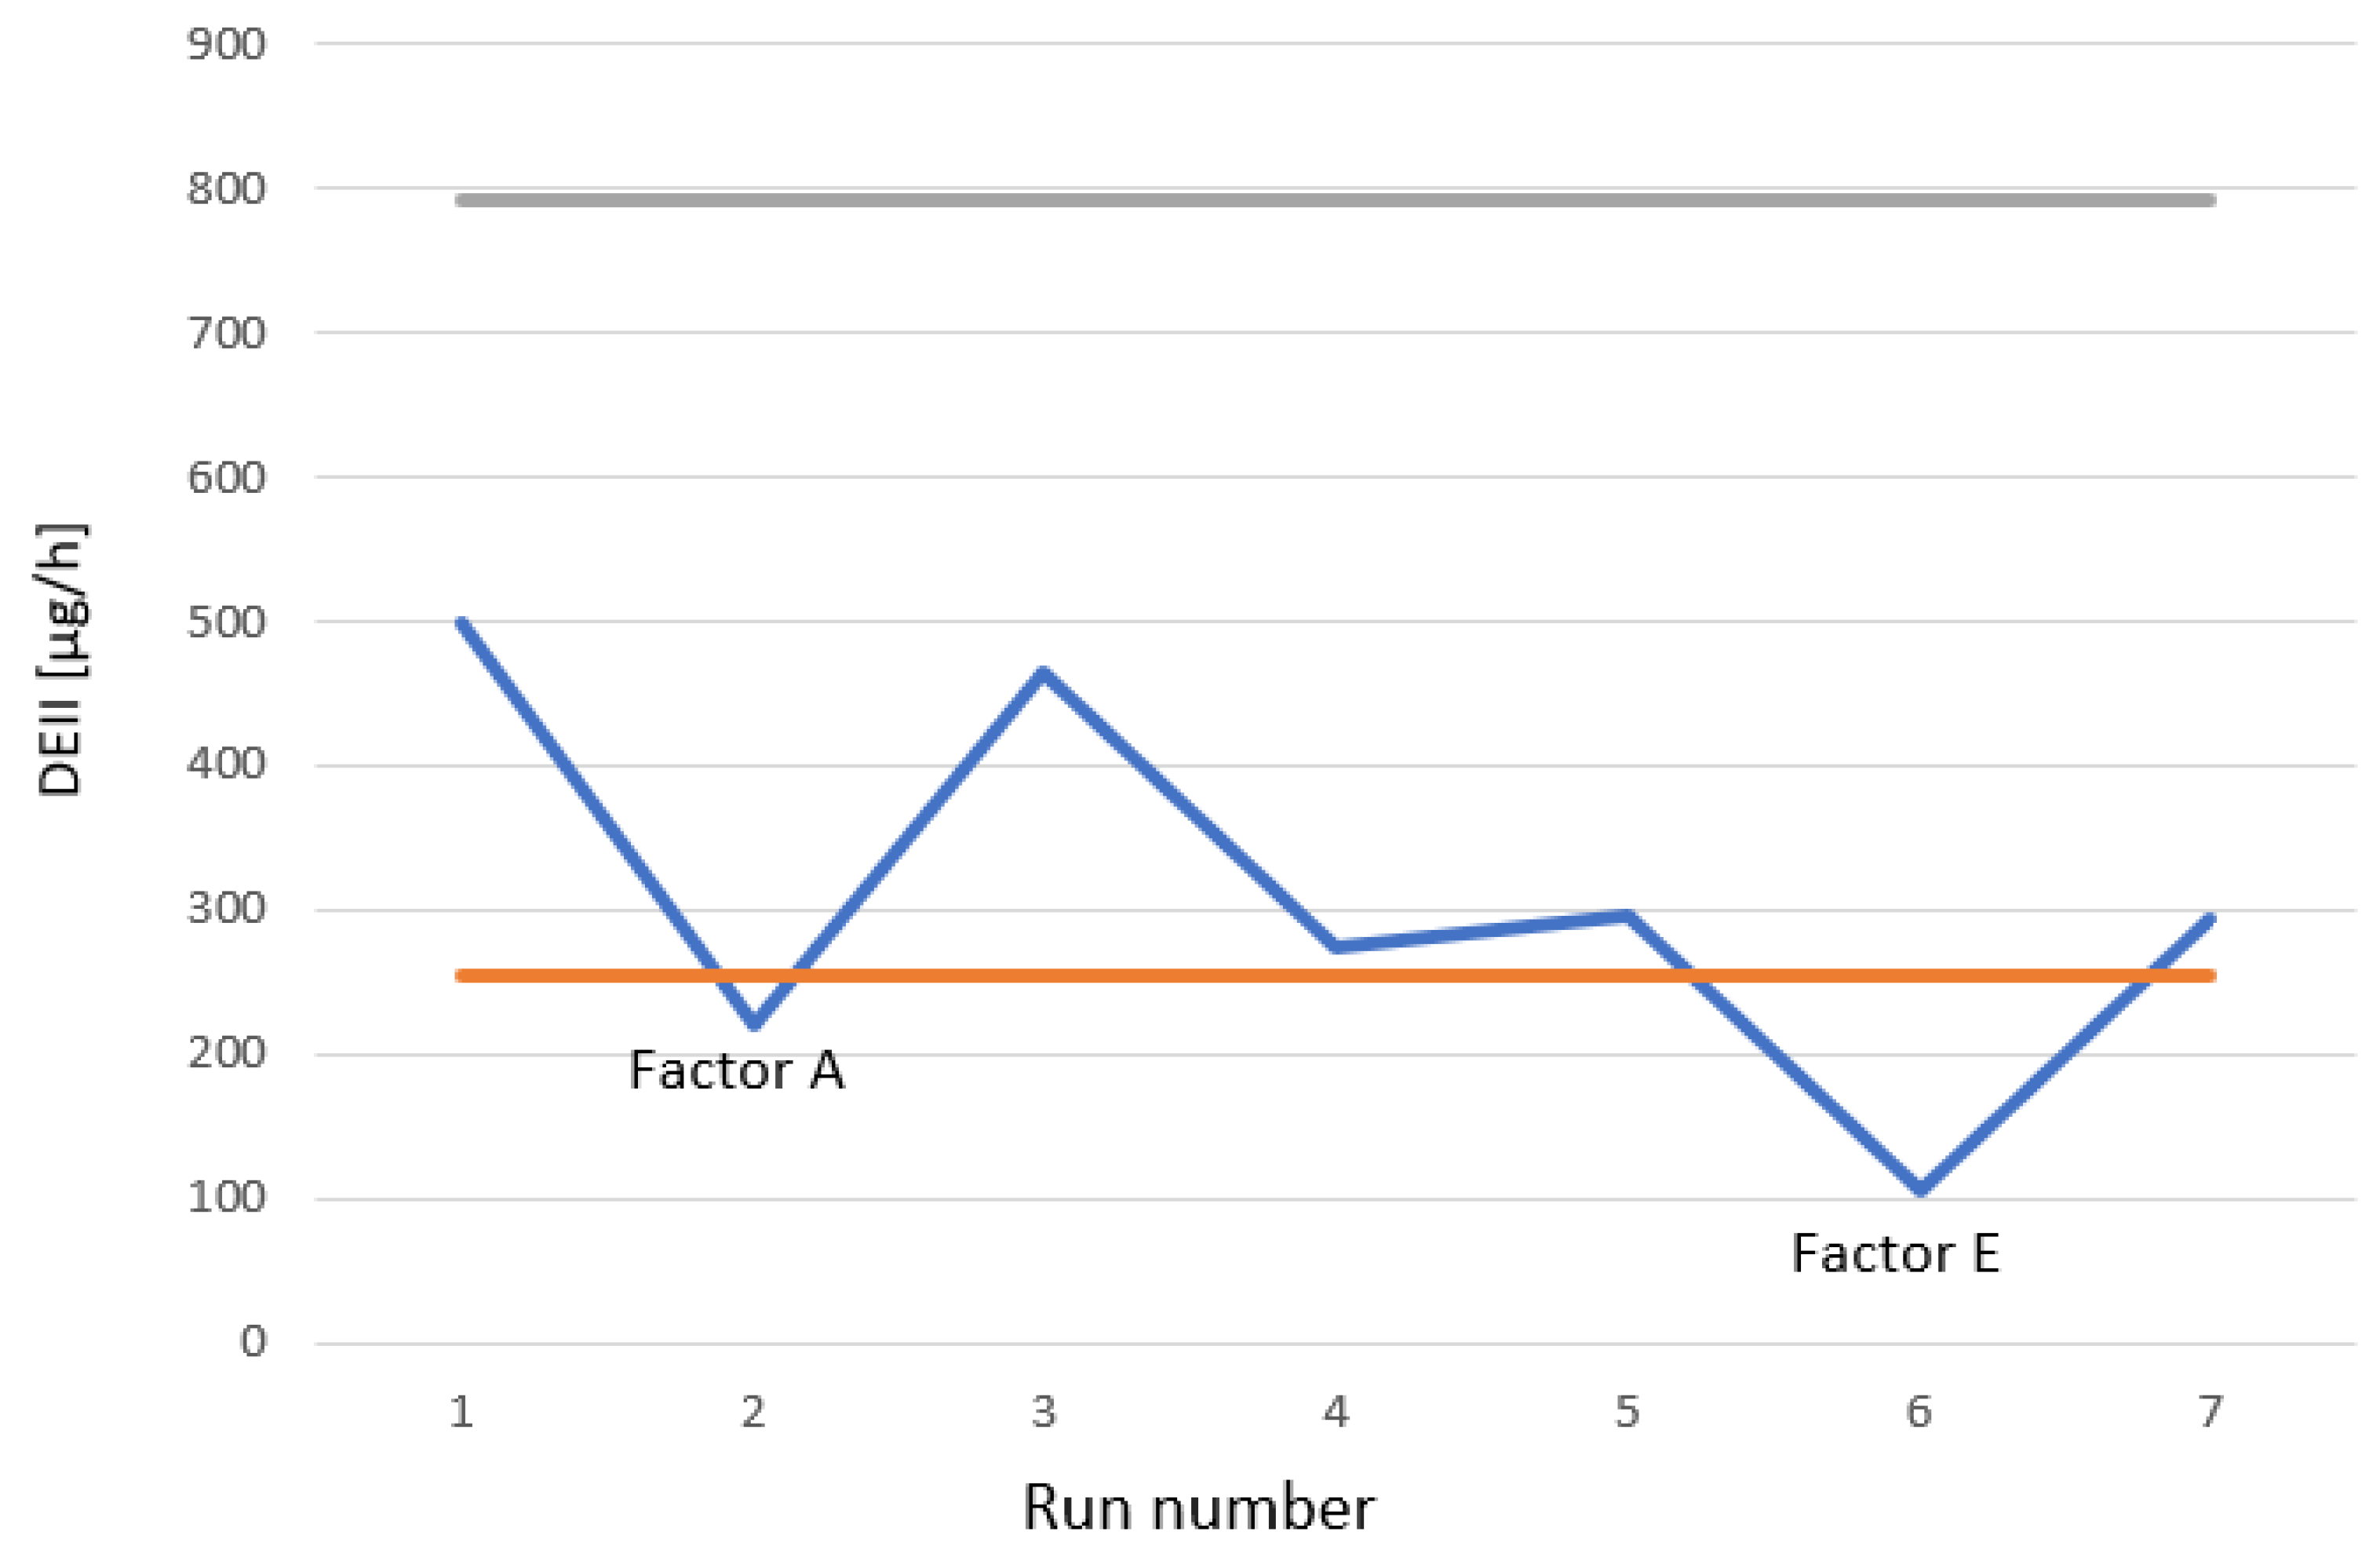
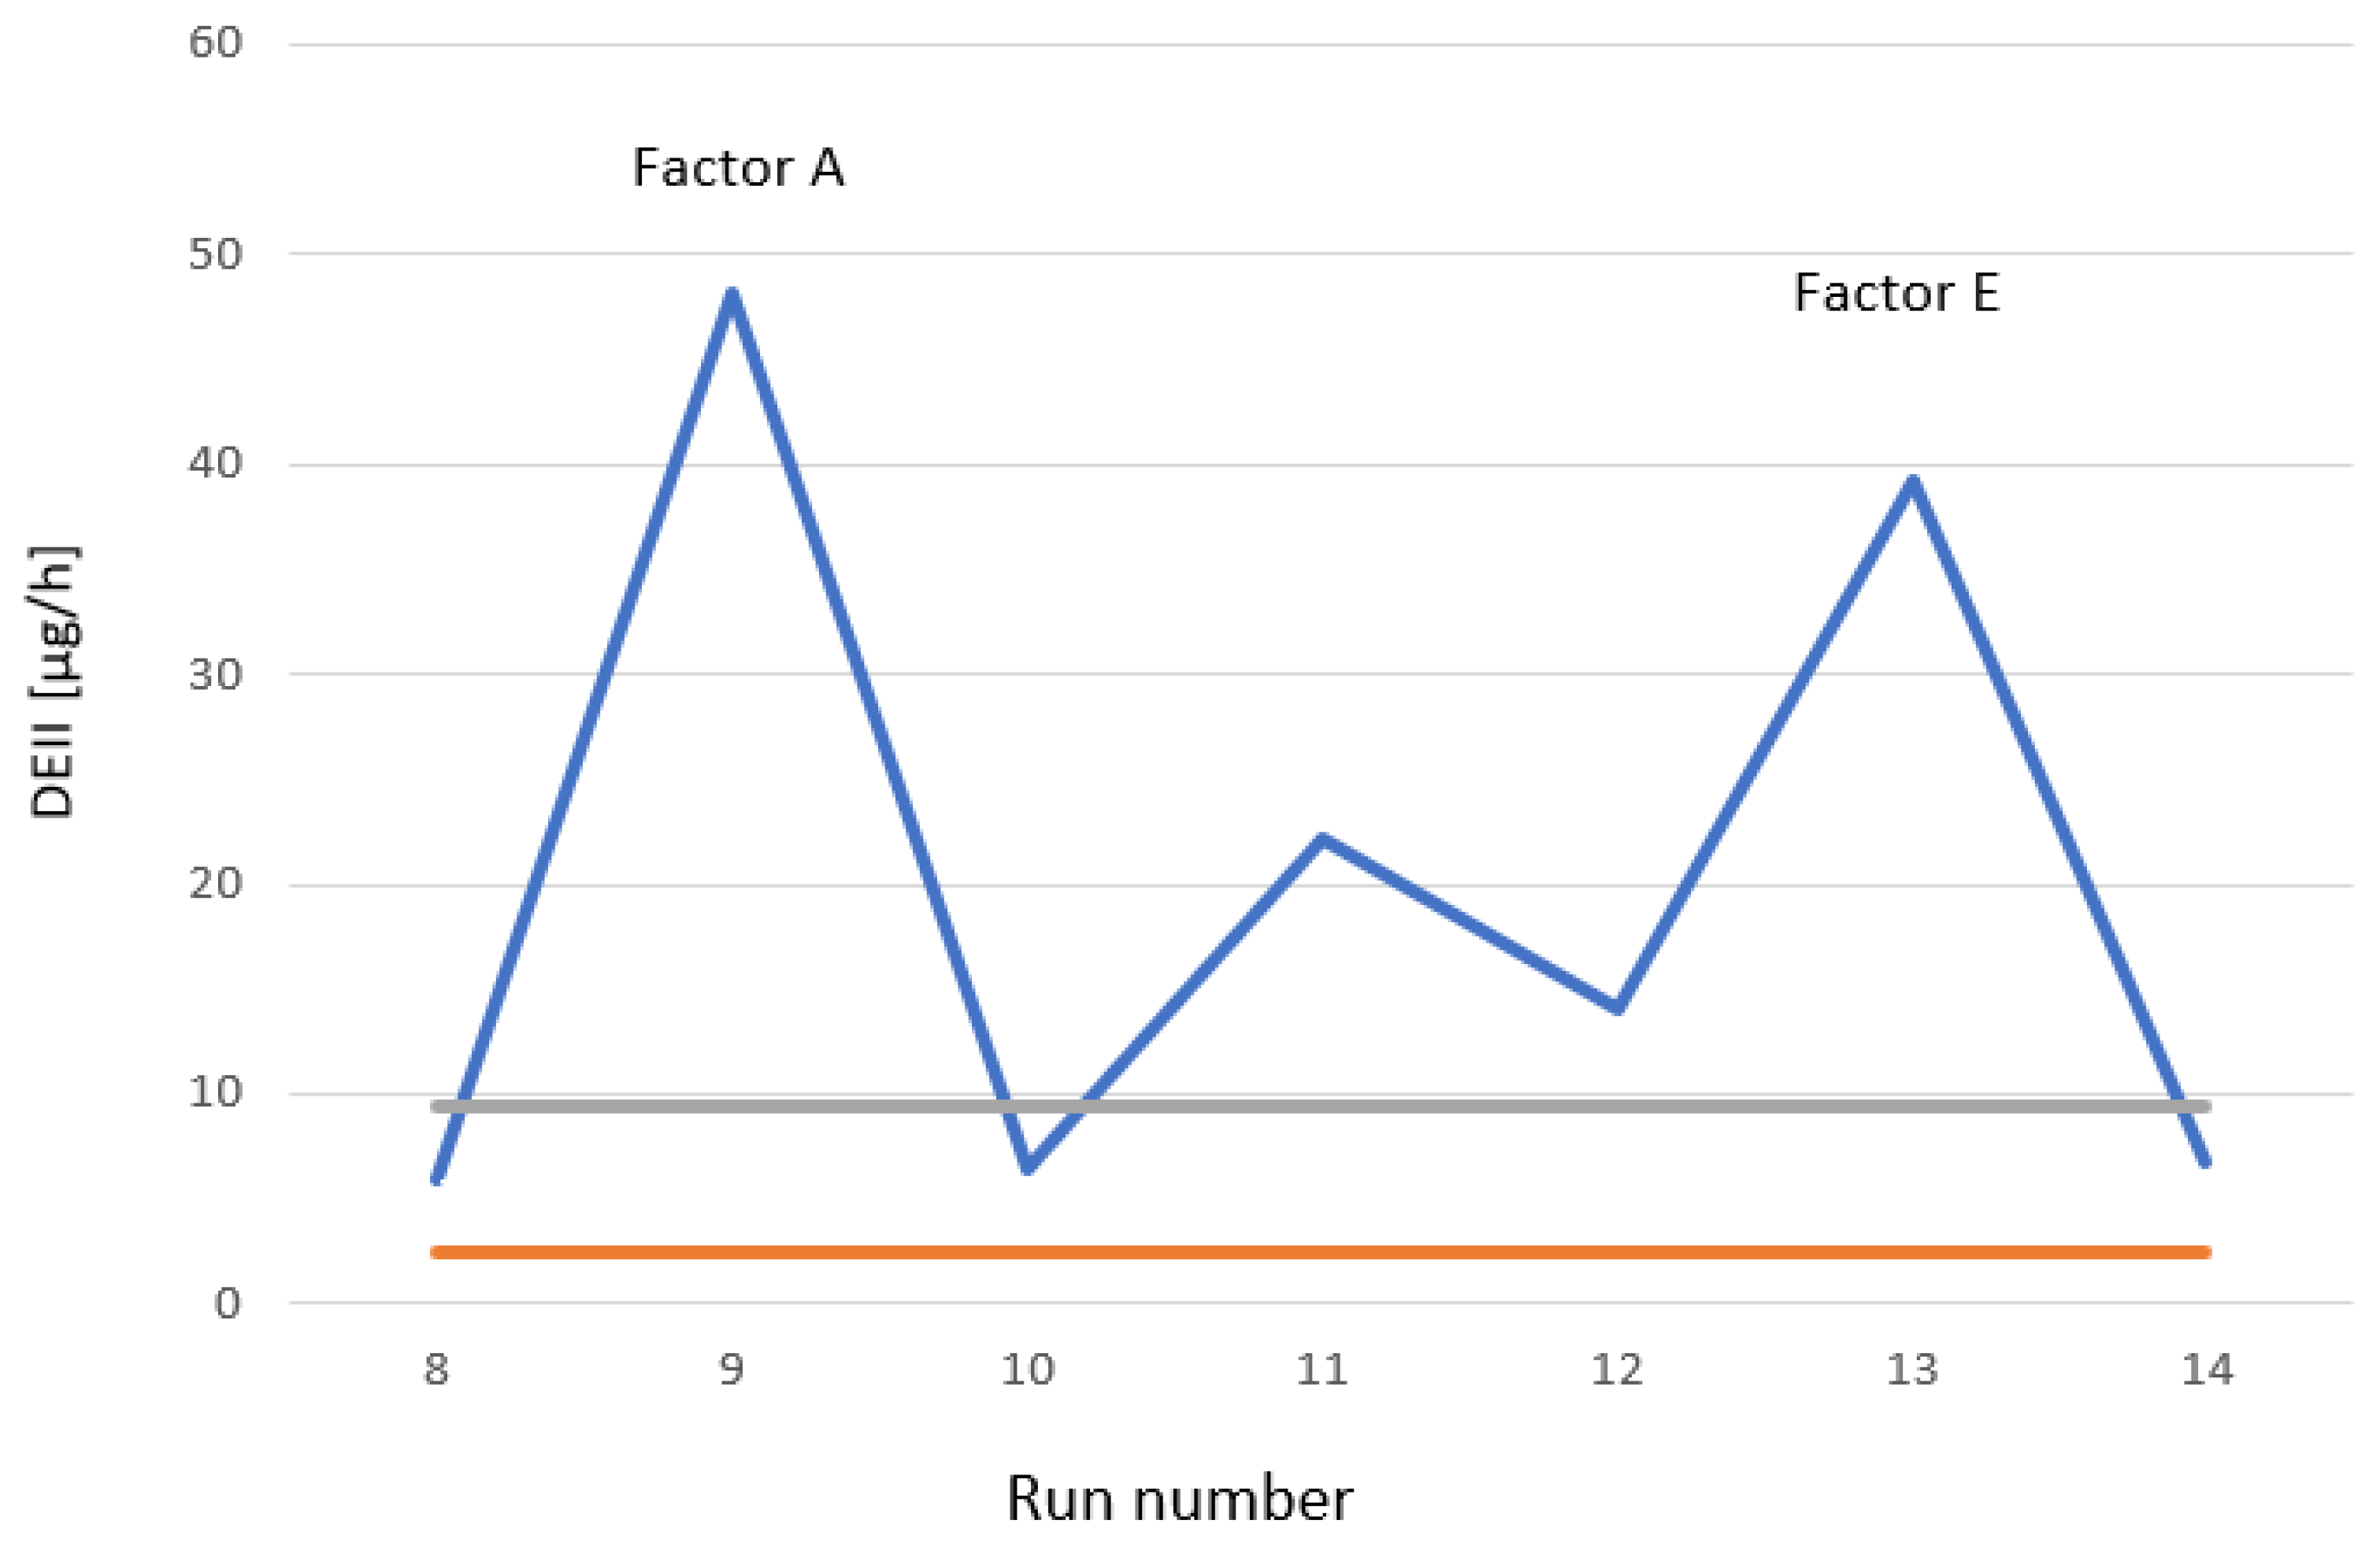
The impact of FFF process parameters on dust emission intensity was determined based on changes in the average value of the index—( D E I I ¯ ) (last column in Table 7) across the different runs of the experiments. These changes were evaluated in relation to the values of LCL (Lower Confidence Limit) and UCL (Upper Confidence Limit), which define the confidence interval in which the value of the index ( D E I I ¯ ) is expected to lie with a probability of p = 0.95, assuming the factor changed in a given run does not significantly impact the DEII value. If the average value ( D E I I ¯ ) in any of the runs (2–7) falls outside the <LCL, UCL> range, it indicates that the factor changed in that particular run has a significant (at the 0.05 level) impact on the emission intensity.
Figure 4 and Figure 5 show the values of D E I I ¯ :
  • In runs 1–7 marked as a blue line (in run 1, all parameters are set at the (+) level; in runs 2–7, one of the factors is set at the (−) level, while the others remain at the (+) level).
  • In runs 8–14 marked as an orange line (in run 8, all parameters are set at the (−) level; in runs 9–14, one of the factors is set at the (+) level, while the others remain at the (−) level).
From the obtained graphs, it can be inferred that the dust emission intensity in an FFF process conducted with all factors set at the All (+) level (blue line) is significantly higher than in the process conducted with all factors set at the All (−) level (orange line).
The key factors influencing the emission level in all tested variants are primarily the printer’s extruder temperature (factor A) and the nozzle diameter (factor E). Both of these parameters are crucial, regardless of the type of filament used or other printer settings. The studies showed that the influence of the other process factors on dust emission intensity is smaller than that of the two mentioned factors.
The impact of extruder temperature on dust and volatile organic compound emissions can be interpreted through two factors:
  • Intensification of chemical processes—high extruder temperature promotes the acceleration of chemical reactions and physical processes within the filament, leading to the disintegration of the material structure into finer particles. As a result, a greater amount of potentially harmful substances is released into the surrounding environment, affecting air quality.
  • Increase in the intensity of thermodynamic processes—high extruder temperature triggers more intense thermodynamic transformations, including the expansion of gases trapped in the micro-pores of the filament. As the material is heated, gases are released more rapidly, which can generate additional emissions of fine particles. The solid particles expelled in this way are carried by the expanding gases, facilitating their migration into the surrounding environment, thereby increasing dust emissions.
The impact of nozzle diameter can, in turn, be explained as follows:
  • A larger nozzle diameter allows for the extrusion of a thicker material stream, which reduces the amount of heat delivered per unit mass of filament, as well as the pressure under which the filament is extruded. The lower amount of heat delivered to the material also reduces its thermal degradation, resulting in lower emissions of ultrafine particles. The reduction in pressure leads to less swelling of the filament after it exits the nozzle.
  • The use of a larger nozzle reduces the number of layers required to form the object, thereby shortening the process time. This, in turn, limits the number of extruder movements and the surface area of the filament exposed to heat and air. As a result, the number of particles emitted into the surrounding environment decreases.
  • With a larger nozzle, the extruded material has a relatively small surface area compared to its volume, which limits the exposure of the material to factors that promote its oxidation and degradation. A smaller contact surface means that the filament is less susceptible to processes that lead to the emission of ultrafine particles. For example, for a printed object with a volume of 1 cm3 (in the form of a cube), the surface area of the material exposed to air is 157 cm2 when using a 0.4 mm diameter nozzle. With a 0.8 mm diameter nozzle, the surface area exposed to air decreases to just under 105.5 cm2.
  • Since the thicker filament has a relatively smaller surface area compared to its volume, it allows for faster heat dissipation. Faster solidification reduces the time during which the material remains in a semi-liquid state, thus decreasing the risk of thermal degradation and dust emissions.
These observations are consistent with known thermodynamic and degradation mechanisms of polylactic acid (PLA). Higher local temperatures and shear stress within smaller nozzles promote polymer chain scission, oxidation, and volatilization of low-molecular-weight compounds, which subsequently nucleate into ultrafine particles. Conversely, lower shear and faster cooling at larger nozzle diameters limit the extent of thermal degradation and reduce emission intensity [36,37].
It should be noted that the applied screening design allowed the identification of the main factors influencing emission levels but did not enable a precise assessment of potential interactions between variables. As a result, effects such as the interaction between cooling fan operation and temperature parameters—where the fan could locally reduce nozzle and bed temperature—could not be quantitatively verified within this study.

4.3. The Dust Emission Intensity Index Depending on the Filament Type and Supplier

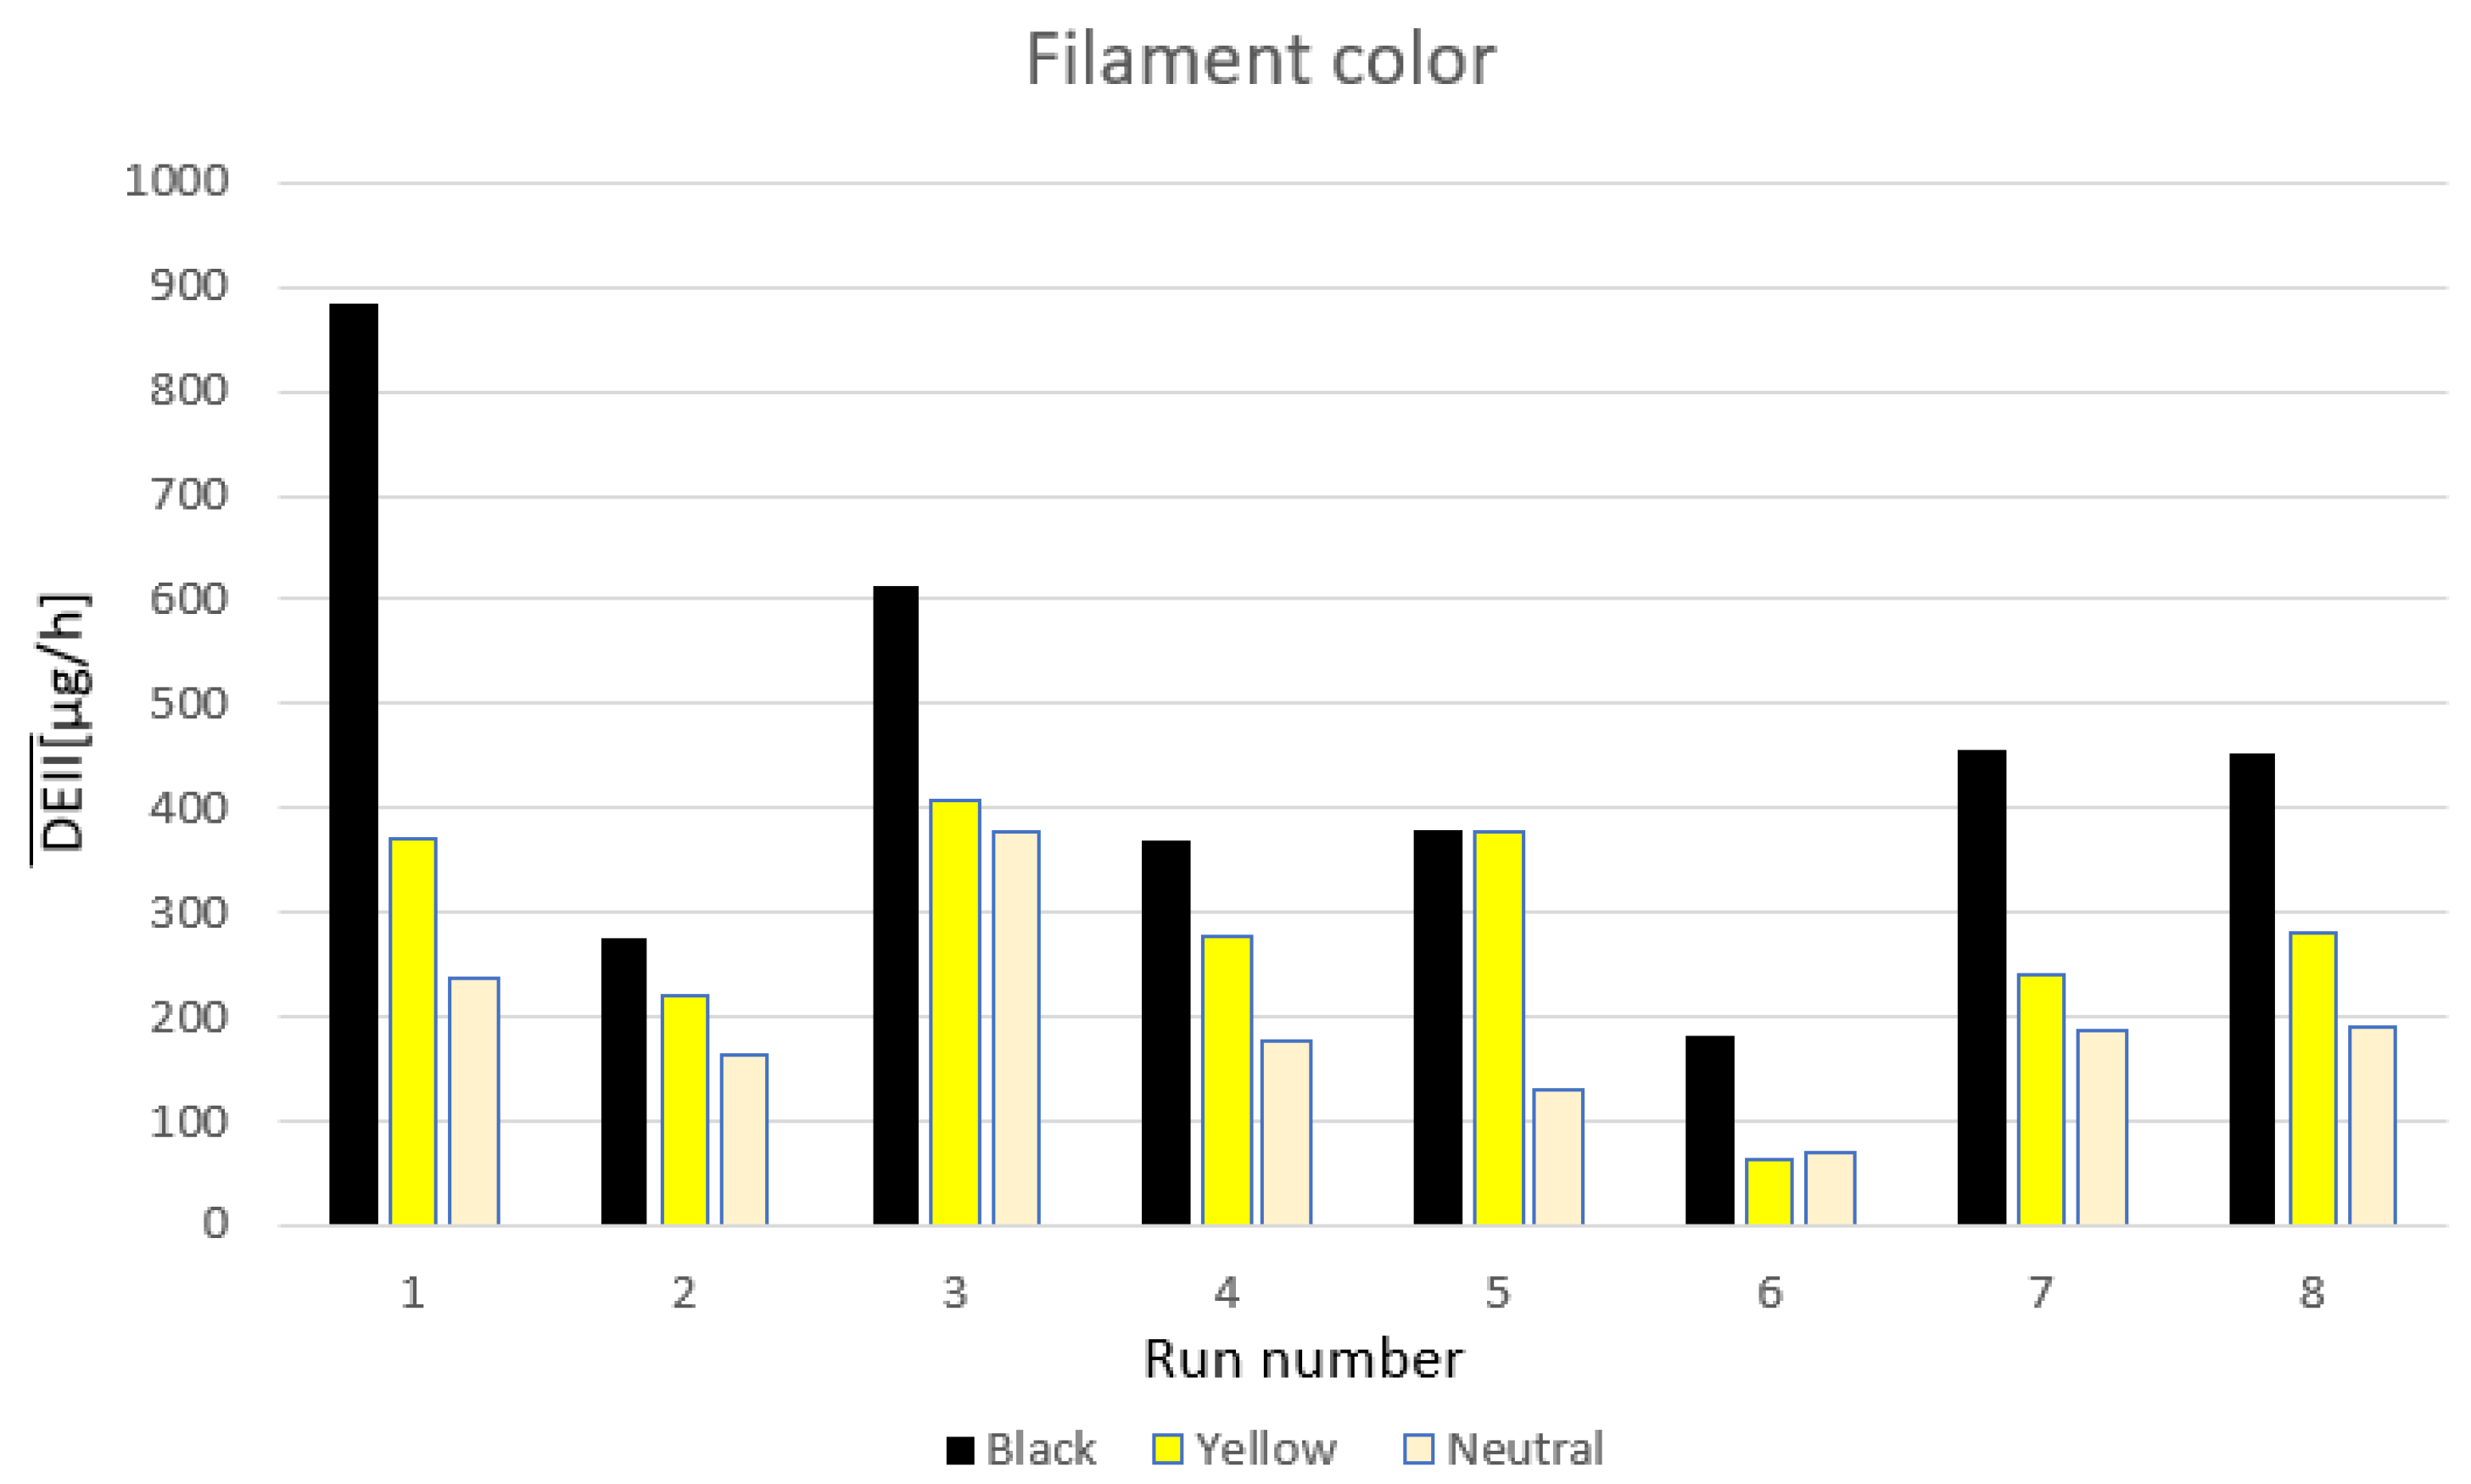
Figure 6 shows the values of the DEII index during the printing of products with filaments of different colors (the values presented in the graph are averaged by manufacturer). Categories 1–7 correspond to individual experimental runs, while category 8 presents the average value from runs 1–7. The presented results include only runs 1–7, as it is in these runs that emission levels were observed that may pose a risk to human health.
Analysis of Figure 6 indicates that in most runs, the highest intensity of solid particle emissions was observed when printing with black filament, while the lowest emission values were recorded when using neutral-colored filament. This variation may result from differences in the content of pigments and chemical additives in the individual filaments, which affect their properties during melting and the printing process. Pigments used in black filaments, particularly carbon-based ones, can lead to higher solid particle emissions, which explains the higher emission levels compared to neutral-colored filaments, which have a simpler chemical composition and fewer impurities.
Figure 7 shows the emission values when printing with filaments from different manufacturers. As before, categories 1–7 correspond to individual experimental runs, while category 8 presents the average value from runs 1–7.
The obtained data were subjected to ANOVA analysis. Results shown in Table 9 indicate that among the analyzed categorical factors, only filament color had a statistically significant effect on dust emission levels (p = 0.042). The influence of the filament manufacturer was not significant (p = 0.232), suggesting that production-related differences between filaments were less relevant than their color properties. The lack of fit value (p = 0.944) confirms that the applied model adequately described the observed variability in DEII. These findings demonstrate that color, likely related to pigment composition and thermal behavior, is an important variable influencing emission intensity.
Analysis of Figure 6 and Figure 7 indicates that the key factor influencing particulate pollutant emissions during 3D printing is the dyes contained in the polymers, rather than the filament manufacturer itself.
From Figure 7 it can also be inferred that in the averaged category (8), the emission intensity for individual manufacturers is similar, with manufacturers 1 and 3 showing nearly identical results. These values suggest a similar characteristic of the filaments from these two suppliers in terms of behavior during the printing process. In contrast, manufacturer 2 recorded slightly lower emission values, which may indicate that their filaments have a different formulation or contain fewer components that contribute to pollutant emissions during printing. This variation in results could be the effect of differences in the manufacturing process, the dyes used, or other factors influencing emissions during 3D printing.
It is also worth noting that manufacturer 2 is a supplier of mid-range priced filaments, which challenges the assumption that a higher filament price is always associated with a decrease in dust emissions.

5. Conclusions

The conducted research allows for the formulation of several important general conclusions with both practical and cognitive significance.
  • Dust emissions generated during the additive manufacturing process using an FFF method can pose a threat to individuals operating the printers or present in rooms where they are used, especially with prolonged exposure to the emitted pollutants. It has been shown that under specific conditions (small room, high extruder temperature, wide print path), negative health effects may occur after approximately 40 min of exposure.
  • Among FFF process parameters, the nozzle diameter and extruder temperature have the greatest impact on dust emission levels. A lower extruder temperature results in less thermal degradation of the material. Increasing the nozzle diameter allows for the extrusion of a thicker filament stream, which reduces the amount of heat applied per unit mass of filament and the pressure during extrusion. Additionally, a filament with a larger diameter has a smaller surface area in contact with air relative to its volume, which limits its exposure to factors that lead to degradation and particle emission.
  • An impact of the filament composition, especially the dyes, on dust emissions was also observed. However, no effect of the manufacturer was found. This means that efforts to reduce emissions should primarily focus on the color composition of the filament, rather than its source.
The results obtained allow us to conclude that it is possible to predict the degree of negative impact of FFF printing and, based on this, implement preventive measures, such as using appropriate safeguards such as ventilation systems, air filters, and personal protective equipment, to minimize the risk associated with dust emissions in the workplace. However, in order for these predictions to be convincing for FFF printer users and filament manufacturers, it is necessary to expand the scope of research to include other types of polymers, including ABS, which may exhibit different properties in terms of dust and pollutant emissions compared to polylactic acid (PLA), and may also require different working conditions and control in the printing process.
In the context of protecting the health of employees operating 3D printers or present in rooms where they are used, a challenge is the lack of regulations regarding the concentrations of smaller particles. Therefore, further research should consider including particle sizes, especially PM0.5, in the measurements. It is known that even at low concentrations in the air, these particles can be harmful to human health.

Author Contributions

Conceptualization and Writing—Review and Editing, F.O.; Supervision and Writing—Review and Editing, A.H. All authors have read and agreed to the published version of the manuscript.

Funding

This research received no external funding.

Data Availability Statement

The original contributions presented in this study are included in the article. Further inquiries can be directed to the corresponding author(s).

Conflicts of Interest

The authors declare no conflicts of interest.

References

  1. Campbell, I.; Bourell, D.; Gibson, I. Additive Manufacturing: Rapid Prototyping Comes of Age. Rapid Prototyp. J. 2012, 18, 255–258. [Google Scholar] [CrossRef]
  2. Gibson, I.; Rosen, D.W.; Stucker, B. Additive Manufacturing Technologies: 3D Printing, Rapid Prototyping, and Direct Digital Manufacturing; Springer: New York, NY, USA, 2015. [Google Scholar] [CrossRef]
  3. Karayannis, P.; Petrakli, F.; Gkika, A.; Koumoulos, E. 3D-Printed Lab-on-a-Chip Diagnostic Systems—Developing a Safe-by-Design Manufacturing Approach. Micromachines 2019, 10, 825. [Google Scholar] [CrossRef] [PubMed]
  4. Siemiński, P.; Budzik, G. Additive Manufacturing Techniques: 3D Printing, 3D Printers; Warsaw University of Technology Press: Warsaw, Poland, 2015; pp. 11–145. (In Polish) [Google Scholar]
  5. Bravia, L.; Murmura, F.; Santos, G. Additive Manufacturing: Possible Problems with Indoor Air Quality. Procedia Manuf. 2019, 41, 952–959. [Google Scholar] [CrossRef]
  6. Khaki, S.; Rio, M.; Marin, P. Monitoring Indoor Air Quality in Additive Manufacturing Environments. Procedia CIRP 2020, 90, 455–460. [Google Scholar] [CrossRef]
  7. Stefaniak, A.B.; LeBouf, R.F.; Yi, J.; Ham, J.; Nurkewicz, T.; Schwegler-Berry, D.E.; Chen, B.T.; Wells, J.R.; Duling, M.G.; Lawrence, R.B.; et al. Characterization of Chemical Contaminants Generated by a Desktop Fused Deposition Modeling 3-Dimensional Printer. J. Occup. Environ. Hyg. 2017, 14, 540–550. [Google Scholar] [CrossRef] [PubMed]
  8. Gao, C.; Wolff, S.; Wang, S. Eco-Friendly Additive Manufacturing of Metals: Energy Efficiency and Life Cycle Analysis. J. Manuf. Syst. 2021, 60, 459–472. [Google Scholar] [CrossRef]
  9. Liao, J.; Cooper, D.R. The Environmental Impacts of Metal Powder Bed Additive Manufacturing. J. Manuf. Sci. Eng. 2021, 143, 030801. [Google Scholar] [CrossRef]
  10. Maines, E.M.; Porwal, M.K.; Ellison, C.J.; Reineke, T.M. Sustainable Advances in SLA/DLP 3D Printing Materials and Processes. Green Chem. 2021, 23, 6863–6897. [Google Scholar] [CrossRef]
  11. Mele, M.; Campana, G.; D’Avino, G. Life Cycle Impact Assessment of Desktop Stereolithography. J. Clean. Prod. 2020, 244, 118743. [Google Scholar] [CrossRef]
  12. Stabile, L.; Scungio, M.; Buonanno, G.; Arpino, F.; Ficco, G. Airborne Particle Emission of a Commercial 3D Printer: The Effect of Filament Material and Printing Temperature. Indoor Air 2017, 27, 452–459. [Google Scholar] [CrossRef]
  13. Azimi, P.; Zhao, D.; Pouzet, C.; Crain, N.E.; Stephens, B. Emissions of Ultrafine Particles and Volatile Organic Compounds from Commercially Available Desktop Three-Dimensional Printers with Multiple Filaments. Environ. Sci. Technol. 2016, 50, 1260–1268. [Google Scholar] [CrossRef]
  14. Gu, J.; Wensing, M.; Uhde, E.; Salthammer, T. Characterization of Particulate and Gaseous Pollutants Emitted During Operation of a Desktop 3D Printer. Environ. Int. 2019, 123, 476–485. [Google Scholar] [CrossRef]
  15. Davis, A.Y.; Zhang, Q.; Wong, J.P.S.; Weber, R.J.; Black, M.S. Characterization of Volatile Organic Compound Emissions from Consumer-Level Material Extrusion 3D Printers. Build. Environ. 2019, 160, 106209. [Google Scholar] [CrossRef]
  16. Min, K.; Li, Y.; Wang, D.; Chen, B.; Ma, M.; Hu, L.; Liu, Q.; Jiang, G. 3D Printing-Induced Fine Particle and Volatile Organic Compound Emission: An Emerging Health Risk. Environ. Sci. Technol. Lett. 2021, 8, 616–625. [Google Scholar] [CrossRef]
  17. Environmental Protection Agency (EPA). Particulate Matter (PM) Basics; EPA Website. 2022. Available online: https://www.epa.gov (accessed on 4 September 2025).
  18. World Health Organization (WHO). Air Quality Guidelines; WHO Website: Geneva, Switzerland, 2021; Available online: https://www.who.int (accessed on 20 August 2025).
  19. Viitanen, A.; Kallonen, K.; Kukko, K.; Kanerva, T.; Saukko, E.; Hussein, T.; Hämeri, K.; Saamanen, A. Technical Control of Nanoparticle Emissions from Desktop 3D Printing. Indoor Air 2021, 31, 1061–1071. [Google Scholar] [CrossRef] [PubMed]
  20. Warlimont, H.; Martienssen, W. Springer Handbook of Condensed Matter and Materials Data; Springer: Berlin/Heidelberg, Germany, 2005. [Google Scholar] [CrossRef]
  21. Zhang, Q.; Wong, J.P.S.; Davis, A.Y.; Black, M.S.; Weber, R.J. Characterization of Particle Emissions from Consumer Fused Deposition Modeling 3D Printers. Aerosol Sci. Technol. 2017, 51, 1275–1286. [Google Scholar] [CrossRef]
  22. Zhang, Q.; Pardo, M.; Rudich, Y.; Kaplan-Ashiri, I.; Wong, J.P.S.; Davis, A.Y.; Black, M.S.; Weber, R.J. Chemical Composition and Toxicity of Particles Emitted from a Consumer-Level 3D Printer Using Various Materials. Environ. Sci. Technol. 2019, 53, 12054–12061. [Google Scholar] [CrossRef]
  23. Stephens, B.; Azimi, P.; Orch, Z.E.; Ramos, T. Ultrafine Particle Emissions from Desktop 3D Printers. Atmos. Environ. 2013, 79, 334–339. [Google Scholar] [CrossRef]
  24. Ordinance of the Minister of Family, Labour and Social Policy. Ordinance of the Minister of Family, Labour and Social Policy of 12 June 2018 on the Highest Permissible Concentrations and Intensities of Harmful Factors for Health in the Work Environment. J. Laws 2018. Item 1286. Available online: https://isap.sejm.gov.pl/isap.nsf/DocDetails.xsp?id=WDU20180001286 (accessed on 3 September 2025).
  25. Regulation of the Minister of Environment. Regulation of the Minister of Environment of 26 January 2010 on Reference Values for Certain Substances in the Air. J. Laws 2010. Item 87. Available online: https://isap.sejm.gov.pl/isap.nsf/DocDetails.xsp?id=wdu20100160087 (accessed on 3 September 2025).
  26. U.S. Department of Labor, Occupational Safety and Health Administration (OSHA). 1926.55—Gases, Vapors, Fumes, Dusts, and Mists; U.S. Department of Labor: Washington, DC, USA, 2020. [Google Scholar]
  27. Health and Safety Executive (HSE). EH40/2005 Workplace Exposure Limits, 4th ed.; HSE: London, UK, 2020. [Google Scholar]
  28. Tang, C.-L.; Seeger, S. Measurement of Sub-4 nm Particle Emission from FFF 3D Printing with the TSI Nano Enhancer and the Airmodus Particle Size Magnifier. Aerosol Sci. Technol. 2024, 58, 644–656. [Google Scholar] [CrossRef]
  29. Tang, C.-L.; Chan, K.-H.; Lee, S.-Y. Development of a Standard Emission Test Method for the Determination of Particle Emission from 3D Printing with Fused Filament Fabrication Filaments. Preprint, ResearchGate. 2023. Available online: https://www.researchgate.net/publication/390493160 (accessed on 4 September 2025).
  30. Durai, M.A.; Ashok, D. Multi-Objective Optimization of Surface Finish and VOC Emissions in FFF 3D Printing Using ANN–NSGA-II Approach. Sci. Rep. 2025, 15, 34394. [Google Scholar] [CrossRef]
  31. Kim, B.; Shin, J.H.; Kim, H.P.; Jo, M.S.; Kim, H.S.; Lee, J.S.; Yu, I.J. Assessment and Mitigation of Exposure of 3-D Printer Emissions. Front. Toxicol. 2022, 3, 817454. [Google Scholar] [CrossRef]
  32. Secondo, L.E.; Adawi, H.I.; Cuddehe, J.; Hopson, K.; Schumacher, A.; Mendoza, L.; Lewinski, N.A. Comparative Analysis of Ventilation Efficiency on Ultrafine Particle Removal in University MakerSpaces. Atmos. Environ. 2020, 224, 117321. [Google Scholar] [CrossRef] [PubMed]
  33. Stefaniak, A.B.; Du Preez, S.; Du Plessis, J.L. Additive Manufacturing for Occupational Hygiene: A Comprehensive Review of Processes, Emissions, and Exposures. J. Toxicol. Environ. Health Part B 2021, 24, 173–222. [Google Scholar] [CrossRef] [PubMed]
  34. Hamrol, A. Quality Management and Engineering; Wydawnictwo Naukowe PWN: Warsaw, Poland, 2022; ISBN 978-83-01-19863-3. (In Polish) [Google Scholar]
  35. Raffo, M.; Appolloni, L.; D’Alessandro, D. Housing Spaces in Europe: A Comparative Analysis of Standards in Nine European Countries. Eur. J. Public Health 2020, 30 (Suppl. 5), ckaa166-126. [Google Scholar] [CrossRef]
  36. Benabderazag, K.; Rouchon, D.; Boulanger, A.; Dupont, P.; Martin, L. Characterization of Thermomechanical Properties and Emission Behaviour in 3D-Printed Biocomposite Fabricated Using Fused Deposition Modelling. Compos. Part B Eng. 2024, 299, 110541. [Google Scholar] [CrossRef]
  37. Hejna, A.; Marć, M.; Szymański, P.; Mizera, K.; Barczewski, M. Analysis of Emission of Volatile Organic Compounds and Thermal Degradation in Investment Casting Using Fused Deposition Modelling (FDM) and Three-Dimensional Printing (3DP) Made of Various Thermoplastic Polymers. Environ. Sci. Pollut. Res. 2024, 31, 60371–60388. [Google Scholar] [CrossRef] [PubMed]
Figure 1. Filament used in the tests.
Processes 13 03470 g001
Figure 2. Three-dimensional printer placed in the test chamber.
Processes 13 03470 g002
Figure 3. The graphs of dust concentration changed during the printing process in the trials (a) T1,2,1; (b) T1,2,2; (c) T1,2,3.
Processes 13 03470 g003
Figure 4. Graph of changes of D E I I ¯ as a function of the factor levels in runs 1–7.
Processes 13 03470 g004
Figure 5. Graph of changes of D E I I ¯ as a function of the factor levels in runs 8–14.
Processes 13 03470 g005
Figure 6. Effect of filament color on emission rate in runs 1–7, plus mean value (8).
Processes 13 03470 g006
Figure 7. Influence of filament manufacturer on emission rate in runs 1–7, plus mean value (8).
Processes 13 03470 g007
Table 1. Comparison of Additive Manufacturing Methods in Terms of Occupational Health and Safety and Environmental Hazards.
3D Printing Method Occupational Health and Safety Hazards Environmental Hazards
Fused Deposition Modeling (FDM)Emission of fine particles and volatile organic compounds (VOCs).
Potential burns from hot printer components (extruder, heated bed).
Improper handling of chemicals used for adhesion or post-processing.
Consumption of difficult-to-recycle polymer (ABS, PLA)
waste in the form of used filaments.
Stereolithography (SLA)Exposure to chemicals in the form of liquid; toxic and irritating resins.
Emission of UV radiation during the curing process.
Skin and respiratory irritation due to inadequate ventilation.
Difficulties in recycling resins, which are challenging to manage and can contaminate the environment.
High energy consumption.
Emission of volatile organic compounds (VOCs) during resin curing.
Selective Laser Sintering (SLS)Exposure to dust harmful to the respiratory system.
Burn risk.
Exposure to laser radiation.
High energy consumption.
Use of large quantities of powders that are difficult to recycle.
Potential for dust emissions into the atmosphere.
Digital Light Processing (DLP)Exposure to toxic resins, similar to SLA.
UV light emission, which can be harmful to the skin and eyes.
Potential hazards associated with chemical waste after printing.
Problems with the disposal of used materials, such as resins.
High energy consumption.
Potential environmental contamination from chemicals used in printing.
Binder JettingExposure to dust that may irritate the respiratory system.
Risk of contamination from chemicals used for material bonding.
Potential hazards related to contact with solvents.
Difficulties in disposing of unused powders.
High energy and material consumption.
Emission of volatile organic compounds (VOCs) during drying and curing of prints.
Electron Beam Melting (EBM)Exposure to electromagnetic radiation.
High temperatures causing burn risks.
Explosion risk when mishandling metallic powders.
Very high energy consumption.
Waste in the form of used metallic powders, which are difficult to recycle.
Potential environmental contamination from metallic dust.
Table 2. Maximum permissible concentrations of dust pollutants at workplaces and in the environment [24,25,26,27].
Acceptable Levels of Dust
Concentration [mg/m3]
PolandUSAWHO
Total dust organic and inorganic10 mg/m315 mg/m3-
Max concentration of PM10 in the environment40 µg/m340 µg/m350 µg/m3
Max concentration of PM2.5 in the environment20 µg/m310 µg/m320 µg/m3
Table 3. Examples of dust emission values in FFF with use of PLA [7,31,32,33].
AuthorColorHead Temperature [°C]Emission RatesPrint Time
[Particles/min]
[31]Brown210–2204.89 × 1082 h 30 min
Not described210–2204.27 × 1081 h 55 min
[7] Blue2151.1 ± 0.7 × 101020 min
Blue2151.6 ± 0.2 × 101021 min
Red2151.3 ± 0.5 × 101022 min
Green2151.3 ± 0.2 × 101023 min
Table 4. Experimental factors.
DesignationHead TemperatureBed TemperatureLayerPrinting SpeedNozzle DiameterCooling
Ht [°C]Bt [°C]L [mm]Ps [mm/s]Nd [mm]Yes/No
ABCDEF
+225600.2500.4yes
190210.3300.8no
Table 5. The experimental setup was designed with fourteen runs.
Run
[r]
Run CodeThe Examined Factor
Head Temperature
[A]
Bed Temperature
[B]
Layer
[C]
Printing Speed
[D]
Nozzle Diameter
[E]
Cooling
[F]
1All+++++++
2A (−−) All (+)−−+++++
3B (−−) All (+)+−−++++
4C (−−) All (+)++−−+++
5D (−−) All (+)+++−−++
6E (−−) All (+)++++−−+
7F (−−) All (+)+++++−−
8All (−−)−−−−−−−−−−−−
9A (+) All (−−)+−−−−−−−−−−
10B (+) All (−−)−−+−−−−−−−−
11C (+) All (−−)−−−−+−−−−−−
12D (+) All (−−)−−−−−−+−−−−
13E (+) All (−−)−−−−−−−−+−−
14F (+) All (−−)−−−−−−−−++
Table 6. Trial table.
Run
[r]
Code
of the Run
Manufacturer
[m]
123
Color
[c]
BlackYellowTransparentBlackYellowTransparentBlackYellowTransparent
123123123
1All+ T1,2,1
2A (−) All (+)
3B (−) All (+)
4C (−) All (+)
5D (−) All (+)
6E (−) All (+)
7F (−) All (+)
8All (−) T8,2,1
9A (+) All (−)
10B (+) All (−)
11C (+) All (−)
12D (+) All (−)
13E (+) All (−)
14F (+) All (−)
Table 7. Dust Emission Intensity Index (DEII) in the trials and the average emission value ( D E I I ¯ ) in the run [μg/h].
Run
r
CodeManufacturer
m
Mean
123
Color
c
123123123
DEII D E I I ¯
1All+9065002686912832111058328235498
2A (−) All (+)28923814117321171365211276220
3B (−) All (+)503464428519341315817420384466
4C (−) All (+)36226518434721371403350276275
5D (−) All (+)28330915754156968311259160295
6E (−) All (+)1295545893338325102131105
7F (−) All (+)43624229723920669690273194294
8All (−)73310549856
9A (+) All (−)15614504474113291548
10B (+) All (−)64486410876
11C (+) All (−)53182274254281222
12D (+) All (−)2518674152421614
13E (+) All (−)98283103413561939
14F (+) All (−)96684413747
Table 8. Forecasted dust concentration after 1 h of printing.
ColorRun NumberAverage Emission Rate [µg/h]Concentration After 1 h
[µg/m3]
Time After Which WHO Standards Were Exceeded
Black188530.5298 min
Black890.31-
Yellow137012.76235 min
Yellow850.17-
Neutral12388.20365 min
Neutral840.14-
Table 9. ANOVA results: the impact of color and manufacturer on dust emissions in 3D printing.
F-Valuep-Value
Manufacturer 1.480.232
Color 3.240.042
Lack of fit0.190.944
Disclaimer/Publisher’s Note: The statements, opinions and data contained in all publications are solely those of the individual author(s) and contributor(s) and not of MDPI and/or the editor(s). MDPI and/or the editor(s) disclaim responsibility for any injury to people or property resulting from any ideas, methods, instructions or products referred to in the content.