Article

Distinct Pollution Profiles and Spatio-Temporal Dynamics in Adjacent Ramsar Lakes (Algeria): An Integrated Assessment and High-Resolution Mapping for Targeted Conservation

1
Laboratory of Biology, Water and Environment (LBEE), Faculty SNV-STU, University 8 May 1945 Guelma, P.O. Box 401, Guelma 24000, Algeria
2
Department of Biology, Faculty of Natural and Life Sciences, University Mohamed Chérif Messaidia, Souk-Ahras 41000, Algeria
3
Environmental Research Center (CRE), Avenue Boughazi Said, Annaba 23001, Algeria
4
Department of Biology, Faculty of Natural and Life Sciences, Earth and Universe Sciences, University 8 Mai 1945, Guelma 24000, Algeria
5
Laboratoire de Zoologie Appliquée (LZA), Université de Béjaïa Abderrahmane Mira, Béjaïa 06000, Algeria
6
Department of Biomedical Engineering, Koszalin University of Technology, Śniadeckich 2, 75-453 Koszalin, Poland
7
Department of Landscape Management, University of South Bohemia in České Budějovice, Branišovská 1645/31A, 370 05 České Budějovice, Czech Republic
*
Author to whom correspondence should be addressed.
Processes 2025, 13(11), 3466; https://doi.org/10.3390/pr13113466
Submission received: 14 September 2025 / Revised: 20 October 2025 / Accepted: 23 October 2025 / Published: 28 October 2025

Abstract

This study provides the first integrated spatio-temporal assessment of water quality in Lakes Tonga and Oubeira, two adjacent Ramsar-designated wetlands within El Kala National Park (Algeria). The objective was to identify major pollution sources and inform targeted conservation strategies. Physico-chemical, microbiological, and heavy metal analyses were performed on water samples collected monthly over one year (September 2022–August 2023) from two sites per lake. Applying robust statistical analyses (ANOVA, Kruskal–Wallis, PCA, boxplots) and high-resolution spatial mapping, we revealed significant spatio-temporal heterogeneity and distinct pollution profiles between the two lakes. Specifically, Lake Tonga exhibited higher concentrations of organic and bacterial pollutants, likely linked to agricultural runoff and domestic discharge, while Lake Oubeira was characterized by elevated heavy metal concentrations and higher mineralization. The calculated Water Quality Index (WQI) classified the water quality of both lakes predominantly as “Moderate”, with punctual “Poor” quality episodes. Numerous parameters consistently exceeded water quality standards, indicating substantial ecological and health risks. Spatial distribution maps clearly pinpointed pollution hotspots, guiding lake-specific management measures. These findings underscore the urgent need for differentiated, targeted management interventions and an integrated, multidisciplinary approach for the effective conservation of these valuable wetland ecosystems.

1. Introduction

Wetlands are ecosystems of critical ecological and socio-economic importance worldwide [1], playing vital roles in conserving terrestrial biodiversity, carbon, and water quality [2]. As vital transition zones between terrestrial and aquatic environments, they fulfill indispensable functions in hydrological regulation, carbon sequestration, and the maintenance of exceptional biodiversity [3]. Beyond their intrinsic ecological value, wetlands provide essential ecosystem services to human populations, including freshwater supply, natural hazard mitigation (floods, coastal erosion), fisheries, and tourism. However, these fragile ecosystems are among the most threatened globally; freshwater biodiversity, in particular, is declining at a rate far exceeding that of terrestrial or marine systems, with a multitude of emerging threats such as climate change, new contaminants, and cumulative stressors posing serious concerns [4]. These fragile ecosystems are increasingly threatened by escalating anthropogenic pressures and global climate change, leading to pervasive water quality degradation and biodiversity loss on a global scale [5,6,7,8,9,10,11,12]. Such degradation is a major concern globally, as evidenced by numerous studies highlighting eutrophication and nutrient release in urban and agricultural areas [7,9], which can significantly alter ecosystem functions [8,9,11,12], and promote the proliferation of potentially toxic cyanobacterial blooms [13].
Effective assessment and management of water quality in these vulnerable ecosystems often necessitate integrated approaches combining robust analytical methods, advanced statistical modeling, and high-resolution spatial mapping. The growing complexity of anthropogenic impacts on aquatic systems requires a reunification of limnological and oceanographic perspectives to better understand and mitigate global changes [14]. These tools are crucial for characterizing pollution dynamics, identifying contamination sources, and informing targeted interventions.
El Kala National Park in Algeria harbors a lacustrine complex of major ecological significance, recognized since 1983 as a Ramsar site. Within this complex, Lakes Tonga and Oubeira stand out due to their rich biodiversity, supporting diverse avian, fish, and invertebrate species, and serving as crucial breeding, feeding, and overwintering areas for numerous migratory species [15,16,17]. Despite their geographic proximity, these two lakes exhibit distinct environmental characteristics (e.g., depth, vegetation cover, hydrological inputs) and are subject to specific, yet varied, anthropogenic pressures, exemplified by the introduction of invasive species in Lake Oubeira [18,19]. Their Ramsar designation underscores their international importance and the imperative for understanding and preserving these valuable, threatened ecosystems.
Despite their protected status, Lakes Tonga and Oubeira face increasing anthropogenic pressures primarily stemming from intensive agricultural activities (fertilizer use, runoff), domestic wastewater discharge, and potentially, nearby industrial operations (heavy metal releases). These pressures consistently result in significant organic, bacterial, and metal pollution, leading to progressive water quality degradation, eutrophication, and an elevated risk of toxic cyanobacterial blooms, particularly concerning in Lake Oubeira, where such events have been previously documented [20,21,22,23]. Prior studies have indeed confirmed significant water quality impairment. For instance, Loucif et al. [24] conducted a physico-chemical and bacteriological quality assessment of Lake Tonga, revealing a slightly alkaline environment, electrical conductivity below 1500 µS/cm, dissolved oxygen levels below 5 mg/L, and high concentrations of phosphates (above 5 mg/L), nitrites (above 0.1 mg/L), and ammonium (above 0.5 mg/L). Their study also indicated the presence of various groups of fecal bacteria (e.g., total heterotrophic bacteria 32.3 × 10³ CFU/100 mL, total and fecal coliforms 24 × 103 CFU/100 mL, and fecal streptococci 37 × 103 CFU/100 mL), concluding that Lake Tonga was already in an eutrophication state. Beyond these findings on Lake Tonga, broader studies have also highlighted physico-chemical and bacteriological alterations [25,26,27], and the presence of heavy metals in the waters and sediments of Lake Oubeira [28,29]. The challenges posed by urbanization and intensive agriculture on biodiversity are well-documented in other Algerian wetlands [30,31,32,33,34].
However, a comprehensive and integrated spatio-temporal assessment of both lakes simultaneously, covering a wide range of pollution parameters over a complete annual cycle, and leveraging high-resolution mapping and advanced statistical analyses to differentiate distinct pollution profiles and inform targeted conservation strategies, remains to be fully explored. This study, therefore, aims to bridge this knowledge gap.
Specifically, this study’s objectives are to:
  • Identify the major pollution sources affecting Lakes Tonga and Oubeira.
  • Evaluate the spatial and temporal heterogeneity of pollution both between and within the two lakes, and demonstrate how high-resolution spatial mapping contributes to visualizing these patterns.
  • Assess the implications of the observed pollution levels for the conservation of these valuable ecosystems, including their biodiversity and the public health of surrounding communities.
By providing a unique comparative analysis of physico-chemical, microbiological, and heavy metal parameters over a complete annual cycle (September 2022–August 2023), and utilizing robust statistical tools and detailed spatial mapping, this multidisciplinary study aims to inform sustainable and effective lake-specific management strategies for the preservation of these Ramsar wetlands.

2. Materials and Methods

This study conducted a comprehensive and integrated spatio-temporal assessment of water quality in Lakes Tonga and Oubeira, two sensitive and Ramsar-designated ecosystems within El Kala National Park (Algeria). The analysis combines physico-chemical, microbiological, and heavy metal data, collected monthly for one year (September 2022–August 2023) from two distinct sites in each lake. Statistical analysis (ANOVA, Kruskal–Wallis test, PCA, Boxplots) identified the main spatial and temporal pollution trends.

2.1. Study Sites

The study focused on Lakes Tonga and Oubeira, two lakes of major ecological importance, designated as Ramsar sites, located in El Kala National Park (Figure 1). This complex is recognized for its exceptional biodiversity and plays a crucial role as a breeding, feeding, and overwintering area for numerous migratory bird, fish, and invertebrate species [15,16,17,25,26,27,28,29,30]. Although geographically close, these two lakes exhibit distinct environmental and morpho-hydrological characteristics.
Lake Tonga is typically characterized by deeper water and denser macrophyte vegetation, providing crucial habitat complexity. It serves as a significant wintering and nesting site for a diverse avifauna, including several threatened species [15,27].
In contrast, Lake Oubeira has shallower waters and extensive marshy areas, making it potentially more susceptible to environmental perturbations. This lake has previously experienced significant turtle mortality linked to a proliferation of toxic cyanobacteria [20,21], highlighting its vulnerability to eutrophication-related events.
The main potential sources of pollution in the study area include diffuse agricultural discharges from surrounding cultivated lands, domestic wastewater from nearby rural dwellings, and potential industrial activities upstream or adjacent to the lakes. The choice of these specific lakes is justified by their ecological importance, their documented vulnerability to anthropogenic pollution, and their proximity to potential pollution sources [34].

2.2. Sampling Protocol

Monthly sampling campaigns were conducted over a twelve-month period, from September 2022 to August 2023. To ensure a representative spatial coverage and account for potential variability in water quality, four distinct sampling stations were strategically selected based on a predefined methodology. Two stations were chosen within each lake, considering factors such as proximity to suspected pollution sources, hydrological inputs, and overall representativeness of the lake’s different zones. The geographical coordinates and justification for each station are detailed in Table 1.
Water samples were taken using 1 L polyethylene bottles, previously cleaned and rinsed three times in situ with water from the site to be sampled [35]. For microbiological analyses, sterile 250 mL glass bottles, autoclaved at 121 °C for 20 min, were used to prevent contamination. All samples were conserved at 4–6 °C in a cooler immediately after collection and transported to the laboratory within a maximum of 4 h to minimize physicochemical and microbiological alterations.

2.3. Laboratory Analyses

Physico-chemical, microbiological, and heavy metal analyses were performed according to standardized protocols and appropriate international (ISO) standards [35]. All analyses were conducted in triplicate for each sample, and results are presented as mean values. Missing data, if any, were handled by exclusion from specific calculations.

2.3.1. Physico-Chemical Analyses

For in situ measurements, temperature, pH, electrical conductivity (EC), and dissolved oxygen (DO) were initially assessed using a portable multiparameter meter (WTW Multi 3430, WTW GmbH, Weilheim, Germany), carefully calibrated prior to each sampling event. Subsequently, a wider range of parameters was determined in the laboratory. These included total suspended solids (TSS), nutrient concentrations (nitrates, nitrites, ammonium, and orthophosphates), total hardness, and major ions (calcium, magnesium, chlorides, potassium, and sulfates). Detailed methodologies, including specific reagent kits, detection ranges, and spectrophotometric wavelengths, are provided in the Supplementary Material.
Specifically, nitrate concentrations were determined using the cadmium reduction method (ISO 13395:1996) [36]. Nitrite concentrations were assessed using the diazotization method (ISO 6777:1984) [37]. Ammonium concentrations were quantified using the salicylate method. Orthophosphate levels were assessed using the ascorbate method (NF EN 1189) [38]. Chemical oxygen demand (COD) was determined according to the ISO 15705:2002 [39] standard (dichromate method). Biochemical oxygen demand (BOD5) was determined according to the EN 1899-1 [40] standard (manometric method, OxiTop® Control OC 110 BOD, WTW) (WTW GmbH, Weilheim, Germany). Total suspended solids (TSS) were determined by the filtration method (NF EN872 2005) [41]. Total hardness was determined by the titrimetric EDTA method. Calcium, magnesium, chlorides, potassium, and sulfates were determined by spectrophotometry.

2.3.2. Heavy Metal Analysis

Copper (Cu), iron (Fe), lead (Pb), manganese (Mn), and nickel (Ni) were determined by Inductively Coupled Plasma Optical Emission Spectrometry (ICP-OES) after acid digestion of the samples (concentrated HNO3, ISO 5667-16 (2017)) [42]. The ICP-OES instrument used was an Agilent 5110 ICP-OES (Agilent Technologies, Santa Clara, CA, USA). EPA method 6010D (2018) [43] was used. These specific metals were selected based on their environmental relevance as common aquatic pollutants and their potential ecotoxicological impact in similar wetland ecosystems.

2.3.3. Microbiological Analyses

To assess fecal contamination, total coliforms (TC), fecal coliforms (FC), and fecal streptococci (FS) were enumerated using the most probable number (MPN) method. All analyses were conducted using specific culture media and incubation conditions as follows: total coliforms were cultured in lactose broth with bromocresol purple and incubated for 24 to 48 h at 37 °C (ISO 9308-2:2012) [44]; for fecal coliforms, brilliant green bile broth with Durham tubes was utilized, with incubation for 24 to 48 h at 44 °C (ISO 9308-3:1998) [45]; and fecal streptococci were cultured on EVA Litsky medium and incubated at 37 °C for 24 h (ISO 7899-2000) [46].

2.4. Water Quality Index (WQI) Calculation

The Water Quality Index (WQI) was calculated to provide a comprehensive assessment of water quality in Lakes Tonga and Oubeira. This index synthesizes multiple parameters into a single value, facilitating comparison across spatial and temporal scales. The methodology for WQI calculation follows a weighted arithmetic mean approach.
A total of 27 parameters (pH, EC, TSS, NO3, NH4+, PO43−, DO, Ca2+, K+, COD, BOD5, Copper, Iron, Lead, Manganese, Nickel, Turbidity, NO2, OM, TH, Mg2+, Cl, SO42−, Total Bacteria, Total Coliforms, Fecal Coliforms, Fecal Streptococci) were included. For each parameter, a standard value (Si) was defined based on the Objectives of Quality of Surface and Groundwater intended for the Potable Water Supply of the Population from the Official Gazette of the Algerian Republic 34 N°, 19 June 2011, supplemented by WHO Guidelines for Drinking-water Quality [47] or WHO Guidelines for Recreational Water Quality, particularly for parameters where Algerian official norms were not directly applicable or were considered too permissive for ecological assessment. Each parameter was assigned a weight (wi) from 1 to 5, reflecting its relative importance and potential impact.
The WQI calculation involves several steps for each monthly sample:
Quality Rating Scale (qi): Calculated for each parameter using
qi = (Ci/Si) ∗ 100
For pollutants (where Ci is the observed concentration and Si is the standard value). For dissolved oxygen (DO) and temperature (TH, formerly ‘TH (°F)’), where lower/higher values (respectively) indicate poorer quality relative to the ideal/maximum: qi_DO = (Si_DO/Ci_DO) ∗ 100 and qi_TH = (Ci_TH/Si_TH) ∗ 100 if Ci_TH > Si_TH else 1. For pH, qi_pH = (Ci_pH/9) ∗ 100 if Ci_pH > 9, qi_pH = (6.5/Ci_pH) ∗ 100 if Ci_pH < 6.5, else 1 if within the acceptable range (6.5–9).
Relative Weight (Wi): Determined as
Wi = wi/Σwi,
where Σwi is the sum of all weights.
Sub-Index (SIi): Calculated as
SIi = Wi ∗ qi.
Overall WQI: Computed as
WQI = ΣSIi.
The resulting WQI values are classified into five categories: Excellent (<25), Good (25–50), Moderate (50–100), Poor (100–150), and Very Poor (≥150) quality, facilitating intuitive interpretation.

2.5. Statistical Analysis

Data were processed using XLSTAT 2016 software (Addinsoft, Paris, France) and JASP statistical software (Version 0.19.3.0). A one-way analysis of variance (ANOVA) was performed to determine the influence of the sampling site (Tong.1, Tong.2, Oub.1, Oub.2) and month on water quality parameters. The Shapiro–Wilk test (α = 0.05) verified the normality of the data for each group. Levene’s test (α = 0.05) was used to check for homogeneity of variances. For parameters meeting these assumptions, Tukey HSD post hoc tests were performed to identify specific pairwise differences. For data violating ANOVA assumptions (non-normal distribution or heterogeneous variances), the non-parametric Kruskal–Wallis test was used, followed by Dunn’s post hoc test (with Bonferroni correction) for pairwise comparisons. Principal Component Analysis (PCA) was performed to identify relationships between parameters and visualize their distribution. Boxplot analysis was used to visually compare distributions between stations. The level of statistical significance was consistently set at p < 0.05 for all tests. All bar chart figures illustrating spatio-temporal variations were generated using R statistical software (Version 4.4.3) to ensure appropriate scaling and clarity.

3. Results

This study conducted an integrated spatio-temporal assessment of water quality in Lakes Tonga and Oubeira, two sensitive Ramsar-designated ecosystems within El Kala National Park (Algeria). The analysis combined physico-chemical, microbiological, and heavy metal data, collected monthly for one year (September 2022–August 2023) from two distinct sites in each lake. Statistical analysis (ANOVA, Kruskal–Wallis test, PCA, Boxplots) identified the main spatial and temporal pollution trends. This section presents the results of this evaluation, structured into three main parts: physico-chemical and microbiological characterization of the waters, multivariate statistical analyses, and exceedances of water quality standards.

3.1. Physico-Chemical and Microbiological Characterization of Lakes Tonga and Oubeira

This section presents the spatio-temporal evolution of key physico-chemical, microbiological, and heavy metal parameters, illustrating seasonal variations across the study sites.

3.1.1. Physico-Chemical Parameters

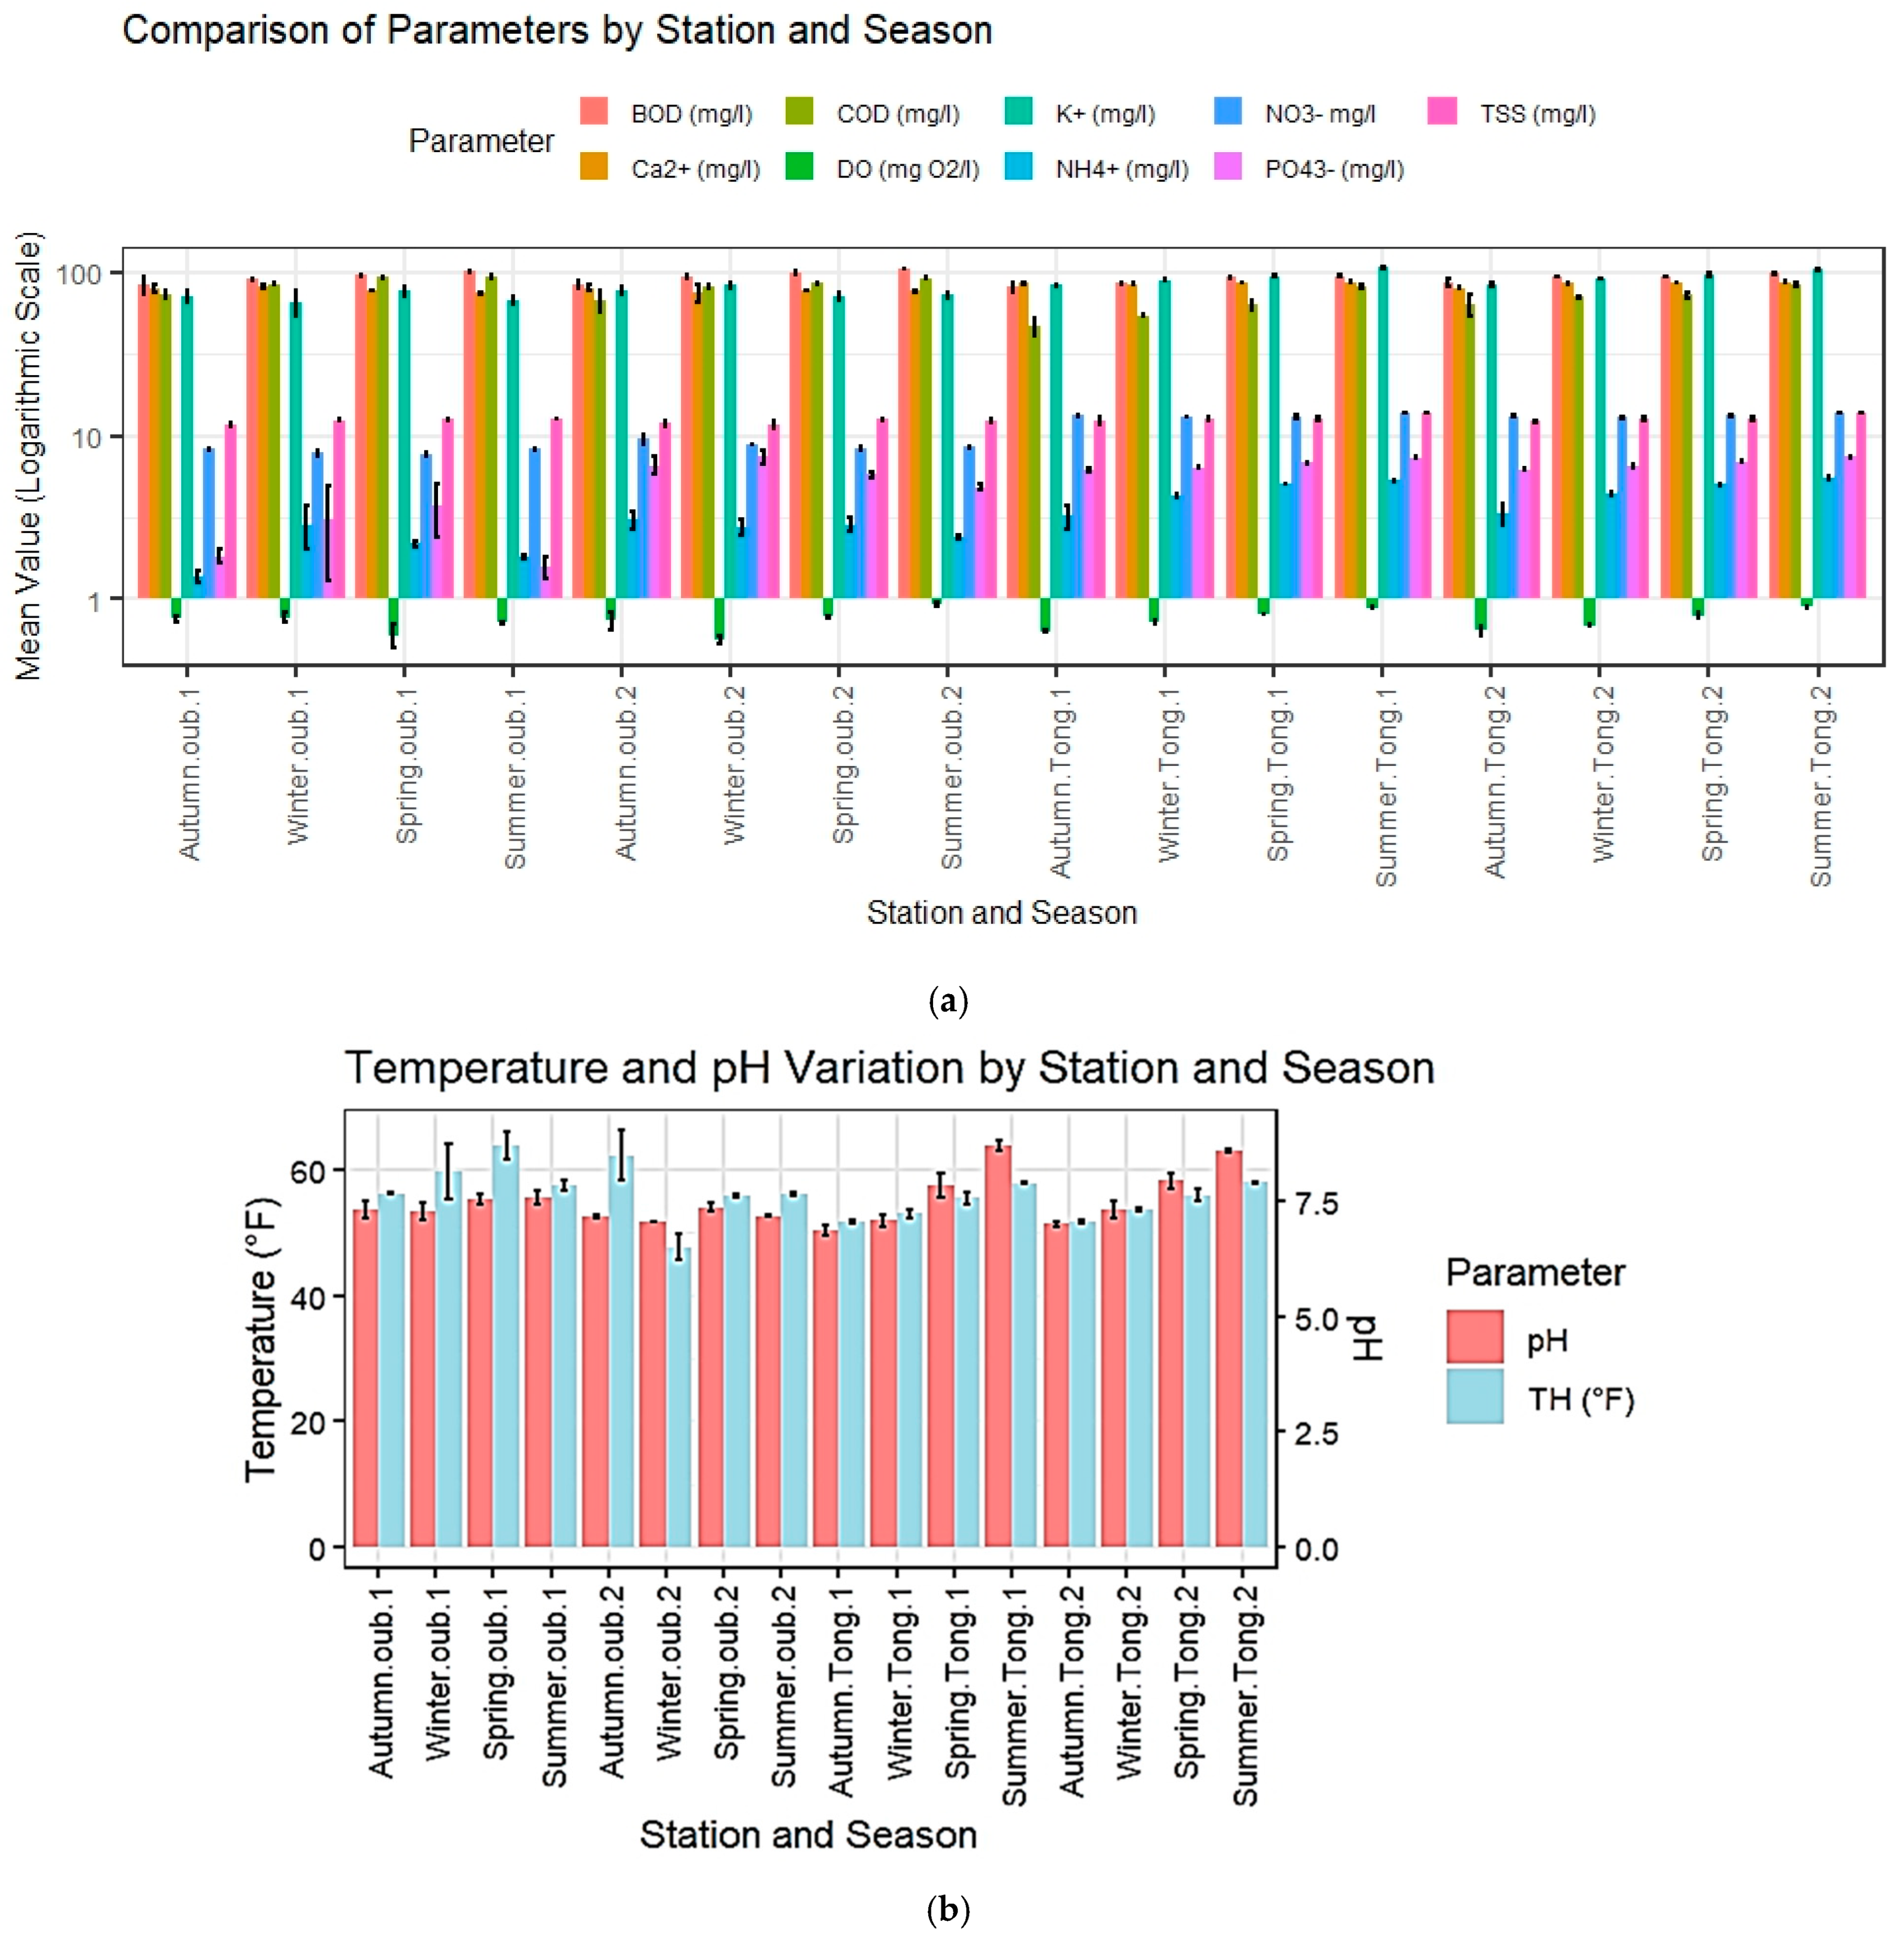
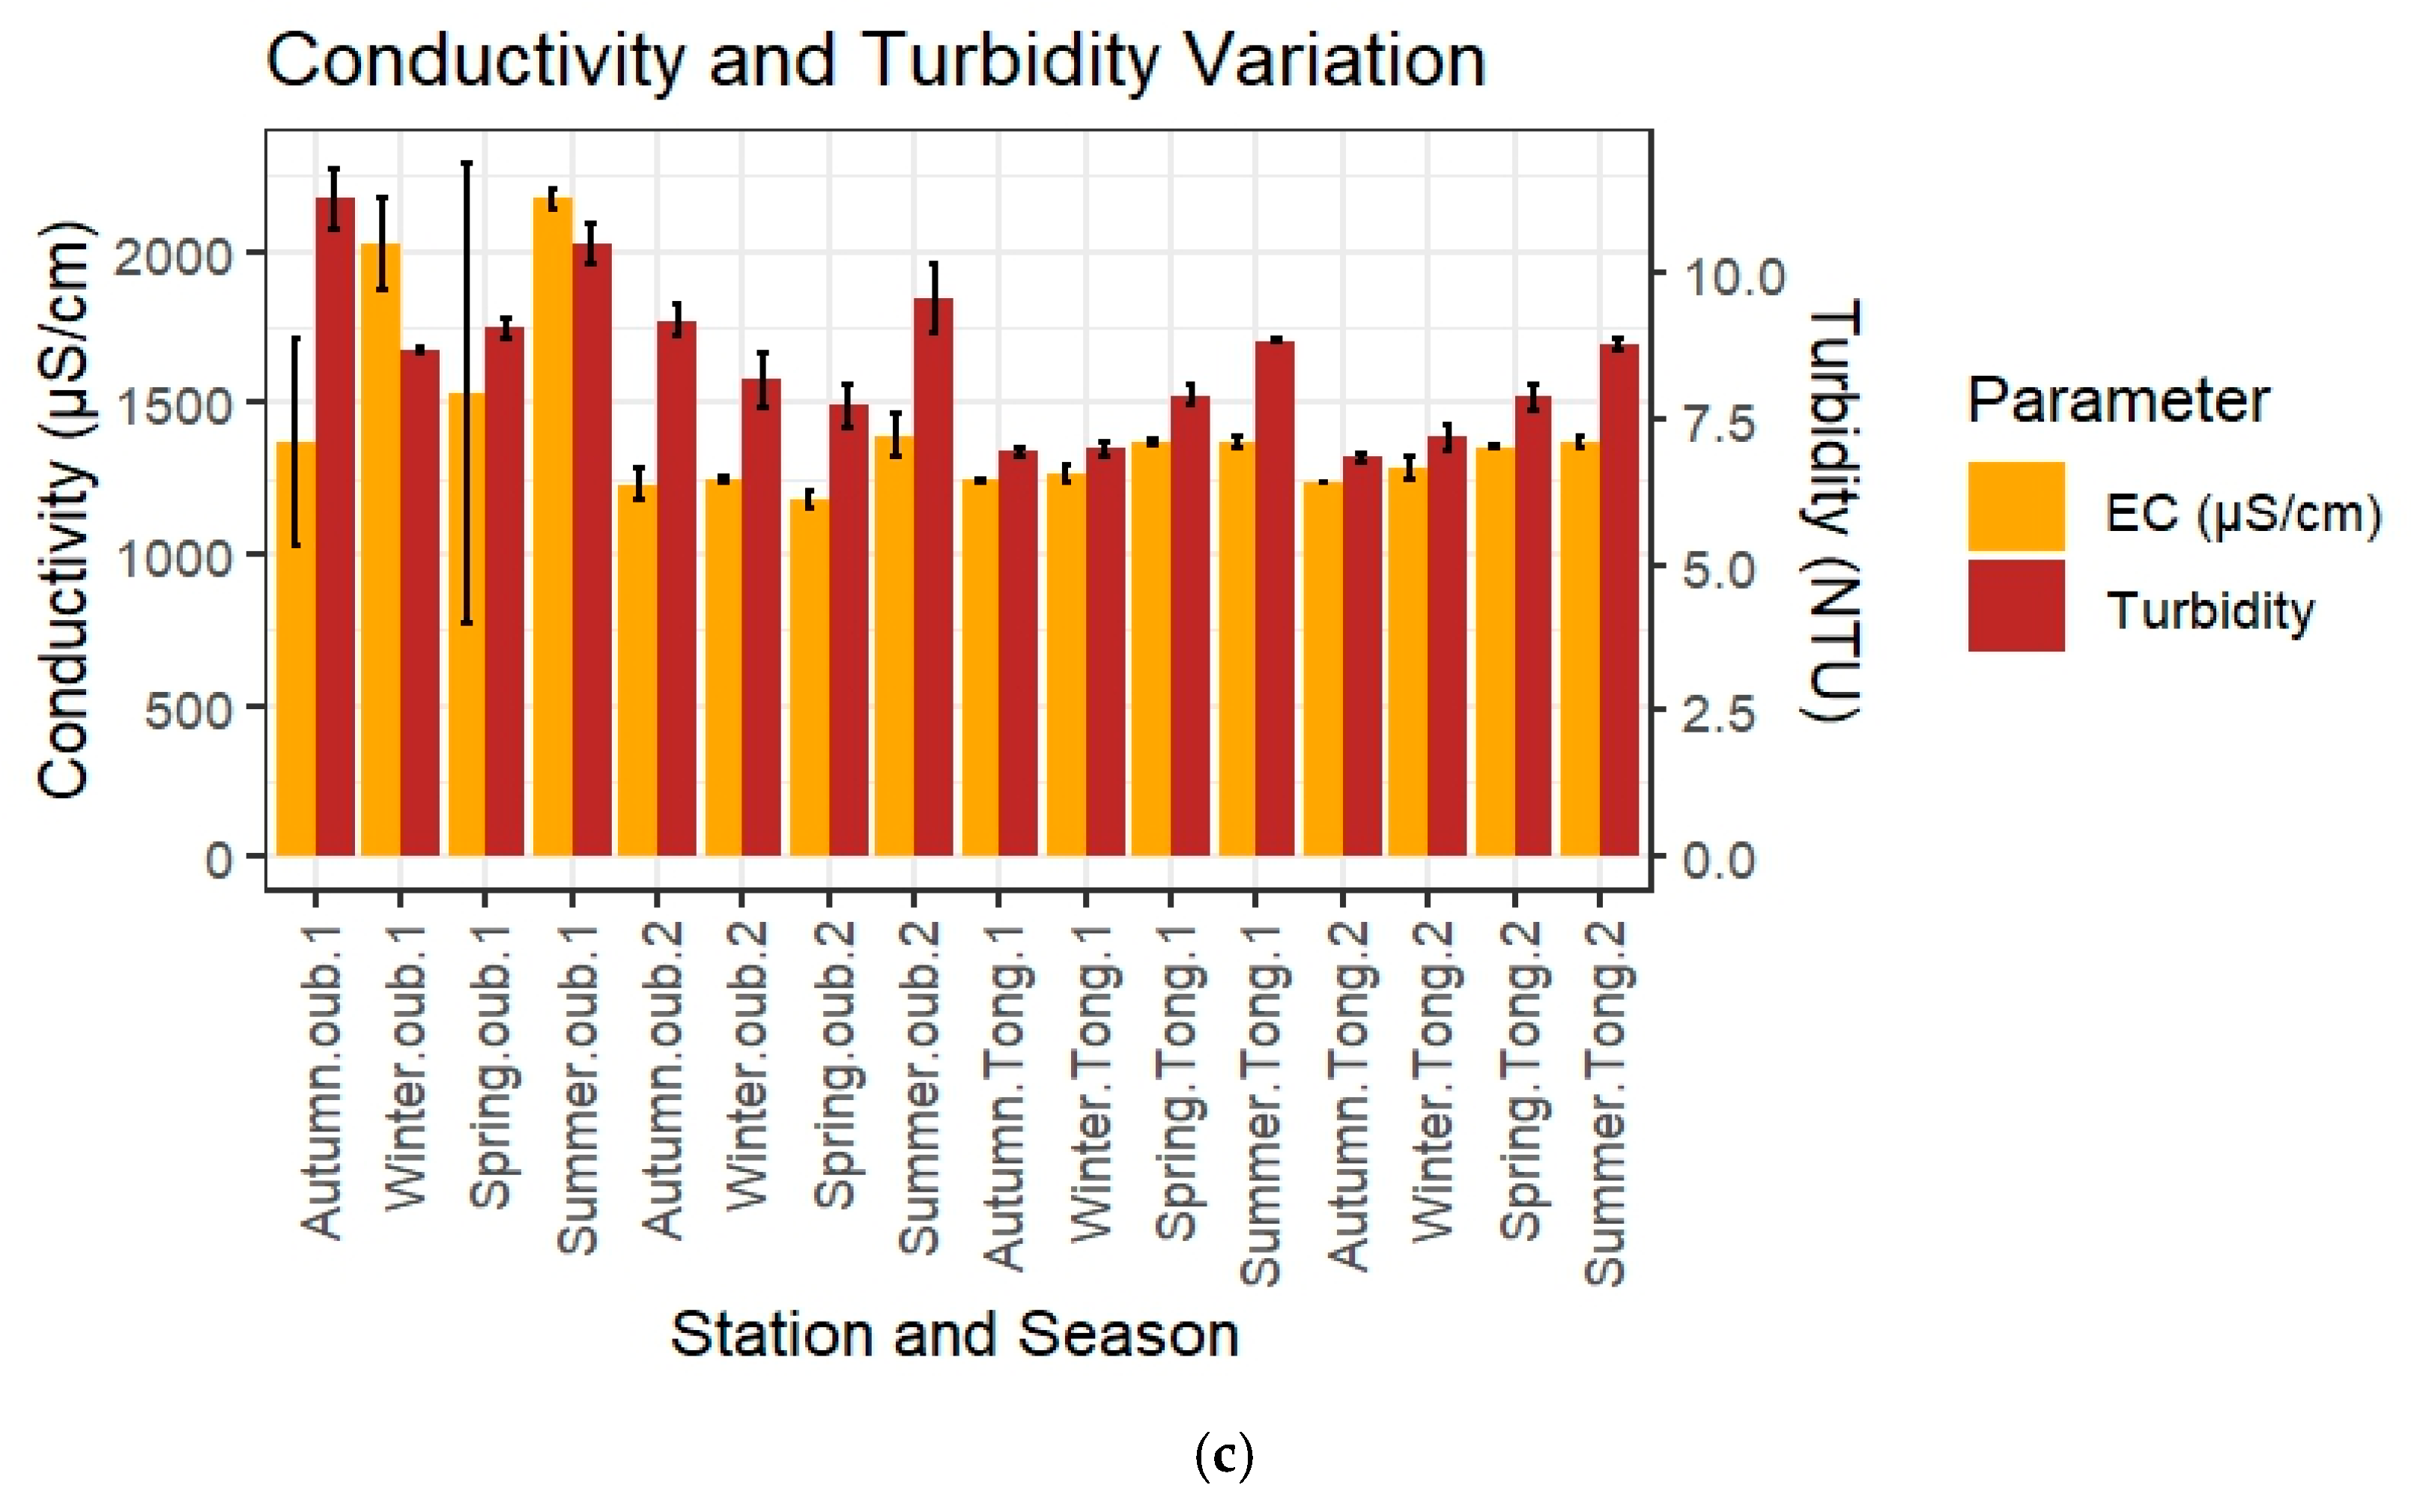
Figure 2a–c illustrate the spatio-temporal evolution of several key physico-chemical parameters in Lakes Tonga and Oubeira, for the four sampling stations and the four seasons. To ensure clarity, given the wide range of values, parameters are presented across three figures, often utilizing logarithmic scales or dual y-axes for optimal visualization.
Regarding the major physico-chemical parameters (BOD5, COD, K+, NO3, TSS, Ca2+, DO, NH4+, PO43−) displayed on a logarithmic scale in Figure 2a, visual inspection reveals distinct spatio-temporal patterns. Notably, nitrate (NO3) concentrations are consistently higher in Lake Tonga (stations Tong.1 and Tong.2) compared to Lake Oubeira for all seasons, suggesting a significant impact of nitrate inputs. Ammonium (NH4+) levels, though lower than nitrates, show a similar tendency with slight increases during Summer in both lakes. Phosphates (PO43−) exhibit a more complex distribution, with slightly higher levels in Winter and Spring across both lakes, and a subtle decrease in Summer and Autumn. Lake Oubeira appears to have globally slightly higher phosphate levels than Lake Tonga. Dissolved Oxygen (DO) levels are generally low across both lakes. For organic load indicators, COD and BOD5, Figure 2a indicates parallel seasonal variations, with concentrations tending to increase during the summer period in both lakes. Lake Oubeira generally presents slightly higher COD and BOD5 levels than Lake Tonga, particularly during the Summer. Calcium (Ca2+) and Potassium (K+) show relatively stable concentrations within each station, yet with slightly higher levels observed in Lake Tonga. Total Suspended Solids (TSS) also demonstrate less pronounced seasonal and spatial variability than other parameters.
Figure 2b, focusing on Temperature and pH, reveals clear spatio-temporal dynamics. The temperature exhibits significant seasonal fluctuations, with notably higher values in Summer across all stations, particularly in Lake Tonga. Conversely, Winter months show lower temperatures. The pH, while remaining within an acceptable range (7–8), also displays a slight trend towards increasing values during Summer, more perceptible for the Lake Tonga stations. Lake Oubeira generally shows slightly lower and less variable pH values.
Figure 2c, illustrating Conductivity and Turbidity, highlights pronounced spatio-temporal heterogeneity for these parameters. Electrical conductivity (EC) values are notably higher for the Lake Oubeira stations compared to Lake Tonga across all seasons. Within Lake Oubeira, distinct peaks in EC are observed in Summer and Winter, suggesting periods of increased concentration of dissolved salts. Lake Tonga, in contrast, maintains lower and more stable EC levels throughout the year. Turbidity, despite some fluctuations, is generally low across both lakes and seasons, with values remaining below 20 NTU, indicating relatively clear water.
In conclusion, the visual examination of Figure 2a–c collectively reveal distinct spatial and seasonal trends for the physico-chemical parameters. Electrical conductivity and nutrients (nitrates, ammonium, phosphates) are primarily distinguished by marked spatial variations between Lakes Tonga and Oubeira. In contrast, parameters such as pH, temperature, and turbidity appear more spatially and temporally homogeneous, or show trends across both lakes.

3.1.2. Microbiological Parameters

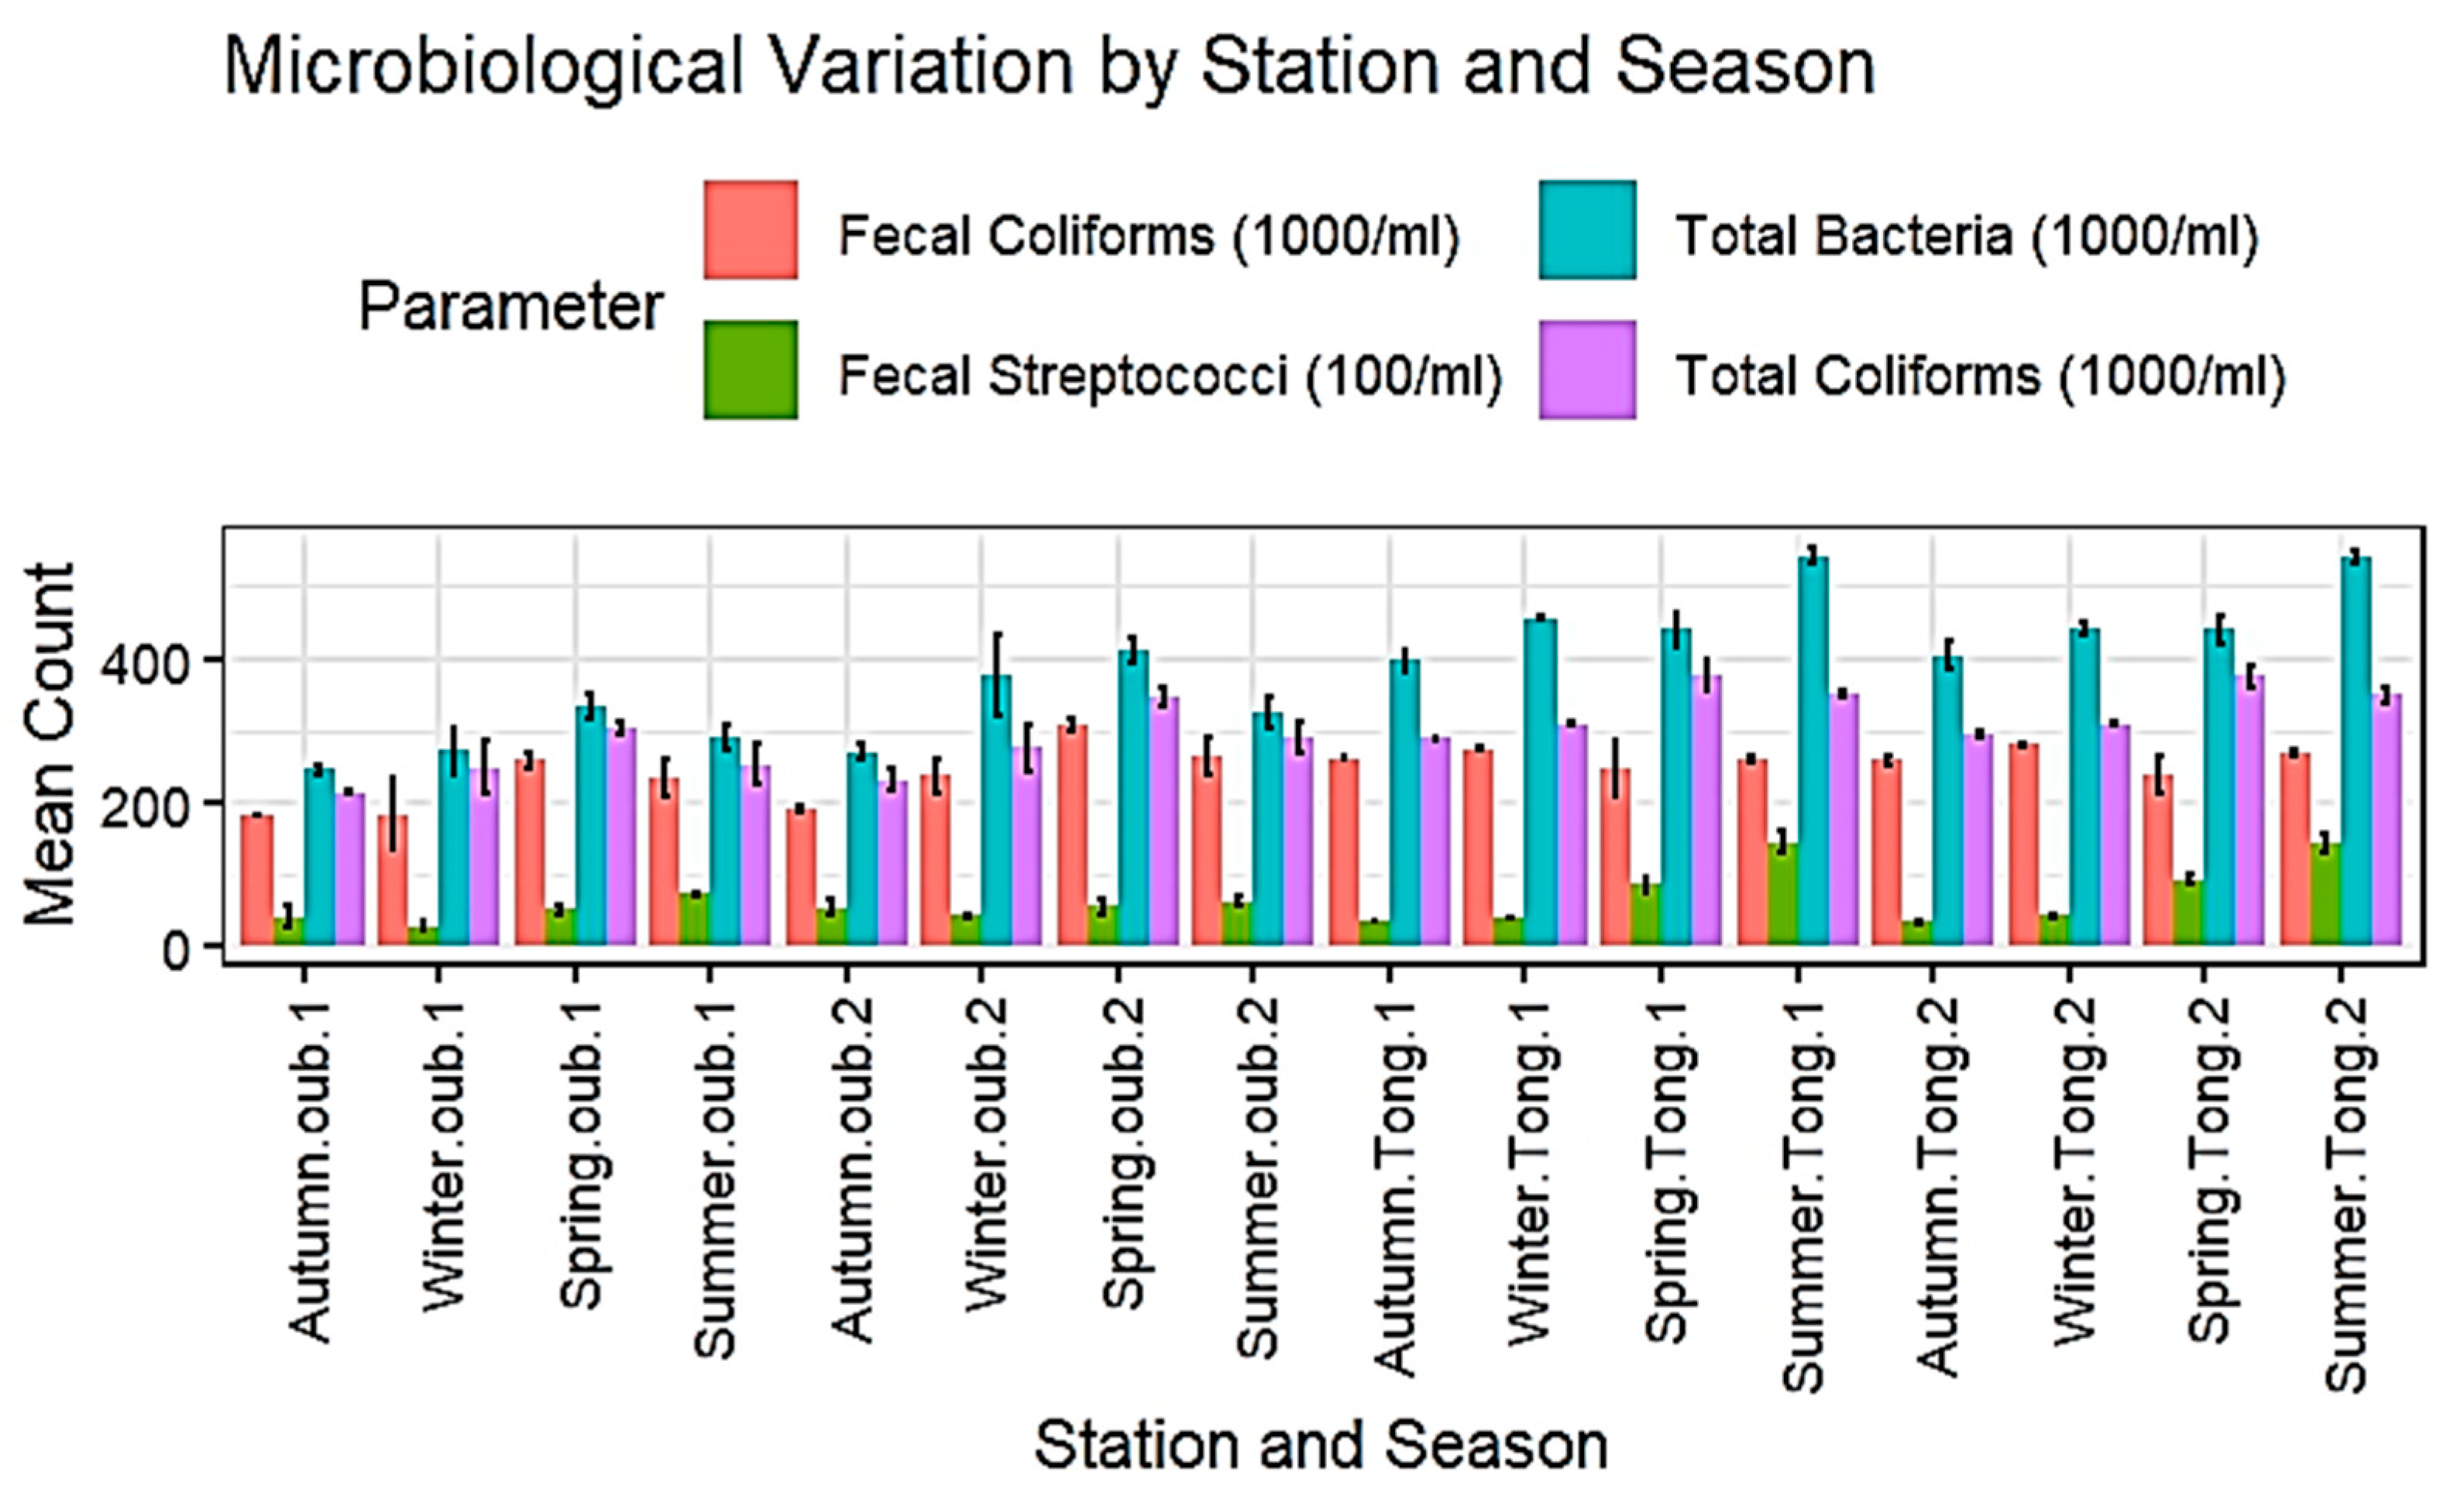
Figure 3 illustrates the spatio-temporal evolution of the concentrations of the main indicators of microbiological contamination in Lakes Tonga and Oubeira, namely Total Bacteria (TB), Total Coliforms (TC), Fecal Coliforms (FC), and Fecal Streptococci (FS). Visual examination of the figure reveals similar trends for Total Bacteria (TB) and Total Coliforms (TC), which appear to be the most abundant microbiological indicators in both lakes.
Comparing the stations, generally higher concentrations of Total Bacteria and Total Coliforms are systematically observed in Lake Tonga (stations Tong.1 and Tong.2) compared to Lake Oubeira (stations Oub.1 and Oub.2) for all seasons. In addition, a clear trend towards increasing TB and TC concentrations during the Summer emerges in both lakes, with peaks that appear more marked for Lake Tonga. Conversely, the lowest levels of Total Bacteria and Total Coliforms appear in Autumn and Winter.
Fecal Coliforms (FC), more specific indicators of fecal contamination, present a seasonal and spatial distribution pattern similar to TB and TC, although their concentrations are globally lower. As with TB and TC, Lake Tonga (stations Tong.1 and Tong.2) exhibits higher FC concentrations than Lake Oubeira (stations Oub.1 and Oub.2) for most seasons. An increase in FC is also noticeable in Summer, particularly in Lake Tonga. It is important to note that, although FC concentrations are lower than those of TB and TC, their presence on the figure significantly confirms fecal contamination in both lakes.
Fecal Streptococci (FS), on the other hand, show globally lower concentrations than the other bacterial indicators, which is consistent with the different scale of the y-axis. Seasonal trends for FS appear less clear than for the other microbiological parameters. However, a slight increase in FS concentrations during the Summer can be perceived in Lake Tonga (stations Tong.1 and Tong.2), similarly to TB, TC, and FC. Lake Tonga also exhibits slightly higher FS levels than Lake Oubeira.
Generally, visual examination of Figure 3 suggests that the concentrations of the different bacterial indicators follow a decreasing order: TB > TC > FC > FS, which is visually consistent with the classification of these bacterial groups. The error bars visible on the figure indicate generalized fecal pollution, probably linked to agricultural activities and domestic discharges [48].

3.1.3. Heavy Metal Concentrations

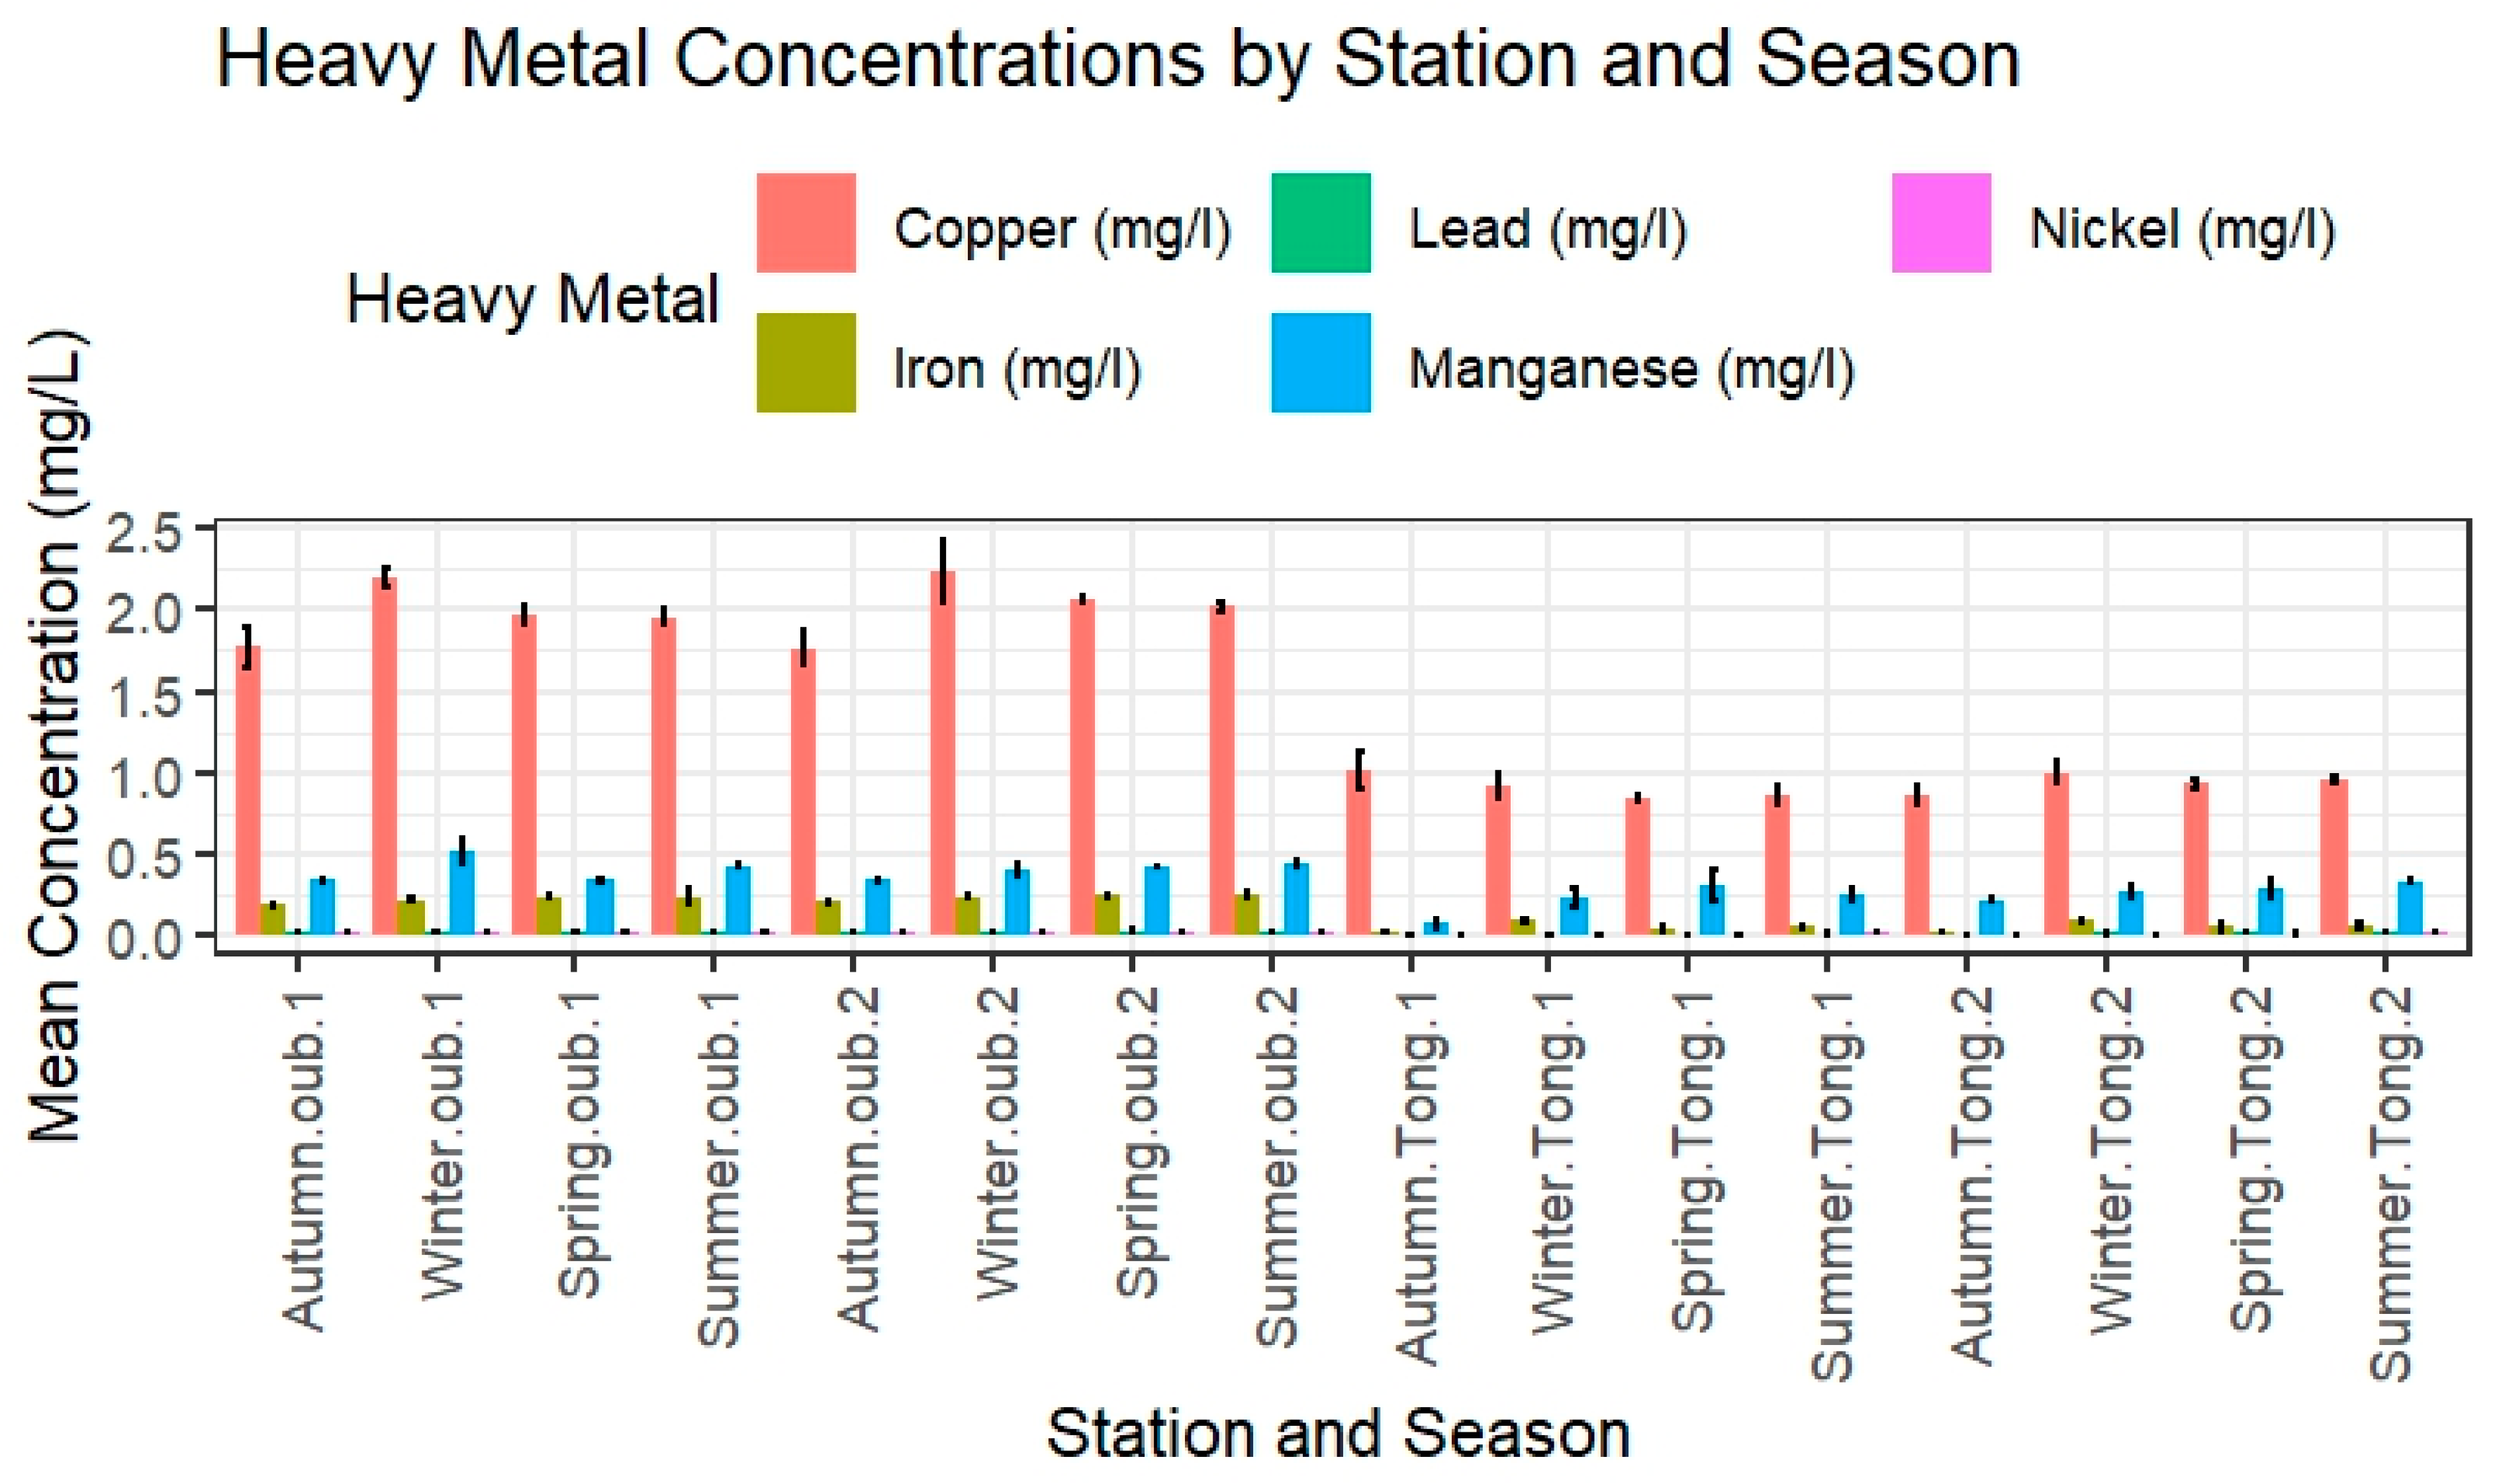
Visual analysis of Figure 4 strikingly confirms the significant spatial heterogeneity in metal contamination, particularly highlighting Lake Oubeira as the most impacted by copper. The Lake Oubeira stations (oub.1 and oub.2) consistently show markedly higher mean copper concentrations (reaching over 2 mg/L in Winter.oub.1 and Spring.oub.1) compared to Lake Tonga stations (Tong.1 and Tong.2), where copper levels remain consistently low (below 1 mg/L). This pronounced difference underscores a critical issue of copper pollution in Lake Oubeira. The consistently high levels of copper in Lake Oubeira raise concerns about potential bioaccumulation in aquatic biota, including fish and wildlife, posing ecotoxicological risks to these sensitive ecosystems.
For Iron (Fe) and Manganese (Mn), concentrations are generally lower than copper but still exhibit higher mean values in Lake Oubeira stations compared to Lake Tonga. Mean Iron concentrations in Oubeira are visibly around 0.2–0.3 mg/L, while in Tonga they are close to 0.05 mg/L. Similarly, mean Manganese concentrations in Oubeira range from 0.3 to 0.5 mg/L, whereas in Tonga they are consistently below 0.2 mg/L.
Conversely, Lead (Pb) and Nickel (Ni) concentrations remain very low across all stations and seasons in both lakes, often approaching detection limits. Their mean concentrations are barely visible on the graph’s primary scale, indicating a relatively minor contribution to overall heavy metal pollution in these specific matrices.
Seasonal trends show some variability for copper, iron, and manganese, with notable peaks or sustained high levels in Lake Oubeira during Autumn, Winter, and Spring for copper, and some fluctuations for iron and manganese throughout the year. The error bars (representing standard deviation) visible on the figure indicate the variability of measurements, suggesting fluctuations in metal concentrations within each station and season.
In summary, Figure 4 clearly illustrates a strong spatial differentiation in heavy metal contamination, with copper being the predominant heavy metal pollutant, especially in Lake Oubeira, while iron and manganese contribute to a lesser extent. Lead and nickel concentrations are comparatively negligible across the study area.

3.2. Statistical Analyses

This section presents the results of multivariate statistical analyses (PCA, Boxplots, and ANOVA) aimed at synthesizing and visualizing the main gradients of spatio-temporal variation in water quality.

3.2.1. Principal Component Analysis (PCA)

To synthesize the complex relationships between water quality parameters and identify the main gradients of spatio-temporal variation, a Principal Component Analysis (PCA) was performed. The first two principal components (F1 and F2) together explain (67.51%) of the total variance in both PCAs, indicating a robust representation of data variability on the factorial planes presented.
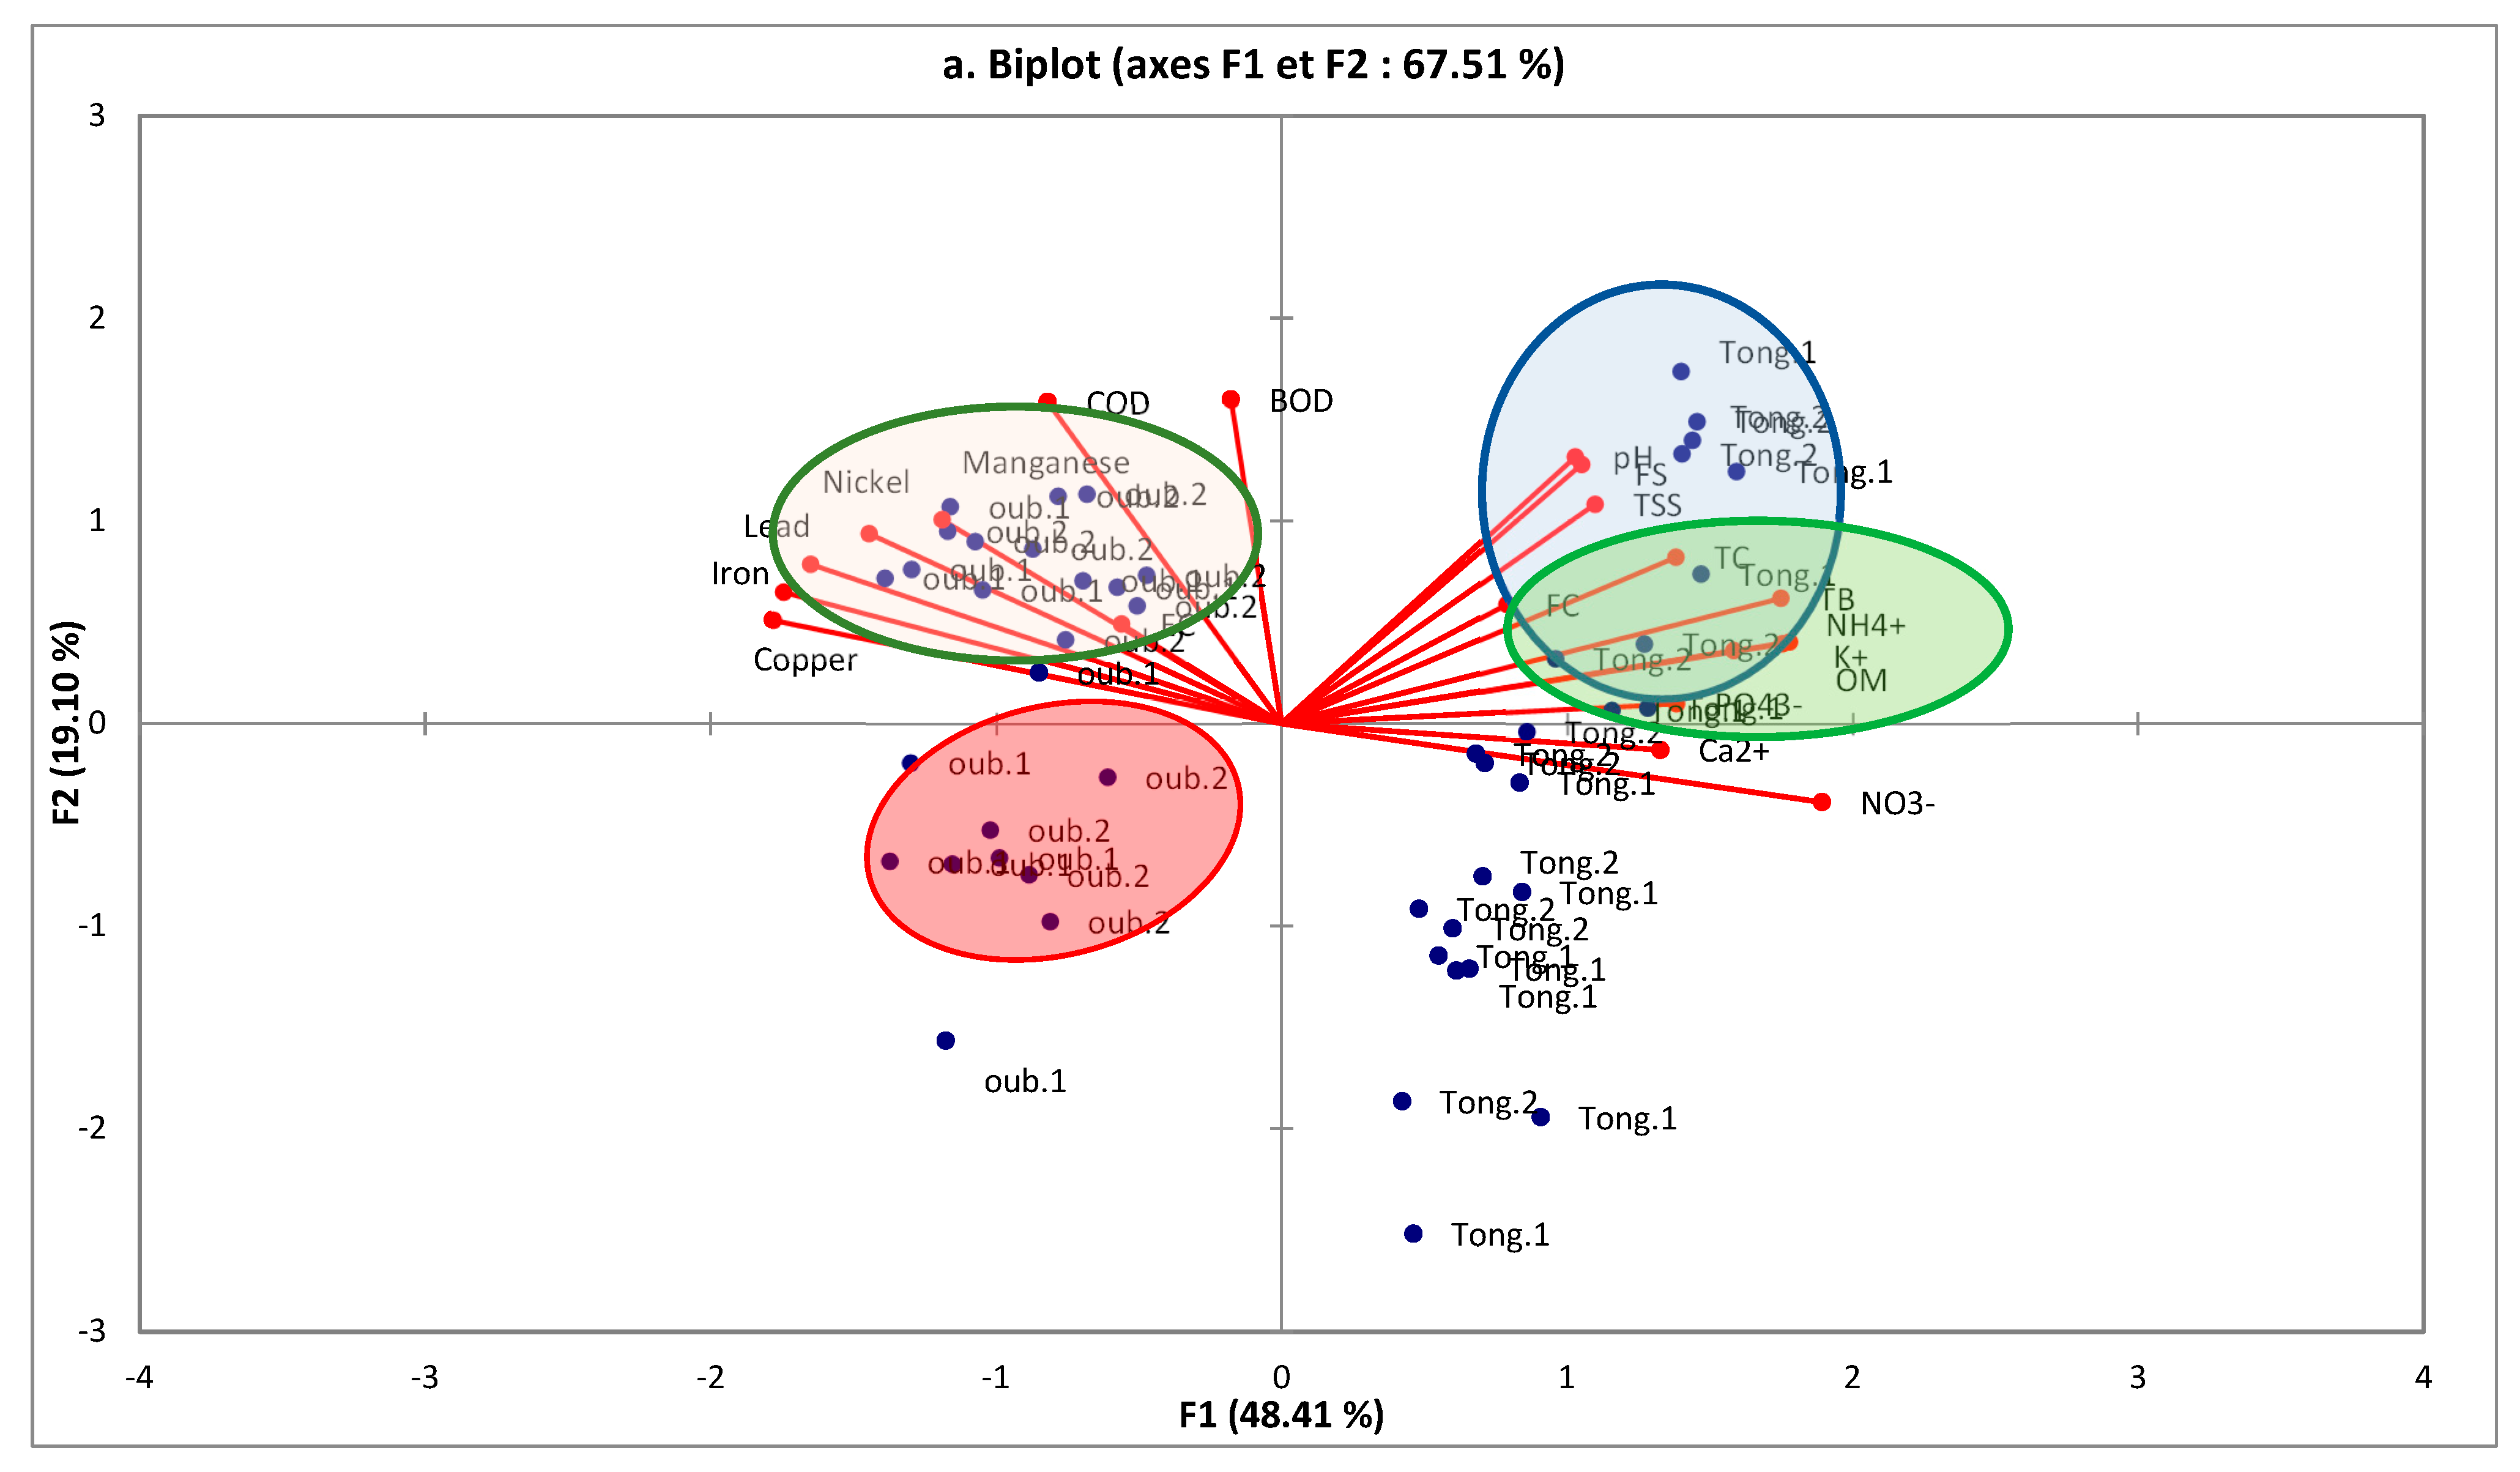
Figure 5a, illustrating the spatial PCA biplot, highlights a clear differentiation between the sampling stations of Lakes Tonga and Oubeira along the F1 axis, which accounts for 48.41% of the variance. Stations from Lake Oubeira (Oub.1 and Oub.2) are predominantly grouped on the negative side of the F1 axis, while Lake Tonga stations (Tong.1 and Tong.2) cluster on the positive side. Visual circles on the biplot (e.g., a dashed red circle for Lake Oubeira and a dashed blue circle for Lake Tonga) further emphasize this distinct spatial separation.
The horizontal F1 axis captures a major environmental gradient. The positive side of F1, associated with Lake Tonga, shows strong positive correlations with parameters indicative of organic, bacterial, and nutrient pollution, including Nitrates (NO3), Calcium (Ca2+), Phosphates (PO43−), Organic Matter (OM), Total Suspended Solids (TSS), and bacterial contamination indicators (Total Bacteria, Total Coliforms, Fecal Coliforms, Fecal Streptococci). This suggests that Lake Tonga’s water quality is predominantly driven by inputs of organic matter, nutrients, and fecal contaminants. For illustration, a discrete green circle around a typical Lake Tonga station (e.g., Tong.1 in Summer) could highlight this predominant organic/bacterial pollution profile.
Conversely, the negative side of the F1 axis, associated with Lake Oubeira, is correlated with heavy metals (Copper, Iron, Lead, Nickel, Manganese), Electrical Conductivity (EC), Chemical Oxygen Demand (COD), and Biochemical Oxygen Demand (BOD5). This indicates that Lake Oubeira is primarily characterized by higher metal pollution and increased mineralization, alongside a distinct organic load. Similarly, a discrete orange circle around a typical Lake Oubeira station (e.g., Oub.2 in Autumn) could visually emphasize this predominant metal pollution profile.
The F2 axis (19.10% of the variance) represents a secondary gradient, possibly associated with finer variations in organic load or other environmental factors within each lake, although its primary explanatory power is less pronounced than F1.
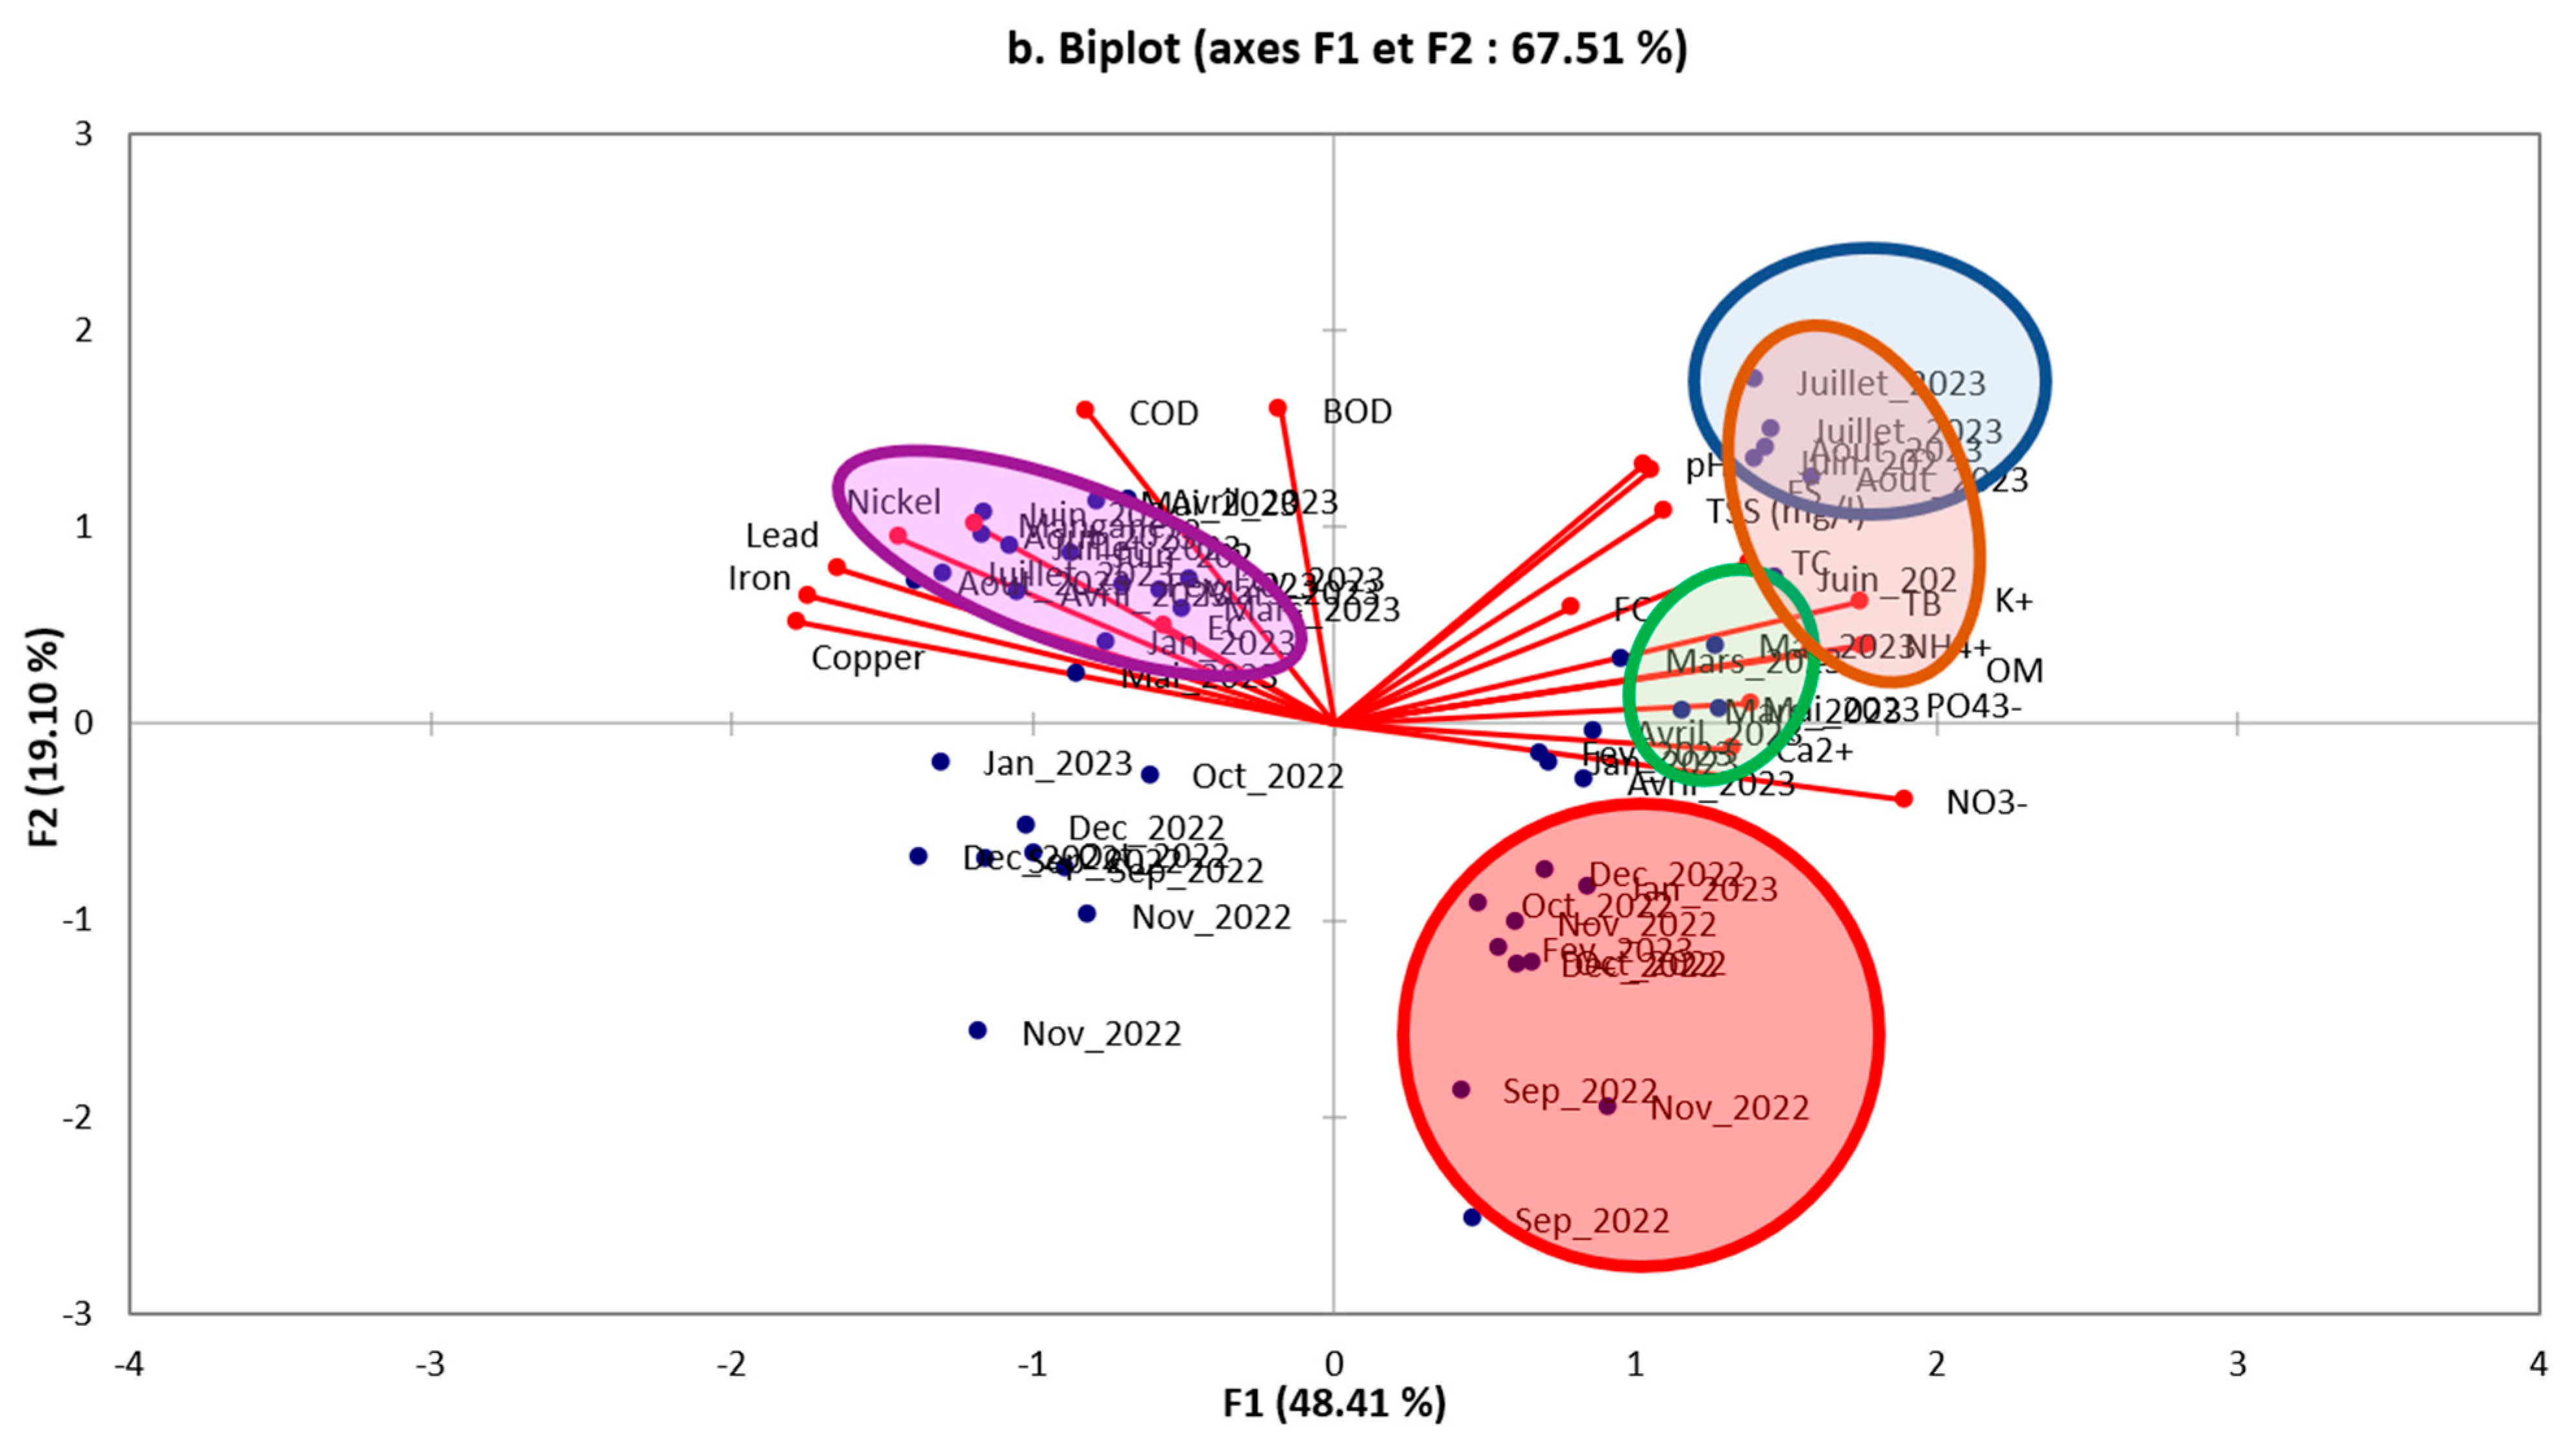
Figure 5b presents the temporal PCA biplot, revealing a dominant seasonal gradient along the F1 axis, which also accounts for 48.41% of the variance. Summer months (June_2023, July_2023, August_2023) consistently group on the positive side of F1, while Autumn and Winter months (September 2022 to February 2023) are situated on the negative side, with Spring months (March_2023 to May_2023) occupying an intermediate position. Visual circles on the biplot (e.g., a dashed blue circle for summer months and a dashed red circle for Autumn/Winter months) effectively highlight these seasonal groupings.
The temporal F1 axis is positively correlated with the same parameters as the positive spatial F1 axis (Nitrates, Calcium, Phosphates, Organic Matter, TSS, Total Bacteria, Total Coliforms, Fecal Coliforms, Fecal Streptococci). This strongly confirms that the summer period is characterized by an increase in organic and bacterial pollution, as well as nutrient concentrations. A discrete brown circle around a typical summer month (e.g., July_2023) could illustrate this summer pollution profile.
The negative side of the temporal F1 axis is consistent with the spatial PCA, associated with heavy metals, Electrical Conductivity, COD, and BOD5. This suggests a relatively more significant influence of these parameters during Autumn and Winter months. A discrete purple circle around a typical autumn/winter month (e.g., December_2022) could visually emphasize this pollution profile.
In conclusion, the combined spatial and temporal PCA analyses (Figure 5a,b) converge to highlight two major pollution gradients: a clear spatial differentiation between Lakes Tonga (predominantly organic/bacterial/nutrient pollution) and Oubeira (predominantly metal pollution), and a strong seasonality, with a notable degradation of water quality, particularly organic and bacterial pollution, observed during the summer period.

3.2.2. Boxplot Analysis

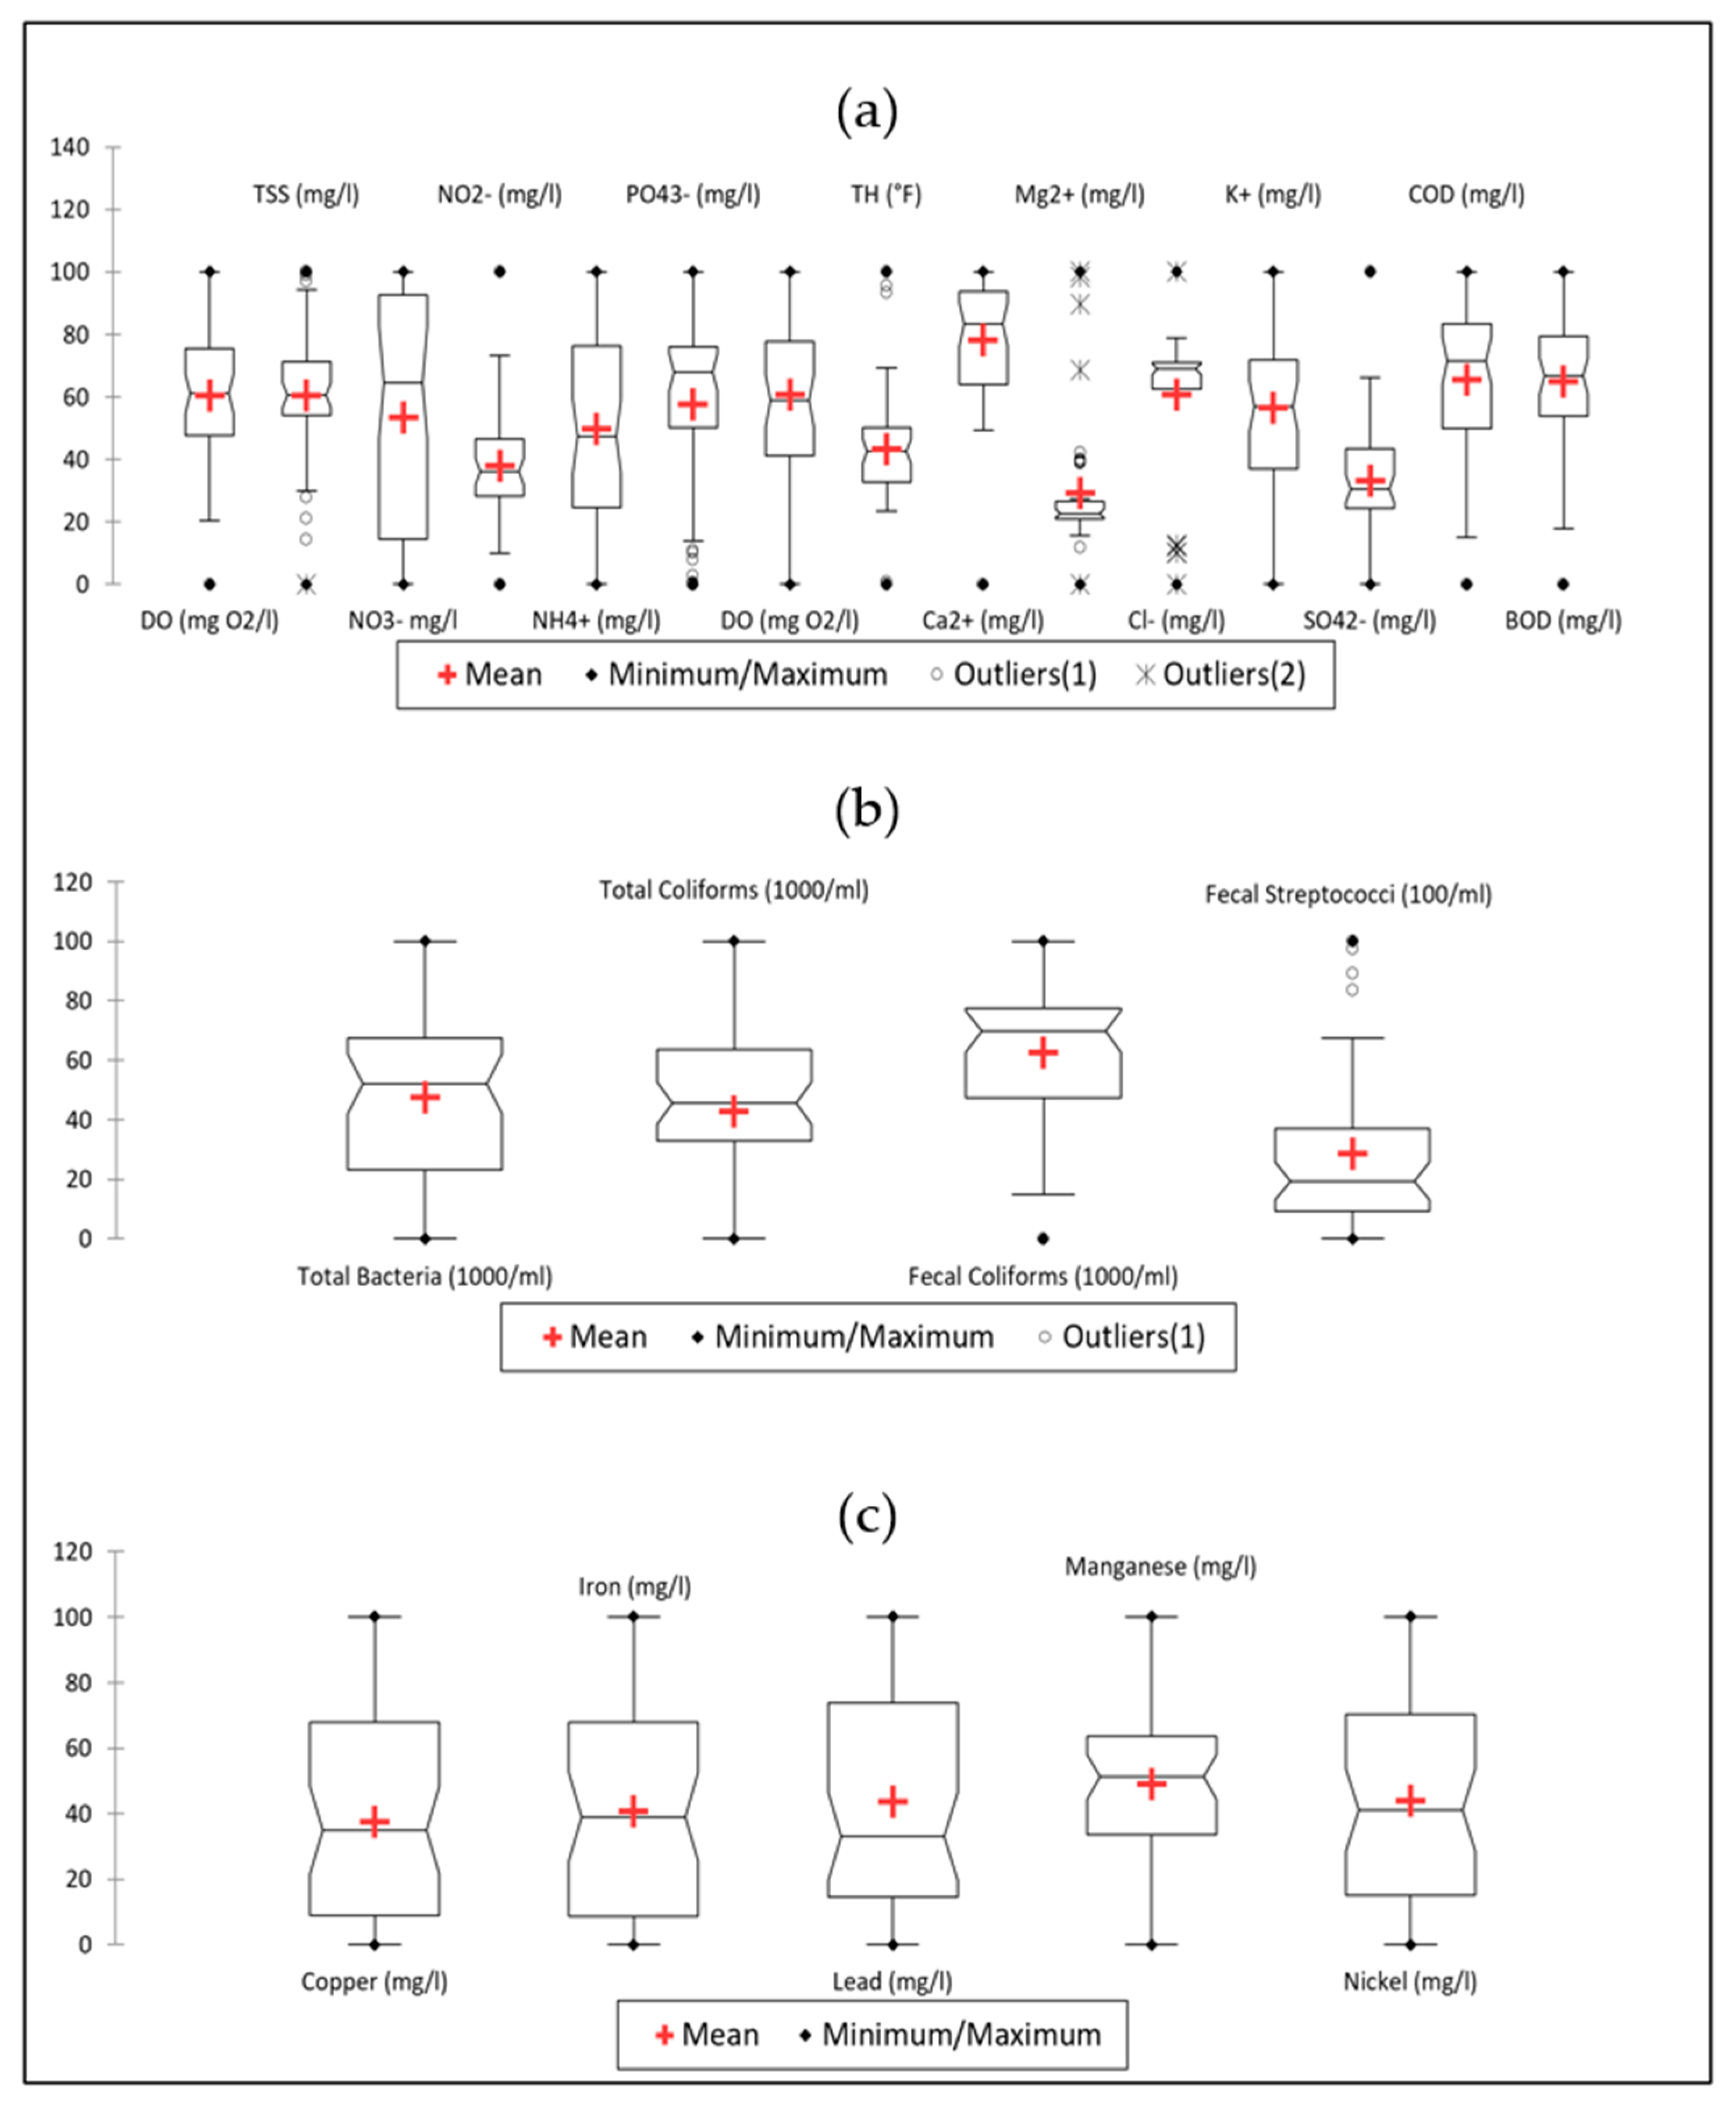
To complement the multivariate analysis by PCA and to examine in more detail the spatial distribution of each water quality parameter, boxplot analyses were performed to visually compare the distributions of parameters between the different sampling stations. Figure 6 presents a multi-panel boxplot illustrating the distribution of physico-chemical, microbiological, and heavy metal parameters across the four stations and four seasons. Each panel allows visualization of medians, data dispersion, and the presence of outliers for individual parameters.
Analysis of the physico-chemical boxplots (Panel a of Figure 6) refines our understanding of spatial distribution. Turbidity and pH demonstrate relatively homogeneous distributions between stations, exhibiting globally low levels and limited variability, suggesting stability in both lakes. In contrast, electrical conductivity (EC) reveals a major spatial heterogeneity, with Lake Oubeira stations (Oub.1 and Oub.2) showing significantly higher medians and variability than those of Lake Tonga (Tong.1 and Tong.2). Notably, Oub.1 presents high outliers, indicating extreme fluctuations. Dissolved Oxygen (DO) is characterized by globally low levels in both lakes, with a slight tendency towards lower medians at Oub.2. Conversely to EC, nitrates (NO3) show markedly higher median concentrations in Lake Tonga, particularly at Tong.1, where variability is also greater. Ammonium (NH4+) follows a similar, though less pronounced, trend with slightly higher medians and variability in Lake Tonga. Phosphates (PO43−) exhibit a more complex distribution; while medians are generally high in both lakes, Oub.2 stands out with particularly high medians and variability, including both high and low outliers. Total hardness (TH), COD, and BOD5 do not display major spatial differences, with their boxplots revealing fairly similar distributions between stations. Finally, magnesium (Mg2+) and potassium (K+) present highly variable distributions with numerous outliers, making precise spatial interpretation challenging, although a slightly lower potassium median is observed at Oub.2.
The analysis of microbiological boxplots (Panel b of Figure 6) confirms significant bacterial contamination in both lakes. High levels of Total Bacteria (TB) and Total Coliforms (TC) are consistently observed across all stations. Fecal Coliforms (FC), although present at lower concentrations, follow a similar pattern, with higher levels in Lake Tonga. Fecal Streptococci (FS) exhibit lower median concentrations and less variability compared to other indicators, but unequivocally denote generalized fecal contamination. Generally, concentrations of these bacterial indicators follow the expected hierarchy: TB > TC > FC > FS.
The heavy metal boxplots (Panel c of Figure 6) highlight significantly higher copper (Cu) contamination in Lake Oubeira compared to Lake Tonga. Lake Oubeira stations show markedly higher medians and variability in copper concentrations. Iron (Fe) and manganese (Mn) follow a similar, albeit less pronounced, trend with slightly higher concentrations in Lake Oubeira. Conversely, lead (Pb) and nickel (Ni) concentrations remain generally very low and comparable between both lakes, often approaching detection limits. These results reinforce the spatial heterogeneity of metal pollution, with Lake Oubeira identified as a critical zone for copper contamination.

3.2.3. Water Quality Index (WQI): Spatio-Temporal Assessment

The Water Quality Index (WQI) was calculated to provide a comprehensive and synthesized assessment of the overall water quality in Lakes Tonga and Oubeira, integrating 27 physico-chemical, microbiological, and heavy metal parameters. This index allows for a simplified interpretation and facilitates comparison across spatial and temporal scales. Table 2 presents the mean seasonal WQI values for each station, along with their standard deviations and corresponding water quality classifications. The classification of WQI values is based on the following categories: Excellent (<25), Good (25–50), Moderate (50–100), Poor (100–150), and Very Poor (≥150) quality.
Analysis of the mean seasonal WQI values (Table 2) reveals that the water quality in Lakes Tonga and Oubeira is predominantly classified as “Moderate quality” (50 ≤ WQI < 100) across all stations and seasons. This classification indicates that the waters are not pristine and present a certain degree of pollution, potentially limiting some uses without adequate treatment.
In terms of spatial differentiation, Lake Oubeira stations (Oub.1 and Oub.2) generally exhibit slightly higher mean seasonal WQI scores (implying slightly worse water quality) compared to Lake Tonga stations (Tong.1 and Tong.2). This difference, while present, is of limited magnitude and does not alter the overall “Moderate quality” classification for most seasons. Notably, the highest mean WQI scores for Lake Oubeira (oub.1: 60.9 ± 4.07, oub.2: 63.3 ± 0.09) are recorded during the Winter and Spring, respectively.
Temporally, the mean seasonal WQI for both lakes shows a general trend of slight increase (indicating a slight degradation in quality) from Autumn towards Summer. For Lake Tonga, WQI values range from 56.0 ± 1.41 in Autumn to 63.1 ± 0.65 in Summer for Tong.1, and from 56.6 ± 1.73 in Autumn to 63.5 ± 0.30 in Summer for Tong.2. A similar, albeit less pronounced, trend of increasing WQI towards Summer is also observed in Lake Oubeira. The associated standard deviations indicate a notable seasonal variability in water quality conditions.
In conclusion, the WQI assessment (Table 2) confirms the presence of chronic and significant pollution in Lakes Tonga and Oubeira, consistently classifying their waters as of “Moderate quality”. These results corroborate the trends observed in the detailed physico-chemical and microbiological analyses, underlining the complex environmental challenges with which these Ramsar wetlands are confronted.

3.2.4. Analysis of Variance (ANOVA)

To statistically evaluate the water quality differences between sampling stations (spatial variations) and between months (seasonal temporal variations), one-way analyses of variance (ANOVA) were performed for each parameter. These analyses considered the sampling site and the sampling month as explanatory factors. Table 3 summarizes the results of these ANOVA analyses, indicating the F statistic, the p-value, and the post hoc groupings (Tukey HSD, p < 0.05) for specific comparisons, which identify precisely which groups differ significantly.
To statistically evaluate the water quality differences, one-way analyses of variance (ANOVA) were performed for each parameter, considering both sampling site and month as explanatory factors. The results revealed a pronounced spatio-temporal heterogeneity in water quality, with statistically significant differences (p < 0.05) observed across a majority of parameters.
Spatially, significant differences (p < 0.05) were found between the four stations for 21 out of 27 analyzed parameters, as detailed in Table 3. Post hoc comparisons (Tukey HSD) confirmed a clear and consistent differentiation between the two lakes. Lake Tonga stations (Tong.1, Tong.2) consistently exhibited significantly higher concentrations of nitrates (NO3), ammonium (NH4+), phosphates (PO43−), organic matter (OM), calcium (Ca2+), and potassium (K+). For instance, NO3 concentrations were markedly higher in Tong.1(A)/Tong.2(A) than in oub.2(B) and oub.1(C). In contrast, Lake Oubeira stations (Oub.1, Oub.2) were characterized by significantly higher concentrations of heavy metals (Copper, Iron, Lead, Manganese, Nickel), electrical conductivity (EC), and chemical oxygen demand (COD). Copper, for example, was unequivocally higher in oub.1(A)/oub.2(A) compared to Tong.1(C)/Tong.2(C). Turbidity and total suspended solids (TSS) also showed significant spatial variations, with Lake Oubeira presenting higher turbidity and oub.2 exhibiting higher TSS concentrations. The temperature also varied significantly across stations, with Tong.1 showing a notably higher temperature than oub.1. Conversely, parameters such as pH, dissolved oxygen (DO), nitrites (NO2), magnesium (Mg2+), chlorides (Cl), sulfates (SO42−), biochemical oxygen demand (BOD5), and fecal streptococci did not exhibit statistically significant spatial differences (p > 0.05) between stations.
Temporally, the ANOVA results also underscored significant seasonal variations (p < 0.05) between months for several key parameters, predominantly those linked to organic load and bacterial contamination, as visually observed in Figure 2a–c and Figure 3. Specifically, BOD5 and COD showed highly significant temporal differences (p < 0.001 and p = 0.002, respectively), with post hoc tests consistently revealing significantly lower values in Autumn/early Winter months compared to significantly higher values in Spring/Summer months. Similarly, bacterial indicators such as Total Coliforms and Fecal Streptococci displayed highly significant seasonal variations (p = 0.004 and p < 0.001, respectively), with significantly higher concentrations in Spring/Summer months. Furthermore, pH and TSS also showed significant seasonal variations (p = 0.002 and p = 0.023, respectively), with temperature confirming a clear seasonal trend. Conversely, turbidity, EC, DO, NO3, NO2, NH4+, PO43−, OM, Ca2+, Mg2+, Cl, K+, SO42−, and all heavy metals (Copper, Iron, Lead, Manganese, Nickel) did not exhibit statistically significant temporal differences (p > 0.05) between months.
In conclusion, the combined spatio-temporal ANOVA analyses, complemented by post hoc tests, reveal a pronounced and complex heterogeneity in water quality within Lakes Tonga and Oubeira. This statistical assessment robustly supports the visual observations, confirming distinct pollution profiles across space (Lake Tonga: nutrients/organic/bacterial; Lake Oubeira: metals/EC/COD) and clear seasonal influences on key organic load, bacterial, pH, and temperature parameters over time.

3.3. Exceedances of Water Quality Standards and Cartographic Representation

3.3.1. Exceedances of Water Quality Standards

To assess the ecological and health risks, the measured concentrations of key pollutants were compared against established water quality standards, including Algerian regulations for surface waters and international guidelines. Table 4 presents a representative summary of the most critical exceedances observed during the study period, highlighting the magnitude and location of these events.
The analysis of exceedances confirms significant contamination in both lakes, with frequent breaches of standards for nutrients, heavy metals, and microbiological indicators.
Regarding eutrophication indicators, nutrient levels frequently surpassed permissible limits, particularly in Lake Tonga. For instance, nitrate (NO3) concentrations at Tong.1 reached 13.75 mg/L in June 2023, exceeding the standard of 10 mg/L. Similarly, ammonium (NH4+) peaked at 5.75 mg/L in August 2023 at Tong.2, well above the 4 mg/L limit. While phosphate (PO43−) concentrations were high in both lakes, the maximum value of 8.66 mg/L was recorded at oub.2 in December 2022, approaching the standard limit of 10 mg/L.
Heavy metal contamination was most prominent in Lake Oubeira. Specifically, copper (Cu) concentrations at oub.2 reached a peak of 2.63 mg/L in February 2023, exceeding the standard of 2.0 mg/L. Lead (Pb) levels also peaked at Oub.2 in May 2023, with a concentration of 0.028 mg/L (standard: 0.05 mg/L). These exceedances highlight a non-negligible ecotoxicological risk associated with metal pollution in Lake Oubeira.
Furthermore, fecal contamination represents a major concern in both lakes, with a clear predominance in Lake Tonga. Concentrations of Total Coliforms frequently exceeded the standard of 100 CFU*1000/mL, reaching a maximum of 560 CFU*1000/mL at Tong.1 in August 2023. Fecal Coliforms also showed numerous exceedances, particularly during the spring and summer periods in Lake Tonga.
In conclusion, the analysis of standard exceedances confirms the presence of chronic and persistent pollution in both lakes. A clear spatial pattern emerges, with Lake Tonga being more vulnerable to nutrient and microbiological contamination, while Lake Oubeira is primarily affected by heavy metal pollution. The summer period was identified as the most critical for nutrient and fecal contamination exceedances, whereas winter showed peaks for certain heavy metals and phosphates.

3.3.2. Cartographic Representation of the Spatial Distribution of Pollutants

The spatial distribution of pollutants, visualized through thematic maps of maximum observed concentrations (Figure 7, Figure 8 and Figure 9), confirms and details the spatial heterogeneity identified by statistical analyses.
Nutrients
Figure 7 present the spatial distribution of the main nutrients analyzed: Nitrates (NO3) (Figure 7a), Ammonium (NH4+) (Figure 7b), Nitrites (NO2) (Figure 7c), and Phosphates (PO43−) (Figure 7d).
This map highlights particularly high nitrate concentrations in Lake Tonga, notably in its western part, where the Tonga 1 station is located. It is in this critical area that the maximum nitrate concentration was measured, reaching 13.75 mg/L at the Tonga 1 station in June 2022. In addition, high maximum concentrations are also observed at the Tonga 2 station in July 2023, with a value of 13.73 mg/L, confirming the general trend towards higher nitrate levels in Lake Tonga. This area of high nitrate concentration in Lake Tonga coincides with a major agricultural area, suggesting a direct link with agricultural runoff. In comparison, Lake Oubeira presents significantly lower nitrate concentrations. The maximum values observed in Lake Oubeira, clearly lower than those of Lake Tonga, are 10.55 mg/L at the Oubeira 2 station in October 2022 and 8.55 mg/L at the Oubeira 1 station in November 2022. These results are consistent with the conclusions of the ANOVA (Table 3), which highlight significantly higher nitrate concentrations in the Lake Tonga stations. Thus, the mapping of the spatial distribution of nitrates visually and quantitatively confirms the major impact of nitrate inputs, probably of agricultural origin, on Lake Tonga, and highlights the heterogeneity of nutrient pollution between the two lakes.
This map (Figure 7b), illustrating the spatial distribution of ammonium (NH4+), reveals a distribution pattern visually similar to that of nitrates, suggesting common pollution sources. Indeed, the map highlights ammonium concentrations also higher in Lake Tonga, particularly near agricultural areas, as for nitrates. The maximum ammonium value measured reaches 5.75 mg/L at the Tonga 2 station in August 2023, in the summer period, highlighting a significant maximum concentration in Lake Tonga. High maximum concentrations are also observed at the Tonga 1 station in July 2023, with a value of 5.47 mg/L, confirming the trend towards higher ammonium levels in Lake Tonga, particularly during the summer period. Conversely, Lake Oubeira presents lower maximum ammonium values, with a maximum of 4.5 mg/L at the Oubeira 1 station in January 2023 and 3.5 mg/L at the Oubeira 2 station in October 2022, indicating an ammonium contamination less pronounced than in Lake Tonga. These visual observations reinforce the hypothesis of contamination of agricultural origin and/or wastewater discharges as the main sources of ammonium in the study area, with a more marked impact on Lake Tonga.
Examination of the spatial distribution map of nitrites (NO2) (Figure 7c) reveals a clearly contrasting situation in terms of maximum values between the two lakes. The stations of Lake Tonga (Tong.1 and Tong.2) are visually characterized by extremely low maximum nitrite values, which are close to the detection limit. In contrast, the station of Lake Oubeira 2 (Oub.2) clearly stands out with a much higher maximum nitrite value, reaching 1.52 mg/L. This maximum value at the Oubeira 2 station visually and significantly exceeds the maximum values observed for all other stations, suggesting a more pronounced nitrite contamination event in this area of Lake Oubeira. The station of Lake Oubeira 1 (Oub.1) also presents a maximum nitrite value visually higher than the stations of Lake Tonga, although less high than the Oub.2 station. It should be noted that the highest maximum nitrite value, observed at the Oubeira 2 station, occurs in December 2022, during the winter period. Thus, the mapping of the spatial distribution of nitrites highlights a marked contrast in terms of maximum values between Lake Tonga, characterized by very low levels, and Lake Oubeira, where significantly higher maximum values are observed, particularly at the Oubeira 2 station.
Figure 7d, illustrating the spatial distribution of phosphates (PO43−), indicates high phosphate concentrations in both lakes, suggesting a diffuse impact from multiple sources. Indeed, the map reveals significant phosphate levels throughout both lakes, without spatial differentiation as marked as for nitrates or electrical conductivity. However, Lake Oubeira appears to exhibit a slightly more significant contamination by phosphates, with the highest absolute maximum value observed at the Oubeira 2 station in December 2022, reaching 8.66 mg/L. Lake Tonga, for its part, reaches slightly lower maximum values, with a maximum of 7.55 mg/L at the Tonga 1 station and 7.63 mg/L at the Tonga 2 station, both observed in August 2023, in the summer period. These observations suggest significant and diffuse contamination by phosphates in both lakes, with a higher punctual peak in Lake Oubeira in the winter period, and persistent high levels in Lake Tonga during the Summer. Thus, the map of spatial distribution of phosphates confirms a generalized contamination by this nutrient in the two lacustrine ecosystems, highlighting a risk of diffuse eutrophication potentially linked to multiple sources, such as wastewater and agricultural activities.
Heavy Metals
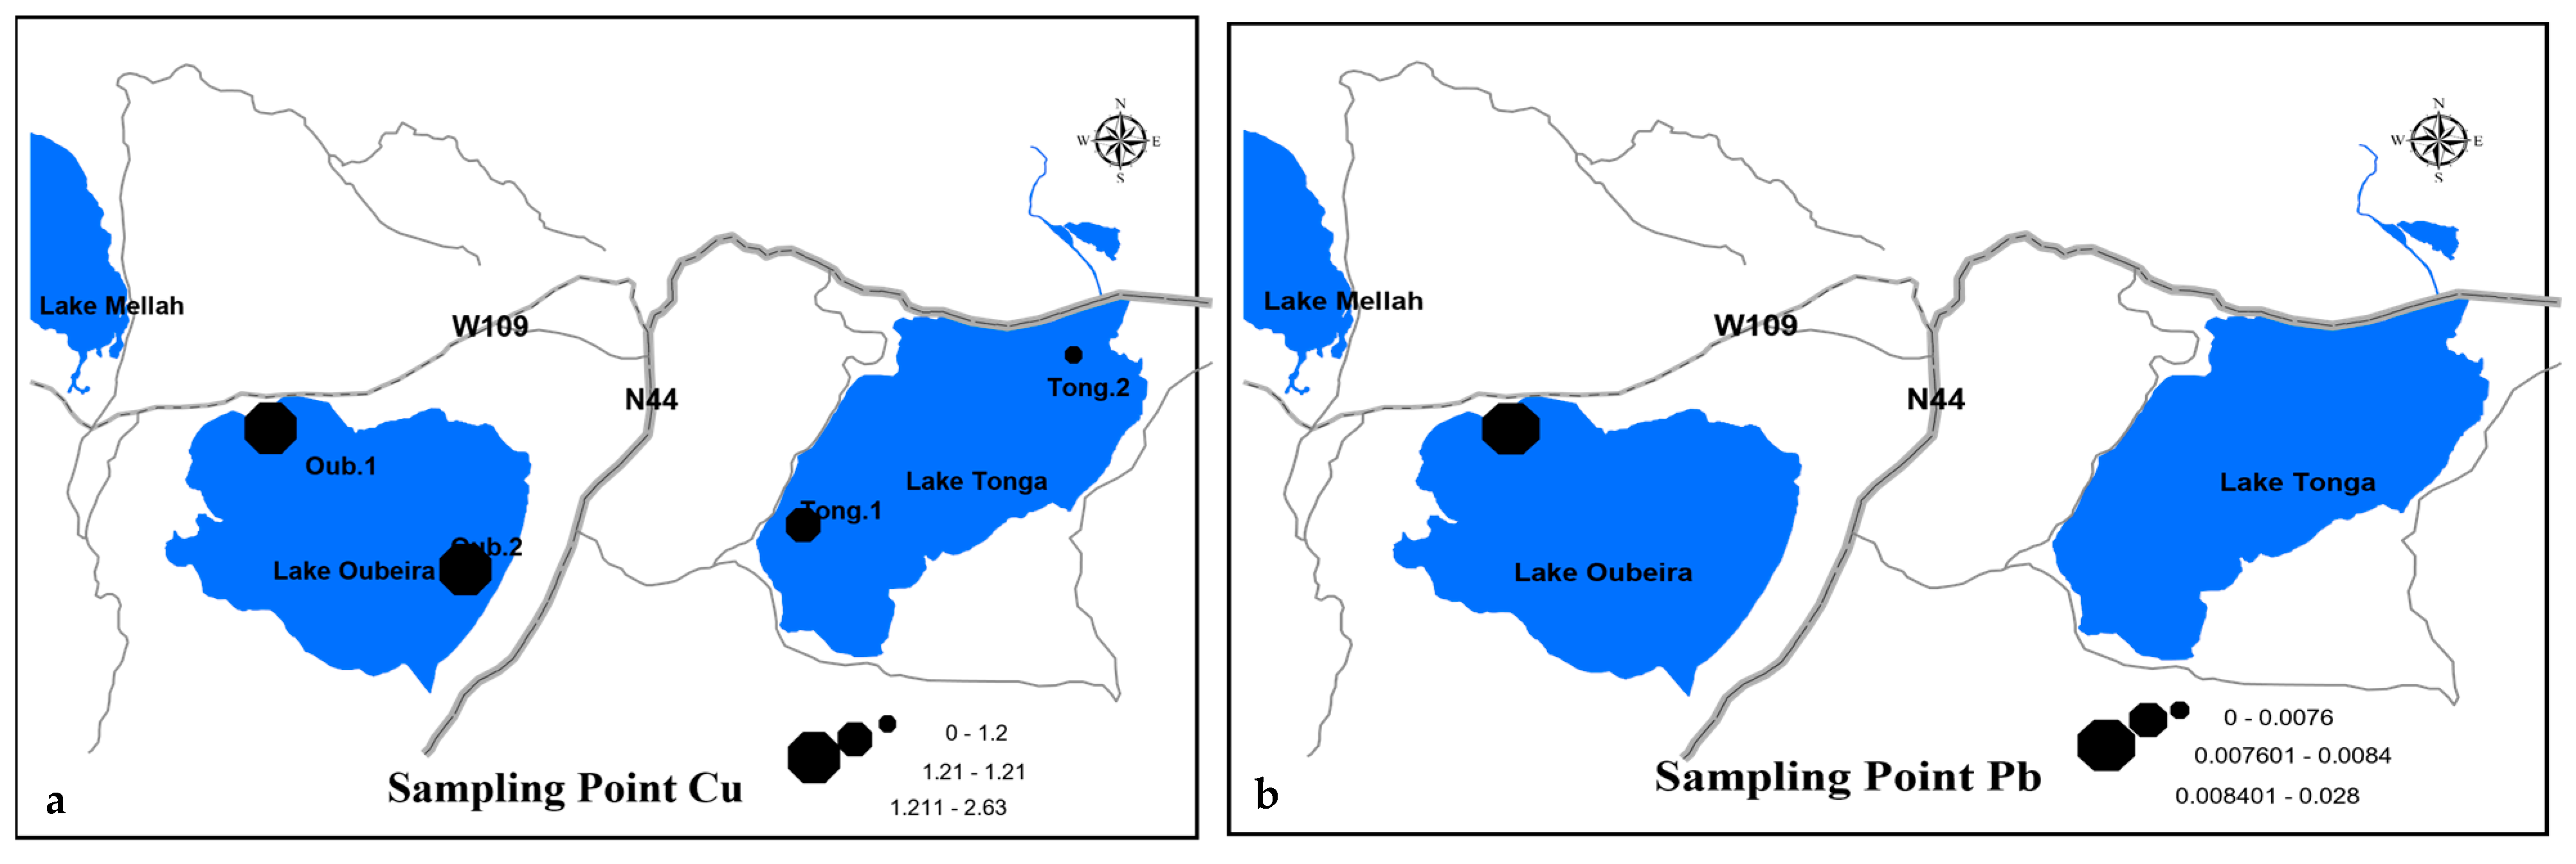
Figure 8 groups the maps of spatial distribution of the main heavy metals identified as concerning in this study: Copper (Figure 8a), and Lead (Figure 8b).
Analysis of the maximum copper values, visualized in Figure 8a, strikingly confirms the more significant contamination of Lake Oubeira by this heavy metal. Indeed, Figure 8a highlights areas of Lake Oubeira presenting maximum copper values clearly higher than those of Lake Tonga. The stations of Lake Oubeira stand out with a peak of particularly high maximum copper concentration at the Oubeira 2 station in February 2023, reaching 2.63 mg/L. The Oubeira 1 station also presents a high maximum value, of 2.33 mg/L, also observed in February 2023, confirming the significant copper contamination in Lake Oubeira. In comparison, the areas of Lake Tonga show in Figure 8a maximum copper values much lower. The peaks of maximum copper concentration in Lake Tonga remain clearly lower, with a maximum value of 1.2 mg/L at the Tonga 1 station in October 2022 and 1.12 mg/L at the Tonga 2 station in February 2023. Thus, the analysis of maximum copper values, visualized on the map of spatial distribution (Figure 8a), demonstrates significantly more pronounced copper contamination in Lake Oubeira than in Lake Tonga.
Examination of Figure 8b, representing the spatial distribution of lead (Pb), also highlights lead levels slightly higher in Lake Oubeira, although the concentrations remain globally low in both lakes. Indeed, Figure 8b shows that the areas of Lake Oubeira present lead concentrations slightly higher than those of Lake Tonga. The map reveals a peak of maximum lead concentration at the Oubeira 2 station, consistent with the maximum value of 0.028 mg/L observed at this station in May 2023. The Oubeira 1 station also appears with lead concentrations higher than the stations of Lake Tonga, in accordance with the maximum value of 0.024 mg/L measured at this station in June 2022. In comparison, the areas of Lake Tonga show on Figure 8b lead levels lower, with maximum values of 0.0076 mg/L at the Tonga 1 station in August 2023 and 0.0084 mg/L at the Tonga 2 station in January 2023. Thus, the analysis of Figure 8b, the map of spatial distribution of lead, suggests a slight tendency to lead levels a little higher in Lake Oubeira, particularly at stations Oubeira 1 and Oubeira 2, with a more marked maximum concentration at station Oubeira 2.
Microbiological Contamination Indicators
Figure 9 groups the maps of spatial distribution of the main indicators of microbiological contamination: Total Coliforms (Figure 9a), Fecal Coliforms (Figure 9b), and Fecal Streptococci (Figure 9c).
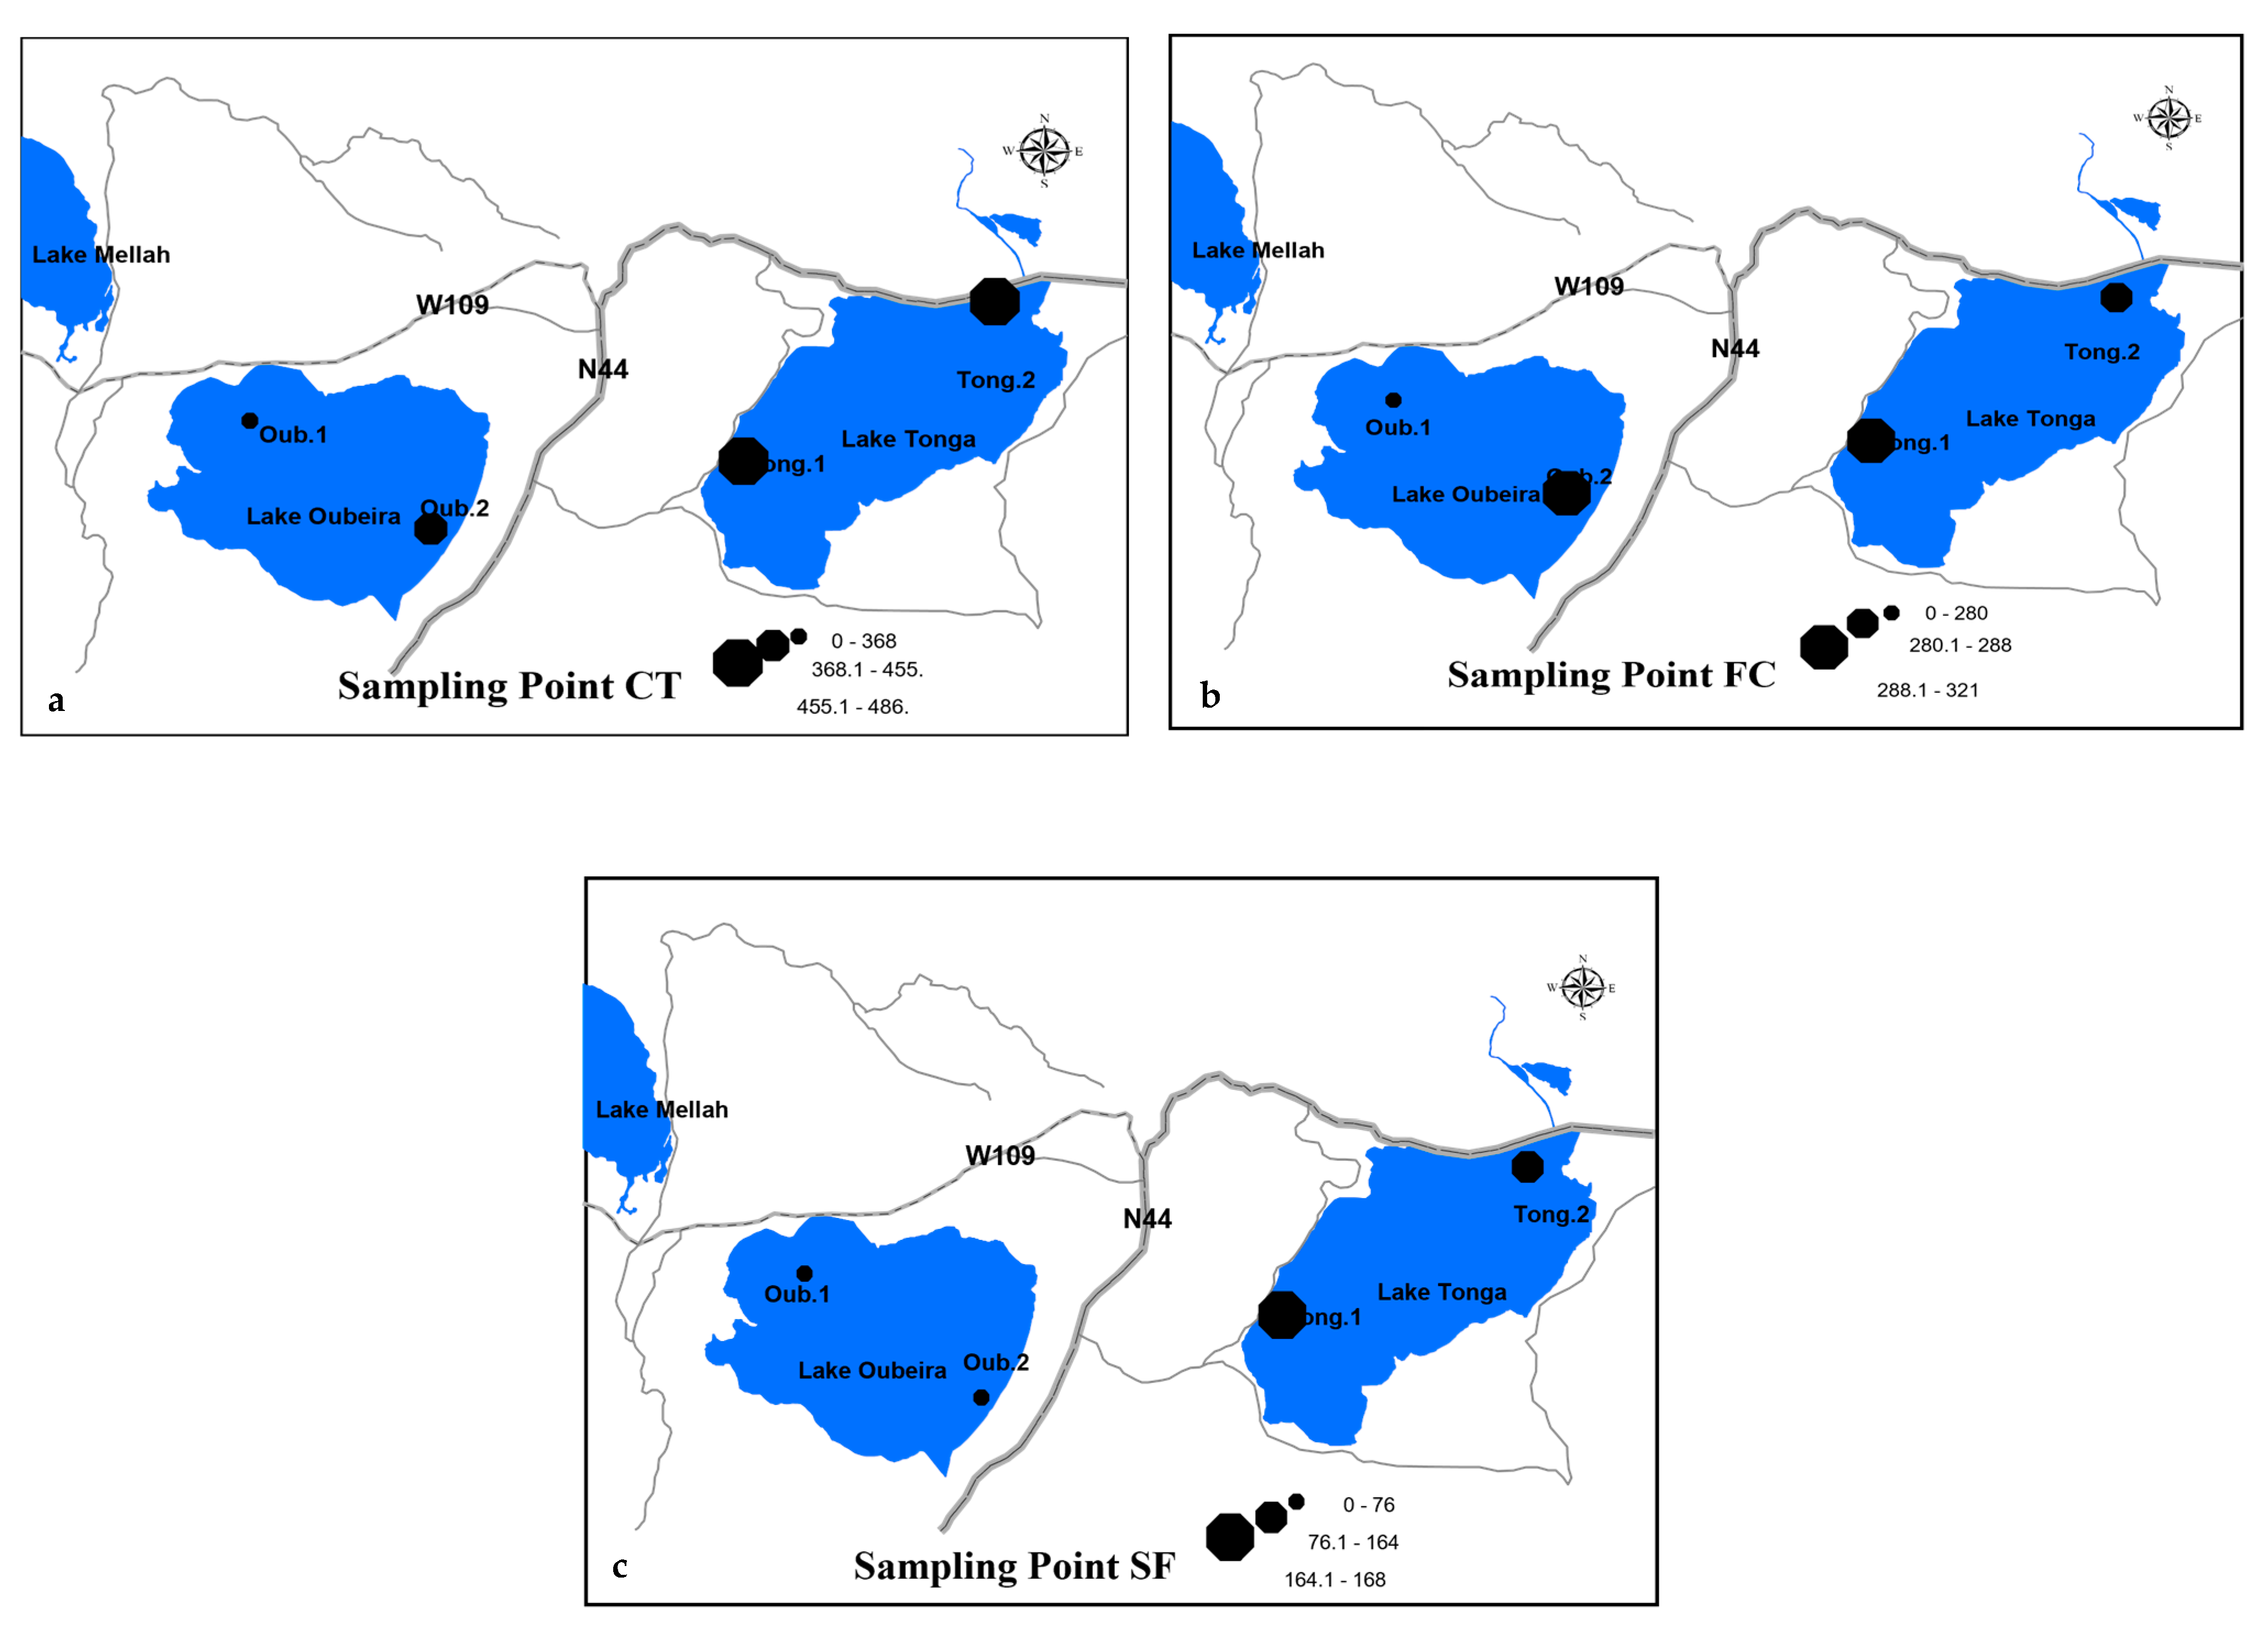
Examination of the maps of spatial distribution of Total Coliforms (Figure 9a) reveals high concentrations of bacteria, indicating fecal contamination in both lakes, confirming the importance of pollution of fecal origin. Indeed, Figure 9a clearly shows a generalized contamination by total coliforms throughout Lakes Tonga and Oubeira. However, the Lake Tonga stations exhibit higher maximum Total Coliform concentrations than those of Lake Oubeira. The stations of Lake Tonga are distinguished by peaks of particularly high maximum concentration of Total Coliforms, with a maximum of 560 CFU1000/mL at the Tonga 1 station in August 2023, and of 475 CFU1000/mL at the Tonga 2 station in March 2023. Lake Oubeira also presents high contamination levels in Total Coliforms, but the maximum values are lower than those of Lake Tonga, with a maximum of 368 CFU1000/mL at the Oubeira 1 station and of 455 CFU1000/mL at the Oubeira 2 station, these peaks being observed in the spring and summer period. Thus, the analysis of the maps of spatial distribution of Total Coliforms confirms an important and generalized fecal contamination in both lakes, with a tendency to higher contamination levels in Lake Tonga, particularly in the summer period.
Examination of the maps of spatial distribution of Fecal Coliforms (Figure 9b) confirms high concentrations of bacteria, indicating fecal contamination in both lakes, highlighting the importance of pollution of fecal origin. Indeed, Figure 9b clearly reveals a generalized fecal contamination by Fecal Coliforms in Lakes Tonga and Oubeira. However, Lake Tonga exhibits the highest levels of contamination by Fecal Coliforms. The stations of Lake Tonga are distinguished by peaks of particularly important maximum concentration of Fecal Coliforms, with a maximum of 321 CFU1000/mL at the Tonga 1 station in March 2023, and of 288 CFU1000/mL at the Tonga 2 station, also in March 2023. Lake Oubeira also presents high contamination levels in Fecal Coliforms, but the maximum values are lower than those of Lake Tonga, with a maximum of 280 CFU1000/mL at stations Oubeira 1 and Oubeira 2, these peaks being observed in the summer and spring period. Thus, the analysis of the maps of spatial distribution of Fecal Coliforms confirms an important fecal contamination in both lakes, with a predominance of the highest contamination levels in Lake Tonga, particularly in the spring and summer period.
Examination of the maps of spatial distribution of Fecal Streptococci (Figure 9c) also reveals high concentrations of bacteria, indicating fecal contamination in both lakes, confirming the importance of pollution of fecal origin. Indeed, Figure 9c attests to a fecal contamination by Fecal Streptococci in Lakes Tonga and Oubeira. The analysis of the maximum values of Fecal Streptococci, although expressed in a different unit (CFU100/mL), also confirms this fecal contamination in both lakes.
Lake Tonga exhibits the highest levels of contamination by Fecal Streptococci. The stations of Lake Tonga are distinguished by peaks of significant maximum concentration of Fecal Streptococci, with a maximum of 168 CFU100/mL at the Tonga 1 station in July 2023, and of 164 CFU100/mL at the Tonga 2 station in August 2023, both these peaks being observed in the summer period. Lake Oubeira, in comparison, presents maximum Fecal Streptococci values lower, with a maximum of 75 CFU100/mL at the Oubeira 1 station in August 2023 and of 76 CFU100/mL at the Oubeira 2 station in September 2022. Thus, the analysis of the maps of spatial distribution of Fecal Streptococci, combined with the examination of the maximum values, confirms a fecal contamination by these bacteria in both lakes, with a tendency to higher contamination levels in Lake Tonga, particularly in the summer period.
The cartographic representation of the spatial distribution of pollutants (Figure 7, Figure 8 and Figure 9) confirms the spatial heterogeneity of pollution in Lakes Tonga and Oubeira, and allows identification of the most critical areas for different types of pollutants. The maps particularly highlight the contamination by nitrates and microbiological indicators, more marked in Lake Tonga, and the contamination by heavy metals, in particular copper, more important in Lake Oubeira. This spatial information is essential for effectively targeting management and conservation measures.

4. Discussion

This study provides the first integrated, spatio-temporal assessment of water quality in Lakes Tonga and Oubeira, revealing significant and distinct pollution profiles that challenge a uniform conservation approach. Our findings, discussed below, highlight the specific anthropogenic pressures on each lake, the seasonal dynamics driving pollution peaks, and the urgent need for targeted management strategies.
Our study reveals a striking spatial differentiation in pollution profiles between the two adjacent Ramsar lakes, a key finding highlighted by the Principal Component Analysis (Figure 5a). Lake Tonga is predominantly impacted by nutrient enrichment and microbial contamination, whereas Lake Oubeira is characterized by higher mineralization and significant heavy metal pollution. This clear dichotomy suggests distinct anthropogenic pressures and/or differing biogeochemical responses within each ecosystem, necessitating tailored management approaches.
The pronounced eutrophic state of Lake Tonga, evidenced by significantly higher concentrations of nitrates, ammonium, and phosphates (Table 3, Figure 6a), points strongly towards impacts from the surrounding agricultural watershed. Runoff from fertilized lands is a well-documented primary source of nitrogen and phosphorus in freshwater ecosystems, often leading to rapid water quality degradation (e.g., Carpenter et al. [49]). Furthermore, the elevated levels of fecal indicator bacteria (TC, FC, FS) in Lake Tonga (Figure 6b) are indicative of contamination from domestic wastewater, likely originating from nearby settlements with inadequate sanitation infrastructure. This combined agricultural and domestic “signature” is consistent with observations in other Mediterranean wetlands facing similar anthropogenic pressures. For instance, the study by Bouhezila et al. [50] on Lake Réghaïa in Algeria also identified untreated wastewater as a major driver of eutrophication, corroborating our interpretation.
In sharp contrast, Lake Oubeira’s pollution profile is dominated by heavy metals, particularly copper, and higher electrical conductivity (Figure 4 and Figure 6a,c). While a certain level of mineralization can be attributed to the local geology [31], the exceptionally high concentrations of copper, which frequently exceed water quality standards (Table 3), strongly suggest an anthropogenic source. Potential inputs could include industrial discharges within the catchment area or the use of copper-based fungicides in specific agricultural practices, which warrant further investigation. This specific metal signature aligns with previous reports of metal contamination in the El Kala wetland complex [27,28], but our year-long monitoring confirms the persistence and severity of this issue, distinguishing Lake Oubeira’s primary environmental threat from that of its neighbor.
Beyond the spatial heterogeneity, our year-long monitoring revealed significant seasonal fluctuations in water quality in both lakes, with a general trend of degradation during the summer months (Figure 5b). This period was characterized by elevated concentrations of nutrients, organic matter (COD, BOD5), and fecal indicator bacteria (Figure 2a,b and Figure 3). Documenting these seasonal dynamics is crucial, as they highlight periods of heightened ecological risk that might be missed by short-term or “snapshot” assessments.
These seasonal variations are likely driven by a combination of climatic and anthropogenic factors. The increase in water temperature during summer directly accelerates microbial metabolic rates, including those involved in decomposition and nutrient cycling, which can exacerbate oxygen depletion [5] and favor the proliferation of phytoplankton [51]. This is particularly concerning for Lake Oubeira, which has a history of toxic cyanobacterial blooms [20,21]. Furthermore, lower rainfall and higher evaporation rates in summer can lead to a concentration effect, increasing the levels of dissolved solids and pollutants [52].
Anthropogenic activities also follow seasonal patterns that amplify these climatic effects. The summer period often coincides with increased agricultural activity, including irrigation return flows that can carry concentrated loads of fertilizers. Similarly, seasonal peaks in domestic wastewater discharges could contribute to the observed summer increase in fecal bacteria, a trend also noted in other Algerian aquatic systems like the Lake of Birds [53]. Conversely, the higher rainfall during the autumn and winter seasons, while potentially diluting some pollutants, can also trigger significant runoff events from agricultural and urbanized areas, mobilizing nutrients and contaminants accumulated in the watershed soils. This hydrological connectivity likely explains some of the pollution peaks observed outside the summer period. Such interplay between climate and anthropogenic pressures on water quality seasonality has been well-documented in other semi-arid Mediterranean regions [54].
To assess the severity of the pollution, it is essential to compare the observed contaminant concentrations with those reported in other aquatic ecosystems. The nutrient and microbial loads in Lake Tonga place it among the highly eutrophic systems in the region. Our measured nitrate (up to 13.75 mg/L) and ammonium (up to 5.75 mg/L) concentrations are consistent with, and in some cases exceed, the concerning values previously reported for Lake Tonga, confirming a persistent state of degradation [24,55]. When compared to other Algerian wetlands, this level of eutrophication is unfortunately not an isolated case. For example, similar nutrient enrichment driven by agricultural and domestic waste has been documented in the Lake of Birds, located within the same national park [53], and in the Réghaïa lake basin [51]. The extremely high fecal bacterial counts also align with findings from other Algerian water bodies impacted by untreated wastewater, such as the wadis of Biskra [56], highlighting a widespread challenge in national water resource management.
The pollution levels in Lake Oubeira are arguably even more alarming, particularly regarding heavy metals and organic load. The maximum copper concentration recorded in our study (2.63 mg/L) is exceptionally high for a surface water body and drastically exceeds both national and international water quality standards for ecosystem protection. These values are significantly higher than those typically reported in many polluted freshwater systems worldwide, which are often in the µg/L range (e.g., Ali et al. [57]). Furthermore, the very high Chemical Oxygen Demand (COD) values observed (Figure 2b), at levels often associated with partially treated or raw wastewater, distinguish Lake Oubeira’s pollution profile from a purely geogenic origin. This dual pressure of metallic and organic pollution creates a particularly toxic environment, posing severe ecotoxicological risks that demand urgent attention.
The distinct pollution profiles of Lakes Tonga and Oubeira entail severe and differentiated ecological and public health risks. The advanced state of eutrophication in Lake Tonga, driven by high nutrient loads, increases the probability of harmful algal blooms, leading to hypoxic conditions (as suggested by our low DO measurements), loss of submerged aquatic vegetation, and a decline in biodiversity, particularly affecting fish and invertebrate communities [8] that are crucial for the site’s diverse avifauna [14]. In Lake Oubeira, the primary threat stems from ecotoxicological risks associated with heavy metals. Copper, even at low concentrations, can be toxic to many aquatic organisms. The high levels we measured raise serious concerns about bioaccumulation in the food web, potentially impacting fish, waterbirds that feed on them, and ultimately human health through consumption [58]. Furthermore, the widespread fecal contamination in both lakes presents a direct public health risk to local populations.
These findings underscore the urgent need for a dual management strategy, tailored to the specific threats facing each lake.
  • For Lake Tonga, management efforts must prioritize the reduction in nutrient and microbial inputs from non-point sources. Key actions should include the implementation of agricultural best management practices, such as optimizing fertilizer use and establishing vegetated buffer strips along drainage channels and the lake shore to intercept runoff [59]. Concurrently, improving domestic wastewater collection and investing in effective, low-cost treatment solutions for the surrounding rural settlements is critical to curb fecal pollution [60].
  • For Lake Oubeira, the priority is to address the severe metal and organic pollution. An urgent investigation is required to identify the precise sources of copper, differentiating between potential industrial point sources, diffuse agricultural inputs (e.g., fungicides), or legacy contamination from sediments.
Beyond these lake-specific actions, an integrated watershed management approach is essential. This requires the collaboration of all stakeholders, including El Kala National Park authorities, local government bodies, farmers, and scientists. The high-resolution pollution maps generated in this study (Figure 7, Figure 8 and Figure 9) serve as critical decision-support tools, enabling managers to target interventions where they are most needed. By adopting such an evidence-based approach, it will be possible to develop effective conservation strategies to safeguard the ecological integrity of these invaluable Ramsar sites.

5. Conclusions

This study provides the first integrated, year-long assessment of Lakes Tonga and Oubeira, revealing starkly contrasting pollution profiles that demand tailored conservation strategies. Lake Tonga is severely impacted by nutrient and microbial loads from its agricultural watershed, while Lake Oubeira suffers from acute heavy metal contamination, particularly copper, and high organic pollution. This fundamental dichotomy renders a uniform management approach ineffective and highlights the necessity for site-specific interventions. We strongly recommend that immediate actions for Lake Tonga focus on reducing non-point source pollution through the implementation of vegetated buffer zones and improved rural wastewater treatment. For Lake Oubeira, an urgent investigation to identify and mitigate the sources of copper is the top priority. The high-resolution spatial maps produced in this work offer a crucial tool for park managers and local authorities to target these interventions precisely. Future research should build on this baseline by focusing on sediment core analysis to understand long-term pollution trends, assessing bioaccumulation in the food web, and establishing a multi-year monitoring program to distinguish seasonal patterns from climate-driven changes. A collaborative effort between scientists, park authorities, and local stakeholders is imperative for the successful preservation of these critical Ramsar wetlands.

Supplementary Materials

The following supporting information can be downloaded at: https://www.mdpi.com/article/10.3390/pr13113466/s1, Table S1. Detailed methodologies for physico-chemical parameter analysis.

Author Contributions

Conceptualization, L.B. (Laid Bouchaala), I.H., L.B. (Leila Bouaguel) and M.H.; methodology, I.H., L.B. (Laid Bouchaala), L.B. (Leila Bouaguel), M.B., N.G., A.S. and M.H.; software, I.H., L.B. (Laid Bouchaala), M.B. and M.H.; validation, L.B. (Laid Bouchaala), N.G., M.B. and M.H.; formal analysis, I.H., L.B. (Laid Bouchaala), N.G. and M.H.; investigation, I.H., L.B. (Laid Bouchaala), M.B. and N.G.; resources, L.B. (Laid Bouchaala), L.B. (Leila Bouaguel), A.S., N.G. and M.H.; data curation, L.B. (Laid Bouchaala), I.H., L.B. (Leila Bouaguel) and M.H.; writing—original draft preparation, I.H., L.B. (Laid Bouchaala), M.B., N.G., L.B. (Leila Bouaguel), A.S. and M.H.; writing—review and editing, L.B. (Laid Bouchaala), L.B., N.G., A.S., M.B. and M.H.; visualization, L.B. (Laid Bouchaala), I.H., L.B. (Leila Bouaguel), N.G. and M.H.; supervision, L.B. (Laid Bouchaala), N.G., A.S. and M.H.; project administration, L.B. (Laid Bouchaala), L.B. (Leila Bouaguel), A.S., N.G., M.B. and M.H.; funding acquisition, L.B. (Laid Bouchaala), L.B. (Leila Bouaguel), A.S., N.G., M.B., and M.H. All authors have read and agreed to the published version of the manuscript.

Funding

This research received no external funding.

Institutional Review Board Statement

Not applicable.

Informed Consent Statement

Not applicable.

Data Availability Statement

All data generated during this study are presented in this paper.

Acknowledgments

First and foremost, we express our sincere gratitude to the General Directorate of Scientific Research and Technological Development (DGRSDT) of the Republic of Algeria for encouraging this research endeavor. We are also deeply indebted to all those who contributed to the completion of this work, including researchers, technicians, and staff. Their collective effort and dedication have been instrumental in achieving the project’s goals.

Conflicts of Interest

The authors declare no conflicts of interest.

References

  1. Mitsch, W.J.; Gosselink, J.G. Wetlands, 5th ed.; John Wiley & Sons, Inc.: Hoboken, NJ, USA, 2015. [Google Scholar]
  2. Jung, M.; Arnell, A.; de Lamo, X.; García-Rangel, S.; Lewis, M.; Mark, J.; Merow, C.; Miles, L.; Ondo, I.; Pironon, S.; et al. Areas of global importance for conserving terrestrial biodiversity, carbon and water. Nat. Ecol. Evol. 2021, 5, 1499–1509. [Google Scholar] [CrossRef]
  3. Ramsar Convention Secretariat. The Ramsar Convention Manual: A Guide to the Convention on Wetlands; Ramsar Convention Secretariat: Gland, Switzerland, 2021; Available online: https://onlinelibrary.wiley.com/doi/10.1002/9781119692621.ch2 (accessed on 10 December 2024).
  4. Reid, A.J.; Carlson, A.K.; Creed, I.F.; Eliason, E.J.; Gell, P.A.; Johnson, P.T.J.; Kidd, K.A.; MacCormack, T.J.; Olden, J.D.; Ormerod, S.J.; et al. Emerging threats and persistent conservation challenges for freshwater biodiversity. Biol. Rev. 2019, 94, 849–873. [Google Scholar] [CrossRef]
  5. Woolway, R.I.; Sharma, S.; Smol, J.P. Lakes in Hot Water: The Impacts of a Changing Climate on Aquatic Ecosystems. Bioscience 2022, 72, 1050–1061. [Google Scholar] [CrossRef]
  6. Meybeck, M.; Lestel, L.; Carré, C.; Bouleau, G.; Garnier, J.; Mouchel, J.M. Trajectories of river chemical quality issues over the Longue Durée: The Seine River (1900S–2010). Environ. Sci. Pollut. Res. 2016, 25, 23468–23484. [Google Scholar] [CrossRef]
  7. Nyenje, P.M.; Foppen, J.W.; Uhlenbrook, S. Eutrophication and nutrient release in urban areas of sub-Saharan Africa—A review. Sci. Total Environ. 2010, 408, 447–455. [Google Scholar] [CrossRef]
  8. Schindler, D.W. Recent advances in the understanding and management of eutrophication. Limnol. Oceanogr. 2006, 51, 356–363. [Google Scholar] [CrossRef]
  9. Ayele, G.; Atlabachew, M. Review of characterization, factors, impacts, and solutions of Lake eutrophication: Lesson for lake Tana, Ethiopia. Environ. Sci. Pollut. Res. 2021, 28, 14233–14252. [Google Scholar] [CrossRef] [PubMed]
  10. Kakade, A.; Salama, E.; Han, H.; Zheng, Y.; Kulshrestha, S.; Jalalah, M.; Harraz, F.; Alsareii, S.; Harraz, F.; Alsareii, S.; et al. World eutrophic pollution of lake and river: Biotreatment potential and future perspectives. Environ. Technol. Innov. 2021, 23, 101604. [Google Scholar] [CrossRef]
  11. Suresh, K.; Tang, T.; Van Vliet, M.T.; Bierkens, M.F.P.; Strokal, M.; Sorger-Domenigg, F.; Wada, Y. Recent advancement in water quality indicators for eutrophication in global freshwater lakes. Environ. Res. Lett. 2023, 18, 073001. [Google Scholar] [CrossRef]
  12. Pereira, A.; Mulligan, C.N. Practices for Eutrophic Shallow Lake Water Remediation and Restoration: A Critical Literature Review. Water 2023, 15, 2270. [Google Scholar] [CrossRef]
  13. Huisman, J.; Codd, G.A.; Paerl, H.W.; Belings, I.; Verspagen, P.A.; Visser, P.M. Cyanobacterial blooms. Nat. Rev. Microbiol. 2018, 16, 471–483. [Google Scholar] [CrossRef]
  14. Downing, J. Limnology and oceanography: Two estranged twins reuniting by global change. Inland Waters 2014, 4, 215–232. [Google Scholar] [CrossRef]
  15. Gherib, A.; Lazli, A.; Naili, S.; Boucheker, A.; Ikhlef, D.; Mechaka, N. Avifauna diversity and phenology in a Ramsar site: Lake Tonga (Northeastern Algeria). Arx. Miscel·Lània Zool. 2022, 19, 321–344. [Google Scholar] [CrossRef]
  16. Djamai, S.; Mimeche, F.; Bensaci, E.; Oliva-Paterna, F. Diversity of macro-invertebrates in Lake Tonga (northeast Algeria). Biharean Biol. 2019, 13, 8–11. [Google Scholar]
  17. Nebbache, M.; Lazli, A.; Boucheker, A. An ecological survey of Laro-limicolae in Northeastern Algeria. Arx. Miscel·Lània Zool. 2023, 21, 261–274. [Google Scholar] [CrossRef]
  18. Dis, C.; Kara, F.; Bouamama, S.; Sahra, F.; Boucena, M. Eco-biological Study of the Mosquitofish Gambusia affinis from Oubeira lake. J. Aquac. Fish Health 2022, 11, 201–209. [Google Scholar]
  19. Bensaâd-Bendjedid, L.; Telailia, S.; Alliouche, F.; Touati, H.; Ladjama, I. First record of the occurrence of the Chinese pond mussel Sinanodonta woodiana (Lea, 1834) (Bivalvia: Unionidae: Unionidae) in African freshwaters: Oubeira Lake, Algeria. Turk. J. Zool. 2023, 47, 94–102. [Google Scholar] [CrossRef]
  20. Nasri, A.; Bouaïcha, N.; Fastner, J. First Report of a Microcystin-Containing Bloom of the Cyanobacteria microcystis spp. in Lake Oubeira, Eastern Algeria. Arch. Environ. Contam. Toxicol. 2004, 46, 197–202. [Google Scholar] [CrossRef]
  21. Nasri, H.; Herry, E.; Bouaïcha, N. First reported case of turtle deaths during a toxic Microcystis spp. bloom in Lake Oubeira, Algeria. Ecotoxicol. Environ. Saf. 2008, 71, 535–544. [Google Scholar] [CrossRef]
  22. Hasna, C.; Faiza, M.; Aicha, T. Diatoms diversity in Oubeïra Lake, northeastern Algeria. Biodiversitas 2020, 11, 573–580. [Google Scholar] [CrossRef]
  23. Djelita, B.; Benadda, L. Spatiotemporal Assessment of the Water Quality of the Hammam Boughrara Dam (North-West Algeria). J. Ecol. Eng. 2021, 22, 92–103. [Google Scholar] [CrossRef]
  24. Loucif, K.; Neffar, S.; Menasria, T.; Maazi, M.C.; Houhamdi, M.; Chenchouni, H. Physico-chemical and bacteriological quality assessment of surface water at Lake Tonga in Algeria. Environ. Nanotechnol. Monit. Manag. 2020, 13, 100284. [Google Scholar] [CrossRef]
  25. Loucif, K. Ecology of Avian Settlements in Lake Tonga (Northern Algeria). Zool. Sci. 2020, 54, 275–284. [Google Scholar] [CrossRef]
  26. Naili, S.; Boucheker, A.; Gherib, A.; Djelloul, R.; Lazli, A. Seasonal variation in physico-chemical characteristics and load contamination of lake Tonga and their effects on waterbird populations. Ukr. J. Ecol. 2021, 11, 103–112. [Google Scholar]
  27. Derradji, F.; Benmeziane, F.; Benaabidate, L.; Maoui, A.; Bousnoubra, H.; Kherici, N. Heavy metals analysis in the water of Mellah, Oubeira and Tonga Lakes of El kala wetland complex, North east Algeria. Int. J. Innov. Sci. Res. 2015, 13, 107–113. [Google Scholar]
  28. Belabed, B.-E.; Bendjema, A.; Boudjelida, H.; Djabri, L.; Bensouilah, M. Evaluation of the metal contaminations in the surface sediments of the Oubeira lagoon, National park of El Kala, Algeria. Arch. Appl. Sci. Res. 2011, 3, 51–62. [Google Scholar]
  29. Loucif, K.; Maazi, M.; Houhamdi, M.; Chenchouni, H. Nest site selection and breeding ecology of the Ferruginous Duck (Aythya nyroca) in Algeria. Glob. Ecol. Conserv. 2021, 26, e01524. [Google Scholar] [CrossRef]
  30. Mahmoudi, K.; Bendali-Saoudi, F.; Soltani, N. Do water physicochemical parameters explain richness and phenology of aquatic beetles (Coleoptera) in Tonga Lake (Northeast Algeria)? Orient. Insects 2022, 57, 1–24. [Google Scholar] [CrossRef]
  31. Alayat, H.; Lamouroux, C. Caractérisation physico-chimique des eaux thermo–minérales des monts de la Cheffia (Extrême nord-est Algérien). Presse Therm. Clim. 2007, 144, 191–199. [Google Scholar]
  32. Alayat, H.; Kherici, N.; Lamouroux, C. Evolution Spatiale Des Caracteristiques Physico-Chimiques Des Eaux Du Lac Oubeira Impose Par Les Conditions Severes De La Secheresse (Extreme Ne Algerien). Eur. Sci. J. 2013, 9, 564–579. [Google Scholar]
  33. Alayat, H.; Kherici, N.; Lamouroux, C. Space evolution of the silting of Oubeira Lake imposed by erosion (extreme NE Algerian). Rev. Ljee 2014, 15, 28–38. [Google Scholar]
  34. Bouchaala, L.; Charchar, N.; Mezoug, S.E.; Sellam, F.; Guednouse, A.; Houhamdi, M. Point position of the bacteriological physicochemical quality and wetlands water mapping of Guerbes-Sanhadja eco-complex (Skikda, Northeastern Algeria). Int. J. Innov. Sci. Res. 2019, 46, 80–93. [Google Scholar]
  35. Rodier, J.; Legube, B.; Merlet, N. L’Analyse de L’Eau: Eaux Naturelles, Eaux Résiduaires, Eau de Mer, 9th ed.; Dunod: Malakoff, France, 2009; Available online: http://www.sudoc.fr/134445627 (accessed on 1 November 2024).
  36. ISO 13395:1996; Water Quality—Determination of Nitrate Nitrogen and Nitrite Nitrogen and the Sum of Both by Flow Analysis (CFA and FIA) and Spectrometric Detection. International Organization for Standardization: Geneva, Switzerland, 1996.
  37. ISO 6777:1984; Water Quality—Determination of Nitrite—Molecular Absorption Spectrometric Method. International Organization for Standardization: Geneva, Switzerland, 1984.
  38. NF EN 1189:2007; Water Quality—Determination of Phosphorus—Ammonium Molybdate Spectrometric Method. Association Française de Normalisation (AFNOR): Paris, France, 2007.
  39. ISO 15705:2002; Water Quality—Determination of the Chemical Oxygen Demand Index (ST-COD)—Small-Scale Sealed-Tube Method. International Organization for Standardization: Geneva, Switzerland, 2002.
  40. EN 1899-1:1998; Water Quality—Determination of Biochemical Oxygen Demand After n Days (BODn)—Part 1: Dilution and Seeding Method with Allylthiourea Addition. European Committee for Standardization (CEN): Brussels, Belgium, 1998.
  41. NF EN 872:2005; Water Quality—Determination of Suspended Solids—Method by Filtration Through Glass Fibre Filters. Association Française de Normalisation (AFNOR): Paris, France, 2005.
  42. ISO 5667-16:2017; Water Quality—Sampling—Part 16: Guidance on Sample Preservation and Handling of Water Samples. International Organization for Standardization: Geneva, Switzerland, 2017.
  43. U.S. EPA. Method 6010D: Inductively Coupled Plasma-Optical Emission Spectrometry. In Test Methods for Evaluating Solid Waste, Physical/Chemical Methods; SW-846; U.S. Environmental Protection Agency: Washington, DC, USA, 2018. [Google Scholar]
  44. ISO 9308-2:2012; Water Quality—Enumeration of Escherichia coli and Coliform Bacteria—Part 2: Most Probable Number Method. International Organization for Standardization: Geneva, Switzerland, 2012.
  45. ISO 9308-3:1998; Water Quality—Detection and Enumeration of Escherichia coli and Coliform Bacteria in Surface and Waste Water—Part 3: Miniaturized Method (Most Probable Number) for the Detection and Enumeration of E. coli. International Organization for Standardization: Geneva, Switzerland, 1998.
  46. ISO 7899-2:2000; Water Quality—Detection and Enumeration of Intestinal Enterococci—Part 2: Membrane Filtration Method. International Organization for Standardization: Geneva, Switzerland, 2000.
  47. World Health Organization (WHO). Guidelines for Drinking-Water Quality, 4th ed.; Incorporating the 1st Addendum; WHO: Geneva, Switzerland, 2017. [Google Scholar]
  48. Messerer, Y.; Retima, A.; Amira, A.B.; Djebar, A.B. Climatic changes, hydrology and trophic status of Lake Oubeira (extreme northeast of Algeria). AACL Bioflux 2019, 12, 4. [Google Scholar]
  49. Carpenter, S.R.; Caraco, N.F.; Correll, D.L.; Howarth, R.W.; Sharpley, A.N.; Smith, V.H. Nonpoint pollution of surface waters with phosphorus and nitrogen. Ecol. Appl. 1998, 8, 559–568. [Google Scholar] [CrossRef]
  50. Bouhezila, F.; Hacène, H.; Aichouni, M. Water quality assessment in Réghaïa (North of Algeria) lake basin by using traditional approach and water quality indices. Kuwait J. Sci. 2020, 47, 57–71. [Google Scholar]
  51. Tong, Y.; Xu, X.; Qi, M.; Sun, J.; Zhang, Y.; Zhang, W.; Wang, M.; Wang, X.; Zhang, Y. Lake warming intensifies the seasonal pattern of internal nutrient cycling in the eutrophic lake and potential impacts on algal blooms. Water Res. 2020, 188, 116570. [Google Scholar]
  52. Madene, E.; Boufekane, A.; Busico, G.; Meddi, M.; Maizi, D. Temporal evaluation of surface water quality in semiarid regions: A case study of the Ouled Mellouk dam in north-western Algeria. Water Supply 2023, 23, 2387–2403. [Google Scholar] [CrossRef]
  53. Boussaha, A.; Bezzalla, A.; Zebsa, R.; Amari, H.; Houhamdi, M.; Chenchouni, H. Monitoring and assessment of spatial and seasonal variability in water quality at Lake of Birds (Algeria) using physicochemical parameters and bacterial quality indicators. Environ. Nanotechnol. Monit. Manag. 2024, 21, 100955. [Google Scholar] [CrossRef]
  54. Mebarkia, A.; Boufekane, A. Human activity impact on surface water quality in semi-arid regions: A case study of Aïnzeda lake (North-East Algeria). Water Supply 2020, 20, 1726–1744. [Google Scholar] [CrossRef]
  55. Loucif, K.; Chenchouni, H. Water physicochemical quality as driver of spatial and temporal patterns of microbial community composition in lake ecosystems. Appl. Water Sci. 2024, 14, 115. [Google Scholar] [CrossRef]
  56. Guemmaz, F.; Neffar, S.; Chenchouni, H. Physicochemical and Bacteriological Quality of Surface Water Resources Receiving Common Wastewater Effluents in Drylands of Algeria. In Water Resources in Algeria: Part II; Negm, A., Bouderbala, A., Chenchouni, H., Barceló, D., Eds.; The Handbook of Environmental Chemistry; Springer: Cham, Switzerland, 2020; Volume 100. [Google Scholar]
  57. Ali, H.; Khan, E.; Ilahi, I. Environmental chemistry and ecotoxicology of hazardous heavy metals: Environmental persistence, toxicity, and bioaccumulation. J. Chem. 2019, 2019, 6730305. [Google Scholar] [CrossRef]
  58. Senouci, N.; Bemmoussat-Dekkak, S.; Ammouri, R.; Abdellaoui-Hassaine, K. Water Quality Evaluation Using Benthic Macroinvertebrates, Physicochemical Parameters and Heavy Metal Levels in Two Lakes (Northwestern Algeria). Appl. Ecol. Environ. Res. 2023, 21, 5069–5090. [Google Scholar] [CrossRef]
  59. Tammeorg, O.; Chorus, I.; Spears, B.; Nõges, P.; Nürnberg, G.K.; Tammeorg, P.; Søndergaard, M.; Jeppesen, E.; Paerl, H.; Huser, B.; et al. Sustainable lake restoration: From challenges to solutions. Wiley Interdiscip. Rev. Water 2023, 11, e1689. [Google Scholar] [CrossRef]
  60. Bouchaala, L.; Charchar, N.; Gherib, A.E. Ressources hydriques: Traitement et réutilisation des eaux usées en Algérie. Alger. J. Arid Environ. 2017, 7, 84–95. [Google Scholar] [CrossRef]
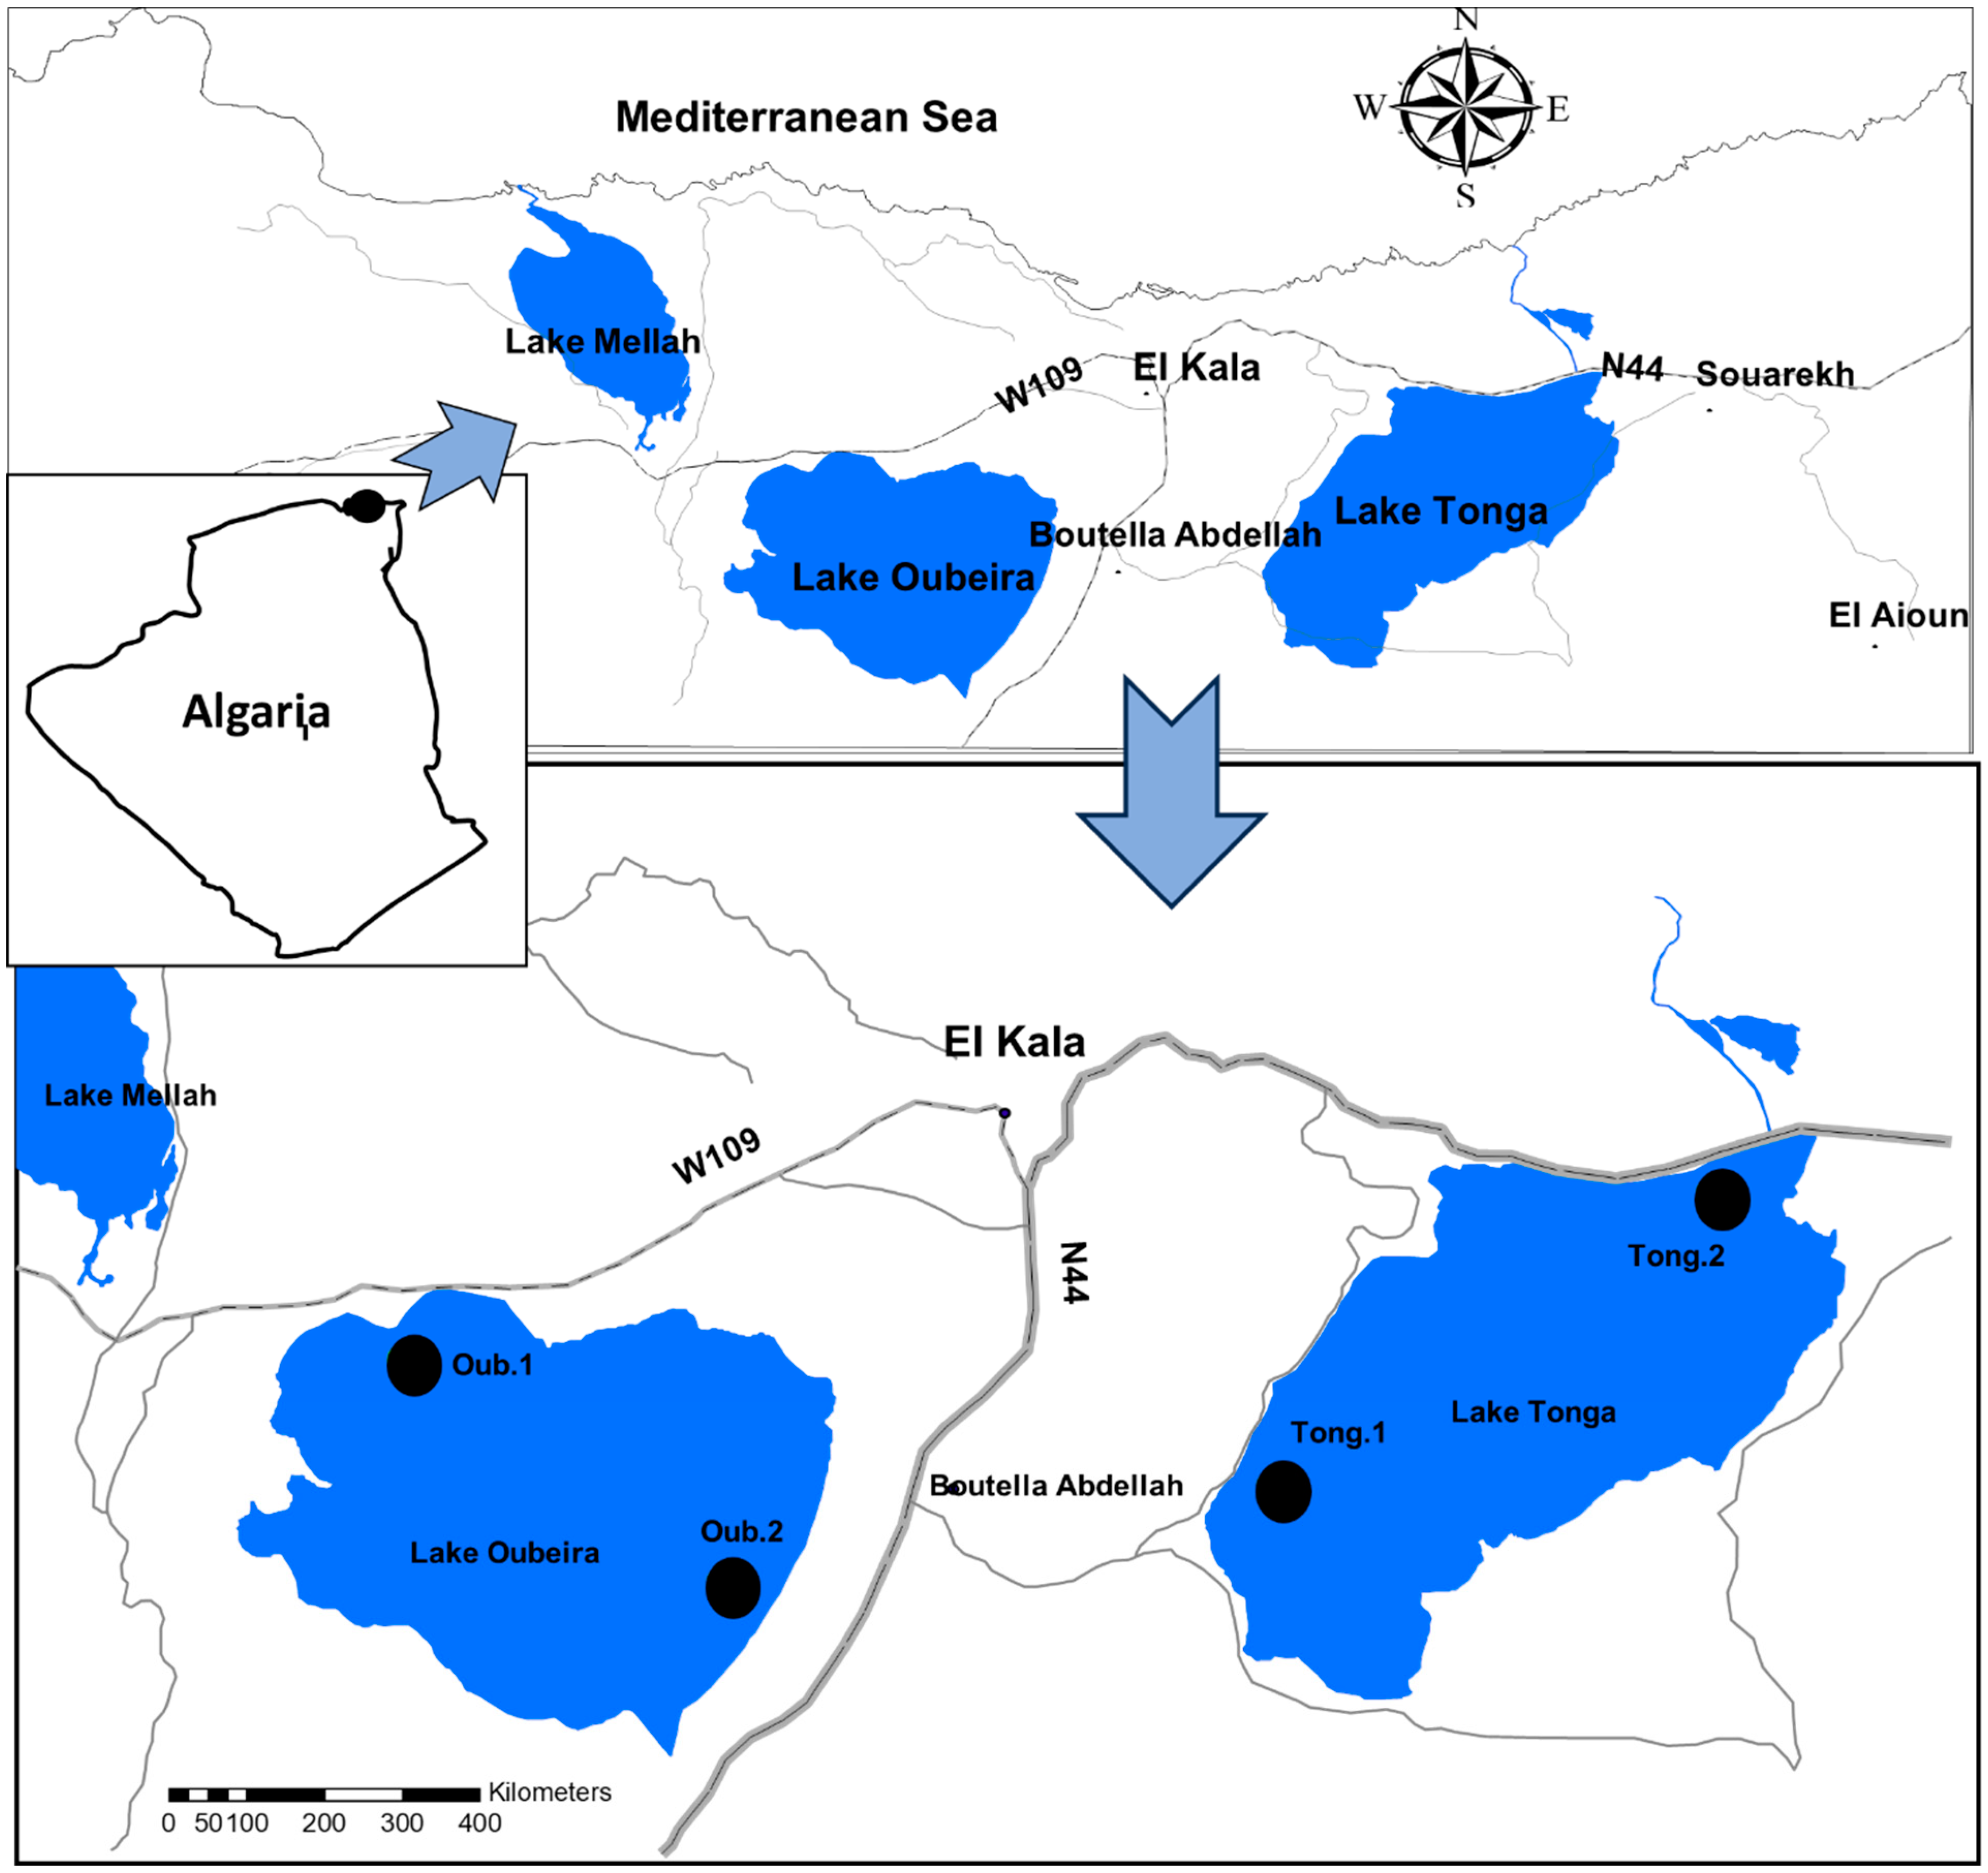
Figure 1. Geographic Location of El Kala National Park (Algeria) Highlighting Lakes Tonga and Oubeira, and Detailed Position of Sampling Stations.
Processes 13 03466 g001
Figure 2. (a) Spatio-temporal Evolution of Major Physico-chemical Parameters (BOD5, COD, K+, NO3, TSS, Ca2+, DO, NH4+, PO43−) on a Logarithmic Scale by Station and Season in Lakes Tonga and Oubeira. (b) Spatio-temporal Evolution of Temperature and pH by Station and Season in Lakes Tonga and Oubeira. (c) Spatio-temporal Evolution of Electrical Conductivity (EC) and Turbidity by Station and Season in Lakes Tonga and Oubeira.
Processes 13 03466 g002aProcesses 13 03466 g002b
Figure 3. Spatio-temporal evolution of microbiological parameters of water from Lakes Tonga and Oubeira.
Processes 13 03466 g003
Figure 4. Spatio-temporal Evolution of Heavy Metal Concentrations by Station and Season in Lakes Tonga and Oubeira.
Processes 13 03466 g004
Figure 5. (a) Spatial Principal Component Analysis (PCA). (b) Spatio-temporal Principal Component Analysis (PCA) of waters of Lakes Tonga and Oubeira (Months).
Processes 13 03466 g005aProcesses 13 03466 g005b
Figure 6. Boxplots of the spatial distribution of water quality parameters: (a) Physico-chemical parameters, (b) Microbiological parameters, and (c) Heavy metal parameters.
Processes 13 03466 g006
Figure 7. Spatial distribution of major nutrients in Lakes Tonga and Oubeira. Thematic maps showing the distribution of maximum observed concentrations during the study period for: (a) Nitrates (NO3), (b) Ammonium (NH4+), (c) Nitrites (NO2), and (d) Phosphates (PO43−). These maps visually identify the nutrient pollution hotspots in both ecosystems, with particularly high nitrate and ammonium loads observed in Lake Tonga.
Processes 13 03466 g007
Figure 8. Spatial distribution of key heavy metals in Lakes Tonga and Oubeira. Maps showing the maximum observed concentrations for: (a) Copper (Cu) and (b) Lead (Pb).
Processes 13 03466 g008
Figure 9. Spatial distribution of microbiological contamination indicators in Lakes Tonga and Oubeira. Maps showing the maximum observed concentrations for: (a) Total Coliforms, (b) Fecal Coliforms, and (c) Fecal Streptococci. These maps illustrate the widespread fecal contamination, with consistently higher levels observed in Lake Tonga, pointing to significant public health risks.
Processes 13 03466 g009
Table 1. Geographical Coordinates and Justification of Sampling Stations.
StationLatitudeLongitudeStation Justification
Tong.136°84′44″ N8°47′20″ ELocated on the western shore of Lake Tonga, this station is in close proximity to cultivated fields and an agricultural drainage canal, representing the zone potentially most impacted by agricultural runoff. Accessible via an existing agricultural road.
Tong.236°87′98″ N8°52′51″ ESituated in the center of Lake Tonga, this station is considered to be less directly influenced by point sources of pollution and representative of open-water conditions. Accessible by light boat.
Oub.136°86′39″ N8°37′32″ ELocated in the northern part of Lake Oubeira, near the primary water input zone (where small chaabates drain rainwater into the lake), allowing for assessment of incoming water quality. Accessible from the bank.
Oub.236°83′50″ N8°40′77″ EPositioned on the southeastern shore of Lake Oubeira, this station is in proximity to rural dwellings and a potential diffuse discharge point for domestic wastewater. Accessible via a walking path.
Table 2. Mean Seasonal Water Quality Index (WQI) per Station (Mean ± Standard Deviation).
StationSeasonMean WQI ± SDWQI Classification (Seasonal)
Tong.1Autumn 202256.0 ± 1.41Moderate quality
Tong.1Winter 2022–202358.4 ± 0.37Moderate quality
Tong.1Spring 202360.2 ± 0.27Moderate quality
Tong.1Summer 202363.1 ± 0.65Moderate quality
Tong.2Autumn 202256.6 ± 1.73Moderate quality
Tong.2Winter 2022–202359.5 ± 0.98Moderate quality
Tong.2Spring 202360.2 ± 1.59Moderate quality
Tong.2Summer 202363.5 ± 0.30Moderate quality
Oub.1Autumn 202256.0 ± 2.72Moderate quality
Oub.1Winter 2022–202360.9 ± 4.07Moderate quality
Oub.1Spring 202360.6 ± 1.30Moderate quality
Oub.1Summer 202361.1 ± 0.41Moderate quality
Oub.2Autumn 202261.4 ± 1.06Moderate quality
Oub.2Winter 2022–202361.4 ± 1.96Moderate quality
Oub.2Spring 202363.3 ± 0.09Moderate quality
Oub.2Summer 202362.6 ± 0.39Moderate quality
Table 3. Summary of ANOVA and Post Hoc Test Results by Factor (Month and Station).
ParameterF-Valuep-ValuePost Hoc Groupings (Tukey HSD) 1
Turbidity13.782<0.001Oub.1 (A), oub.2 (B), Tong.2 Tong.1 (C)
EC (µS/cm)5.2730.003Oub.1 (A), oub.2 (B), Tong.2 Tong.1 (C)
TSS (mg/L)3.6600.019Oub.2 (A), Tong.2 (B), oub.1 (BC), Tong.1 (C)
NO3 (mg/L)369.859<0.001Tong.1 Tong.2 (A), oub.2 (B), oub.1 (C)
NH4+ (mg/L)27.233<0.001Tong.1 Tong.2 (A), oub.2 (B), oub.1 (C)
PO43− (mg/L)33.835<0.001Tong.1 Tong.2 (A), oub.2 (B), oub.1 (C)
OM (mg O2/L)15.653<0.001Tong.1 Tong.2 (A), oub.2 (B), oub.1 (C)
TH (°F)3.0800.037Tong.1 Tong.2 (A), oub.2 oub.1 (B)
Ca2+ (mg/L)9.522<0.001Tong.1 Tong.2 (A), oub.2 (B), oub.1 (C)
K+ (mg/L)21.458<0.001Tong.1 Tong.2 (A), oub.2 (B), oub.1 (C)
COD (mg/L)9.559<0.001Oub.1 oub.2 (A), Tong.2 (B), Tong.1 (C)
Copper (mg/L)150.825<0.001Oub.2 oub.1 (A), Tong.2 Tong.1 (B)
Iron (mg/L)103.405<0.001Oub.2 oub.1 (A), Tong.2 Tong.1 (B)
Lead (mg/L)134.181<0.001Oub.2 oub.1 (A), Tong.2 Tong.1 (B)
Manganese (mg/L)13.049<0.001Oub.1 oub.2 (A), Tong.2 (B), Tong.1 (C)
Nickel (mg/L)43.402<0.001Oub.2 oub.1 (A), Tong.2 (B), Tong.1 (C)
Total Bacteria24.432<0.001Tong.1 Tong.2 (A), oub.2 (B), oub.1 (C)
Total Coliforms8.231<0.001Tong.1 Tong.2 (A), oub.2 (B), oub.1 (C)
Fecal Coliforms3.2000.032Tong.1 Tong.2 (A), oub.2 (B), oub.1 (C)
1 Stations not sharing a common letter within a row are significantly different (Tukey HSD, p < 0.05). Parameters with non-significant spatial differences (p > 0.05) were: pH, DO, NO2, Mg2+, Cl, K+, SO42−, BOD, and Fecal Streptococci.
Table 4. Representative Exceedances of Water Quality Standards by Site and Period.
SiteParameterMeasured ValueStandard (mg/L or CFU)Date
Tong.1NO3 (mg/L)13.7510June 2023
Tong.1Total Coliforms (1000/mL)560100August 2023
Tong.2NH4+ (mg/L)5.754August 2023
Oub.2PO43− (mg/L)8.6610December 2022
Oub.2Copper (Cu) (mg/L)2.632.0February 2023
Oub.2Lead (Pb) (mg/L)0.0280.05May 2023
Disclaimer/Publisher’s Note: The statements, opinions and data contained in all publications are solely those of the individual author(s) and contributor(s) and not of MDPI and/or the editor(s). MDPI and/or the editor(s) disclaim responsibility for any injury to people or property resulting from any ideas, methods, instructions or products referred to in the content.