Abstract
As a common coal mine disaster, a coal and gas outburst in coal mining seriously threatens the safety production of coal mines with its sudden and destructive nature. In order to accurately identify the main influencing factors of a coal and gas outburst in coal mines and assess the risk level of a coal and gas outburst, 12 indicators are established from three aspects: coal seam gas factors, coal seam physical and mechanical properties, and in situ stress state. This study introduces the fuzzy set theory on the basis of the DEMATEL and combines it with the TOPSIS to establish a fuzzy DEMATEL-TOPSIS risk assessment model. The model was applied to conduct a comprehensive evaluation of the coal and gas outburst in the 3908 working face of a coal mine in Jiangxi Province so as to determine the risk level of coal and gas outburst. The results show that, sorted by weight in descending order, the main influencing factors are gas pressure (0.105), in situ stress (0.101), gas content (0.098), burial depth (0.090), and geological structure type (0.087). The hazard grade identification of coal and gas outburst at the working face is Level II (with a relative approximation degree of 0.270), which is consistent with the actual situation. It can provide a reference for the prevention and control of coal and gas outbursts.
1. Introduction
As the world’s most widely distributed and largely stored non-renewable resource, coal contributes 27.2% of the world’s primary energy consumption, and world coal production is also on the rise with demand, demonstrating the strong vitality of the coal industry [1]. As a major coal consumer, China’s total annual standard coal consumption demand exceeds 5 billion tons; the total coal demand remains stable, and its basic energy status remains unchanged [2]. Coal mining and utilization are accompanied by significant environmental impacts, which induce changes in climate and soil; meanwhile, they entail safety risks, as global coal mine accident rates and mortality rates remain relatively high [3,4,5,6]. Therefore, it is of great value to study and establish an accident prevention mechanism in coal mines to reduce the possibility of accidents and reduce losses to ensure the safe production operation of coal mines.
Numerous scholars have applied relevant theories of safety assessment to conduct research in various aspects. Güllüdağ et al. [7] employed the Kriging and IDW methods to clarify the spatial differentiation pattern of harmful elements within the study area, providing a referenceable technical approach for the environmental risk assessment of coal. Zhu Quanjie et al. [8] proposed an improved entropy weight-gray target decision method (EW-GTDM) and evaluated the risk of coal seam outburst by taking actual coal mines as an example. Tripathy et al. [9] used different machine learning modeling techniques, such as KNN, SVM, logistic regression, and decision trees, to predict coal mine safety risks. Ghasemi et al. [10] employed the Fuzzy-TOPSIS method to conduct risk assessment for underground coal mines, and the results showed that carelessness, negligence, and distraction had the most significant impact on this risk assessment. Nian Qifeng et al. [11] constructed an ANP-SPA risk assessment model to comprehensively evaluate the risk of coal mine gas explosion from four levels, “human-machine-environment-management”, determined the main influencing factors of coal mine gas explosion, and processed their interrelationships. In addition, there are other methods, such as Game Theory, the Fuzzy Comprehensive Evaluation Method, the Combination Weighting Method, the Entropy Weight Method, and the Neural Network Evaluation Method [12,13,14].
Existing study methods focus on the overall algorithm construction and optimization of models, with relatively high requirements for sample size. While the results are relatively accurate, the practical application process is complex; moreover, the setting of indicator independence remains inadequate, leading to potential correlations between indicators affecting the objectivity of the evaluation results. Based on this, this study takes coal and gas outburst in coal mine working faces as the research object and tries to introduce the fuzzy set theory on the basis of the DEMATEL method and the TOPSIS method to establish the risk assessment model of coal and gas outburst in the coal mining face, aiming to improve the independence of indicators and enhance the objectivity of the evaluation results. By avoiding biases in ranking the results caused by flaws in the assumption of indicator independence in traditional methods or unreasonable weight assignment, this approach enhances the reliability of decision-making and provides a reasonable basis for coal mine safety investment.
2. Theoretical Basis
2.1. Fuzzy DEMATEL Theory
The DEMATEL method was proposed by American scholars A. Gabus and E. Fontela, and it is a systematic analysis method using graph theory and matrix tools [15]. In practical application (MATLAB 2022b), the DEMATEL method may be affected by factors such as individual differences and subjective consciousness of experts, which reduce the credibility of the research results. The fuzzy DEMATEL method, based on the DEMATEL method, introduces the fuzzy set theory. It converts experts’ evaluations into triangular fuzzy numbers, performs fuzzification processing on experts’ scores and then obtains the direct influence matrix through defuzzification, reduces the subjectivity of evaluations, and derives the normalized matrix. Thus, it calculates the cause degree and centrality of each factor to determine the mutual influence degree between factors and their respective importance [16,17,18].
For defuzzification, this study adopts the CFCS method, whose principle is to balance the upper and lower bounds of fuzzy numbers and retain their core features. It features low computational complexity and little information loss, avoids the one-sidedness of the single extreme value method without requiring complex integral operations, and is widely used in multi-criteria decision-making (MCDM). The steps to use the CFCS method are as follows [16,18].
Triangular fuzzy number normalization is obtained as follows:
i and j, respectively, denote the row and column positions of elements in the matrix, with i = j representing the same element in the matrix; k stands for the k-th expert involved in the evaluation, and the value range of k is 1 ≤ k ≤ P (where P is the total number of experts). The meanings of these symbols remain consistent throughout the text. and denote the lower bound and upper bound of the fuzzy number, respectively; denotes the most probable value; , , and denote the lower bound, most probable value, and upper bound of the fuzzy number after standardization, respectively; and .
Calculate the standardized values of the left and right sides as follows:
and denote the left-side standardized value and the right-side standardized value.
Calculate the total normalized value as follows:
denotes the total standardized value of the score given by expert k for the degree of influence of the i-th factor on the j-th factor.
Obtain a clear value after defuzzifying the evaluation of the k-th expert as follows:
denotes the crisp value of the score given by expert k for the degree of influence of the i-th factor on the j-th factor.
Synthesize the evaluations of p experts, calculate the average clear value, and obtain the direct influence matrix as follows:
denotes the element of the matrix located in the i-th row and j-th column.
2.2. TOPSIS Theory
The TOPSIS method was first proposed by scholars C.L. Hwang and K. Yoon in 1981. It is a common multi-dimensional decision-making method and has been widely applied in fields such as engineering, manufacturing, energy, commercial finance, etc. The basic process is as follows: first, unify the indicator types of the original data matrix to obtain the initial judgment matrix; standardize the matrix to eliminate the influence of the dimensions of each indicator and identify the optimal and worst decisions; calculate the distances between each evaluation object and the optimal decision as well as the worst decision respectively; and, finally, obtain the relative approximation degree of each evaluation object to the optimal decision [19,20]. This method does not impose strict restrictions on data distribution and sample size. Its calculation process is simple and convenient, and it can accurately reflect the differences between various objects. The final ranking results are used as the basis for judging the quality of decisions, thereby obtaining the final ideal evaluation results [21].
Based on the standardized decision matrix Y of the evaluation objects calculated by the TOPSIS method, and combined with the sample comprehensive evaluation weights W calculated by the fuzzy DEMATEL method, the weighted standardized matrix Q of the evaluation objects can be obtained.
3. Fuzzy DEMATEL-TOPSIS Model Evaluation Method
The technical route of the risk assessment method for coal and gas outbursts in coal mine working faces, which combines the fuzzy DEMATEL method and the TOPSIS method, is shown in Figure 1 below.
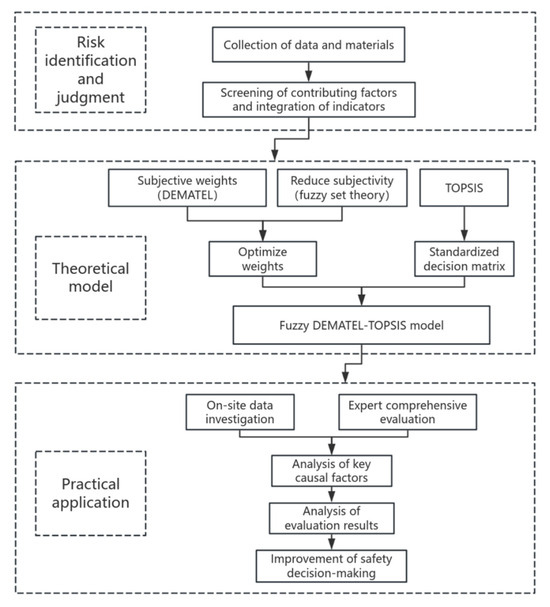
Figure 1.
Technical route for risk assessment.
3.1. Construction of the Indicator System
As a common coal mine safety accident, coal and gas outburst accidents in coal mines are significantly destructive and complex, so it is necessary to ensure that the evaluation indicator system is accurate and reasonable when conducting risk assessment. This paper establishes an indicator system model from three aspects: coal seam gas parameters, physical and mechanical properties of coal seams, and in situ stress state. This is achieved by consulting the literature, conducting field investigations, distributing questionnaires, holding expert discussions, and other methods, while comprehensively considering factors such as the current production status and sustainable development of coal mines [22,23]. Taking the evaluation indicator system for coal and gas outburst in coal mine working faces as the target layer, this model constructs 3 secondary indicators and 12 tertiary indicators through analysis from the aspects of coal seam gas factors, physical and mechanical properties of coal seams, and in situ stress state. The hierarchical relationship between indicators is shown in Figure 2.
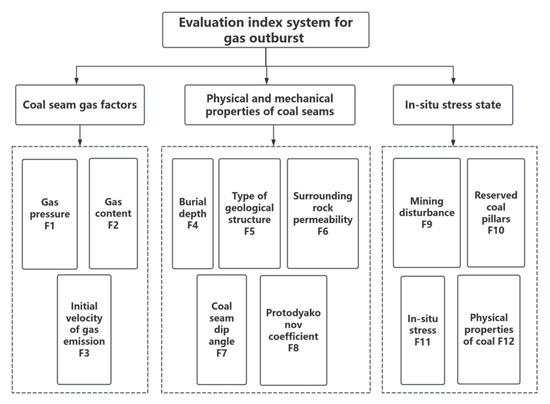
Figure 2.
Evaluation index system of coal and gas outburst in the working face.
3.2. Fuzzy DEMATE Evaluation Method
Compared with the classical DEMATEL method, the fuzzy DEMATEL method can convert experts’ evaluations into corresponding triangular fuzzy numbers, calculate the corresponding matrix, defuzzify the matrix via the CFCS method to obtain the direct influence matrix, and finally complete the final calculation with the DEMATEL method [18,24]. It can deal with the fuzzy language of uncertainty, ambiguity, and subjective judgment that are common in the decision-making environment and quantify the nonlinear relationship of complex systems into a visual causal network structure, and it is widely used in various complex analysis scenarios to help decision-makers make reliable decisions reasonably and based on evidence.
Invite multiple experts in coal mining and safety to score the relationships among the influencing factors of coal and gas outburst in coal mine working faces and introduce triangular fuzzy numbers for fuzzification to reduce the subjectivity of their scores. The conversion table of clear values for triangular fuzzy numbers is shown in Table 1.

Table 1.
Fuzzy number semantic transformation.
The fuzzy direct influence matrix is defuzzified using the CFCS method to obtain the direct influence matrix Z.
Normalize the direct influence matrix Z to obtain the normalized matrix D.
n denotes the total number of indicators (the meaning of this symbol remains consistent throughout the text).
Calculate the comprehensive influence matrix.
I is the identity matrix.
Influence degree ei, influenced degree fi, centrality degree bi, and cause degree ci.
Normalize centrality degree bi as the weight W.
3.3. TOPSIS Evaluation Method
In general, the closer the relative distance between an evaluation object and the positive ideal solution, the higher the degree of fit between them; the closer the relative distance between the evaluation object and the negative ideal solution, the lower the degree of fit. If an evaluation object is closest to the optimal solution while being farthest from the worst solution, it is the ideal optimal solution. Evaluation objects can be divided into benefit-type indicators, cost-type indicators, and intermediate-type indicators. For benefit-type indicators, the larger the indicator value, the more ideal it is; for cost-type indicators, the smaller the value, the more ideal it is; and for intermediate-type indicators, the closer the value is to a specific value, the more ideal it is [25,26].
Construct the initial judgment matrix. Suppose there is a sample set consisting of m evaluation objects and each object has an indicator set composed of n evaluation indicators, thus forming the initial judgment matrix X.
Amn denotes the n-th indicator of the m-th evaluation object, which serves as an evaluation index.
For data normalization processing, standardize matrix A to construct the standardized decision matrix Y.
(i = 1, 2, …, m; j = 1, 2, …, n)
Using the weight W obtained from the aforementioned fuzzy DEMATEL method and combining it with the standardized decision matrix Y, the weighted standardized matrix Q is finally obtained.
The calculation formulas for the positive ideal solution (Q+) and distance to positive ideal solution (D+), as well as the negative ideal solution (Q−) and distance to negative ideal solution (D−), are as follows:
Calculate the relative approximation degree λᵢ and draw a conclusion after sorting.
4. Case Application
4.1. Overview of the Mining Area
This paper takes a coal mine in Jiangxi Province as an example and selects the 3908 working face in the third mining area of the first level of the D9 coal seam as a practical case to verify the rationality of the fuzzy DEMATEL-TOPSIS model in the safety assessment of coal and gas outbursts in the working face. Given its low coal and gas outburst risk, this coal mine can serve as a typical sample for low-risk scenarios, providing a reference for decision-making on the “matching of prevention investment and risk” in low-risk coal mines.
The mine is located in a low, hilly area, where the strike of the mountains is consistent with the strike of the strata. The elevation difference of the terrain gradually decreases from the northwest to the southeast, whereas it turns southward and flattens out, with slight undulations. The working face has a burial depth of 364 m, a strike length of 80 m, and an inclined length of 80 m. The geological structure type of the area where the working face is located is relatively simple, and no rock burst has occurred. The coal seam is completely developed within the working face, with an average thickness of 2.67 m and an average dip angle of 38 degrees. The roof and floor of the coal seam are siltstone, with very few being fine sandstone or mudstone. The hydrogeological conditions in the area are simple, with no risk of water hazards. The rocks occur in stable layers, belonging to type II, which is classified as basically stable. The structure of the working face is simple, the coal seam is basically straight, there is no fault structure, and there is only a certain undulation in the inclination direction. There is no influence from coal pillars, and the disturbance caused by mining is relatively small. The coal seam is mainly fat coking coal, with relatively soft coal quality. It belongs to type III damaged coal, and the coal seam firmness coefficient is 0.8. According to the detection results, the gas emission rate is 2.47 m3/min, the gas pressure is 0.46 MPa, and the gas content is 2.85 m3/t.
4.2. Fuzzy DEMATEL Method Calculations
To ensure the fairness and accuracy of the scoring and enhance the persuasiveness of the evaluation results, this study comprehensively considered factors such as professional identity, years of work experience, and educational background, and it invited a total of 10 experts, including technical workers from coal mines and researchers from universities. Among these experts, there are two researchers with over 5 years of coal mine work experience, two senior engineers (professor-level), and three associate senior engineers each with more than 10 years of relevant experience; in addition, the university-based experts include two associate professors with 5 years of work experience and one professor with over 10 years of work experience, ensuring the diversity and professionalism of the expert panel to support the reliability of the subsequent evaluation process.
With reference to Table 1, triangular fuzzy numbers are introduced to complete the semantic conversion, and the expert scores are fuzzified. Then, using the CFCS, the expert scores are defuzzified according to Formulas (1)–(9) to obtain the direct influence matrix. Z.
According to the direct influence matrix Z and Formulas (10)–(12), the normalized matrix D can be obtained.
Substituting the normalized matrix D into Formula (13), the comprehensive influence matrix T can be obtained.
Based on the calculated comprehensive influence matrix T, by substituting it into Formulas (14)–(17), the influence degree, influenced degree, centrality degree, cause degree, weight, and ranking can be obtained, respectively, as shown in Table 2 below.
Table 2.
Interrelationship and weighting of factors.
With the centrality degree as the abscissa and the cause degree as the ordinate, the causal relationship diagram is shown in Figure 3 below.
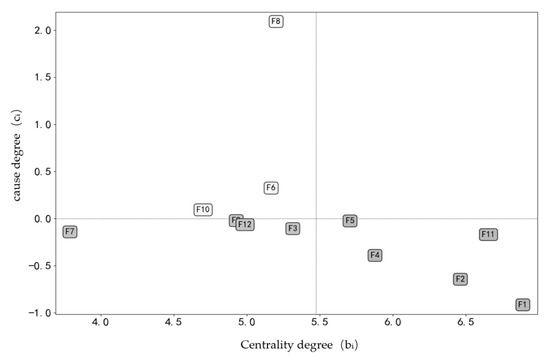
Figure 3.
Causal relationship diagram.
From the calculation results, it can be seen that gas pressure, in situ stress, gas content, burial depth, type of geological structure, initial velocity of gas emission, physical properties of coal, mining disturbance, and coal seam dip angle are result factors, while Protodyakonov coefficient, surrounding rock permeability, and reserved coal pillars are cause factors. Among them, gas pressure, in situ stress, gas content, burial depth, and type of geological structure are the five factors with a relatively high degree of influence.
The indicator weight W can be obtained by normalizing the centrality degree according to Formula (18); this result provides a weight basis for subsequent evaluations.
W = (0.105, 0.101, 0.098, 0.089, 0.087, 0.081, 0.079, 0.079, 0.076, 0.075, 0.072, 0.058)
4.3. TOPSIS Method Calculations
Based on the correlation between various influencing factors, experts evaluate the factors affecting coal and gas outbursts in each working face. According to the characteristics of coal and gas outbursts—including geological dynamic characteristics, gas occurrence characteristics, and coal structure characteristics—and industry standards, coal and gas outbursts are classified into five levels based on danger degree: Level I (safe), Level II (relatively safe), Level III (medium), Level IV (relatively dangerous), and Level V (extremely dangerous). Combining the on-site actual situation, referring to the research results of Chen, Yin, et al., and in accordance with relevant standards, such as the Regulations on Prevention and Control of Coal and Gas Outburst and Coal Mine Safety Regulations, the qualitative standards are converted into quantitative expressions, and finally, the risk of the coal and gas outburst in the working face and its main influencing factors are determined [27,28].
The various data measured in working face 3908 are shown in Table 3. Indicators that cannot be judged based on specific data are classified into five levels according to the risk degree of coal and gas outbursts from low to high, namely, Level Ⅰ (safe, 1), Level Ⅱ (relatively safe, 2), Level Ⅲ (medium, 3), Level Ⅳ (relatively dangerous, 4), and Level Ⅴ (extremely dangerous, 5). The risk assessment table for coal and gas outbursts in the working face and the data of each indicator are shown in Table 3.
Table 3.
Classification of hazard levels for working face indicators.
The data in the above table are substituted into Formula (19) to construct the initial judgment matrix X, and the standardized decision matrix Y is obtained by Formulas (20) and (21).
According to Formula (22), combined with the weight W calculated by the fuzzy DEMATEL method and the standardized decision matrix Y, the weighted standardized matrix Q can be obtained.
Based on Formulas (23)–(26), the positive ideal solution (Q+), distance to the positive ideal solution (D+), negative ideal solution (Q−), and distance to the negative ideal solution (D−) are obtained.
Q+ = [0.01042, 0, 0, 0, 0, 0.0518, 0, 0.05930, 0, 0, 0, 0]
Q− = [0.06796, 0.07568, 0.06316, 0.05363, 0.05125, 0, 0.05149, 0.01186, 0.04864, 0.04424, 0.04584, 0.03890]
D+ = [0.26302, 0.22089, 0.17950, 0.14269, 0.09115, 0.23476]
D− = [0.09090, 0.08621, 0.09981, 0.13585, 0.15895, 0.08685]
The tendency grade of coal and gas outbursts in the working face is obtained according to Formula (27).
λ = [0.25684, 0.28071, 0.35734, 0.48772, 0.63555, 0.27005]
4.4. Analysis of the Results
Through the weight W calculated by the fuzzy DEMATEL method, the importance weights of each influencing factor can be ranked. Among them, the top five factors leading to coal and gas outbursts in the working face are gas pressure, in situ stress, gas content, burial depth, and type of geological structure. Therefore, emphasis should be placed on these factors in the prevention and control of coal and gas outbursts, with strengthened monitoring and management.
According to the evaluation results, the coal and gas outburst tendencies of the working face, sorted by magnitude, are as follows: I (0.25684) < working face 3908(0.27005) < II (0.28071) < III (0.35734) < IV (0.48772) < V (0.63555).
Risk classification falls within the range from safe to relatively safe, belonging to the relatively safe level for coal and gas outbursts, which is consistent with the actual results of coal and gas outbursts.
4.5. Improvement Measures
Based on the above analysis results, targeted preventive measures can be formulated by focusing on key influencing factors, such as gas pressure, burial depth, and gas content, so as to improve the level of proactive risk prevention and control.
Priority should be given to key technologies, such as directional long-borehole pre-extraction and real-time monitoring and early warning; combined with coal seam permeability improvement, gas pressure and content shall be reduced to safety thresholds from the source.
Governance strategies corresponding to different burial depths shall be formulated, such as increasing pre-extraction time and densifying pressure–relief boreholes in high-risk areas, while combining coal seam occurrence conditions to avoid inefficiency or inadequate prevention and control. For high-stress areas, technologies such as hydraulic fracturing for pressure relief shall be adopted to proactively release accumulated stress.
An intelligent prevention and control platform shall be built to integrate various monitoring data; data fusion algorithms shall be used to analyze the influence weights of various parameters on coal and gas outbursts so as to achieve automatic monitoring, early warning, and risk prevention and control, thereby enhancing the scientificity and timeliness of governance.
5. Conclusions
- In this paper, 12 specific indicators are established from three aspects: coal seam gas factors, physical and mechanical properties of coal seams, and in situ stress state. This can avoid the impact of individual indicators on the results and improve the accuracy of the evaluation.
- Compared with the traditional DEMATEL method, this paper introduces the fuzzy set theory after expert scoring and performs fuzzification on expert scores. This can effectively avoid the subjectivity of experts in evaluating indicators and make the indicator weights more in line with the actual situation.
- This study constructed the fuzzy DEMATEL-TOPSIS evaluation model and took the 3908 working face of a coal mine as an example for analysis. The relative approximation degree of coal and gas outburst was calculated as 0.270, corresponding to Hazard Level II (relatively safe). This result is consistent with on-site actual conditions, which verifies the application value of the model.
- The main influencing factors of coal and gas outbursts in this coal mine, sorted in descending order of weight, are gas pressure (0.105), in situ stress (0.101), gas content (0.098), and burial depth (0.090). This provides specific ideas with both pertinence and operability for coal mine safety governance and can also serve as a reference for safety management practices in similar low-risk coal mines.
- Given that the current model was mainly constructed based on existing cases, its generalizability and assessment accuracy still have room for improvement. Therefore, in the next step, more cases will be used to verify and improve the model, so as to enhance the accuracy of the assessment.
Author Contributions
N.T.: conceptualization, methodology, and writing—original draft. X.Q.: investigation, visualization, and writing—original draft. X.G.: methodology and resources. Y.S.: validation and writing—review and editing. S.Z.: writing—review and editing. All authors have read and agreed to the published version of the manuscript.
Funding
This research was funded by the National Natural Science Foundation of China (Grant No. 52304215) and the Open Research Grant of Joint National-Local Engineering Research Centre for Safe and Precise Coal Mining (Grant No. EC2023019).
Data Availability Statement
The data that supports the findings of this study are available within the article. Alternatively, more relevant details can be obtained by contacting the corresponding author, provided that the relevant request is reasonable.
Acknowledgments
We would like to express our sincere gratitude to all those who have contributed to this research. Their valuable suggestions, careful guidance, and selfless assistance have provided tremendous support for the successful completion of this study.
Conflicts of Interest
All authors confirm that there are no conflicts of interest (including but not limited to economic interests, academic competition, personal relations, etc.) that may affect the objectivity of the research during the research and the writing of this paper. There are no disputes among the authors regarding the authorship, content expression, and other aspects of the paper.
References
- Ni, K.; Liu, C.; Wang, Y. Research on The Current Situation and Trends of World Coal Industry Development During The 14th Five Year Plan Period. China Coal 2024, 50, 235–245. [Google Scholar] [CrossRef]
- Xie, H.-P.; Wu, L.-X.; Zheng, D.-Z. Prediction on The Energy Consumption and Coal Demand of China In 2025. J. China Coal Soc. 2019, 44, 1949–1960. [Google Scholar] [CrossRef]
- Liangguo, K. The Impact of the Chinese Coal Economy on Coal Mine Deaths from 1992 to 2021. Min. Metall. Explor. 2024, 41, 207–218. [Google Scholar] [CrossRef]
- Wang, H.-J.; Qi, Q.-J.; Liang, Y.-T.; Qi, Q.-X.; Liu, Y.-J. Statistical Analysis and Countermeasures of Major Accidents in Coal Mines in China. China Saf. Sci. J. 2024, 34, 9–18. [Google Scholar] [CrossRef]
- Li, H.; Yang, T.; Li, L.-M.; Lu, B.; Zhang, T.-Z.; Lu, X.-L.; Peng, R.; Wang, Z.-H. Location-Specific Climate and Environmental Benefits of China’s Coal Mining Phase-Down Towards Carbon Neutrality. Glob. Environ. Change 2025, 95, 103057. [Google Scholar] [CrossRef]
- Rouhani, A.; Skousen, J.; Tack, F.M.G. An Overview of Soil Pollution and Remediation Strategies in Coal Mining Regions. Minerals 2023, 13, 1064. [Google Scholar] [CrossRef]
- Güllüdağ, C.B.; Kartal, N.Ü. Comparison of The Distribution of Environmentally Hazardous Elements in Coal with Kriging and IDW Methods (Tekirdağ-Malkara Coalfield). J. Sci. Rep. A 2022, 50, 44–67. [Google Scholar]
- Zhu, Q.-J.; Zhang, E.-H.; Li, Q.-S.; Ma, S.; Zhang, Z. Risk Assessment Theory of The Coal and Gas Outbursts and Its Application to The Entropy Weight and Grey Target Decision Methods. J. Saf. Environ. 2020, 20, 1205–1212. [Google Scholar] [CrossRef]
- Tripathy, D.P.; Parida, S.; Khandu, L. Safety Risk Assessment and Risk Prediction in Underground Coal Mines Using Machine Learning Techniques. J. Inst. Eng. India Ser. D 2021, 102, 495–504. [Google Scholar] [CrossRef]
- Ghasemi, A.; Sereshki, F.; Ataei, M. Investigating the Role of Human Factors in The Risk Assessment of Underground Coal Mines. Rud.-Geološko-Naft. Zb. 2024, 39, 165–180. [Google Scholar] [CrossRef]
- Nian, Q.-F.; Shi, S.-L.; Li, R.-Q. Application of ANP-SPA Risk Assessment Model for Gas Explosion in Coal Mine. Sci. Technol. Rev. 2013, 31, 40–44. [Google Scholar]
- Adam, S.M.; Dorota, S. Fuzzy Logic Approach to Calculation of Thermal Hazard Distances in Process Industries. Process Saf. Environ. Prot. 2014, 92, 338–345. [Google Scholar] [CrossRef]
- Lin, Z.J.; Li, M.; He, S.; Shi, S.L.; Tian, X.N.; Wang, D. Risk Assessment of Gas Explosion in Coal Mines Based on Game Theory and Bayesian Network. J. China Coal Soc. 2024, 49, 3484–3497. [Google Scholar] [CrossRef]
- Yu, B.; Chen, G.B.; Chen, X.; Sun, X.L. CW-TOPSIS Coal And Gas Co-Mining Evaluation Model Based on Game Theory and Its Application: A Case Study of Zhaoguan Coal Mine. Sci. Technol. Eng. 2024, 24, 14170–14177. [Google Scholar]
- Sun, Y.-H.; Han, W.; Duan, W.-C. Review on Research Progress of DEMATEL Algorithm for Complex Systems. J. Control Decis. 2017, 32, 385–392. [Google Scholar] [CrossRef]
- Yuan, Q.; Zhang, X.-K.; Zhu, H.-Q.; Zhang, B.-Z.; Chen, J. Research on Influencing Factors of Coal Mine Safety Production Based on Integrated Fuzzy DEMATEL-ISM Methods. Energy Sources A Recovery Util. Environ. Eff. 2023, 45, 2811–2830. [Google Scholar] [CrossRef]
- He, L.-N.; Wang, G.-T.; Liu, J. Supply Chain Risk Management Based on Hesitant Fuzzy DEMATEL And House of Risk. Comput. Integr. Manuf. Syst. 2021, 27, 1459–1468. [Google Scholar] [CrossRef]
- Wu, W.-W.; Lee, Y.-T. Developing Global Managers’ Competencies Using the Fuzzy DEMATEL Method. Expert Syst. Appl. 2005, 32, 499–507. [Google Scholar] [CrossRef]
- Dönmez, O.-H.; Tunçdemir, H.; Acaroğlu, Ö. Fuzzy AHP-TOPSIS Framework for Rock Mass Classification Based on RMQR Criteria. Geotech. Geol. Eng. 2025, 43, 325. [Google Scholar] [CrossRef]
- Liu, Y.; Xie, G.-Q.; Zheng, H.-L.; Ma, X.-F.; Ren, G.-C.; Feng, X.-Y.; Zhao, W.-K.; Ma, H.; Lei, F.-Y. Optimization of Fracturing Sweet Spot in Deep Carbonate Reservoirs by Combining TOPSIS and AHP Algorithm. Processes 2025, 13, 2777. [Google Scholar] [CrossRef]
- Jin, R.-B.; Wang, L.; Zhang, T.-J.; Li, Q.-F. Bridge Construction Quality Evaluation Based on Combination Weighting Method- Technique for Order Preference by Similarity to an Ideal Solution Theory. Appl. Sci. 2023, 13, 12018. [Google Scholar] [CrossRef]
- Shi, H.-K.; Qi, Y.; Zhang, G.-E.; Jiang, X.-Y.; He, X.; Sun, Y.-H. Risk Assessment of Coal and Gas Outburst Based on Combination Weighting and Grey Clustering. China Saf. Sci. J. 2023, 33, 52–57. [Google Scholar] [CrossRef]
- Zheng, X.-L.; Lai, W.-H.; Xue, S. Application of MI and SVM in coal and gas outburst prediction. China Saf. Sci. J. 2021, 31, 75–80. [Google Scholar] [CrossRef]
- Hatefi, M.S.; Tamošaitienė, J. An Integrated Fuzzy DEMATEL-Fuzzy ANP Model for Evaluating Construction Projects by Considering Interrelationships Among Risk Factors. J. Civ. Eng. Manag. 2019, 25, 114–131. [Google Scholar] [CrossRef]
- Hu, Y.-H. The Improved Method for TOPSIS in Comprehensive Evaluation. Math. Pract. Theory 2002, 4, 572–575. [Google Scholar]
- Gong, J.; Hu, N.-L.; Cui, X.; Wang, X.-D. Rockburst Tendency Prediction Based on AHP-TOPSIS Evaluation Model. Chin. J. Rock Mech. Eng. 2014, 33, 1442–1448. [Google Scholar] [CrossRef]
- Chen, L.-Y.; Li, X.-J.; Bi, J.; Hua, Y.-J.; Wei, Z.-Y. Prediction of Coal-Gas Outburst Induced by Rock-Burst Tendency Based on Ahp-Topsis. China Saf. Sci. J. 2020, 30, 47–52. [Google Scholar] [CrossRef]
- Yin, Y.-M.; Zhang, X.-K.; Jiang, F.-X.; Yu, Z.-X. Study on Mechanical Mechanism and Danger Evaluation Technology of Coal and Gas Outburst Induced by Rockburst. J. Min. Saf. Eng. 2018, 35, 801–809. [Google Scholar] [CrossRef]


Disclaimer/Publisher’s Note: The statements, opinions and data contained in all publications are solely those of the individual author(s) and contributor(s) and not of MDPI and/or the editor(s). MDPI and/or the editor(s) disclaim responsibility for any injury to people or property resulting from any ideas, methods, instructions or products referred to in the content. |
© 2025 by the authors. Licensee MDPI, Basel, Switzerland. This article is an open access article distributed under the terms and conditions of the Creative Commons Attribution (CC BY) license (https://creativecommons.org/licenses/by/4.0/).