Article

Effects of the Fluctuating Wind Loads on Flow Field Distribution and Structural Response of the Dish Solar Concentrator System Under Multiple Operating Conditions

1
College of Mechanical and Vehicle Engineering, Hunan University, Changsha 410082, China
2
School of Mechanical Engineering, Hunan Engineering University, Xiangtan 411104, China
3
Institute of New Energy and Energy-Saving & Emission-Reduction Technology, Hunan University, Changsha 410082, China
*
Authors to whom correspondence should be addressed.
Processes 2025, 13(11), 3444; https://doi.org/10.3390/pr13113444
Submission received: 17 September 2025 / Revised: 16 October 2025 / Accepted: 23 October 2025 / Published: 27 October 2025

Abstract

With the rapid development of solar thermal power generation technology, the structural stability of the dish solar concentrator system under complex wind environments has become a critical limiting factor for its large-scale application. This study investigates the flow field distribution and structural response under fluctuating wind loads using computational fluid dynamics (CFD). A three-dimensional model was developed and simulated in ANSYS Fluent under varying wind angles and speed cycles. The results indicate that changes in the concentrator’s orientation significantly influence the airflow field, with the most adverse effects observed at low elevation angles (0°) and an azimuth angle of 60°. Short-period wind loads (T = 25 s) exacerbate transient impact effects of lift forces and overturning moments, markedly increasing structural fatigue risks. Long-period winds (T = 50 s) amplify cumulative drag forces and tilting moments (e.g., peak drag of −73.9 kN at β = 0°). Key parameters for wind-resistant design are identified, including critical angles and period-dependent load characteristics.

1. Introduction

As a zero-emission clean energy source, solar energy [1,2] has become a core component of renewable energy systems due to its sustainability advantages. Compared with traditional energy sources, solar energy development eliminates fuel combustion processes [3,4], and produces minimal environmental pollution throughout its lifecycle [5,6], combining practical application value with long-term developmental potential. Current mainstream solar utilization technologies can be categorized into three types based on energy conversion mechanisms [7,8,9]: solar thermal power systems generating heat output through photothermal effects, photovoltaic power technology based on semiconductor material photovoltaic effects, and photochemical conversion technologies storing chemical energy via photochemical reactions. Solar thermal power generation technology [10,11,12], with its stable electricity output characteristics, demonstrates significantly superior grid compatibility compared to weather-dependent photovoltaics. Its cascade waste heat can synergistically support diversified applications such as heating [13,14] and seawater desalination [15].
Dish systems, optimized through vacuum-driven mechanisms [16], thermal expansion compensation [17], sealing technologies [18], and condensation techniques [19], integrate distributed power supply with large-scale integration capabilities. Their dry-cooling design and low-pollution characteristics are particularly suitable for large-scale power plant construction in arid regions. Studies have shown [20] that dish solar thermal systems are predominantly deployed in open sandy-wind environments. The concentrators’ large surface area makes them susceptible to wind-induced mirror displacement and vibrations, causing focal point deviations that reduce power generation efficiency. Additionally, wind loads generate structural stress concentrations, diminishing mechanical strength and potentially leading to structural failure [21].
In the field of wind load characteristic research for dish solar concentrator system, Liu et al. [22] revealed differences in wind pressure distribution on reflector surfaces caused by concentrator attitude angle variations under constant wind speeds through wind tunnel experiments based on parabolic concentrator configurations. They found that overturning moments reached extreme values when the concentrator elevation angle reached 60°, establishing critical instability criteria. Furthermore, their simplified physical model provided theoretical explanations for wind-induced failure mechanisms in engineering practice and proposed structural stability enhancement measures. Zuo et al. [23] further developed a multi-condition wind load mechanical model through numerical simulations, systematically analyzing dynamic response characteristics under coupled wind attack and elevation angles. Vibration resistance studies by the same team [24] demonstrated that wind-induced vibrations significantly reduce the system’s low-order natural frequencies, while azimuth angle variations induce nonlinear torque growth. The research emphasized the necessity of avoiding resonance risks through modal analysis and local stiffness optimization. Further refining concentrator array gap dimensions, Yu et al. [25] showed that increasing gaps to 60 mm exacerbates wind vibration risks at mirror edges, particularly under 60° yaw angles where wind load coefficients exhibit nonlinear growth. However, overly small gaps (<60 mm), while suppressing aerodynamic loads, degrade optical precision due to reduced reflective area and edge stress concentration, necessitating gap parameter optimization under structural stability and tracking accuracy constraints. Yan et al. [26] discovered that wind-induced structural deformations in dish concentrators cause flux distribution distortion and optical efficiency attenuation, severely limiting system energy output. They proposed a coordinated control strategy combining tracking compensation and receiver translation compensation. This method reduced the energy distribution factor Ee of cylindrical cavity receivers from 0.12–0.17 to 0.01–0.06 and horn cavity receivers from 0.41–0.62 to 0.04–0.19, effectively eliminating localized high-flux and light interception losses, validating the structural deformation compensation mechanism. Ali’s team [27] identified wind-induced deformations and gravity loads as critical constraints on dish concentrator optical precision, proposing honeycomb sandwich composite materials to replace steel structures. Through fluid–structure interaction analysis, they revealed aerodynamic load distribution characteristics under varying azimuth/elevation angles and quantified wind-induced focal spot distortion rates using ray tracing, providing failure thresholds and optical compensation benchmarks for lightweight concentrator design. Egerer et al. [28] conducted the first field measurements at operational CSP plants, demonstrating that parabolic trough collectors under vertical wind directions significantly alter turbulent fields, causing static/dynamic load surges in support structures (exceeding wind tunnel test values) that directly threaten optical efficiency and structural integrity. Jian et al. [29] proposed an optomechanical integrated modeling method coupling finite element analysis with ray tracing to quantify wind load/gravity deformation impacts on dish concentrator flux. They established a discretized mirror surface model with verified accuracy (relative error 0.6–5.6%), providing a universal framework for deformation-induced optical prediction. Ji et al. [30] developed a wind load evaluation method by constructing a multi-mirror heliostat finite element model, quantifying pitch angle (from 95.5% to 72.2%) and wind direction impacts on concentrator efficiency loss. The study revealed heightened wind direction sensitivity at low pitch angles, offering theoretical foundations for wind resistance optimization. Merarda et al. [31] combined CFD and finite element methods to analyze decade-long fatigue damage in Algerian heliostats, uncovering wind direction-dependent stress concentration effects and clarifying lifespan variations related to wind speed and stress cycles, emphasizing fatigue inspection necessity in structural design. E et al. [32] established a dish concentrator fluid–structure interaction model using STAR-CCM+ and ABAQUS, mapping CFD pressure fields to finite element models to analyze vibration characteristics under varying pitch angles, azimuth angles, and wind speeds. The validated model predicted amplitude and frequency variations, showing that vibrations under sinusoidal wind loads peak briefly before attenuating. Elevation angles minimally affect modal frequencies (natural frequency variation <5%), and wind speed increases only induce minor frequency shifts, revealing that dynamic responses are dominated by wind load temporal characteristics. This study provides high-precision simulation foundations for vibration suppression and structural optimization.
Existing research [33] has preliminarily revealed wind-induced behavior patterns of concentrators, but the dynamic stability mechanisms under complex turbulent field-structure aeroelastic coupling require deeper analysis. Compared to the aerodynamic research frameworks for trough and tower systems [34], fundamental theories on gap turbulence effects and transient posture adjustment responses in dish concentrators—critical aerodynamic bottlenecks affecting large-scale engineering applications—remain underdeveloped. Systematic exploration of these characteristics is urgently needed to unlock their technological potential.
Novel Contributions: This study provides new insights into the fluctuating wind load effects on dish concentrators by:
(1) Quantifying flow field and load variations under multiple operating conditions (azimuth and elevation angles) and wind periods (25 s and 50 s).
(2) Identifying critical angles (e.g., β = 60°, α = 60°) where short-period winds exacerbate transient loads, and long-period winds amplify cumulative effects.
(3) Offering practical guidelines for wind-resistant design based on aerodynamic load characteristics.
(4) The comparison of 25 s and 50 s wind periods is justified by their relevance to real wind fluctuations in solar farm environments, as documented in meteorological studies [35].
This study initially established a three-dimensional model of a dish solar concentrator using SolidWorks software 2025, which was subsequently imported into ANSYS Fluent 2025R1 for detailed simulation calculations. The research systematically investigated the aerodynamic behavior of the concentrator under varying operating angles and periodic wind speed conditions, as well as dynamic variations in the airflow field. Furthermore, by adjusting inlet wind speed cycles, the extremal variations in forces and moments acting on the dish concentrator under fluctuating wind effects were analyzed, revealing the distribution characteristics of the surrounding airflow field under periodic wind loading.

2. Finite Element Model and Mathematical-Physical Model

2.1. Establishment of Finite Element Simulation Model for Concentrators

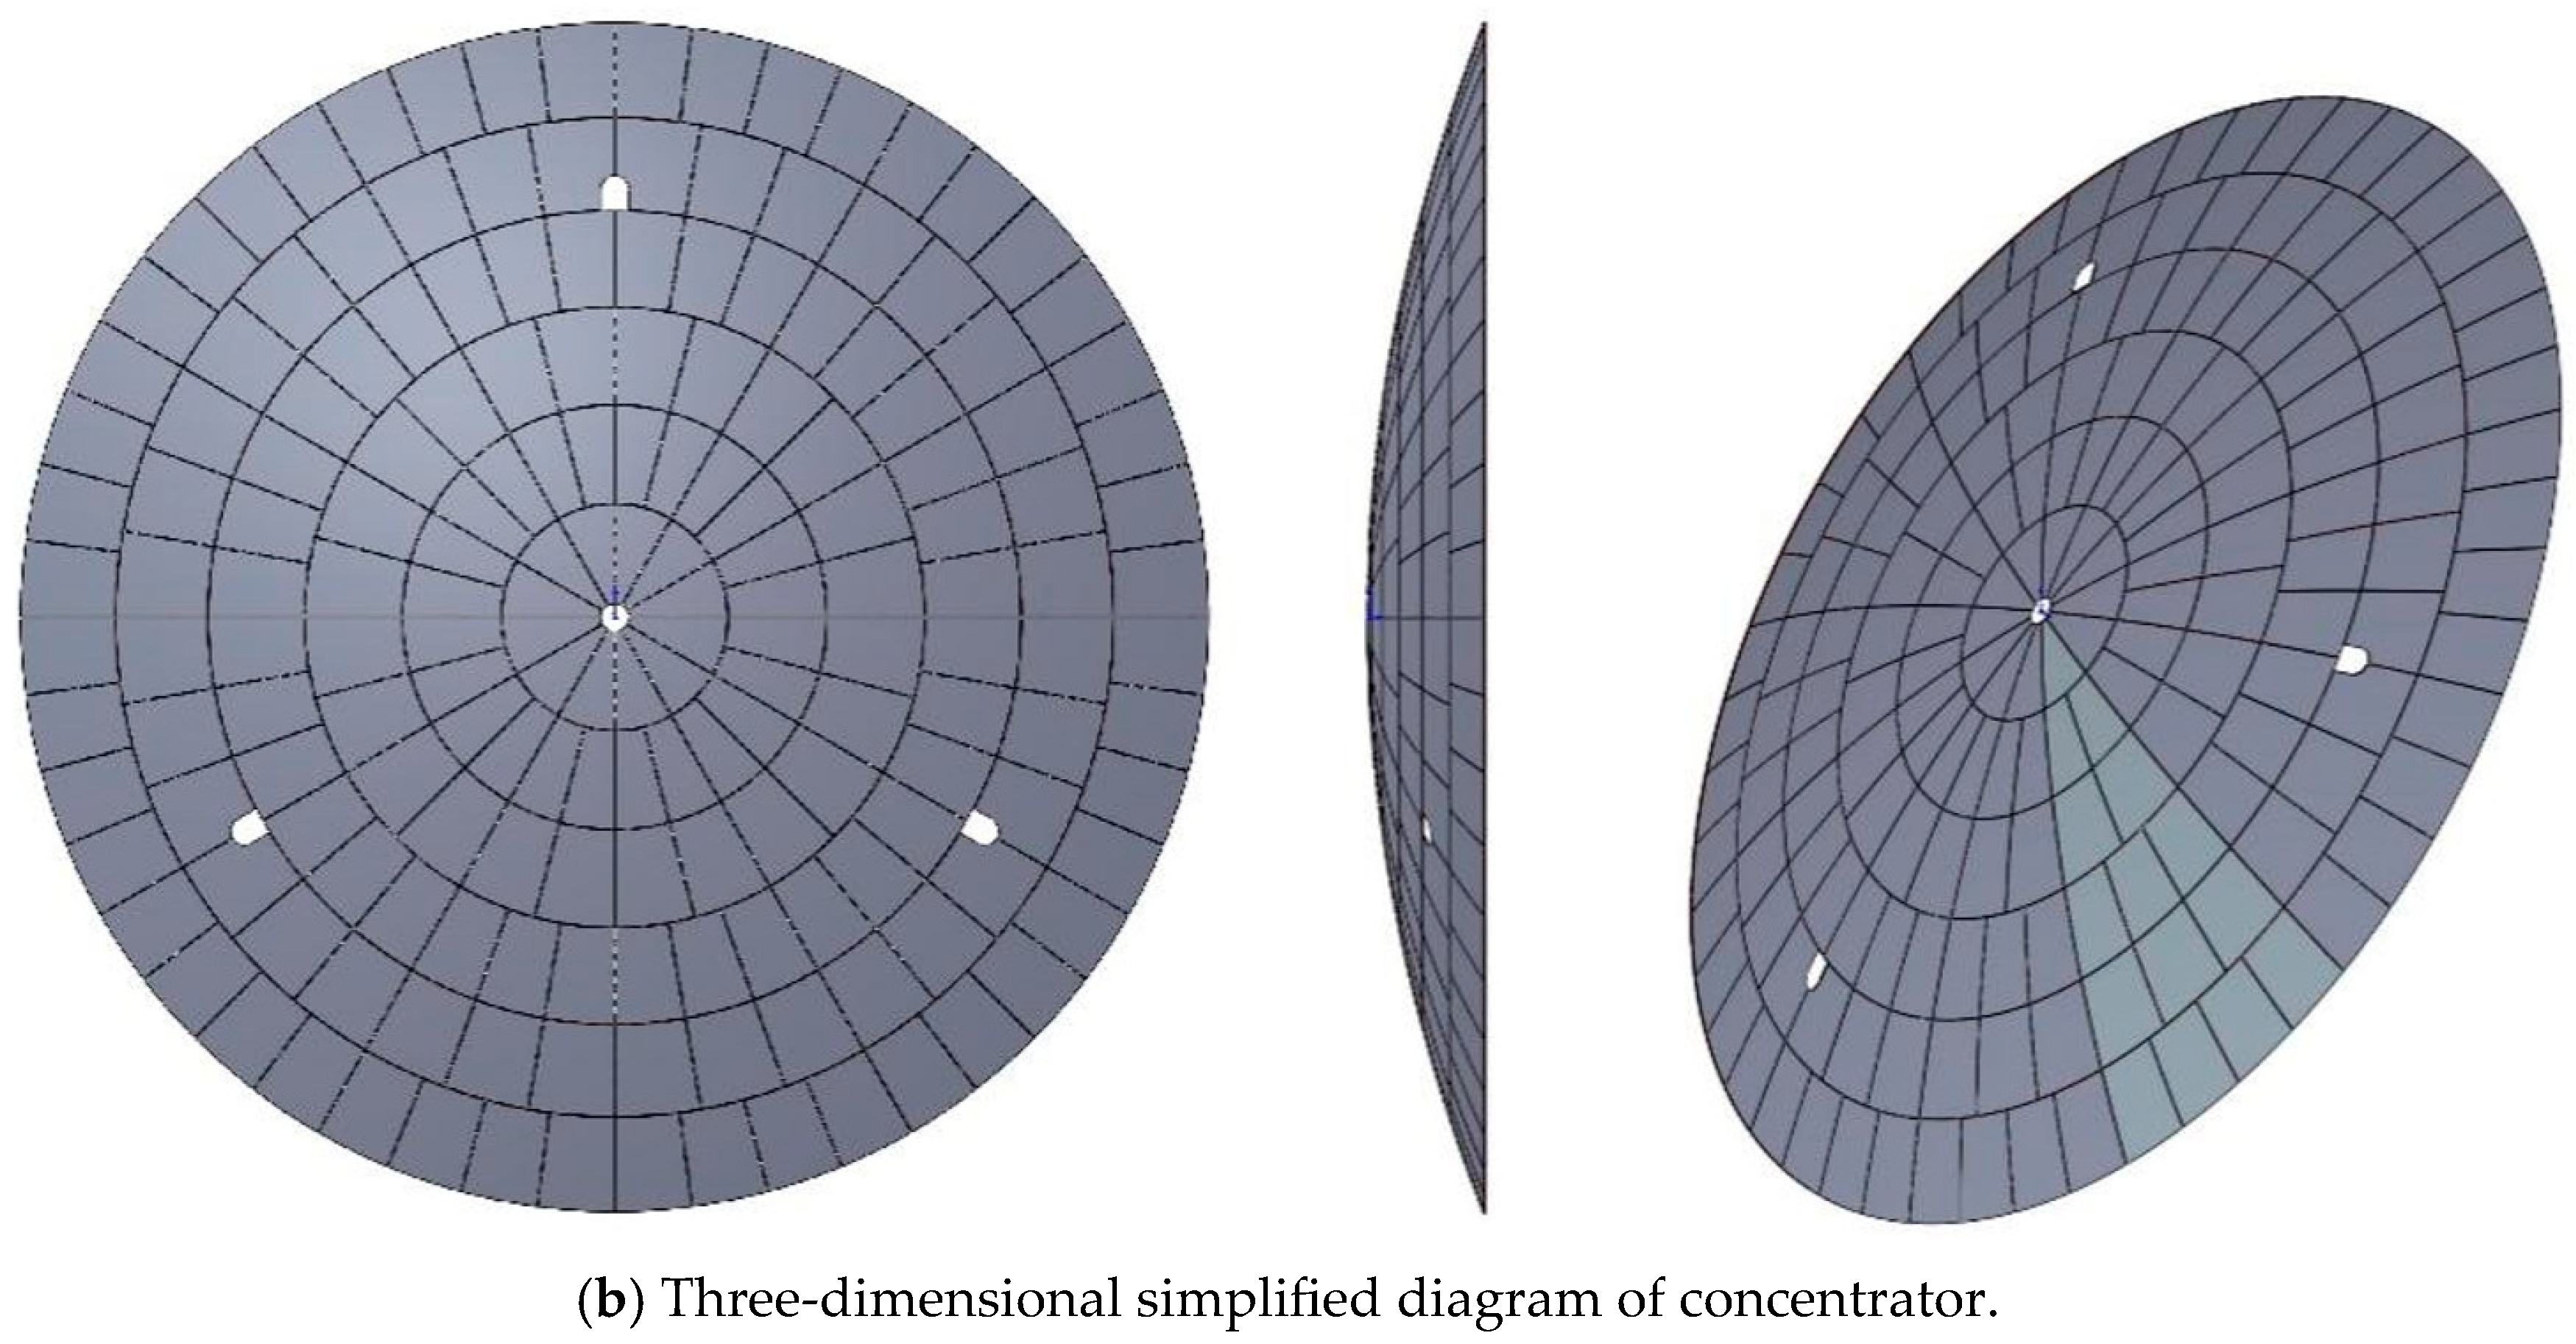
This study employed a full-scale three-dimensional modeling approach to investigate the aerostructural characteristics of concentrators, with a focus on mechanical stability under wind loads. As shown in the topology-optimized model in Figure 1a, thermomechanical coupling components were appropriately simplified while maintaining the integrity of critical load-transfer paths. The geometric configuration of the concentrator surface strictly adheres to the standard rotational paraboloid equation x2 + z2 = 42.735. Through coordinate transformation, the Cartesian spatial domain of the effective reflective surface was defined as x, z ∈ [−8.52, 8.52] m and y ∈ [4.6 × 10⁻⁴, 1.698] m, forming a precise paraboloid with an axial extension of 16.98 m and a projected diameter of 17.04 m. As the primary wind-bearing component, the concentrator was modeled using a parametric simplification strategy (Figure 1b), decomposed into 180 modular mirror units with a thickness of 27 mm. Dynamic compensation gaps of 15.5 mm were set between units, a design that satisfies mirror curvature accuracy requirements while providing stress relief space for wind-induced deformations. The digital prototype constructed on the SolidWorks platform fully preserves assembly constraints of structural components, establishing a high-fidelity geometric foundation for subsequent aerodynamic load analysis.

2.2. Mathematical-Physical Model

2.2.1. Governing Equations for Fluid Motion

At the molecular scale, fluids are fundamentally dynamic systems where discrete molecular clusters transfer momentum and energy through collisions [36]. However, in macroscopic engineering applications (where characteristic dimensions far exceed molecular mean free paths), the continuum hypothesis treats fluids as gapless continua, assigning continuously distributed state parameters—such as density, velocity, and pressure—to each fluid parcel [37]. Within this theoretical framework, fluid motion is governed by three fundamental conservation laws: mass conservation (continuity equation), momentum conservation (Navier–Stokes equations), and energy conservation. The Navier–Stokes equations for incompressible flow consist of the continuity equation (mass conservation) and momentum conservation equations.
The mass conservation law characterizes the material continuity in fluid particle transport processes, momentum conservation reflects the dynamic equilibrium between forces and motion states of fluid elements, while energy conservation establishes coupled relationships between thermodynamic parameters and mechanical work. The specific differential equation forms and physical implications of these conservation laws have been systematically elaborated in reference [38], forming the mathematical foundation for modern fluid dynamics analysis.

2.2.2. Numerical Methods in Computational Fluid Dynamics

Computational fluid dynamics (CFD) numerical methods encompass three major systems: finite difference method, finite element method, and finite volume method [39]. Among these, the finite volume method is widely adopted due to its strict conservation properties [40]. Given the parabolic characteristics of dish concentrators, this study employed the finite difference method for geometric discretization. Simultaneously, control equations were implemented in the Fluent platform using the finite volume method [41], achieving a balance between accuracy and computational efficiency through second-order upwind discretization of convective terms.

2.3. Parameter Settings

Air at ambient temperature was selected as the computational fluid. The standard k-ε model [42] is renowned for its computational efficiency, rapid convergence, and reasonable accuracy in predicting flows such as boundary layers [43], flow around obstacles [44], and engineering applications with partial recirculation [45]. Therefore, it was adopted for this study. Consequently, this study adopted the standard k-ε model for numerical calculations. However, the standard k-ε model may not fully capture complex flow separation and vortex dynamics around bluff bodies like dish concentrators. Its use here is justified by the model’s robustness for engineering applications and computational efficiency, though limitations are acknowledged in Section 5. The reference pressure was set to 1 standard atmospheric pressure. For this computational fluid, wind tunnel experimental simulations were implemented using three boundary conditions within the computational domain:
(1) Inlet boundary condition
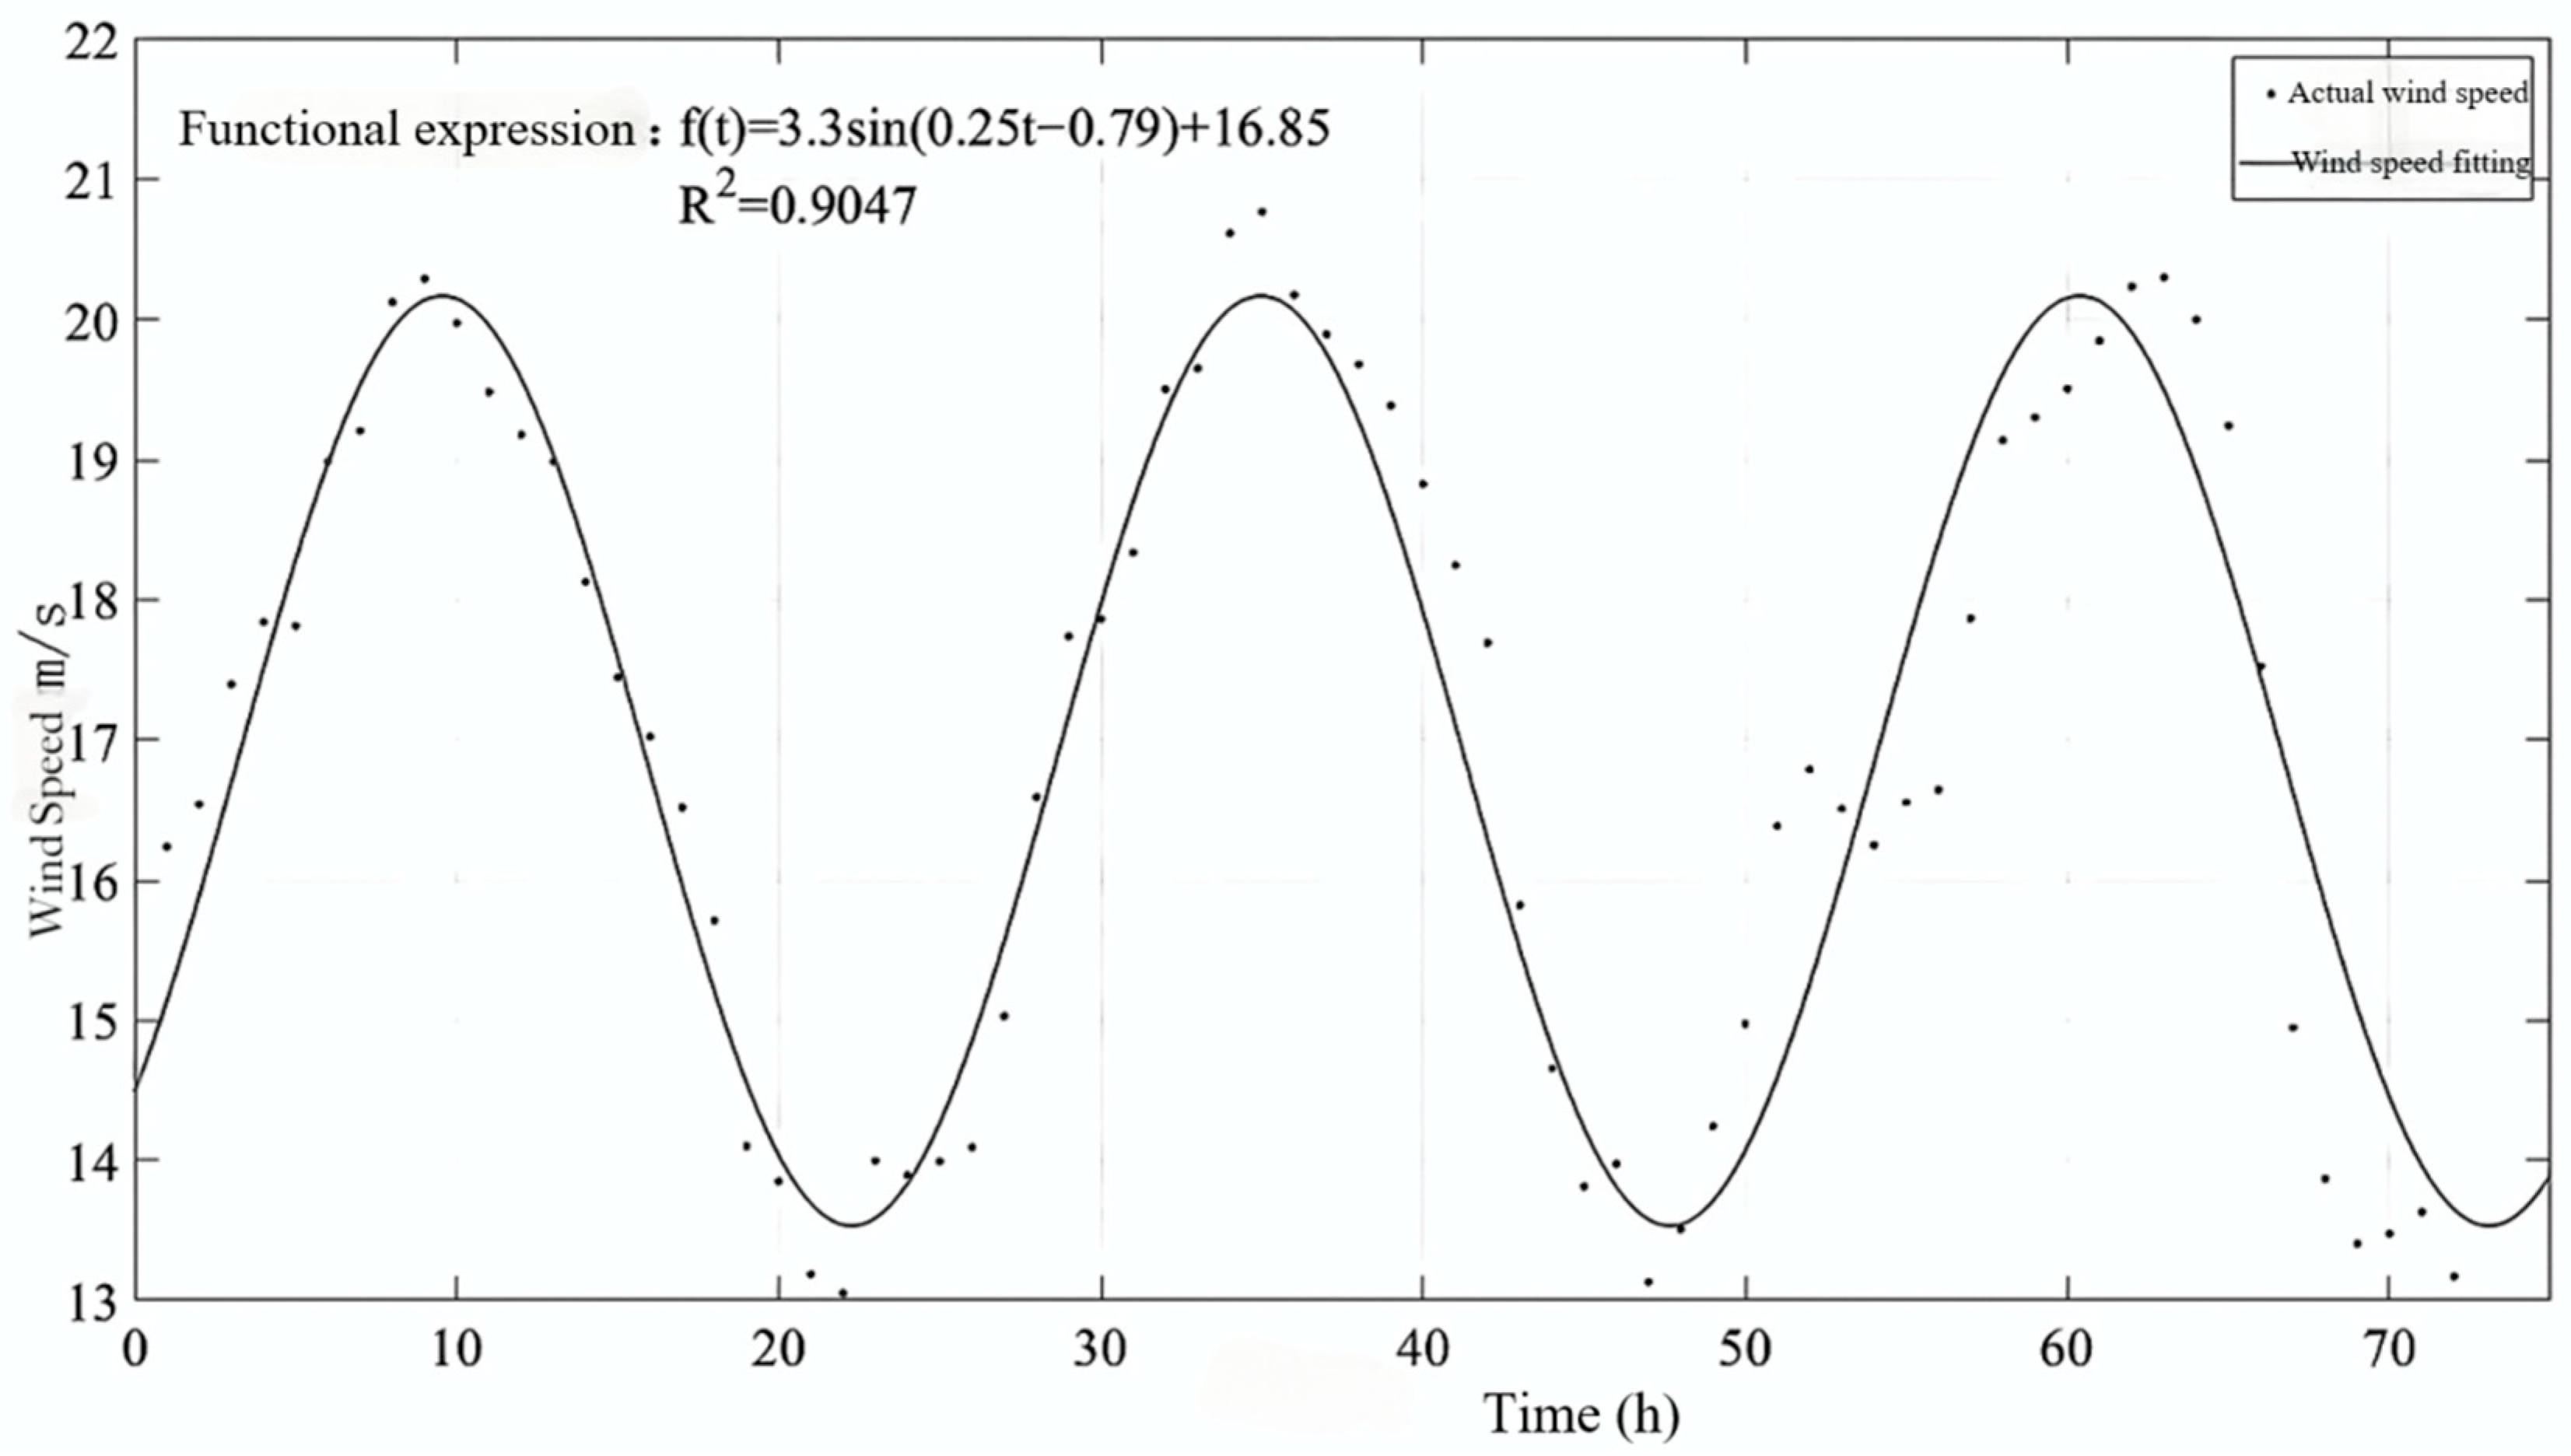
The fluid flow in this region was treated as incompressible. Operational wind speed data from a dish solar thermal power plant in Inner Mongolia were acquired via the Xihe Energy Big Data Platform. Wind speed profiles with maximum magnitude and fluctuation amplitude over three consecutive days were recorded and fitted using curve functions. Based on Jin’s research [46], the coefficient of determination R2 was defined for goodness-of-fit evaluation.
R 2 = 1 ( Y Y f ) 2 ( Y Y m ) 2
where ( Y Y f ) 2 represents the sum of squared errors between observed values Y and fitted values Yf, and ( Y Y m ) 2 denotes the total sum of squared deviations between observations Y and their mean Ym.
Based on the coefficient of determination R2 = 0.9047 obtained from curve fitting in MATLAB 2025a (as shown in Figure 2), where R2 ranges between 0 and 1 (closer to 1 indicating better fitting quality), the high R2 value confirms excellent curve fitting accuracy. Consequently, this fitted function was selected as the inlet boundary condition for dynamic simulations of time-varying wind speeds:
v = 16.85 + 3.3 sin ( 0.08 π t 0.79 )
where v represents the inlet wind speed, periodically varying with a cycle of 25 s.
(2) Outlet boundary condition
The outlet boundary condition was set as a pressure outlet boundary condition at 1 standard atmospheric pressure.
(3) Wall conditions
In the model, walls were set at the periphery of the fluid domain and on the surface of the concentrator. For viscous fluid numerical simulations, wall boundary conditions were configured based on the no-slip theory: Stationary surfaces (concentrator surface and bottom of the computational domain): Applied no-slip wall conditions. Moving boundaries (top, front, and rear surfaces of the computational domain): Implemented slip boundary conditions, where fluid velocity maintained full synchronization with the wall surface velocity.

2.4. Grid Independence Verification

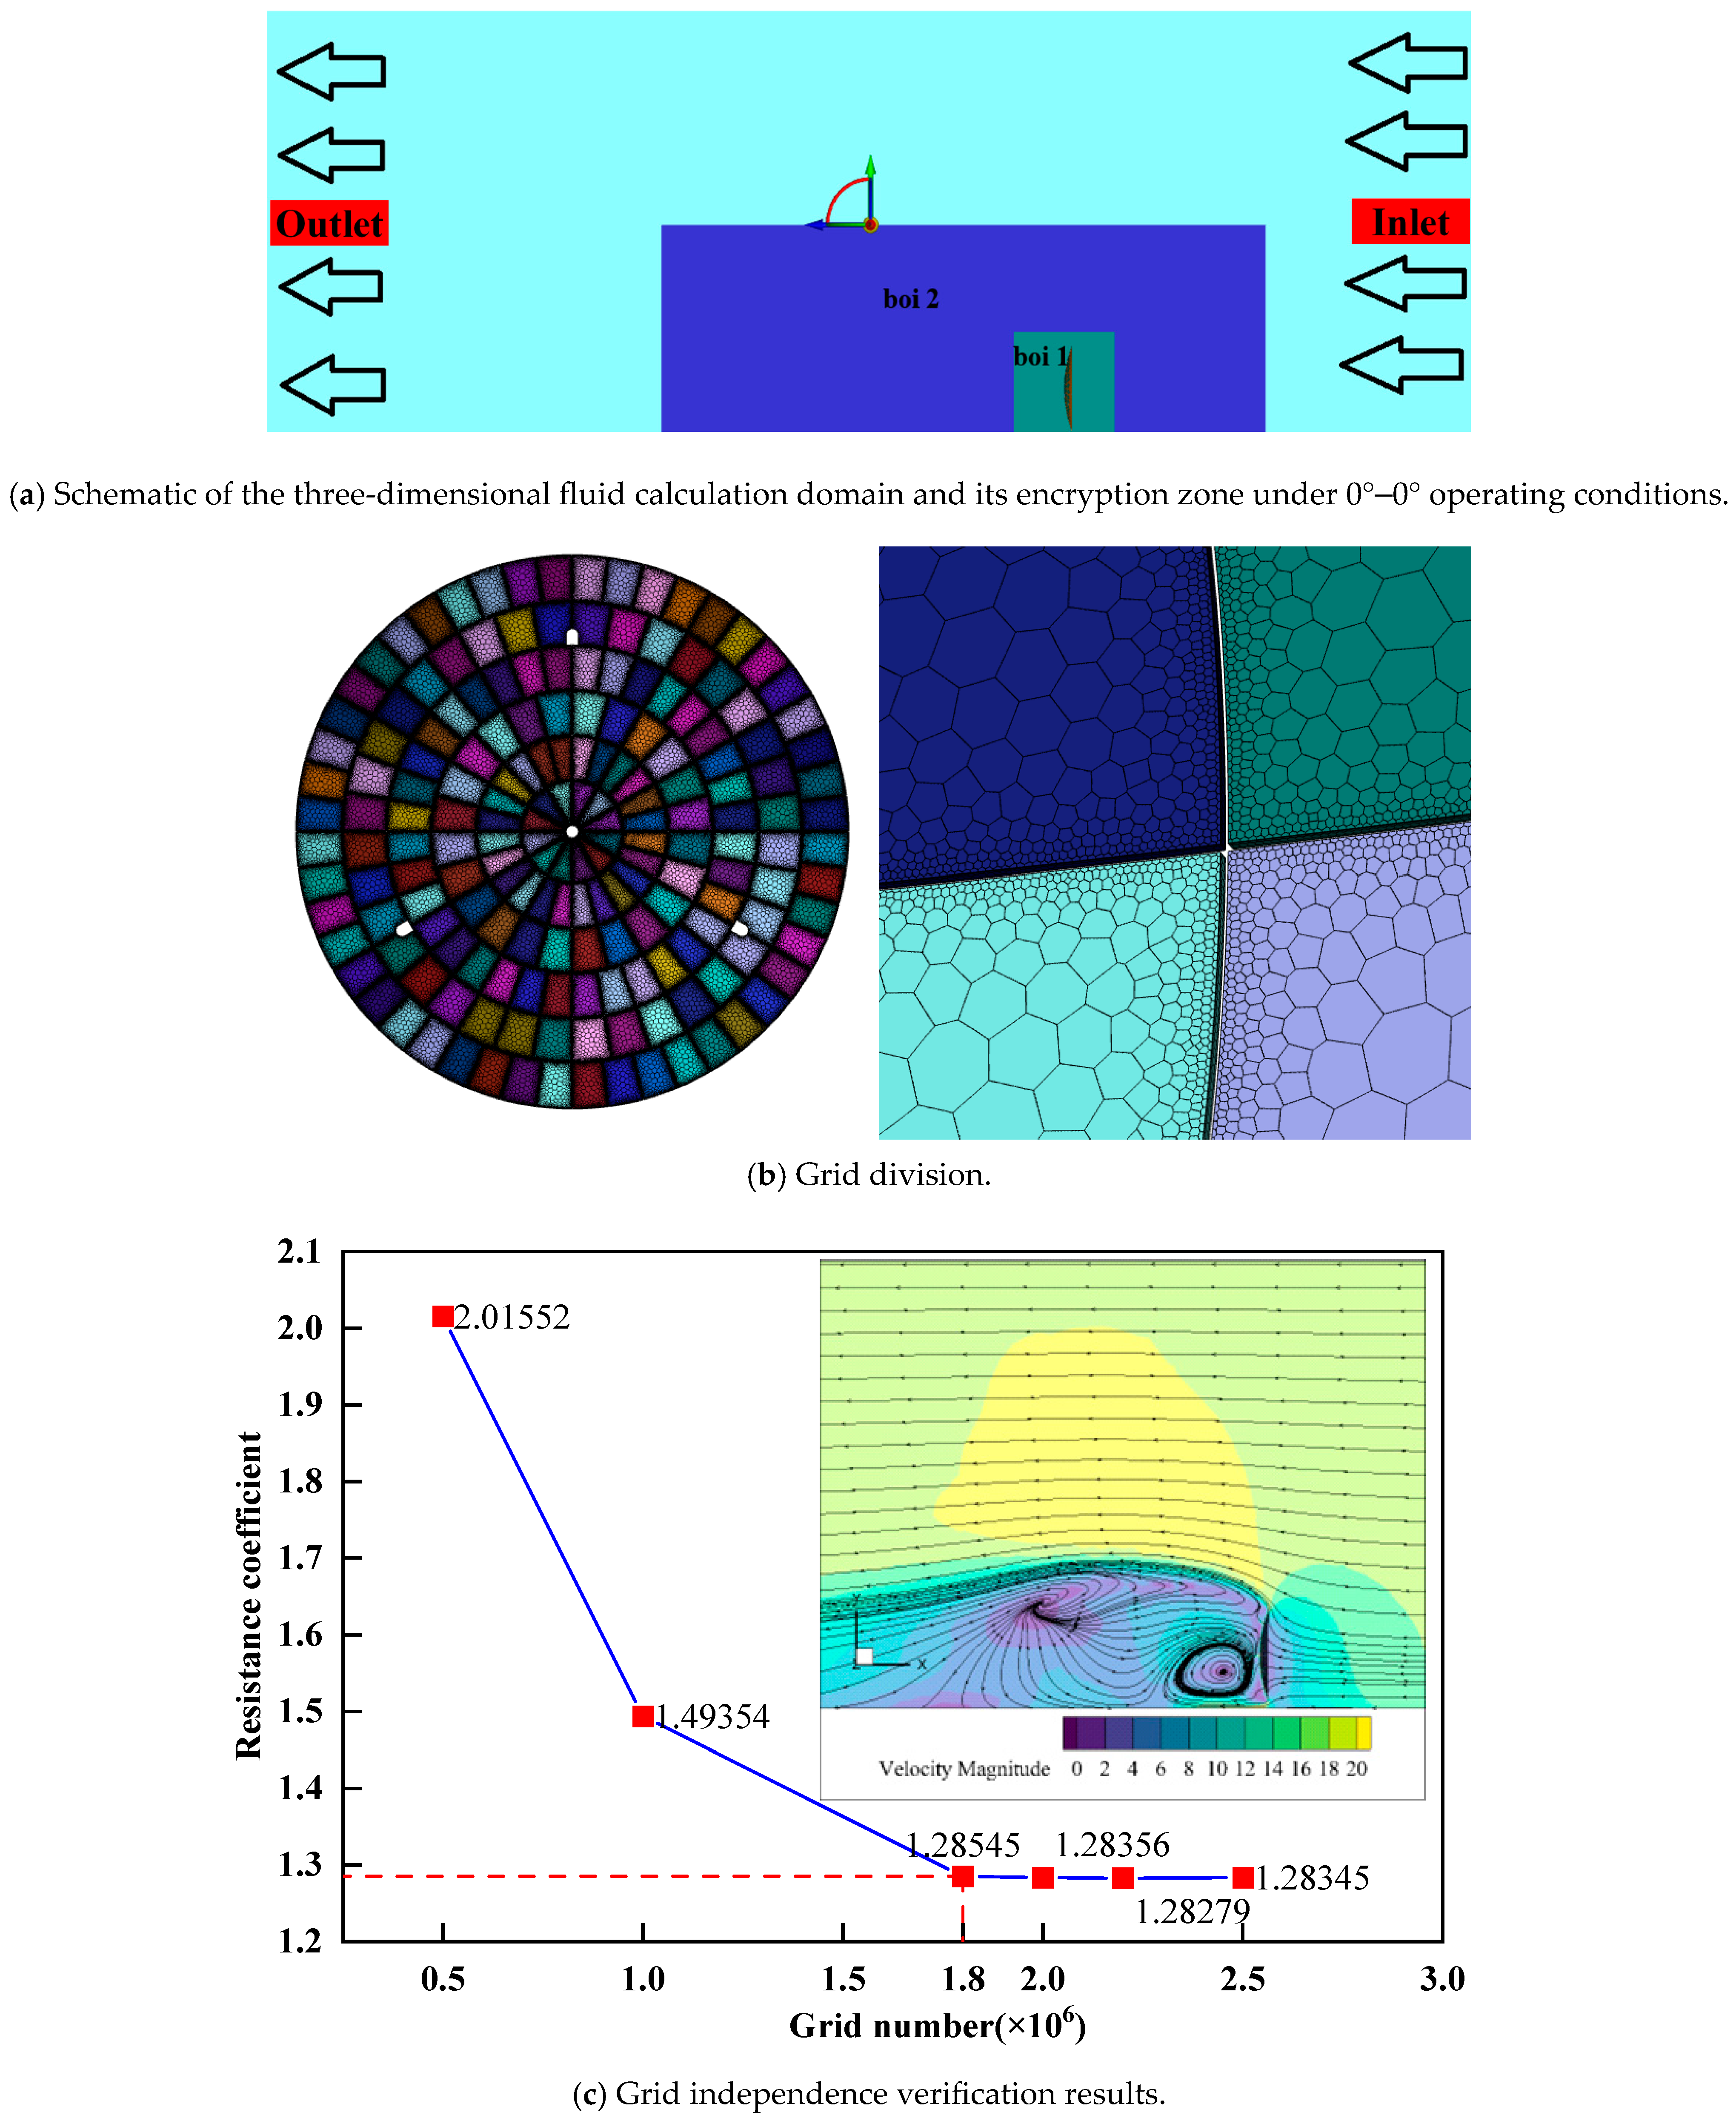
In numerical simulations of computational fluid dynamics, the grid configuration and density distribution directly affect the reliability of the simulation. In this work, the three-dimensional fluid computational domain (see the schematic in Figure 3a) was discretized using unstructured polyhedral grids. The computational domain dimensions are 15 D × 5 D × 5 D (where D = 17.04 m is the concentrator diameter), ensuring minimal boundary interference. Figure 3b shows the grid characteristics of the fluid domain under typical operating conditions.
The differentiated encryption strategy was implemented based on geometric features. That is to say, the concentrator surface achieves adaptive local encryption according to curvature changes, and the wake region was constructed using isotropic elements. The total amount of grid in the entire area was about 1.8 million, and the unit size of the mirror feature area was strictly controlled at 0.02 D. The maximum expansion ratio of the entire area was maintained below 1.4. This configuration scheme effectively captures subtle flow field features by improving the resolution of key areas and controlling the continuity of grid transitions. The y+ values near the wall were maintained between 30 and 300, appropriate for the standard k-ε model. The Courant number was kept below 1.0 to ensure numerical stability for the transient simulations.
At the same time, a hierarchical encryption system based on the boundary effect domain (boi) was established in the grid partitioning: the boi1 area covers the high gradient flow area near the wall for first level encryption, and the boi2 area corresponds to the wake development area for second level encryption. This hierarchical encryption strategy ensures the resolution of the core flow area while balancing computational accuracy and resource consumption through progressive encryption, controlling the grid size gradient rate to ensure that the element quality meets numerical stability requirements.
To balance numerical simulation accuracy and computational efficiency, the resistance coefficient of the concentrator under the wind speed of 16.85 m/s was set as the evaluation index, and the effect of different grid densities on the calculation results was systematically investigated. As shown in Figure 3c, when the number of grids increases to 1.8 × 10⁶, the relative change rate of the resistance coefficient is less than 1%, which meets the convergence standard of engineering calculations. The grid convergence for the drag coefficient, along with the model’s ability to capture key load trends as validated in Section 2.5, demonstrates that the current grid scheme provides a sufficient balance of accuracy and computational efficiency for the purposes of this study. Based on this, it is determined that the grid scheme has both computational accuracy and economy, and can be used as a benchmark parameter for subsequent simulations.

2.5. Model Validation

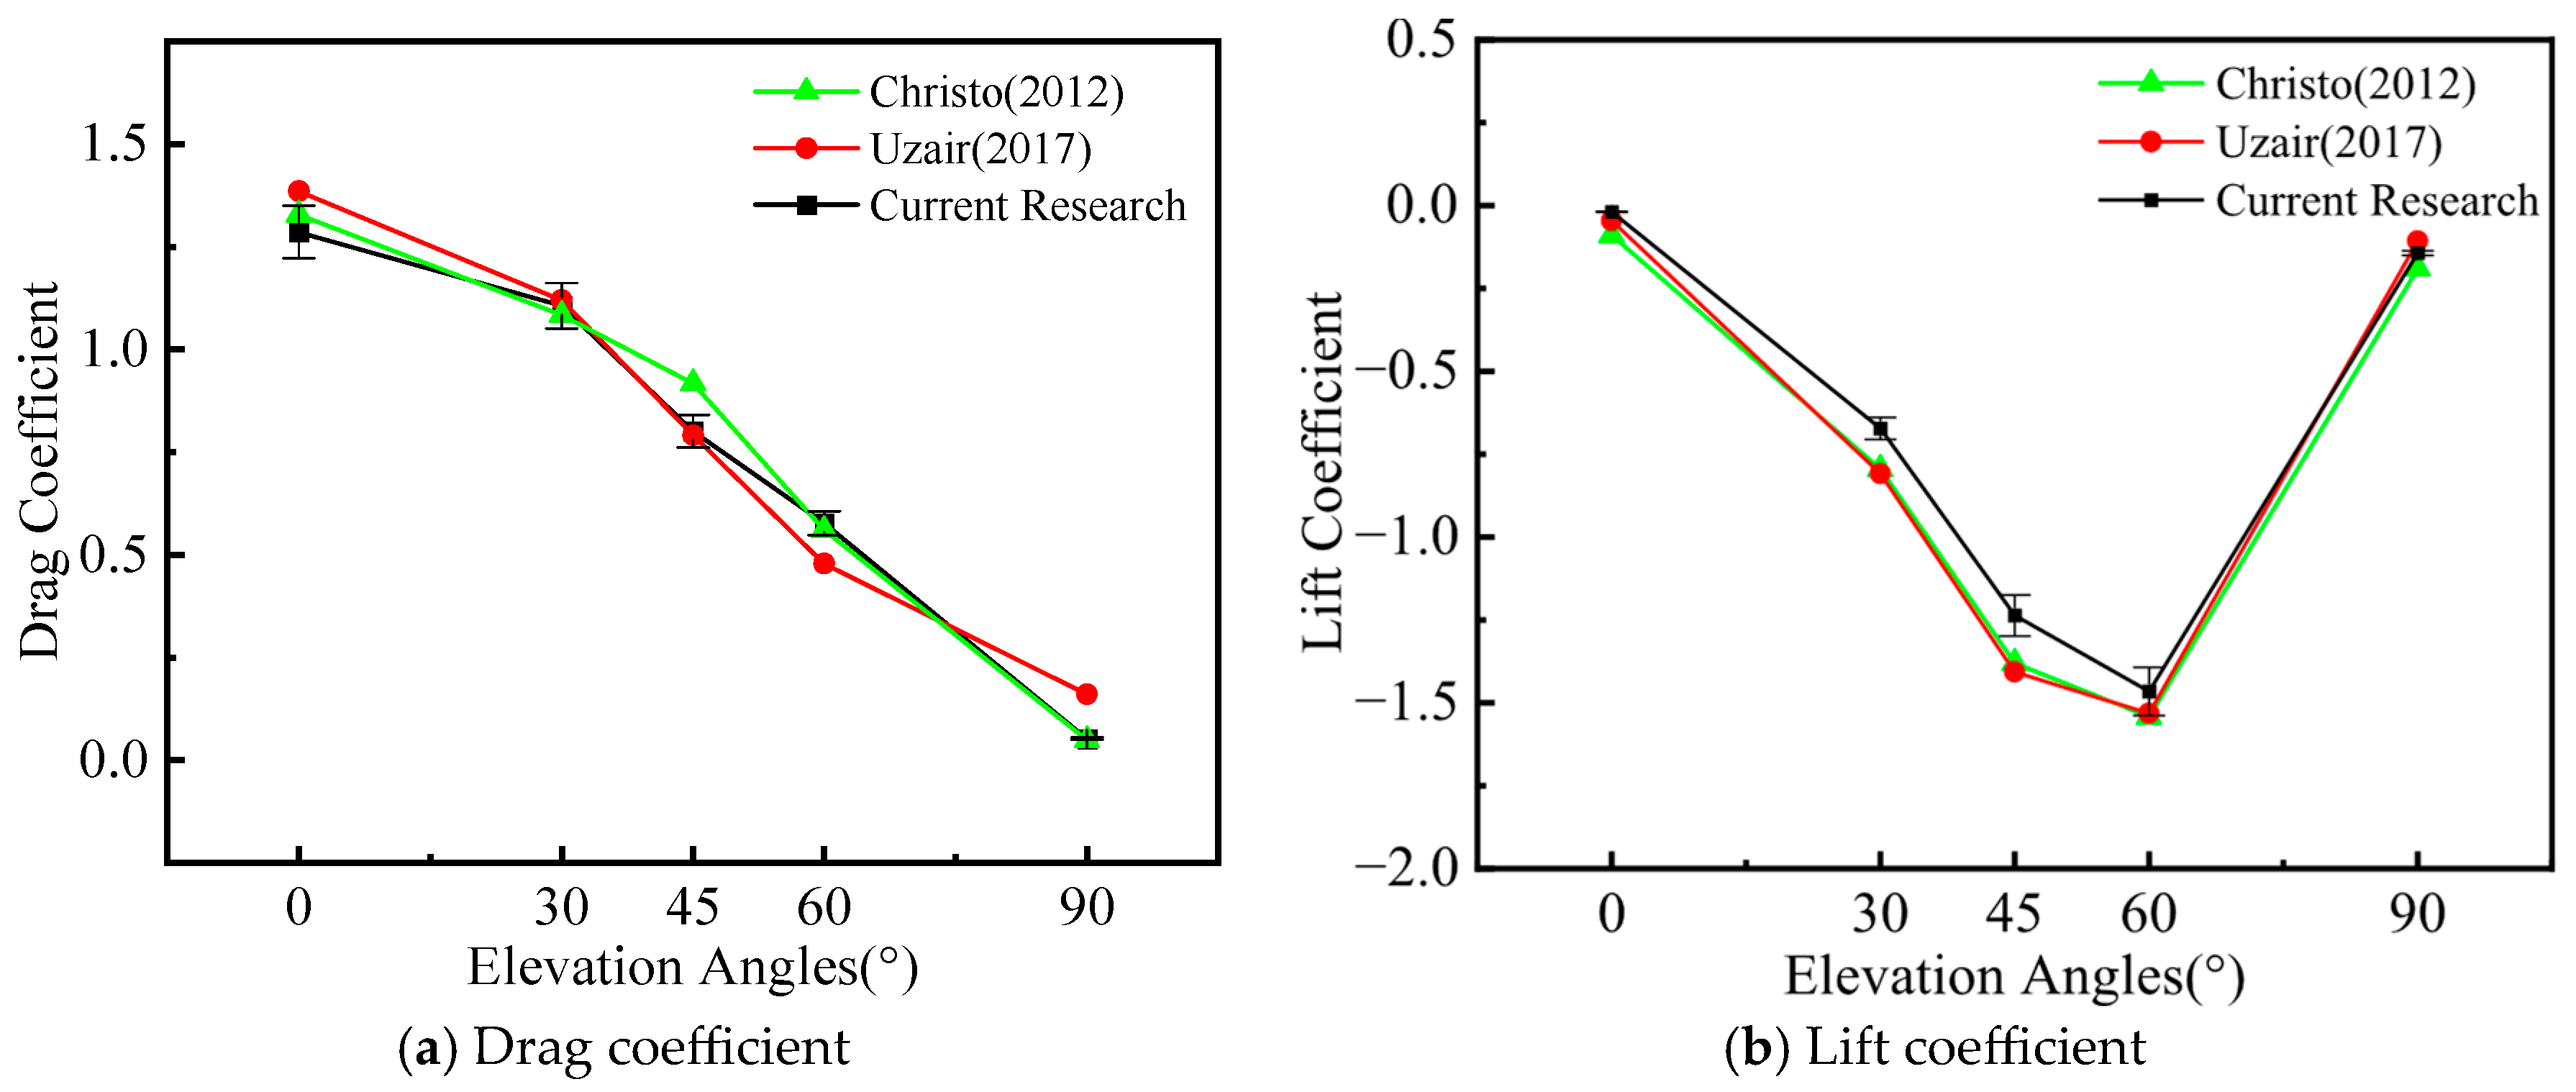
To ensure numerical model reliability, this study validated the model by comparing simulation results with experimental data from literature. Using numerical simulation results from Christo et al. [47] and experimental measurements from Uzair et al. [48] as benchmarks, the variation patterns of drag coefficient (Cd) and lift coefficient (Cl) with elevation angles were examined. Simulation parameters and boundary conditions followed the settings described previously, with wind speeds selected at 5 m/s (consistent with two prior studies). Figure 4 presents comparative analysis results:
Peak Cd occurred at an 0° elevation angle, decreasing gradually with increasing angles. Maximum Cl appeared at a 60° elevation angle, aligning with peak response patterns documented in the literature.
The simulation results from this study show consistent trends with both the numerical data from Christo et al. and the experimental measurements from Uzair et al. The deviations observed in this comparative analysis fall within the ranges represented by the error bars. Potential causes for the discrepancies with the experimental data include the following:
(1) Reference models in Christo and Uzair’s studies incorporated base structures and flow guides, while this study employed geometric simplification focused on the concentrator body, leading to differences in local flow separation characteristics.
(2) Literature wind tunnel experiments used scaled models (ratio 1:33), resulting in Reynolds number magnitude differences compared to this study’s full-scale simulation model, potentially causing flow similarity errors.
(3) Uzair’s experiment modeled the receiver inner wall as a 600 °C isothermal surface with buoyancy effects simulating natural convection, whereas this study excluded thermal-flow coupling effects. Reduced air density at high temperatures versus ambient density in simulations contributed to drag/lift coefficient differences. Buoyancy-flow coupling may also alter vortex shedding frequencies.
Based on reasonable model simplification and the model’s capability to capture key load variation trends, the computational model established in this study is validated as effective for the purpose of this comparative study.

3. Analysis and Discussion of Computational Results

3.1. Simulation Analysis of Flow Field Distribution in Dish Solar Systems Under Varying Wind Speeds

To maintain optimal optical alignment, dual-axis solar tracking systems are required to dynamically adjust the concentrator’s orientation in response to the diurnal variation in solar angles. This study systematically investigates transient wake field characteristics of parabolic concentrators across discrete operational configurations, with parametric discretization of azimuth angle (α ∈ [0°, 150°]) and elevation angle (β ∈ [0°, 90°]). Through time-resolved computational fluid dynamics (CFD) simulations, flow field characteristic parameters dynamically associated with concentrator postures are characterized, with focused analysis on vortex shedding modes and pressure gradient evolution mechanisms during posture adjustments.

3.1.1. Variation Characteristics of System Flow Field Distribution with Elevation Angle Under Varying Wind Speeds

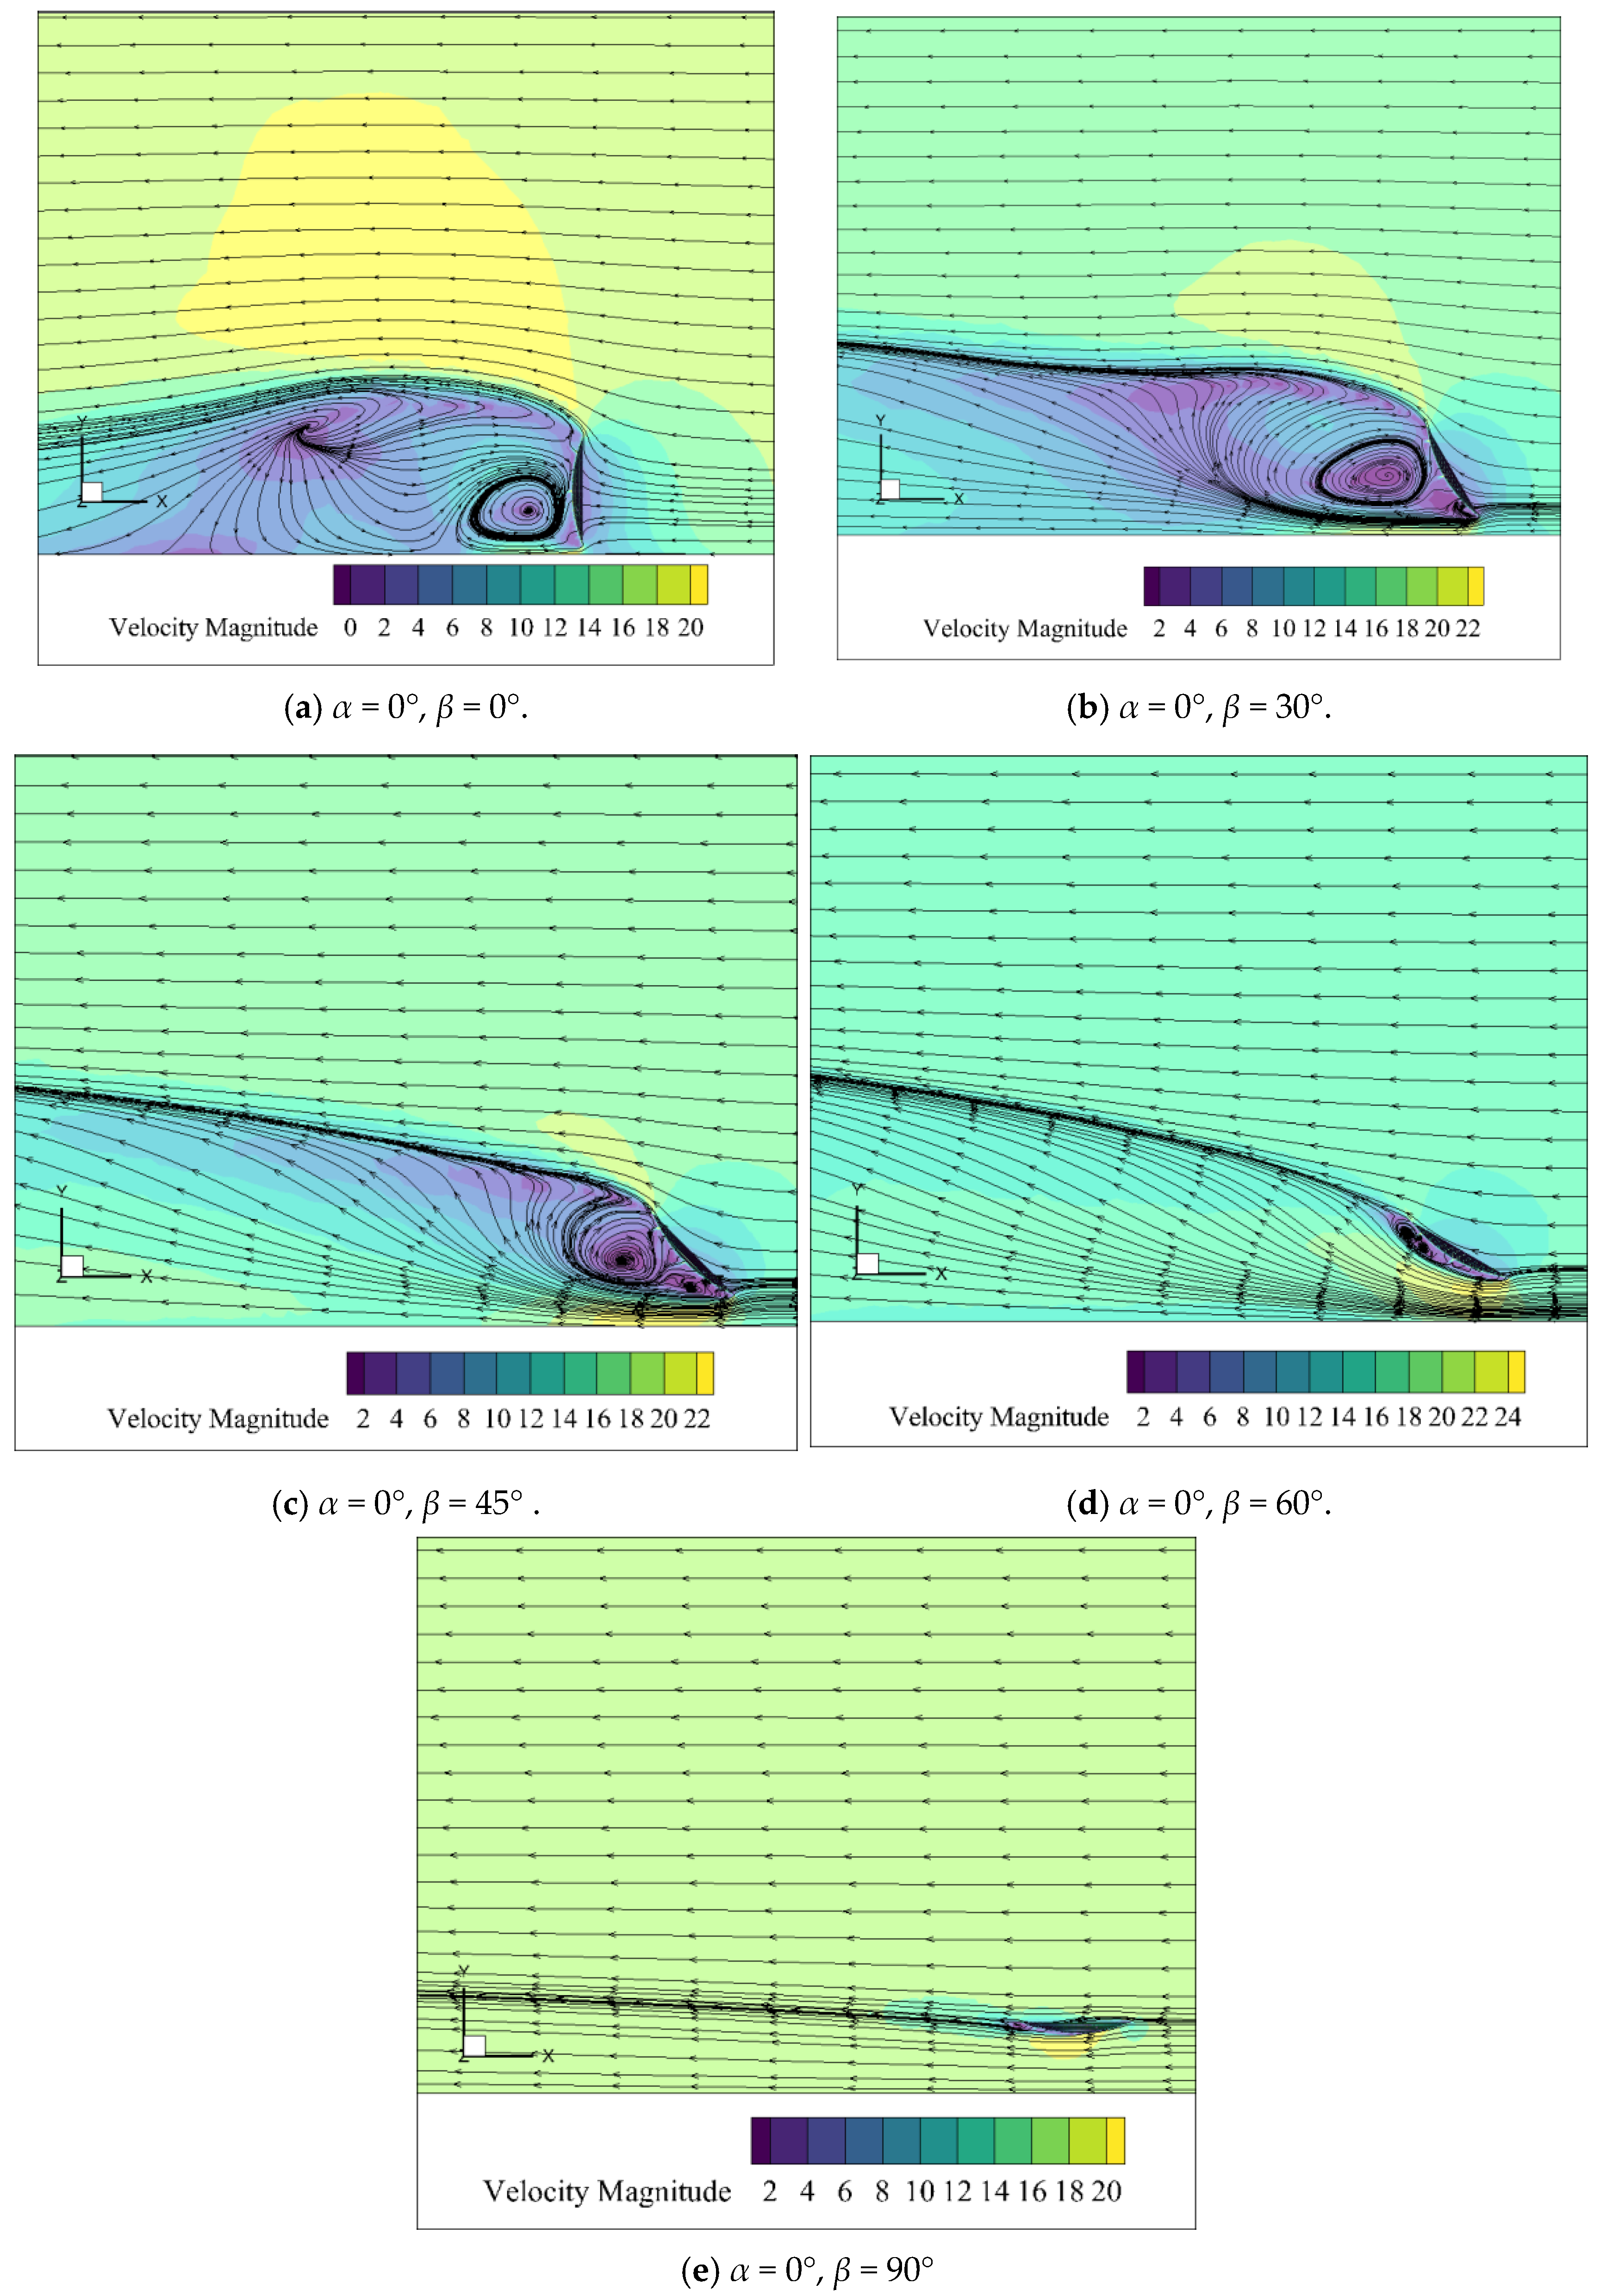
To accurately assess the effect of concentrator elevation angle on flow field characteristics, this study employed a controlled variable approach for parametric analysis. With azimuth angle fixed at α = 0°, discrete elevation angles β ∈ {0°, 30°, 45°, 60°, 90°} were selected as independent variables. The surrounding flow fields of the dish solar concentrator under these five operational conditions with fluctuating wind speed period of 25 s are shown in Figure 5.
Observation of the results reveals that at smaller elevation angles (0° and 30°), distinct low-velocity recirculation zones exist in the leeward region of the dish solar concentrator. Sudden curvature changes induce adverse pressure gradients, causing airflow deceleration and pressure recovery. This leads to premature flow separation at the trailing edge, forming vortex structures with high turbulence intensity that significantly enhance wind load fluctuations. As elevation angle increases, curvature variations on the windward surface become gradual, weakening adverse pressure gradients. The flow separation point gradually shifts rearward until achieving full attachment. The velocity gradient within the shear layer decreases, enhancing overall flow stability. Maximum flow velocity peaks at 60° elevation. When elevation angle reaches 90°, recirculation zones nearly disappear with fully attached flow, indicating optimal wind load stability and minimal structural impact from turbulence effects. Quantitative analysis of pressure coefficient distributions confirms higher suction peaks at β = 0° and 60°, consistent with flow separation patterns.

3.1.2. Variation Characteristics of System Flow Field Distribution with Azimuth Angle Under Varying Wind Speeds

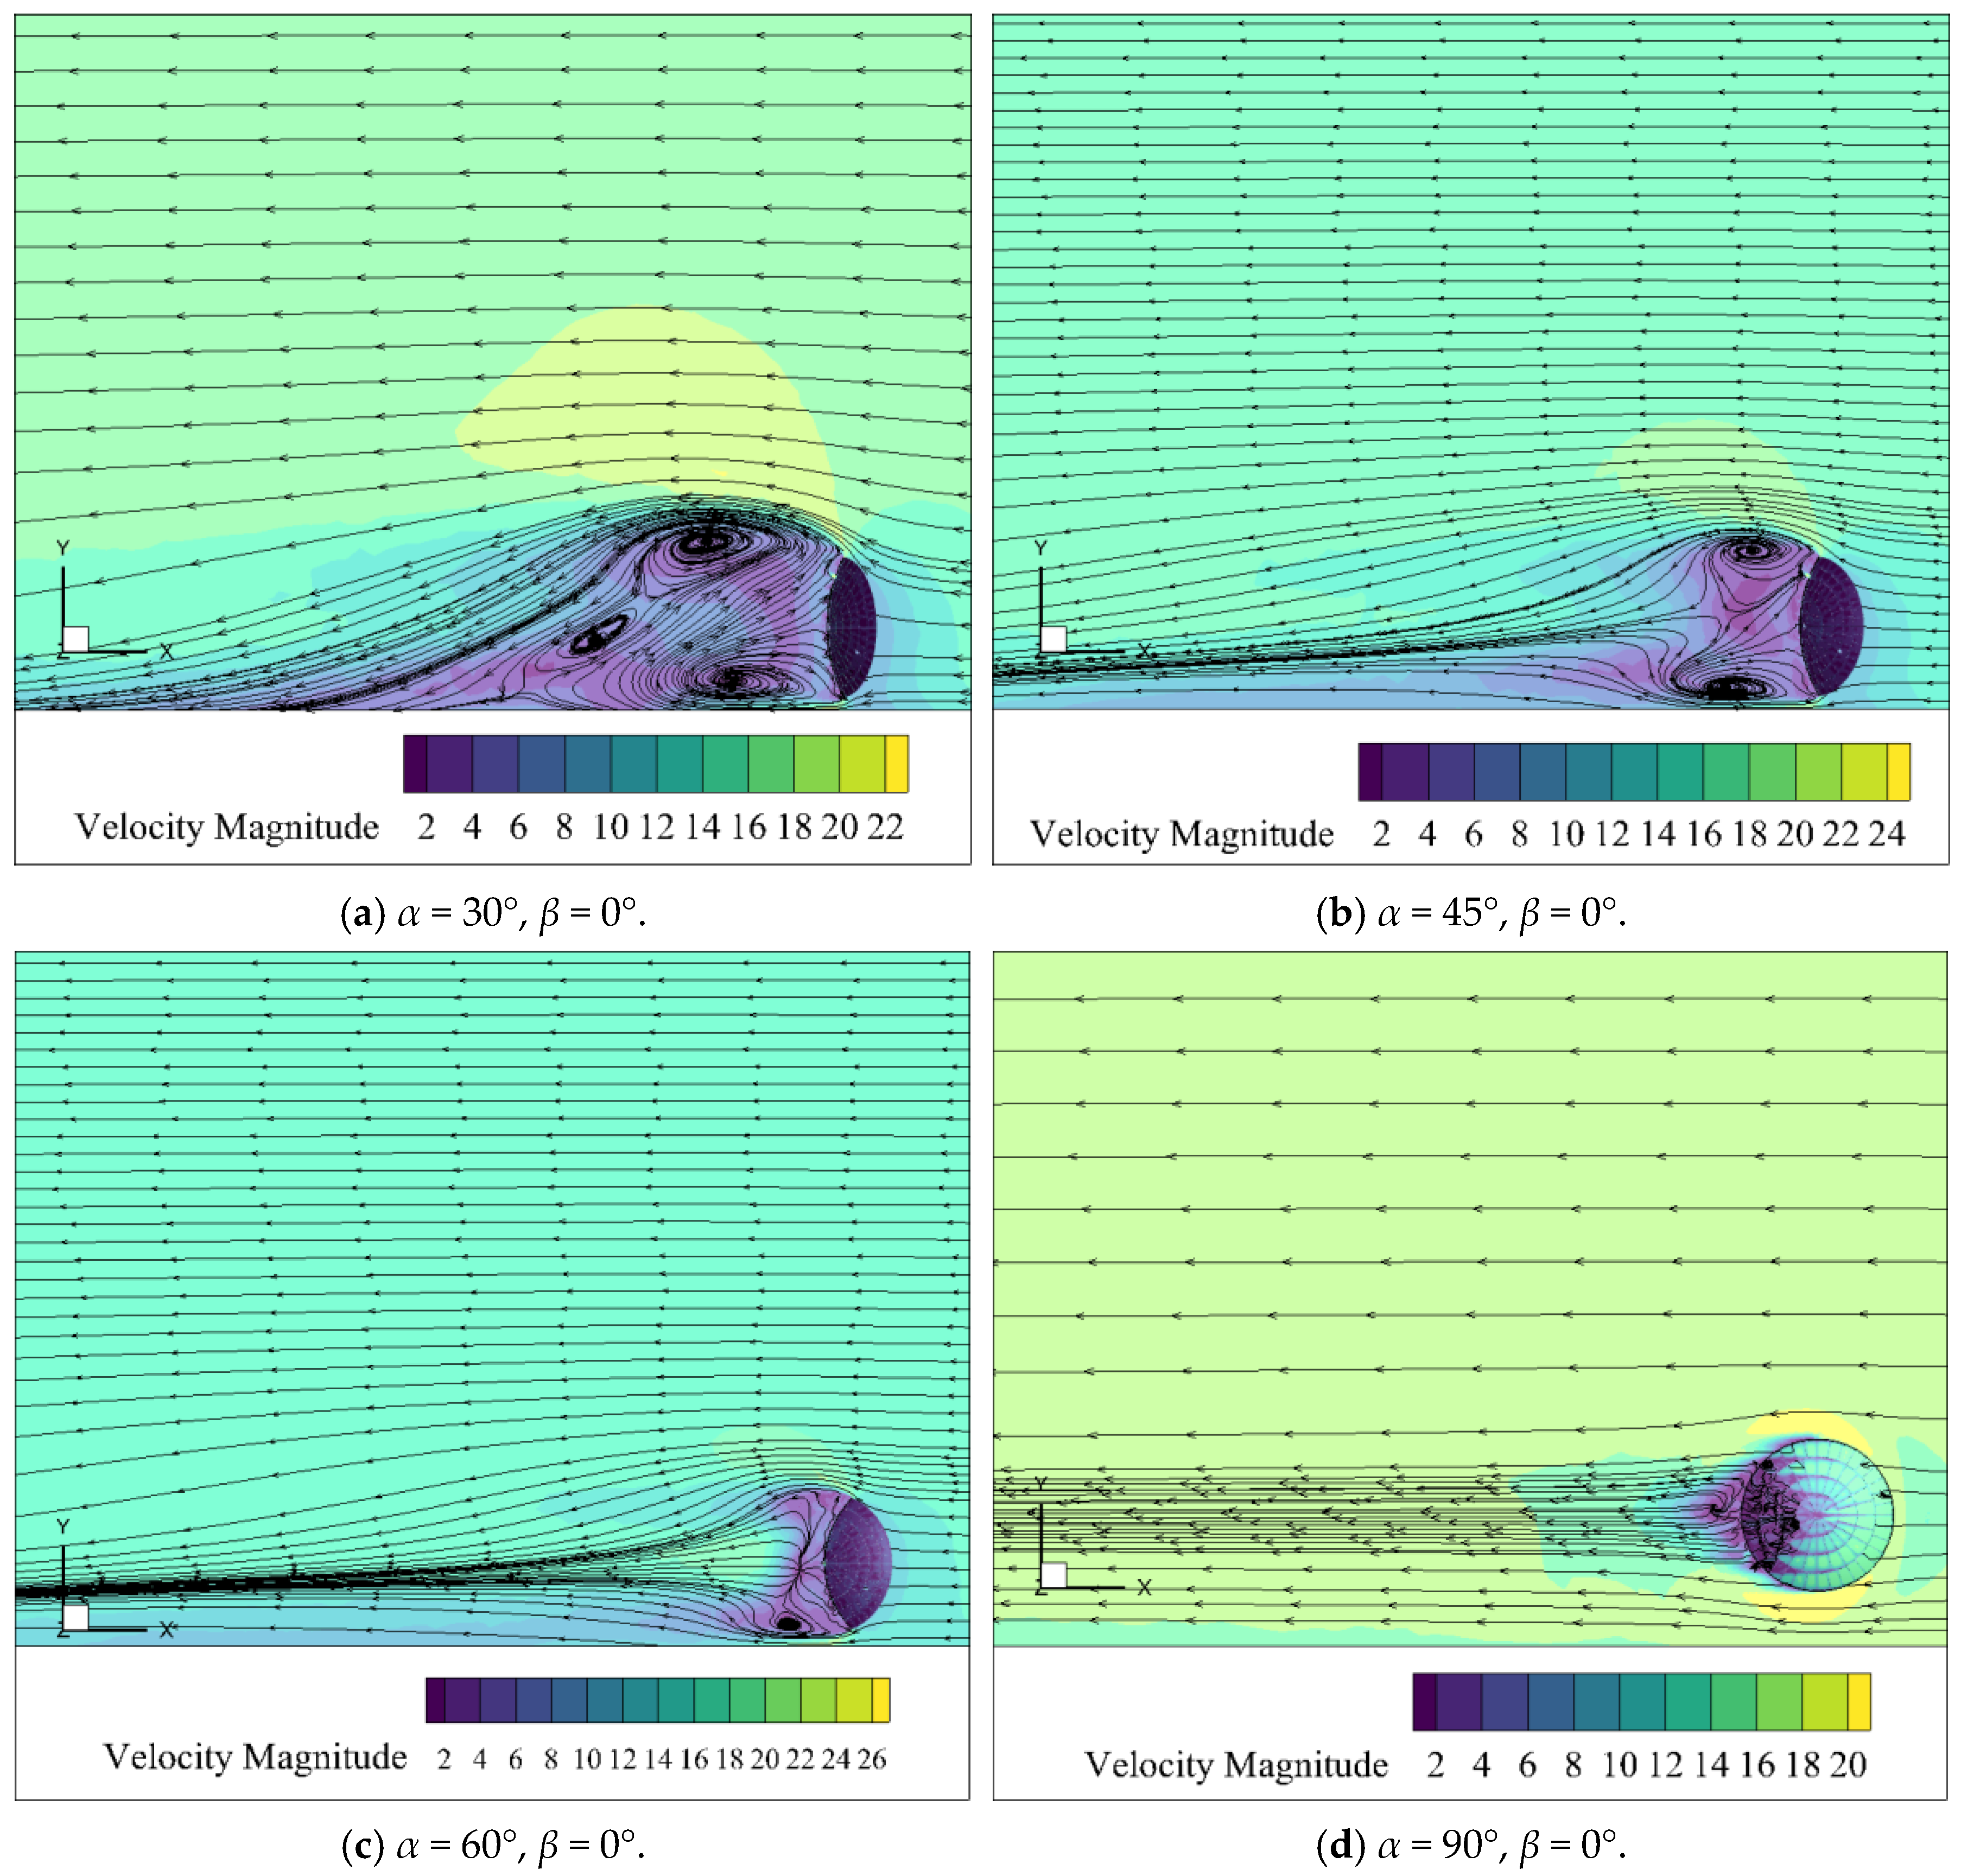
With azimuth angles α set at 30°, 45°, 60°, 90°, 120°, 135°, and 150°, and elevation angle fixed at β = 0°, transient flow field characteristics of the dish concentrator under 25 s-period fluctuating wind loads were obtained through numerical simulations. The flow field distributions are shown in Figure 6. Analysis of the diagram indicates that as the azimuth angle increases from 30° to 150°, the leeward flow characteristics of the concentrator evolve from multi-vortex structures to a single vortex and back to multi-vortex structures. At low azimuth angles (30–60°), the lateral angle between the incoming flow direction and the concentrator axis induces significant three-dimensional flow characteristics.
The lateral velocity component generates Coriolis effects, causing an asymmetric pressure distribution in the leeward region and gradually intensifying shear layer disturbances. At high azimuth angles (120–150°), the curvature of the windward surface approaches orthogonality with the incoming flow, triggering severe flow separation along the edges. Enhanced momentum exchange within the shear layer gradually forms dual-vortex structures, expanding the recirculation zone to 1.2 D (where D is the concentrator diameter) with markedly increased turbulence intensity. At 90° azimuth, the flow exhibits optimal symmetry with enhanced leeward flow attachment and minimal turbulence intensity, representing the aerodynamically most stable condition. The 60° and 150° cases require special attention in wind-resistant design due to localized peak flow velocities and dual-vortex interference effects, respectively. Strouhal numbers, estimated from vortex shedding frequencies, range from 0.15 to 0.25 for α = 60–150°, indicating moderate unsteadiness.

3.2. Variation Characteristics of the Flow Field Distribution Under Fluctuating Winds with Different Periods

The flexible structure of dish solar systems makes them susceptible to wind-induced vibrations under wind loads, particularly in flow separation zones where wind pressure fluctuations are more pronounced. Existing research [41] indicates that fluctuating winds induce more significant residual deformation in large-span roofs, creating clearances between mating components. Short-term wind pressure pulsations may cause high-intensity mechanical stresses such as vibrations and impacts, while long-term fluctuations can lead to fatigue-induced structural damage. Consequently, the effects of fluctuating winds with different periods on wind loads exhibit distinct characteristics. To analyze the effect of varying wind periods on concentrator flow fields, this section incorporates flow field distributions under 50 s-period fluctuating winds, examining differences in airflow separation, recirculation zones, and shear layer evolution within the leeward region compared to 25 s-period conditions. Inlet wind speed fluctuation amplitude remains identical to the 25 s-period case, with the 50 s-period case corresponding to the equation:
v = 16.85 + 3.3 sin ( 0.04 π t 0.79 )
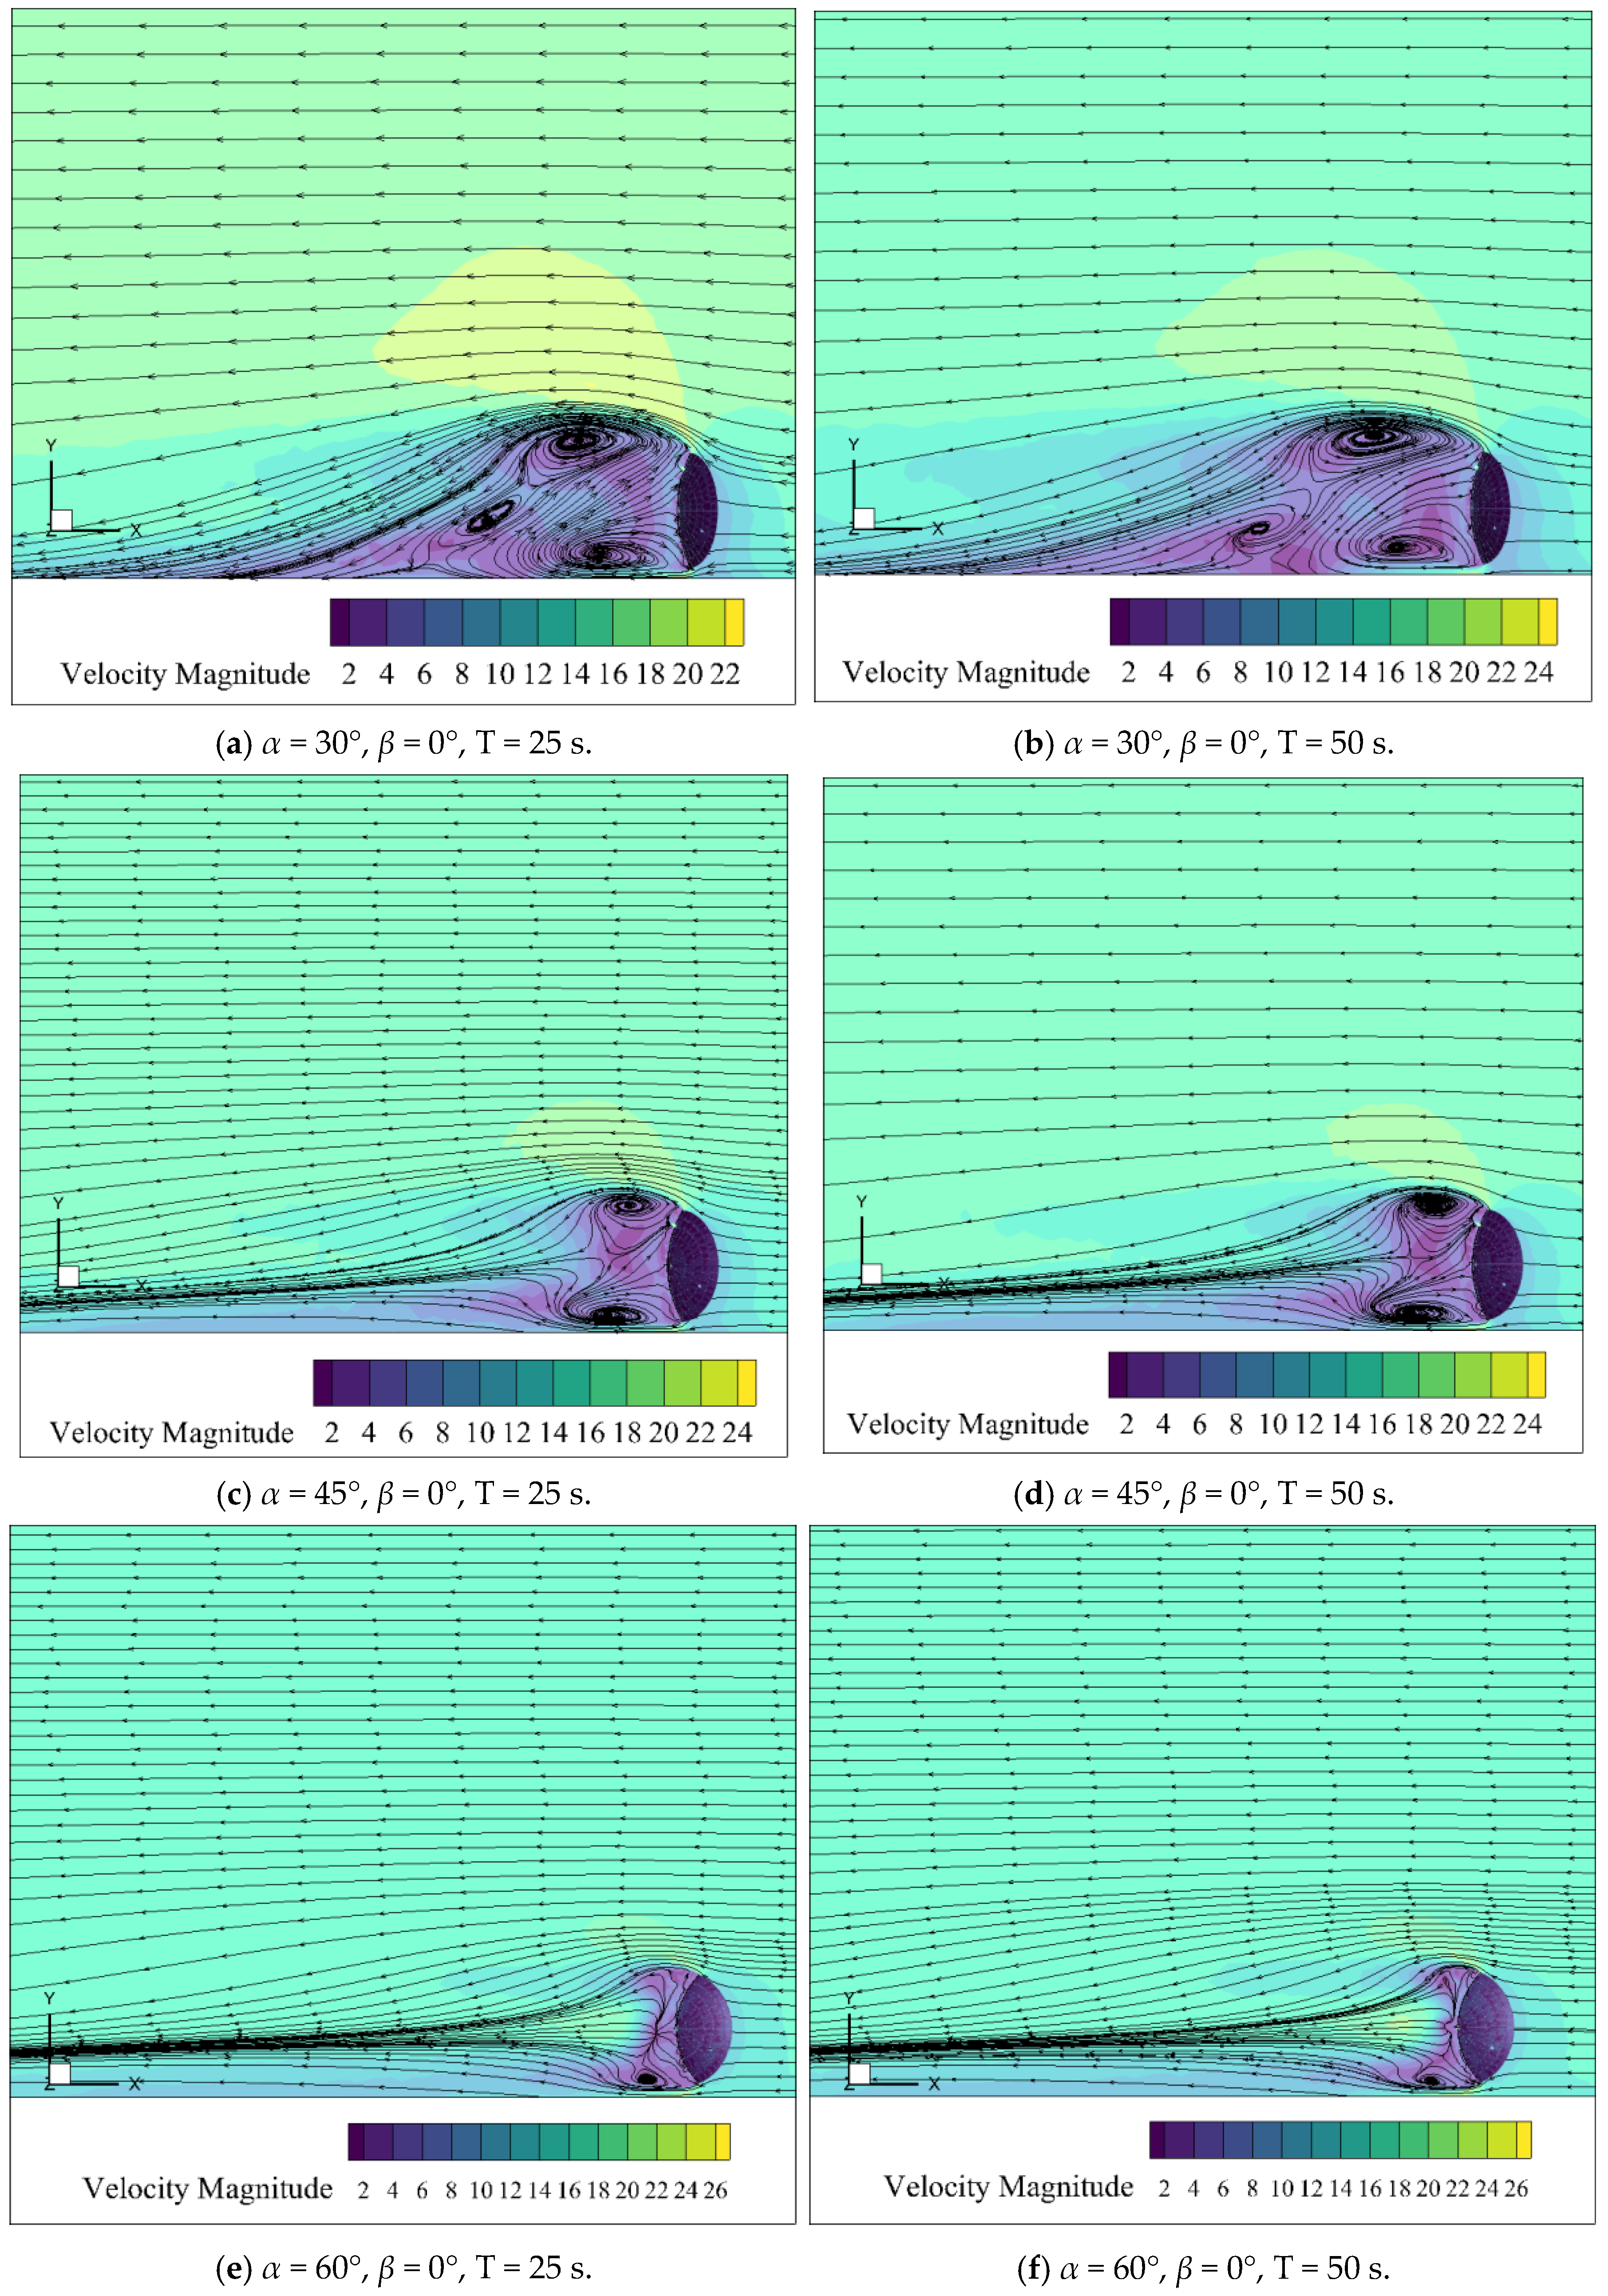
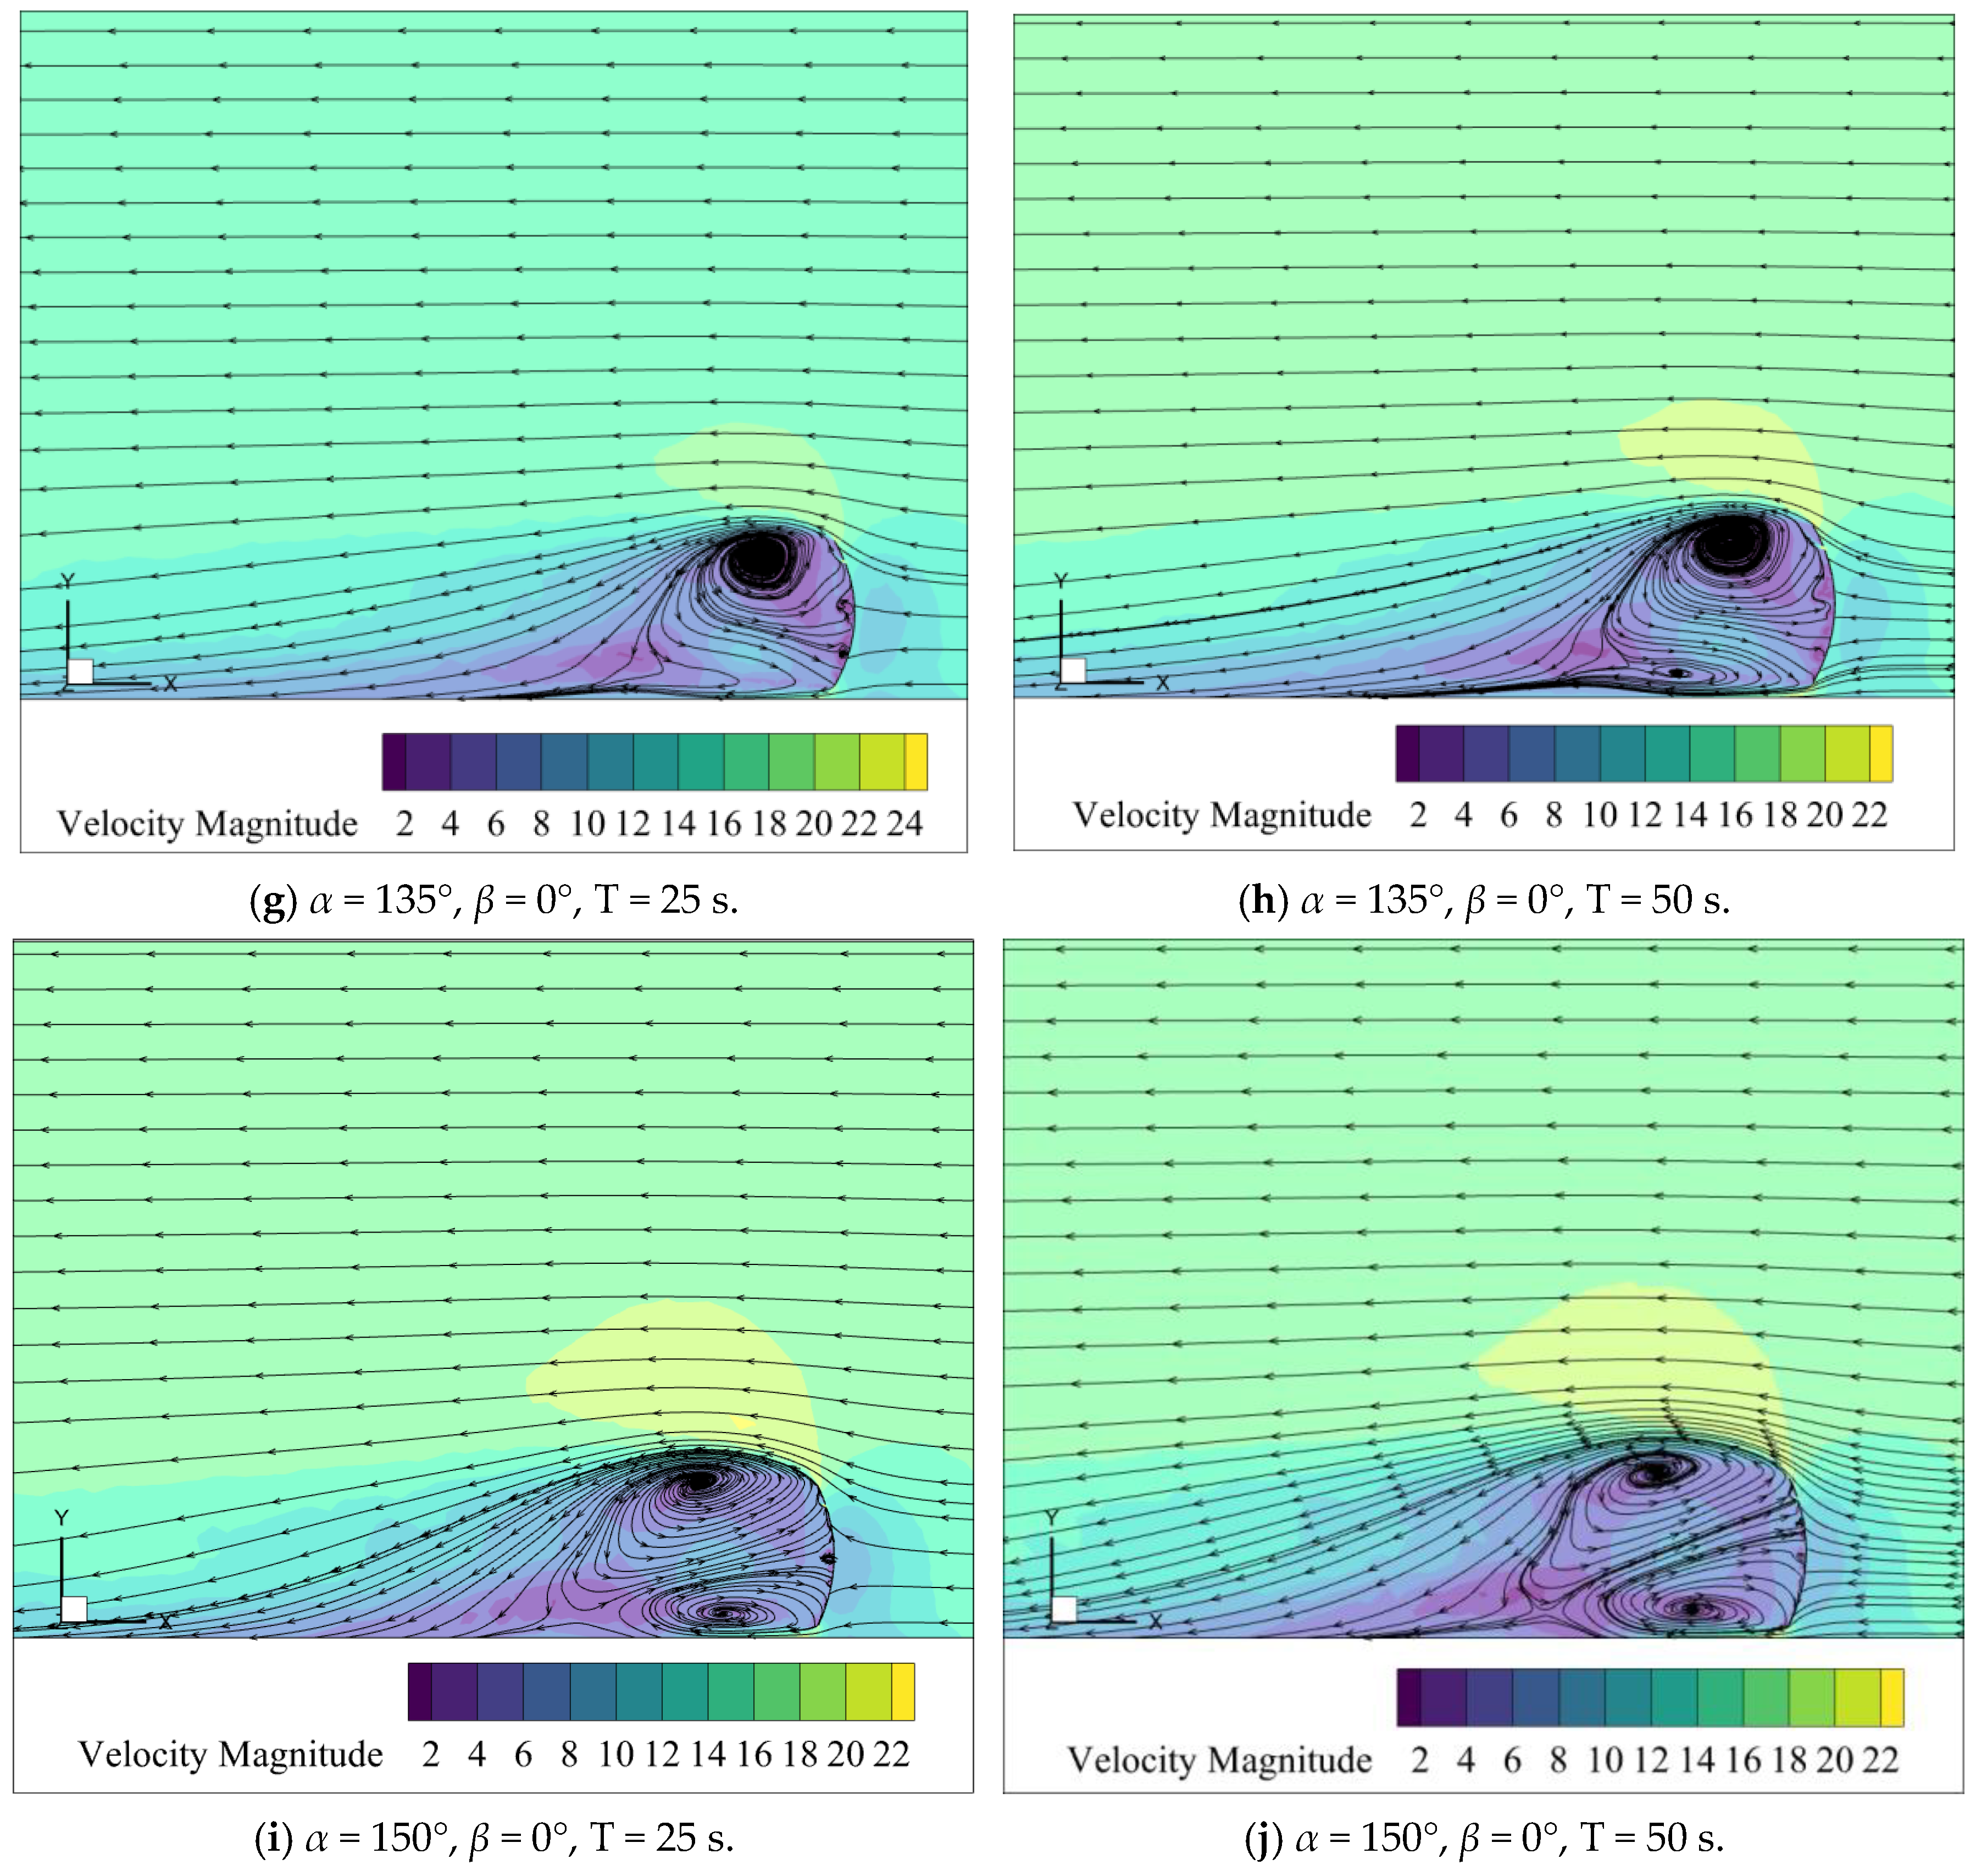
Figure 7 and Figure 8 present comparative flow field diagrams for fluctuating wind periods of 25 s and 50 s, respectively, under varying elevation angles (β) and azimuth angles (α). Similar to the preceding section, one angle is held constant while the other is treated as a discretized variable. Representative cases demonstrating significant flow field variations around the concentrator were selected for analysis, with azimuth angles α ∈ {30°, 45°, 60°, 135°, 150°} and elevation angles β ∈ {0°, 30°, 45°, 60°}.
Figure 7 illustrates that under different elevation angles, the 25 s and 50 s periodic winds exert significant effects on the flow field distribution. At an elevation angle of 0°, the 50 s wind reduces the peak local wind speed but expands the flow reversal zone and smooths the shear layer, potentially intensifying low-frequency wind-induced vibrations. At β = 30°, the flow separation point shifts downstream, and the scale of the primary vortex increases. The 50 s wind prolongs the airflow residence time and reduces the vortex shedding frequency, resulting in a more stable flow field but stronger low-frequency effects. At β = 45°, the shear layer becomes smoother and turbulence weakens, yet the scale of the primary vortex remains largely unchanged, indicating limited impact of periodicity on the vortex structure. At β = 60°, both 25 s and 50 s winds yield a maximum wind speed of 24 m/s; however, the shorter period induces stronger turbulence and more intense shear layer disturbances, while the longer period expands the reversal zone and enhances flow stability. Overall, the 50 s wind enlarges low-speed stagnation zones and reversal regions, potentially amplifying low-frequency wind-induced vibrations and impacting long-term stability. Conversely, the 25 s wind exhibits more intense velocity fluctuations, higher turbulence intensity, and more pronounced short-term impact effects.
Figure 8 reveals that, comparing flow field characteristics under 25 s and 50 s fluctuating wind periods at different azimuth angles, such as α = 30° and 60°, the vortex structure under the 50 s period is relatively stable with weaker local momentum exchange. At α = 135°, the shear layer is more active under the 25 s wind, while the 50 s wind slightly improves flow reattachment capability, though overall flow instability remains significant. At α = 150°, the interaction between the primary vortex and the bottom secondary vortex intensifies under the 50 s wind, expanding the vortex interaction zone. This may exacerbate local pressure fluctuations, rendering the concentrator more susceptible to dynamic wind loads under these conditions and increasing the risk of structural damage.

3.3. Force Analysis of a Dish Solar Energy System Under Variable Wind Speeds

An analysis of wind load characteristics based solely on flow field distribution has limitations. While streamline structures, vortex scales, and shear layer features reflect flow unsteadiness, they cannot directly quantify wind load effects on the concentrator. Therefore, further investigation of aerodynamic forces and moments—including drag, lift, and lateral forces—is required to evaluate overall load characteristics under varying flow conditions. Error bars (representing ±1 standard deviation) are added to force and moment plots to indicate variability. Concurrently, moments about the three coordinate axes are critical for structural stability evolution, particularly fluctuations in pitch and overturning moments, which may affect the dynamic response of supporting structures. Subsequent analysis will thus focus on quantifying aerodynamic loads acting on the concentrator.

3.3.1. Effect of Elevation Angle and Wind Load Periodicity on Force Characteristics of the Concentrator

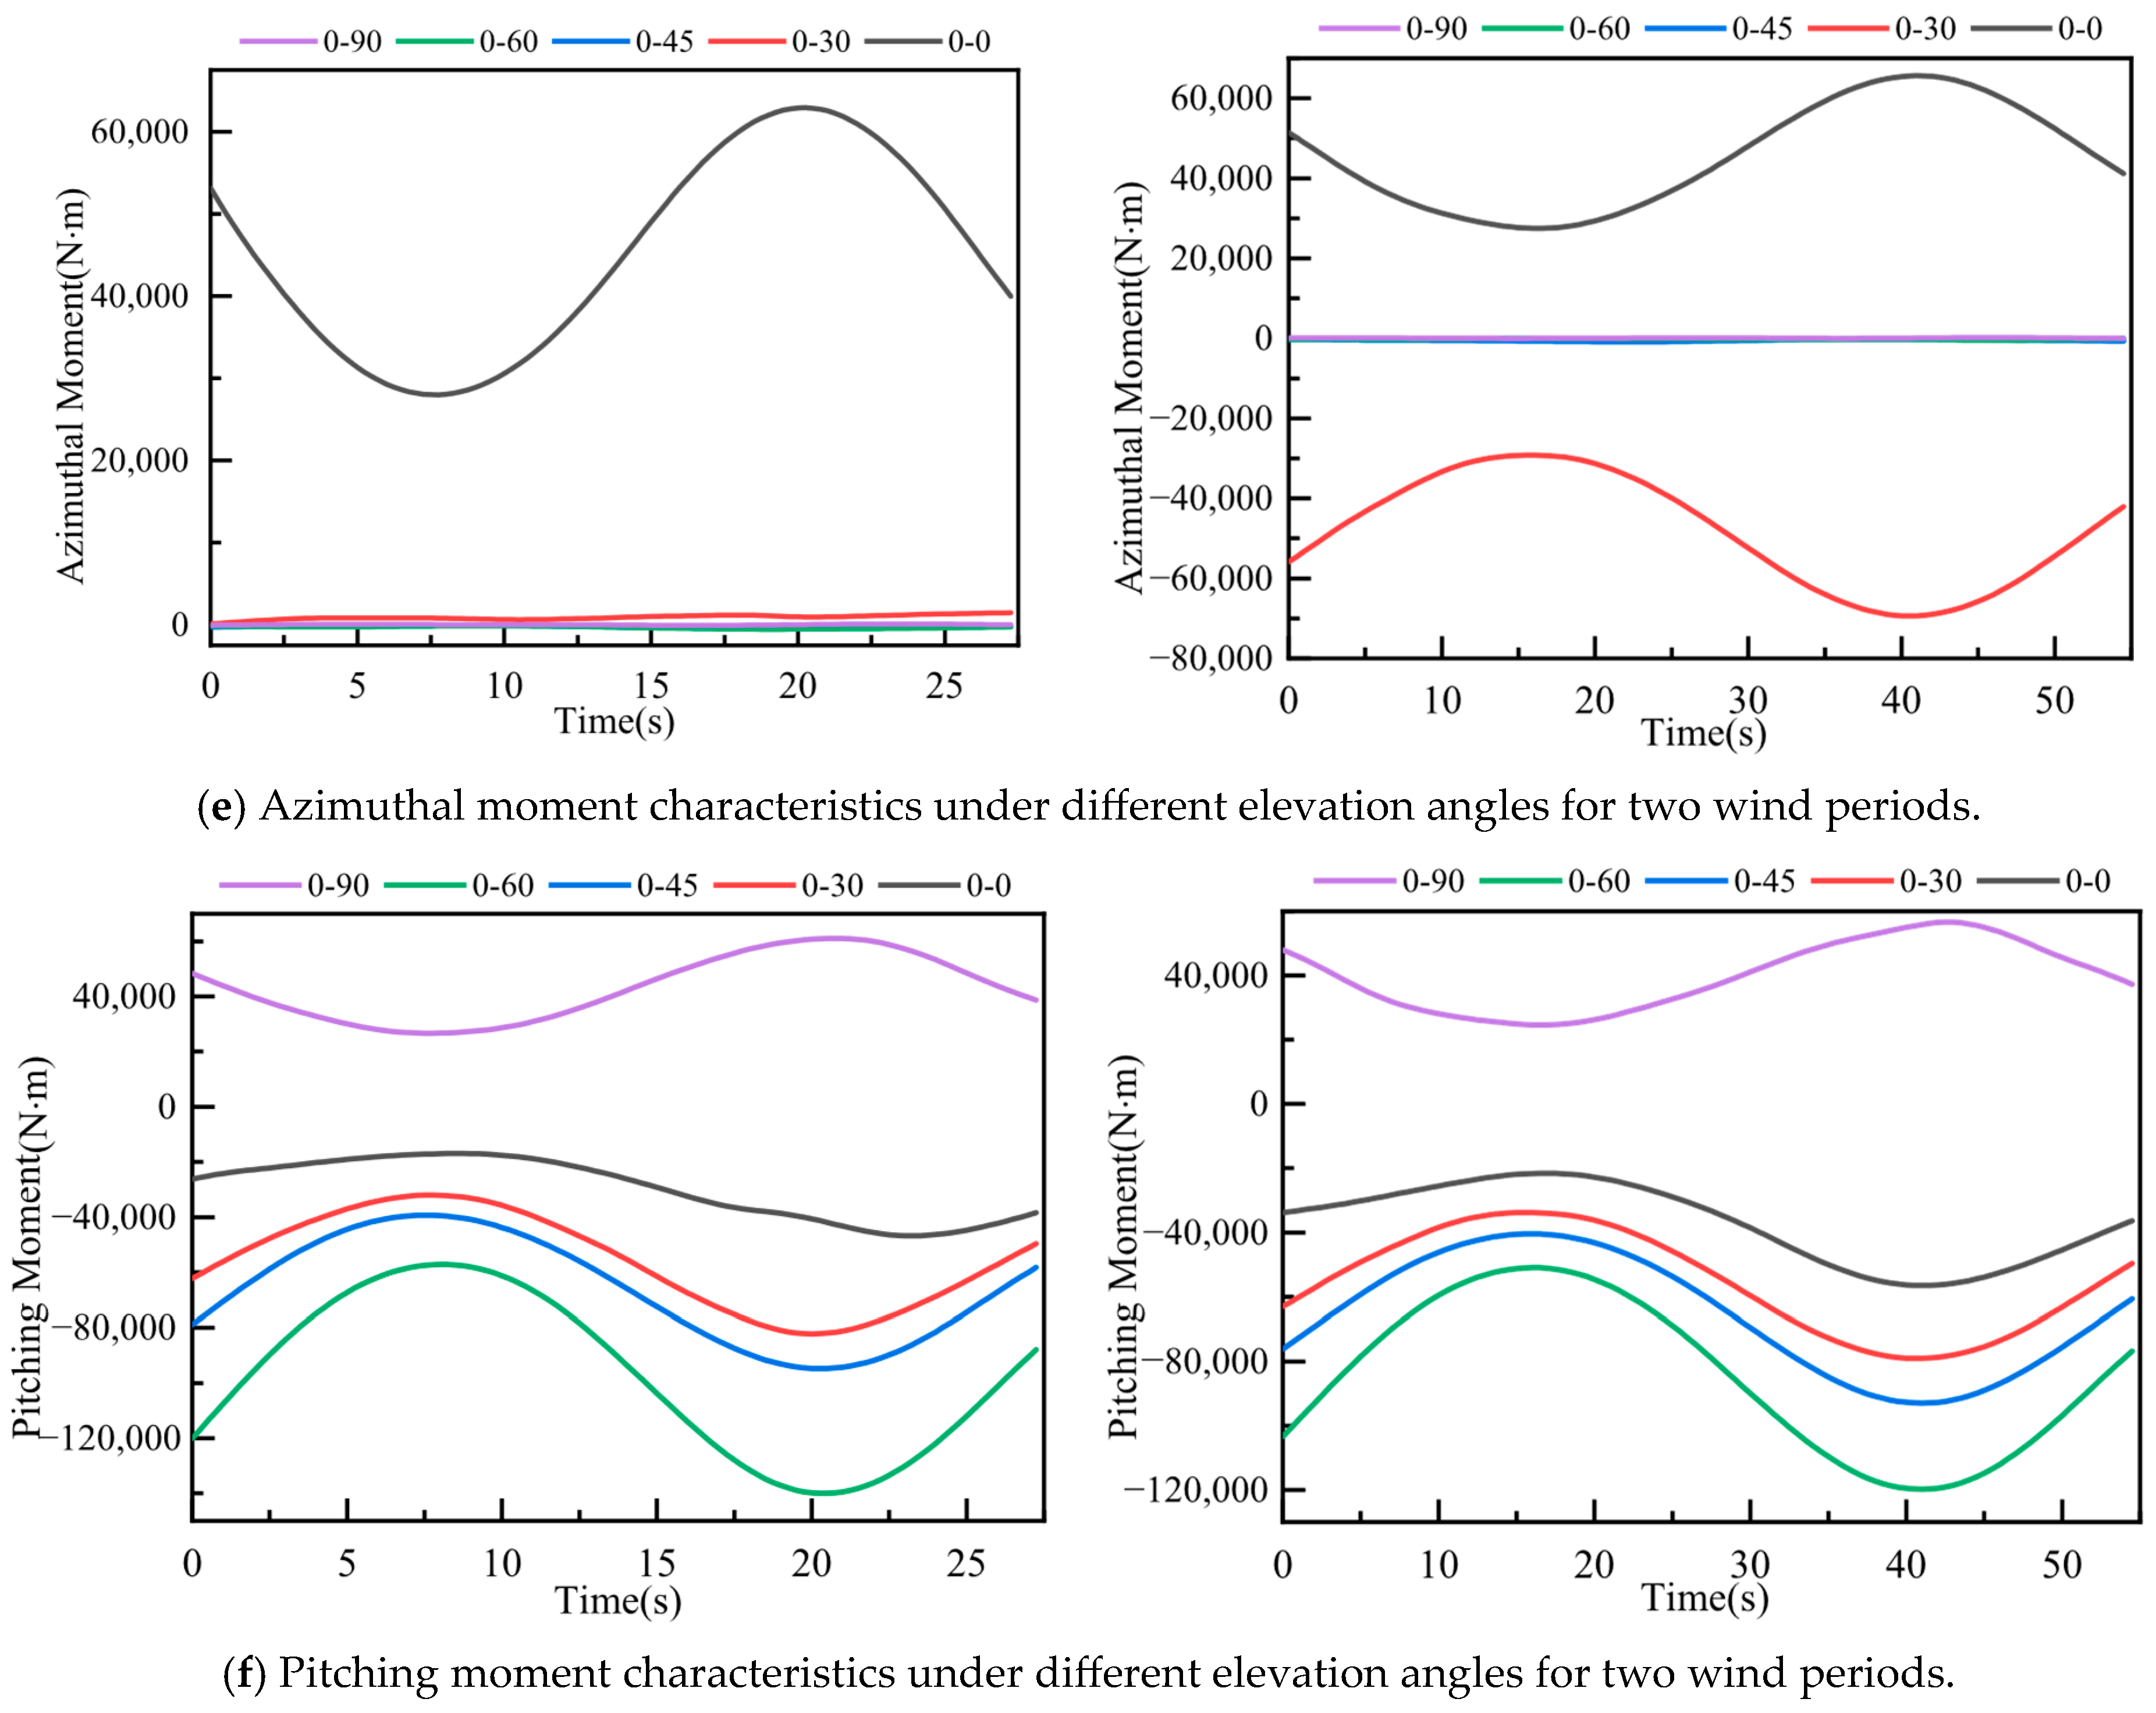
Figure 9 illustrates temporal variations in forces and moments acting on the concentrator under fluctuating wind periods of 25 s and 50 s. Consistent with the preceding section, azimuth angle α = 0° was fixed while elevation angles β ∈ {0°, 30°, 45°, 60°, 90°} were varied to ensure a single-variable analysis. Due to structural symmetry relative to the inflow direction under specific conditions, aerodynamic loads within the plane of symmetry are significantly reduced or cancel each other out. This results in reduced moment amplitudes and pronounced fluctuations along symmetric axes. Compared to dominant force directions (e.g., normal direction), contributions of symmetric-axis moments to overall loading are negligible. Consequently, structural safety assessment focuses exclusively on verification of principal load-direction values.
The effect of elevation angle (β) and fluctuation period on aerodynamic loads is summarized as follows:
Force Distributions:
Drag: At β = 0°, the 50 s period yields a peak drag of −73.9 kN (2.87% higher than 25 s). For β ≥ 30°, the 25 s period exhibits more significant peak drag (max. difference: 6.98%), though peak values attenuate with increasing β. RMS values of drag fluctuations are 5–10% higher for 25 s winds at β = 60°.
Lift: At β = 60°, the 25 s period generates −76.0 kN lift (7.61% higher than 50 s), potentially inducing fatigue damage. At β = 0° and 90°, lift magnitudes are smaller, yet 25 s peaks exceed 50 s by 21.81% and 3.64%, respectively.
Lateral Force: At β = 0°, the 50 s period produces the largest absolute negative peak (−2.94 kN). Lateral forces diminish substantially at other β angles, indicating higher structural safety.
Moment Responses:
Overturning Moment (Mx): At β = 30°, Mx under the 50 s period reaches −2.819 kN·m (3.45× that of 25 s). All values remain low (peaks ≤ 2.82 kN·m) due to structural self-balancing symmetry.
Azimuthal Moment (My): At β = 30°, the 50 s period reverses My direction and amplifies its magnitude by 46× to −69.4 kN·m, posing dynamic instability risks. Period differences are minimal at symmetric angles (β = 0°, 90°).
Pitching Moment (Mz): It is most critical at β = 60°, where the 25 s period peaks at −140 kN·m (17.65% higher than 50 s). At β = 0°, the 50 s peak (−56.5 kN·m) exceeds 25 s by 20.73%.
Critical load conditions concentrate at β = 0° (drag/lateral force), β = 30° (My mutation), and β = 60° (lift/Mz peaks). Long-period winds (50 s) dominate drag, lateral forces, and local moments, whereas short-period winds (25 s) intensify lift and pitching effects. Wind-resistant designs require differential control strategies for these regimes.

3.3.2. Effects of Azimuth Angle and Wind Load Period on Force Characteristics of Solar Concentrators

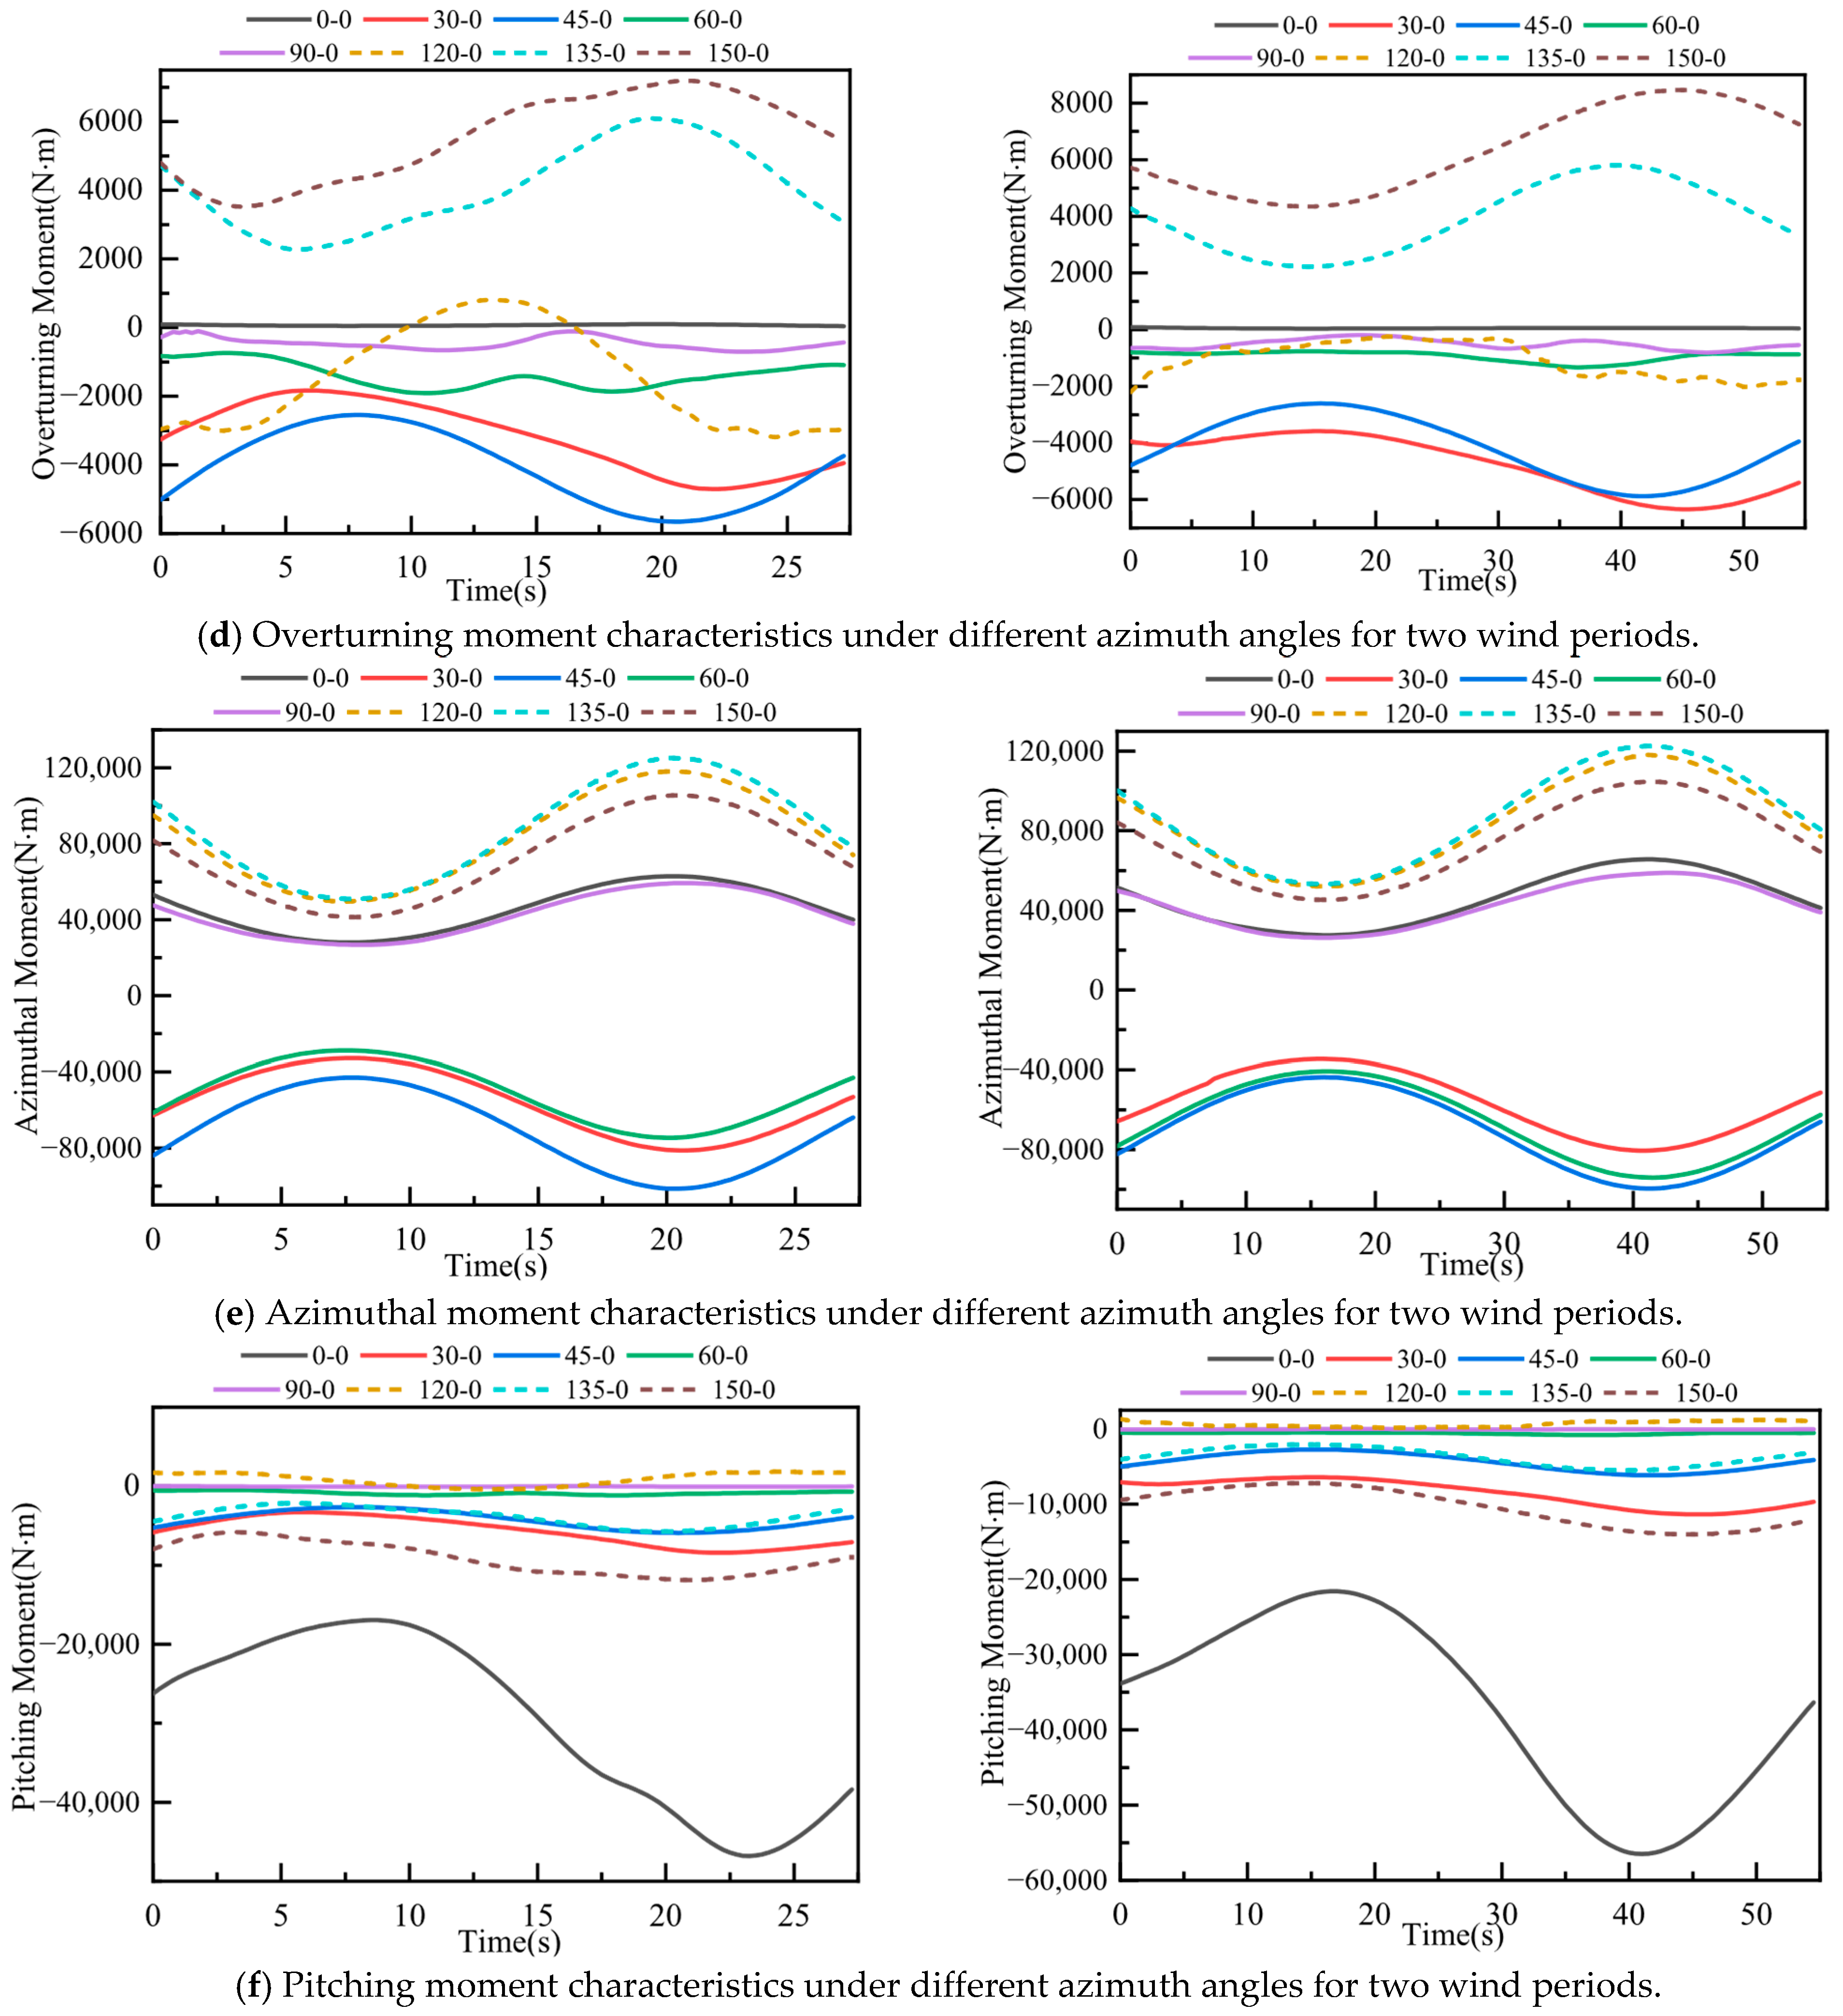
Figure 10 presents the temporal characteristics of multi-directional forces and moments acting on the concentrator at a fixed elevation angle (β = 0°) with azimuth angles varying across α ∈ {0°,30°,45°,60°,90°,120°,135°,150°} under 25 s and 50 s fluctuating wind periods.
Analysis of aerodynamic loads under coupled azimuth angle (α) and wind periodicity, based on Figure 10, yields the following conclusions:
Drag Evolution: At α = 60°, the 50 s period induces a drag peak of −82.3 kN (14.2% higher than 25 s), correlating with amplified vortex shedding. RMS drag values are 10–15% higher for 50 s winds at α = 60°. Minimum drag occurs at α = 90° under the 25 s period (−58.6 kN), attributable to streamlined flow attachment.
Lift Dynamics: Maximum lift fluctuation emerges at α = 135° (25 s: ΔFL = 31.5 kN), driven by asymmetric separation. The 50 s period reduces lift extremes by 9.4–18.7% across most α angles, except at α = 150° where negative lift spikes intensify by 12.3%.
Lateral Force Characteristics: Strong directionality is observed: α = 30° yields peak lateral force under the 25 s period (−3.15 kN mean), while α = 120° exhibits force reversal (50 s: +1.92 kN). The period effect diminishes beyond α = 90°, with variations < 5%.
Critical moment responses:
Mx (Overturning): α = 45° triggers maximum Mx under the 50 s period (−4.27 kN·m), 2.1× the 25 s value, linked to helical vortex formation.
My (Azimuthal): Resonance occurs at α = 135° (50 s: |My| = 89.6 kN·m), exhibiting 37.5% amplification versus 25 s due to wake-concentrator interference.
Mz (Pitching): The most severe loading occurs at α = 60° (25 s: Mz = −127 kN·m), where short-period turbulence excites torsional modes.
Period-dependent mechanisms:
25 s Period: Dominates lift fluctuations (max. ΔFLt = 4.8 kN/s at α = 30°) and pitching moments through high-frequency turbulence impingement.
50 s Period: Governs drag extremes and azimuthal moments via low-frequency wake pumping effects, particularly at α ∈ [120°,150°].
Structural implications:
High-risk azimuths: α = 60° (pitching resonance), α = 135° (azimuthal instability)
Period-specific vulnerabilities: 25 s winds accelerate fatigue at α ≤ 90°, 50 s winds amplify quasi-static loads at α ≥ 120°;
Design priority: Stiffness augmentation against My at α = 135° and Mz at α = 60°. Sensitivity analysis shows that moment fluctuations are most sensitive to wind period at β = 60°.

4. Conclusions and Engineering Implications

Using a computational fluid dynamics (CFD) model, this study developed a simplified 3D model of a dish solar concentrator and defined its operational attitudes and loading conditions. Within the simulation software, a 3D fluid computational domain was constructed to replicate the wind field. Meshing was performed with hierarchical refinement, and boundary conditions were defined: slip walls for the top, inlet, and outlet of the fluid domain, while no-slip walls were applied to the concentrator surface and fluid domain bottom. Fluctuating inlet boundary conditions were introduced to simulate airflow fields and dynamic load responses under fluctuating winds. User-Defined Functions (UDFs) implemented two fluctuating wind periods (T = 25 s and T = 50 s). To ensure generalizability, simulations covered azimuth angles α ∈ {0°, 30°, 45°, 60°, 90°, 120°, 135°, 150°} and elevation angles β ∈ {0°, 30°, 45°, 60°, 90°}, yielding flow field distributions and multi-directional force/moment variations. Key conclusions are as follows:
(1) Synergistic effects of elevation angle and wind periodicity:
At β = 0°, long-period (50 s) winds dominate drag and lateral force peaks (−73.9 kN and −2.94 kN). Short-period (25 s) winds significantly intensify lift (−76.0 kN) and pitching moment (−140 kN·m) at β = 60°, with differences of 7.61% and 17.65%, respectively. Moment reversal in the azimuthal direction (46-fold amplification to −69.4 kN·m under long-period winds at β = 30°) indicates low-frequency winds may trigger dynamic instability, necessitating structural stiffness optimization to suppress nonlinear resonance.
(2) Azimuthal sensitivity and flow field dynamics:
Azimuths α = 0° and 30° represent critical drag conditions (peak: −73.9 kN), while lateral force peaks at 79.1 kN under long-period winds at α = 60°. At α = 150°, overturning moment peaks at 8.46 kN·m (17.66% higher under long periods), revealing intensified local loads from flow separation and vortex interference at large azimuths. Short-period winds amplify azimuthal moments at α = 45° and 135° (−101.5 kN·m and 125.1 kN·m), requiring damping designs to mitigate instantaneous turbulent impacts.
(3) Coupling mechanisms between flow evolution and structural response:
Pronounced flow separation occurs at low elevation angles (β ≤ 30°) and large azimuths (α ≥ 120°), with reversed flow zones expanding to 1.2 D, exacerbating long-term vibration risks under low-frequency winds (50 s). Short-period winds (25 s) induce short-term fatigue damage via high turbulence intensity (e.g., 5.69% lateral force difference at α = 60°). Symmetric azimuths (α = 0°, 90°) exhibit optimal flow attachment, yet overturning moments remain dominated by long periods at α = 0° (−56.5 kN·m), demanding reinforced anti-overturning capacity in support structures.
Engineering Design Guidelines:
(1) Avoid operating at critical angles (e.g., β = 60° with short-period winds, α = 135° with long-period winds) to minimize fatigue and instability.
(2) Enhance structural stiffness at support points where moments peak (e.g., azimuthal moments at α = 135°).
(3) Consider wind periodicity in site selection: areas with dominant short-period winds require fatigue-resistant designs, while long-period wind regions need reinforcement against cumulative loads.
(4) Implement real-time posture adjustments to avoid high-risk angles during extreme wind events.

5. Limitations and Future Work

This study has several limitations that should be addressed in future research:
(1)
Turbulence Model: The standard k-ε model may not fully capture complex separation and vortex dynamics. Future work should use more advanced models (e.g., SST k-ω) or LES for improved accuracy.
(2)
Structural Response: The focus is on aerodynamic loads; direct structural analysis (e.g., stress, deformation) was not included. Coupled FSI simulations are recommended for comprehensive stability assessment.
(3)
Validation: Deviations from experimental data (7–10% for lift) indicate the need for more rigorous validation, including uncertainty quantification and sensitivity analysis.
(4)
Scale Effects: Full-scale simulations may not perfectly match scaled experiments; future studies should investigate Reynolds number effects.
(5)
Atmospheric Conditions: The model assumes neutral stratification; real-world atmospheric boundary layer effects could alter results.
(6)
Frequency Analysis: Frequency domain analysis (e.g., FFT) of force time histories was not performed due to limitations in simulation time required for statistical convergence.
(7)
Wind Speed Trajectory: This study is limited to a single periodic wind speed profile (Figure 2) to systematically investigate the effects of wind period and concentrator orientation. Although this profile is representative of typical fluctuations, other trajectories such as turbulent gusts, ramp-up winds, or stochastic variations prescribed by standards may induce different dynamic responses. Future research should incorporate a wider spectrum of wind speed histories to assess the generality of the current findings.

Author Contributions

Conceptualization, H.Z. and J.E.; Methodology, H.Z.; Software, J.H.; Validation, J.H., H.Z. and G.J.; Formal analysis, J.H., H.Z., G.J., Y.S. and J.E.; Investigation, J.H., H.Z., G.J., Y.S. and J.E.; Data curation, J.H., H.Z., G.J., Y.S. and J.E.; Writing—original draft, J.H.; Writing—review and editing, H.Z., G.J., Y.S. and J.E.; Supervision, H.Z. and J.E.; Funding acquisition, H.Z. All authors have read and agreed to the published version of the manuscript.

Funding

This work is supported by the National Natural Science Foundation of China (No. 52175135).

Data Availability Statement

The original contributions presented in this study are included in the article. Further inquiries can be directed to the corresponding authors.

Conflicts of Interest

The authors declare no conflicts of interest.

References

  1. Shi, P.; Li, J.; Song, Y.; Xu, N.; Zhu, J. Cogeneration of clean water and valuable energy/resources via interfacial solar evaporation. Nano Lett. 2024, 19, 5673–5682. [Google Scholar] [CrossRef] [PubMed]
  2. Ho, C.K.; Iverson, B.D. Review of high-temperature central receiver designs for concentrating solar power. Renew. Sustain. Energy Rev. 2014, 29, 835–846. [Google Scholar] [CrossRef]
  3. Conceição, R.; González-Aguilar, J.; Merrouni, A.A.; Romero, M. Soiling effect in solar energy conversion systems: A review. Renew. Sustain. Energy Rev. 2022, 162, 112434. [Google Scholar] [CrossRef]
  4. Paneru, B.; Paneru, B.; Alexander, V.; Nova, S.; Bhattarai, N.; Poudyal, R.; Narayan Poudyal, K.; Dangi, M.B.; Boland, J.J. Solar energy for operating solar cookers as a clean cooking technology in South Asia: A review. Sol. Energy 2024, 283, 113004. [Google Scholar] [CrossRef]
  5. Gomez-Garcia, F.; Gonzalez-Aguilar, J.; Tamayo-Pacheco, S.; Olalde, G.; Romero, M. Numerical Analysis of Radiation Attenuation in Volumetric Solar Receivers Composed of a Stack of Thin Monolith Layers. Energy Procedia 2014, 57, 457–466. [Google Scholar] [CrossRef]
  6. Yang, X.; Zou, T.; Xu, Y.; Chen, F.; Luo, H.; ullah, S.; Li, R. Research dynamics and applications of tracking technology and devices in solar energy utilization system. Sustain. Energy Technol. Assess. 2025, 75, 104256. [Google Scholar] [CrossRef]
  7. Ho, C.K. Advances in central receivers for concentrating solar applications. Sol. Energy 2017, 152, 38–56. [Google Scholar] [CrossRef]
  8. Chen, C.; Wang, M.; Chen, X.; Chen, X.; Fu, Q.; Deng, H. Recent progress in solar photothermal steam technology for water purification and energy utilization. Chem. Eng. J. 2022, 448, 137603. [Google Scholar] [CrossRef]
  9. Ho, C.K.; Khalsa, S.S.; Kolb, G.J. Methods for probabilistic modeling of concentrating solar power plants. Sol. Energy 2011, 85, 669–675. [Google Scholar] [CrossRef]
  10. Shan, C.; Wang, J.; Cao, Y.; Li, H. Multi-objective optimization of a novel combined cooling, heating and power solar thermal energy storage system: A comprehensive analysis of energy, exergy, exergoeconomic, and exergoenvironmental performance. Energy 2025, 316, 134464. [Google Scholar] [CrossRef]
  11. Ho, C.K. A review of high-temperature particle receivers for concentrating solar power. Appl. Therm. Eng. 2016, 109, 958–969. [Google Scholar] [CrossRef]
  12. González-Pardo, A.; González-Aguilar, J.; Romero, M. Analysis of glint and glare produced by the receiver of small heliostat fields integrated in building façades. Methodol. Appl. Conv. Cent. Receiv. systems. Sol. Energy 2015, 121, 68–77. [Google Scholar]
  13. Xu, X.; Zhang, L.; Zhang, H.; Ma, J.; Sambatmaryde, K. Performance analysis of a novel small-scale integrated solar-ORC system for power and heating. Sol. Energy 2024, 274, 112605. [Google Scholar] [CrossRef]
  14. Martínez-Hernández, A.; Conceição, R.; Asselineau, C.-A.; Romero, M.; González-Aguilar, J. Advanced surface reconstruction method for solar reflective concentrators by flux mapping. Sol. Energy 2023, 266, 112162. [Google Scholar] [CrossRef]
  15. Khan, M.I.; Asfand, F.; Al-Ghamdi, S.G.; Bicer, Y.; Khan, M.; Faqooq, M.; Pesyridis, A. Realizing the promise of concentrating solar power for thermal desalination: A review of technology configurations and optimizations. Renew. Sustain. Energy Rev. 2024, 208, 115022. [Google Scholar] [CrossRef]
  16. Rodriguez, J.; Canadas, I.; Monterreal, R.; Enrique, R.; Galindo, J. PSA SF60 solar furnace renewed. AIP Conf. Proc. 2019, 2126, 030046. [Google Scholar] [CrossRef]
  17. Guk, E.; Kalkan, N. Large Scale Solar Thermal Systems for the Solution of Europe’s Expansion of Energy Demand. J. Eng. Sci. Technol. Rev. 2014, 7, 94–96. [Google Scholar] [CrossRef]
  18. Guoyan, Z.; Xiutian, Y.; Yi, Z.; Weigang, Z.; Guozhong, C. Study on the water-lubricated high-speed non-contact mechanical face seal supported by a disc spring. Braz. Soc. Mech. Sci. Eng. 2018, 40, 351. [Google Scholar] [CrossRef]
  19. Elango, C.; Gunasekaran, N.; Sampathkumar, K. Thermal Modelling of Solar Still-A comprehensive review. Renew. Sustain. Energy Rev. 2015, 47, 856–911. [Google Scholar] [CrossRef]
  20. Guarino, S.; Buscemi, A.; Ciulla, G.; Bonomolo, M.; Lo Brano, V. A dish-stirling solar concentrator coupled to a seasonal thermal energy storage system in the southern mediterranean basin: A cogenerative layout hypothesis. Energy Convers. Manag. 2020, 222, 113228. [Google Scholar] [CrossRef]
  21. Graham, P.; Fadlallah, S.O.; Boulbrachene, K. Wind incidence and pedestal height effect on the flow behaviour and aerodynamic loading on a stand-alone solar parabolic dish. Renew. Energy 2024, 227, 120451. [Google Scholar] [CrossRef]
  22. Liu, G.; E, J.; Liu, T.; Zuo, W.; Zhang, Q. Effects of different poses and wind speeds on flow field of dish solar concentrator based on virtual wind tunnel experiment with constant wind. J. Cent. South Univ. 2018, 25, 1948–1957. [Google Scholar] [CrossRef]
  23. Zuo, H.; Liu, G.; E, J.Q.; Zuo, W.; Wei, K.; Hu, W.; Tan, J. Catastrophic analysis on the stability of a large dish solar thermal power generation system with wind-induced vibration. Solar Energy 2019, 183, 40–49. [Google Scholar] [CrossRef]
  24. Zuo, H.; Tan, J.; Wei, K.; Huang, Z.; Zhong, D.; Xie, F. Effects of different poses and wind speeds on wind-induced vibration characteristics of a dish solar concentrator system. Renew. Energy 2021, 168, 1308–1326. [Google Scholar] [CrossRef]
  25. Yu, M.; Gong, J.; Cai, H. Numerical simulation of impact on wind load due to mirror gap effect for parabolic dish solar concentrator. Proc. Inst. Mech. Eng. Part A J. Power Energy 2019, 233, 1056–1067. [Google Scholar] [CrossRef]
  26. Yan, J.; Peng, Y.; Xie, X.; Liu, Y. Optical performance maintenance of solar dish collector system under service loads based on tracking compensation and receiver translational compensation methods. Energy 2024, 313, 134125. [Google Scholar] [CrossRef]
  27. Ali, H.; Fadlallah, S.O.; Serradj, D.E.B. Wind-induced structural behavior and optical performance of a lightweight composite-based paraboloidal solar dish. Mech. Based Des. Struct. Mach. 2025, 53, 4542–4571. [Google Scholar] [CrossRef]
  28. Egerer, U.; Dana, S.; Jager, D.; Stanislawski, B.J.; Xia, G.; Yellapantula, S. Field measurements reveal insights into the impact of turbulent wind on loads experienced by parabolic trough solar collectors. Sol. Energy 2024, 280, 112860. [Google Scholar] [CrossRef]
  29. Jian, Y.; Peng, Y.D.; Liu, Y.X. An optical-mechanical integrated modeling method of solar dish concentrator system for optical performance analysis under service load. Energy 2022, 261, 125283. [Google Scholar] [CrossRef]
  30. Ji, B.; Qiu, P.; Xu, F.; Liu, Q.; Zhang, X.; Zhang, L. Concentrating efficiency loss of heliostat with multiple sub-mirrors under wind loads. Energy 2023, 281, 128281. [Google Scholar] [CrossRef]
  31. Merarda, H.; Toumi, M.; Boutelhig, A. Analysis of heliostat fatigue: Impact of wind speed distribution, studied over six regions of Algeria. Sol. Energy 2024, 278, 112776. [Google Scholar] [CrossRef]
  32. E, J.Q.; Liu, G.; Liu, T.; Zhang, Z.; Zuo, H.; Hu, W.; Wei, K. Harmonic response analysis of a large dish solar thermal power generation system with wind-induced vibration. Sol. Energy 2019, 181, 116–129. [Google Scholar] [CrossRef]
  33. Glynn John, S.; Lakshmanan, T. Cost optimization of dish solar concentrator system for improved scalability decisions. Renew. Energy 2017, 114, 600–613. [Google Scholar] [CrossRef]
  34. Faddouli, A.; Hajji, M.; Fadili, S.; Hartiti, B.; Labrim, H.; Habchi, A. A comprehensive review of solar, thermal, photovoltaic, and thermoelectric hybrid systems for heating and power generation. Int. J. Green Energy 2024, 21, 413–447. [Google Scholar] [CrossRef]
  35. Chen, C.; Huo, L.; Wang, Z.; Li, H. Experimental study on fluctuating wind pressure on a long-span dome roof subjected to stationary downburst-like winds. Adv. Struct. Eng. 2025, 28, 574–591. [Google Scholar] [CrossRef]
  36. Simmons, S.C.; Lubitz, W.D. Analysis of internal fluid motion in an Archimedes screw using computational fluid mechanics. J. Hydraul. Res. 2021, 59, 932–946. [Google Scholar] [CrossRef]
  37. Graebel, W.P.; Paintal, A.S. Engineering Fluid Mechanics. Eng. Fluid Mech. 2001, 54, 77–96. [Google Scholar] [CrossRef]
  38. Molerus, O. Fluid mechanics and continuum mechanics. Heat Mass Transf./Waerme-Und Stoffuebertragung 2008, 44, 625–633. [Google Scholar] [CrossRef]
  39. Elmisaoui, S.; Kissami, I.; Ghidaglia, J.-M. High-Performance Computing to Accelerate Large-Scale Computational Fluid Dynamics Simulations: A Comprehensive Study. Lect. Notes Netw. Syst. 2024, 930LNNS, 352–360. [Google Scholar]
  40. Gou, Q.; Wang, X.; Chen, G.; Liu, S. Effect of particle shape on particle flow and heat transfer behavior based on computational fluid dynamics-discrete element modeling. Phys. Fluids 2025, 37, 023332. [Google Scholar] [CrossRef]
  41. Zhan, Y.J. Assessment of subgrid method in a finite-volume model. Comput. Math. Appl. 2021, 81, 220–236. [Google Scholar] [CrossRef]
  42. Pratik, N.A.; Ali, M.H.; Lubaba, N.; Hasan, N.; Asaduzzaman, M.; Miyara, A. Numerical investigation to optimize the modified cavity receiver for enhancement of thermal performance of solar parabolic dish collector system. Energy 2024, 290, 130133. [Google Scholar] [CrossRef]
  43. Wang, H.; Blocken, B.; Lin, Z. CFD simulation of the stratified atmospheric boundary layer: Consistency between Monin-Obukhov similarity theory and the standard k-Ε model. Build. Environ. 2025, 267, 112284. [Google Scholar] [CrossRef]
  44. Meng, F.-Q.; He, B.-J.; Zhu, J.; Zhao, D.-X.; Darko, A.; Zhao, Z.-Q. Sensitivity analysis of wind pressure coefficients on CAARC standard tall buildings in CFD simulations. J. Build. Eng. 2018, 16, 146–158. [Google Scholar] [CrossRef]
  45. Lai, Y.; Ha, J.H.; Deo, K.A.; Yang, J.; Yin, P.; Park, S. Reflow Recipe Establishment Based on CFD-Informed Machine Learning Model. IEEE Trans. Compon. Packag. Manuf. Technol. 2023, 13, 127–134. [Google Scholar] [CrossRef]
  46. Jin, C. Embedding numerical methods and MATLAB programming in a fluid mechanics course for undergraduates in engineering technology. Int. J. Mech. Eng. Educ. 2024, 3, 564–580. [Google Scholar] [CrossRef]
  47. Christo, F.C. Numerical modelling of wind and dust patterns around a full-scale paraboloidal solar dish. Renew. Energy 2012, 39, 356–366. [Google Scholar] [CrossRef]
  48. Uzair, M.; Anderson, T.N.; Nates, R.J. The impact of the parabolic dish concentrator on the wind induced heat loss from its receiver. Sol. Energy 2017, 151, 95–101. [Google Scholar] [CrossRef]
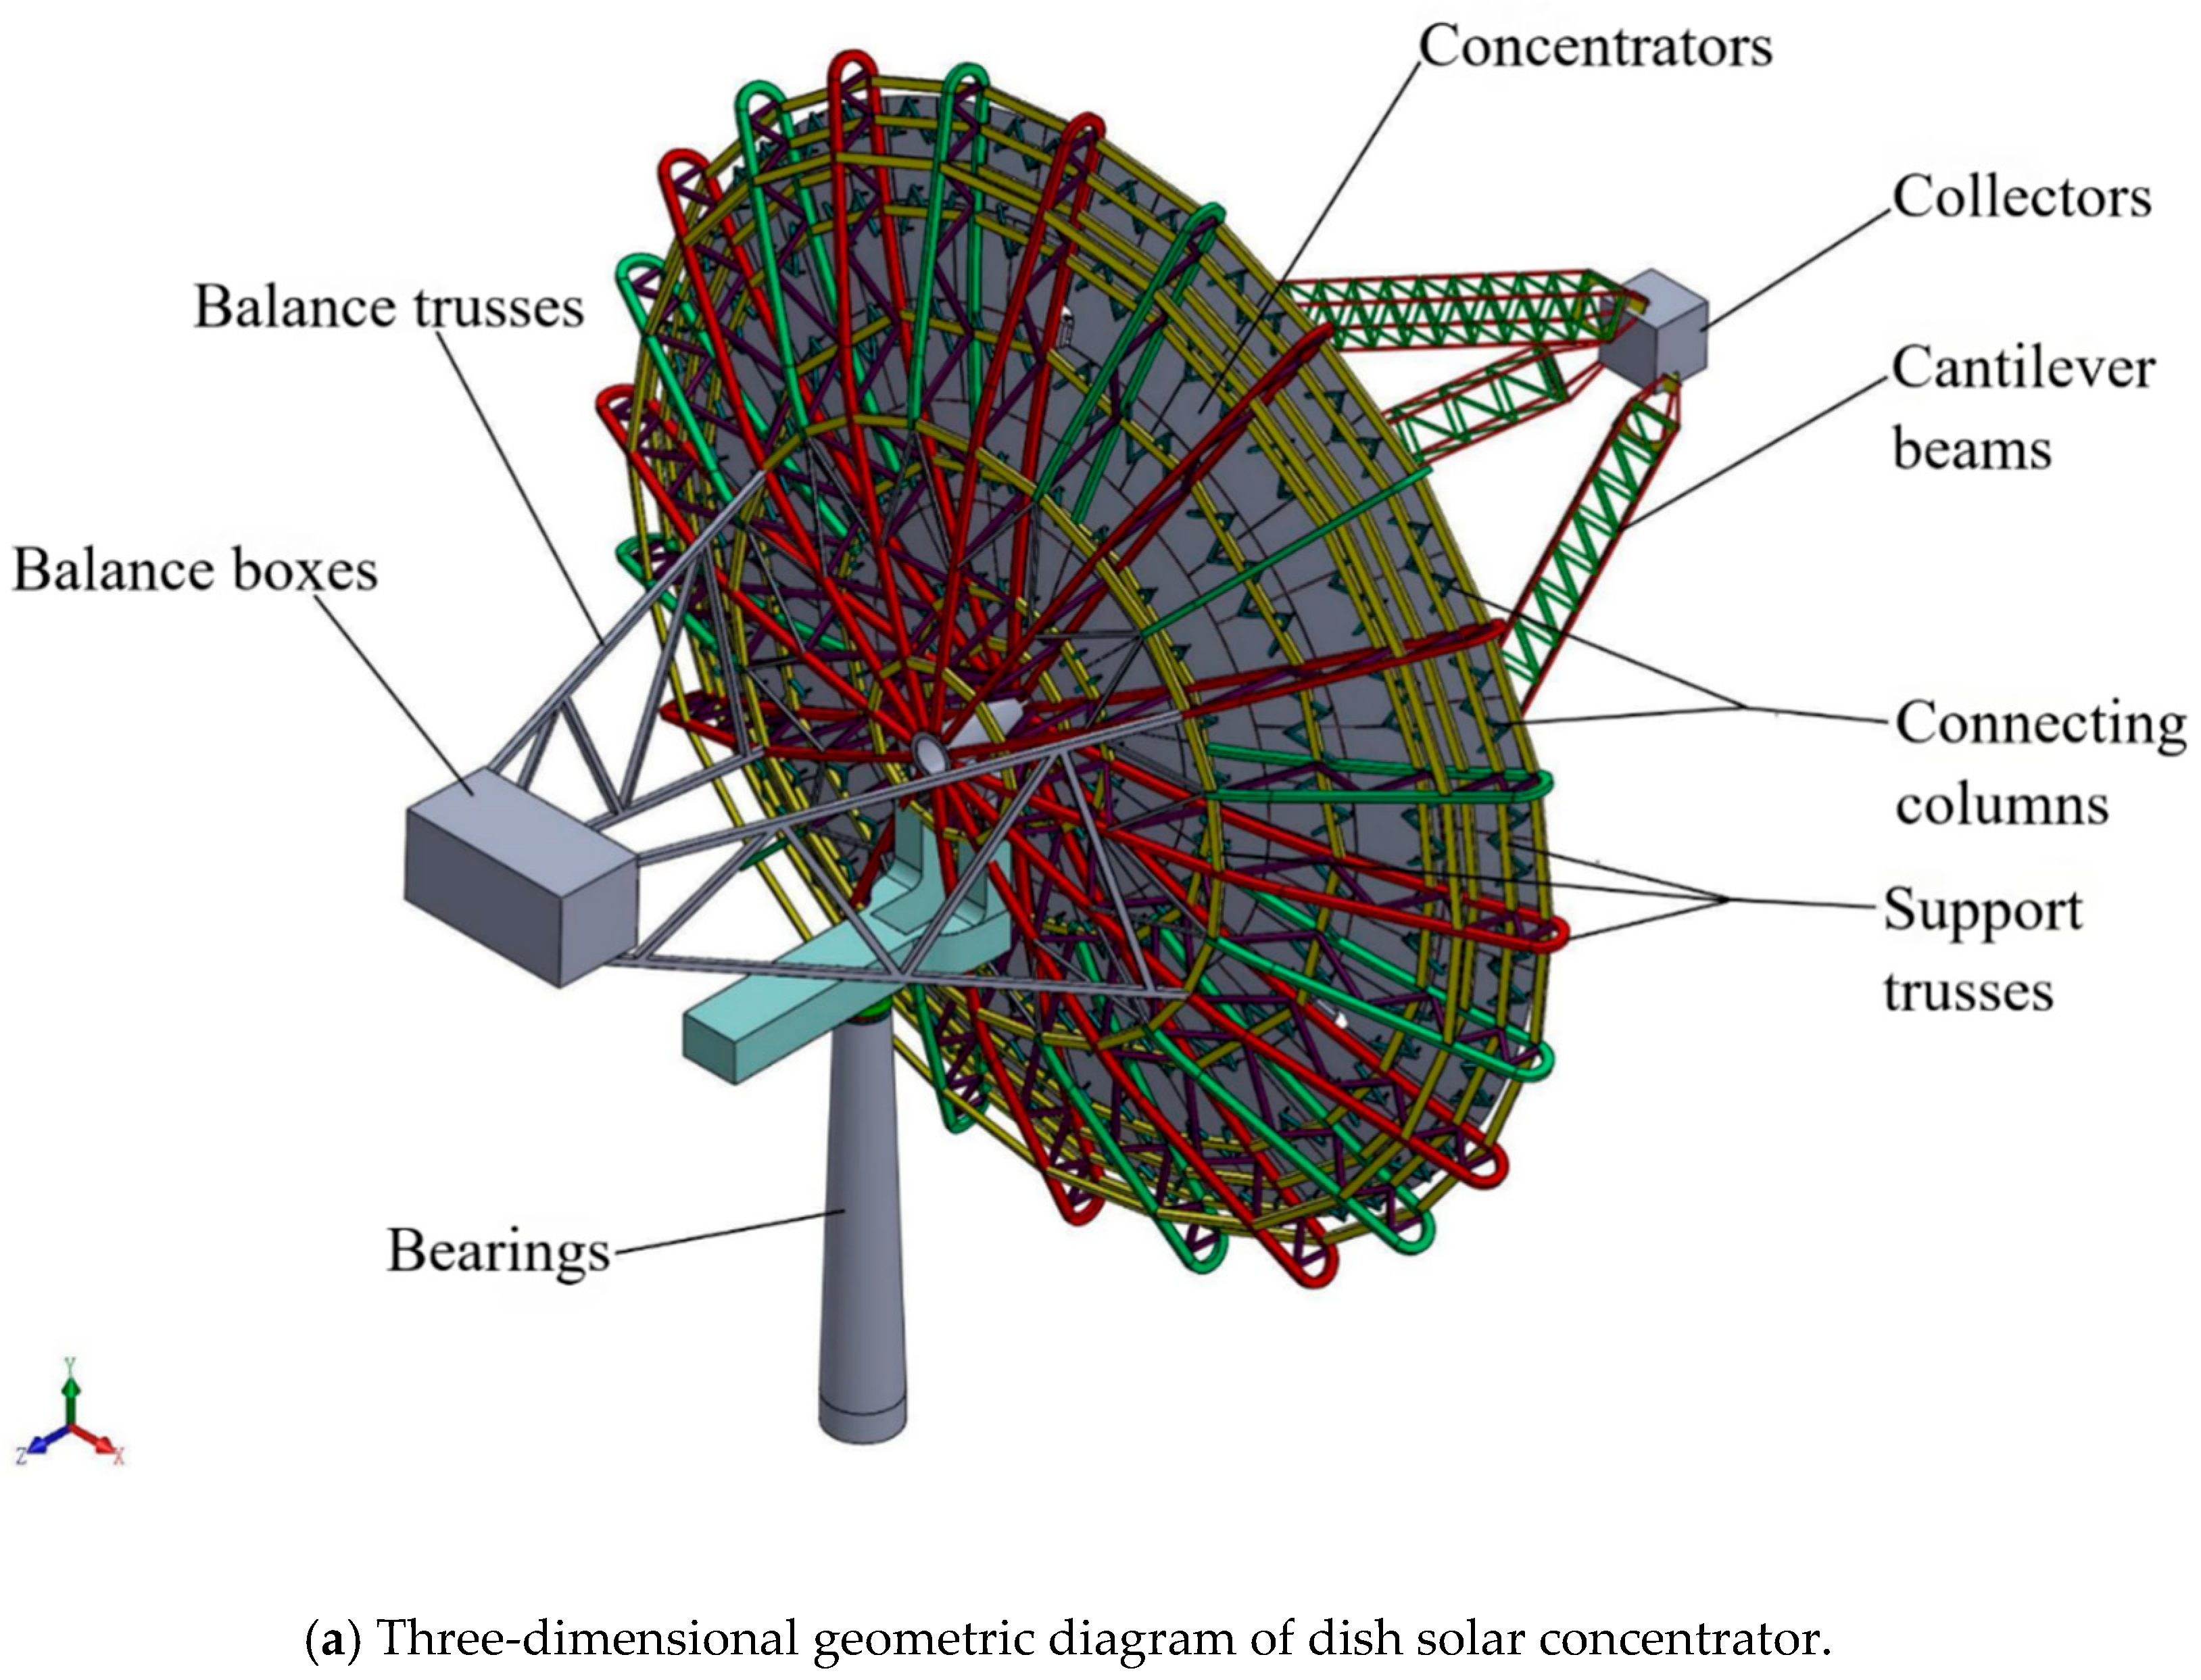
Figure 1. Three-dimensional model of the dish solar concentrator system.
Processes 13 03444 g001aProcesses 13 03444 g001b
Figure 2. Wind Speed Fitting Diagram.
Processes 13 03444 g002
Figure 3. Schematic of the fluid calculation domain, grid division and grid independence verification results.
Processes 13 03444 g003
Figure 4. Comparative diagram of drag coefficient and lift coefficient at different elevation angles [47,48].
Processes 13 03444 g004
Figure 5. Velocity distribution of concentrator under 25 s periodic fluctuating wind at different elevation angles (representative cases shown).
Processes 13 03444 g005
Figure 6. Velocity distribution diagram of concentrator under 25 s periodic fluctuating wind at different azimuth angles.
Processes 13 03444 g006aProcesses 13 03444 g006b
Figure 7. Flow field distribution around the concentrator under fluctuating wind with periods of 25 s and 50 s at different elevation angles (at fixed azimuth angles).
Processes 13 03444 g007aProcesses 13 03444 g007b
Figure 8. Flow field distribution around the concentrator under fluctuating wind with periods of 25 s and 50 s at different azimuth angles (at fixed elevation angles).
Processes 13 03444 g008aProcesses 13 03444 g008b
Figure 9. Force response of the concentrator under periodically fluctuating winds with 25 s and 50 s periods at varying elevation angles (error bars indicate ±1σ).
Processes 13 03444 g009aProcesses 13 03444 g009b
Figure 10. Force response of the concentrator under periodically fluctuating winds with 25 s and 50 s periods at varying azimuth angles (error bars indicate ±1σ).
Processes 13 03444 g010aProcesses 13 03444 g010b
Disclaimer/Publisher’s Note: The statements, opinions and data contained in all publications are solely those of the individual author(s) and contributor(s) and not of MDPI and/or the editor(s). MDPI and/or the editor(s) disclaim responsibility for any injury to people or property resulting from any ideas, methods, instructions or products referred to in the content.